This article appeared in a journal published by Elsevier. The attached copy is furnished to the author for internal non-commercial research and education use, including for instruction at the authors institution and sharing with colleagues. Other uses, including reproduction and distribution, or selling or licensing copies, or posting to personal, institutional or third party websites are prohibited. In most cases authors are permitted to post their version of the article (e.g. in Word or Tex form) to their personal website or institutional repository. Authors requiring further information regarding Elsevier’s archiving and manuscript policies are encouraged to visit: http://www.elsevier.com/copyright
Transcript
This article appeared in a journal published by Elsevier. The attachedcopy is furnished to the author for internal non-commercial researchand education use, including for instruction at the authors institution
and sharing with colleagues.
Other uses, including reproduction and distribution, or selling orlicensing copies, or posting to personal, institutional or third party
websites are prohibited.
In most cases authors are permitted to post their version of thearticle (e.g. in Word or Tex form) to their personal website orinstitutional repository. Authors requiring further information
regarding Elsevier’s archiving and manuscript policies areencouraged to visit:
jo u rn al hom epage: www.elsev ier .com/ locate /sna
Piezoelectric probe for pressure waveform estimation in flexible tubes and itsapplication to the cardiovascular system
V.G. Almeidaa,∗, H.C. Pereiraa,b, T. Pereiraa, E. Figueirasa, E. Borgesa, J.M.R. Cardosoa, C. Correiaa
a Electronics and Instrumentation Group, Instrumentation Center, University of Coimbra, Portugalb ISA - Intelligent Sensing Anywhere, Coimbra, Portugal
a r t i c l e i n f o
Article history:Received 30 November 2010Received in revised form 19 April 2011Accepted 29 April 2011Available online 7 May 2011
The problem of using a piezoelectric (PZ) probe to non-invasively measuring the pressure wave propa-gation through a fluid contained in an elastic tube is considered in this paper. In particular, we describea probe system designed to non-invasively reproduce the morphology of the pulsatile arterial pressurewaveform (APW). The study is focused in three main issues: the mechanical interface that transmits theforces associated to the distension of the wall of the tube to the sensor, the electronic conditioning cir-cuit and the methods to assess the global accuracy of the system. The circuit, incorporates a, new to ourknowledge, baseline restorer (BLR) that contributes to maintaining a stable (non-floating) baseline of thecardiac pressure pulses, making real-time observations more effective. Identification and correction ofthe systematic errors, responsible for deviations of the correct output morphology, are also discussed andtested for different waveforms. To assess the performance of the probe a special purpose test bench wasdeveloped that can originate an arbitrarily shaped pressure wave and launch it through a silicone-rubbertube. Finally, preliminary results, taken at the carotid site of a set of human volunteers, are shown. Theprobe can be incorporated in a collar, and its pulse waveforms exhibit high intra-patient repeatability. Ithas the potential of being used as an alternative to costly techniques such as ultrasound or applanationtonometry. The root mean square error (RMSE) of the probe when reproducing cardiac-like pressurewaveforms yielded a value of 1.8 ± 0.22%.
The study of effective methods that allow non-invasive moni-toring of the pressure waveform propagating inside elastic tubes[1,2] and its extension to physiological applications [3] remains animportant issue addressed in the literature.
Historically, the cuff sphygmomanometer, universally used byclinicians since the beginning of the 20th century, was the firstdevice to quantify a part of the information contained in the arte-rial pressure waveform (APW), peak systolic and diastolic pressurevalues, and conquered a (still) irreplaceable role in general clini-cal practice. Over the last few decades, however, physiologists andclinicians, started to pay increasing attention to other aspects ofthe information carried by the APW that can only be unfolded byits morphology.
Various non-invasive probes designed to evaluate the cardiovas-cular condition have been reported in the literature: Choi and Jiang[4] describe a PVDF (polyvinylidene fluoride) sensor for extractingcardiorespiratory information, the heartbeats and the respiratory
cycles, for long acquisition times in sleep condition. A bi-layer thinfilm sensor applied over the carotid artery to monitor cardiac activ-ity is described by Katranas et al. [5].
The increasing awareness of the importance of arterial stiffness[6,7] started an era of search for parameters capable of, directly orindirectly, quantifying this feature of the walls of arteries from themorphology of the APW.
Ideally, we are looking for a precise instrument capable of non-invasively delivering the calibrated APW at the ascending aorta,even though from a remote sensing site (peripheral artery). In prac-tice, and in this work, we delegate the calibration issue to somecompanion instrument such as the sphygmomanometer and con-centrate in acquiring the precise pressure waveform morphology,from which a great deal of clinically relevant information can bederived.
Among electromechanic based technologies, piezoelectric (PZ)probes have been studied either for assessing timing parame-ters of the APW [8,9] or for monitoring APW at the radial artery[10,11]. They also are in the basis of some commercial instru-ments dedicated to pulse waveform velocity (PWV) assessment(e.g. Complior® from Artech-Medical, Pantin, France).
The purpose of this research is to develop a PZ probe capable ofprecisely rendering the pressure waveform in elastic tubes, as the
218 V.G. Almeida et al. / Sensors and Actuators A 169 (2011) 217– 226
U1
1/4 OPA270 4
U2
1/4 OPA270 4D1
C2
100nF
U5
1/4 OPA270 4
C3
1uF
VSens
DG41 9
R6100kΩ
U4
LM31 1
U3
INA12 8
6
4
7
3
2
5
1
8R3
Vref
Timer x 2
R1
6.8MΩ
Peak d etectorVCC
5V
VSS-5V
BLR
D2
Integrator
C1
8nFVTest
Vd
Vou t
with reset
First ampli fying stageand timer
R48MΩ
OPA86 0
Z
Y
X U6
1/4 OPA270 4R5
10kΩ
R2
6.8k Ω
S1
U5
1/4 OPA270AA 4
C3
1uF
DG419
R6100kΩ
Integrator
VouVV t
with reset
BLR
D2
OPA860
Z
Y
X U6
1/4 OPA270AA 4R5
10kΩ
S1
U1
1/4 OPA270AA 4
VSVV ens
R1
6.8MΩ
C1
8nFVTVV est
VdVV
First amplifyff ing yy stage
R2
6.8kΩ U2
1/4 OPA270AA 4D1
C2
100nF
U4
LM311
U3
INA128
6
4
7
3
2
5
1
8R3
Vref
Timer x 2
Peak dk etectorVCC
5V
VSS-5V
and timer
R4RR8MΩ
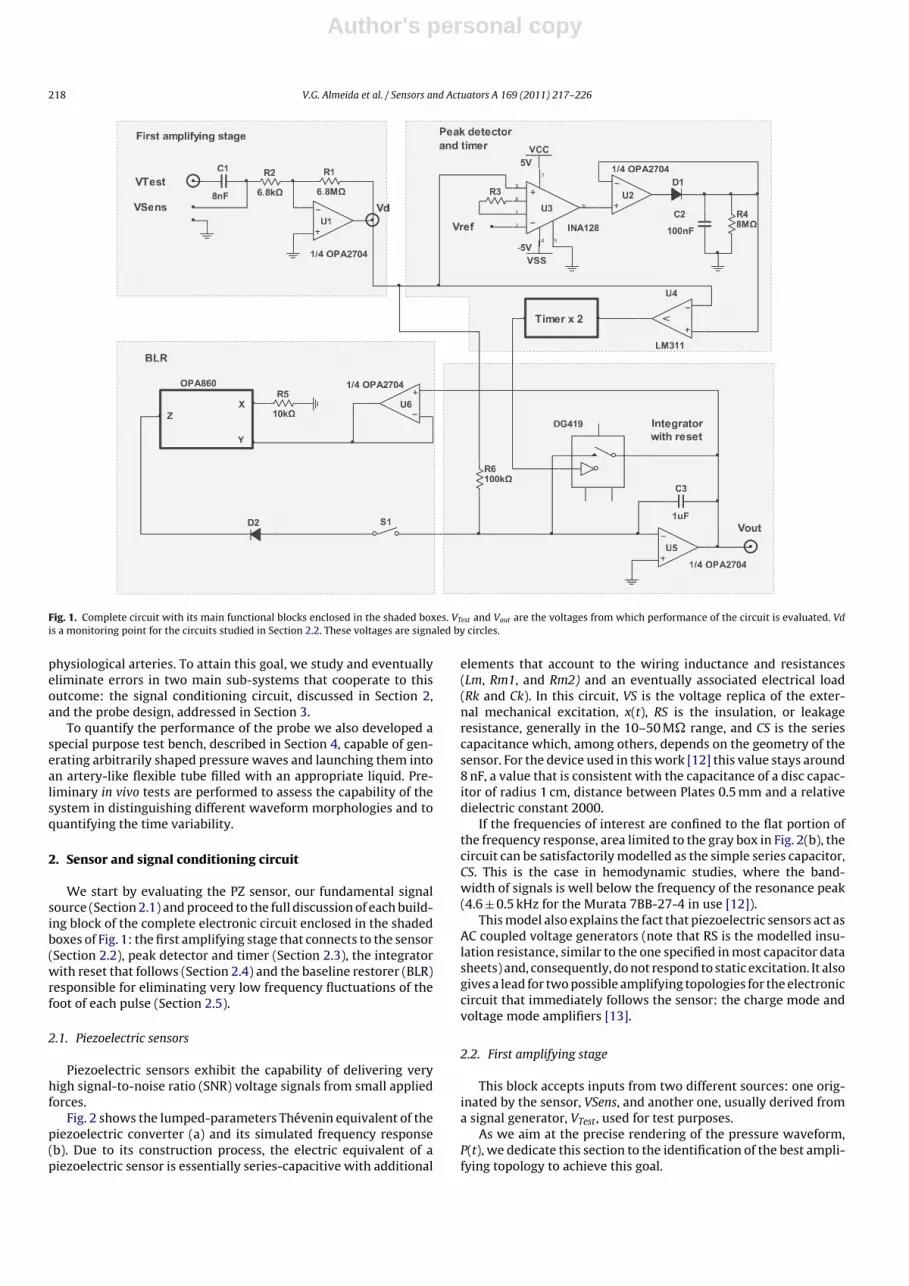
Fig. 1. Complete circuit with its main functional blocks enclosed in the shaded boxes. VTest and Vout are the voltages from which performance of the circuit is evaluated. Vdis a monitoring point for the circuits studied in Section 2.2. These voltages are signaled by circles.
physiological arteries. To attain this goal, we study and eventuallyeliminate errors in two main sub-systems that cooperate to thisoutcome: the signal conditioning circuit, discussed in Section 2,and the probe design, addressed in Section 3.
To quantify the performance of the probe we also developed aspecial purpose test bench, described in Section 4, capable of gen-erating arbitrarily shaped pressure waves and launching them intoan artery-like flexible tube filled with an appropriate liquid. Pre-liminary in vivo tests are performed to assess the capability of thesystem in distinguishing different waveform morphologies and toquantifying the time variability.
2. Sensor and signal conditioning circuit
We start by evaluating the PZ sensor, our fundamental signalsource (Section 2.1) and proceed to the full discussion of each build-ing block of the complete electronic circuit enclosed in the shadedboxes of Fig. 1: the first amplifying stage that connects to the sensor(Section 2.2), peak detector and timer (Section 2.3), the integratorwith reset that follows (Section 2.4) and the baseline restorer (BLR)responsible for eliminating very low frequency fluctuations of thefoot of each pulse (Section 2.5).
2.1. Piezoelectric sensors
Piezoelectric sensors exhibit the capability of delivering veryhigh signal-to-noise ratio (SNR) voltage signals from small appliedforces.
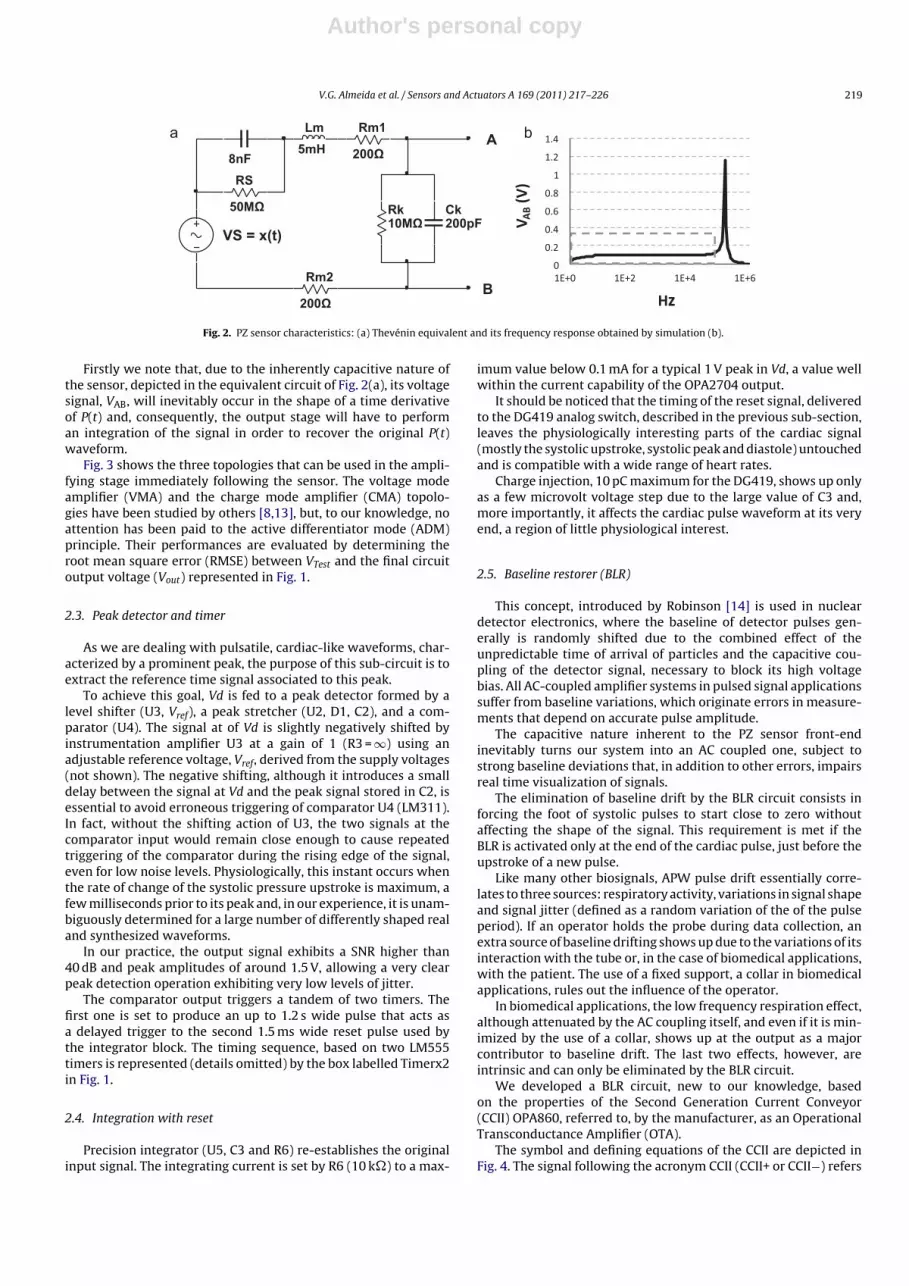
Fig. 2 shows the lumped-parameters Thévenin equivalent of thepiezoelectric converter (a) and its simulated frequency response(b). Due to its construction process, the electric equivalent of apiezoelectric sensor is essentially series-capacitive with additional
elements that account to the wiring inductance and resistances(Lm, Rm1, and Rm2) and an eventually associated electrical load(Rk and Ck). In this circuit, VS is the voltage replica of the exter-nal mechanical excitation, x(t), RS is the insulation, or leakageresistance, generally in the 10–50 M� range, and CS is the seriescapacitance which, among others, depends on the geometry of thesensor. For the device used in this work [12] this value stays around8 nF, a value that is consistent with the capacitance of a disc capac-itor of radius 1 cm, distance between Plates 0.5 mm and a relativedielectric constant 2000.
If the frequencies of interest are confined to the flat portion ofthe frequency response, area limited to the gray box in Fig. 2(b), thecircuit can be satisfactorily modelled as the simple series capacitor,CS. This is the case in hemodynamic studies, where the band-width of signals is well below the frequency of the resonance peak(4.6 ± 0.5 kHz for the Murata 7BB-27-4 in use [12]).
This model also explains the fact that piezoelectric sensors act asAC coupled voltage generators (note that RS is the modelled insu-lation resistance, similar to the one specified in most capacitor datasheets) and, consequently, do not respond to static excitation. It alsogives a lead for two possible amplifying topologies for the electroniccircuit that immediately follows the sensor: the charge mode andvoltage mode amplifiers [13].
2.2. First amplifying stage
This block accepts inputs from two different sources: one orig-inated by the sensor, VSens, and another one, usually derived froma signal generator, VTest, used for test purposes.
As we aim at the precise rendering of the pressure waveform,P(t), we dedicate this section to the identification of the best ampli-fying topology to achieve this goal.
Author's personal copy
V.G. Almeida et al. / Sensors and Actuators A 169 (2011) 217– 226 219
a b8nFRS
50MΩ Rk10MΩ
Ck 200pF
Lm5mH
A
B
VS = x(t)
Rm1
200Ω
Rm2
200Ω
0
0.2
0.4
0.6
0.8
1
1.2
1.4
1E+0 1E+2 1E+4 1E+6
V AB
(V)
Hz
Fig. 2. PZ sensor characteristics: (a) Thevénin equivalent and its frequency response obtained by simulation (b).
Firstly we note that, due to the inherently capacitive nature ofthe sensor, depicted in the equivalent circuit of Fig. 2(a), its voltagesignal, VAB, will inevitably occur in the shape of a time derivativeof P(t) and, consequently, the output stage will have to performan integration of the signal in order to recover the original P(t)waveform.
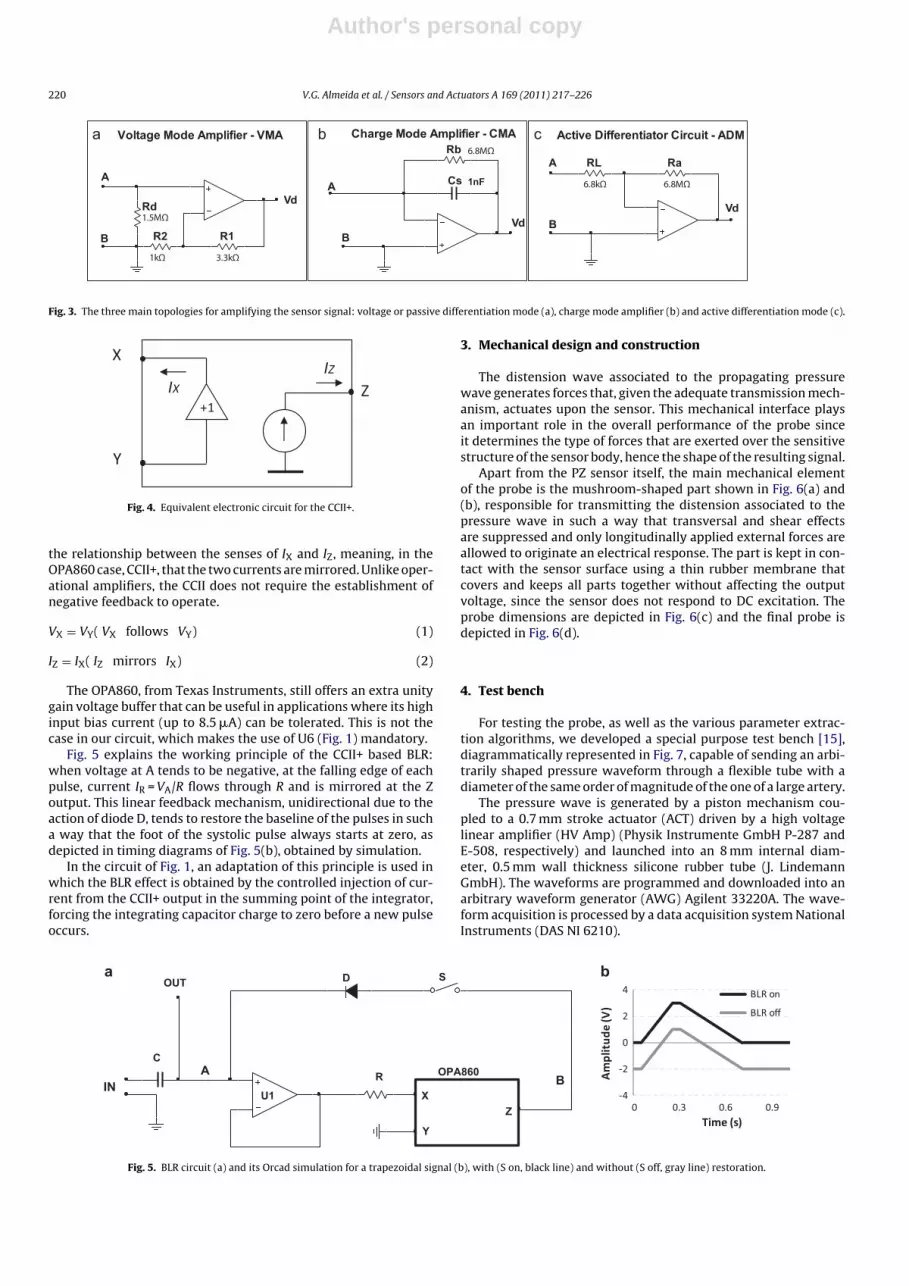
Fig. 3 shows the three topologies that can be used in the ampli-fying stage immediately following the sensor. The voltage modeamplifier (VMA) and the charge mode amplifier (CMA) topolo-gies have been studied by others [8,13], but, to our knowledge, noattention has been paid to the active differentiator mode (ADM)principle. Their performances are evaluated by determining theroot mean square error (RMSE) between VTest and the final circuitoutput voltage (Vout) represented in Fig. 1.
2.3. Peak detector and timer
As we are dealing with pulsatile, cardiac-like waveforms, char-acterized by a prominent peak, the purpose of this sub-circuit is toextract the reference time signal associated to this peak.
To achieve this goal, Vd is fed to a peak detector formed by alevel shifter (U3, Vref), a peak stretcher (U2, D1, C2), and a com-parator (U4). The signal at of Vd is slightly negatively shifted byinstrumentation amplifier U3 at a gain of 1 (R3 = ∞) using anadjustable reference voltage, Vref, derived from the supply voltages(not shown). The negative shifting, although it introduces a smalldelay between the signal at Vd and the peak signal stored in C2, isessential to avoid erroneous triggering of comparator U4 (LM311).In fact, without the shifting action of U3, the two signals at thecomparator input would remain close enough to cause repeatedtriggering of the comparator during the rising edge of the signal,even for low noise levels. Physiologically, this instant occurs whenthe rate of change of the systolic pressure upstroke is maximum, afew milliseconds prior to its peak and, in our experience, it is unam-biguously determined for a large number of differently shaped realand synthesized waveforms.
In our practice, the output signal exhibits a SNR higher than40 dB and peak amplitudes of around 1.5 V, allowing a very clearpeak detection operation exhibiting very low levels of jitter.
The comparator output triggers a tandem of two timers. Thefirst one is set to produce an up to 1.2 s wide pulse that acts asa delayed trigger to the second 1.5 ms wide reset pulse used bythe integrator block. The timing sequence, based on two LM555timers is represented (details omitted) by the box labelled Timerx2in Fig. 1.
2.4. Integration with reset
Precision integrator (U5, C3 and R6) re-establishes the originalinput signal. The integrating current is set by R6 (10 k�) to a max-
imum value below 0.1 mA for a typical 1 V peak in Vd, a value wellwithin the current capability of the OPA2704 output.
It should be noticed that the timing of the reset signal, deliveredto the DG419 analog switch, described in the previous sub-section,leaves the physiologically interesting parts of the cardiac signal(mostly the systolic upstroke, systolic peak and diastole) untouchedand is compatible with a wide range of heart rates.
Charge injection, 10 pC maximum for the DG419, shows up onlyas a few microvolt voltage step due to the large value of C3 and,more importantly, it affects the cardiac pulse waveform at its veryend, a region of little physiological interest.
2.5. Baseline restorer (BLR)
This concept, introduced by Robinson [14] is used in nucleardetector electronics, where the baseline of detector pulses gen-erally is randomly shifted due to the combined effect of theunpredictable time of arrival of particles and the capacitive cou-pling of the detector signal, necessary to block its high voltagebias. All AC-coupled amplifier systems in pulsed signal applicationssuffer from baseline variations, which originate errors in measure-ments that depend on accurate pulse amplitude.
The capacitive nature inherent to the PZ sensor front-endinevitably turns our system into an AC coupled one, subject tostrong baseline deviations that, in addition to other errors, impairsreal time visualization of signals.
The elimination of baseline drift by the BLR circuit consists inforcing the foot of systolic pulses to start close to zero withoutaffecting the shape of the signal. This requirement is met if theBLR is activated only at the end of the cardiac pulse, just before theupstroke of a new pulse.
Like many other biosignals, APW pulse drift essentially corre-lates to three sources: respiratory activity, variations in signal shapeand signal jitter (defined as a random variation of the of the pulseperiod). If an operator holds the probe during data collection, anextra source of baseline drifting shows up due to the variations of itsinteraction with the tube or, in the case of biomedical applications,with the patient. The use of a fixed support, a collar in biomedicalapplications, rules out the influence of the operator.
In biomedical applications, the low frequency respiration effect,although attenuated by the AC coupling itself, and even if it is min-imized by the use of a collar, shows up at the output as a majorcontributor to baseline drift. The last two effects, however, areintrinsic and can only be eliminated by the BLR circuit.
We developed a BLR circuit, new to our knowledge, basedon the properties of the Second Generation Current Conveyor(CCII) OPA860, referred to, by the manufacturer, as an OperationalTransconductance Amplifier (OTA).
The symbol and defining equations of the CCII are depicted inFig. 4. The signal following the acronym CCII (CCII+ or CCII−) refers
Author's personal copy
220 V.G. Almeida et al. / Sensors and Actuators A 169 (2011) 217– 226
A
B R1
3.3k Ω
R2
1kΩ
A
Rb 6.8MΩ
Cs 1nF
A
B
Ra
6.8MΩ
Voltage Mod e Ampli fier - VMA
Rd1.5MΩ
Charge Mod e Ampli fier - CMA Active Diff erentiator Circuit - ADMa b c
RL
6.8k Ω
Vd
VdVd
B
Fig. 3. The three main topologies for amplifying the sensor signal: voltage or passive differentiation mode (a), charge mode amplifier (b) and active differentiation mode (c).
Y
Z
X
IXIZ
+1
Fig. 4. Equivalent electronic circuit for the CCII+.
the relationship between the senses of IX and IZ, meaning, in theOPA860 case, CCII+, that the two currents are mirrored. Unlike oper-ational amplifiers, the CCII does not require the establishment ofnegative feedback to operate.
VX = VY( VX follows VY) (1)
IZ = IX( IZ mirrors IX) (2)
The OPA860, from Texas Instruments, still offers an extra unitygain voltage buffer that can be useful in applications where its highinput bias current (up to 8.5 �A) can be tolerated. This is not thecase in our circuit, which makes the use of U6 (Fig. 1) mandatory.
Fig. 5 explains the working principle of the CCII+ based BLR:when voltage at A tends to be negative, at the falling edge of eachpulse, current IR = VA/R flows through R and is mirrored at the Zoutput. This linear feedback mechanism, unidirectional due to theaction of diode D, tends to restore the baseline of the pulses in sucha way that the foot of the systolic pulse always starts at zero, asdepicted in timing diagrams of Fig. 5(b), obtained by simulation.
In the circuit of Fig. 1, an adaptation of this principle is used inwhich the BLR effect is obtained by the controlled injection of cur-rent from the CCII+ output in the summing point of the integrator,forcing the integrating capacitor charge to zero before a new pulseoccurs.
3. Mechanical design and construction
The distension wave associated to the propagating pressurewave generates forces that, given the adequate transmission mech-anism, actuates upon the sensor. This mechanical interface playsan important role in the overall performance of the probe sinceit determines the type of forces that are exerted over the sensitivestructure of the sensor body, hence the shape of the resulting signal.
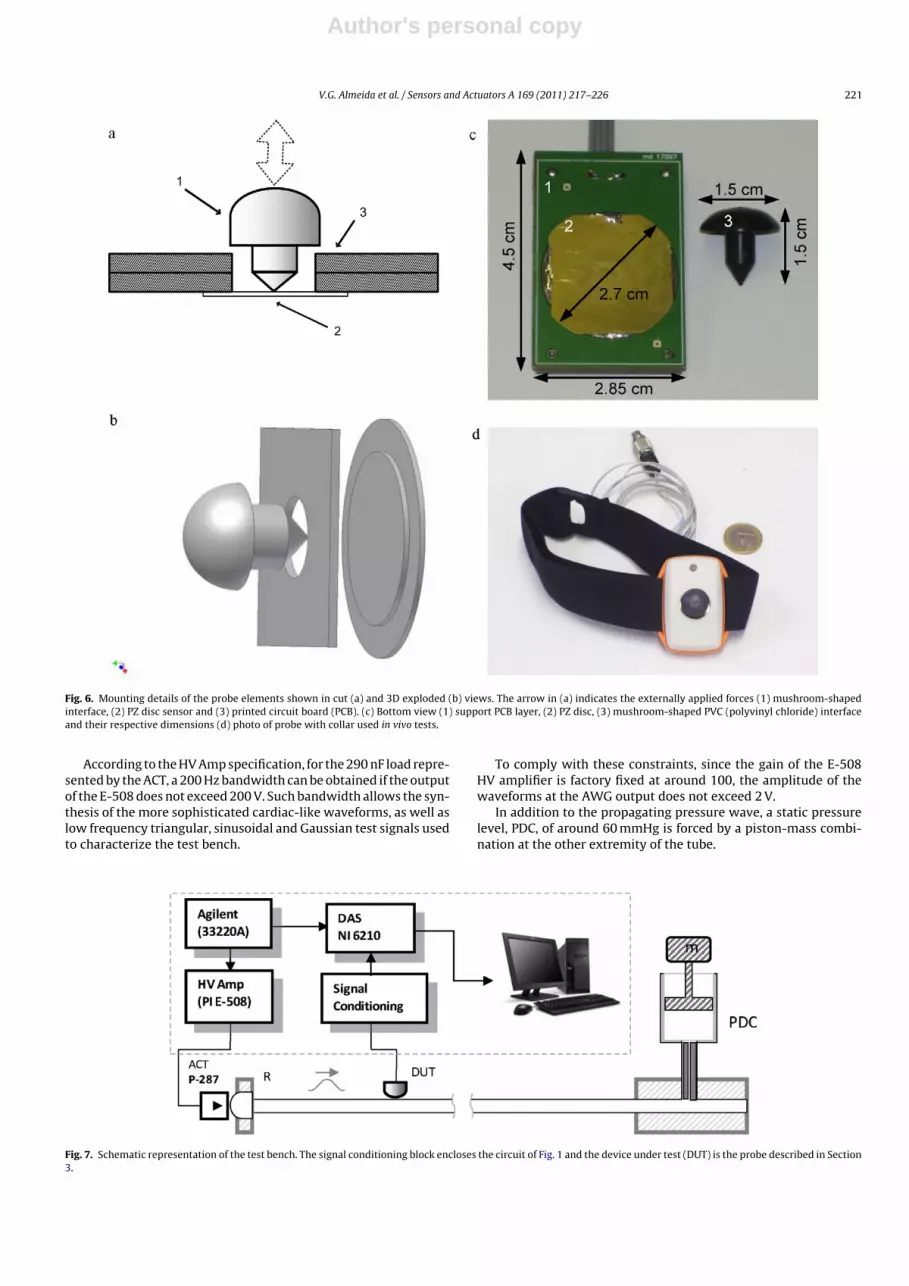
Apart from the PZ sensor itself, the main mechanical elementof the probe is the mushroom-shaped part shown in Fig. 6(a) and(b), responsible for transmitting the distension associated to thepressure wave in such a way that transversal and shear effectsare suppressed and only longitudinally applied external forces areallowed to originate an electrical response. The part is kept in con-tact with the sensor surface using a thin rubber membrane thatcovers and keeps all parts together without affecting the outputvoltage, since the sensor does not respond to DC excitation. Theprobe dimensions are depicted in Fig. 6(c) and the final probe isdepicted in Fig. 6(d).
4. Test bench
For testing the probe, as well as the various parameter extrac-tion algorithms, we developed a special purpose test bench [15],diagrammatically represented in Fig. 7, capable of sending an arbi-trarily shaped pressure waveform through a flexible tube with adiameter of the same order of magnitude of the one of a large artery.
The pressure wave is generated by a piston mechanism cou-pled to a 0.7 mm stroke actuator (ACT) driven by a high voltagelinear amplifier (HV Amp) (Physik Instrumente GmbH P-287 andE-508, respectively) and launched into an 8 mm internal diam-eter, 0.5 mm wall thickness silicone rubber tube (J. LindemannGmbH). The waveforms are programmed and downloaded into anarbitrary waveform generator (AWG) Agilent 33220A. The wave-form acquisition is processed by a data acquisition system NationalInstruments (DAS NI 6210).
U1
RIN
OPA860
D
Z
Y
X
OUTa b
AB
S
C
-4
-2
0
2
4
0.90.60.30
Am
plit
ude
(V)
Time (s)
BLR on
BLR off
Fig. 5. BLR circuit (a) and its Orcad simulation for a trapezoidal signal (b), with (S on, black line) and without (S off, gray line) restoration.
Author's personal copy
V.G. Almeida et al. / Sensors and Actuators A 169 (2011) 217– 226 221
Fig. 6. Mounting details of the probe elements shown in cut (a) and 3D exploded (b) views. The arrow in (a) indicates the externally applied forces (1) mushroom-shapedinterface, (2) PZ disc sensor and (3) printed circuit board (PCB). (c) Bottom view (1) support PCB layer, (2) PZ disc, (3) mushroom-shaped PVC (polyvinyl chloride) interfaceand their respective dimensions (d) photo of probe with collar used in vivo tests.
According to the HV Amp specification, for the 290 nF load repre-sented by the ACT, a 200 Hz bandwidth can be obtained if the outputof the E-508 does not exceed 200 V. Such bandwidth allows the syn-thesis of the more sophisticated cardiac-like waveforms, as well aslow frequency triangular, sinusoidal and Gaussian test signals usedto characterize the test bench.
To comply with these constraints, since the gain of the E-508HV amplifier is factory fixed at around 100, the amplitude of thewaveforms at the AWG output does not exceed 2 V.
In addition to the propagating pressure wave, a static pressurelevel, PDC, of around 60 mmHg is forced by a piston-mass combi-nation at the other extremity of the tube.
Fig. 7. Schematic representation of the test bench. The signal conditioning block encloses the circuit of Fig. 1 and the device under test (DUT) is the probe described in Section3.
Author's personal copy
222 V.G. Almeida et al. / Sensors and Actuators A 169 (2011) 217– 226
5. Methods
In the circuit topology we started by noting that the physical ori-gin of introduced error lays in the amplitude and phase distortions,so the transfer function of the complete circuit was determinedfor each of the above mentioned amplifying stages (Fig. 3). Then,we use a set of cardiac-like synthesized pulses [16], shaped so asto reproduce the different classes typified by Murgo et al. [17]. Theroot mean square error (RMSE) was then measured using simulatedand real data.
In the real data tests, the test input (VTest, represented in Fig. 1)is driven by the AWG loaded with the same signal used in thesimulations. RMSE is calculated taking VTest as the reference, thus
RMSE = RMS(Vout − VTest) (3)
If any of the circuits should perform ideally (no distortion intro-duced) its RMSE would be zero, in the absence of noise. If noise ispresent, however, the ideal circuit will yield a non-zero minimumvalue for RMSE:
RMSEmin =√
n2VS + n2
Vout(4)
where nVS and nVout are the RMS of noises at the input and output,respectively.
We calculate the RMSEmin to all waveforms, that were previ-ously normalized to discard interference of gain and offset that arenot important for evaluating the accuracy in reproducing the inputwaveform.
Finally, the one labelled RMSEc is computed from the other one,subtracting noise contribution according to Eq. (5),
RMSEc = RMSE − RMSEmin (5)
The optimal design shape of the mushroom interface was stud-ied in order to repeatedly obtain the best (undistorted) pressurewaveform transmitted to the sensor. In these tests three differentlyshaped probes were submitted to the direct action of the excitation.
The test bench also allows the full study of the propagating wavedynamics, including reflections at the extremities of the elastictube.
A small group of twenty volunteers was organized to assess theprobe efficiency in monitoring the APW at the carotid site.
6. Results
6.1. Transfer function
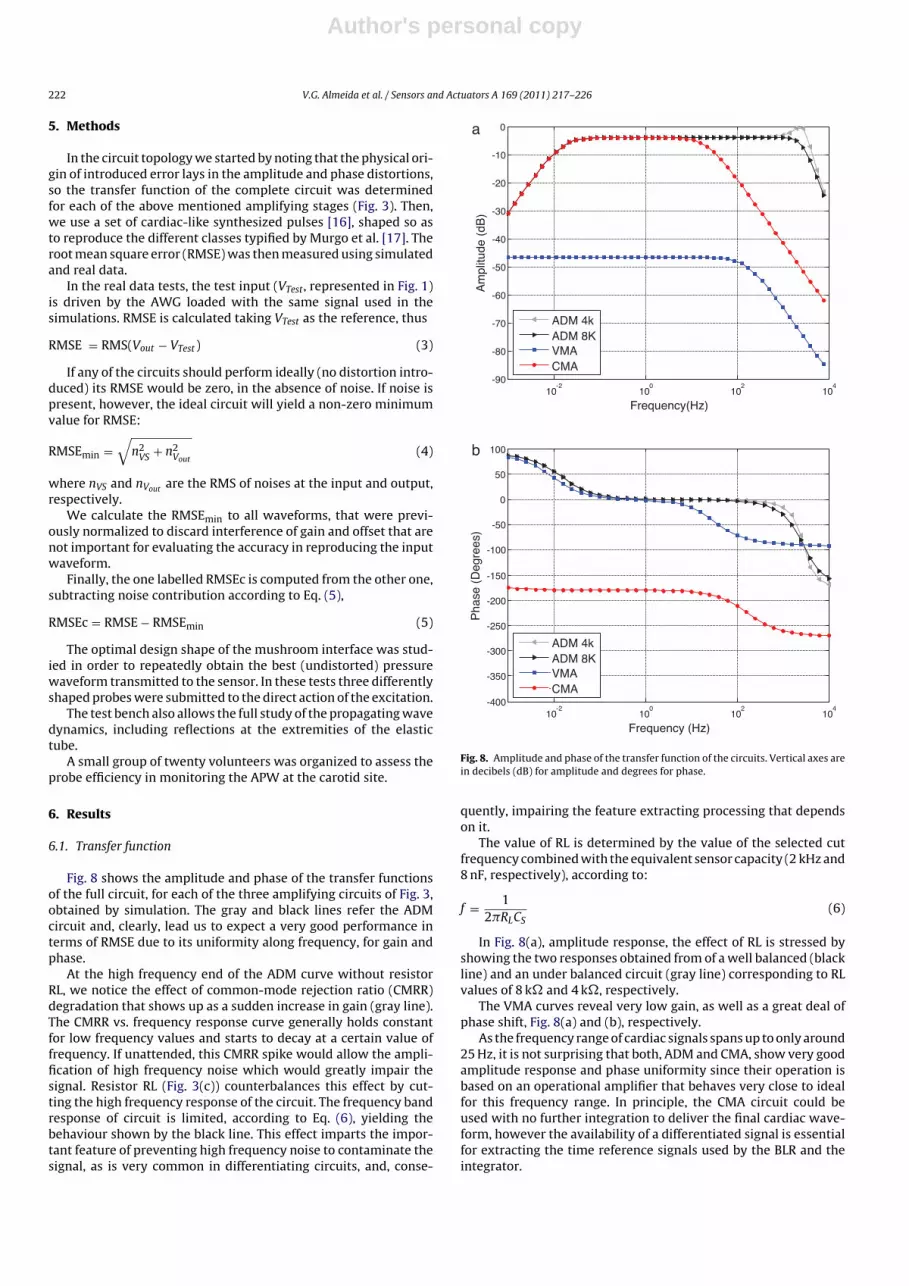
Fig. 8 shows the amplitude and phase of the transfer functionsof the full circuit, for each of the three amplifying circuits of Fig. 3,obtained by simulation. The gray and black lines refer the ADMcircuit and, clearly, lead us to expect a very good performance interms of RMSE due to its uniformity along frequency, for gain andphase.
At the high frequency end of the ADM curve without resistorRL, we notice the effect of common-mode rejection ratio (CMRR)degradation that shows up as a sudden increase in gain (gray line).The CMRR vs. frequency response curve generally holds constantfor low frequency values and starts to decay at a certain value offrequency. If unattended, this CMRR spike would allow the ampli-fication of high frequency noise which would greatly impair thesignal. Resistor RL (Fig. 3(c)) counterbalances this effect by cut-ting the high frequency response of the circuit. The frequency bandresponse of circuit is limited, according to Eq. (6), yielding thebehaviour shown by the black line. This effect imparts the impor-tant feature of preventing high frequency noise to contaminate thesignal, as is very common in differentiating circuits, and, conse-
10-2
100
10 2
10 4
-90
-80
-70
-60
-50
-40
-30
-20
-10
0a
b
Am
plitu
de (
dB)
Frequency(Hz)
ADM 4kADM 8KVMACMA
10-2
100
10 2
10 4
-400
-350
-300
-250
-200
-150
-100
-50
0
50
100
Pha
se (
Deg
rees
)
Frequency (Hz)
ADM 4kADM 8KVMACMA
Fig. 8. Amplitude and phase of the transfer function of the circuits. Vertical axes arein decibels (dB) for amplitude and degrees for phase.
quently, impairing the feature extracting processing that dependson it.
The value of RL is determined by the value of the selected cutfrequency combined with the equivalent sensor capacity (2 kHz and8 nF, respectively), according to:
f = 12�RLCS
(6)
In Fig. 8(a), amplitude response, the effect of RL is stressed byshowing the two responses obtained from of a well balanced (blackline) and an under balanced circuit (gray line) corresponding to RLvalues of 8 k� and 4 k�, respectively.
The VMA curves reveal very low gain, as well as a great deal ofphase shift, Fig. 8(a) and (b), respectively.
As the frequency range of cardiac signals spans up to only around25 Hz, it is not surprising that both, ADM and CMA, show very goodamplitude response and phase uniformity since their operation isbased on an operational amplifier that behaves very close to idealfor this frequency range. In principle, the CMA circuit could beused with no further integration to deliver the final cardiac wave-form, however the availability of a differentiated signal is essentialfor extracting the time reference signals used by the BLR and theintegrator.
Author's personal copy
V.G. Almeida et al. / Sensors and Actuators A 169 (2011) 217– 226 223
0
0.2
0.4
0.6
0.8
1a b
0 0.2 0.4 0.6 0.8
Am
plit
ude
(V)
Time (s)
INADMVMACMA
0
0.2
0.4
0.6
0.8
1
0 0.2 0.4 0.6 0.8
Am
plit
ude
(V)
Time (s)
INADMVMACMA
Fig. 9. Normalized input and output for a type B cardiac pulse in the three circuit topologies, as given by the simulator (a) and measured in the circuit (b). Noise is visibleonly in the real data plotted in (b).
Therefore we adopted a configuration where the ADM circuit isfollowed by the integrator, which in any case is the best performingconfiguration, as will be seen in next section.
6.2. Overall performance
The RMSE between input and output for each of the three topolo-gies was computed from simulated as well as real data, using thevery same synthesized pulse waveforms as inputs in the simulatorand in the physical circuits, Fig. 9(a) and (b) respectively. Table 1summarizes results for all four types of cardiac waveforms.
The circuit data is split in three columns to show the contribu-tion of noise. This was done by measuring nVS and nVout , the RMS of
input and output in the absence of signal respectively, and apply-ing Eq. (5) to compute RMSEc for each topology. Results, shown inTable 1, clearly demonstrate the superiority of the ADM topology inthe precise rendering the input signal waveform. The ADM topol-ogy, was therefore, used to perform the mechanical tests, as wellthe test bench characterization and in vivo tests.
6.3. Mechanical design
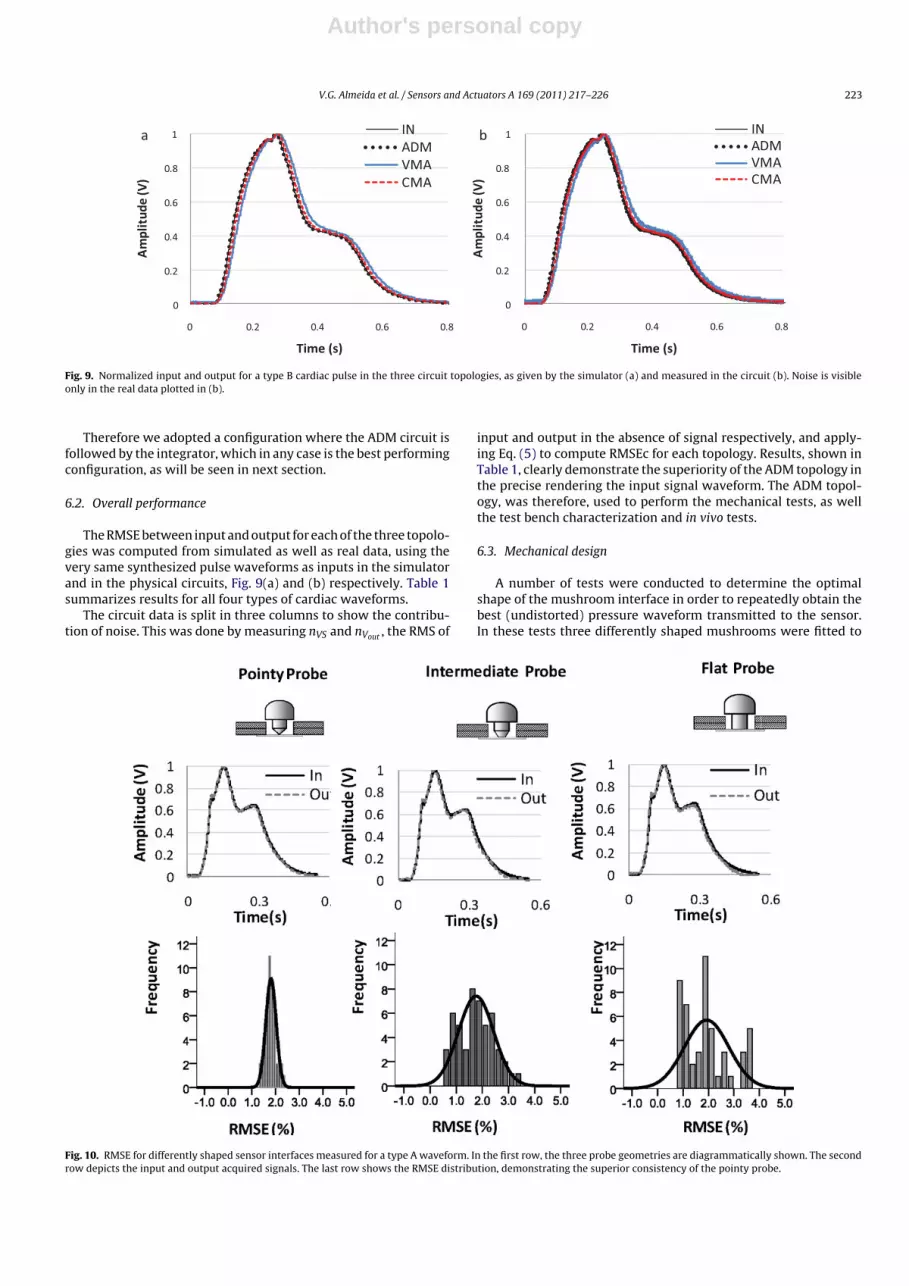
A number of tests were conducted to determine the optimalshape of the mushroom interface in order to repeatedly obtain thebest (undistorted) pressure waveform transmitted to the sensor.In these tests three differently shaped mushrooms were fitted to
Fig. 10. RMSE for differently shaped sensor interfaces measured for a type A waveform. In the first row, the three probe geometries are diagrammatically shown. The secondrow depicts the input and output acquired signals. The last row shows the RMSE distribution, demonstrating the superior consistency of the pointy probe.
Author's personal copy
224 V.G. Almeida et al. / Sensors and Actuators A 169 (2011) 217– 226
Table 1RMSE measurements for each of the three amplifying circuits using cardiac-likesynthesized pulses to reproduce the different classes described in the literature[17]. Data to compute the results is taken from the simulator and measured in thecircuit. The three columns in the circuit data show the effect of noise on the signals.
Table 2Statistics of measurements depicted in Fig. 10.
Probe type Pointy (P) Intermediate (I) Flat (F)
Number of pulses 50 50 50Mean 1.80 1.76 1.93Std. deviation 0.22 0.67 0.88Minimum 1.34 0.66 0.77Maximum 2.30 3.28 3.62
the probe and submitted to the direct action of the actuator. Thedifference is in the geometry of the mushroom base, which directlycontacts the sensor, that we have shaped pointy, flat and interme-diate.
The stroke of the actuator was adjusted to about 10 �m, and theresponse was collected by the probe and stored by the DAS. Severaltypes of pressure waveforms were used and results for a type Bcardiac waveform are shown in Fig. 10.
Again, the overall error is quantified as the RMSE between nor-malized input and output, VTest and Vout in Fig. 1, respectively.
Results, shown in Fig. 10 and Table 2, are obtained for a type Acardiac waveform [15], since it is the more demanding in terms cir-cuit performance. The pointy probe exhibits the best performancein reproducing the input waveform with low RMSE variance.
6.4. Test bench
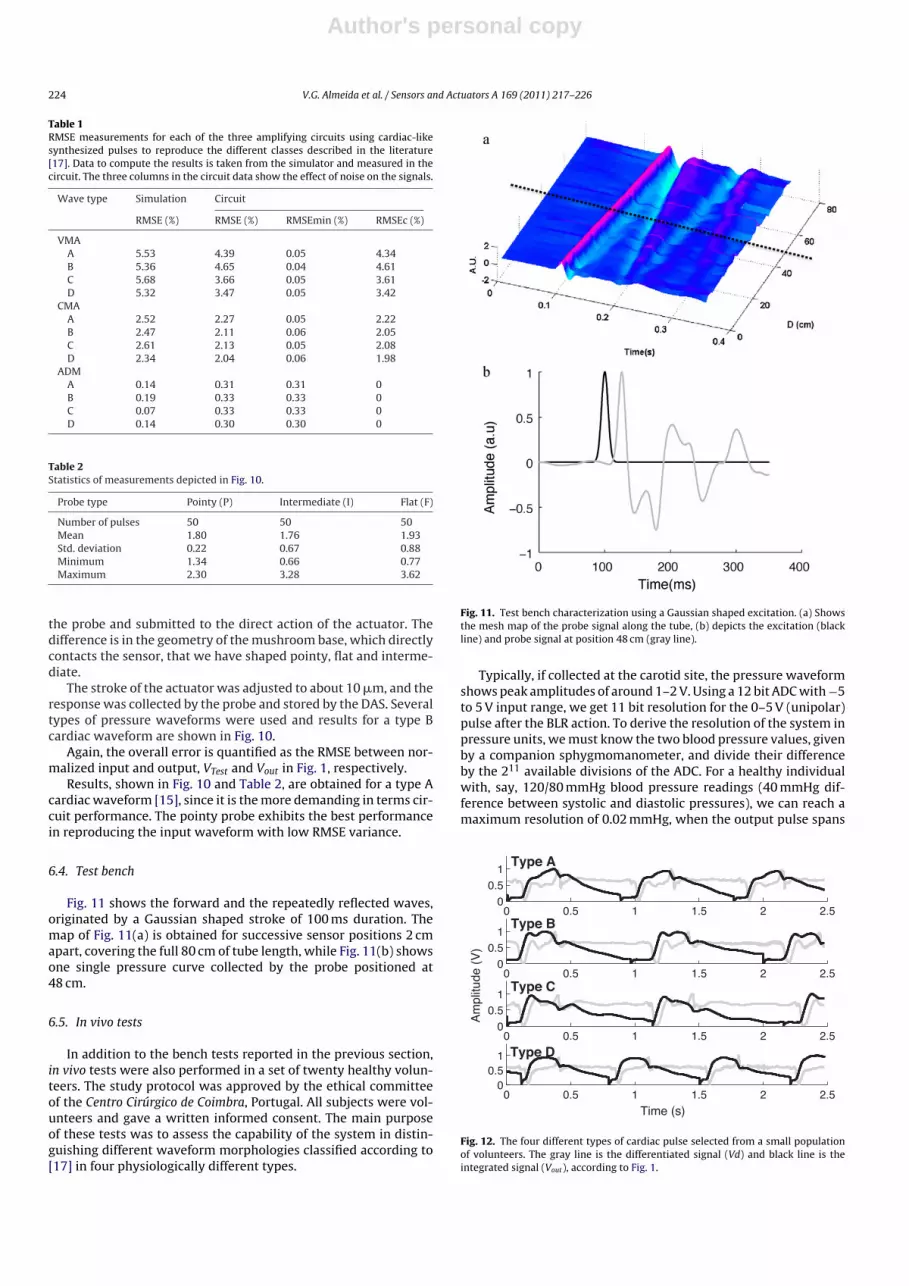
Fig. 11 shows the forward and the repeatedly reflected waves,originated by a Gaussian shaped stroke of 100 ms duration. Themap of Fig. 11(a) is obtained for successive sensor positions 2 cmapart, covering the full 80 cm of tube length, while Fig. 11(b) showsone single pressure curve collected by the probe positioned at48 cm.
6.5. In vivo tests
In addition to the bench tests reported in the previous section,in vivo tests were also performed in a set of twenty healthy volun-teers. The study protocol was approved by the ethical committeeof the Centro Cirúrgico de Coimbra, Portugal. All subjects were vol-unteers and gave a written informed consent. The main purposeof these tests was to assess the capability of the system in distin-guishing different waveform morphologies classified according to[17] in four physiologically different types.
Fig. 11. Test bench characterization using a Gaussian shaped excitation. (a) Showsthe mesh map of the probe signal along the tube, (b) depicts the excitation (blackline) and probe signal at position 48 cm (gray line).
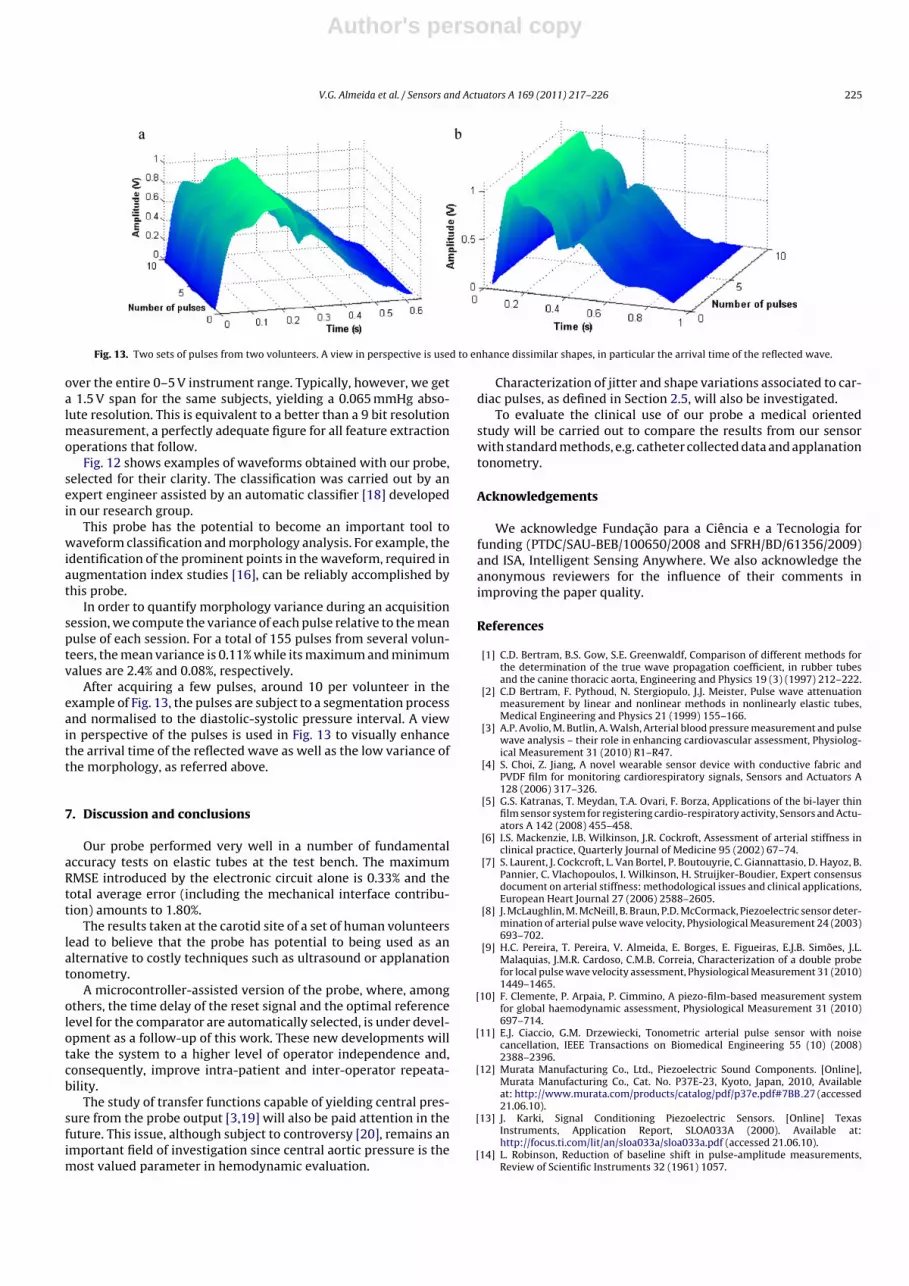
Typically, if collected at the carotid site, the pressure waveformshows peak amplitudes of around 1–2 V. Using a 12 bit ADC with −5to 5 V input range, we get 11 bit resolution for the 0–5 V (unipolar)pulse after the BLR action. To derive the resolution of the system inpressure units, we must know the two blood pressure values, givenby a companion sphygmomanometer, and divide their differenceby the 211 available divisions of the ADC. For a healthy individualwith, say, 120/80 mmHg blood pressure readings (40 mmHg dif-ference between systolic and diastolic pressures), we can reach amaximum resolution of 0.02 mmHg, when the output pulse spans
0 0.5 1 1.5 2 2.50
0.51
0 0.5 1 1.5 2 2.50
0.51
Am
plitu
de (
V)
0 0.5 1 1.5 2 2.50
0.51
0 0.5 1 1.5 2 2.50
0.51
Time (s)
Type A
Type B
Type C
Type D
Fig. 12. The four different types of cardiac pulse selected from a small populationof volunteers. The gray line is the differentiated signal (Vd) and black line is theintegrated signal (Vout), according to Fig. 1.
Author's personal copy
V.G. Almeida et al. / Sensors and Actuators A 169 (2011) 217– 226 225
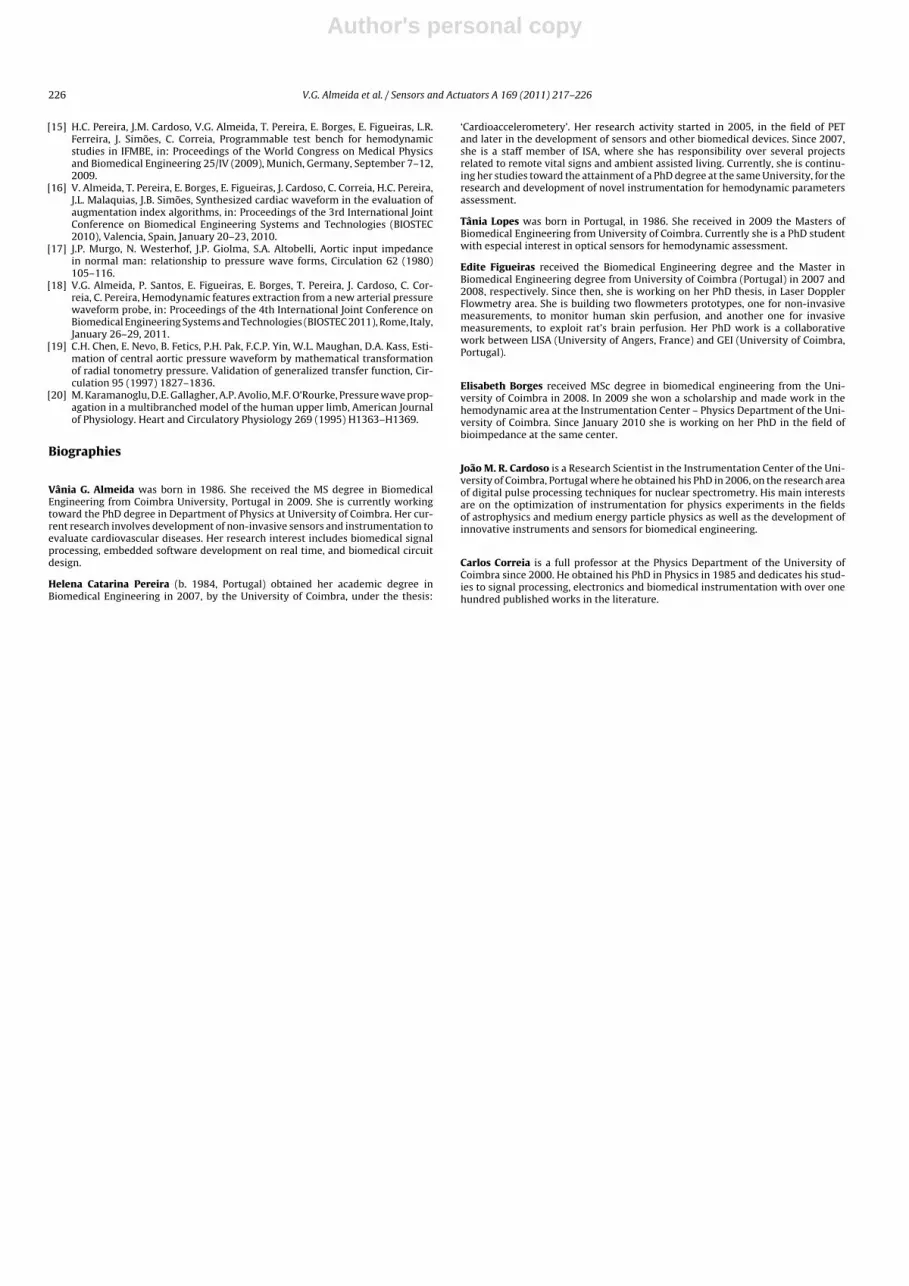
Fig. 13. Two sets of pulses from two volunteers. A view in perspective is used to enhance dissimilar shapes, in particular the arrival time of the reflected wave.
over the entire 0–5 V instrument range. Typically, however, we geta 1.5 V span for the same subjects, yielding a 0.065 mmHg abso-lute resolution. This is equivalent to a better than a 9 bit resolutionmeasurement, a perfectly adequate figure for all feature extractionoperations that follow.
Fig. 12 shows examples of waveforms obtained with our probe,selected for their clarity. The classification was carried out by anexpert engineer assisted by an automatic classifier [18] developedin our research group.
This probe has the potential to become an important tool towaveform classification and morphology analysis. For example, theidentification of the prominent points in the waveform, required inaugmentation index studies [16], can be reliably accomplished bythis probe.
In order to quantify morphology variance during an acquisitionsession, we compute the variance of each pulse relative to the meanpulse of each session. For a total of 155 pulses from several volun-teers, the mean variance is 0.11% while its maximum and minimumvalues are 2.4% and 0.08%, respectively.
After acquiring a few pulses, around 10 per volunteer in theexample of Fig. 13, the pulses are subject to a segmentation processand normalised to the diastolic-systolic pressure interval. A viewin perspective of the pulses is used in Fig. 13 to visually enhancethe arrival time of the reflected wave as well as the low variance ofthe morphology, as referred above.
7. Discussion and conclusions
Our probe performed very well in a number of fundamentalaccuracy tests on elastic tubes at the test bench. The maximumRMSE introduced by the electronic circuit alone is 0.33% and thetotal average error (including the mechanical interface contribu-tion) amounts to 1.80%.
The results taken at the carotid site of a set of human volunteerslead to believe that the probe has potential to being used as analternative to costly techniques such as ultrasound or applanationtonometry.
A microcontroller-assisted version of the probe, where, amongothers, the time delay of the reset signal and the optimal referencelevel for the comparator are automatically selected, is under devel-opment as a follow-up of this work. These new developments willtake the system to a higher level of operator independence and,consequently, improve intra-patient and inter-operator repeata-bility.
The study of transfer functions capable of yielding central pres-sure from the probe output [3,19] will also be paid attention in thefuture. This issue, although subject to controversy [20], remains animportant field of investigation since central aortic pressure is themost valued parameter in hemodynamic evaluation.
Characterization of jitter and shape variations associated to car-diac pulses, as defined in Section 2.5, will also be investigated.
To evaluate the clinical use of our probe a medical orientedstudy will be carried out to compare the results from our sensorwith standard methods, e.g. catheter collected data and applanationtonometry.
Acknowledgements
We acknowledge Fundac ão para a Ciência e a Tecnologia forfunding (PTDC/SAU-BEB/100650/2008 and SFRH/BD/61356/2009)and ISA, Intelligent Sensing Anywhere. We also acknowledge theanonymous reviewers for the influence of their comments inimproving the paper quality.
References
[1] C.D. Bertram, B.S. Gow, S.E. Greenwaldf, Comparison of different methods forthe determination of the true wave propagation coefficient, in rubber tubesand the canine thoracic aorta, Engineering and Physics 19 (3) (1997) 212–222.
[2] C.D Bertram, F. Pythoud, N. Stergiopulo, J.J. Meister, Pulse wave attenuationmeasurement by linear and nonlinear methods in nonlinearly elastic tubes,Medical Engineering and Physics 21 (1999) 155–166.
[3] A.P. Avolio, M. Butlin, A. Walsh, Arterial blood pressure measurement and pulsewave analysis – their role in enhancing cardiovascular assessment, Physiolog-ical Measurement 31 (2010) R1–R47.
[4] S. Choi, Z. Jiang, A novel wearable sensor device with conductive fabric andPVDF film for monitoring cardiorespiratory signals, Sensors and Actuators A128 (2006) 317–326.
[5] G.S. Katranas, T. Meydan, T.A. Ovari, F. Borza, Applications of the bi-layer thinfilm sensor system for registering cardio-respiratory activity, Sensors and Actu-ators A 142 (2008) 455–458.
[6] I.S. Mackenzie, I.B. Wilkinson, J.R. Cockroft, Assessment of arterial stiffness inclinical practice, Quarterly Journal of Medicine 95 (2002) 67–74.
[7] S. Laurent, J. Cockcroft, L. Van Bortel, P. Boutouyrie, C. Giannattasio, D. Hayoz, B.Pannier, C. Vlachopoulos, I. Wilkinson, H. Struijker-Boudier, Expert consensusdocument on arterial stiffness: methodological issues and clinical applications,European Heart Journal 27 (2006) 2588–2605.
[8] J. McLaughlin, M. McNeill, B. Braun, P.D. McCormack, Piezoelectric sensor deter-mination of arterial pulse wave velocity, Physiological Measurement 24 (2003)693–702.
[9] H.C. Pereira, T. Pereira, V. Almeida, E. Borges, E. Figueiras, E.J.B. Simões, J.L.Malaquias, J.M.R. Cardoso, C.M.B. Correia, Characterization of a double probefor local pulse wave velocity assessment, Physiological Measurement 31 (2010)1449–1465.
[10] F. Clemente, P. Arpaia, P. Cimmino, A piezo-film-based measurement systemfor global haemodynamic assessment, Physiological Measurement 31 (2010)697–714.
[11] E.J. Ciaccio, G.M. Drzewiecki, Tonometric arterial pulse sensor with noisecancellation, IEEE Transactions on Biomedical Engineering 55 (10) (2008)2388–2396.
[13] J. Karki, Signal Conditioning Piezoelectric Sensors. [Online] TexasInstruments, Application Report, SLOA033A (2000). Available at:http://focus.ti.com/lit/an/sloa033a/sloa033a.pdf (accessed 21.06.10).
[14] L. Robinson, Reduction of baseline shift in pulse-amplitude measurements,Review of Scientific Instruments 32 (1961) 1057.
Author's personal copy
226 V.G. Almeida et al. / Sensors and Actuators A 169 (2011) 217– 226
[15] H.C. Pereira, J.M. Cardoso, V.G. Almeida, T. Pereira, E. Borges, E. Figueiras, L.R.Ferreira, J. Simões, C. Correia, Programmable test bench for hemodynamicstudies in IFMBE, in: Proceedings of the World Congress on Medical Physicsand Biomedical Engineering 25/IV (2009), Munich, Germany, September 7–12,2009.
[16] V. Almeida, T. Pereira, E. Borges, E. Figueiras, J. Cardoso, C. Correia, H.C. Pereira,J.L. Malaquias, J.B. Simões, Synthesized cardiac waveform in the evaluation ofaugmentation index algorithms, in: Proceedings of the 3rd International JointConference on Biomedical Engineering Systems and Technologies (BIOSTEC2010), Valencia, Spain, January 20–23, 2010.
[17] J.P. Murgo, N. Westerhof, J.P. Giolma, S.A. Altobelli, Aortic input impedancein normal man: relationship to pressure wave forms, Circulation 62 (1980)105–116.
[18] V.G. Almeida, P. Santos, E. Figueiras, E. Borges, T. Pereira, J. Cardoso, C. Cor-reia, C. Pereira, Hemodynamic features extraction from a new arterial pressurewaveform probe, in: Proceedings of the 4th International Joint Conference onBiomedical Engineering Systems and Technologies (BIOSTEC 2011), Rome, Italy,January 26–29, 2011.
[19] C.H. Chen, E. Nevo, B. Fetics, P.H. Pak, F.C.P. Yin, W.L. Maughan, D.A. Kass, Esti-mation of central aortic pressure waveform by mathematical transformationof radial tonometry pressure. Validation of generalized transfer function, Cir-culation 95 (1997) 1827–1836.
[20] M. Karamanoglu, D.E. Gallagher, A.P. Avolio, M.F. O’Rourke, Pressure wave prop-agation in a multibranched model of the human upper limb, American Journalof Physiology. Heart and Circulatory Physiology 269 (1995) H1363–H1369.
Biographies
Vânia G. Almeida was born in 1986. She received the MS degree in BiomedicalEngineering from Coimbra University, Portugal in 2009. She is currently workingtoward the PhD degree in Department of Physics at University of Coimbra. Her cur-rent research involves development of non-invasive sensors and instrumentation toevaluate cardiovascular diseases. Her research interest includes biomedical signalprocessing, embedded software development on real time, and biomedical circuitdesign.
Helena Catarina Pereira (b. 1984, Portugal) obtained her academic degree inBiomedical Engineering in 2007, by the University of Coimbra, under the thesis:
‘Cardioaccelerometery’. Her research activity started in 2005, in the field of PETand later in the development of sensors and other biomedical devices. Since 2007,she is a staff member of ISA, where she has responsibility over several projectsrelated to remote vital signs and ambient assisted living. Currently, she is continu-ing her studies toward the attainment of a PhD degree at the same University, for theresearch and development of novel instrumentation for hemodynamic parametersassessment.
Tânia Lopes was born in Portugal, in 1986. She received in 2009 the Masters ofBiomedical Engineering from University of Coimbra. Currently she is a PhD studentwith especial interest in optical sensors for hemodynamic assessment.
Edite Figueiras received the Biomedical Engineering degree and the Master inBiomedical Engineering degree from University of Coimbra (Portugal) in 2007 and2008, respectively. Since then, she is working on her PhD thesis, in Laser DopplerFlowmetry area. She is building two flowmeters prototypes, one for non-invasivemeasurements, to monitor human skin perfusion, and another one for invasivemeasurements, to exploit rat’s brain perfusion. Her PhD work is a collaborativework between LISA (University of Angers, France) and GEI (University of Coimbra,Portugal).
Elisabeth Borges received MSc degree in biomedical engineering from the Uni-versity of Coimbra in 2008. In 2009 she won a scholarship and made work in thehemodynamic area at the Instrumentation Center – Physics Department of the Uni-versity of Coimbra. Since January 2010 she is working on her PhD in the field ofbioimpedance at the same center.
João M. R. Cardoso is a Research Scientist in the Instrumentation Center of the Uni-versity of Coimbra, Portugal where he obtained his PhD in 2006, on the research areaof digital pulse processing techniques for nuclear spectrometry. His main interestsare on the optimization of instrumentation for physics experiments in the fieldsof astrophysics and medium energy particle physics as well as the development ofinnovative instruments and sensors for biomedical engineering.
Carlos Correia is a full professor at the Physics Department of the University ofCoimbra since 2000. He obtained his PhD in Physics in 1985 and dedicates his stud-ies to signal processing, electronics and biomedical instrumentation with over onehundred published works in the literature.