Steady Spontaneous Capillary Flow in Partially Coated Tubes Mark M. Weislogel NASA Lewis Research Center, Cleveland, OH 44135 A spontaneous, steady capillaryflow is produced for a liquid index in a circular tube that is partially coated with a sugace modifier to create a discontinuous wetting condi- tion between upstream and downstreamportions of the tube. As a means of demonstrat- ing that the flow configuration may prove useful as a diagnostic tool in studies concem- ing capillarity and the physics associated with the moving contact line, average steady velocitiesare predicted and compared against a large aperimental data set that includes the effects of tube dimensions and fluid properties. To access a wider range of tube diameters (0.516 - 9.88 mm), experiments are p e ~ o r m e d employing “U-tubes ”tested in the low-gravityenvironment of a drop tower, in addition to straight capillary tubes tested horizontally in a laboratory. The sensitivity of the steady capillary flow to sugace clean- liness is dramatic. Introduction Spontaneous capillary flows are defined here as bulk capil- lary flows where spatial gradients in the interfacial tension and external forces on the fluid are absent. Such flows exist solely as a result of system geometry and surface wettability, and though they are commonplace in nature and industry, they are particularly conspicuous when the effects of gravity are small. Applications relating to coating flows and phase- separation processes are myriad and span wide ranges of length scales, for example, from ,< O(1 mm) in printing oper- ations to - 0(1 m) in the passive control/positioning of liq- uids (fuels, oxygen, wastes, etc.) in the tanks of orbiting spacecraft. In this study, a simple experimental technique is adopted that permits the observation of spontaneous capillary flows that are steady. Such flows may prove useful as a tool for probing the inner-scale mechanisms controlling dynamic wet- ting as relevant to many fluids management processes. The reported experiments and intentionally simplified theory are intended to be “demonstrative” of this possibility. Mechanism of Flow and Scope of Research Figure 1 shows a right-circular-cylindrical capillary tube partially filled with a liquid index. The ends of the tube are open to the atmosphere and the lefthand side of the tube is treated so that it is less wetting (higher static contact angle) than the righthand side (O,, < 02,). Since the pressure jump across a given interface is proportional to the curvature of that interface, a pressure gradient in the direction of the more favorably wetted side of the tube is established such that, if overcoming the effects of contact angle hysteresis, it pro- duces a flow resisted by the fluid’s viscosity. After a brief 02s-1 s Static I I - V steady flow Static I I Figure 1. Steady flow resulting from a discontinuous wetting condition on the interior of a circular tube of constant radius where 8, < 8,. AIChE Journal March 1997 Vol. 43, No. 3 645
Transcript
Steady Spontaneous Capillary Flow in Partially Coated Tubes
Mark M. Weislogel NASA Lewis Research Center, Cleveland, OH 44135
A spontaneous, steady capillary flow is produced for a liquid index in a circular tube that is partially coated with a sugace modifier to create a discontinuous wetting condi- tion between upstream and downstream portions of the tube. As a means of demonstrat- ing that the flow configuration may prove useful as a diagnostic tool in studies concem- ing capillarity and the physics associated with the moving contact line, average steady velocities are predicted and compared against a large aperimental data set that includes the effects of tube dimensions and fluid properties. To access a wider range of tube diameters (0.516 - 9.88 mm), experiments are pe~ormed employing “U-tubes ”tested in the low-gravity environment of a drop tower, in addition to straight capillary tubes tested horizontally in a laboratory. The sensitivity of the steady capillary flow to sugace clean- liness is dramatic.
Introduction Spontaneous capillary flows are defined here as bulk capil-
lary flows where spatial gradients in the interfacial tension and external forces on the fluid are absent. Such flows exist solely as a result of system geometry and surface wettability, and though they are commonplace in nature and industry, they are particularly conspicuous when the effects of gravity are small. Applications relating to coating flows and phase- separation processes are myriad and span wide ranges of length scales, for example, from ,< O(1 mm) in printing oper- ations to - 0(1 m) in the passive control/positioning of liq- uids (fuels, oxygen, wastes, etc.) in the tanks of orbiting spacecraft. In this study, a simple experimental technique is adopted
that permits the observation of spontaneous capillary flows that are steady. Such flows may prove useful as a tool for probing the inner-scale mechanisms controlling dynamic wet- ting as relevant to many fluids management processes. The reported experiments and intentionally simplified theory are intended to be “demonstrative” of this possibility.
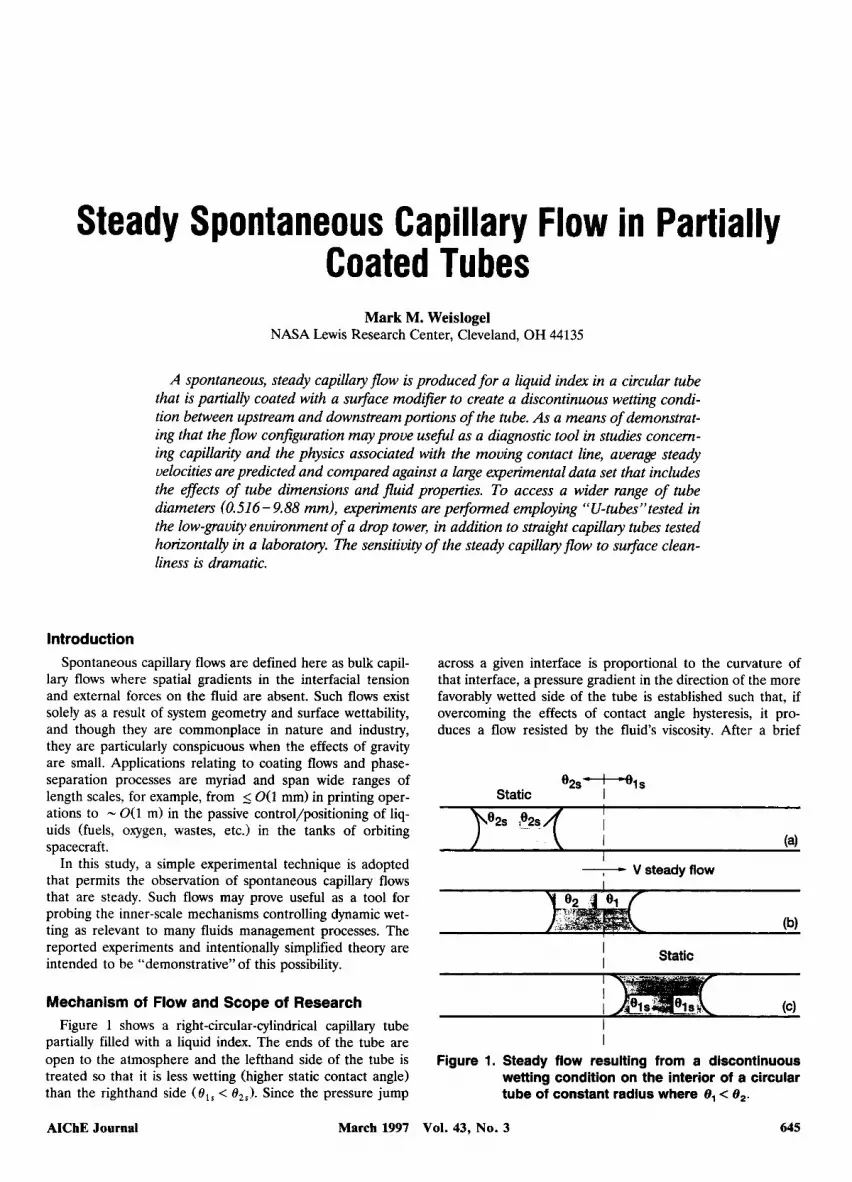
Mechanism of Flow and Scope of Research Figure 1 shows a right-circular-cylindrical capillary tube
partially filled with a liquid index. The ends of the tube are open to the atmosphere and the lefthand side of the tube is treated so that it is less wetting (higher static contact angle) than the righthand side (O,, < 02,). Since the pressure jump
across a given interface is proportional to the curvature of that interface, a pressure gradient in the direction of the more favorably wetted side of the tube is established such that, if overcoming the effects of contact angle hysteresis, it pro- duces a flow resisted by the fluid’s viscosity. After a brief
02s-1 s Static I
I - V steady flow
Static I I
Figure 1. Steady flow resulting from a discontinuous wetting condition on the interior of a circular tube of constant radius where 8, < 8,.
AIChE Journal March 1997 Vol. 43, No. 3 645
transient, the macroscopic flow is steady and persists as long as the liquid slug bridges the wetting discontinuity.
The earliest reference found explicitly envisioning such a flow (though there are likely to be earlier works) is that of Satterlee and Reynolds (19641, who briefly discuss the gen- eral case of capillary flow in tubes where the quantity ucose/r is not equal at each interface of the index, r being the local tube radius. One special case is that of Figure lb, which hap- pens to produce a steady flow. This feature is unique in two respects: (1) it can avoid the need for transient analysis nec- essary, for instance, in similar “capillary rise” experiments (Kistler, 1993, p. 348 and references contained therein), and (2) it is still a capillary flow in which the steady fluid velocity is not maintained by, say, pump pressure, gravity head, a plunging tape, and so forth, but rather by the spontaneous flow itself.
To demonstrate the utility of the technique, a l-dimen- sional (1-D) analysis is performed principally to determine the average steady velocity of a liquid index of length I , vis- cosity p, density p , and surface tension u, in a tube of radius r , with air as the host medium. Simple experiments are then outlined and data presented for tests performed using small capillary tubes ( r 6 1.0 mm) in a laboratory and larger capil- lary tubes ( r 5 5.0 mm) in the reduced-gravity environment produced by a drop tower. The experimental results are scaled and presented against the independent variables of the prob- lem. A brief discussion follows. It is no surprise that these flows are quite sensitive to the level of cleanliness of the tubes and that reproducibility and predictability are greatly in- creased with increased control of the surface conditions. Since the resulting steady velocities can be measured with excellent accuracy the sensitivity of these flows to surface conditions may make this experimental approach well suited for studies of capillary flows over heterogeneous surfaces where the “heterogeneous” nature of the surface is highly controlled. For examples of such studies, see Schwartz and Garoff (1985) and Paterson et al. (1995).
One-Dimensional Analysis; Average Steady Velocity
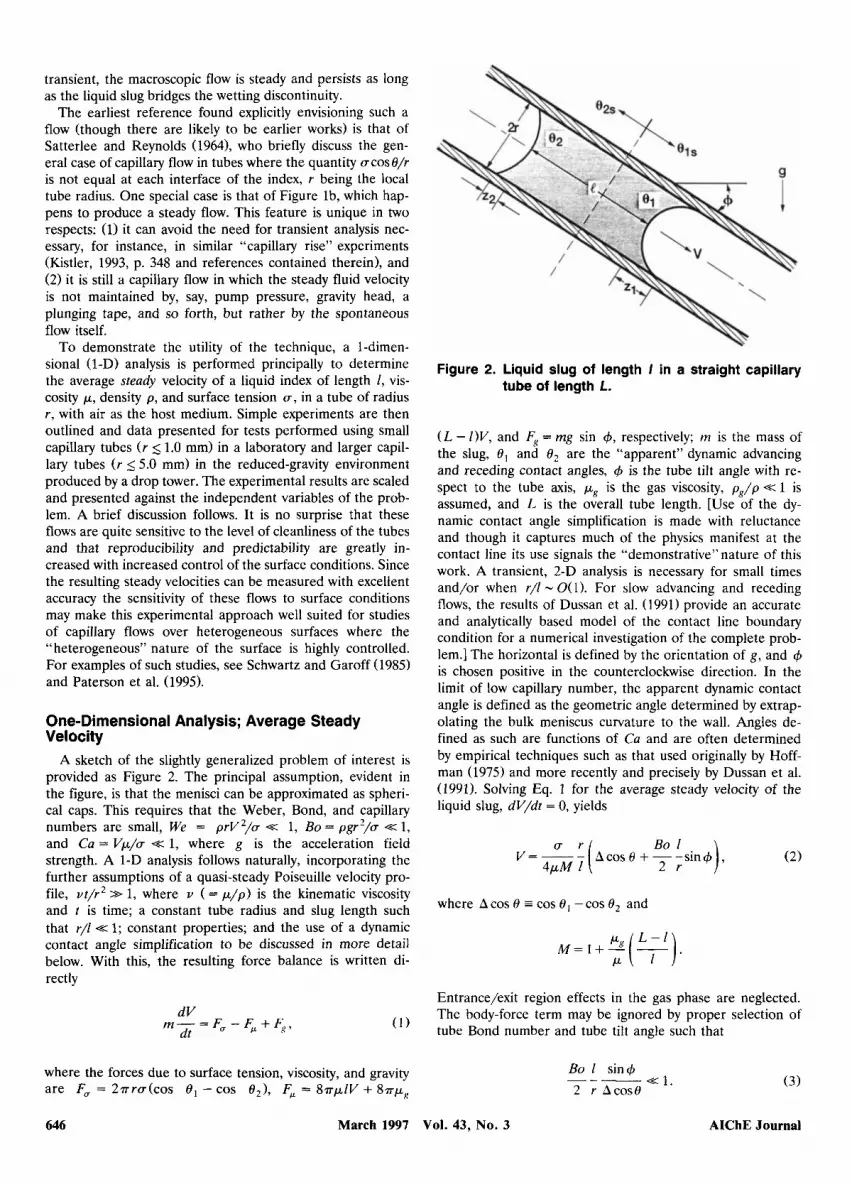
A sketch of the slightly generalized problem of interest is provided as Figure 2. The principal assumption, evident in the figure, is that the menisci can be approximated as spheri- cal caps. This requires that the Weber, Bond, and capillary numbers are small, We = prV2/u << 1, Bo = p g r 2 / u <+ 1, and Cu = Vp/u << 1, where g is the acceleration field strength. A 1-D analysis follows naturally, incorporating the further assumptions of a quasi-steady Poiseuille velocity pro- file, vt /r2 >> 1, where u ( = p / ~ ) is the kinematic viscosity and t is time; a constant tube radius and slug length such that r/I << 1; constant properties; and the use of a dynamic contact angle simplification to be discussed in more detail below. With this, the resulting force balance is written di- rectly
dV dt
m- = F, - F, i- Fq,
where the forces due to surface tension, viscosity, and gravity are F, = 2 r r u ( c o s 8, - cos F, = 8 r p f V + 8 r p 8
Figure 2. Liquid slug of length I in a straight capillary tube of length L.
( L - l)V, and F, = rng sin +, respectively; m is the mass of the slug, 8 , and O2 are the “apparent” dynamic advancing and receding contact angles, 4 is the tube tilt angle with re- spect to the tube axis, pg is the gas viscosity, p , / ~ << 1 is assumed, and L is the overall tube length. [Use of the dy- namic contact angle simplification is made with reluctance and though it captures much of the physics manifest at the contact line its use signals the “demonstrative” nature of this work. A transient, 2-D analysis is necessary for small times and/or when r/l - O( 1). For slow advancing and receding flows, the results of Dussan et al. (1991) provide an accurate and analytically based model of the contact line boundary condition for a numerical investigation of the complete prob- lem.] The horizontal is defined by the orientation of g, and + is chosen positive in the counterclockwise direction. In the limit of low capillary number, the apparent dynamic contact angle is defined as the geometric angle determined by extrap- olating the bulk meniscus curvature to the wall. Angles de- fined as such are functions of Cu and are often determined by empirical techniques such as that used originally by Hoff- man (1975) and more recently and precisely by Dussan et al. (1991). Solving Eq. 1 for the average steady velocity of the liquid slug, dV/dr = 0, yields
where A cos 8 = cos 8 , - cos O2 and
(2)
Entrance/exit region effects in the gas phase are neglected. The body-force term may be ignored by proper selection of tube Bond number and tube tilt angle such that
Bo 1 sin+ 2 r hcos8 << 1. ( 3 )
646 March 1997 Vol. 43, No. 3 AIChE Journal
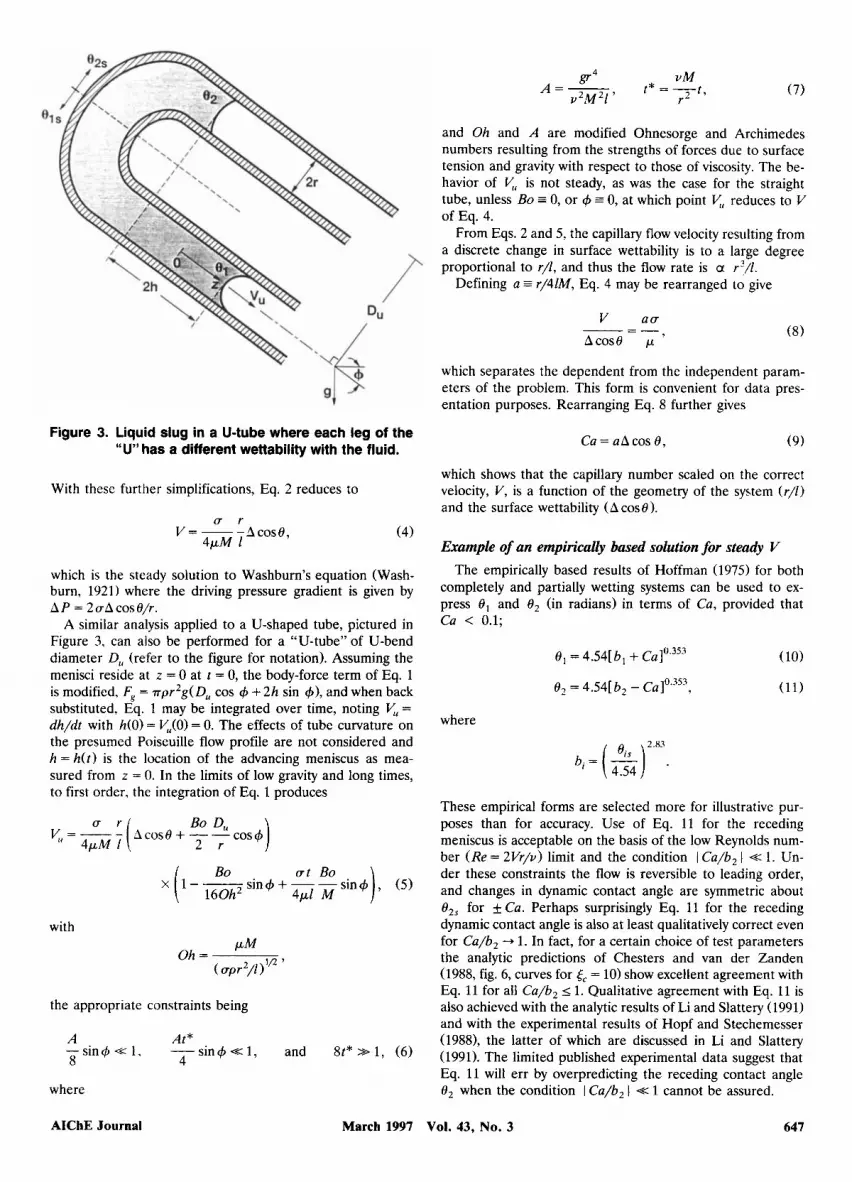
Figure 3. Liquid slug in a U-tube where each leg of the “U” has a different wettability with the fluid.
With these further simplifications, Eq. 2 reduces to
u r V = - -9cos8,
4pM 1 (4)
which is the steady solution to Washburn’s equation (Wash- burn, 1921) where the driving pressure gradient is given by A P = 2aAcos@/r .
A similar analysis applied to a U-shaped tube, pictured in Figure 3, can also be performed for a “U-tube” of U-bend diameter D,, (refer to the figure for notation). Assuming the menisci reside at z = 0 at t = 0, the body-force term of Eq. 1 is modified, F,, = rpr2g(D, cos $ + 2h sin $1, and when back substituted, Eq. 1 may be integrated over time, noting V, = dh/dt with h(0) = V,(O) = 0. The effects of tube curvature on the presumed Poiseuille flow profile are not considered and h = h ( t ) is the location of the advancing meniscus as mea- sured from z = 0. In the limits of low gravity and long times, to first order, the integration of Eq. 1 produces
Bo 0, y,=-- 4pM r ( lcos8+--cos$ I 2 r
Bo a t Bo ( 160h2 4p1 M x l-- sin&+ --sin$
with
the appropriate constraints being
A At* - sin4 << 1. __ sin4 c 1 , and 8t* >> 1 , (6 ) 8 4
where
UM t* = y t ,
gr4 A = - u2M21’ r - (7)
and Oh and A are modified Ohnesorge and Archimedes numbers resulting from the strengths of forces due to surface tension and gravity with respect to those of viscosity. The be- havior of y, is not steady, as was the case for the straight tube, unless Bo = 0, or $ = 0, at which point y , reduces to V of Eq. 4.
From Eqs. 2 and 5, the capillary flow velocity resulting from a discrete change in surface wettability is to a large degree proportional to r/l, and thus the flow rate is a r’/l.
Defining a = r/41M, Eq. 4 may be rearranged to give
which separates the dependent from the independent param- eters of the problem. This form is convenient for data pres- entation purposes. Rearranging Eq. 8 further gives
C a = u A c o s 8 , (9)
which shows that the capillary number scaled on the correct velocity, V, is a function of the geometry of the system (r/ l) and the surface wettability ( A cos 8).
Example of an empirically based solution for steady V The empirically based results of Hoffman (1975) for both
completely and partially wetting systems can be used to ex- press @, and O2 (in radians) in terms of Cu, provided that c u < 0.1;
where 2.83
These empirical forms are selected more for illustrative pur- poses than for accuracy. Use of Eq. 11 for the receding meniscus is acceptable on the basis of the low Reynolds num- ber (Re = 21/r/v) limit and the condition I Cu/b, I -=z 1. Un- der these constraints the flow is reversible to leading order, and changes in dynamic contact angle are symmetric about 82s for ~ C U . Perhaps surprisingly Eq. 11 for the receding dynamic contact angle is also at least qualitatively correct even for Cu/b2 -+ 1. In fact, for a certain choice of test parameters the analytic predictions of Chesters and van der Zanden (1988, fig. 6, curves for 6, = 10) show excellent agreement with Eq. 11 for all Cu/b2 I 1. Qualitative agreement with E.q. 11 is also achieved with the analytic results of Li and Slattery (1991) and with the experimental results of Hopf and Stechemesser (1988), the latter of which are discussed in Li and Slattery (1991). The limited published experimental data suggest that Eq. 11 will err by overpredicting the receding contact angle 8, when the condition I Cu/b2 I c 1 cannot be assured.
AIChE Journal March 1997 Vol. 43. No. 3 647
Substituting the expressions of Eqs. 10 and 11 into A cos O of Eq. 9, Ca can be determined implicitly from
Therefore, Ca, and in turn V, may be calculated in terms of the geometric ratio a and the static receding and advanc- ing contact angles, e,,. As Kistler (1993, p. 328) reminded us, the selection of O,, depends largely on the degree of hystere- sis on the specific surface and the time available to establish equilibrium. In the absence of such data, the longtime static advancing and receding values may suffice. In the limit b , -+ 0 and << 1, Eq. 12 reduces to
(13)
Equation 13 serves as an appropriate first choice for Ca in the iterative solution of Eq. 12. Though arguably unphysical for a 2 0(0.1), as will be discussed, it can be shown from Eq. 12 that Ca is maximized with respect to a when A cos O = 0. Solving this condition for Ca using Hoffman’s correlation, Eqs. 10 and 11 with b, -+ 0, gives
2.83
cam, = L (%) 2 4.54 .
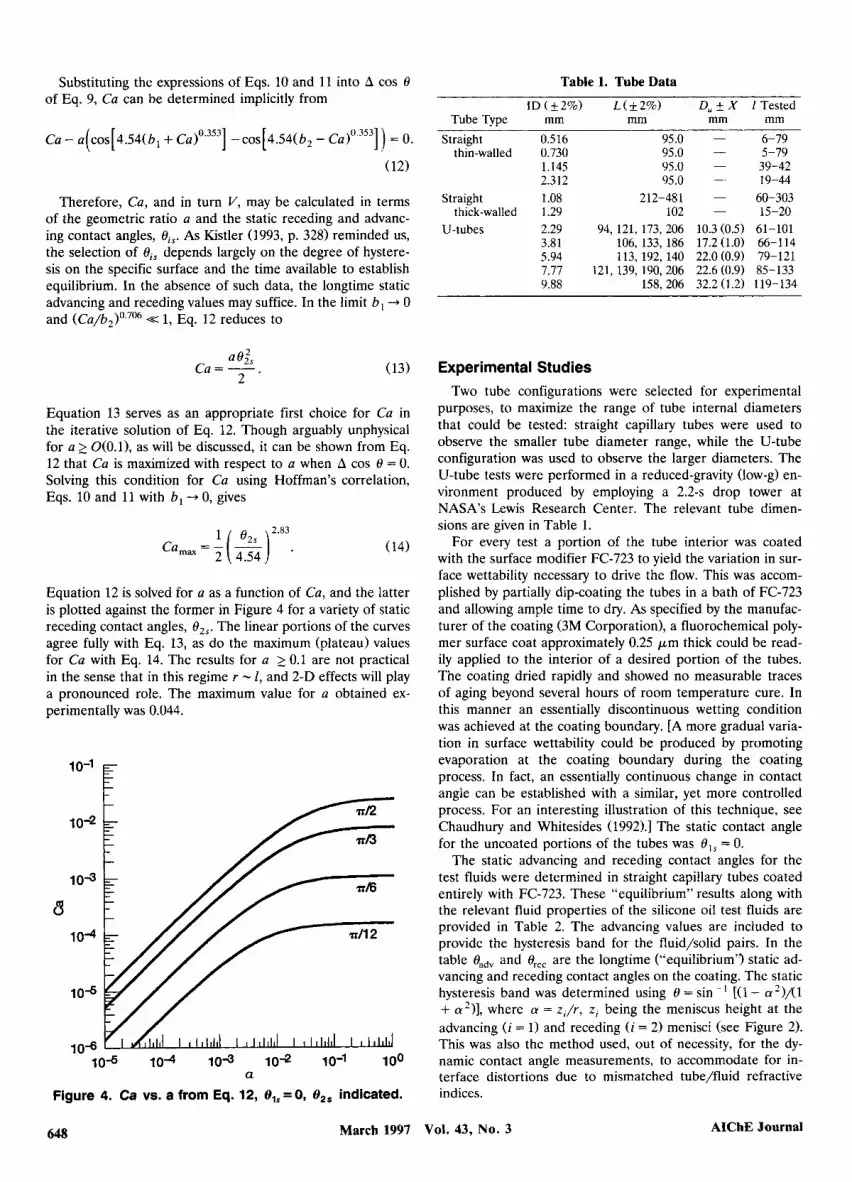
Equation 12 is solved for a as a function of Ca, and the latter is plotted against the former in Figure 4 for a variety of static receding contact angles, 02$. The linear portions of the curves agree fully with Eq. 13, as do the maximum (plateau) values for Ca with Eq. 14. The results for a 2 0.1 are not practical in the sense that in this regime r - I, and 2-D effects will play a pronounced role. The maximum value for a obtained ex- perimentally was 0.044.
lo-’ E
a Figure 4. Ca vs. a from Eq. 12, tllS=O, tl,, indicated.
Table 1. Tube Data
TubeType mrn mm rnrn mm Straight 0.516 95.0 - 6-79
Experimental Studies Two tube configurations were selected for experimental
purposes, to maximize the range of tube internal diameters that could be tested: straight capillary tubes were used to observe the smaller tube diameter range, while the U-tube configuration was used to observe the larger diameters. The U-tube tests were performed in a reduced-gravity (low-g) en- vironment produced by employing a 2.2-s drop tower at NASA’s Lewis Research Center. The relevant tube dimen- sions are given in Table 1.
For every test a portion of the tube interior was coated with the surface modifier FC-723 to yield the variation in sur- face wettability necessary to drive the flow. This was accom- plished by partially dip-coating the tubes in a bath of FC-723 and allowing ample time to dry. As specified by the manufac- turer of the coating (3M Corporation), a fluorochemical poly- mer surface coat approximately 0.25 pm thick could be read- ily applied to the interior of a desired portion of the tubes. The coating dried rapidly and showed no measurable traces of aging beyond several hours of room temperature cure. In this manner an essentially discontinuous wetting condition was achieved at the coating boundary. [A more gradual varia- tion in surface wettability could be produced by promoting evaporation at the coating boundary during the coating process. In fact, an essentially continuous change in contact angle can be established with a similar, yet more controlled process. For an interesting illustration of this technique, see Chaudhury and Whitesides (1992).] The static contact angle for the uncoated portions of the tubes was O,, = 0.
The static advancing and receding contact angles for the test fluids were determined in straight capillary tubes coated entirely with FC-723. These “equilibrium” results along with the relevant fluid properties of the silicone oil test fluids are provided in Table 2. The advancing values are included to provide the hysteresis band for the fluid/solid pairs. In the table Oadv and Or,, are the longtime equilibrium'^ static ad- vancing and receding contact angles on the coating. The static hysteresis band was determined using O = sin-’ [(l- a2)/(l + a’)], where a = z , / r , z , being the meniscus height at the advancing ( i = 1) and receding (i = 2) menisci (see Figure 2). This was also the method used, out of necessity, for the dy- namic contact angle measurements, to accommodate for in- terface distortions due to mismatched tube/fluid refractive indices.
March 1997 Vol. 43, No. 3 AIChE Journal 648
Table 2. Properties of Silicone Oil Test Fluids (Dow Corning) on FC-723 Coated Glass
u t 2 % P 55 u t5% eadV x ere, 5 x X lO-(’rn2/s kg/m3 N/m deg. deg.
Straight tube tests A straight capillary tube, cleaned and coated, was charged
with a liquid slug of prescribed length introduced from the coated end of the tube. The tube was then tilted with respect to gravity until the slug began to flow toward the boundary of the coating. When this boundary was reached, the fluid rapidly achieved a steady velocity in the direction of the un- coated side of the tube. At this point the tube was immedi- ately placed on a level (4 < 0.01’) glass table, the entire pro- cess being backlit and filmed with a variable-speed cine cam- era directed vertically downward at the tube.
The uncertainties particular to the straight tube tests and unaccounted for in the development of Eq. 2 are the en- trance/exit region effects and nonaxisymmetric menisci at- tributable to the gravity field being perpendicular to the tube axis. For the typical test fluids, tube radii, slug lengths, and the resulting flow velocities - 0(1 cm/s), these effects could be estimated separately and shown to have little effect ( 5 f 5%) on the steady velocities measured.
U-tube tests The U-tube approach was adopted as a simple means for
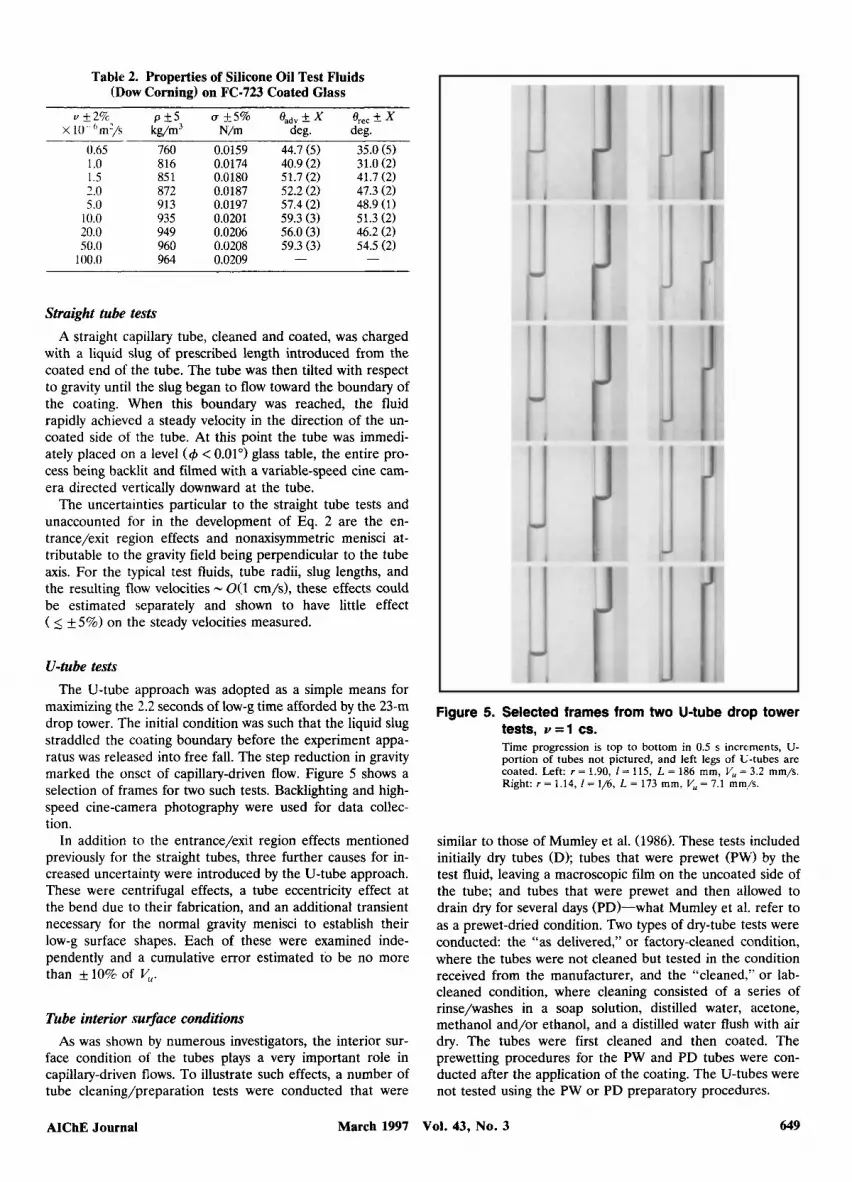
maximizing the 2.2 seconds of low-g time afforded by the 23-m drop tower. The initial condition was such that the liquid slug straddled the coating boundary before the experiment appa- ratus was released into free fall. The step reduction in gravity marked the onset of capillary-driven flow. Figure 5 shows a selection of frames for two such tests. Backlighting and high- speed cine-camera photography were used for data collec- tion.
In addition to the entrance/exit region effects mentioned previously for the straight tubes, three further causes for in- creased uncertainty were introduced by the U-tube approach. These were centrifugal effects, a tube eccentricity effect at the bend due to their fabrication, and an additional transient necessary for the normal gravity menisci to establish their low-g surface shapes. Each of these were examined inde- pendently and a cumulative error estimated to be no more than +10% of yi.
Tube interior surface conditions As was shown by numerous investigators, the interior sur-
face condition of the tubes plays a very important role in capillary-driven flows. To illustrate such effects, a number of tube cleaning/preparation tests were conducted that were
Figure 5. Selected frames from two U-tube drop tower tests, v = 1 cs. Time progression is top to bottom in 0.5 s increments, U- portion of tubes not pictured, and left legs of U-tubes are coated. Left: r = 1.90, I = 115, L = 186 mm, V, = 3.2 mm/s. Right: r = 1.14, I = 1/6, L = 173 mm, V, = 7.1 mm,/s.
similar to those of Mumley et al. (1986). These tests included initially dry tubes (D); tubes that were prewet (PW) by the test fluid, leaving a macroscopic film on the uncoated side of the tube; and tubes that were prewet and then allowed to drain dry for several days (PD)-what Mumley et al. refer to as a prewet-dried condition. Two types of dry-tube tests were conducted the “as delivered,” or factory-cleaned condition, where the tubes were not cleaned but tested in the condition received from the manufacturer, and the “cleaned,” or lab- cleaned condition, where cleaning consisted of a series of rinse/washes in a soap solution, distilled water, acetone, methanol and/or ethanol, and a distilled water flush with air dry. The tubes were first cleaned and then coated. The prewetting procedures for the PW and PD tubes were con- ducted after the application of the coating. The U-tubes were not tested using the PW or PD preparatory procedures.
AIChE Journal March 1997 Vol. 43, No. 3 649
30 r 25
20
$ 15
r- 10 Q)
5
0 0 10 20 30 40
Time, s
0 10 20 30 40 50 60 Time, s
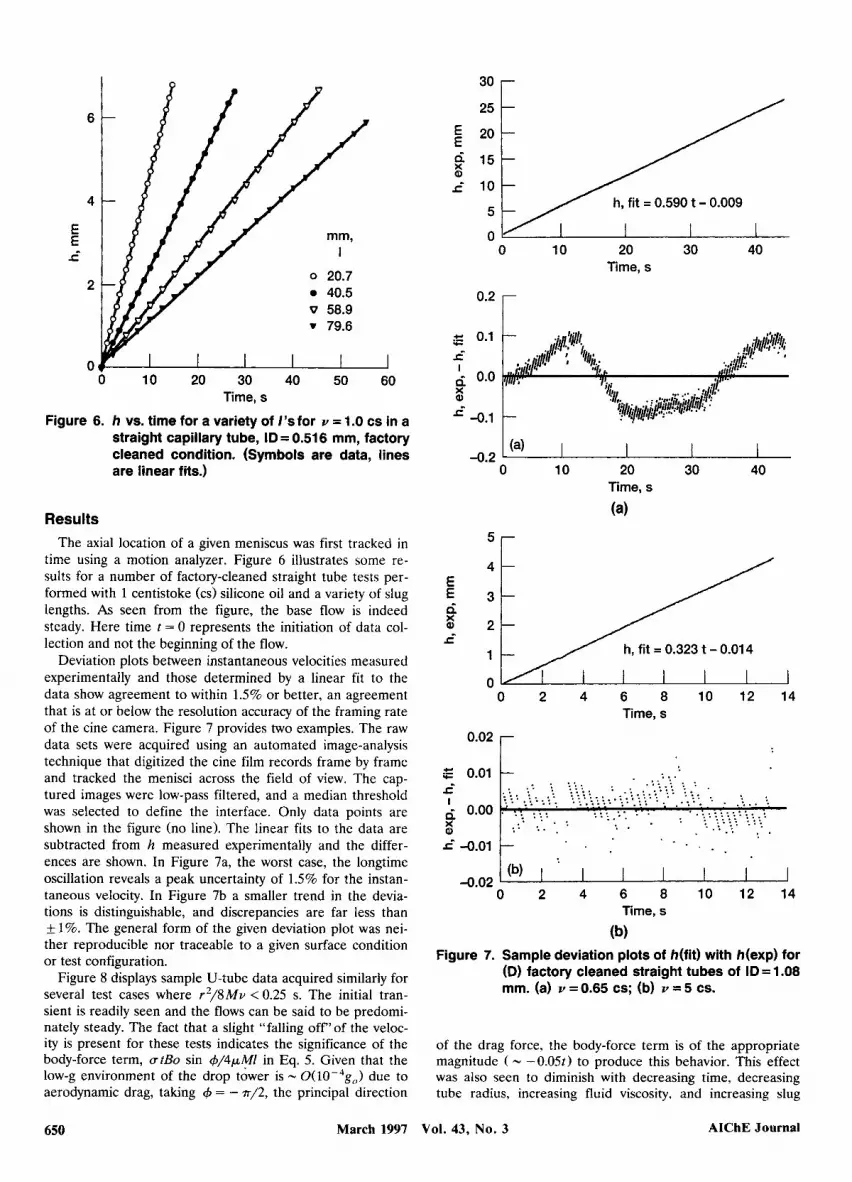
Figure 6. h vs. time for a variety of 1’s for Y = 1 .O cs in a straight capillary tube, ID= 0.516 mm, factory cleaned condition. (Symbols are data, lines are linear fits.)
Results The axial location of a given meniscus was first tracked in
time using a motion analyzer. Figure 6 illustrates some re- sults for a number of factory-cleaned straight tube tests per- formed with 1 centistoke (cs) silicone oil and a variety of slug lengths. As seen from the figure, the base flow is indeed steady. Here time t = 0 represents the initiation of data col- lection and not the beginning of the flow.
Deviation plots between instantaneous velocities measured experimentally and those determined by a linear fit to the data show agreement to within 1.5% or better, an agreement that is at or below the resolution accuracy of the framing rate of the cine camera. Figure 7 provides two examples. The raw data sets were acquired using an automated image-analysis technique that digitized the cine film records frame by frame and tracked the menisci across the field of view. The cap- tured images were low-pass filtered, and a median threshold was selected to define the interface. Only data points are shown in the figure (no line). The linear fits to the data are subtracted from h measured experimentally and the differ- ences are shown. In Figure 7a, the worst case, the longtime oscillation reveals a peak uncertainty of 1.5% for the instan- taneous velocity. In Figure 7b a smaller trend in the devia- tions is distinguishable, and discrepancies are far less than k 1%. The general form of the given deviation plot was nei- ther reproducible nor traceable to a given surface condition or test configuration.
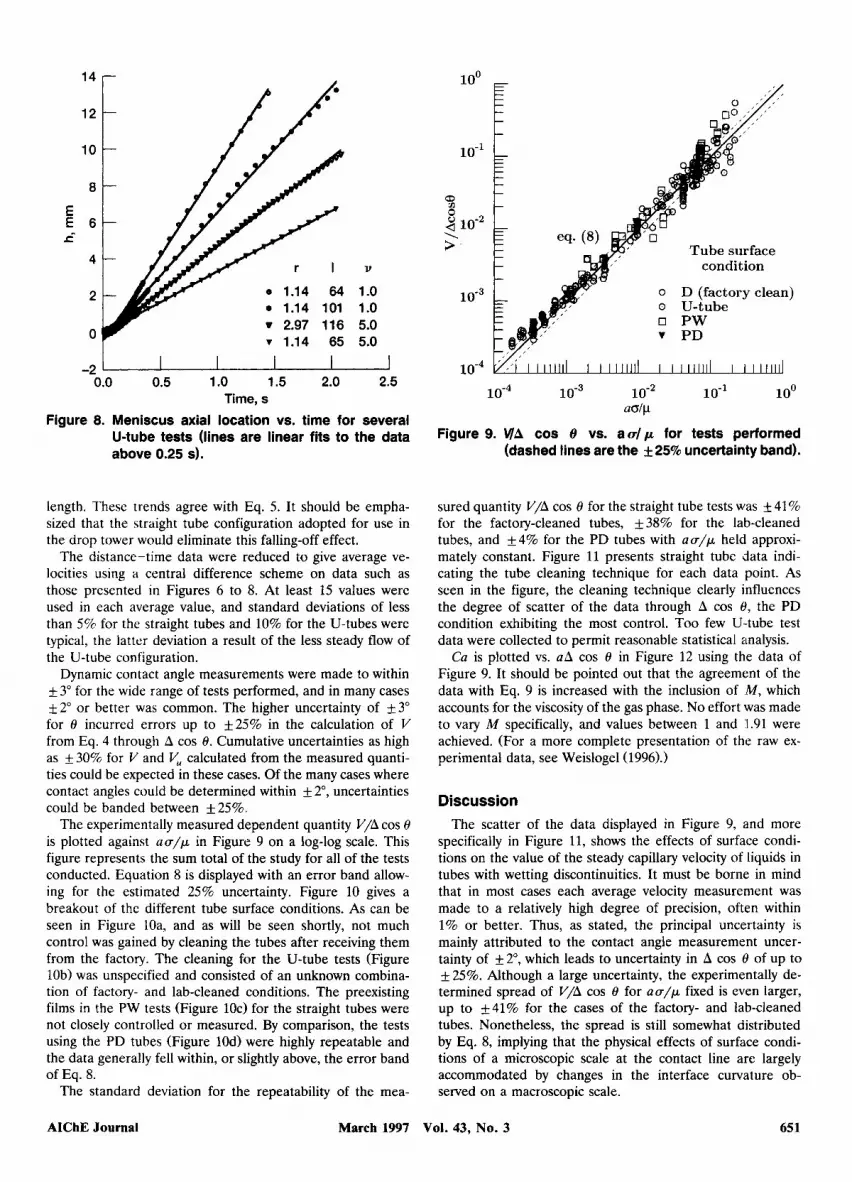
Figure 8 displays sample U-tube data acquired similarly for several test cases where r2 /8Mu < 0.25 s. The initial tran- sient is readily seen and the flows can be said to be predomi- nately steady. The fact that a slight “falling off’of the veloc- ity is present for these tests indicates the significance of the body-force term, atBo sin ~$/4@4I in Eq. 5. Given that the low-g environment of the drop tower is - 0(1O-‘gg,) due to aerodynamic drag, taking 4 = - ~ / 2 , the principal direction
r
(4 -0.2
0 10 20 30 40 Time, s
(a)
5r
0 0 2 4 6 8 1 0 1 2 1 4
Time, s
0.02 r
r“ -0.01 t (b) I
-0.02 0 2 4 6 8 1 0 1 2 1 4
Time, s
(b) Figure 7. Sample deviation plots of /?(fit) with h(exp) for
(D) factory cleaned straight tubes of ID = 1.08 mm. (a) Y = 0.65 cs; (b) Y = 5 cs.
of the drag force, the body-force term is of the appropriate magnitude ( - -0.05t) to produce this behavior. This effect was also seen to diminish with decreasing time, decreasing tube radius, increasing fluid viscosity, and increasing slug
650 March 1997 Vol. 43, No. 3 AlChE Journal
14 r- loo
12
10
8
E € 6 S"
4
2
0
1,
1.0 1 .o 5.0 5.0
-2 0.0 0.5 1 .o 1.5 2.0 2.5
Time, s Figure 8. Meniscus axial location vs. time for several
U-tube tests (lines are linear fits to the data above 0.25 s).
length. These trends agree with Eq. 5. It should be empha- sized that the straight tube configuration adopted for use in the drop tower would eliminate this falling-off effect.
The distance-time data were reduced to give average ve- locities using a central difference scheme on data such as those presented in Figures 6 to 8. At least 15 values were used in each average value, and standard deviations of less than 5% for the straight tubes and 10% for the U-tubes were typical, the latter deviation a result of the less steady flow of the U-tube configuration.
Dynamic contact angle measurements were made to within 5 3" for the wide range of tests performed, and in many cases
2" or better was common. The higher uncertainty of 5 3" for 8 incurred errors up to f25% in the calculation of V from Eq. 4 through A cos 6. Cumulative uncertainties as high as f30% for V and V, calculated from the measured quanti- ties could be expected in these cases. Of the many cases where contact angles could be determined within & 2", uncertainties could be banded between & 25%.
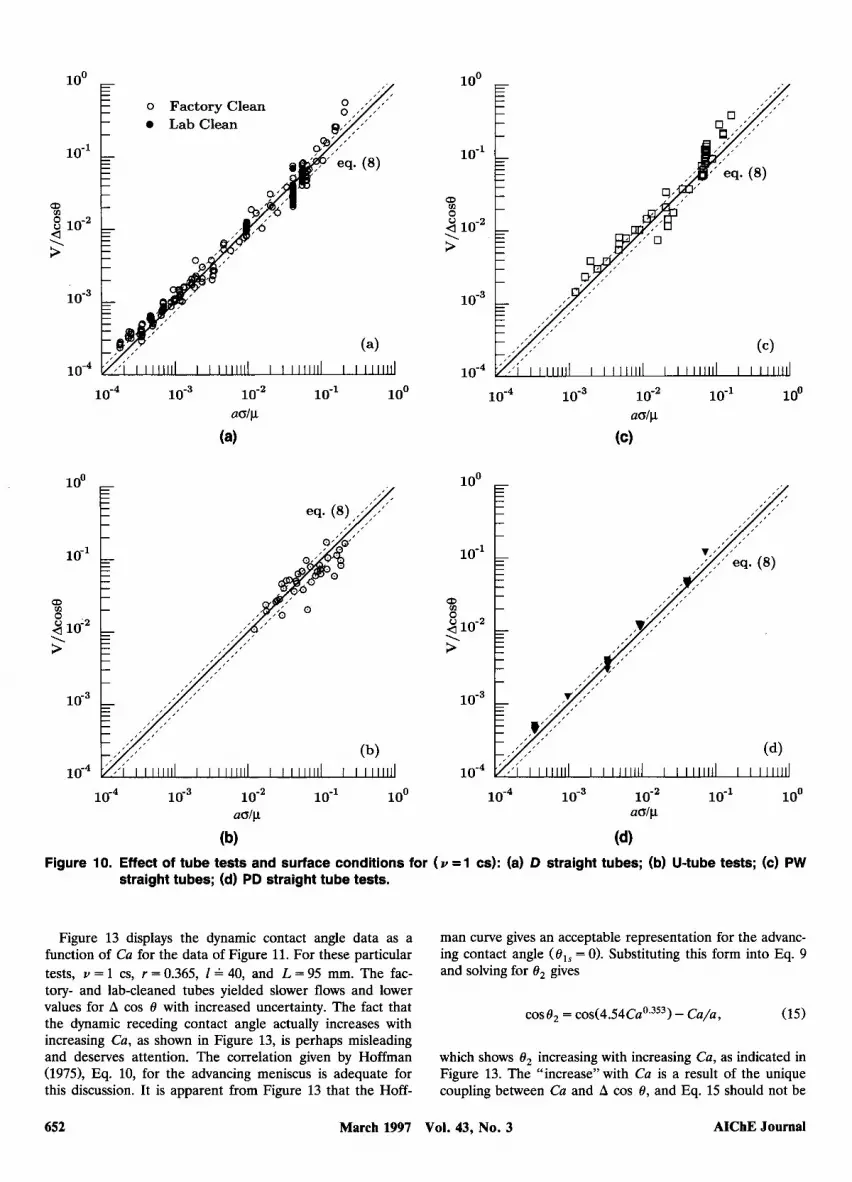
The experimentally measured dependent quantity V/A cos 6 is plotted against u u / p in Figure 9 on a log-log scale. This figure represents the sum total of the study for all of the tests conducted. Equation 8 is displayed with an error band allow- ing for the estimated 25% uncertainty. Figure 10 gives a breakout of the different tube surface conditions. As can be seen in Figure IOa, and as will be seen shortly, not much control was gained by cleaning the tubes after receiving them from the factory. The cleaning for the U-tube tests (Figure lob) was unspecified and consisted of an unknown combina- tion of factory- and lab-cleaned conditions. The preexisting films in the PW tests (Figure 1Oc) for the straight tubes were not closely controlled or measured. By comparison, the tests using the PD tubes (Figure 10d) were highly repeatable and the data generally fell within, or slightly above, the error band of Eq. 8.
The standard deviation for the repeatability of the mea-
10-l
3 d" \ >
10"
t _ I
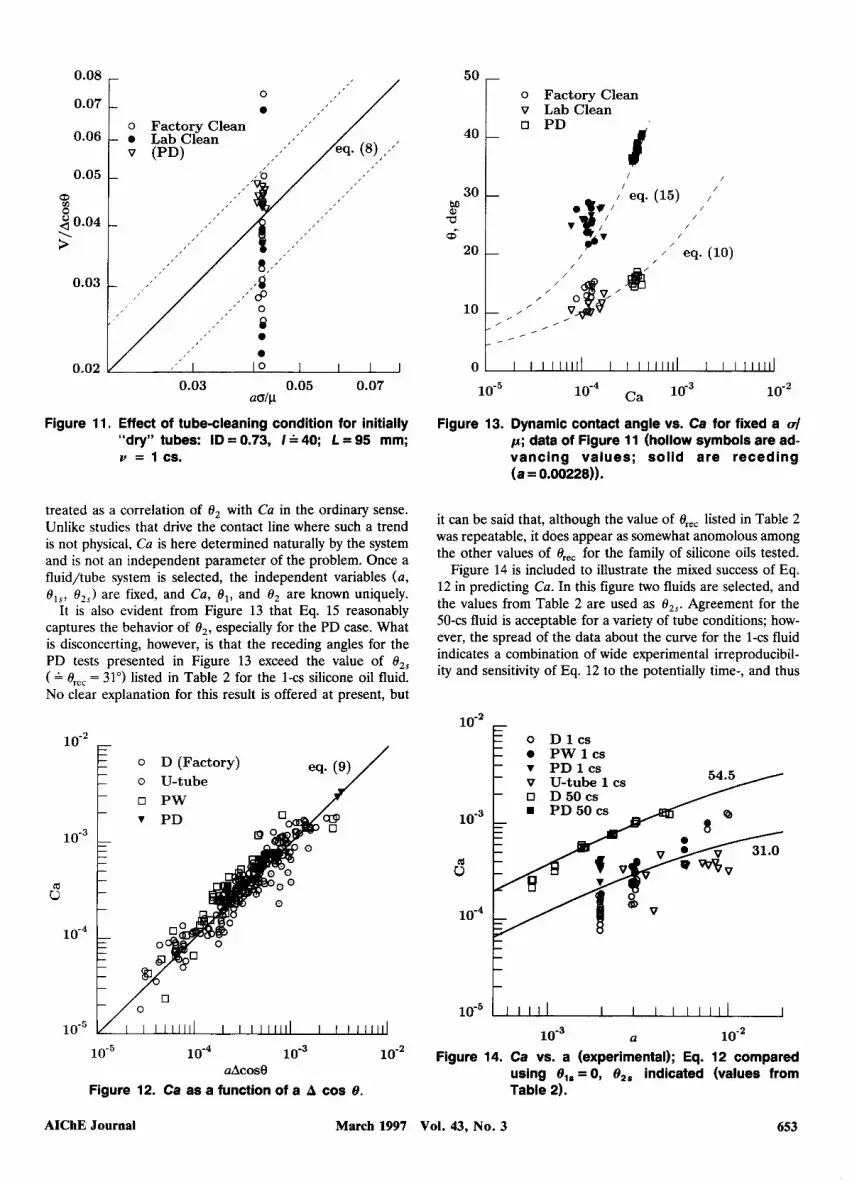
sured quantity V/A cos 8 for the straight tube tests was k 41 % for the factory-cleaned tubes, 538% for the lab-cleaned tubes, and &4% for the PD tubes with u u / p held approxi- mately constant. Figure 11 presents straight tube data indi- cating the tube cleaning technique for each data point. As seen in the figure, the cleaning technique clearly influences the degree of scatter of the data through A cos 19, the PD condition exhibiting the most control. Too few U-tube test data were collected to permit reasonable statistical analysis.
Cu is plotted vs. U A cos 8 in Figure 12 using the data of Figure 9. It should be pointed out that the agreement of the data with Eq. 9 is increased with the inclusion of M , which accounts for the viscosity of the gas phase. No effort was made to vary M specifically, and values between 1 and 1.91 were achieved. (For a more complete presentation of the raw ex- perimental data, see Weislogel (1996).)
Discussion The scatter of the data displayed in Figure 9, and more
specifically in Figure 11, shows the effects of surface condi- tions on the value of the steady capillary velocity of liquids in tubes with wetting discontinuities. It must be borne in mind that in most cases each average velocity measurement was made to a relatively high degree of precision, often within 1% or better. Thus, as stated, the principal uncertainty is mainly attributed to the contact angle measurement uncer- tainty of &2", which leads to uncertainty in A cos 8 of up to & 25%. Although a large uncertainty, the experimentally de- termined spread of V/A cos 8 for u a / p fixed is even larger, up to &41% for the cases of the factory- and lab-cleaned tubes. Nonetheless, the spread is still somewhat distributed by Eq. 8, implying that the physical effects of surface condi- tions of a microscopic scale at the contact line are largely accommodated by changes in the interface curvature ob- served on a macroscopic scale.
AIChE Journal March 1997 Vol. 43, No. 3 65 1
loo
10-1
% s > d \
o Factory Clean LabClean a.’ t 0 9 7 ’
E- L
loo
10-1
%
> 4 \
I I1111111 I I1111111 I 1 1 1 1 1 1 1 1 I I l l l L u l
loo
10-l
1 o - ~
10-1 loo 1 o - ~ 10-1 loo d p adp
(a) (c)
loo
10-1
10-~
m3 10-1 loo 10-1 loo aolp adp
(b) (a Figure 10. Effect of tube tests and surface conditions for ( v = l cs): (a) D straight tubes; (b) U-tube tests; (c) PW
straight tubes; (d) PD straight tube tests.
Figure 13 displays the dynamic contact angle data as a function of Ca for the data of Figure 11. For these particular tests, v = 1 cs, r = 0.365, 1 A 40, and L = 95 mm. The fac- tory- and lab-cleaned tubes yielded slower flows and lower values for A cos 8 with increased uncertainty. The fact that the dynamic receding contact angle actually increases with increasing Ca, as shown in Figure 13, is perhaps misleading and deserves attention. The correlation given by Hoffman (1975), Eq. 10, for the advancing meniscus is adequate for this discussion. It is apparent from Figure 13 that the Hoff-
man curve gives an acceptable representation for the advanc- ing contact angle (Ols = 0). Substituting this form into Eq. 9 and solving for O2 gives
case, = c o ~ ( 4 . 5 4 C a O . ~ ~ ~ ) - Ca/a, (15)
which shows O2 increasing with increasing Ca, as indicated in Figure 13. The “increase” with Ca is a result of the unique coupling between Ca and A cos 8, and Eq. 15 should not be
652 March 1997 Vol. 43, No. 3 AIChE Journal
0.08 /
0.07
0.06
0.05
% 4 0.04
> \
0.03
0.02
c 0 / t :
I ,’ / I’ 0
a
I 10 I I I ] 0.03 0.05 0.07
aolp
Figure 11. Effect of tube-cleaning condition for initially “dry” tubes: ID=0.73, /=LO; L=95 mm; v = 1 cs.
treated as a correlation of 6, with Ca in the ordinary sense. Unlike studies that drive the contact line where such a trend is not physical, Ca is here determined naturally by the system and is not an independent parameter of the problem. Once a fluid/tube system is selected, the independent variables (a, 6,,, 6,,> are fixed, and Ca, 6,, and 6, are known uniquely.
It is also evident from Figure 13 that Eq. 15 reasonably captures the behavior of O,, especially for the PD case. What is disconcerting, however, is that the receding angles for the PD tests presented in Figure 13 exceed the value of eZs ( A ere, = 31”) listed in Table 2 for the 1-cs silicone oil fluid. No clear explanation for this result is offered at present, but
o D (Factory) o U-tube 0 PW v PD
i 1 0 - 3 ~ 10’~
17
1 0 - ~ I I I111111 I I I I I I I I I I I I111111
1 o - ~ 10” aAcos0
Figure 12. Ca as a function of a A cos 8.
o Factory Clean 50 r v Lab Clean
O /
10-~ Ca
Figure 13. Dynamic contact angle vs. Ca for fixed a a/ p; data of Figure 11 (hollow symbols are ad- vancing values; solid are receding (a = 0.00228)).
it can be said that, although the value of ere, listed in Table 2 was repeatable, it does appear as somewhat anomolous among the other values of ere, for the family of silicone oils tested.
Figure 14 is included to illustrate the mixed success of Eq. 12 in predicting Ca. In this figure two fluids are selected, and the values from Table 2 are used as eZs. Agreement for the 50-cs fluid is acceptable for a variety of tube conditions; how- ever, the spread of the data about the curve for the l-cs fluid indicates a combination of wide experimental irreproducibil- ity and sensitivity of Eq. 12 to the potentially time-, and thus
o D l c s E PWlCS
s
v U-tube 1 cs
PD50cs
1 0 - ~
10” a
Figure 14. Ca vs. a (experimental); Eq. 12 compared using O,, =0, 8,, indicated (values from Table 2).
AIChE Journal March 1997 Vol. 43, No. 3 653
velocity-, dependent values of Ois . The complex relationship between the closer-to-equilibrium advancing and receding contact angles listed in Table 2 and the corresponding dy- namic quantities was not addressed. The accuracy of Eq. 11 over a wide range of velocities and values for Cu/b, was also not quantified. It is clear, however, that the constraints on Eq. 11 are better satisfied for the 50-cs fluid: for both the 1 - and 50-cs fluids, Cu/b, 5 0.1, but for the 1-cs fluid, Re - O(1) compared to Re ,< 0.01 for the 50-cs fluid. Velocities of the former were approximately 15 to 30 times faster than the lat- ter for comparable a.
Concluding Remarks The experimental results presented herein demonstrate the
steady nature of flows generated by discontinuously wetted tubes. This is most clearly seen from the individual tests per- formed (refer to Figure 6). The general agreement of Eq. 8 with the complete data set in Figure 9 is also indicative of the accuracy of the simplified analysis over a wide parametric range, the scatter of the data about the predicted curve being primarily due to a large uncertainty - *25% in the mea- surement of A cos 0. Equation 4 can be solved directly for V, provided empirical data or analytic expressions are available for the advancing and receding contact angles as functions of Cu. An example of a simple though approximate approach employing the empirically based Hoffman curve for dynamic contact angles, demonstrates that Eq. 9 may be solved in the implicit form of Eq. 12 for Cu, and hence, I/. The solution of this equation requires only knowledge of the geometric ratio u = r/41M and the static advancing and receding contact an- gles.
Capillary number ranges achievable in such purely capil- lary-driven flows are limited by O,, and the ratio a, and for this study an upper bound of Cu - 0(10-3) was achieved. What is perhaps most interesting here is the degree to which these flows are sensitive to tube surface conditions. For ex- ample, Figure 13 displays a threefold increase in Cu for the PD condition. Thus, the technique of using surface coatings to produce steady spontaneous capillary flows may serve well as a tool for probing the inner-scale mechanisms controlling dynamic wetting, since the steady velocities can be measured to a high degree of precision.
Acknowledgment The author especially thanks J. Kadlowec, through Baldwin Wal-
lace College, and A. White, a participant in the Summer High School Apprenticeship Research Program (SHARP) for their assistance in
data collection. Discussions with R. Balasubramaniam are also ap- preciated.
Notation h, =Hoffman shift function for partial wetting h =meniscus axial location
M =viscosity ratio function Re =Reynolds number I* =dimensionless time z =coordinate along tube axis
Subscripts 1 =uncoated portion of tube 2 =coated portion of tube
max =maximum value
Literature Cited Chaudhury, M., and G. M. Whitesides, “How to Make Water Run
Uphill,” Science, 256, 1539 (1992). Chesters, A. K., and A. J. J. Van Der Zanden, ”An Approximate
Solution of the Hydrodynamic Problem Associated with Receding Liquid-Gas Contact Lines,” In(. J . Midtiphase Flow, 1!3(5), 905 (1993).
Dussan, V, E. B., E. Rame, and S. Garoff, “On Identifying the Ap- propriate Boundary Conditions at a Moving Contact Line: An Ex- perimental Investigation,” J . Fluid Mech., 23097 (1991 ).
Hoffman, R. L., “A Study of the Advancing Interface. I. Interface Shape in Liquid-Gas Systems,” J . Colloids Int. Sci., 50:228 (1975).
Hopf, W., and H. Stechemesser, “Three-Phase Contact Line Move- ment in Systems with and without Surfactant,” Colloids Surf., 33, 25 (1988).
Kistler, S. F., Wettability, Surfuctunt Science Series, Vol. 49. J. C. Berg, ed., Dekker, New York, p. 311 (1993).
Li, D., and J. C. Slattery, “Analysis of the Moving Apparent Com- mon Line and Dynamic Contact Angle Formed by a Draining Film.’ J . Colloids Ini. Sci., 143(2), 382 (1991).
Mumley, T. E., C. J. Radke, and M. C. Williams, “Kinetics of Liq- uid/Liquid Capillary Rise,” J . Colloids Int. Sci., Parts I and 11, 109(2), 398 (1986).
Paterson, A., M. Fermigier, P. Jenffer, and L. Limat, “Wetting on Heterogeneous Surfaces: Experiments in an Imperfect Hele-Shaw Cell,” fhys. Reu. E , 51(2), 1291 (1995).
Satterlee, H. M., and W. C. Reynolds, “The Dynamics of the Free Liquid Surface in Cylindrical Containers under Strong Capillary and Weak Gravity Conditions,” Tech. Rep. LG-2, Dept. of Me- chanical Engineering, Stanford Univ., Stanford, CA (1964).
Schwartz, L. W., and S. Garoff, “Contact Angle Hysteresis on Het- erogeneous Surfaces.” Lungmuir, 1(2), 219 (1985).
Washburn, E. W., “The Dynamics of Capillary Flow,” fhys . Reo., 2nd Series XVII, 3, 273 (1921).
Weislogel, M. M., “Steady Capillary Driven Flow,” NASA TM- 107146. Lewis Research Center, Cleveland, OH (1996).


![Calix[4]tubes: An Approach to Functionalization](https://static.documents.page/doc/80x56/634ce6ef7b55c75a3406c83f/calix4tubes-an-approach-to-functionalization.jpg)


