Archimer, archive institutionnelle de l’Ifremerhttp://www.ifremer.fr/docelec/
Characterization of residual stresses in wound composite tubes
P. Casaria, F. Jacquemina and P. Daviesb
aGeM, Institut de Recherche en Génie Civil et Mécanique - UMR CNRS 6183, 2, rue de la Houssinière, BP 92208, 44322 Nantes Cedex 03, France bIFREMER Centre de Brest, BP 70, 29280 Plouzané, France *: Corresponding author : Fax: +33 02 51 12 55 57. [email protected]
Abstract: This paper presents a method for the characterization of residual stresses in thick filament wound tubes. The three materials considered in the study are wet wound epoxy composite tubes based on E glass, R glass and T700 carbon fibres with three winding angles, [±35], [±55] and [±85] with respect to the longitudinal axis. The aim of the present work is to measure internal stresses, based on strains liberated by cutting composite tubes, and to compare results with predictions from a residual stress model based on the classical equations of solid mechanics. This leads to a simple technique which allows the quick identification of the effects of manufacturing and moisture on the internal multi-axial stress level. Keywords: Residual stress; Composite; Tube; Moisture
1. Introduction
The increasing use of composite laminates in engineering applications, due to their high
strength-to-weight ratio as well as excellent corrosion and fatigue resistance, has resulted in
greater interest in their long term behaviour. Composites tubes are widely used for a range of
industrial applications and have been the subject of many previous studies. The manufacture
of composite tubes by filament winding generates process-induced stresses. When curing is
completed, the tubes are then subjected to ambient conditions which may generate
hygrothermal internal stresses which add to the residual manufacturing stresses. When
polymer matrix composites are exposed to elevated temperatures and wet environments they
undergo dimensional and stress state changes due to moisture induced swelling and thermal
expansion. Such stresses can have a significant effect on the mechanical performance of
composite structures by inducing warpage and initiating matrix cracks and delaminations.
However it is not a trivial task to measure internal stresses accurately during the service life of
composite structures. The aim of the present study is to measure internal stresses and to
compare them to numerical predictions. An experimental investigation into internal stress
measurement is described here, based on measuring the strains revealed by cutting composite
tubes. Axial and transverse cuts release the strains caused by internal stresses. The
corresponding residual stress model, based on continuum mechanics within the framework of
hygrothermoelasticity, is presented. Then the comparison is given through the calculation of
axial and circumferential bending moments.
2. Experimental study
2.1. Principle of residual stresses characterisation
Many techniques have been developed to measure internal stresses. Embedded sensors such
as optical fibres [1] and strain gages have been used to measure the local internal stress state.
At a ply or macroscopic scale the hole drilling method [2], the layer removal method [3] and
the compliance method [4] have been used in the past. The experimental technique used in the
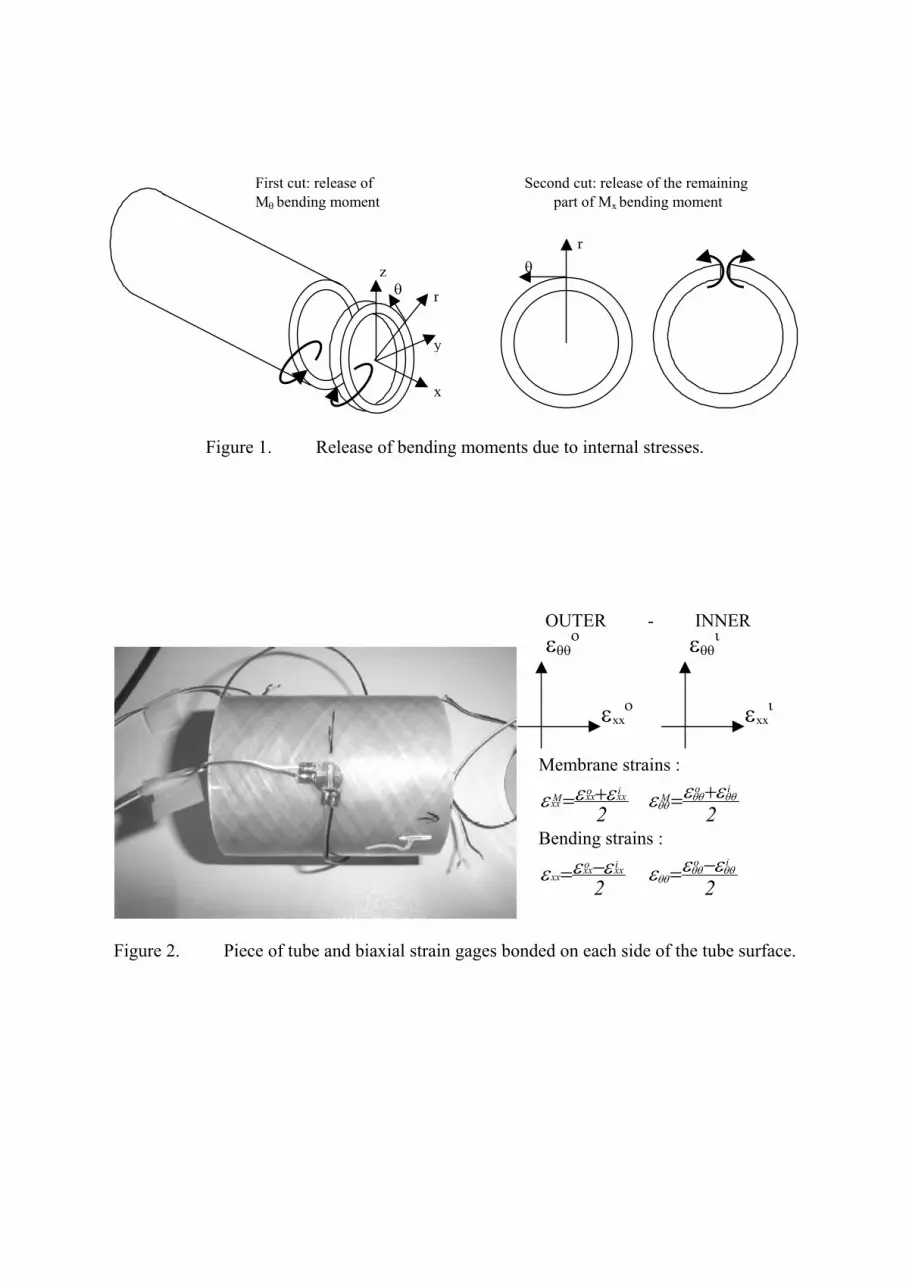
current work is similar to the compliance method and consists of sectioning the tubes (Figure
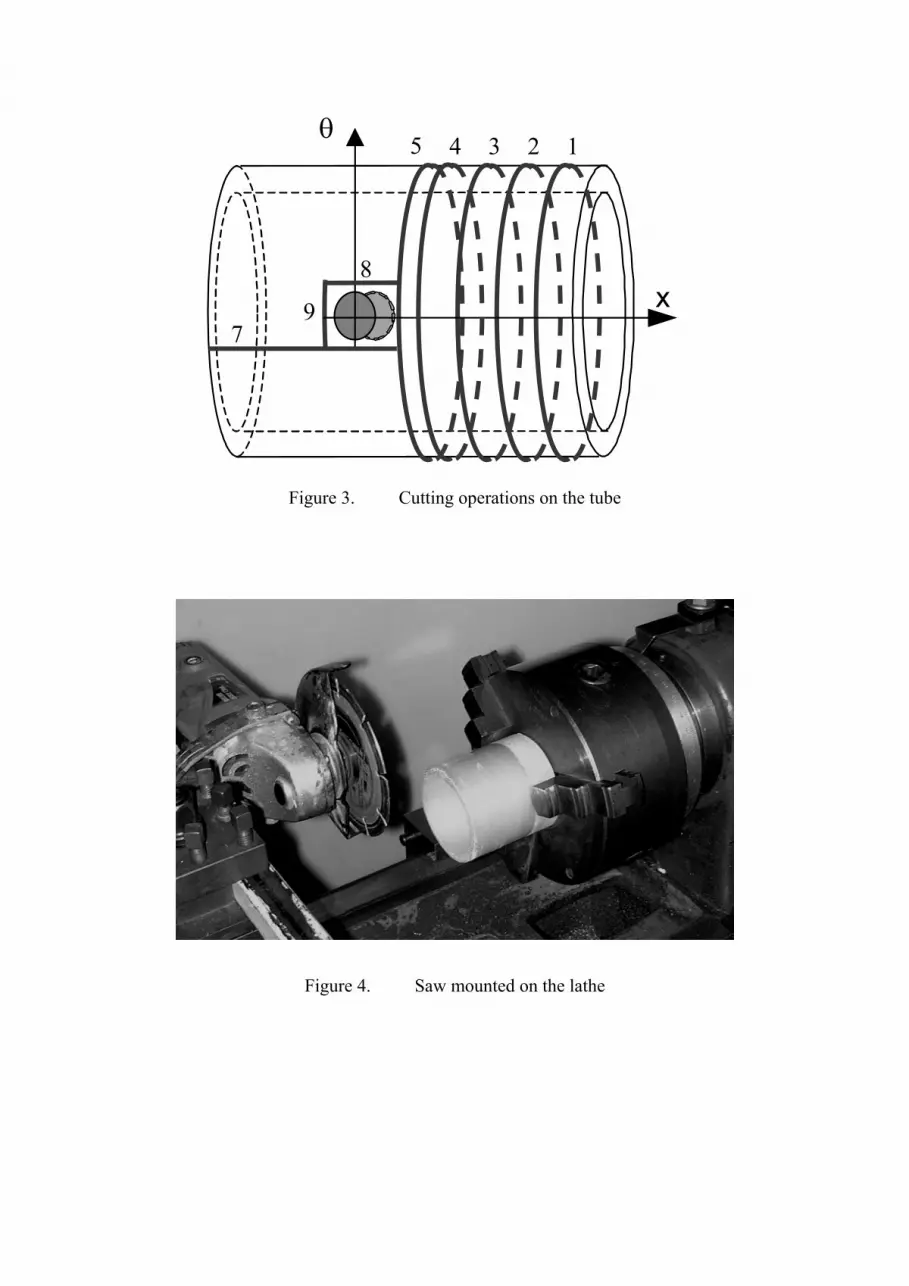
1) and measuring the change in strains on the external and internal surfaces with two biaxial
strain gages, one bonded to each side of the tube wall (Figure 2). This leads to the estimation
of axial and circumferential internal bending moments in order to give an order of magnitude
of quantities commonly used in industrial design for the calculation of the properties of
filament wound tubes.
2.2. Testing operation
The test chosen to reveal residual stresses is a destructive one. It involves removing all the
tube surrounding the area on which strain gages are bonded. A series of cuts is performed, and
strains follow a non-monotonic evolution which depends on the order of cutting operations.
The testing procedure is detailed below in order to analyse accurately the effect of each step
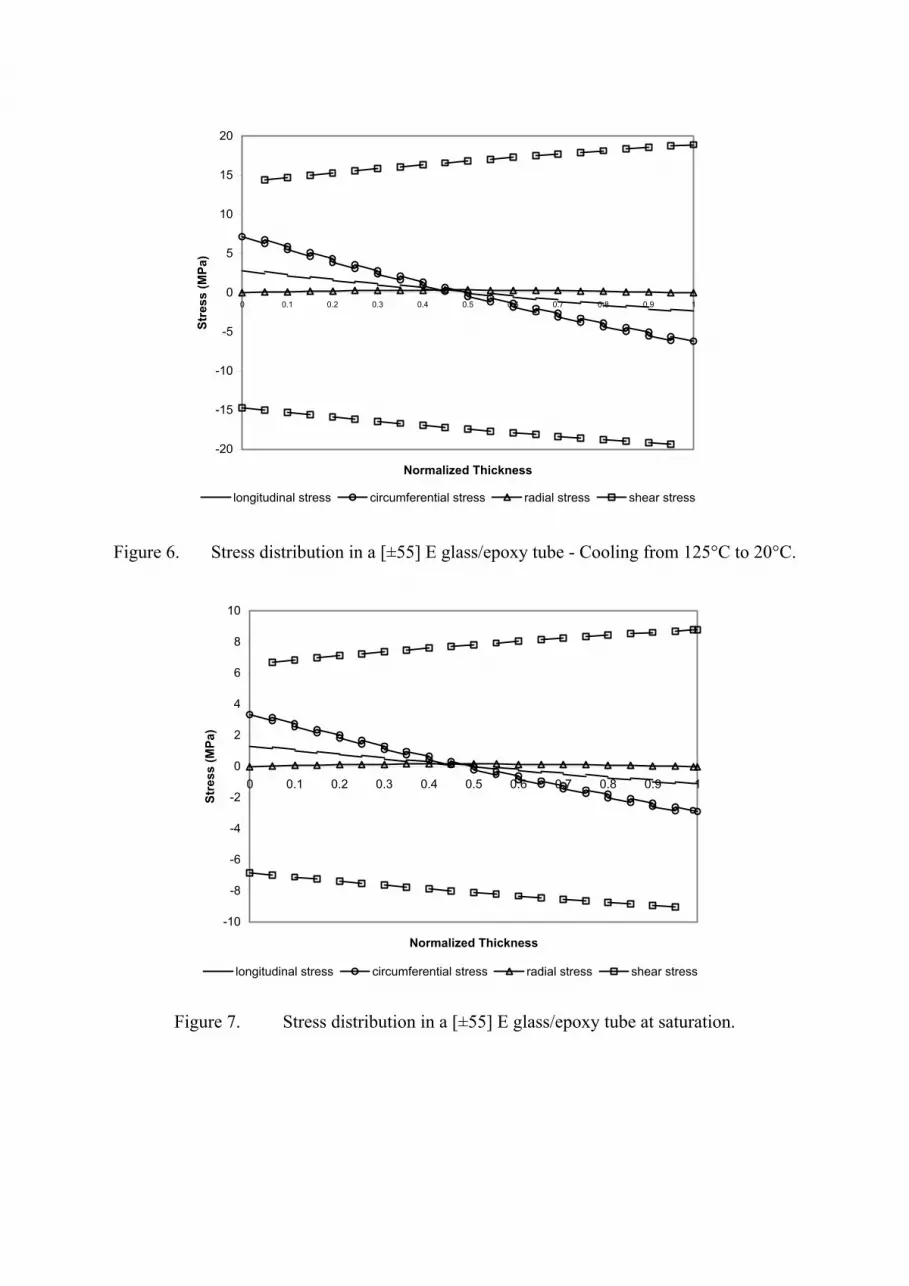
by taking the typical response of a R glass tube, with a stacking sequence of [±85], equipped
with strain gages during cutting:
• 1st step: Samples. The length of the tube is chosen to ensure that the cut of a first ring
at the edge has no effect on the internal strains measured in the middle by strain gages.
The tubes are 55mm diameter and 6.5 mm thickness, The minimum length of the tubes
was 76mm.
• 2nd step: Instrumentation. Biaxial strain gages are bonded and sealed in the middle of
the piece of tube on the inside and outside surfaces. Strain gages have a grid length of
5 mm and a supporting area of 10 mm diameter. An HBM Spider8TM data acquisition
system is used for strain gage quarter bridge conditioning. The electric supply is based
upon a carrier frequency principle which ensures that even on glass-epoxy material,
which has a lower thermal conductivity than carbon-epoxy, there is no drift of the
signal due to strain gage heating. Before handling and clamping the tube, the gage
readings are set at zero.
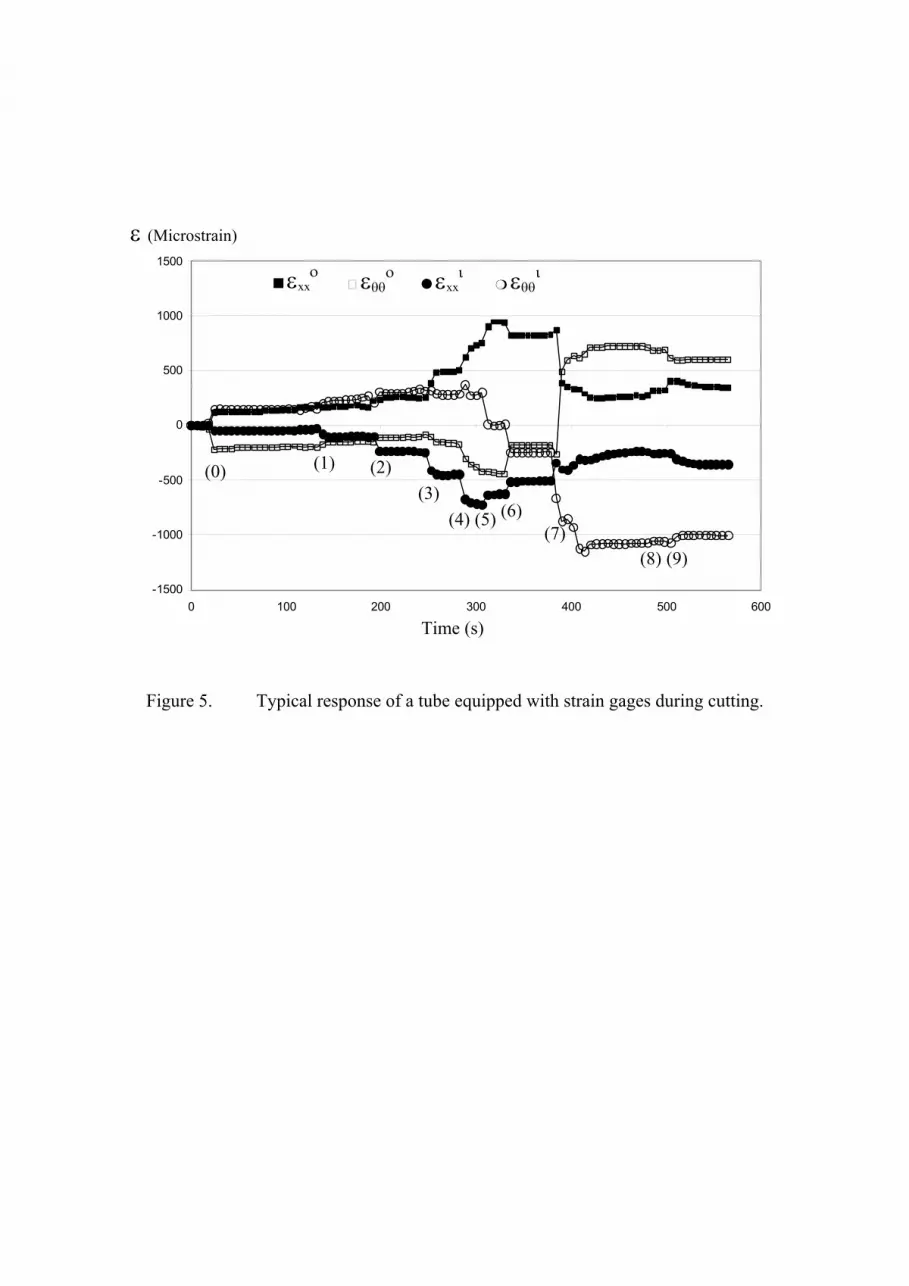
• 3rd step: Machining. A series of cuts are made in a convenient order for machining
(Figure 3). A lubricated diamond saw is mounted on the machine instead of the regular
tool (Figure 4). The cut is obtained by the rotation of the saw and only one turn of the
chuck, so that the wires of the strain gages remain long enough to follow the motion of
the tube. The following numbers refer to Figure 3 and Figure 5.
(0) - The tube is clamped in the chuck of the lathe.
(1-4) - Four rings are cut from the end of the tube. The rings are 6 mm wide and the saw is
2.5 mm thick, so the total thickness of the removed material is 8.5 mm. The last ring
cut is stopped as close as possible to the support of the strain gage. Several rings were
cut in order to ensure that the tube was sufficiently long to avoid end effects.
(5) - A fifth cut is done as close as posible to the strain gages.
(6) - The remaining part of the tube is unclamped from the lathe.
(7) – A cut is made parallel to the x axis in order to open the tube.
(8-9) – The last two cuts are made around the strain gages, and there remains only a square
piece of material on which a zero stress state is assumed.
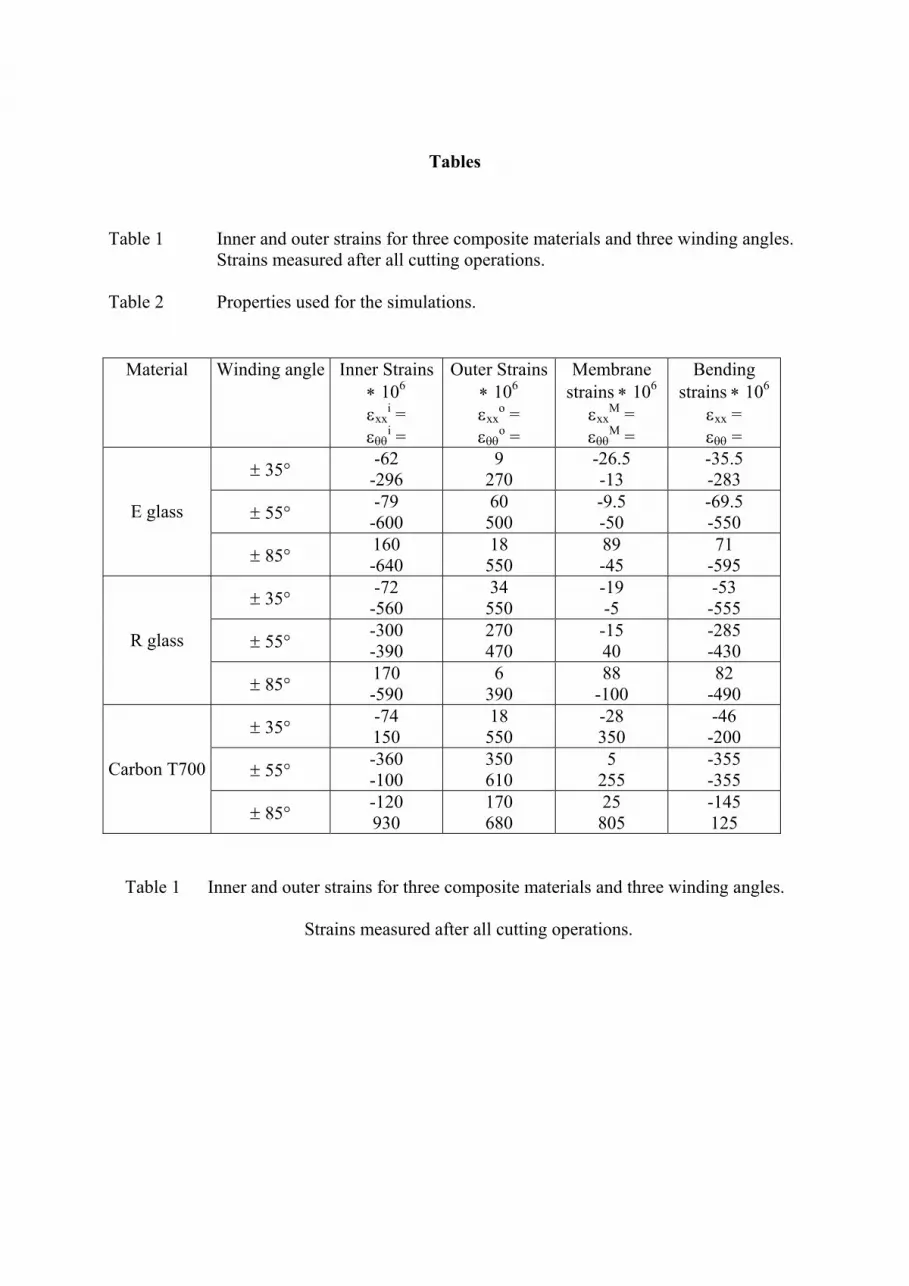
The strains reported in Table 1 correspond to those measured after the end of all cutting
operations.
The first observations are:
• A significant strain level with hundreds of microstrains is measured.
• Tubes tend to close after axial cuts.
• The transverse cuts generate mostly a relaxation of the longitudinal strains and the
longitudinal cuts generate a relaxation of the transverse strains.
• Strains from inner and outer surfaces are roughly opposite to each other, except for the
carbon tubes, for which a thermal drift seems to exist. Different heat transfer
conditions may explain the difference compared with glass tubes.
2.3. Results from experiments
Table 1 shows the inner and outer circumferential and axial final strains for nine epoxy
composite tubes, reinforced with E glass, R glass and T700 carbon fibres. Three winding
angles are considered, [±55°], [±35°] and [±85°] with respect to the tube axis. The tubes were
manufactured in 1998 applying a cure temperature of 125 °C for 7 hours, then stored at
ambient temperature for five years.
The strains are generally negative on the inner surfaces of the tubes while the strains on the
outer surfaces of the tubes are generally positive. Global equilibrium considerations ensure
that only bending internal loads are released from cut-outs. Indeed axial and circumferential
loads are released because of free boundary conditions. However, strains measured inside and
outside which should be opposite to each other don’t respect this. Table 1 gives also the
calculation results of membrane and bending strains (defined on Figure 2). This may be due to
a thermal drift of the strain gages due to the machining warm up, even if lubricant is removing
heat from the tube. Then, only the bending part of strains is considered for the comparison
with simulations in the next sections. Moreover, only one test could be performed on each
type of tube, which may lead to some potential errors in strain results.
3. Numerical study
3.1. Process-induced stresses
A model has been developed in parallel with the experimental study, which predicts the stress
level in the constitutive plies of the tube. The residual stresses, induced by the temperature
differential (between cure and room temperatures), for each ply at any time, are calculated by
using the classical equations of solid mechanics (see reference [5] for details): constitutive
laws of thermoelastic orthotropic materials (1), strain-displacement relationship, compatibility
and equilibrium equations and boundary conditions.
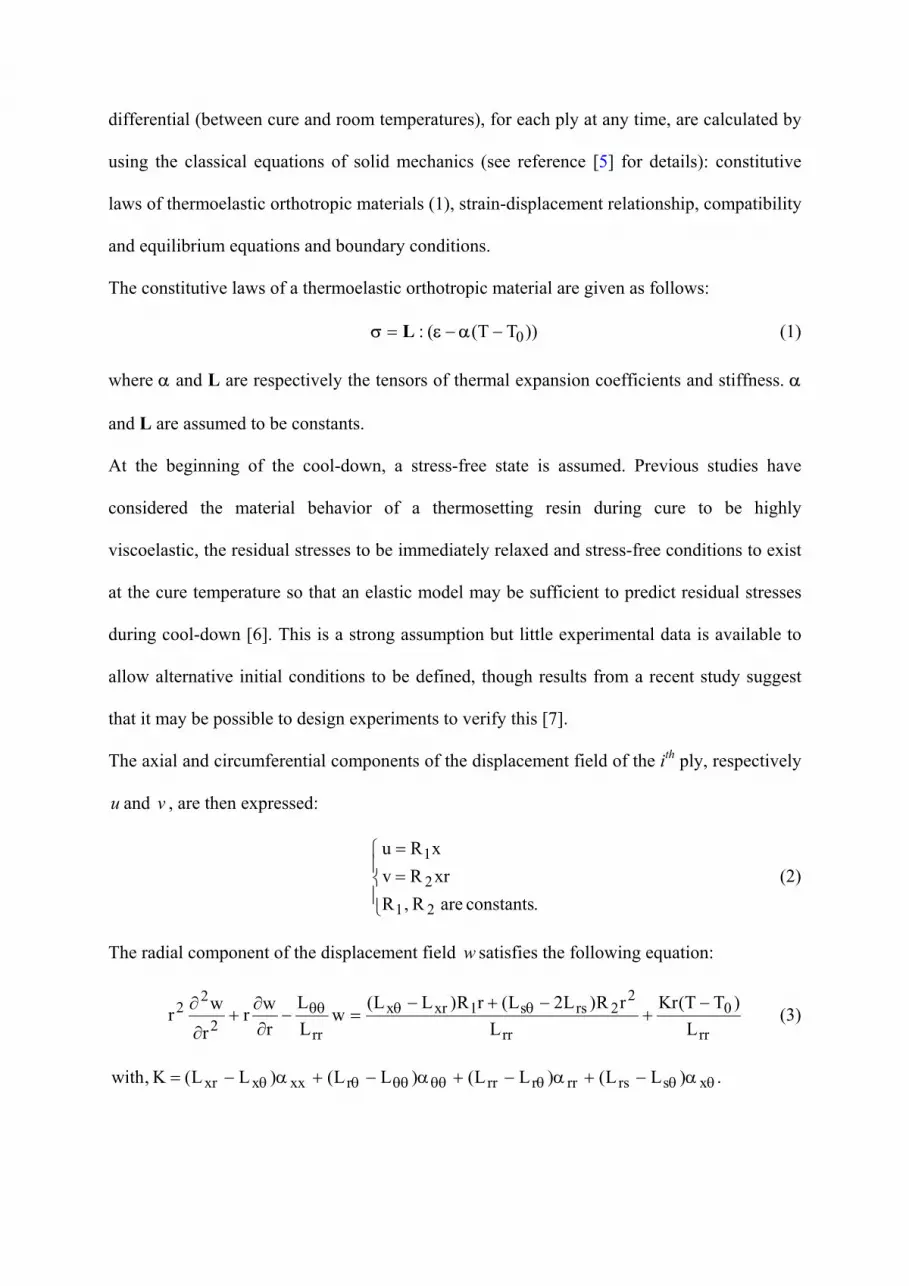
The constitutive laws of a thermoelastic orthotropic material are given as follows:
))TT((: 0−−= αεσ L (1)
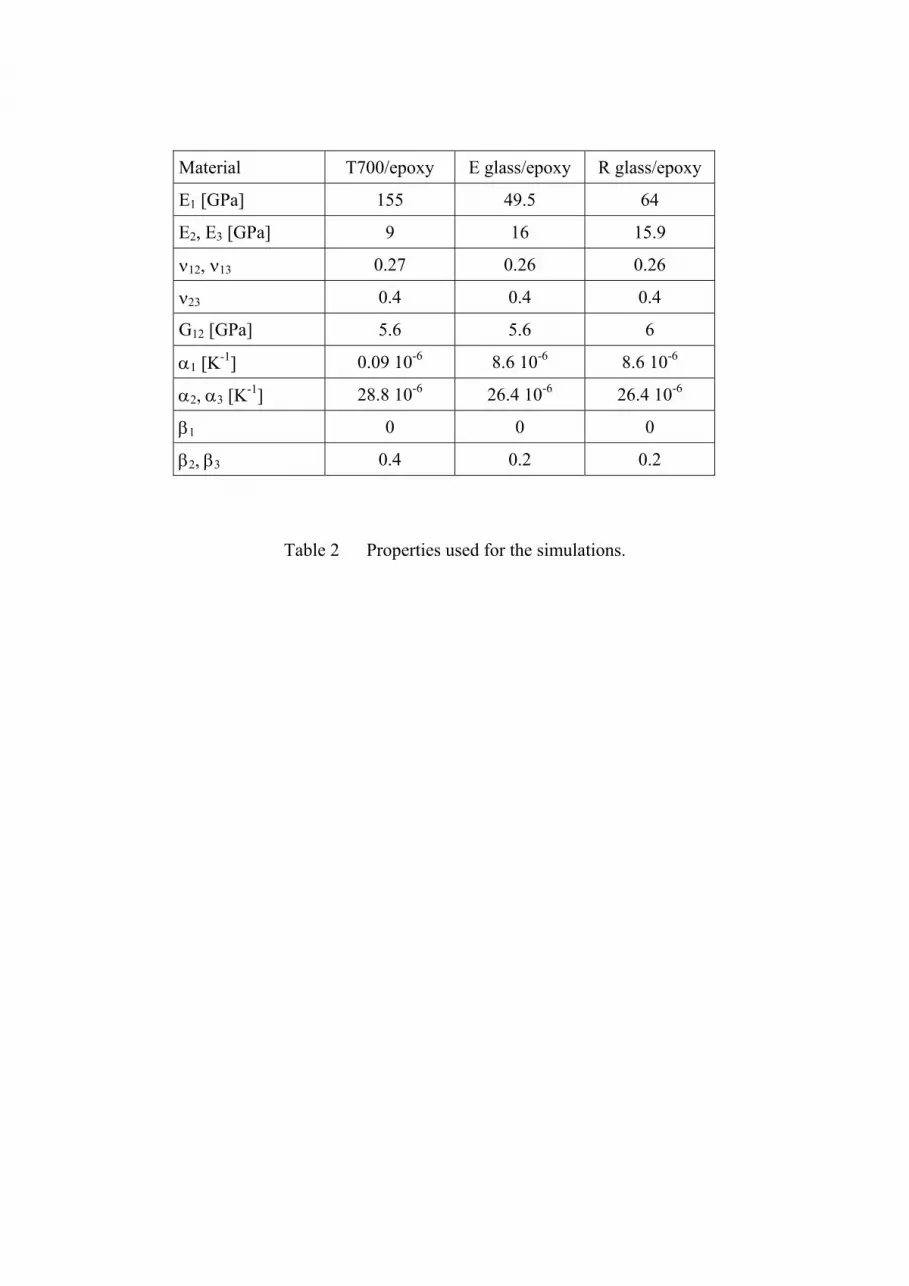
where α and L are respectively the tensors of thermal expansion coefficients and stiffness. α
and L are assumed to be constants.
At the beginning of the cool-down, a stress-free state is assumed. Previous studies have
considered the material behavior of a thermosetting resin during cure to be highly
viscoelastic, the residual stresses to be immediately relaxed and stress-free conditions to exist
at the cure temperature so that an elastic model may be sufficient to predict residual stresses
during cool-down [6]. This is a strong assumption but little experimental data is available to
allow alternative initial conditions to be defined, though results from a recent study suggest
that it may be possible to design experiments to verify this [7].
The axial and circumferential components of the displacement field of the ith ply, respectively
and v , are then expressed: u
(2)
==
.constants are R ,RxrRvxRu
21
2
1
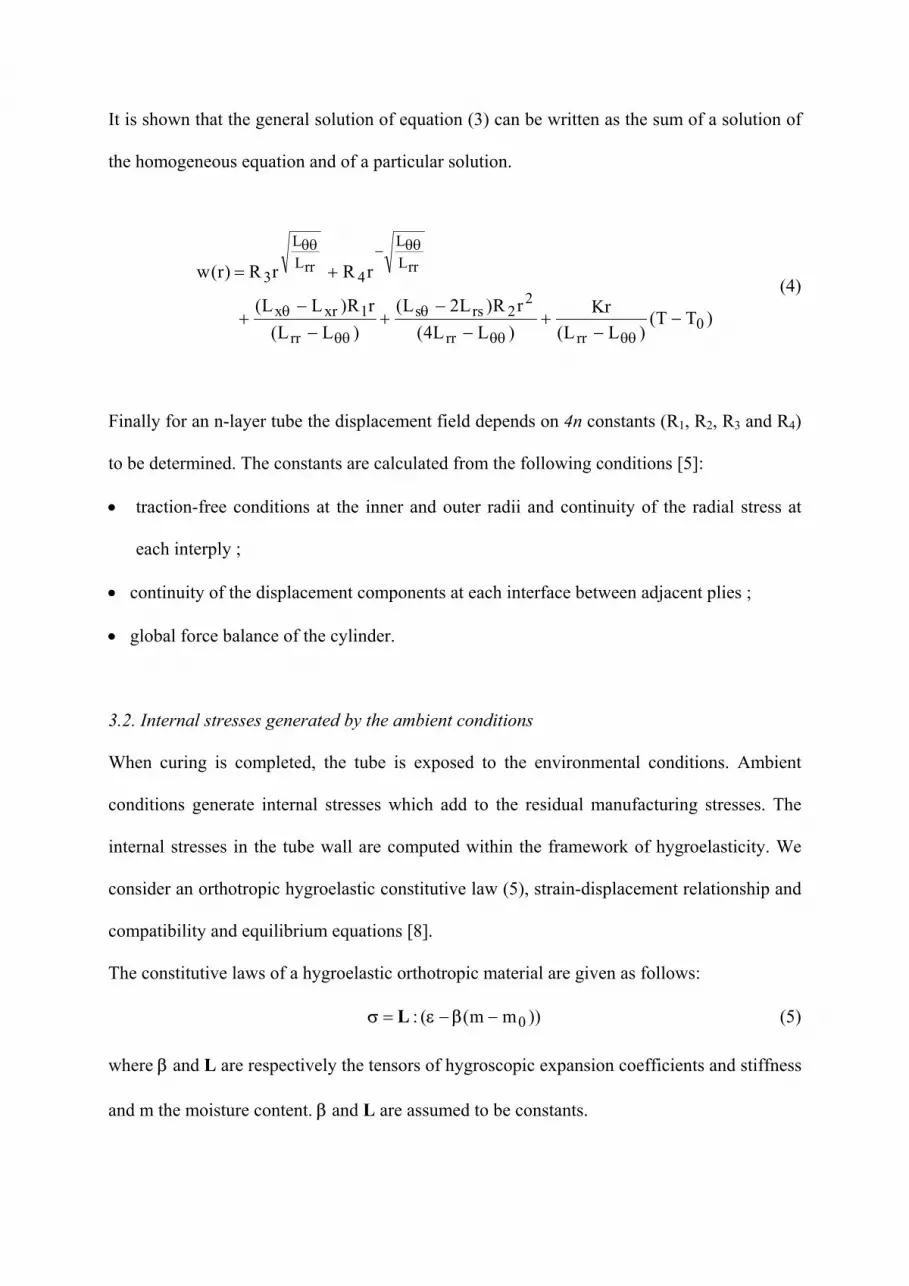
The radial component of the displacement field satisfies the following equation: w
11. Jacquemin, F. and Vautrin, A. Analytical calculation of the transient thermoelastic stresses
in thick walled composite pipes, Journal of Composite Materials 2004, 38 : 1733-1751.
Figures
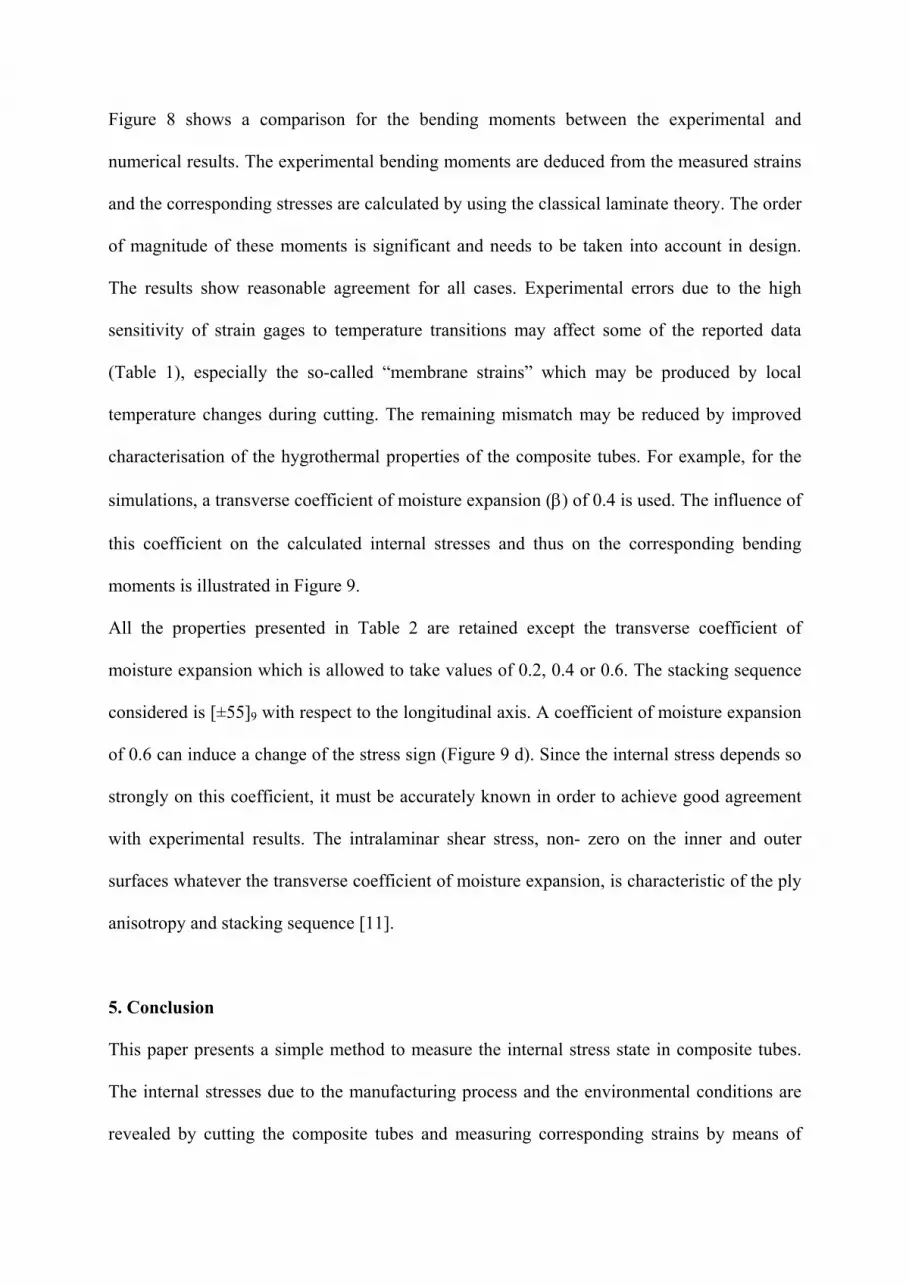
Figure 1. Release of bending moments due to internal stresses.
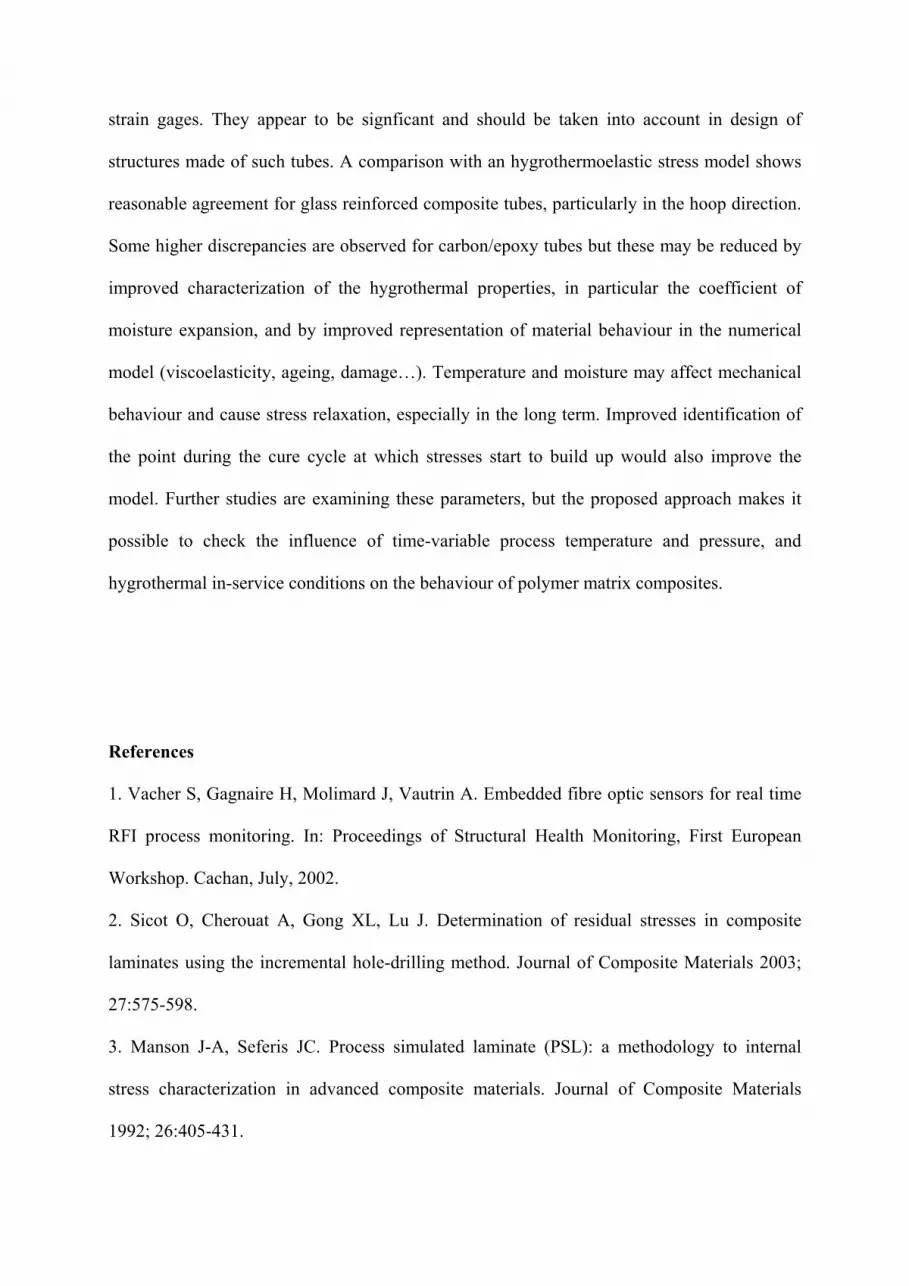
Figure 2. Piece of tube and biaxial strain gages bonded on each side of the tube surface.
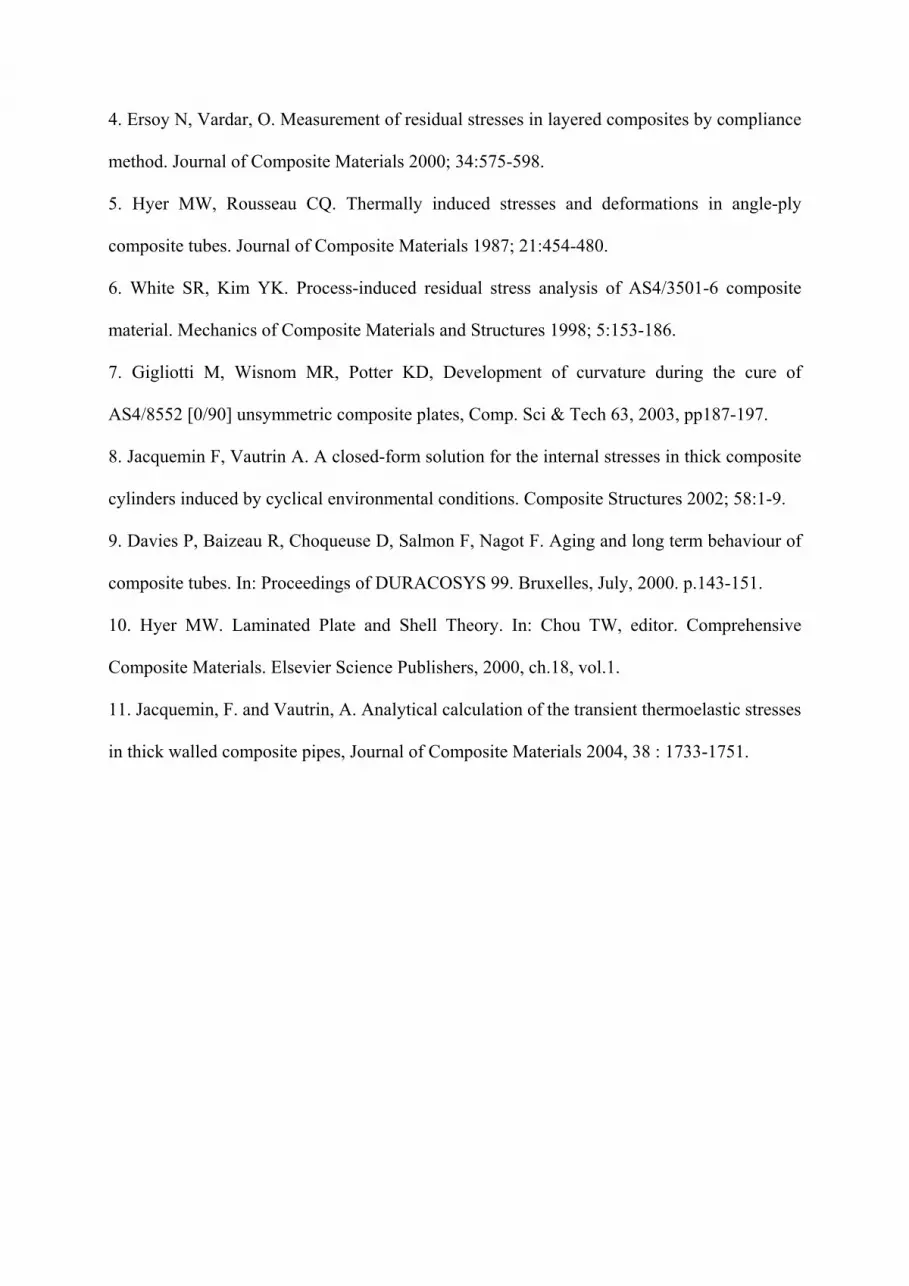
Figure 3. Cutting operations on the tube
Figure 4. Saw mounted on the lathe
Figure 5. Typical response of a tube equipped with strain gages during cutting.
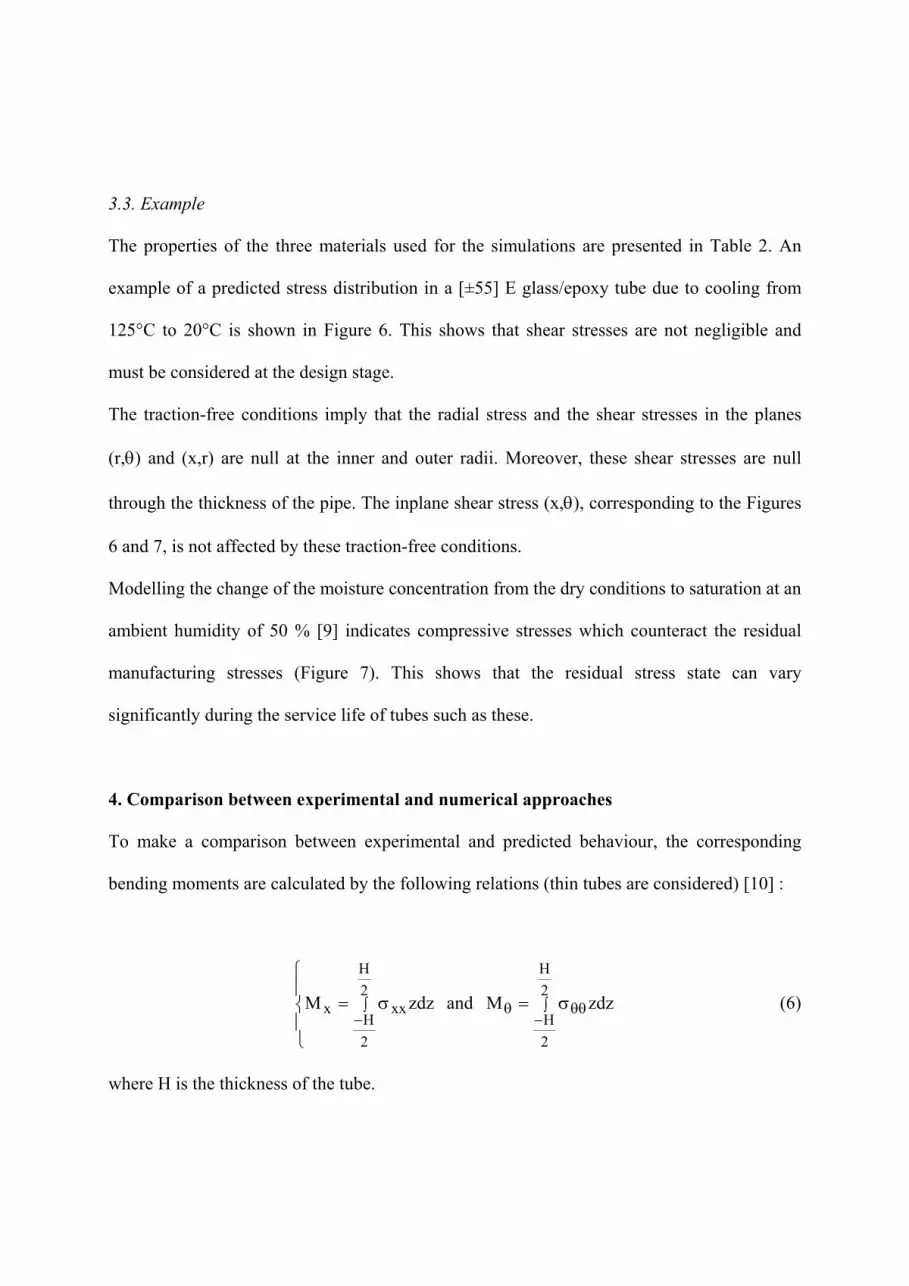
Figure 6. Stress distribution in a [±55] E glass/epoxy tube - Cooling from 125°C to 20°C.
Figure 7. Stress distribution in a [±55] E glass/epoxy tube at saturation.
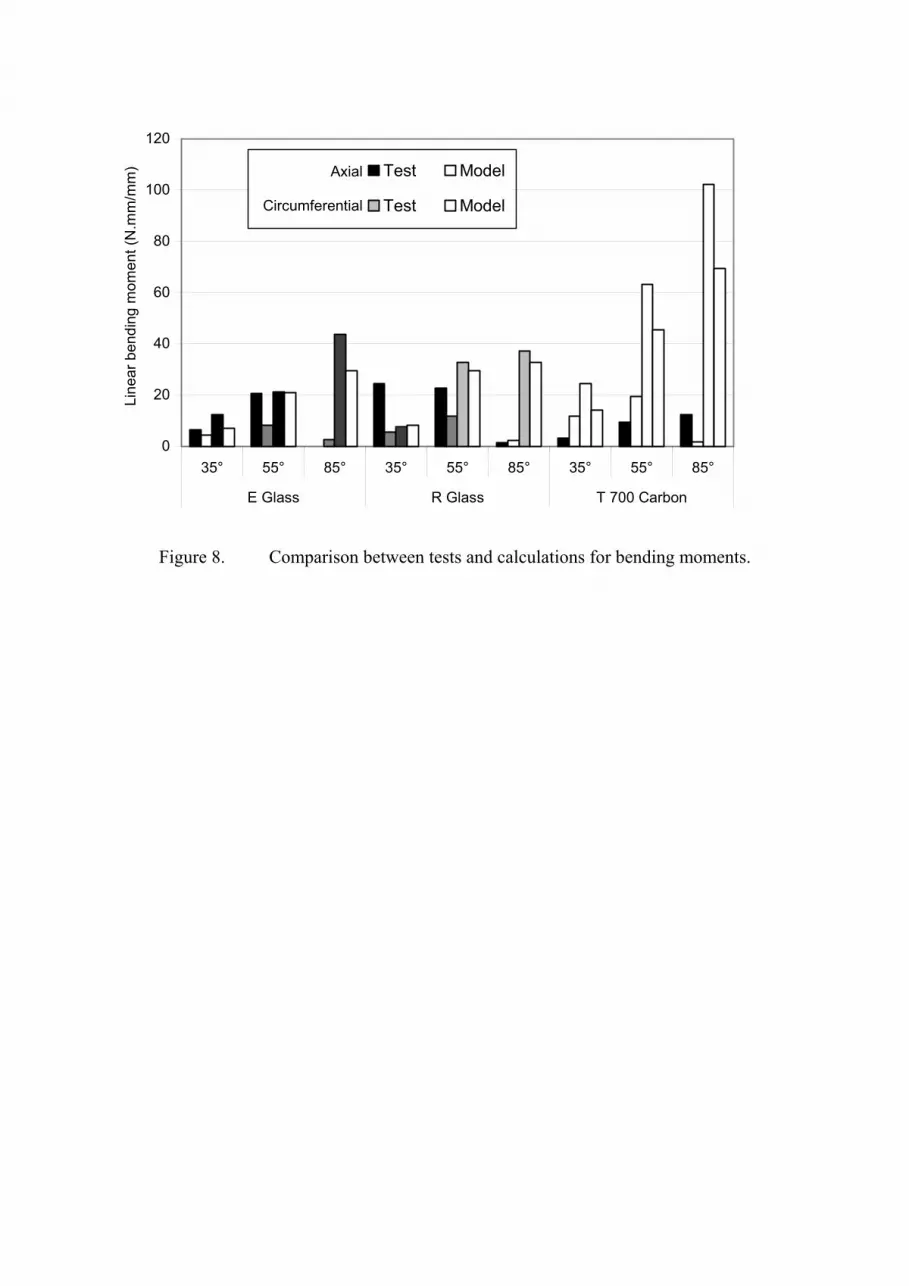
Figure 8. Comparison between tests and calculations for bending moments.
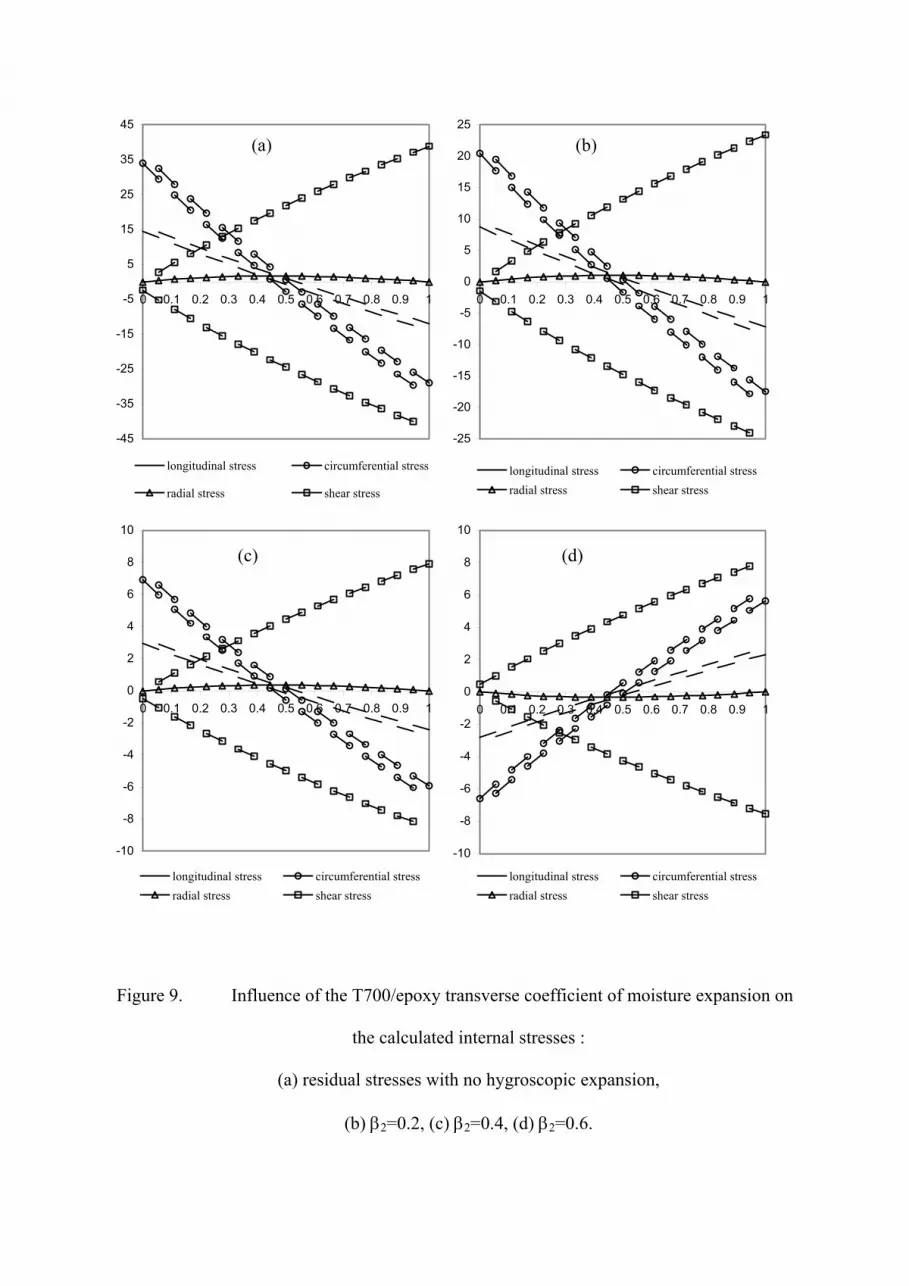
Figure 9. Influence of the T700/epoxy transverse coefficient of moisture expansion on the calculated internal stresses : (a) residual stresses with no hygroscopic expansion, (b) β2=0.2, (c) β2=0.4, (d) β2=0.6.
First cut: release of Mθ bending moment
x
y
z
Second cut: release of the remaining part of Mx bending moment
rθ
rθ
Figure 1. Release of bending moments due to internal stresses.
εθθο
εxxο
εθθι
εxxι
Bending strains :
2ixxoxxxx εεε −=
2ioθθθθ
θθεεε −=
OUTER - INNER
Membrane strains :
2ixxoxxMxx εεε +=
2io
M θθθθθθ
εεε +=
Figure 2. Piece of tube and biaxial strain gages bonded on each side of the tube surface.
x
3 4
7 9
8
2 1 θ 5
Figure 3. Cutting operations on the tube
Figure 4. Saw mounted on the lathe
-1500
-1000
-500
0
500
1000
1500
0 100 200 300 400 500 600
ε (Microstrain)
εxxο εθθ
ι εxxι
Time (s)
εθθο
(0) (1) (2)(3)
(4) (5)(7)
(8) (9)
(6)
Figure 5. Typical response of a tube equipped with strain gages during cutting.


![Calix[4]tubes: An Approach to Functionalization](https://static.documents.page/doc/80x56/634ce6ef7b55c75a3406c83f/calix4tubes-an-approach-to-functionalization.jpg)


