319
PRISM MPS and MPD SDI / IP Waveform Monitor User Manual This document supports software version 3.0. October 2021 D00013488B
| Date post: | 21-Nov-2023 |
| Category: |
Documents |
| Upload: | khangminh22 |
| View: | 0 times |
| Download: | 0 times |
PRISM MPS and MPDSDI / IP Waveform MonitorUser Manual
This document supports software version 3.0.October 2021 D00013488B
2
PRISM MPS and MPD User Manual
Copyrights and Trademark NoticesCopyright © 2021 Telestream, LLC and its Affiliates. All rights reserved. TELESTREAM is a registered trademark of Telestream, LLC. All other trade names referenced are the service marks, trademarks, or registered trademarks of their respective companies.
Telestream products are covered by U.S. and foreign patents, issued and pending. Information in this publication supersedes that in all previously published material. Specifications and price change privileges reserved.
TELESTREAM is a registered trademark of Telestream, LLC.
Blender: Images from Big Buck Bunny used without modification under the Creative Commons Attribution 3.0 license. (c) copyright 2008, Blender Foundation / http://peach.blender.org/about/.
Dolby: Dolby and the double-D symbol are registered trademarks of Dolby Laboratories.
WarrantyTelestream on behalf of itself and its Affiliates (“Telestream”) warrants that this product will be free from defects in materials and workmanship for a period of one (1) year from the date of shipment. If any such product proves defective during this warranty period, Telestream, at its option, either will repair the defective product without charge for parts and labor, or will provide a replacement in exchange for the defective product. Parts, modules and replacement products used by Telestream for warranty work may be new or reconditioned to like new performance. All replaced parts, modules and products become the property of Telestream.
In order to obtain service under this warranty, Customer must notify Telestream of the defect before the expiration of the warranty period and make suitable arrangements for the performance of service. Customer shall be responsible for packaging and shipping the defective product to the service center designated by Telestream, with shipping charges prepaid. Telestream shall pay for the return of the product to Customer if the shipment is to a location within the country in which the Telestream service center is located. Customer shall be responsible for paying all shipping charges, duties, taxes, and any other charges for products returned to any other locations.
This warranty shall not apply to any defect, failure or damage caused by improper use or improper or inadequate maintenance and care. Telestream shall not be obligated to furnish service under this warranty a) to repair damage resulting from attempts by personnel other than Telestream representatives to install, repair or service the product; b) to repair damage resulting from improper use or connection to incompatible equipment; c) to repair any damage or malfunction caused by the use of non- Telestream supplies; or d) to service a product that has been modified or integrated with other products when the effect of such modification or integration increases the time or difficulty of servicing the product.
THIS WARRANTY IS GIVEN BY TELESTREAM WITH RESPECT TO THE PRODUCT IN LIEU OF ANY OTHER WARRANTIES, EXPRESS OR IMPLIED. TELESTREAM AND ITS VENDORS
3
PRISM MPS and MPD User Manual
DISCLAIM ANY IMPLIED WARRANTIES OF MERCHANTABILITY OR FITNESS FOR A PARTICULAR PURPOSE. TELESTREAM’S RESPONSIBILITY TO REPAIR OR REPLACE DEFECTIVE PRODUCTS IS THE SOLE AND EXCLUSIVE REMEDY PROVIDED TO THE CUSTOMER FOR BREACH OF THIS WARRANTY. TELESTREAM AND ITS VENDORS WILL NOT BE LIABLE FOR ANY INDIRECT, SPECIAL, INCIDENTAL, OR CONSEQUENTIAL DAMAGES IRRESPECTIVE OF WHETHER TELESTREAM OR THE VENDOR HAS ADVANCE NOTICE OF THE POSSIBILITY OF SUCH DAMAGES.
[W2 – 15AUG04]
TELESTREAM SOFTWARE LICENSE AGREEMENTTHE PROGRAM, OR PROGRAMS, ENCODED OR INCORPORATED WITHIN EQUIPMENT OR ACCOMPANYING THIS AGREEMENT, IS FURNISHED SUBJECT TO THE TERMS AND CONDITIONS OF THIS AGREEMENT. RETENTION OF THE PROGRAM FOR MORE THAN THIRTY DAYS OR USE OF THE PROGRAM IN ANY MANNER WILL BE CONSIDERED ACCEPTANCE OF THE AGREEMENT TERMS. IF THESE TERMS ARE NOT ACCEPTABLE, THE UNUSED PROGRAM AND ANY ACCOMPANYING DOCUMENTATION SHOULD BE RETURNED PROMPTLY TO TELESTREAM FOR A FULL REFUND OF THE LICENSE FEE PAID. (FOR INFORMATION REGARDING THE RETURN OF PROGRAMS ENCODED OR INCORPORATED WITHIN EQUIPMENT, CONTACT THE NEAREST TELESTREAM SALES OFFICE.)
DEFINITIONS
"Telestream" means Telestream, LLC, a Delaware limited liability company, and its Affiliates, or the local Telestream legal entity that is supplying the equipment. "Program" means the Telestream software product (executable program and/or data) enclosed with this Agreement or included within the equipment with which this Agreement is packed. "Customer" means the person or organization in whose name the Program was ordered.
LICENSE
Customer may:
1. Use the Program on a single machine at any one time; and
2. Copy the Program for archival or backup purposes, provided that no more than one (1) such copy is permitted to exist at any one time. Each copy of the Program made by Customer must include a reproduction of any copyright notice or restrictive rights legend appearing in or on the copy of the Program as received from Telestream.
Customer may not:
1. Use the Program on more than one machine at any one time;
2. Transfer the Program to any person or organization outside of Customer or the corporation of which Customer is a part without the prior written consent of Telestream, except in connection with the transfer of the equipment within which the programs are encoded or incorporated;
4
PRISM MPS and MPD User Manual
3. Export or re-export, directly or indirectly, the program, any associated documentation, or the direct product thereof, to any country to which such export or re-export is restricted by law or regulation of the United States or any foreign government having jurisdiction without the prior authorization, if required, of the Office of Export Administration, Department of Commerce, Washington, D.C. and the corresponding agency of such foreign government;
4. Modify the Program, create derivative works, or merge the Program with another program;
5. Reverse compile or disassemble the Program for any purpose, beyond the extent that such activity is expressly permitted by applicable open source licenses or applicable law notwithstanding this limitation; or
6. Copy the documentation accompanying the Program.
For Programs designed to reside on a single-machine and support one or more additional machines, either locally or remotely, without permitting the Program to be transferred to an additional machine for local execution, the additional machines shall be considered within the definition of "single machine." For programs permitting the Program to be transferred to an additional machine for local execution, a separate license shall be required for each such machine with which the Program may be used. Title to the Program and all copies thereof, but not the media on which the Program or copies may reside, shall be and remain with Telestream or others for whom Telestream has obtained a respective licensing right. Customer shall pay when due all property taxes that may now or hereafter be imposed, levied or assessed with respect to the possession or use of the Program or this license and shall file all reports required in connection with such taxes. If the Program or any related documentation is acquired by or for an agency of the U.S. Government, the Program and documentation shall be considered “commercial computer software” or “commercial computer software documentation” respectively, as those terms are used in 48 CFR §12.212, 48 CFR §227.7202, or 48 CFR §252.227-7014, and are licensed with only those rights as are granted to all other licensees as set forth in this Agreement.
THE PROGRAM MAY NOT BE USED, COPIED, MODIFIED, MERGED, OR TRANSFERRED TO ANOTHER EXCEPT AS EXPRESSLY PERMITTED BY THESE TERMS AND CONDITIONS. UPON TRANSFER OF ANY COPY, MODIFICATION, OR MERGED PORTION OF THE PROGRAM, THE LICENSE GRANTED HEREIN IS AUTOMATICALLY TERMINATED WITH RESPECT TO THE PARTY THAT TRANSFERS THE PROGRAM.
TERM
The license granted herein is effective upon acceptance by Customer, and shall remain in effect until terminated as provided herein. The license may be terminated by Customer at any time upon written notice to Telestream. The license may be terminated by Telestream or any third party from whom Telestream may have obtained a respective licensing right if Customer fails to comply with any term or condition and such failure is not remedied within thirty (30) days after notice hereof from Telestream or such third party. Upon termination by either party, Customer shall return to Telestream or destroy, the Program and all associated documentation, together with all copies in any form.
5
PRISM MPS and MPD User Manual
LIMITED WARRANTY
The Program is provided "as is" without warranty of any kind, either express or implied. Telestream does not warrant that the functions contained in the Program will meet Customer's requirements or that the operation of the Program will be uninterrupted or error-free.
TELESTREAM AND ITS VENDORS DISCLAIM ANY IMPLIED WARRANTIES OF MERCHANTABILITY OR FITNESS FOR A PARTICULAR PURPOSE. LIMITATION OF LIABILITY, IN NO EVENT SHALL TELESTREAM OR OTHERS FROM WHOM TELESTREAM HAS OBTAINED A LICENSING RIGHT BE LIABLE FOR ANY INDIRECT, SPECIAL, INCIDENTAL, OR CONSEQUENTIAL DAMAGES ARISING OUT OF OR CONNECTED WITH CUSTOMER'S POSSESSION OR USE OF THE PROGRAM, EVEN IF TELESTREAM OR SUCH OTHERS HAS ADVANCE NOTICE OF THE POSSIBILITY OF SUCH DAMAGES.
THIRD-PARTY DISCLAIMER
Except as expressly agreed otherwise, third parties from whom Telestream may have obtained a licensing right do not warrant the program, do not assume any liability with respect to its use, and do not undertake to furnish any support or information relating thereto.
GENERAL
This Agreement contains the entire agreement between the parties with respect to the use, reproduction, and transfer of the Program. Neither this Agreement nor the license granted herein is assignable or transferable by Customer without the prior written consent of Telestream. This Agreement and the license granted herein shall be governed by the laws of the state of California. All questions regarding this Agreement or the license granted herein should be directed to the nearest Telestream Sales Office.
Important Compliance and Safety Information 9
Preface 19
Getting Started 22Product description 23Accessories 28MPS-MPD Power-on and Power-off Procedures 29SFP Module Installation 32Network Installation 33MPS Connectors 35MPD Connectors 42Display Elements 48
Methods of Operation 57Touchscreen Operation 58Select and Organize Applications 60On-screen Tools 65Keyboard and Mouse Operation 66Extended Display Operation 68Remote Control through VNC Operation 69Remote Control through API Commands 72
Configure the Instrument 74Configure and Select Signal Inputs 75Configure Instrument for HDR/WCG Monitoring 107Enable NMOS Discovery and Registration 109Adjust Loudness Display 110Configure Instrument Outputs 116Configure to Decode Timecode 117
Contents
7
PRISM MPS-MPD User Manual
Configure Reference Settings 118Set and Recall Instrument Presets 121Syslog 132SNMP Functionality 133Configure Alarms 136Manage Trace and Graticule Intensity 142Set Time and Date 143Upgrade Instrument Firmware 146Upgrade Software License 149Troubleshooting 150
Functions 151Headphone/Speaker Volume, Balance, Device, and Source Adjustment 151Capture 155
Application Information 158Application Options 158Waveform Application 165Vector Application 177Audio Application 184Picture Application 195Video Session Application 206Timing Application 211Event Log Application 215IP Status Application 223AES Channel Status Application 226IP Session Application 227IP Graphs Application 244PIT Histogram Application 250PTP Graphs Application 253Stream Timing Application 256IP Generator Application 262SDI Generator Application 269Datalist Application 272ANC (Ancillary Data) Session Application 274Jitter Application 277Eye Application 279Stop Display Application 281Diamond Application 289Lightning Application 294CIE Application 301Dolby Status Application 304
PTP Operational Overview 309PTP Introduction 309
8
PRISM MPS-MPD User Manual
Five Basic PTP Timing Messages 310Profiles and Domains 312One-step and Two-step Operation 313Multicast, Unicast, and Mixed Communication Modes 314BMCA Operation 316Compensating for Causes of Asymmetric Delay 317
NMOS Specifications 319

Important Compliance and Safety Information 9
PRISM MPS and MPD User Manual
Important Compliance and Safety Information
United States of America Compliance Notices Class A Interference Statement
This equipment has been tested and found to comply with the limits for a Class A digital device, pursuant to Part 15, Subpart B of the FCC Rules. These limits are designed to provide reasonable protection against harmful interference in a commercial installation. This equipment generates, uses, and can radiate radio frequency energy and, if not installed and used in accordance with the instructions, may cause harmful interference to radio communications. However, there is no guarantee that interference will not occur in a particular installation. Operation of this equipment in a residential area is likely to cause harmful interference in which case the user will be required to correct the interference at his own expense.
FCC Caution
This device complies with Part 15 of the FCC Rules. Operation is subject to the following two conditions:
1. This device may not cause harmful interference, and
2. This device must accept any interference received, including interference that may cause undesired operation.
Safety
UL 61010-1: 2012 R7.19: Safety Requirements for Electrical Equipment for Measurement, Control, and Laboratory Use - Part 1: General Requirements.
Environmental
Perchlorate Materials: this product contains one or more type CR lithium batteries. According to the state of California, CR lithium batteries are classified as perchlorate materials and require special handling.
See www.dtsc.ca.gov/hazardouswaste/perchlorate for additional information.

Important Compliance and Safety Information10
PRISM MPS and MPD User Manual
Canada Compliance NoticesDepartment of Communications Radio Interference Regulations
This digital apparatus does not exceed the Class A limits for radio-noise emissions from a digital apparatus as set out in the Radio Interference Regulations of the Canadian Department of Communications. This Class A digital apparatus complies with Canadian ICES-003.
Reglement sur le brouillage radioelectrique du Quadstere des Communications
Cet appareil numerique respecte les limites de bruits radioelectriques visant les appareils numeriques de classe A prescrites dans le Reglement sur le brouillage radioelectrique du Quadstere des Communications du Canada. Cet appareil numerique de la Classe A est conforme a la norme NMB-003 du Canada.
Safety
CAN/CSA-C22.2 NO. 61010-1-12 + GI1 + GI2 (R2017) + A1: Safety Requirements for Electrical Equipment for Measurement, Control, and Laboratory Use - Part 1: General Requirements.
Sécurité
CAN/CSA-C22.2 NO. 61010-1-12 + GI1 + GI2 (R2017) + A1: Exigences de sécurité pour l'électricité Matériel de mesure, de contrôle et d'utilisation en laboratoire - Partie 1: Généralités Exigences.
European Union and European Free Trade Association (EFTA) Compliance Notices
This equipment may be operated in the countries that comprise the member countries of the European Union and the European Free Trade Association. These countries, listed in the following paragraph, are referred to as The European Community throughout this document:
AUSTRIA, BELGIUM, BULGARIA, CYPRUS, CZECH REPUBLIC, DENMARK, ESTONIA, FINLAND, FRANCE, GERMANY, GREECE, HUNGARY, IRELAND, ITALY, LATVIA, LITHUANIA, LUXEMBOURG, MALTA, NETHERLANDS, POLAND, PORTUGAL, ROMANIA, SLOVAKIA, SLOVENIA, SPAIN, SWEDEN, UNITED KINGDOM, ICELAND, LICHTENSTEIN, NORWAY, SWITZERLAND
Declaration of Conformity
Marking by the “CE” symbol indicates compliance with the Essential Requirements of the EMC Directive of the European Union 2014/30/EU
This equipment meets the following conformance standards:
Important Compliance and Safety Information 11
PRISM MPS and MPD User Manual
Safety
EN 61010-1: 2010 + A1: Safety Requirements for Electrical Equipment for Measurement, Control, and Laboratory Use - Part 1: General Requirements Low Voltage Directive 2014/35/EU
Emissions
EN 55032: 2015 + A11: 2020, CISPR 32: 2015, EN 61000-3-2: 2014, EN 61000-3-3: 2013
Immunity
EN 55035: 2017, EN 61000-4-2: 2009,
EN 61000-4-3: 2006 + A1: 2008 + A2: 2010, EN 61000-4-4: 2012, EN 61000-4-5: 2014 + A1: 2017, EN 61000-4-6: 2014, EN 61000-4-8: 2010, EN 61000-4-11: 2020
Environments: E2
WarningsWarning! This is a Class A product. In a domestic environment, this product may cause radio interference, in which case, the user may be required to take appropriate measures.
Achtung! Dieses ist ein Gerat der Funkstorgrenzwertklasse A. In Wohnbereichen konnen bei Betrieb dieses Gerates Rundfunkstorungen auftreten, in welchen Fallen der Benutzer fur entsprechende Gegenmal3nahmen verantwortlich ist.
Attention! Ceci est un produit de Classe A. Dans un environnement domestique, ce produit risque de creer des interferences radioelectriques, ii appartiendra alors a l?utilisateur de prendre les mesures specifiques appropriees.
Notes:
1. For Compliance with the EMC standards listed here, high-quality shielded interface cables should be used.
2. Emissions which exceed the levels required by this standard may occur when this equipment is connected to a test object.
Environmental Compliance
This section provides information about the environmental impact of the product.
Product end-of-life handling
Observe the following guidelines when recycling an instrument or component:
Equipment recycling
Production of this equipment required the extraction and use of natural resources. The equipment may contain substances that could be harmful to the environment or human health if improperly handled at the product's end of life. To avoid release of such substances into the environment and to reduce the use of natural resources, we
Important Compliance and Safety Information12
PRISM MPS and MPD User Manual
encourage you to recycle this product in an appropriate system that will ensure that most of the materials are reused or recycled appropriately.
This symbol on the product or its packaging indicates that this product complies with the applicable European Union requirements according to Directives 2012/19/EU and 2006/66/EC on waste electrical and electronic - equipment (WEEE) and batteries.
It also indicates that this product must not be disposed of with your other household waste. Instead, it is your responsibility to dispose of your waste equipment by handing it over to a designated collection point for the recycling of waste electrical and electronic equipment. The separate collection and recycling of your waste equipment at the time of disposal will help conserve natural resources and ensure that it is recycled in a manner that protects human health and the environment. For more information about where you can drop off your waste for recycling, please contact your local authority, or where you purchased your product.
Battery Recycling
This product may contain a rechargeable battery, which must be recycled or disposed of properly. Please properly dispose of or recycle the battery according to local government regulations.
Transporting Batteries or products with Batteries in them
The capacity of the lithium-ion secondary battery shipped with this product is under 100 Wh. The lithium content of the installed primary battery is under 1 g. Each battery meets the applicable requirements of UN Manual of Tests and Criteria Part Ill Section 38.3. Battery quantity is under the limit for shipment according to Section II of the relevant Packing Instructions from the IATA Dangerous Goods Regulations. Consult your air carrier for applicability and determination of any special lithium battery transportation requirements.
Restriction of Hazardous Substances
This product is classified as an industrial monitoring and control instrument, and is not required to comply with the substance restrictions of the RoHS 3 Directives 2011 /65/EU and EU 2015/863 until July 22, 2021. This product does, however, comply with the RoHS 2 Directive 2011/65/EU.
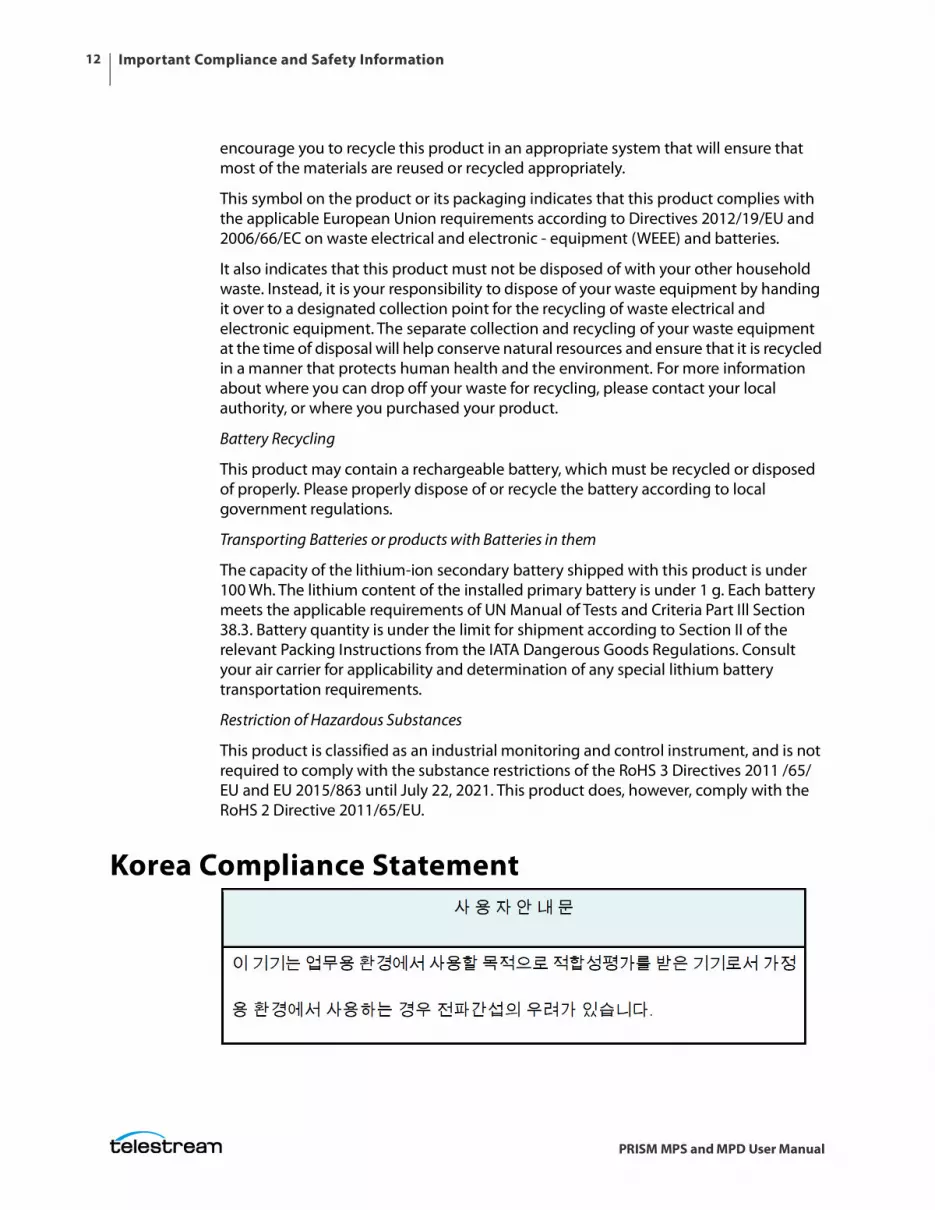
Korea Compliance Statement

Important Compliance and Safety Information 13
PRISM MPS and MPD User Manual
Taiwan Compliance Statement
Japan Compliance Statement
Important Safety InformationThis manual contains information and warnings that must be followed by the user for safe operation and to keep the product in a safe condition. To safely perform service on this product, see the Service Safety Summary that follows the General Safety Summary.
General Safety SummaryUse the product only as specified. Review the following safety precautions to avoid injury and prevent damage to this product or any products connected to it. Carefully read all instructions. Retain these instructions for future reference.
Comply with Local and National Safety CodesFor correct and safe operation of the product, it is essential that you follow generally accepted safety procedures in addition to the safety precautions specified in this manual.
Product is Designed to be Used by Trained Personnel OnlyOnly qualified personnel who are aware of the hazards involved should remove the cover for repair, maintenance, or adjustment. Before use, always check the product with a known source to be sure it is operating correctly.

Important Compliance and Safety Information14
PRISM MPS and MPD User Manual
While using this product, you may need to access other parts of a larger system. Read the safety sections of the other component manuals for warnings and cautions related to operating the system.
When incorporating this equipment into a system, the safety of that system is the responsibility of the assembler of the system.
To Avoid Fire or Personal Injury
Use proper power cord: Use only the power cord specified for this product and certified for the country of use. Do not use the provided power cord for other products.
Ground the product: This product is grounded through the grounding conductor of the power cord. To avoid electric shock, the grounding conductor must be connected to earth ground. Before making connections to the input or output terminals of the product, ensure that the product is properly grounded. Do not disable the power cord grounding connection.
Power disconnect: The power cord disconnects the product from the power source. See instructions for the location. Do not position the equipment so that it is difficult to operate the power cord; it must remain accessible to the user at all times to allow for quick disconnection if needed.
Observe all terminal ratings: To avoid fire or shock hazard, observe all rating and markings on the product. Consult the product manual for further ratings information before making connections to the product. Do not apply a potential to any terminal, including the common terminal, that exceeds the maximum rating of that terminal.
Do not operate without covers: Do not operate this product with covers or panels removed, or with the case open. Hazardous voltage exposure is possible.
Avoid exposed circuitry: Do not touch exposed connections and components when power is present.
Do not operate with suspected failures: If you suspect that there is damage to this product, have it inspected by qualified service personnel.
Disable the product if it is damaged. Do not use the product if it is damaged or operates incorrectly. If in doubt about safety of the product, turn it off and disconnect the power cord. Clearly mark the product to prevent its further operation.
Before use, inspect voltage probes, test leads, and accessories for mechanical damage and replace when damaged. Do not use probes or test leads if they are damaged, if there is exposed metal, or if a wear indicator shows.
Examine the exterior of the product before you use it. Look for cracks or missing pieces.
Use Only Specified Replacement Parts
Do not operate in wet/damp conditions: Be aware that condensation may occur if a unit is moved from a cold to a warm environment.
Do not operate in an explosive atmosphere.

Important Compliance and Safety Information 15
PRISM MPS and MPD User Manual
Keep product surfaces clean and dry: Remove the input signals before you clean the product.
Provide proper ventilation: Refer to the manual's installation instructions for details on installing the product so it has proper ventilation.
Slots and openings are provided for ventilation and should never be covered or otherwise obstructed. Do not push objects into any of the openings.
Provide a safe working environment: Always place the product in a location convenient for viewing the display and indicators.
Be sure your work area meets applicable ergonomic standards. Consult with an ergonomics professional to avoid stress injuries.
Use only the Telestream rackmount hardware specified for this product.
Service Safety Summary The Service Safety Summary section contains additional information required to safely perform service on the product. Only qualified personnel should perform service procedures. Read this Service Safety Summary and the General Safety Summary before performing any service procedures.
To avoid electric shock: Do not touch exposed connections.
Do not service alone: Do not perform internal service or adjustments of this product unless another person capable of rendering first aid and resuscitation is present.
Disconnect power: To avoid electric shock, switch off the product power and disconnect the power cord from the mains power before removing any covers or panels, or opening the case for servicing.
Use care when servicing with power on: Dangerous voltages or currents may exist in this product. Disconnect power, remove battery (if applicable), and disconnect test leads before removing protective panels, soldering, or replacing components.
Verify safety after repair: Always recheck ground continuity and mains dielectric strength after performing a repair.
Terms in the Manual These terms may appear in this manual:
WARNING: Warning statements identify conditions or practices that could result in injury or loss of life.
Caution: Caution statements identify conditions or practices that could result in damage to this product or other property.

Important Compliance and Safety Information16
PRISM MPS and MPD User Manual
Terms on the Product These terms may appear on the product:
DANGER indicates an injury hazard immediately accessible as you read the marking.
WARNING indicates an injury hazard not immediately accessible as you read the marking.
CAUTION indicates a hazard to property including the product.
Symbols on the ProductWhen this symbol is marked on the product, be sure to consult the manual to find out the nature of the potential hazards and any actions which have to be taken to avoid them. (This symbol may also be used to refer the user to ratings in the manual.)
The following symbol(s) may appear on the product:
General Safety Product Specific Statements Use the product only as specified. Review the following safety precautions to avoid injury and prevent damage to this product or any products connected to it.
Carefully read all instructions. Retain these instructions for future reference.
Comply with local and national safety codes.
For correct and safe operation of the product, it is essential that you follow generally accepted safety procedures in addition to the safety precautions specified in this manual. The product is designed to be used by trained personnel only.
Only qualified personnel who are aware of the hazards involved should remove the cover for repair, maintenance, or adjustment.
Before use, always check the product with a known source to be sure it is operating correctly.
This product is not intended for detection of hazardous voltages.
Use personal protective equipment to prevent shock and arc blast injury where hazardous live conductors are exposed.
When incorporating this equipment into a system, the safety of that system is the responsibility of the assembler of the system.
Important Compliance and Safety Information 17
PRISM MPS and MPD User Manual
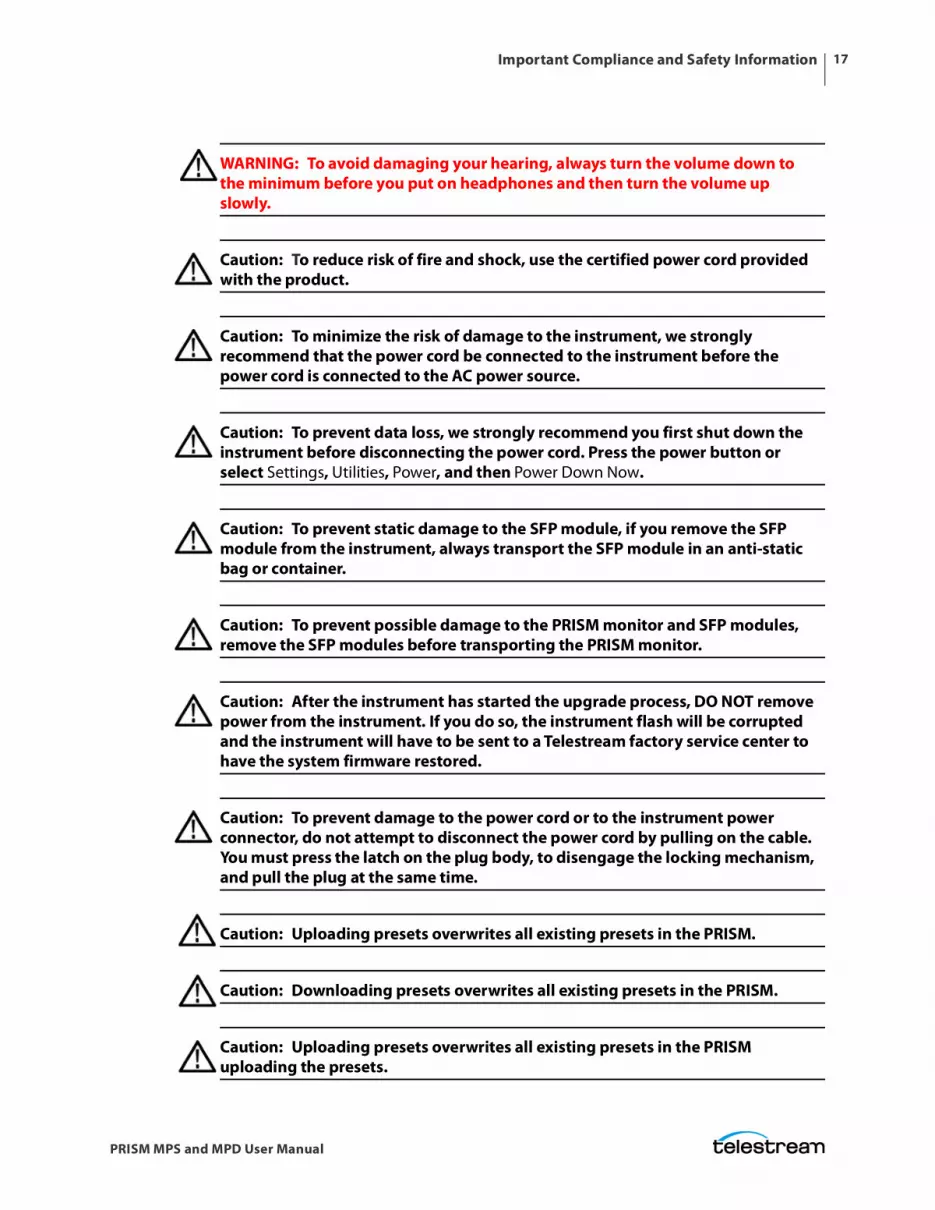
WARNING: To avoid damaging your hearing, always turn the volume down to the minimum before you put on headphones and then turn the volume up slowly.
Caution: To reduce risk of fire and shock, use the certified power cord provided with the product.
Caution: To minimize the risk of damage to the instrument, we strongly recommend that the power cord be connected to the instrument before the power cord is connected to the AC power source.
Caution: To prevent data loss, we strongly recommend you first shut down the instrument before disconnecting the power cord. Press the power button or select Settings, Utilities, Power, and then Power Down Now.
Caution: To prevent static damage to the SFP module, if you remove the SFP module from the instrument, always transport the SFP module in an anti-static bag or container.
Caution: To prevent possible damage to the PRISM monitor and SFP modules, remove the SFP modules before transporting the PRISM monitor.
Caution: After the instrument has started the upgrade process, DO NOT remove power from the instrument. If you do so, the instrument flash will be corrupted and the instrument will have to be sent to a Telestream factory service center to have the system firmware restored.
Caution: To prevent damage to the power cord or to the instrument power connector, do not attempt to disconnect the power cord by pulling on the cable. You must press the latch on the plug body, to disengage the locking mechanism, and pull the plug at the same time.
Caution: Uploading presets overwrites all existing presets in the PRISM.
Caution: Downloading presets overwrites all existing presets in the PRISM.
Caution: Uploading presets overwrites all existing presets in the PRISM uploading the presets.
Important Compliance and Safety Information18
PRISM MPS and MPD User Manual
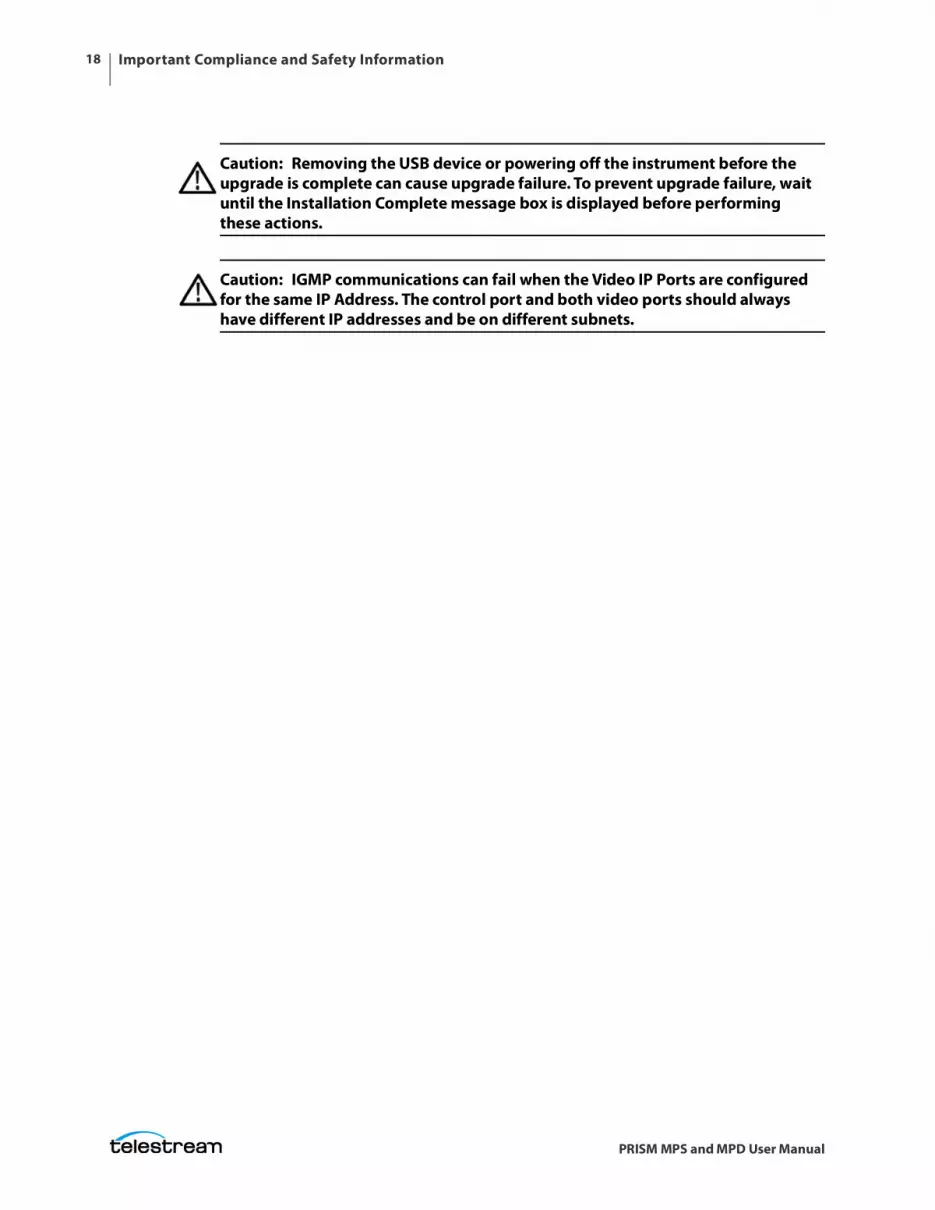
Caution: Removing the USB device or powering off the instrument before the upgrade is complete can cause upgrade failure. To prevent upgrade failure, wait until the Installation Complete message box is displayed before performing these actions.
Caution: IGMP communications can fail when the Video IP Ports are configured for the same IP Address. The control port and both video ports should always have different IP addresses and be on different subnets.
Preface 19
PRISM MPS and MPD User Manual
Preface
This manual contains information to help you use the PRISM SDI/IP Waveform Monitor:
• How to operate the instrument using the front panel, external mouse, keyboard, display, or remote connection.
• How to use the various applications for monitoring SDI or IP video signals.
• How to configure the instrument for network and remote access.
• How to set up error logging and alarms.
Where to Find More InformationThe full User Manual, Release Notes, and other information about your product are available for download at www.telestream.net/video/resources.htm. The Product documentation table lists all the documentation for the PRISM SDI / IP Waveform Monitor.
Product documentation
Document Manual type Part number Description
MPS and MPD User Manual
User D00013488x Provides detailed operating information.
Release Notes Release Notes D00010030x Describes the new features, improvements, and limitations of the instrument firmware.
Read-this-first User P00010449x Lists all relevant documents.
MPS Installation and Safety Instructions
User P00010445x Describes the set up of a PRISM MPS instrument, and provides basic safety and operating information.
Preface20
PRISM MPS and MPD User Manual
Conventions Used in this ManualThe PRISM SDI / IP Waveform Monitor is also referred to as the "PRISM monitor" throughout this manual.
Telestream Contact InformationTo obtain product information, technical support, or provide comments on this guide, contact us using our website, email, or phone number listed.
MPD Installation and Safety Instructions
User P00010446x Describes how to install and set up a PRISM MPD instrument, and provides basic safety and operating information.
MPS Rack Accessory Installation Manual
User P00010448x Describes how to connect rack equipment to a PRISM MPS instrument and install it in a rack. Provides basic safety and operating information.
MPS Portable Accessory Installation Manual
User P00010447x Describes how to connect portable accessory equipment to a PRISM MPS instrument. Provides basic safety and operating information.
Product documentation
Resource Contact Information
Telestream Video Support
Website: http://www.telestream.net/telestream-support
Email: [email protected]
US and Canada Toll-free: 1-844-219-5329
Outside of US and Canada: 1-503-967-9833
Telestream Website: www.telestream.net
Sales and Marketing Email: [email protected]
Address:
Telestream848 Gold Flat Road, Suite 1Nevada City, CA. USA 95959
Preface 21
PRISM MPS and MPD User Manual
International Distributor Support
Website: www.telestream.net
See the Telestream website for your regional authorized Telestream distributor.
Telestream Technical Writers
Email: [email protected]
If you have comments or suggestions about improving this document, or other Telestream documents—or if you've discovered an error or omission, please email us.
Resource Contact Information
Getting Started22
PRISM MPS and MPD User Manual
Getting Started
This section helps you set up and begin to use the PRISM SDI / IP Waveform Monitor. It is divided into subsections:
Product description describes your instrument and provides a list of key features.
Controls and connectors shows you how to verify that you have received all of the parts of your instrument and provides a list of standard and optional accessories and a list of options that are available for your instrument.
Network installation shows you how to set up your instrument on an Ethernet network.
Getting StartedProduct description
23
PRISM MPS and MPD User Manual
Product descriptionThe PRISM SDI / IP Waveform Monitor provides flexible options and field-installable upgrades to monitor a diverse variety of SDI and IP statistics as well as video and audio content. The comprehensive feature set, along with an intuitive and simplified graphical presentation of IP statistics, including video quality and diagnostic information, allows engineers to ensure the delivery of superior QoS levels in an increasingly complex broadcast environment involving compressed or uncompressed video transmission through SDI/IP signal paths. PRISM is an ideal solution for monitoring SDI/IP hybrid environments including master control rooms, production studios, OB vans, and signal contribution or distribution centers.
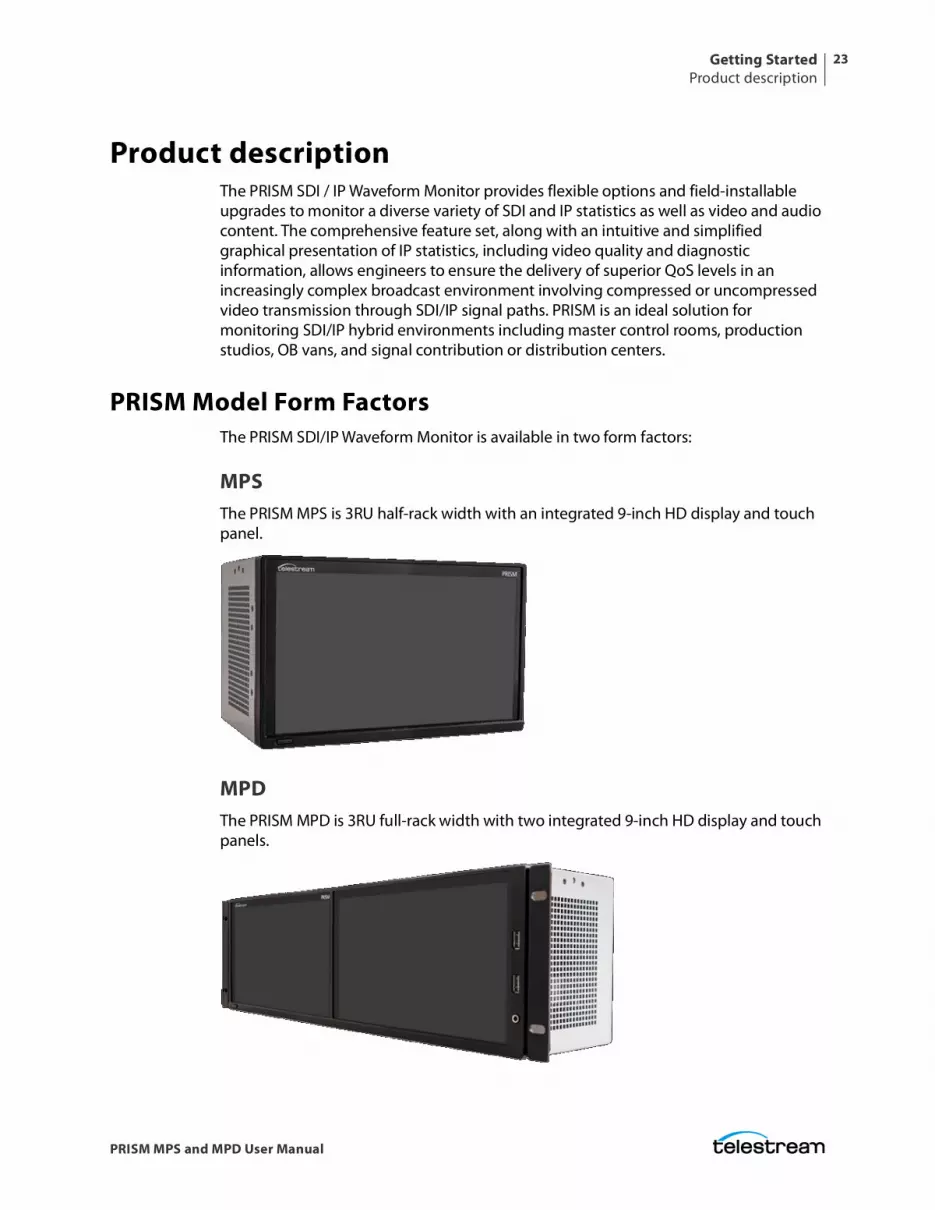
PRISM Model Form FactorsThe PRISM SDI/IP Waveform Monitor is available in two form factors:
MPSThe PRISM MPS is 3RU half-rack width with an integrated 9-inch HD display and touch panel.
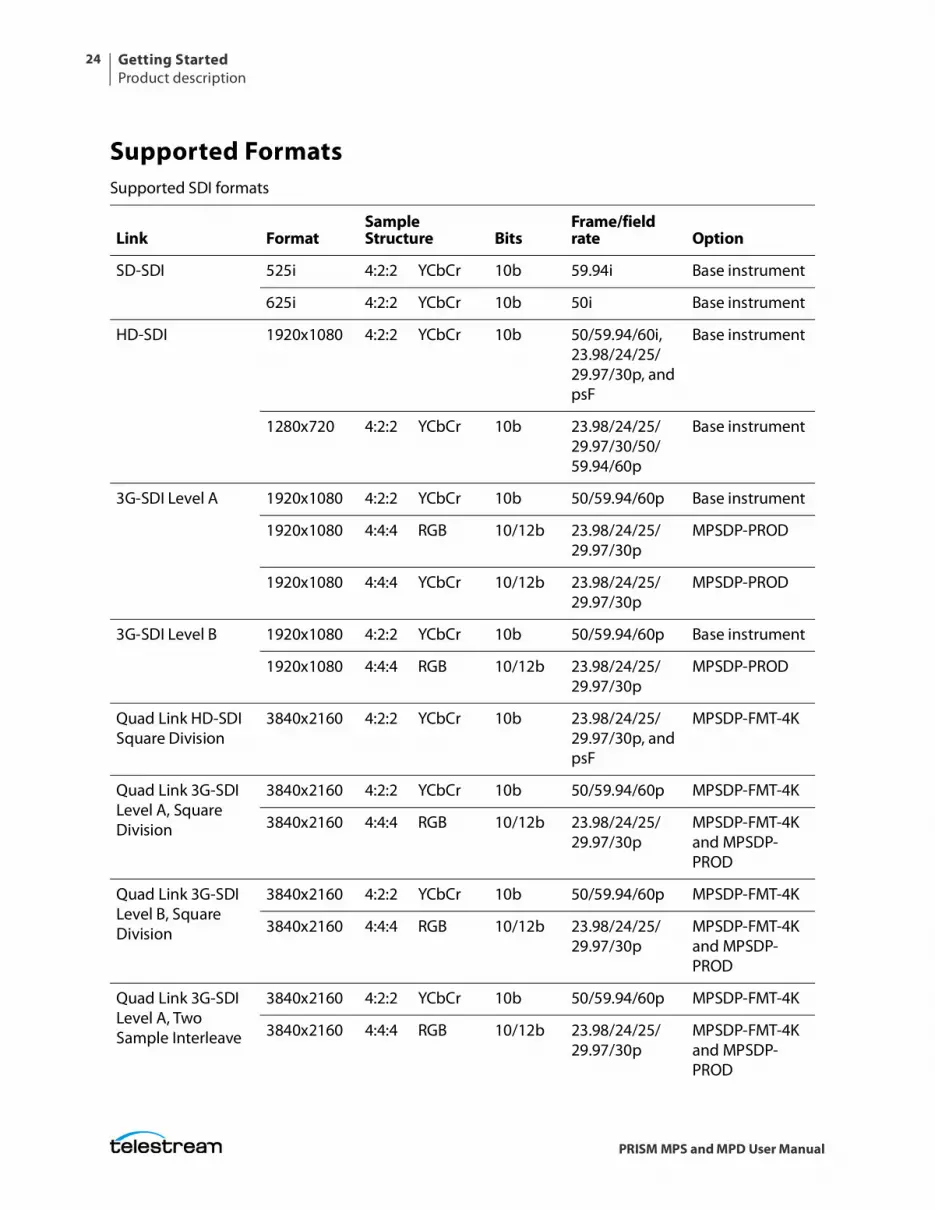
MPDThe PRISM MPD is 3RU full-rack width with two integrated 9-inch HD display and touch panels.
Getting StartedProduct description
24
PRISM MPS and MPD User Manual
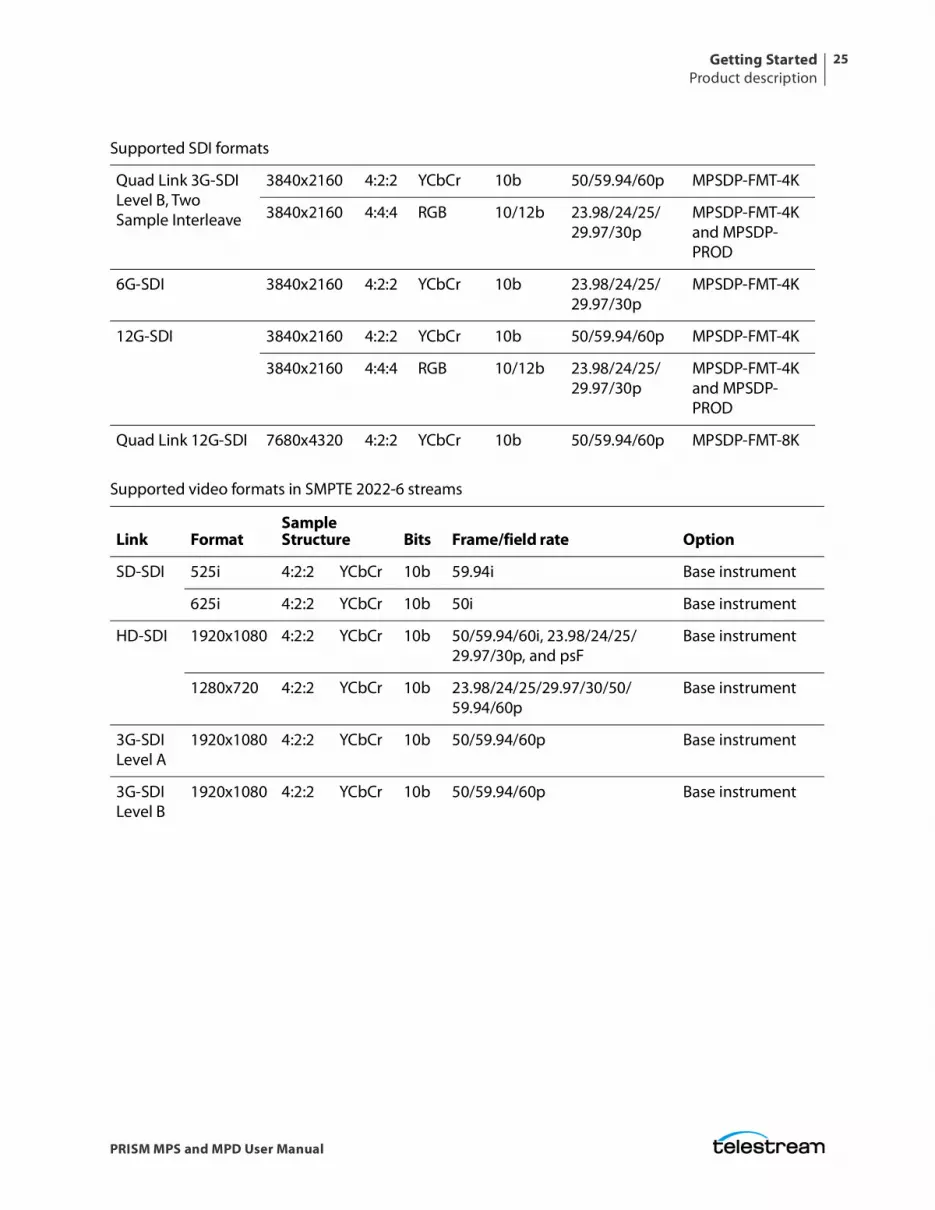
Supported FormatsSupported SDI formats
Link FormatSampleStructure Bits
Frame/field rate Option
SD-SDI 525i 4:2:2 YCbCr 10b 59.94i Base instrument
625i 4:2:2 YCbCr 10b 50i Base instrument
HD-SDI 1920x1080 4:2:2 YCbCr 10b 50/59.94/60i, 23.98/24/25/29.97/30p, and psF
Base instrument
1280x720 4:2:2 YCbCr 10b 23.98/24/25/29.97/30/50/59.94/60p
Base instrument
3G-SDI Level A 1920x1080 4:2:2 YCbCr 10b 50/59.94/60p Base instrument
1920x1080 4:4:4 RGB 10/12b 23.98/24/25/29.97/30p
MPSDP-PROD
1920x1080 4:4:4 YCbCr 10/12b 23.98/24/25/29.97/30p
MPSDP-PROD
3G-SDI Level B 1920x1080 4:2:2 YCbCr 10b 50/59.94/60p Base instrument
1920x1080 4:4:4 RGB 10/12b 23.98/24/25/29.97/30p
MPSDP-PROD
Quad Link HD-SDI Square Division
3840x2160 4:2:2 YCbCr 10b 23.98/24/25/29.97/30p, and psF
MPSDP-FMT-4K
Quad Link 3G-SDI Level A, Square Division
3840x2160 4:2:2 YCbCr 10b 50/59.94/60p MPSDP-FMT-4K
3840x2160 4:4:4 RGB 10/12b 23.98/24/25/29.97/30p
MPSDP-FMT-4K and MPSDP-PROD
Quad Link 3G-SDI Level B, Square Division
3840x2160 4:2:2 YCbCr 10b 50/59.94/60p MPSDP-FMT-4K
3840x2160 4:4:4 RGB 10/12b 23.98/24/25/29.97/30p
MPSDP-FMT-4K and MPSDP-PROD
Quad Link 3G-SDI Level A, Two Sample Interleave
3840x2160 4:2:2 YCbCr 10b 50/59.94/60p MPSDP-FMT-4K
3840x2160 4:4:4 RGB 10/12b 23.98/24/25/29.97/30p
MPSDP-FMT-4K and MPSDP-PROD
Getting StartedProduct description
25
PRISM MPS and MPD User Manual
Quad Link 3G-SDI Level B, Two Sample Interleave
3840x2160 4:2:2 YCbCr 10b 50/59.94/60p MPSDP-FMT-4K
3840x2160 4:4:4 RGB 10/12b 23.98/24/25/29.97/30p
MPSDP-FMT-4K and MPSDP-PROD
6G-SDI 3840x2160 4:2:2 YCbCr 10b 23.98/24/25/29.97/30p
MPSDP-FMT-4K
12G-SDI 3840x2160 4:2:2 YCbCr 10b 50/59.94/60p MPSDP-FMT-4K
3840x2160 4:4:4 RGB 10/12b 23.98/24/25/29.97/30p
MPSDP-FMT-4K and MPSDP-PROD
Quad Link 12G-SDI 7680x4320 4:2:2 YCbCr 10b 50/59.94/60p MPSDP-FMT-8K
Supported video formats in SMPTE 2022-6 streams
Link FormatSample Structure Bits Frame/field rate Option
SD-SDI 525i 4:2:2 YCbCr 10b 59.94i Base instrument
625i 4:2:2 YCbCr 10b 50i Base instrument
HD-SDI 1920x1080 4:2:2 YCbCr 10b 50/59.94/60i, 23.98/24/25/29.97/30p, and psF
Base instrument
1280x720 4:2:2 YCbCr 10b 23.98/24/25/29.97/30/50/59.94/60p
Base instrument
3G-SDI Level A
1920x1080 4:2:2 YCbCr 10b 50/59.94/60p Base instrument
3G-SDI Level B
1920x1080 4:2:2 YCbCr 10b 50/59.94/60p Base instrument
Supported SDI formats
Getting StartedProduct description
26
PRISM MPS and MPD User Manual
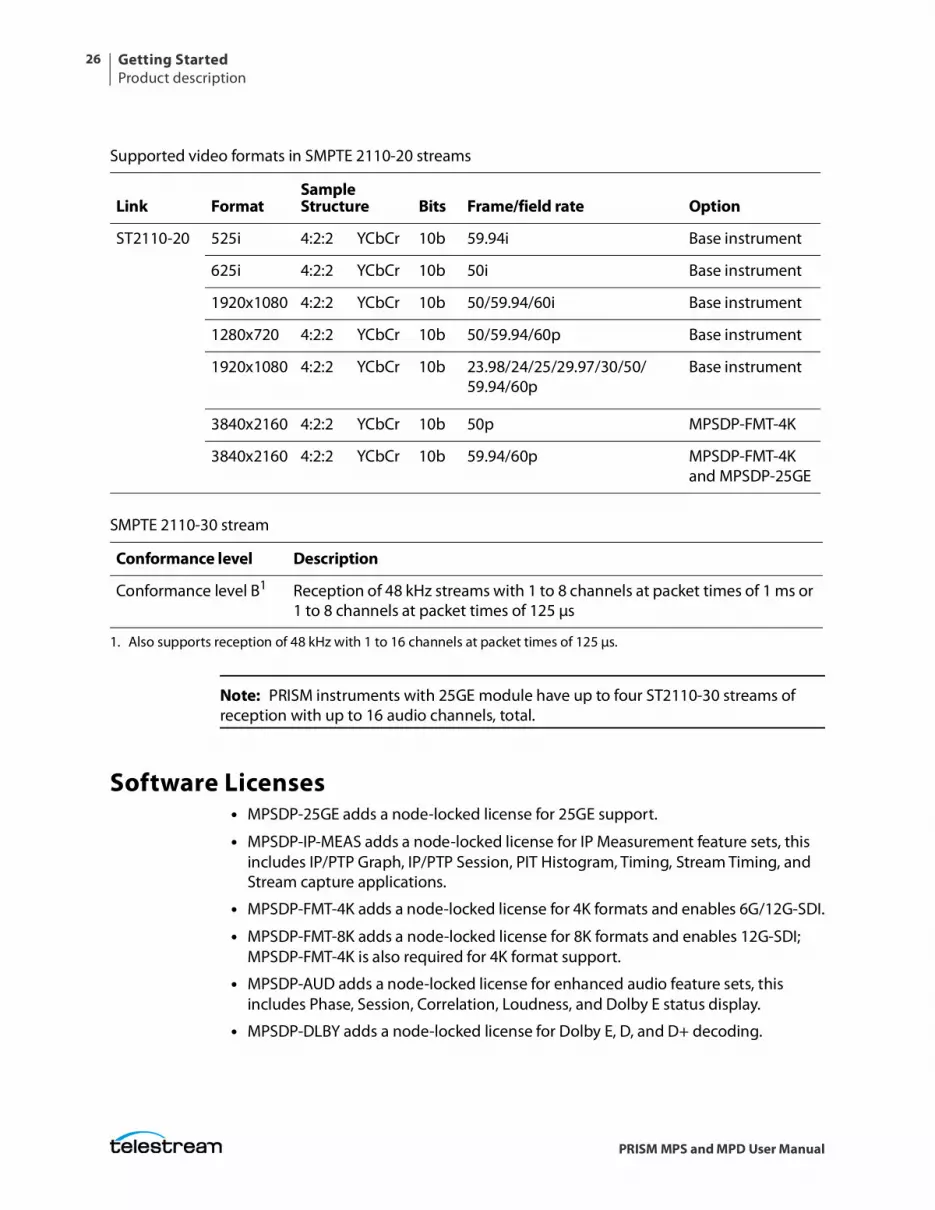
Note: PRISM instruments with 25GE module have up to four ST2110-30 streams of reception with up to 16 audio channels, total.
Software Licenses• MPSDP-25GE adds a node-locked license for 25GE support.
• MPSDP-IP-MEAS adds a node-locked license for IP Measurement feature sets, this includes IP/PTP Graph, IP/PTP Session, PIT Histogram, Timing, Stream Timing, and Stream capture applications.
• MPSDP-FMT-4K adds a node-locked license for 4K formats and enables 6G/12G-SDI.
• MPSDP-FMT-8K adds a node-locked license for 8K formats and enables 12G-SDI; MPSDP-FMT-4K is also required for 4K format support.
• MPSDP-AUD adds a node-locked license for enhanced audio feature sets, this includes Phase, Session, Correlation, Loudness, and Dolby E status display.
• MPSDP-DLBY adds a node-locked license for Dolby E, D, and D+ decoding.
Supported video formats in SMPTE 2110-20 streams
Link FormatSample Structure Bits Frame/field rate Option
ST2110-20 525i 4:2:2 YCbCr 10b 59.94i Base instrument
625i 4:2:2 YCbCr 10b 50i Base instrument
1920x1080 4:2:2 YCbCr 10b 50/59.94/60i Base instrument
1280x720 4:2:2 YCbCr 10b 50/59.94/60p Base instrument
1920x1080 4:2:2 YCbCr 10b 23.98/24/25/29.97/30/50/59.94/60p
Base instrument
3840x2160 4:2:2 YCbCr 10b 50p MPSDP-FMT-4K
3840x2160 4:2:2 YCbCr 10b 59.94/60p MPSDP-FMT-4K and MPSDP-25GE
SMPTE 2110-30 stream
Conformance level Description
Conformance level B1
1. Also supports reception of 48 kHz with 1 to 16 channels at packet times of 125 µs.
Reception of 48 kHz streams with 1 to 8 channels at packet times of 1 ms or 1 to 8 channels at packet times of 125 µs
Getting StartedProduct description
27
PRISM MPS and MPD User Manual
• MPSDP-ENG-QC adds a node-locked license for baseband engineering and quality control feature sets, this includes Datalist, CC/Teletext decoding, ANC Session, and EBU R103 Gamut monitoring.
• MPSDP-PROD adds a node-locked license for production feature sets, this includes Stop, False Color, Light meter, HDR/WCG Conversion, CIE, and HDR Measurements.
• MPSDP-GEN adds a node-locked license for SDI/IP signal generator; this includes IP/SDI Generator application.
• MPSDP-EXTNDSP adds a node-locked license for enabling extended desktop (MPD models include this license as standard).
• MPSDP-SRND adds a node-locked license for surround sound display.
• MPSDP-MULTI adds a node-locked license for multi-channel input.
Getting StartedAccessories
28
PRISM MPS and MPD User Manual
AccessoriesThere are several options for the MPS and MPD instruments to make them more useful and flexible.
Rack MountingThere is rack mounting equipment for both the MPS and MPD models. Instructions to install the equipment is included.
MPS RackThe MPS Rack Accessory Kit (product MPS-RACK) allows you to install one MPS or two MPS units side-by-side in an equipment rack. A bracket is provided to fill the space next to a single MPS in a rack, and equipment to attach the MPS securely to a rack is included. The same kit also contains brackets to connect two MPS side-by-side and equipment to attach the MPS securely to a rack. The kit includes instructions for installation of either setup.
MPD RackThe equipment to install the MPD in a rack is provided with the MPD. The included Installation and Safety documentation has the installation instructions.
PortabilityThe MPS Portable Accessory Kit (product MPS-PTBL) provides equipment for the portability and protection of one MPS. Included is a carry handle, a protective cover for a monitor, a bracket to attach a battery, a protective bottom plate, a mount to connect the unit to a tripod, and instructions to attach the equipment.

Getting StartedMPS-MPD Power-on and Power-off Procedures
29
PRISM MPS and MPD User Manual
MPS-MPD Power-on and Power-off ProceduresThis section describes how to apply power to the MPS and MPD monitors and how to power-on and power-off the instruments.
International Power CordsYour instrument was shipped with one of these power cord options. Power cords for use in North America are UL listed and CSA certified. Cords for use outside North America are approved by at least one authority acceptable in the country to which the product is shipped.
Caution: To reduce risk of fire and shock, use the certified power cord provided with the product.
Power Cord InstallationThis instrument is powered by an AC power source. Connect the power cord to the power connector on the rear panel of the instrument.
The power connector is keyed to be directional, with the flat portion of the power cord housing facing the left of the instrument (as viewed from the rear). When fully inserted, the power cord housing latches onto the instrument power connector.
Caution: To minimize the risk of damage to the instrument, we strongly recommend the power cord be connected to the instrument before the power cord is connected to the AC power source.
PWR-CORD-NA-S15 – North America power cord
PWR-CORD-EURO – Universal EUR power cord
PWR-CORD-CHN – China power cord
PWR-CORD-IN – India power cord
PWR-CORD-UK – United Kingdom power cord
PWR-CORD-BRZ – Brazil power cord
PWR-CORD-AUS– Australia power cord
PWR-CORD-CHE – Switzerland power cord
PWR-CORD-JPN – Japan power cord
PWR-CORD-NONE – No power cord or AC adapter
Getting StartedMPS-MPD Power-on and Power-off Procedures
30
PRISM MPS and MPD User Manual
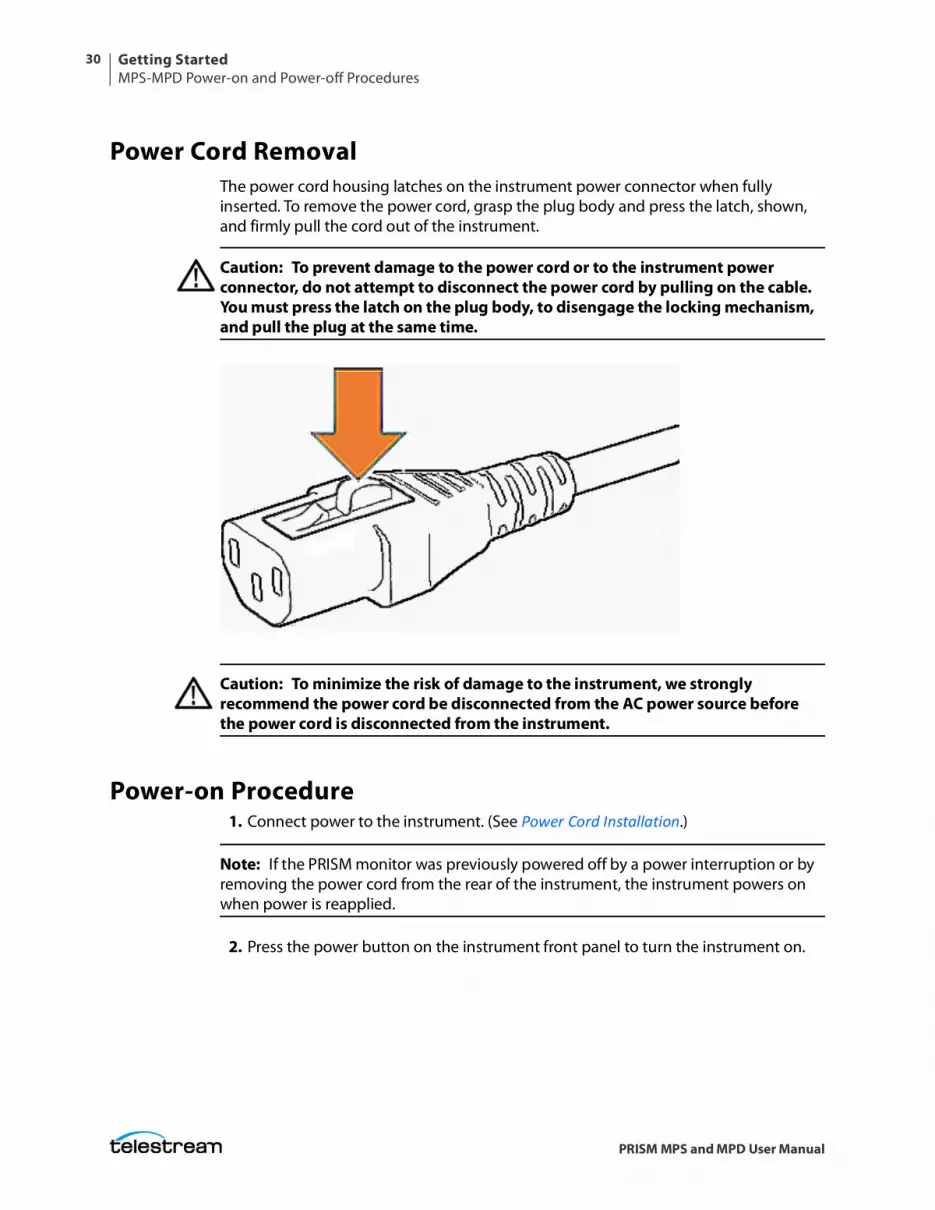
Power Cord RemovalThe power cord housing latches on the instrument power connector when fully inserted. To remove the power cord, grasp the plug body and press the latch, shown, and firmly pull the cord out of the instrument.
Caution: To prevent damage to the power cord or to the instrument power connector, do not attempt to disconnect the power cord by pulling on the cable. You must press the latch on the plug body, to disengage the locking mechanism, and pull the plug at the same time.
Caution: To minimize the risk of damage to the instrument, we strongly recommend the power cord be disconnected from the AC power source before the power cord is disconnected from the instrument.
Power-on Procedure1. Connect power to the instrument. (See Power Cord Installation.)
Note: If the PRISM monitor was previously powered off by a power interruption or by removing the power cord from the rear of the instrument, the instrument powers on when power is reapplied.
2. Press the power button on the instrument front panel to turn the instrument on.
Getting StartedMPS-MPD Power-on and Power-off Procedures
31
PRISM MPS and MPD User Manual
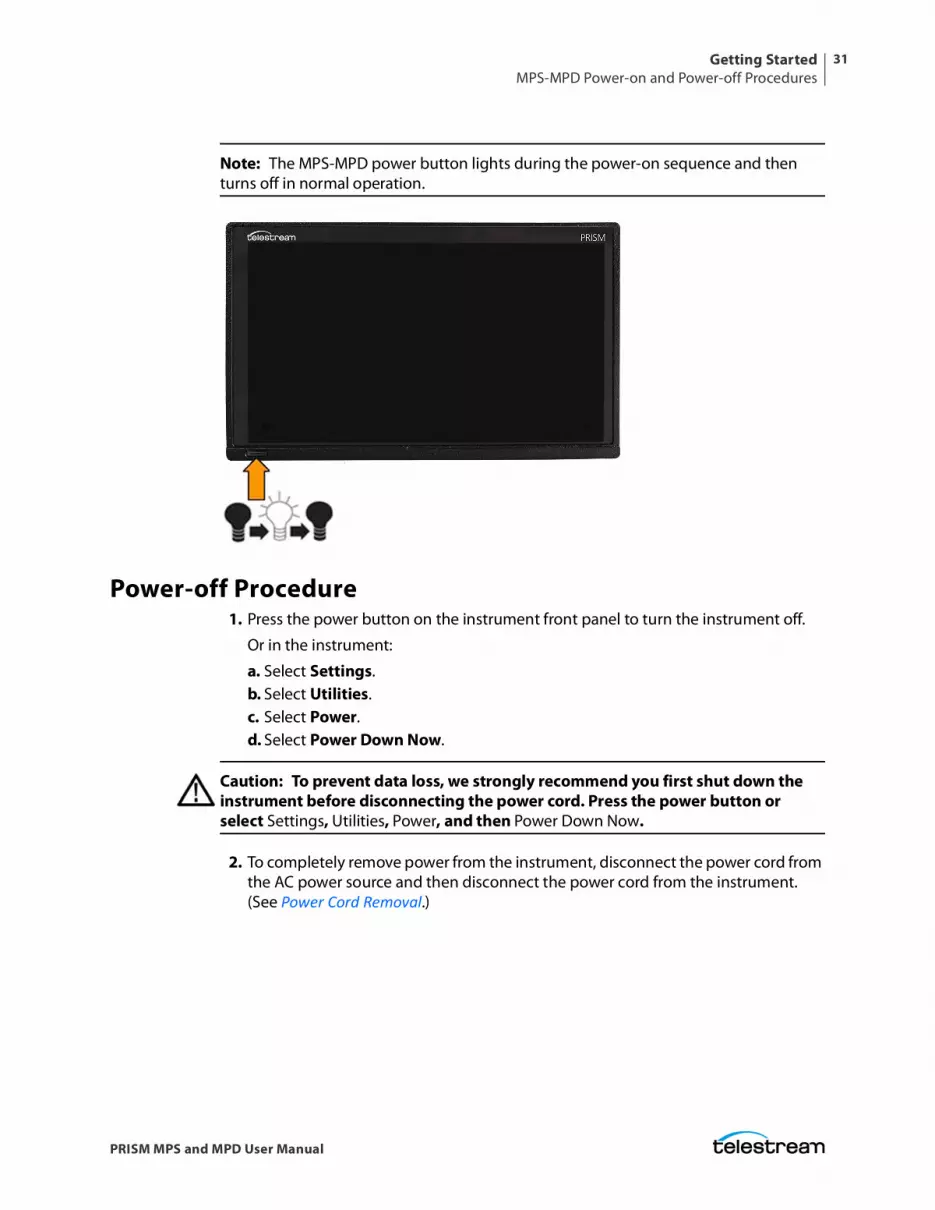
Note: The MPS-MPD power button lights during the power-on sequence and then turns off in normal operation.
Power-off Procedure1. Press the power button on the instrument front panel to turn the instrument off.
Or in the instrument:
a. Select Settings.b. Select Utilities.c. Select Power.d. Select Power Down Now.
Caution: To prevent data loss, we strongly recommend you first shut down the instrument before disconnecting the power cord. Press the power button or select Settings, Utilities, Power, and then Power Down Now.
2. To completely remove power from the instrument, disconnect the power cord from the AC power source and then disconnect the power cord from the instrument. (See Power Cord Removal.)
Getting StartedSFP Module Installation
32
PRISM MPS and MPD User Manual
SFP Module InstallationThere are several types of optional SFP modules available:
• MP-SFP 10GESR is a 10G Ethernet short-range SFP+ transceiver (850 nm).
• MP-SFP 10GELR is a 10G Ethernet long-range SFP+ transceiver (1310 nm).
• MP-SFP 25GESR is a 25G Ethernet short-range SFP28 transceiver (850 nm).
• MP-SFP 25GELR is a 25G Ethernet long-range SFP28 transceiver (1310 nm).
Note: ST2022-7 requires two 10GE (or 25GE) SFP modules to be installed. The modules must be installed in SFP ports 1 and 2.
Install SFP ModuleTo install an SFP module, insert the SFP module into the SFP connector. The module latches into place when fully inserted.
Note: There are different types of SFP modules for 10GE and 25GE signals. If the SFP module does not match the unit signal setting (for example, a 25GE SFP module is installed and the unit is set for a 10GE signal), the Link Status (in Network, under Settings) returns “SFP Error.”
To remove the SFP module, pull down on the latch and then pull the module out of the SFP connector.
Note: To ensure you are using the correct SFP connectors, the 10GE, 25GE, and SDI SFP connectors are marked on the back of the MPS (see MPS Connectors) and MPD (see MPD Connectors). Different types of SFP modules may have different latching mechanisms.
SFP Module Transportation
Caution: To prevent static damage to the SFP module, if you remove the SFP module from the instrument, always store and transport the SFP module in an anti-static bag or container.
Caution: To prevent possible damage to the PRISM monitor and SFP modules, remove the SFP modules before transporting the PRISM monitor.
Getting StartedNetwork Installation
33
PRISM MPS and MPD User Manual
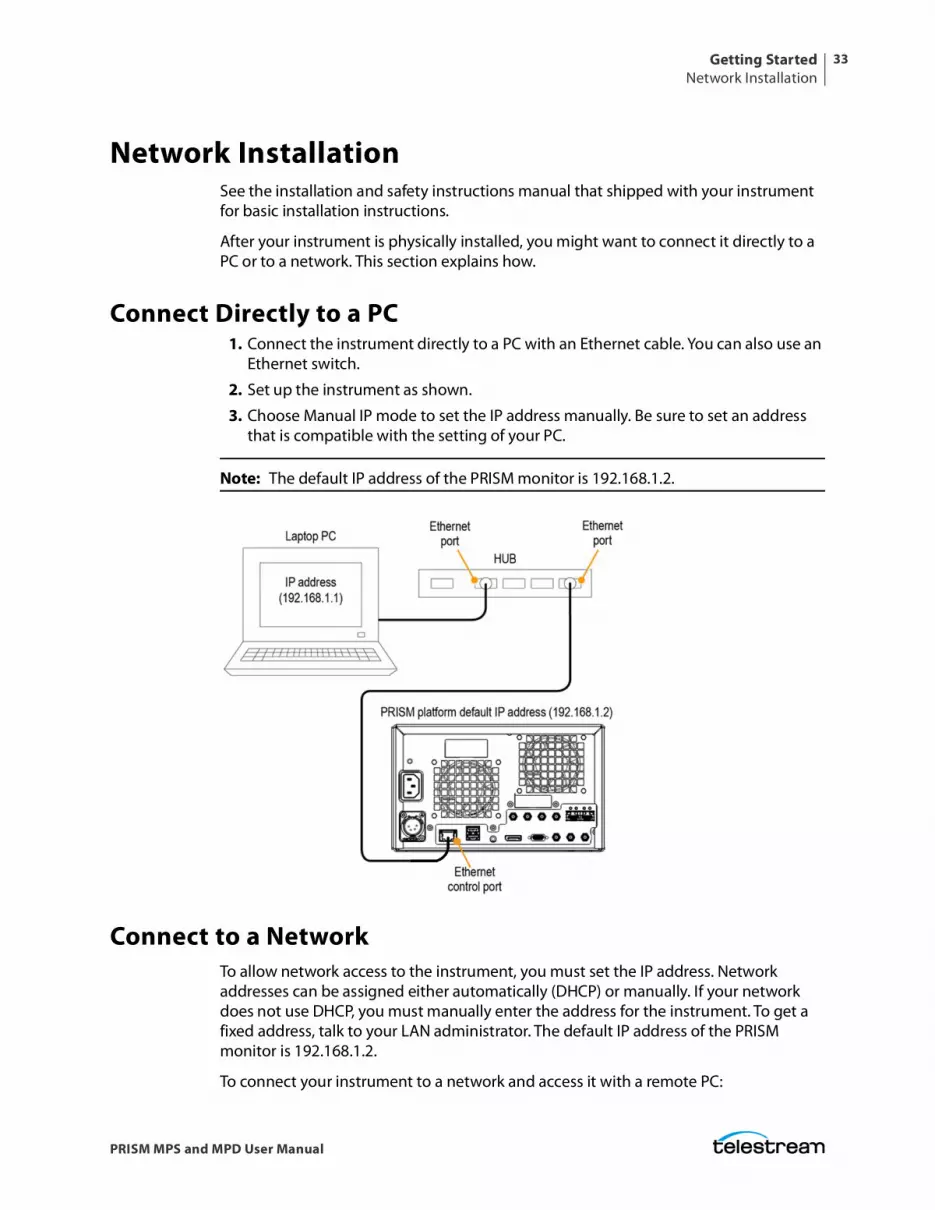
Network InstallationSee the installation and safety instructions manual that shipped with your instrument for basic installation instructions.
After your instrument is physically installed, you might want to connect it directly to a PC or to a network. This section explains how.
Connect Directly to a PC1. Connect the instrument directly to a PC with an Ethernet cable. You can also use an
Ethernet switch.
2. Set up the instrument as shown.
3. Choose Manual IP mode to set the IP address manually. Be sure to set an address that is compatible with the setting of your PC.
Note: The default IP address of the PRISM monitor is 192.168.1.2.
Connect to a NetworkTo allow network access to the instrument, you must set the IP address. Network addresses can be assigned either automatically (DHCP) or manually. If your network does not use DHCP, you must manually enter the address for the instrument. To get a fixed address, talk to your LAN administrator. The default IP address of the PRISM monitor is 192.168.1.2.
To connect your instrument to a network and access it with a remote PC:
Getting StartedNetwork Installation
34
PRISM MPS and MPD User Manual
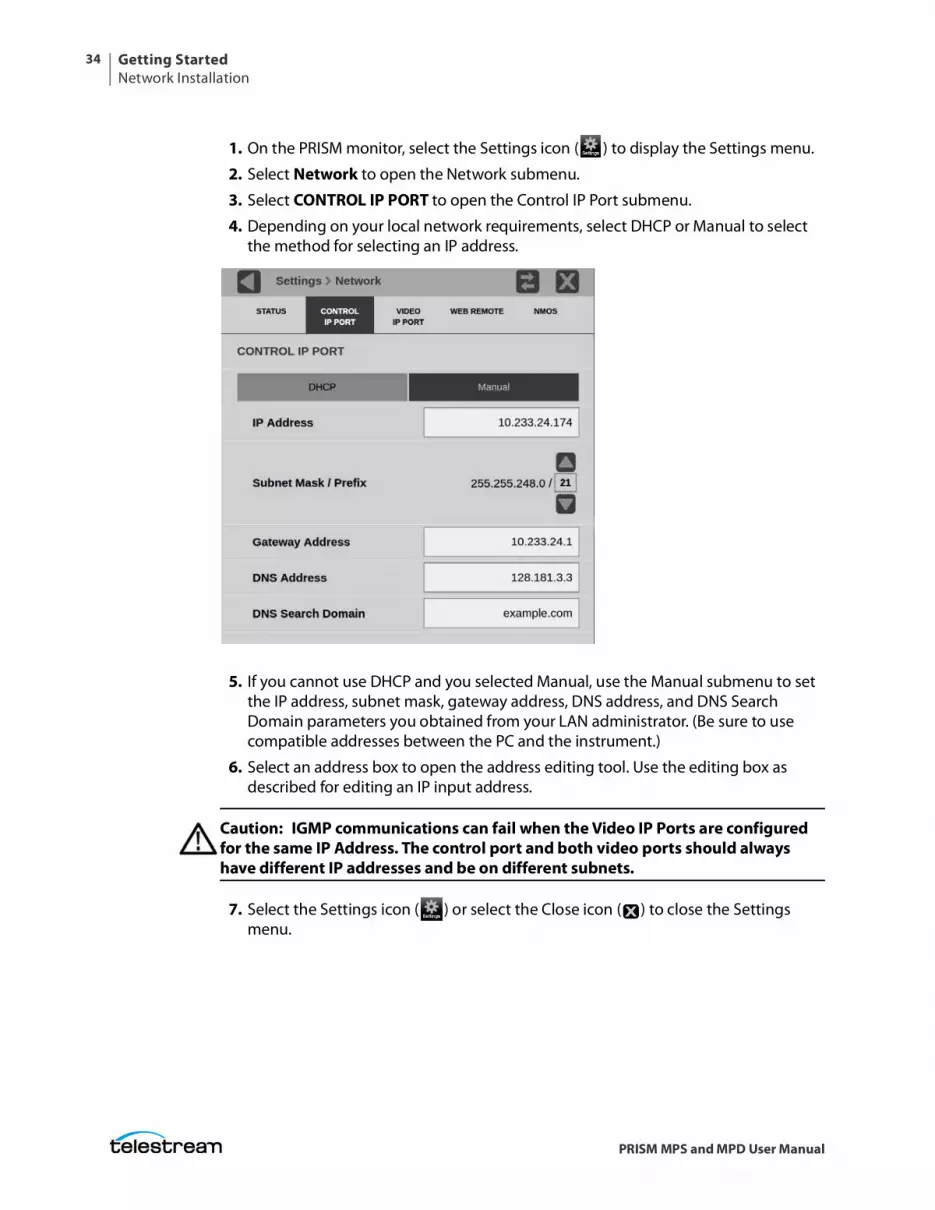
1. On the PRISM monitor, select the Settings icon ( ) to display the Settings menu.
2. Select Network to open the Network submenu.
3. Select CONTROL IP PORT to open the Control IP Port submenu.
4. Depending on your local network requirements, select DHCP or Manual to select the method for selecting an IP address.
5. If you cannot use DHCP and you selected Manual, use the Manual submenu to set the IP address, subnet mask, gateway address, DNS address, and DNS Search Domain parameters you obtained from your LAN administrator. (Be sure to use compatible addresses between the PC and the instrument.)
6. Select an address box to open the address editing tool. Use the editing box as described for editing an IP input address.
Caution: IGMP communications can fail when the Video IP Ports are configured for the same IP Address. The control port and both video ports should always have different IP addresses and be on different subnets.
7. Select the Settings icon ( ) or select the Close icon ( ) to close the Settings menu.
Getting StartedMPS Connectors
35
PRISM MPS and MPD User Manual
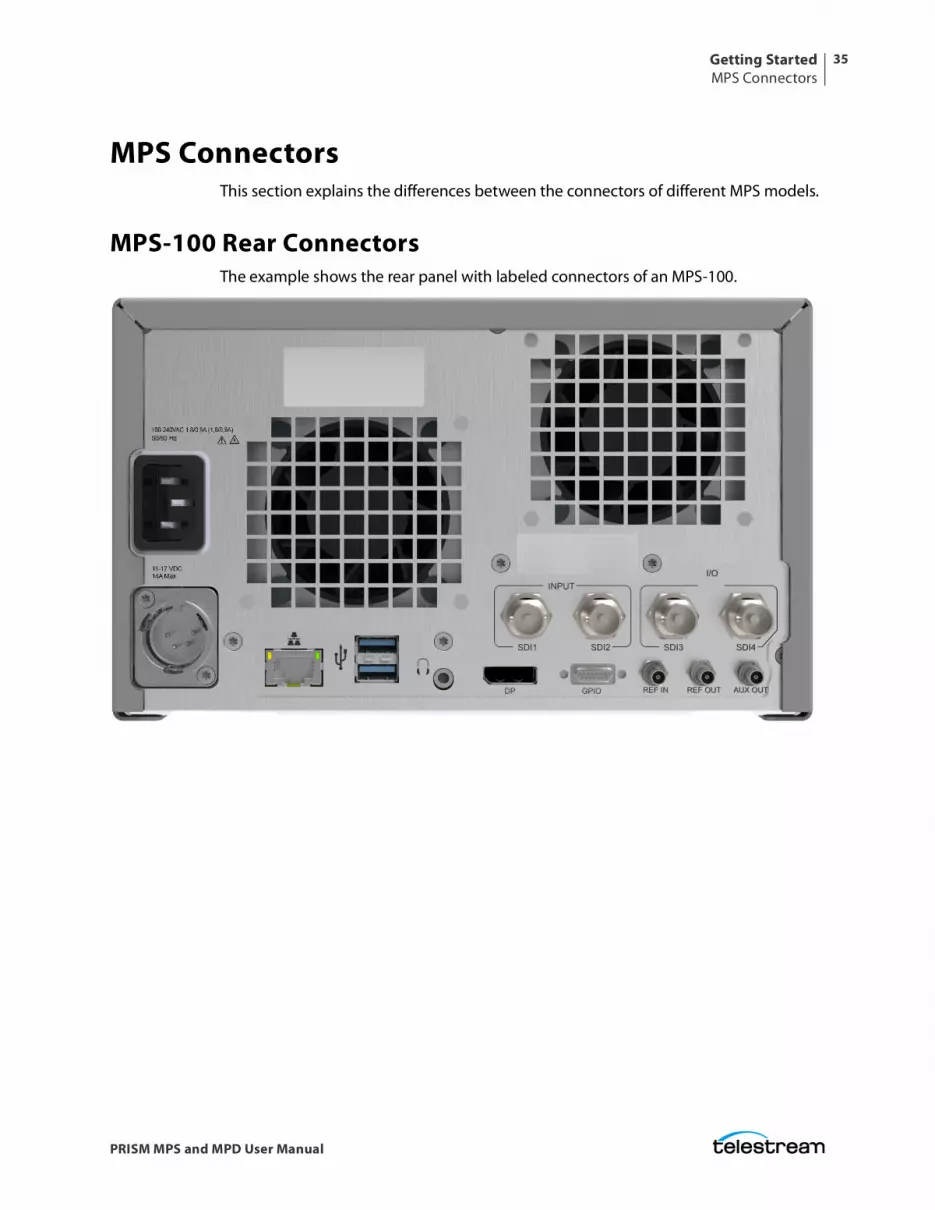
MPS ConnectorsThis section explains the differences between the connectors of different MPS models.
MPS-100 Rear ConnectorsThe example shows the rear panel with labeled connectors of an MPS-100.
Getting StartedMPS Connectors
36
PRISM MPS and MPD User Manual
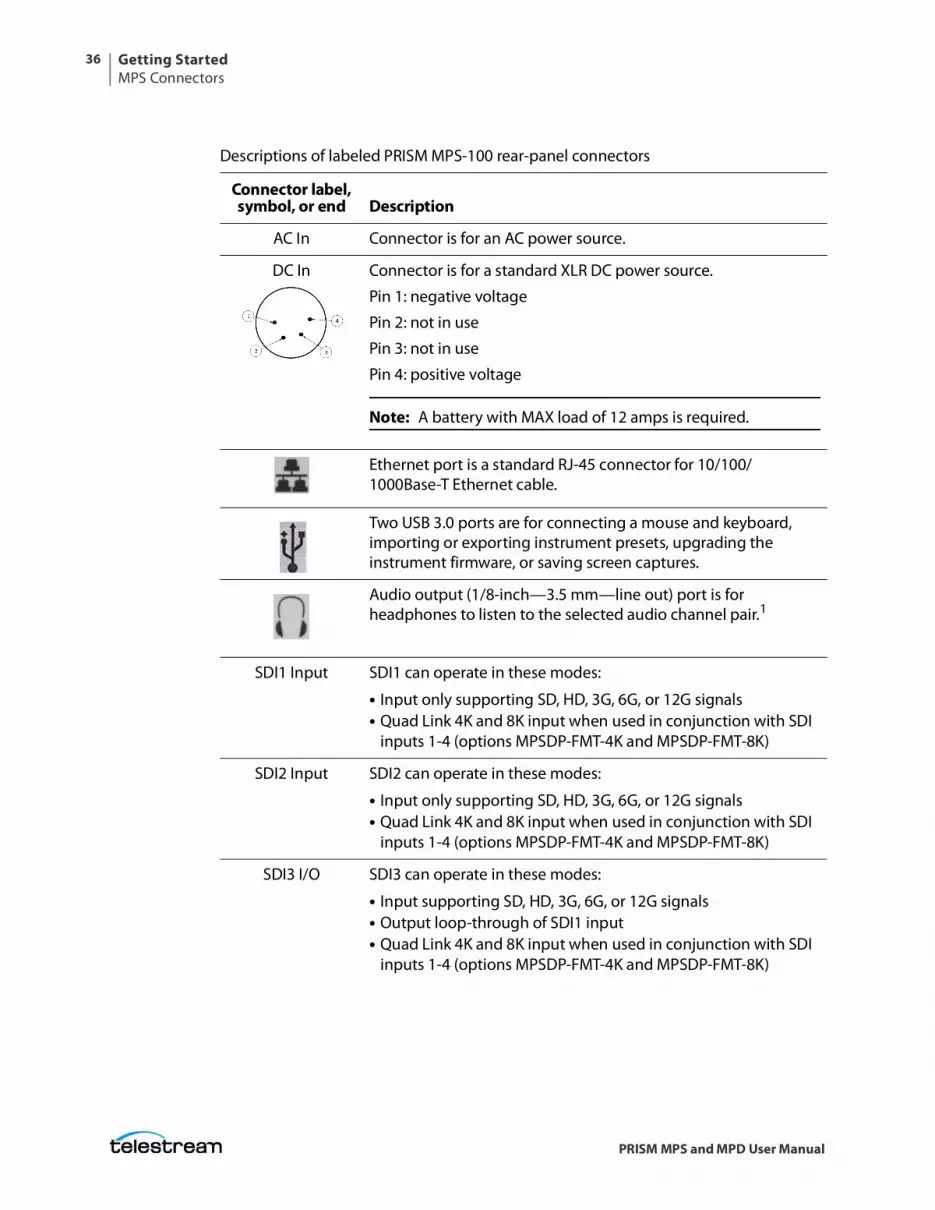
Descriptions of labeled PRISM MPS-100 rear-panel connectors
Connector label, symbol, or end Description
AC In Connector is for an AC power source.
DC In
Connector is for a standard XLR DC power source.
Pin 1: negative voltage
Pin 2: not in use
Pin 3: not in use
Pin 4: positive voltage
Note: A battery with MAX load of 12 amps is required.
Ethernet port is a standard RJ-45 connector for 10/100/1000Base-T Ethernet cable.
Two USB 3.0 ports are for connecting a mouse and keyboard, importing or exporting instrument presets, upgrading the instrument firmware, or saving screen captures.
Audio output (1/8-inch—3.5 mm—line out) port is for headphones to listen to the selected audio channel pair.1
SDI1 Input SDI1 can operate in these modes:
• Input only supporting SD, HD, 3G, 6G, or 12G signals• Quad Link 4K and 8K input when used in conjunction with SDI
inputs 1-4 (options MPSDP-FMT-4K and MPSDP-FMT-8K)
SDI2 Input SDI2 can operate in these modes:
• Input only supporting SD, HD, 3G, 6G, or 12G signals• Quad Link 4K and 8K input when used in conjunction with SDI
inputs 1-4 (options MPSDP-FMT-4K and MPSDP-FMT-8K)
SDI3 I/O SDI3 can operate in these modes:
• Input supporting SD, HD, 3G, 6G, or 12G signals• Output loop-through of SDI1 input• Quad Link 4K and 8K input when used in conjunction with SDI
inputs 1-4 (options MPSDP-FMT-4K and MPSDP-FMT-8K)
Getting StartedMPS Connectors
37
PRISM MPS and MPD User Manual
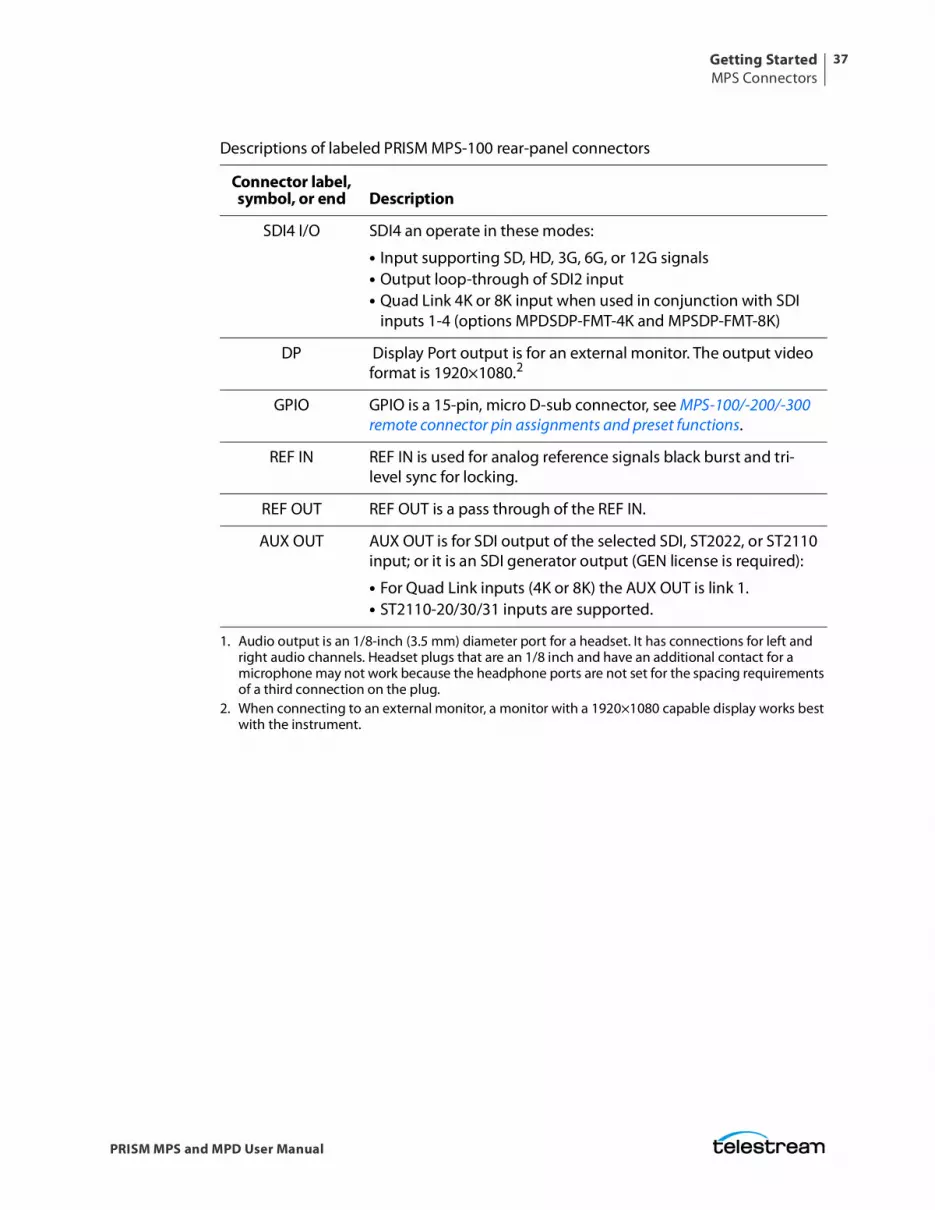
SDI4 I/O SDI4 an operate in these modes:
• Input supporting SD, HD, 3G, 6G, or 12G signals• Output loop-through of SDI2 input• Quad Link 4K or 8K input when used in conjunction with SDI
inputs 1-4 (options MPDSDP-FMT-4K and MPSDP-FMT-8K)
DP Display Port output is for an external monitor. The output video format is 1920×1080.2
GPIO GPIO is a 15-pin, micro D-sub connector, see MPS-100/-200/-300 remote connector pin assignments and preset functions.
REF IN REF IN is used for analog reference signals black burst and tri-level sync for locking.
REF OUT REF OUT is a pass through of the REF IN.
AUX OUT AUX OUT is for SDI output of the selected SDI, ST2022, or ST2110 input; or it is an SDI generator output (GEN license is required):
• For Quad Link inputs (4K or 8K) the AUX OUT is link 1.• ST2110-20/30/31 inputs are supported.
1. Audio output is an 1/8-inch (3.5 mm) diameter port for a headset. It has connections for left and right audio channels. Headset plugs that are an 1/8 inch and have an additional contact for a microphone may not work because the headphone ports are not set for the spacing requirements of a third connection on the plug.
2. When connecting to an external monitor, a monitor with a 1920×1080 capable display works best with the instrument.
Descriptions of labeled PRISM MPS-100 rear-panel connectors
Connector label, symbol, or end Description
Getting StartedMPS Connectors
38
PRISM MPS and MPD User Manual
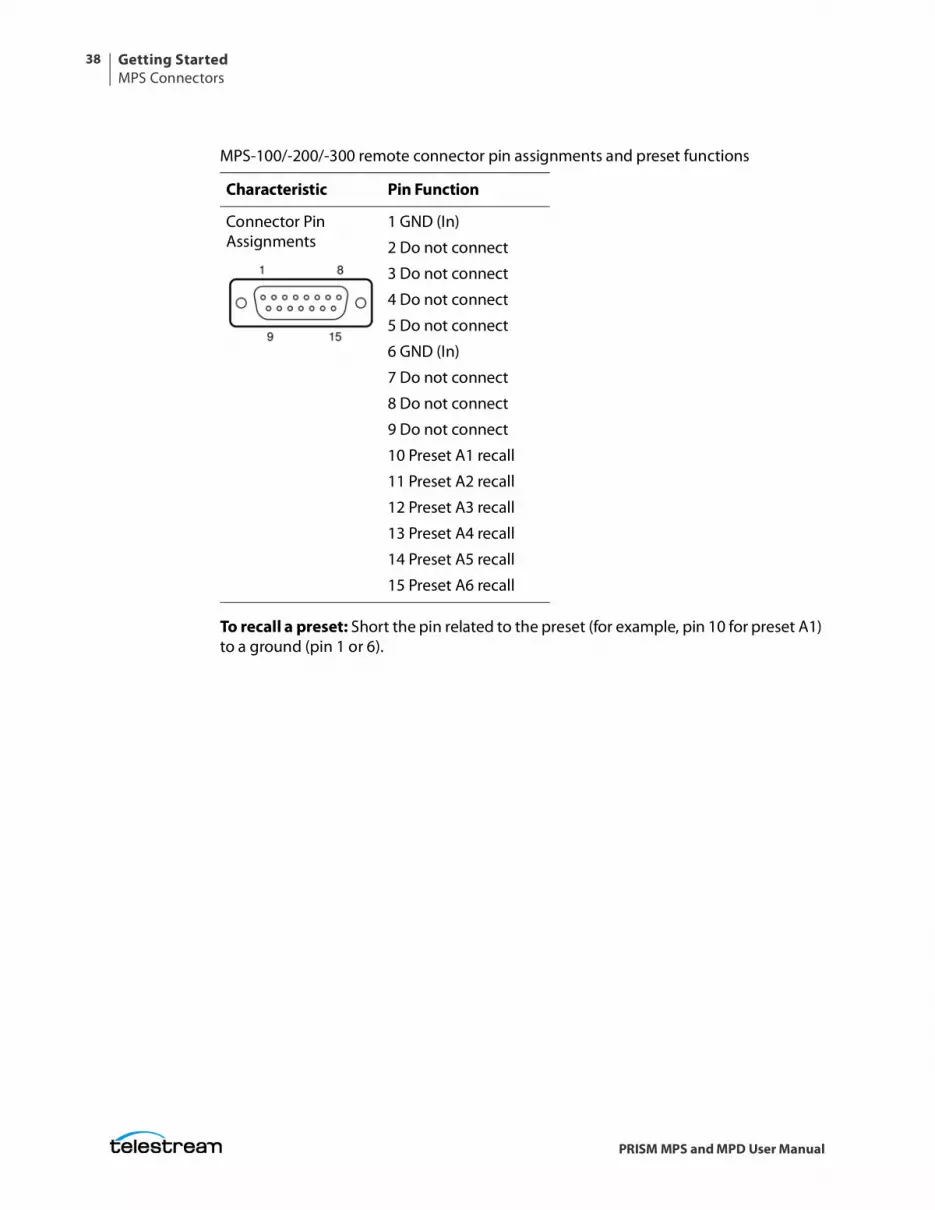
To recall a preset: Short the pin related to the preset (for example, pin 10 for preset A1) to a ground (pin 1 or 6).
MPS-100/-200/-300 remote connector pin assignments and preset functions
Characteristic Pin Function
Connector Pin Assignments
1 GND (In)
2 Do not connect
3 Do not connect
4 Do not connect
5 Do not connect
6 GND (In)
7 Do not connect
8 Do not connect
9 Do not connect
10 Preset A1 recall
11 Preset A2 recall
12 Preset A3 recall
13 Preset A4 recall
14 Preset A5 recall
15 Preset A6 recall
Getting StartedMPS Connectors
39
PRISM MPS and MPD User Manual
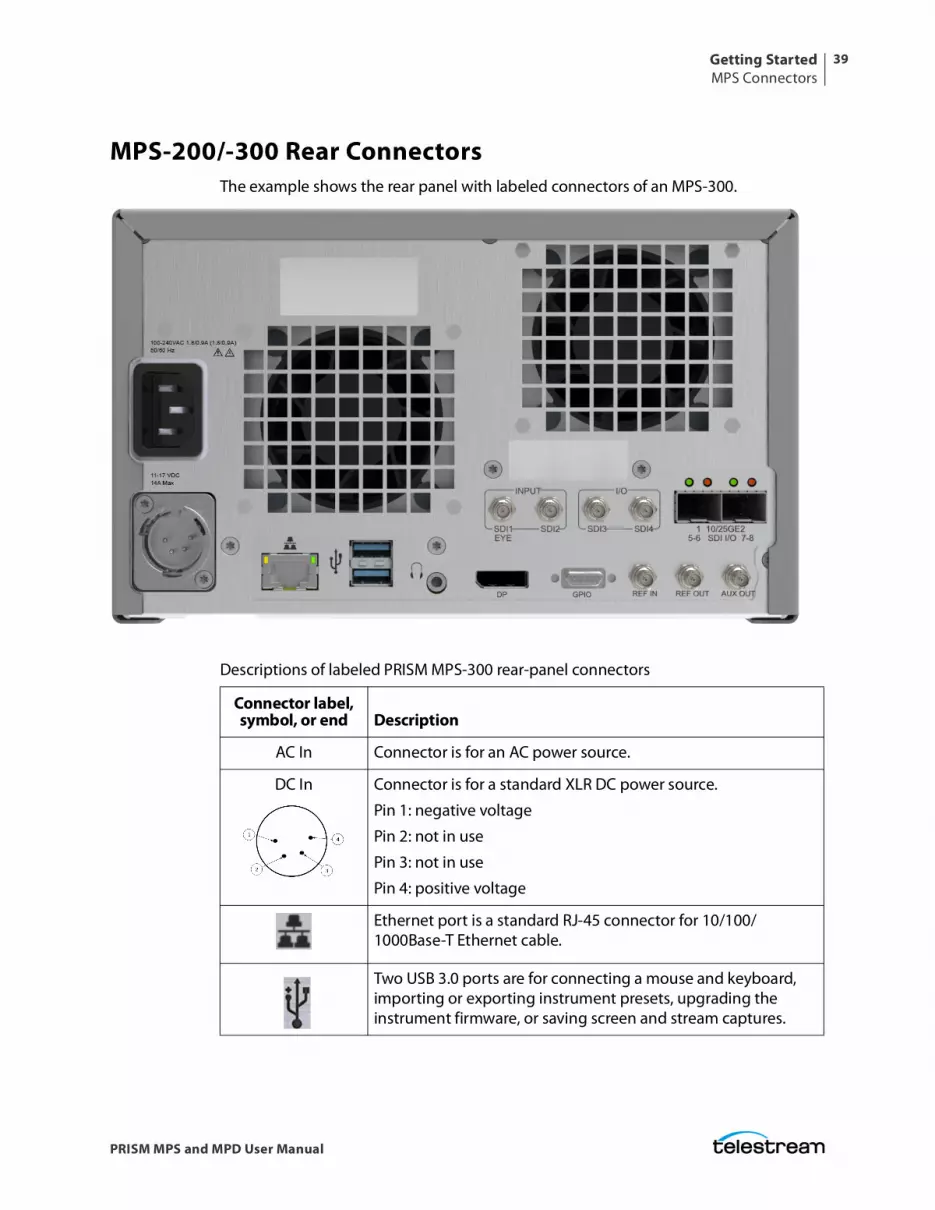
MPS-200/-300 Rear ConnectorsThe example shows the rear panel with labeled connectors of an MPS-300.
Descriptions of labeled PRISM MPS-300 rear-panel connectors
Connector label, symbol, or end Description
AC In Connector is for an AC power source.
DC In Connector is for a standard XLR DC power source.
Pin 1: negative voltage
Pin 2: not in use
Pin 3: not in use
Pin 4: positive voltage
Ethernet port is a standard RJ-45 connector for 10/100/1000Base-T Ethernet cable.
Two USB 3.0 ports are for connecting a mouse and keyboard, importing or exporting instrument presets, upgrading the instrument firmware, or saving screen and stream captures.
Getting StartedMPS Connectors
40
PRISM MPS and MPD User Manual
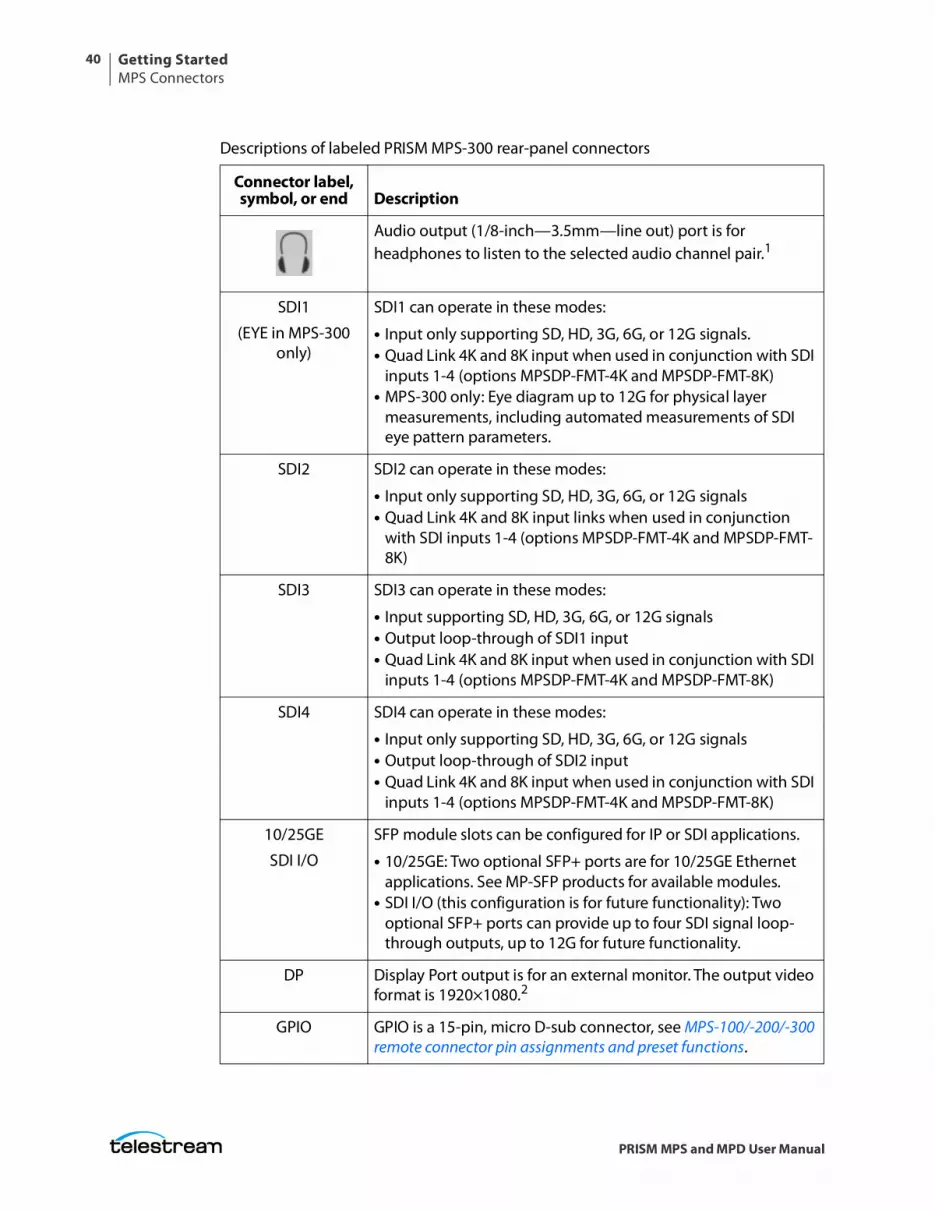
Audio output (1/8-inch—3.5mm—line out) port is for headphones to listen to the selected audio channel pair.1
SDI1
(EYE in MPS-300 only)
SDI1 can operate in these modes:
• Input only supporting SD, HD, 3G, 6G, or 12G signals.• Quad Link 4K and 8K input when used in conjunction with SDI
inputs 1-4 (options MPSDP-FMT-4K and MPSDP-FMT-8K)• MPS-300 only: Eye diagram up to 12G for physical layer
measurements, including automated measurements of SDI eye pattern parameters.
SDI2 SDI2 can operate in these modes:
• Input only supporting SD, HD, 3G, 6G, or 12G signals• Quad Link 4K and 8K input links when used in conjunction
with SDI inputs 1-4 (options MPSDP-FMT-4K and MPSDP-FMT-8K)
SDI3 SDI3 can operate in these modes:
• Input supporting SD, HD, 3G, 6G, or 12G signals• Output loop-through of SDI1 input• Quad Link 4K and 8K input when used in conjunction with SDI
inputs 1-4 (options MPSDP-FMT-4K and MPSDP-FMT-8K)
SDI4 SDI4 can operate in these modes:
• Input only supporting SD, HD, 3G, 6G, or 12G signals• Output loop-through of SDI2 input• Quad Link 4K and 8K input when used in conjunction with SDI
inputs 1-4 (options MPSDP-FMT-4K and MPSDP-FMT-8K)
10/25GE
SDI I/O
SFP module slots can be configured for IP or SDI applications.
• 10/25GE: Two optional SFP+ ports are for 10/25GE Ethernet applications. See MP-SFP products for available modules.
• SDI I/O (this configuration is for future functionality): Two optional SFP+ ports can provide up to four SDI signal loop-through outputs, up to 12G for future functionality.
DP Display Port output is for an external monitor. The output video format is 1920×1080.2
GPIO GPIO is a 15-pin, micro D-sub connector, see MPS-100/-200/-300 remote connector pin assignments and preset functions.
Descriptions of labeled PRISM MPS-300 rear-panel connectors
Connector label, symbol, or end Description
Getting StartedMPS Connectors
41
PRISM MPS and MPD User Manual
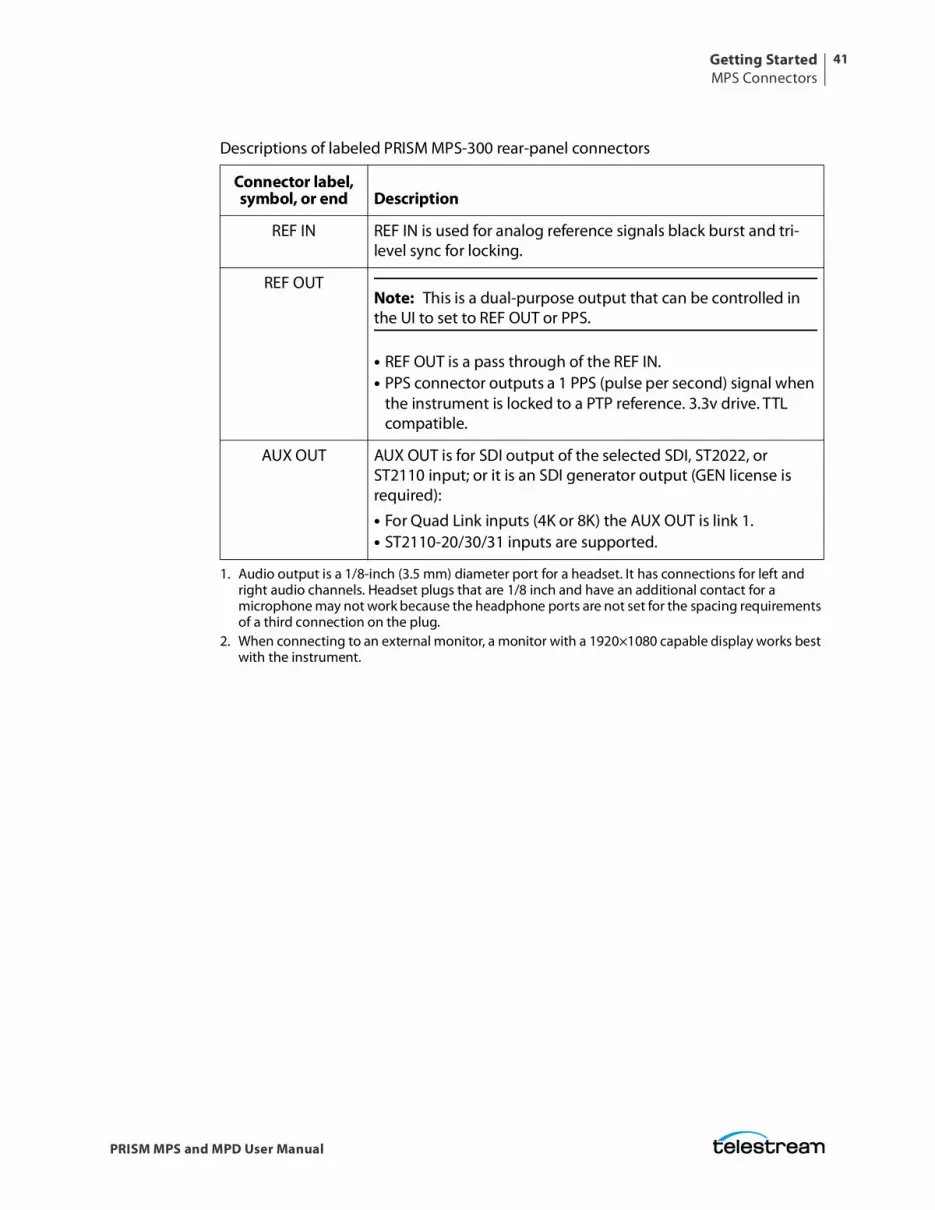
REF IN REF IN is used for analog reference signals black burst and tri-level sync for locking.
REF OUTNote: This is a dual-purpose output that can be controlled in the UI to set to REF OUT or PPS.
• REF OUT is a pass through of the REF IN. • PPS connector outputs a 1 PPS (pulse per second) signal when
the instrument is locked to a PTP reference. 3.3v drive. TTL compatible.
AUX OUT AUX OUT is for SDI output of the selected SDI, ST2022, or ST2110 input; or it is an SDI generator output (GEN license is required):
• For Quad Link inputs (4K or 8K) the AUX OUT is link 1.• ST2110-20/30/31 inputs are supported.
1. Audio output is a 1/8-inch (3.5 mm) diameter port for a headset. It has connections for left and right audio channels. Headset plugs that are 1/8 inch and have an additional contact for a microphone may not work because the headphone ports are not set for the spacing requirements of a third connection on the plug.
2. When connecting to an external monitor, a monitor with a 1920×1080 capable display works best with the instrument.
Descriptions of labeled PRISM MPS-300 rear-panel connectors
Connector label, symbol, or end Description
Getting StartedMPD Connectors
42
PRISM MPS and MPD User Manual
MPD ConnectorsThis section explains the differences between the connectors of different MPD models.
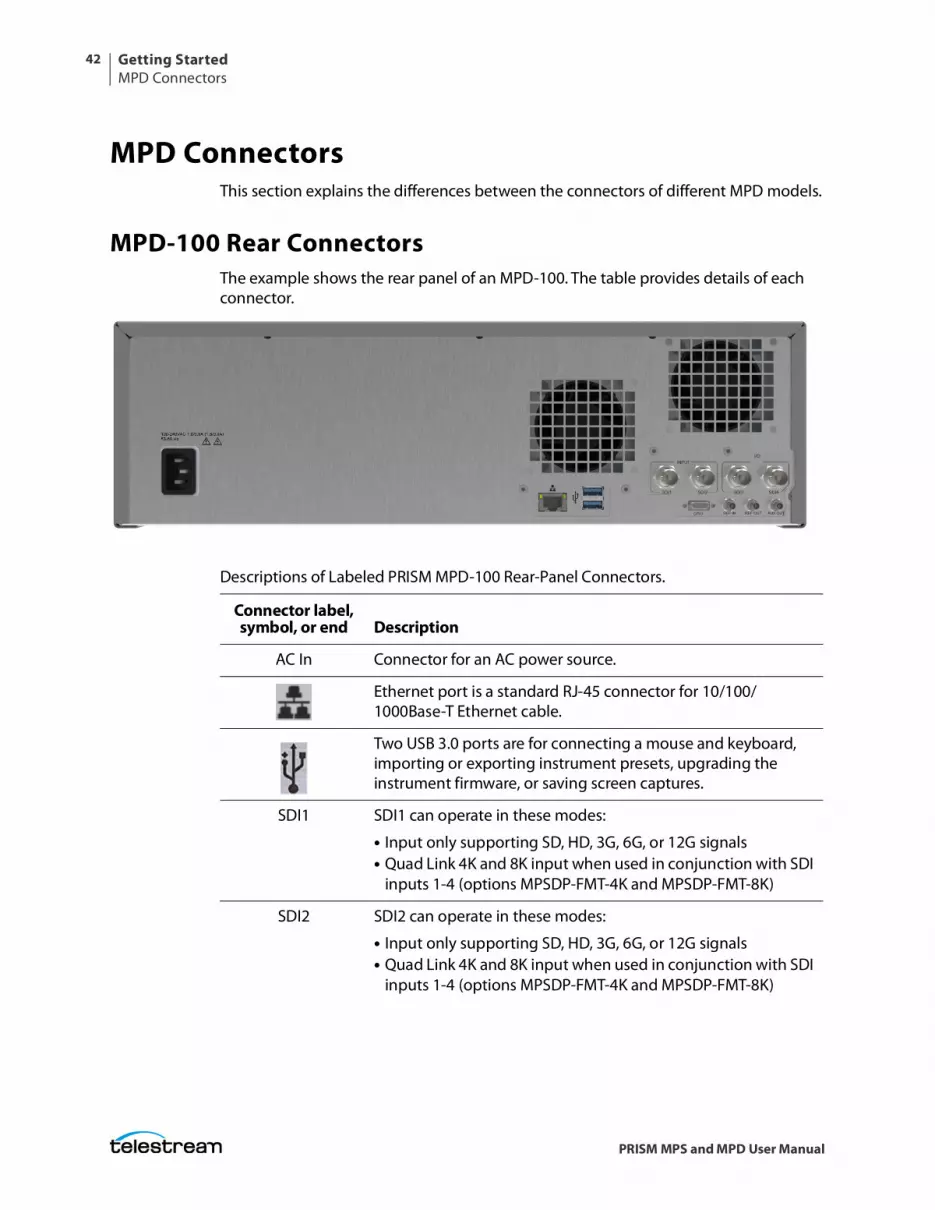
MPD-100 Rear ConnectorsThe example shows the rear panel of an MPD-100. The table provides details of each connector.
Descriptions of Labeled PRISM MPD-100 Rear-Panel Connectors.
Connector label, symbol, or end Description
AC In Connector for an AC power source.
Ethernet port is a standard RJ-45 connector for 10/100/1000Base-T Ethernet cable.
Two USB 3.0 ports are for connecting a mouse and keyboard, importing or exporting instrument presets, upgrading the instrument firmware, or saving screen captures.
SDI1 SDI1 can operate in these modes:
• Input only supporting SD, HD, 3G, 6G, or 12G signals• Quad Link 4K and 8K input when used in conjunction with SDI
inputs 1-4 (options MPSDP-FMT-4K and MPSDP-FMT-8K)
SDI2 SDI2 can operate in these modes:
• Input only supporting SD, HD, 3G, 6G, or 12G signals• Quad Link 4K and 8K input when used in conjunction with SDI
inputs 1-4 (options MPSDP-FMT-4K and MPSDP-FMT-8K)
Getting StartedMPD Connectors
43
PRISM MPS and MPD User Manual
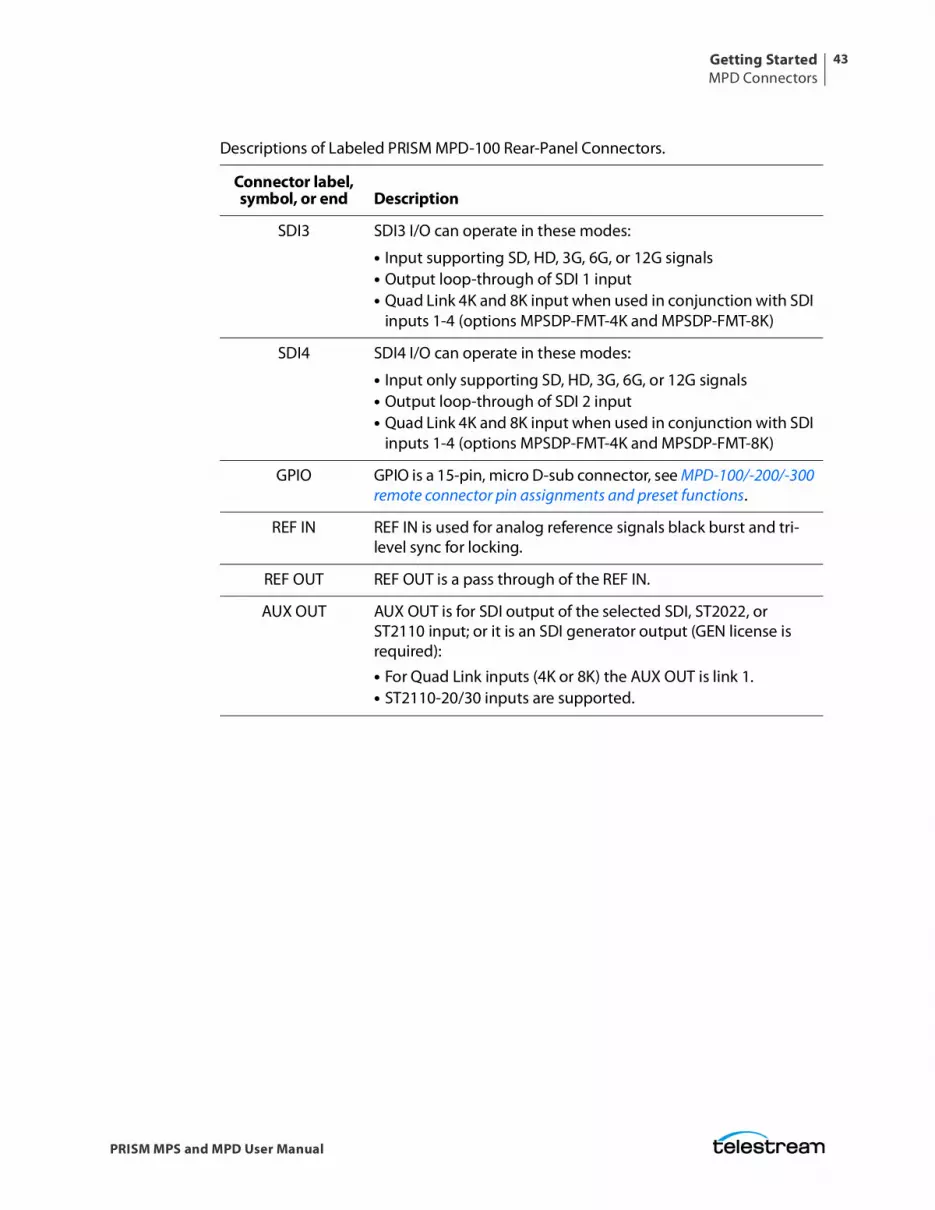
SDI3 SDI3 I/O can operate in these modes:
• Input supporting SD, HD, 3G, 6G, or 12G signals• Output loop-through of SDI 1 input• Quad Link 4K and 8K input when used in conjunction with SDI
inputs 1-4 (options MPSDP-FMT-4K and MPSDP-FMT-8K)
SDI4 SDI4 I/O can operate in these modes:
• Input only supporting SD, HD, 3G, 6G, or 12G signals• Output loop-through of SDI 2 input• Quad Link 4K and 8K input when used in conjunction with SDI
inputs 1-4 (options MPSDP-FMT-4K and MPSDP-FMT-8K)
GPIO GPIO is a 15-pin, micro D-sub connector, see MPD-100/-200/-300 remote connector pin assignments and preset functions.
REF IN REF IN is used for analog reference signals black burst and tri-level sync for locking.
REF OUT REF OUT is a pass through of the REF IN.
AUX OUT AUX OUT is for SDI output of the selected SDI, ST2022, or ST2110 input; or it is an SDI generator output (GEN license is required):
• For Quad Link inputs (4K or 8K) the AUX OUT is link 1.• ST2110-20/30 inputs are supported.
Descriptions of Labeled PRISM MPD-100 Rear-Panel Connectors.
Connector label, symbol, or end Description
Getting StartedMPD Connectors
44
PRISM MPS and MPD User Manual
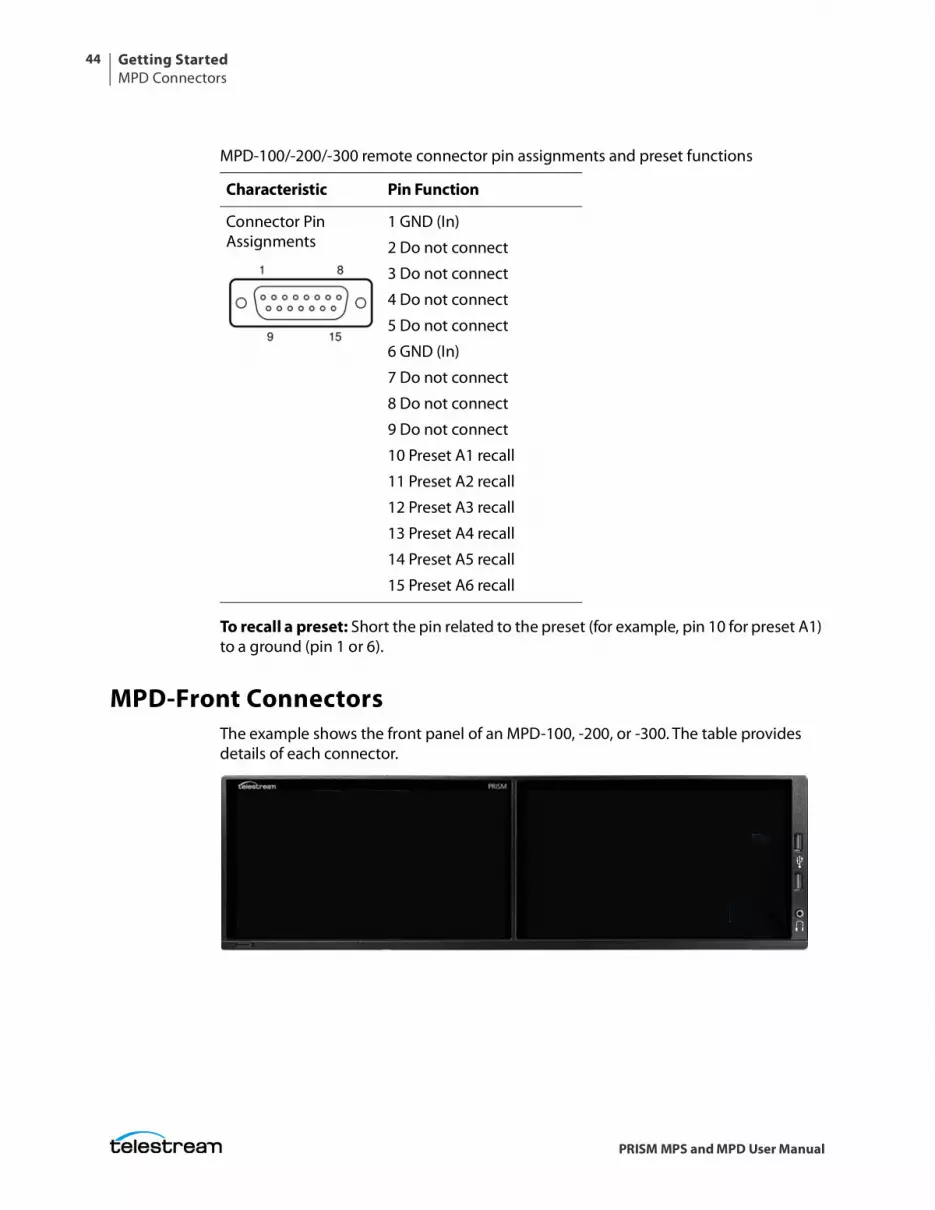
To recall a preset: Short the pin related to the preset (for example, pin 10 for preset A1) to a ground (pin 1 or 6).
MPD-Front ConnectorsThe example shows the front panel of an MPD-100, -200, or -300. The table provides details of each connector.
MPD-100/-200/-300 remote connector pin assignments and preset functions
Characteristic Pin Function
Connector Pin Assignments
1 GND (In)
2 Do not connect
3 Do not connect
4 Do not connect
5 Do not connect
6 GND (In)
7 Do not connect
8 Do not connect
9 Do not connect
10 Preset A1 recall
11 Preset A2 recall
12 Preset A3 recall
13 Preset A4 recall
14 Preset A5 recall
15 Preset A6 recall
Getting StartedMPD Connectors
45
PRISM MPS and MPD User Manual
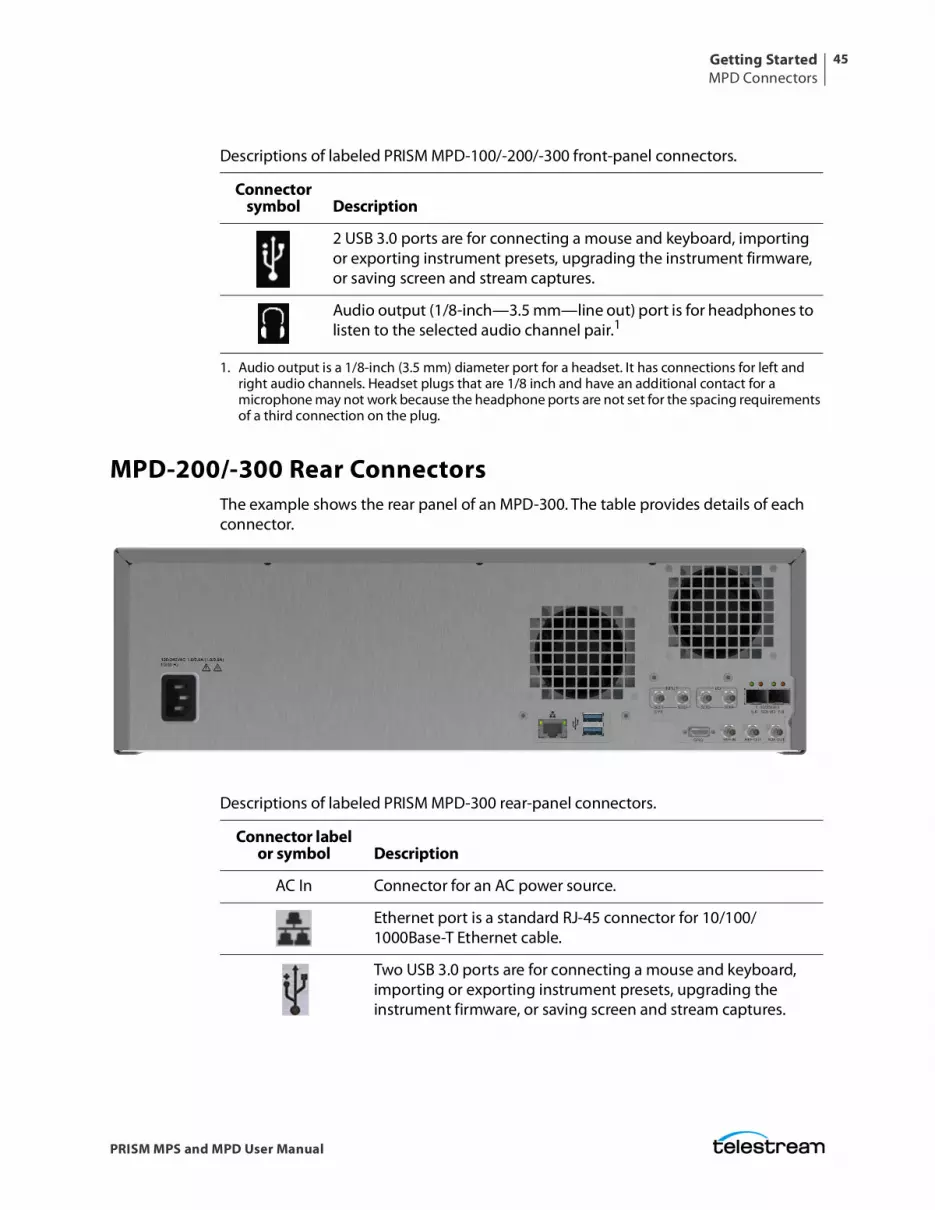
MPD-200/-300 Rear ConnectorsThe example shows the rear panel of an MPD-300. The table provides details of each connector.
Descriptions of labeled PRISM MPD-100/-200/-300 front-panel connectors.
Connector symbol Description
2 USB 3.0 ports are for connecting a mouse and keyboard, importing or exporting instrument presets, upgrading the instrument firmware, or saving screen and stream captures.
Audio output (1/8-inch—3.5 mm—line out) port is for headphones to listen to the selected audio channel pair.1
1. Audio output is a 1/8-inch (3.5 mm) diameter port for a headset. It has connections for left and right audio channels. Headset plugs that are 1/8 inch and have an additional contact for a microphone may not work because the headphone ports are not set for the spacing requirements of a third connection on the plug.
Descriptions of labeled PRISM MPD-300 rear-panel connectors.
Connector label or symbol Description
AC In Connector for an AC power source.
Ethernet port is a standard RJ-45 connector for 10/100/1000Base-T Ethernet cable.
Two USB 3.0 ports are for connecting a mouse and keyboard, importing or exporting instrument presets, upgrading the instrument firmware, or saving screen and stream captures.
Getting StartedMPD Connectors
46
PRISM MPS and MPD User Manual
SDI1
(EYE in MPD-300 only)
SDI 1 can operate in these modes:
• Input only supporting SD, HD, 3G, 6G, or 12G signals.• Quad Link 4K and 8K input when used in conjunction with SDI
inputs 1-4 (options MPSDP-FMT-4K and MPSDP-FMT-8K)• MPD-300 only: Eye diagram up to 12G for physical layer
measurements, including automated measurements of SDI eye pattern parameters.
SDI2 SDI2 can operate in these modes:
• Input only supporting SD, HD, 3G, 6G, or 12G signals• Quad Link 4K and 8K input when used in conjunction with SDI
inputs 1-4 (options MPSDP-FMT-4K and MPSDP-FMT-8K)
SDI3 SDI3 I/O can operate in these modes:
• Input supporting SD, HD, 3G, 6G, or 12G signals• Output loop-through of SDI 1 input• Quad Link 4K and 8K input when used in conjunction with SDI
inputs 1-4 (options MPSDP-FMT-4K and MPSDP-FMT-8K)
SDI4 SDI4 I/O can operate in these modes:
• Input only supporting SD, HD, 3G, 6G, or 12G signals• Output loop-through of SDI 2 input• Quad Link 4K and 8K input when used in conjunction with SDI
inputs 1-4 (options MPSDP-FMT-4K and MPSDP-FMT-8K)
10/25GE
SDI I/O
SFP module slots can be configured for IP or SDI applications.
• 10/25GE: Two optional SFP+ ports are for 10/25GE Ethernet applications. See MP-SFP products for available modules.
• SDI I/O (this configuration is for future functionality): Two optional SFP+ ports can provide up to four SDI signal loop-through outputs, up to 12G for future functionality.
GPIO GPIO is a 15-pin, micro D-sub connector, see MPD-100/-200/-300 remote connector pin assignments and preset functions.
REF IN Used for analog reference signals black burst and tri-level sync for locking
Descriptions of labeled PRISM MPD-300 rear-panel connectors.
Connector label or symbol Description
Getting StartedMPD Connectors
47
PRISM MPS and MPD User Manual
REF OUTNote: This is a dual-purpose output that can be controlled in the UI to set to REF OUT or PPS.
• REF OUT is a pass through of the REF IN. • PPS connector outputs a 1 PPS (pulse per second) signal when
the instrument is locked to a PTP reference. 3.3v drive. TTL compatible.
AUX OUT AUX OUT is for SDI output of the selected SDI, ST2022, or ST2110 input; or it is an SDI generator output (GEN license is required):
• For Quad Link inputs (4K or 8K) the AUX OUT is link 1.• ST2110-20/30 inputs are supported.
Descriptions of labeled PRISM MPD-300 rear-panel connectors.
Connector label or symbol Description
Getting StartedDisplay Elements
48
PRISM MPS and MPD User Manual
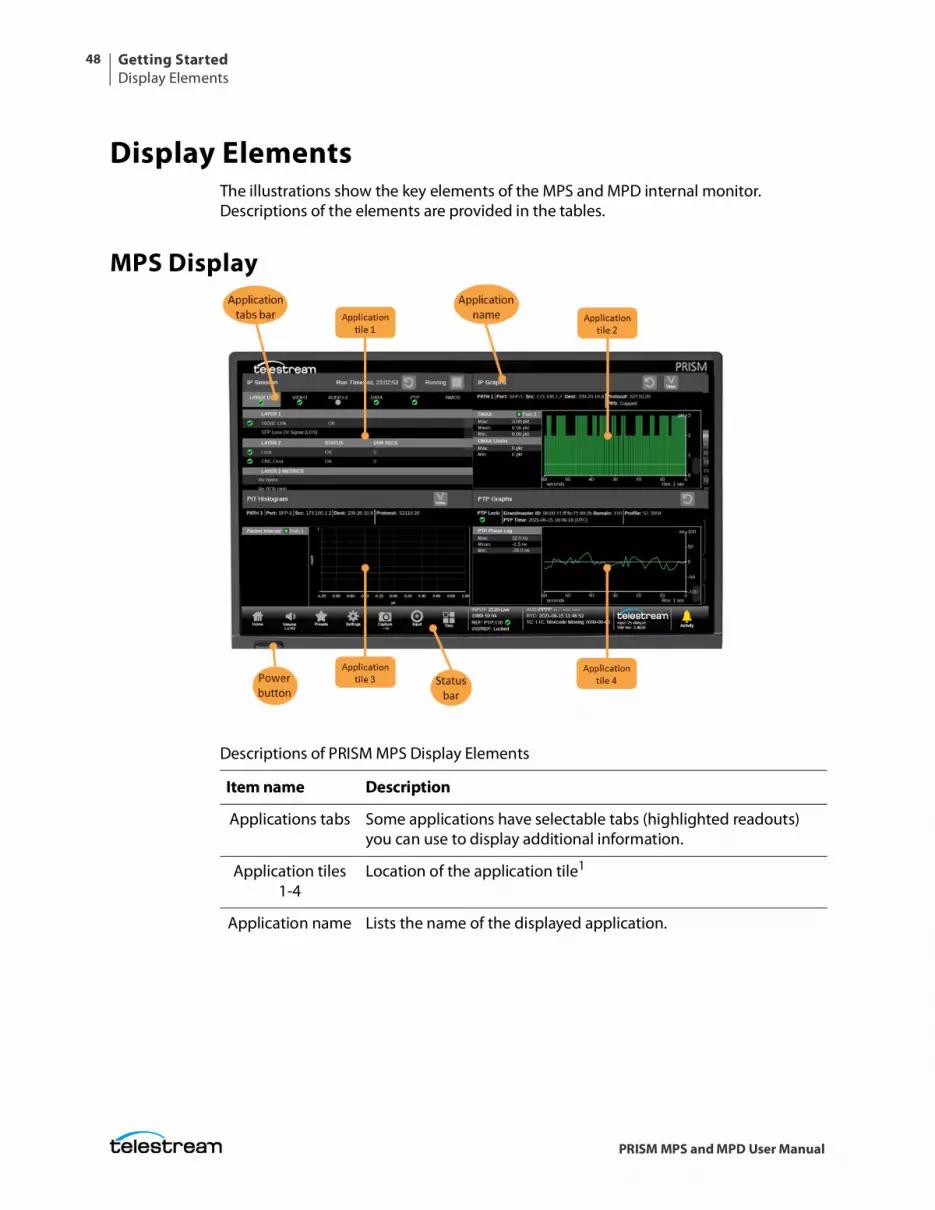
Display ElementsThe illustrations show the key elements of the MPS and MPD internal monitor. Descriptions of the elements are provided in the tables.
MPS Display
Descriptions of PRISM MPS Display Elements
Item name Description
Applications tabs Some applications have selectable tabs (highlighted readouts) you can use to display additional information.
Application tiles 1-4
Location of the application tile1
Application name Lists the name of the displayed application.
Getting StartedDisplay Elements
49
PRISM MPS and MPD User Manual
1 The application tiles can be in quarter-screen display, half-screen display, or one application in full-screen display.
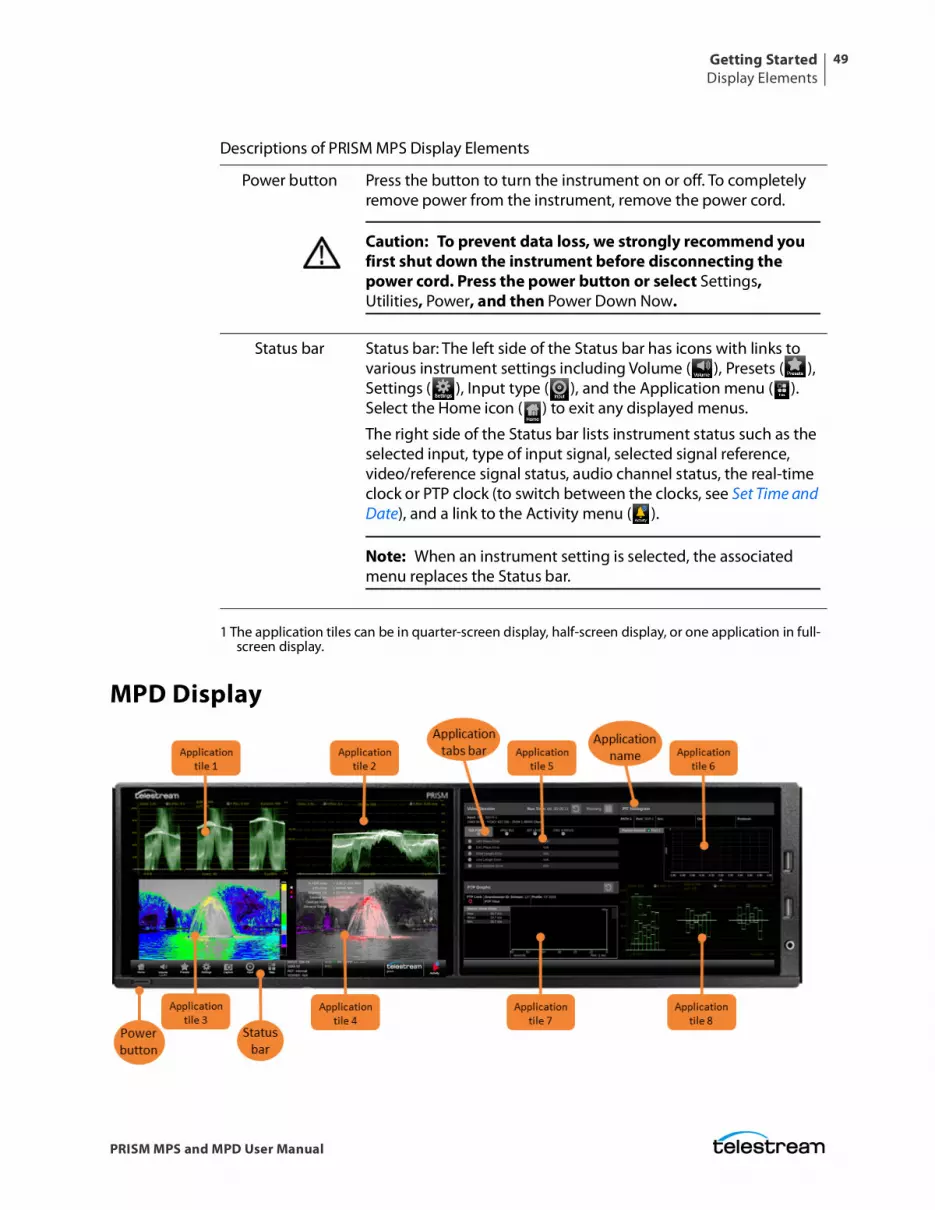
MPD Display
Power button Press the button to turn the instrument on or off. To completely remove power from the instrument, remove the power cord.
Caution: To prevent data loss, we strongly recommend you first shut down the instrument before disconnecting the power cord. Press the power button or select Settings, Utilities, Power, and then Power Down Now.
Status bar Status bar: The left side of the Status bar has icons with links to various instrument settings including Volume ( ), Presets ( ), Settings ( ), Input type ( ), and the Application menu ( ). Select the Home icon ( ) to exit any displayed menus.
The right side of the Status bar lists instrument status such as the selected input, type of input signal, selected signal reference, video/reference signal status, audio channel status, the real-time clock or PTP clock (to switch between the clocks, see Set Time and Date), and a link to the Activity menu ( ).
Note: When an instrument setting is selected, the associated menu replaces the Status bar.
Descriptions of PRISM MPS Display Elements
Getting StartedDisplay Elements
50
PRISM MPS and MPD User Manual
Descriptions of PRISM MPD display elements
Item name Description
Application tiles 1-8
Location of the application tile1
1. The application tiles can be in quarter-screen display, half-screen display, or one application in full-screen display.
Power button Press the button to turn the instrument on or off. To completely remove power from the instrument, remove the power cord.
Caution: To prevent data loss, we strongly recommend you first shut down the instrument before disconnecting the power cord. Press the power button or select Settings, Utilities, Power, and then Power Down Now.
Status bar The left side of the Status bar has icons with links to various instrument settings including volume ( ), presets ( ), global settings ( ), input type ( ), and the tile application menu ( ). Select the Home icon ( ) to exit any displayed menus.
The right side of the Status bar lists instrument status such as the selected input, type of input signal, selected signal reference, video/reference signal status, audio channel status, the real-time clock or PTP clock (to change the Status bar clock, see Change Status Bar Clock), and a link to the Activity menu ( ).
Note: When an instrument setting is selected, the menu appears and the Status bar moves to the right. If another instrument setting is selected on the Status bar, the selected menu replaces the Status bar.
Application tabs
Some applications have selectable tabs (highlighted readouts) you can use to display additional information.
Application name:
Lists the name of the displayed application.
Getting StartedDisplay Elements
51
PRISM MPS and MPD User Manual
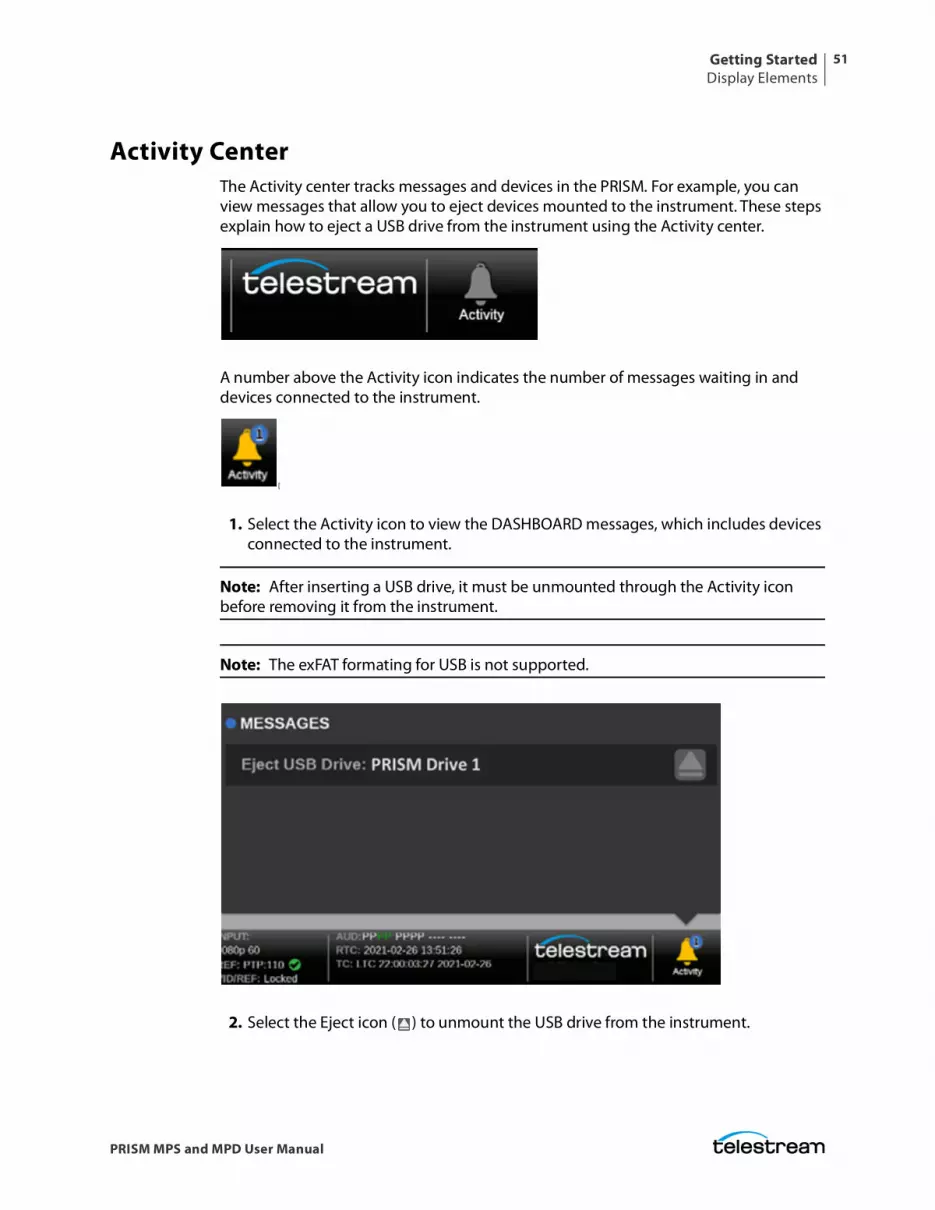
Activity CenterThe Activity center tracks messages and devices in the PRISM. For example, you can view messages that allow you to eject devices mounted to the instrument. These steps explain how to eject a USB drive from the instrument using the Activity center.
A number above the Activity icon indicates the number of messages waiting in and devices connected to the instrument.
[
1. Select the Activity icon to view the DASHBOARD messages, which includes devices connected to the instrument.
Note: After inserting a USB drive, it must be unmounted through the Activity icon before removing it from the instrument.
Note: The exFAT formating for USB is not supported.
2. Select the Eject icon ( ) to unmount the USB drive from the instrument.
Getting StartedDisplay Elements
52
PRISM MPS and MPD User Manual
Note: If there is no USB drive in the instrument, the Eject USB Drive text and eject icon do not appear.
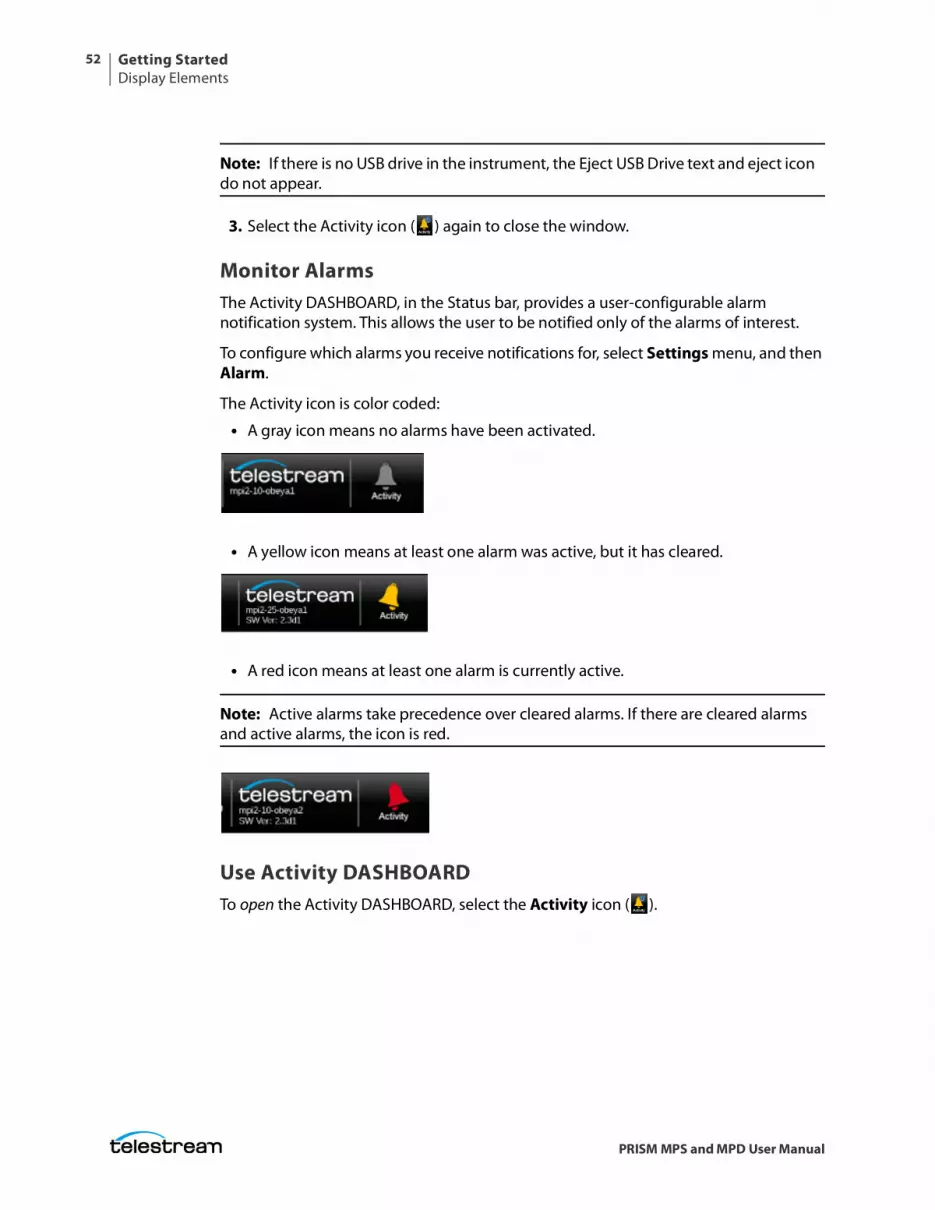
3. Select the Activity icon ( ) again to close the window.
Monitor AlarmsThe Activity DASHBOARD, in the Status bar, provides a user-configurable alarm notification system. This allows the user to be notified only of the alarms of interest.
To configure which alarms you receive notifications for, select Settings menu, and then Alarm.
The Activity icon is color coded:
• A gray icon means no alarms have been activated.
• A yellow icon means at least one alarm was active, but it has cleared.
• A red icon means at least one alarm is currently active.
Note: Active alarms take precedence over cleared alarms. If there are cleared alarms and active alarms, the icon is red.
Use Activity DASHBOARDTo open the Activity DASHBOARD, select the Activity icon ( ).
Getting StartedDisplay Elements
53
PRISM MPS and MPD User Manual
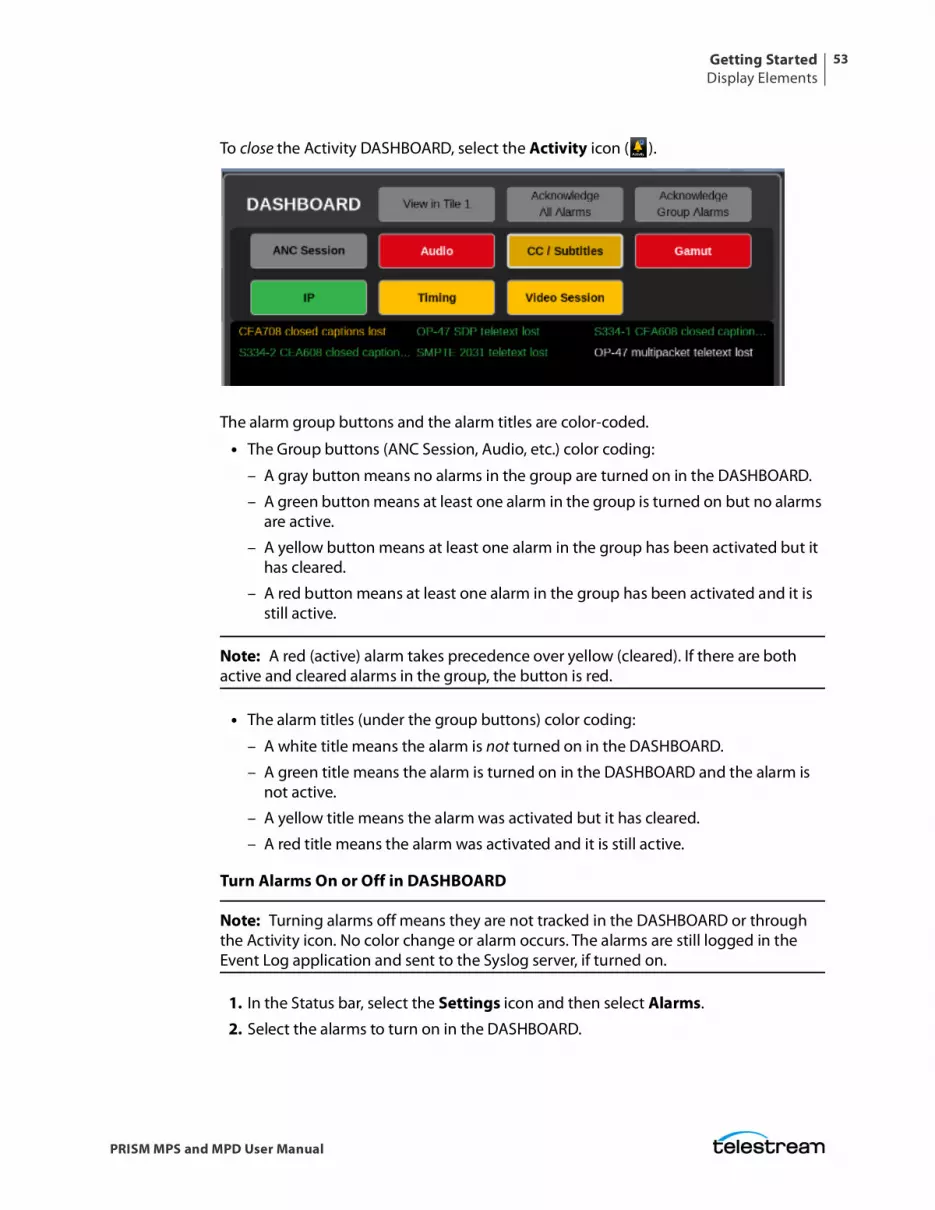
To close the Activity DASHBOARD, select the Activity icon ( ).
The alarm group buttons and the alarm titles are color-coded.
• The Group buttons (ANC Session, Audio, etc.) color coding:
– A gray button means no alarms in the group are turned on in the DASHBOARD.
– A green button means at least one alarm in the group is turned on but no alarms are active.
– A yellow button means at least one alarm in the group has been activated but it has cleared.
– A red button means at least one alarm in the group has been activated and it is still active.
Note: A red (active) alarm takes precedence over yellow (cleared). If there are both active and cleared alarms in the group, the button is red.
• The alarm titles (under the group buttons) color coding:
– A white title means the alarm is not turned on in the DASHBOARD.
– A green title means the alarm is turned on in the DASHBOARD and the alarm is not active.
– A yellow title means the alarm was activated but it has cleared.
– A red title means the alarm was activated and it is still active.
Turn Alarms On or Off in DASHBOARD
Note: Turning alarms off means they are not tracked in the DASHBOARD or through the Activity icon. No color change or alarm occurs. The alarms are still logged in the Event Log application and sent to the Syslog server, if turned on.
1. In the Status bar, select the Settings icon and then select Alarms.
2. Select the alarms to turn on in the DASHBOARD.
Getting StartedDisplay Elements
54
PRISM MPS and MPD User Manual
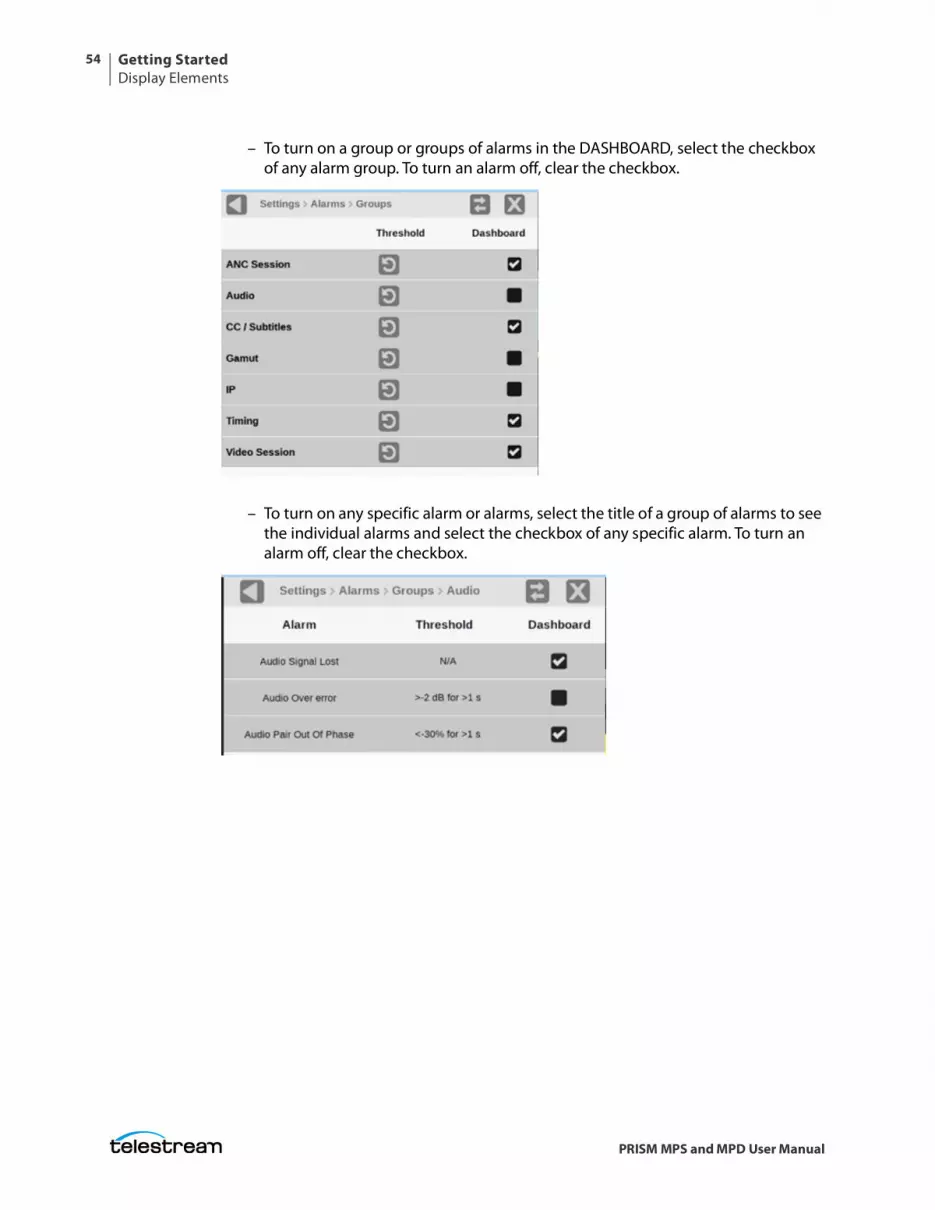
– To turn on a group or groups of alarms in the DASHBOARD, select the checkbox of any alarm group. To turn an alarm off, clear the checkbox.
– To turn on any specific alarm or alarms, select the title of a group of alarms to see the individual alarms and select the checkbox of any specific alarm. To turn an alarm off, clear the checkbox.
Getting StartedDisplay Elements
55
PRISM MPS and MPD User Manual
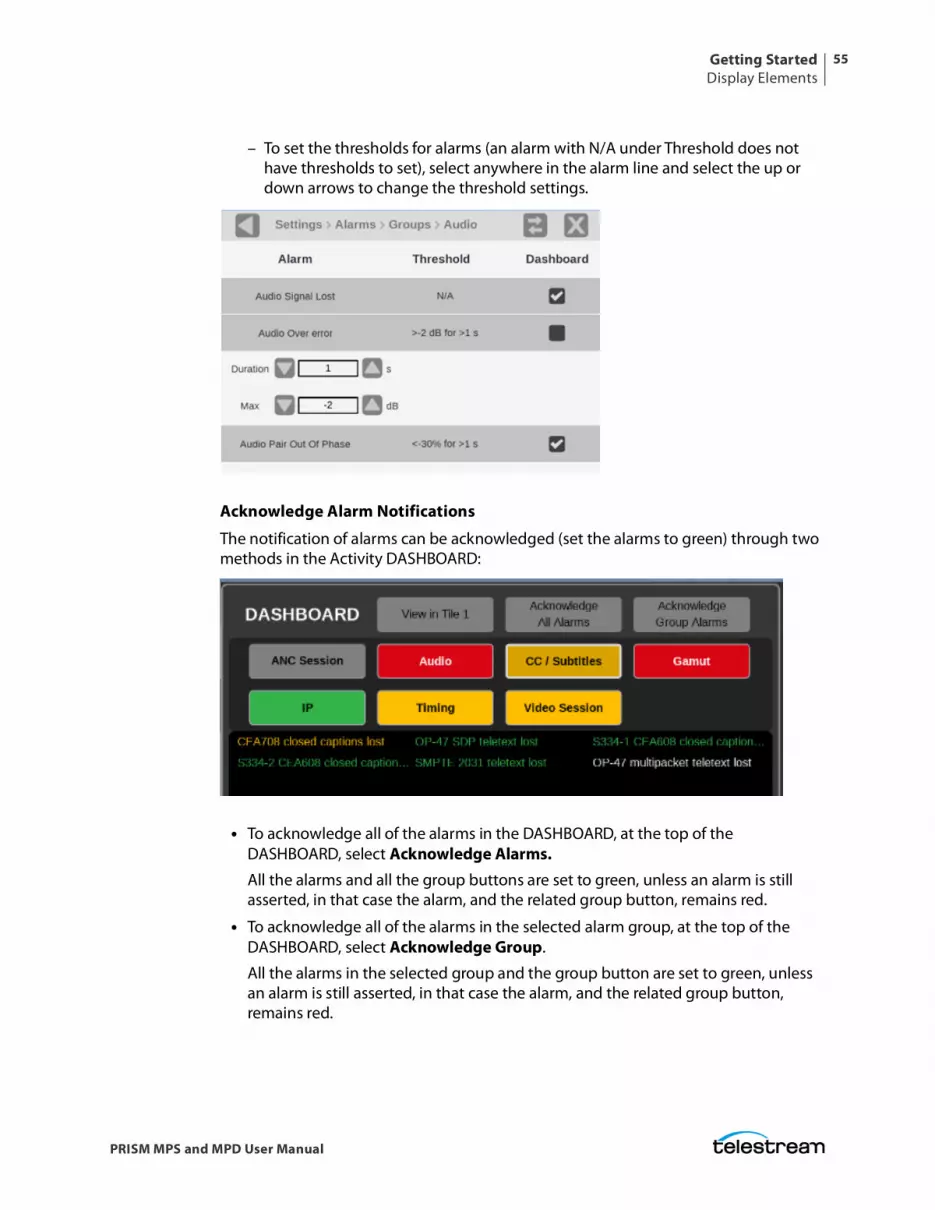
– To set the thresholds for alarms (an alarm with N/A under Threshold does not have thresholds to set), select anywhere in the alarm line and select the up or down arrows to change the threshold settings.
Acknowledge Alarm Notifications
The notification of alarms can be acknowledged (set the alarms to green) through two methods in the Activity DASHBOARD:
• To acknowledge all of the alarms in the DASHBOARD, at the top of the DASHBOARD, select Acknowledge Alarms.All the alarms and all the group buttons are set to green, unless an alarm is still asserted, in that case the alarm, and the related group button, remains red.
• To acknowledge all of the alarms in the selected alarm group, at the top of the DASHBOARD, select Acknowledge Group.
All the alarms in the selected group and the group button are set to green, unless an alarm is still asserted, in that case the alarm, and the related group button, remains red.
Getting StartedDisplay Elements
56
PRISM MPS and MPD User Manual
Use Alarm Groups
Choose Alarm Group
Select the group button from the options under the DASHBOARD header (ANC Session, Audio, etc.). The alarm group is circled in white and the alarms in that group appear under the group buttons.
See Alarms in Event Log Application
Select View in tile 1 at the top of the DASHBOARD.
• The Event Log application displays in tile 1.
• The errors are filtered by the group currently selected Dashboard Alarm Group.
Filter Event Log Alarms by Group
Select an alarm group and select View in tile 1.
Methods of Operation 57
PRISM MPS and MPD User Manual
Methods of Operation
This section describes the primary methods of operating the instrument:
• MPS and MPD front panel touchscreen
• External touchscreen display
• Keyboard and mouse
• Remote control using VNC
• Remote control using API commands
Methods of OperationTouchscreen Operation
58
PRISM MPS and MPD User Manual
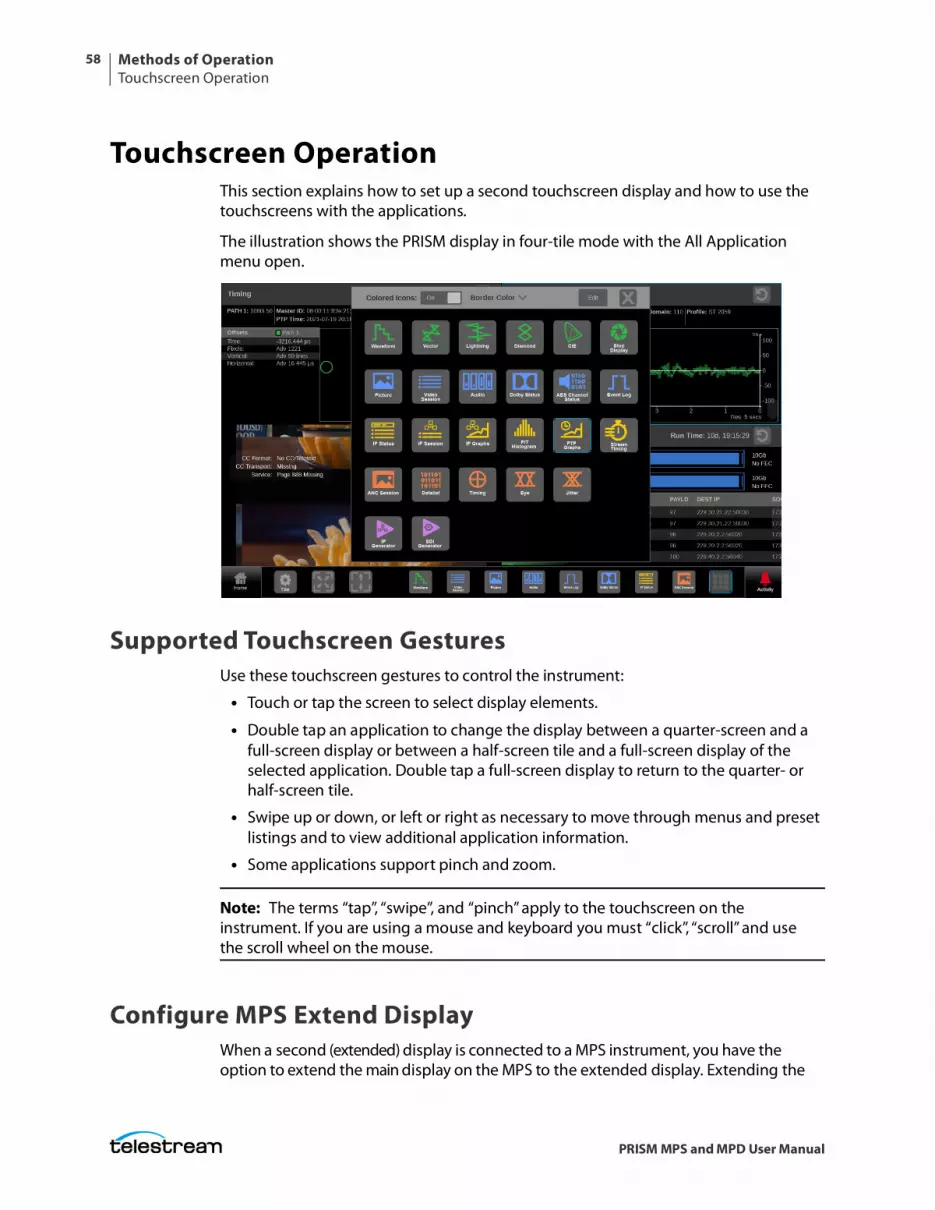
Touchscreen OperationThis section explains how to set up a second touchscreen display and how to use the touchscreens with the applications.
The illustration shows the PRISM display in four-tile mode with the All Application menu open.
Supported Touchscreen GesturesUse these touchscreen gestures to control the instrument:
• Touch or tap the screen to select display elements.
• Double tap an application to change the display between a quarter-screen and a full-screen display or between a half-screen tile and a full-screen display of the selected application. Double tap a full-screen display to return to the quarter- or half-screen tile.
• Swipe up or down, or left or right as necessary to move through menus and preset listings and to view additional application information.
• Some applications support pinch and zoom.
Note: The terms “tap”, “swipe”, and “pinch” apply to the touchscreen on the instrument. If you are using a mouse and keyboard you must “click”, “scroll” and use the scroll wheel on the mouse.
Configure MPS Extend DisplayWhen a second (extended) display is connected to a MPS instrument, you have the option to extend the main display on the MPS to the extended display. Extending the
Methods of OperationTouchscreen Operation
59
PRISM MPS and MPD User Manual
display increases the number of application tiles in your workspace. Using the extended display function requires software option MPDSP-EXTNDSP; without the option the main display is duplicated onto the extended display.
1. Connect the MPS to the extended display and power on both products. (See PRISM MPS Rack Accessory Installation Instructions.)
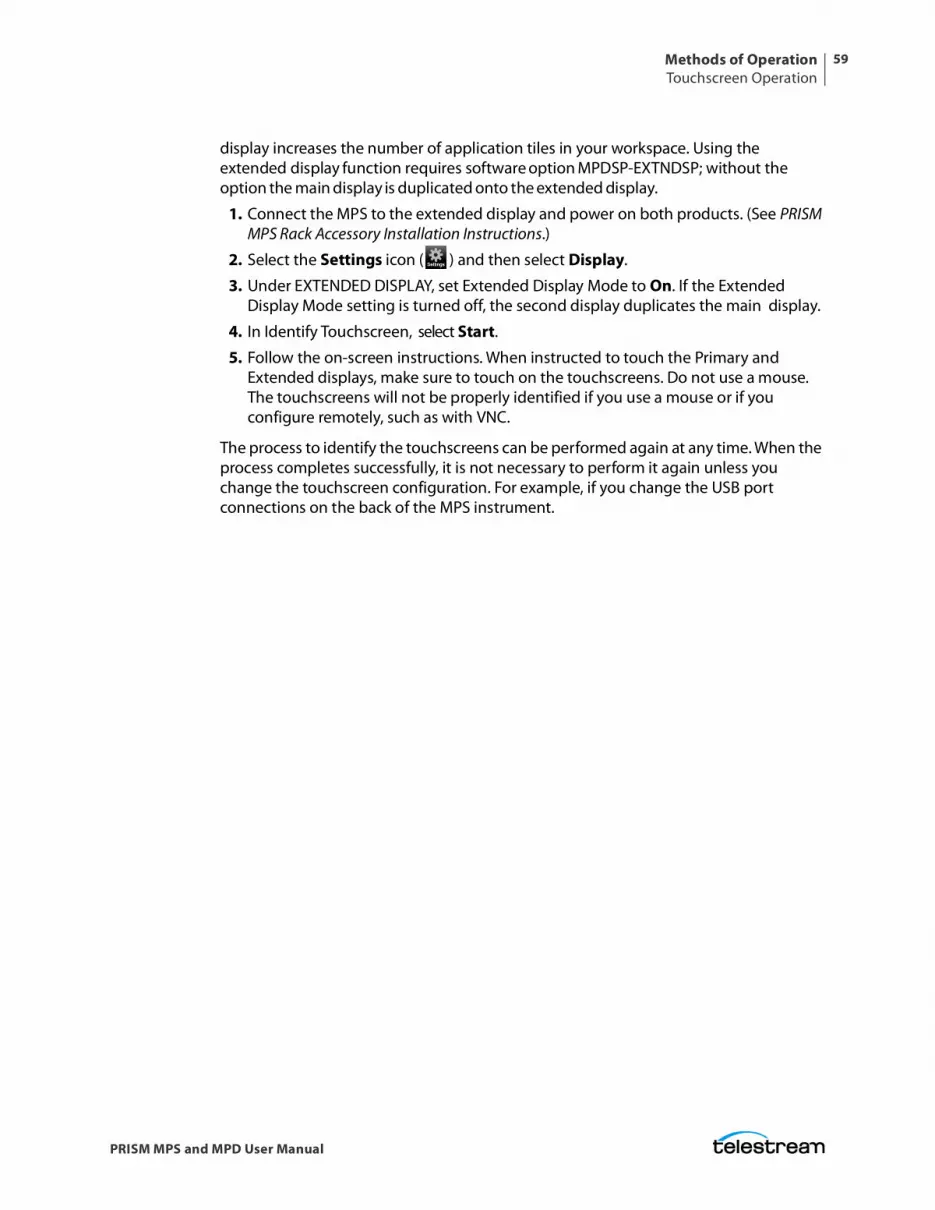
2. Select the Settings icon ( ) and then select Display.
3. Under EXTENDED DISPLAY, set Extended Display Mode to On. If the Extended Display Mode setting is turned off, the second display duplicates the main display.
4. In Identify Touchscreen, select Start.
5. Follow the on-screen instructions. When instructed to touch the Primary and Extended displays, make sure to touch on the touchscreens. Do not use a mouse. The touchscreens will not be properly identified if you use a mouse or if you configure remotely, such as with VNC.
The process to identify the touchscreens can be performed again at any time. When the process completes successfully, it is not necessary to perform it again unless you change the touchscreen configuration. For example, if you change the USB port connections on the back of the MPS instrument.
Methods of OperationSelect and Organize Applications
60
PRISM MPS and MPD User Manual
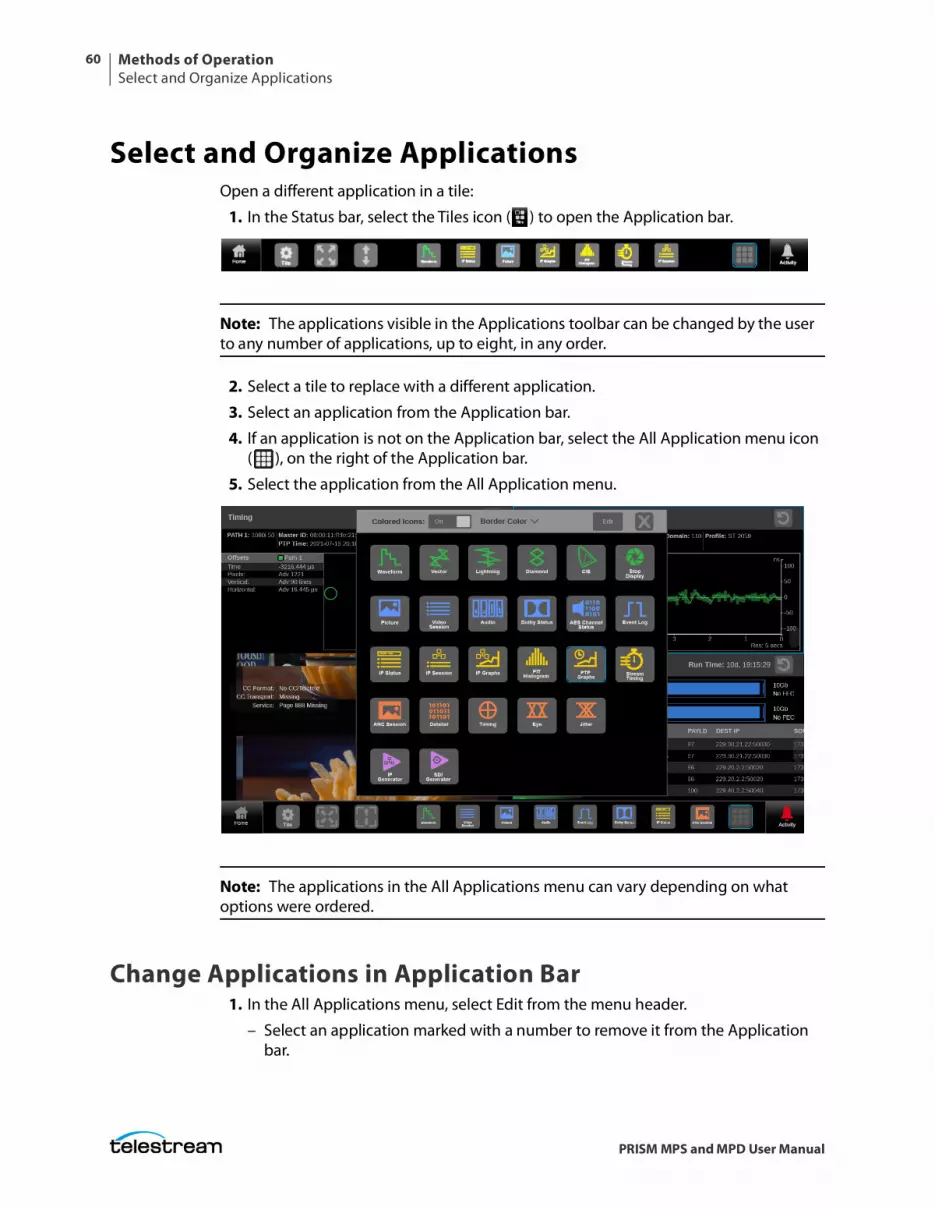
Select and Organize ApplicationsOpen a different application in a tile:
1. In the Status bar, select the Tiles icon ( ) to open the Application bar.
Note: The applications visible in the Applications toolbar can be changed by the user to any number of applications, up to eight, in any order.
2. Select a tile to replace with a different application.
3. Select an application from the Application bar.
4. If an application is not on the Application bar, select the All Application menu icon ( ), on the right of the Application bar.
5. Select the application from the All Application menu.
Note: The applications in the All Applications menu can vary depending on what options were ordered.
Change Applications in Application Bar1. In the All Applications menu, select Edit from the menu header.
– Select an application marked with a number to remove it from the Application bar.
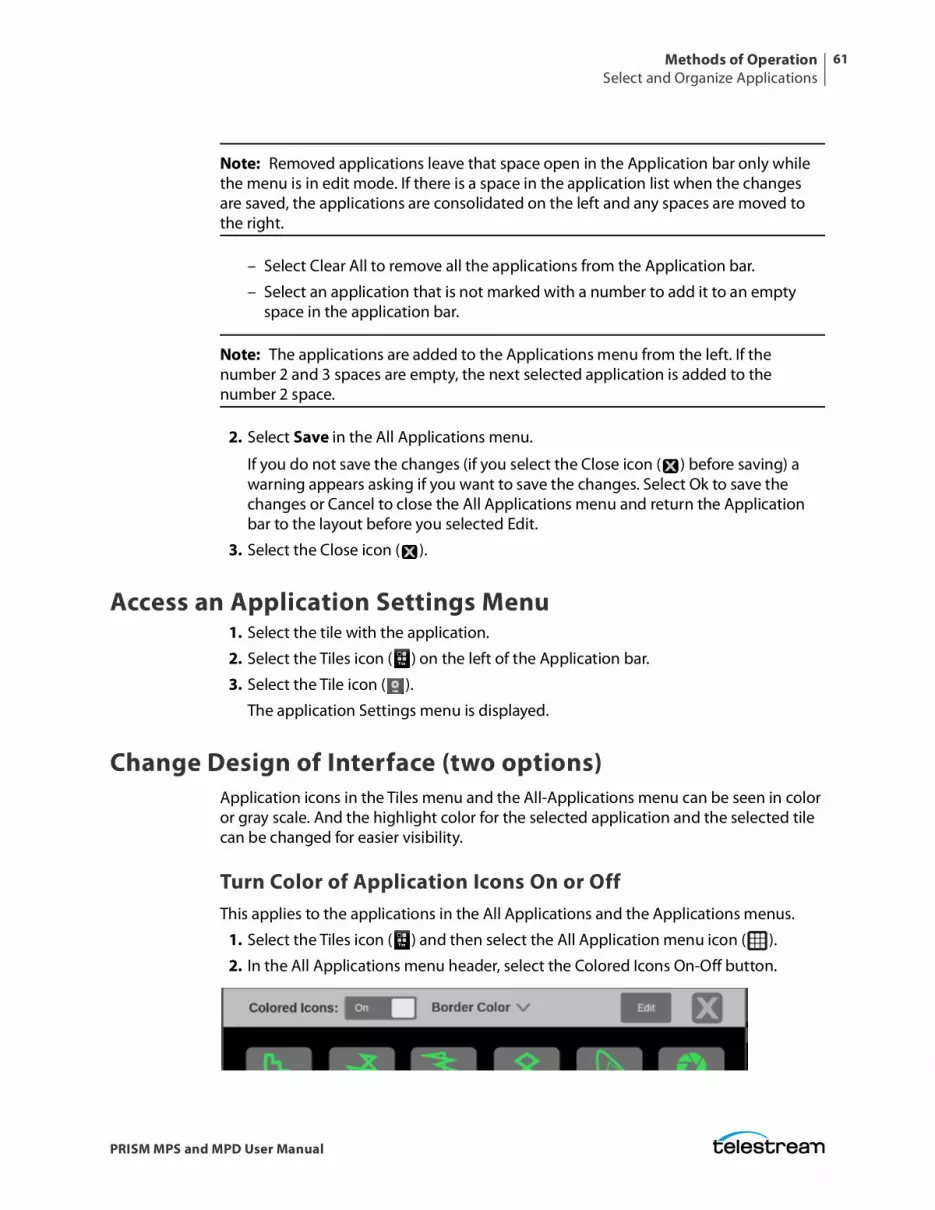
Methods of OperationSelect and Organize Applications
61
PRISM MPS and MPD User Manual
Note: Removed applications leave that space open in the Application bar only while the menu is in edit mode. If there is a space in the application list when the changes are saved, the applications are consolidated on the left and any spaces are moved to the right.
– Select Clear All to remove all the applications from the Application bar.
– Select an application that is not marked with a number to add it to an empty space in the application bar.
Note: The applications are added to the Applications menu from the left. If the number 2 and 3 spaces are empty, the next selected application is added to the number 2 space.
2. Select Save in the All Applications menu.
If you do not save the changes (if you select the Close icon ( ) before saving) a warning appears asking if you want to save the changes. Select Ok to save the changes or Cancel to close the All Applications menu and return the Application bar to the layout before you selected Edit.
3. Select the Close icon ( ).
Access an Application Settings Menu1. Select the tile with the application.
2. Select the Tiles icon ( ) on the left of the Application bar.
3. Select the Tile icon ( ).
The application Settings menu is displayed.
Change Design of Interface (two options)Application icons in the Tiles menu and the All-Applications menu can be seen in color or gray scale. And the highlight color for the selected application and the selected tile can be changed for easier visibility.
Turn Color of Application Icons On or Off This applies to the applications in the All Applications and the Applications menus.
1. Select the Tiles icon ( ) and then select the All Application menu icon ( ).
2. In the All Applications menu header, select the Colored Icons On-Off button.
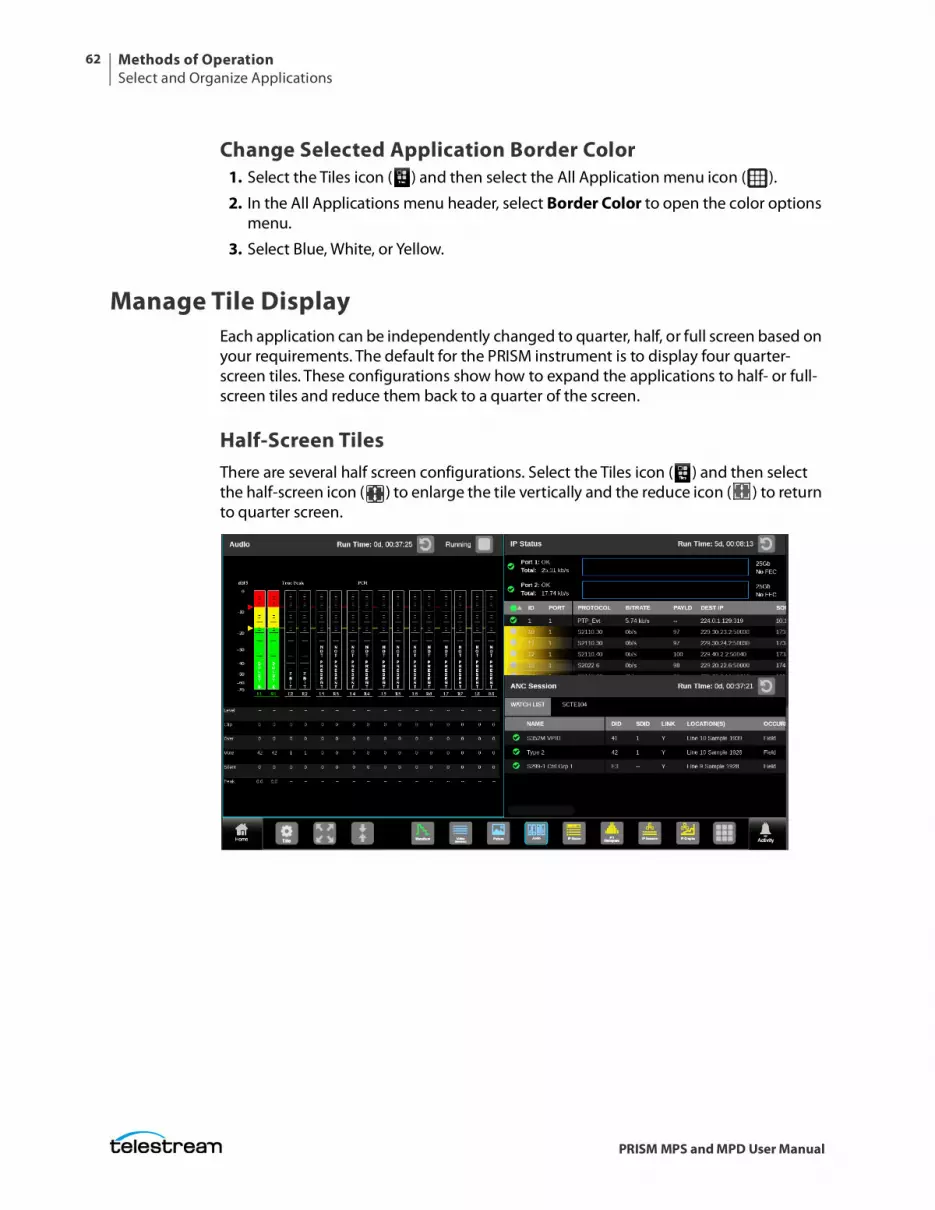
Methods of OperationSelect and Organize Applications
62
PRISM MPS and MPD User Manual
Change Selected Application Border Color1. Select the Tiles icon ( ) and then select the All Application menu icon ( ).
2. In the All Applications menu header, select Border Color to open the color options menu.
3. Select Blue, White, or Yellow.
Manage Tile DisplayEach application can be independently changed to quarter, half, or full screen based on your requirements. The default for the PRISM instrument is to display four quarter-screen tiles. These configurations show how to expand the applications to half- or full-screen tiles and reduce them back to a quarter of the screen.
Half-Screen TilesThere are several half screen configurations. Select the Tiles icon ( ) and then select the half-screen icon ( ) to enlarge the tile vertically and the reduce icon ( ) to return to quarter screen.
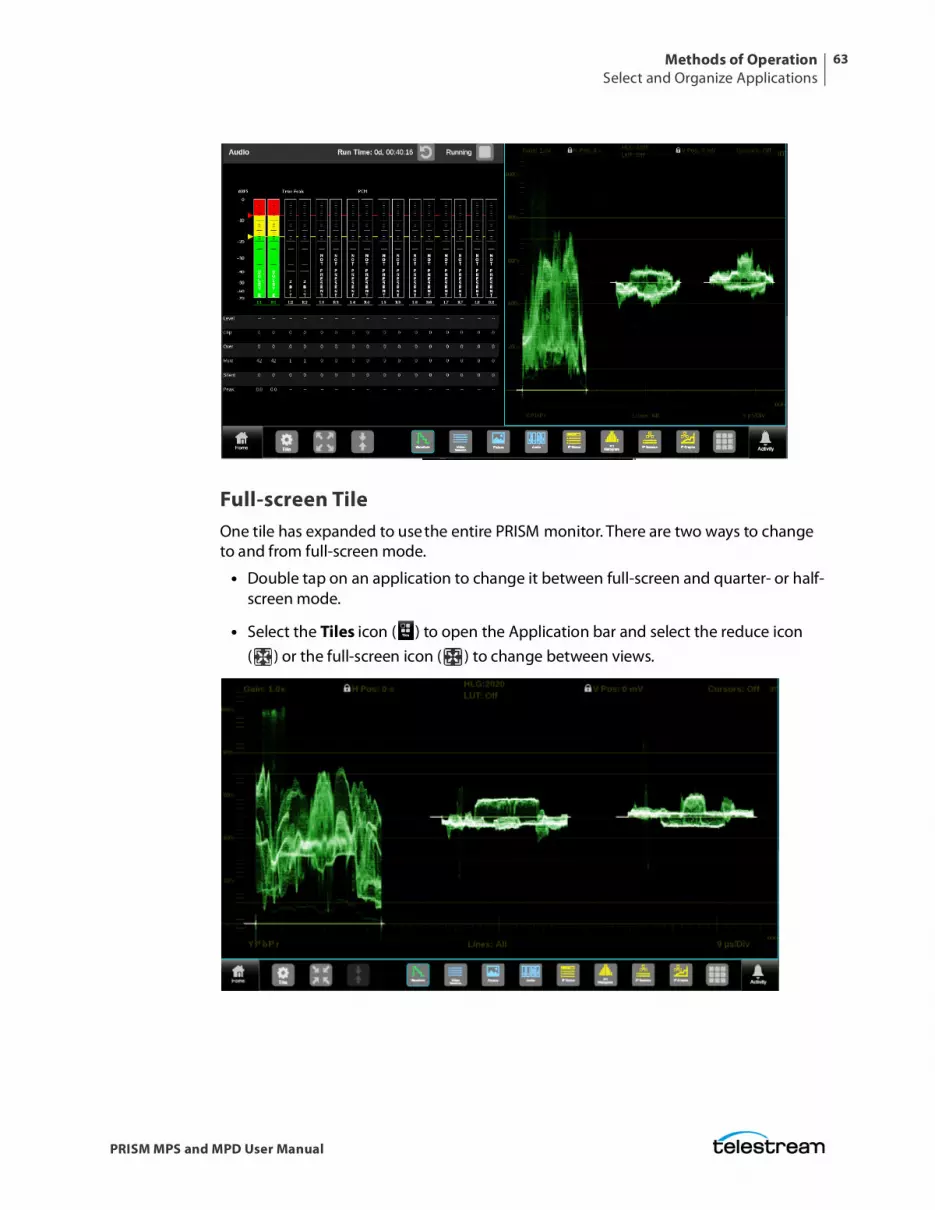
Methods of OperationSelect and Organize Applications
63
PRISM MPS and MPD User Manual
Full-screen TileOne tile has expanded to use the entire PRISM monitor. There are two ways to change to and from full-screen mode.
• Double tap on an application to change it between full-screen and quarter- or half-screen mode.
• Select the Tiles icon ( ) to open the Application bar and select the reduce icon ( ) or the full-screen icon ( ) to change between views.
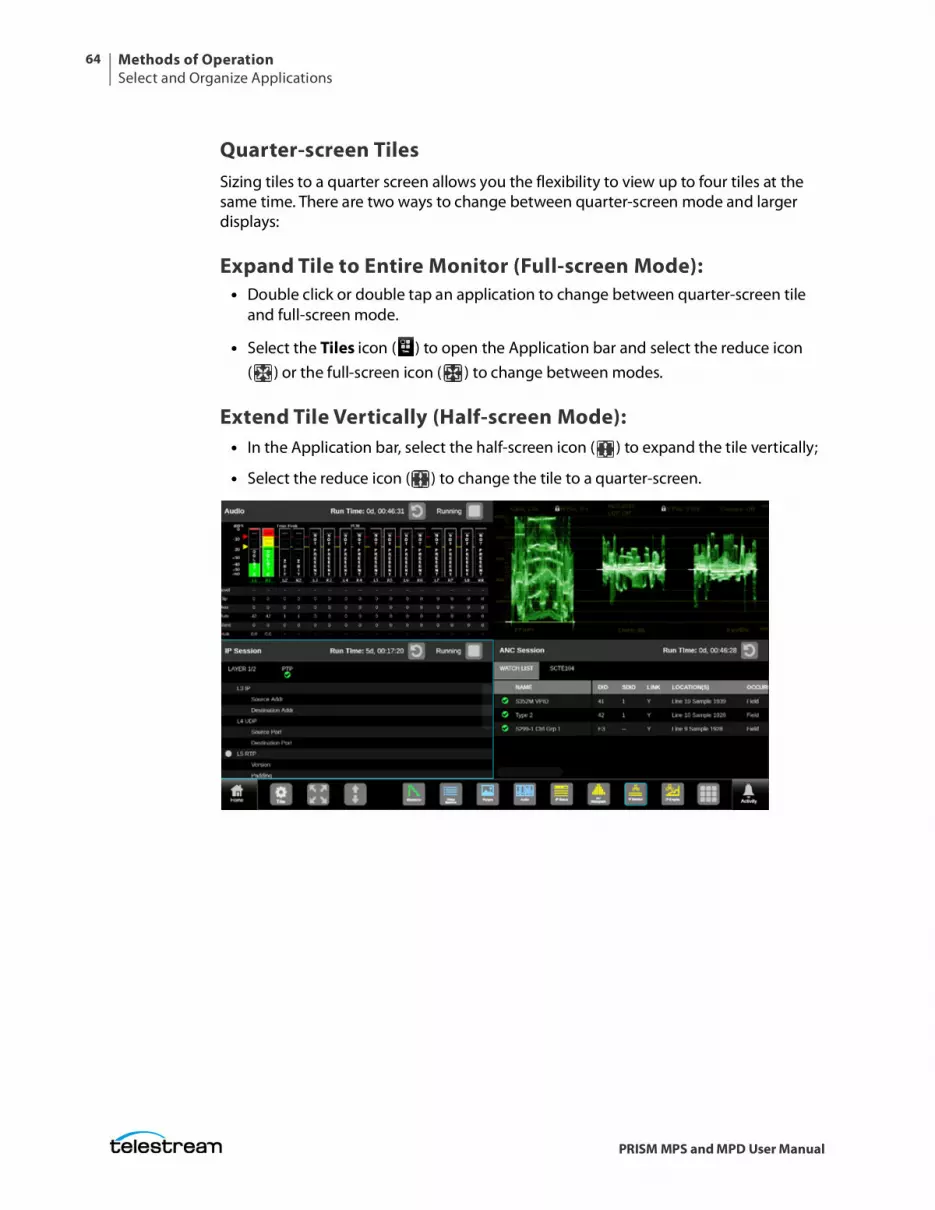
Methods of OperationSelect and Organize Applications
64
PRISM MPS and MPD User Manual
Quarter-screen TilesSizing tiles to a quarter screen allows you the flexibility to view up to four tiles at the same time. There are two ways to change between quarter-screen mode and larger displays:
Expand Tile to Entire Monitor (Full-screen Mode): • Double click or double tap an application to change between quarter-screen tile
and full-screen mode.
• Select the Tiles icon ( ) to open the Application bar and select the reduce icon ( ) or the full-screen icon ( ) to change between modes.
Extend Tile Vertically (Half-screen Mode): • In the Application bar, select the half-screen icon ( ) to expand the tile vertically;
• Select the reduce icon ( ) to change the tile to a quarter-screen.
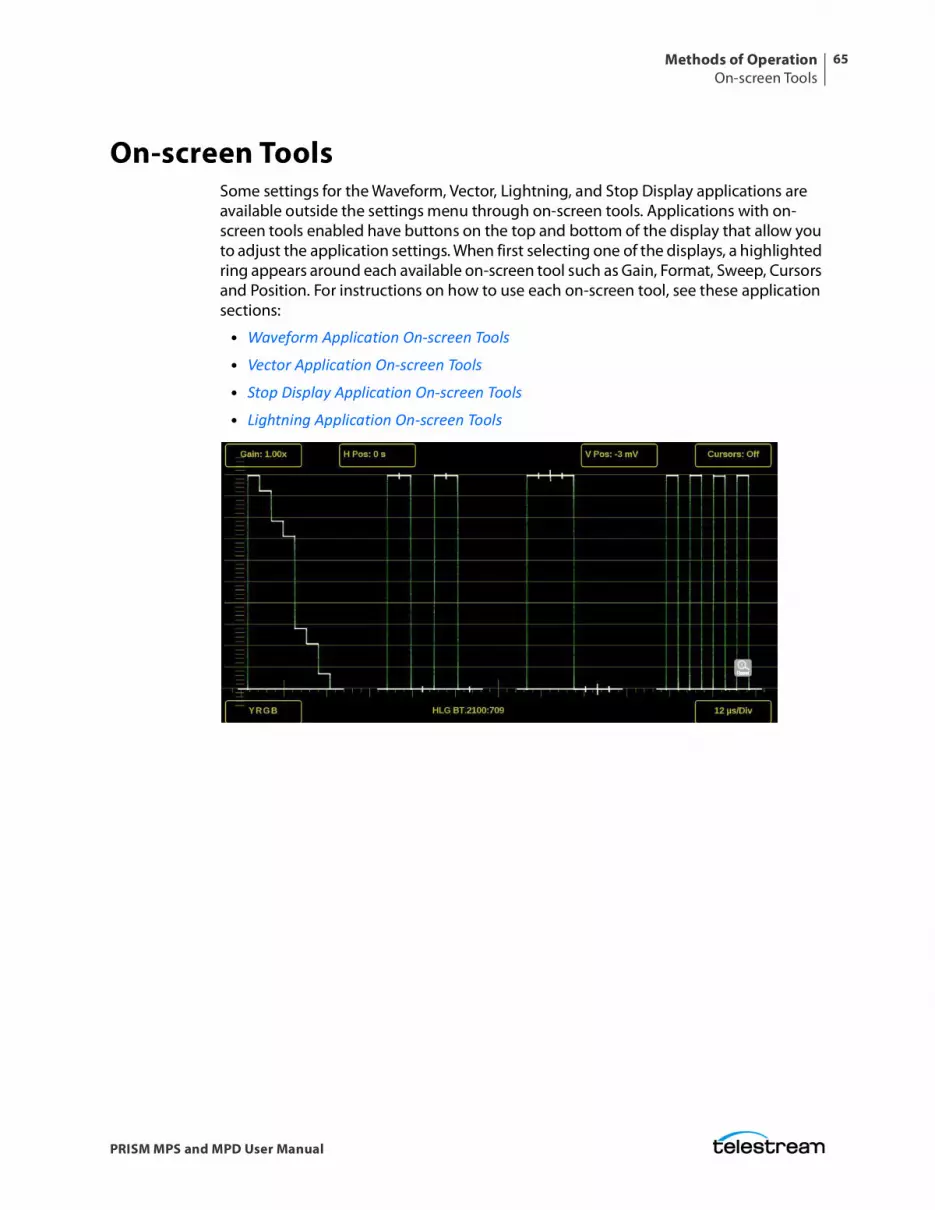
Methods of OperationOn-screen Tools
65
PRISM MPS and MPD User Manual
On-screen ToolsSome settings for the Waveform, Vector, Lightning, and Stop Display applications are available outside the settings menu through on-screen tools. Applications with on-screen tools enabled have buttons on the top and bottom of the display that allow you to adjust the application settings. When first selecting one of the displays, a highlighted ring appears around each available on-screen tool such as Gain, Format, Sweep, Cursors and Position. For instructions on how to use each on-screen tool, see these application sections:
• Waveform Application On-screen Tools
• Vector Application On-screen Tools
• Stop Display Application On-screen Tools
• Lightning Application On-screen Tools
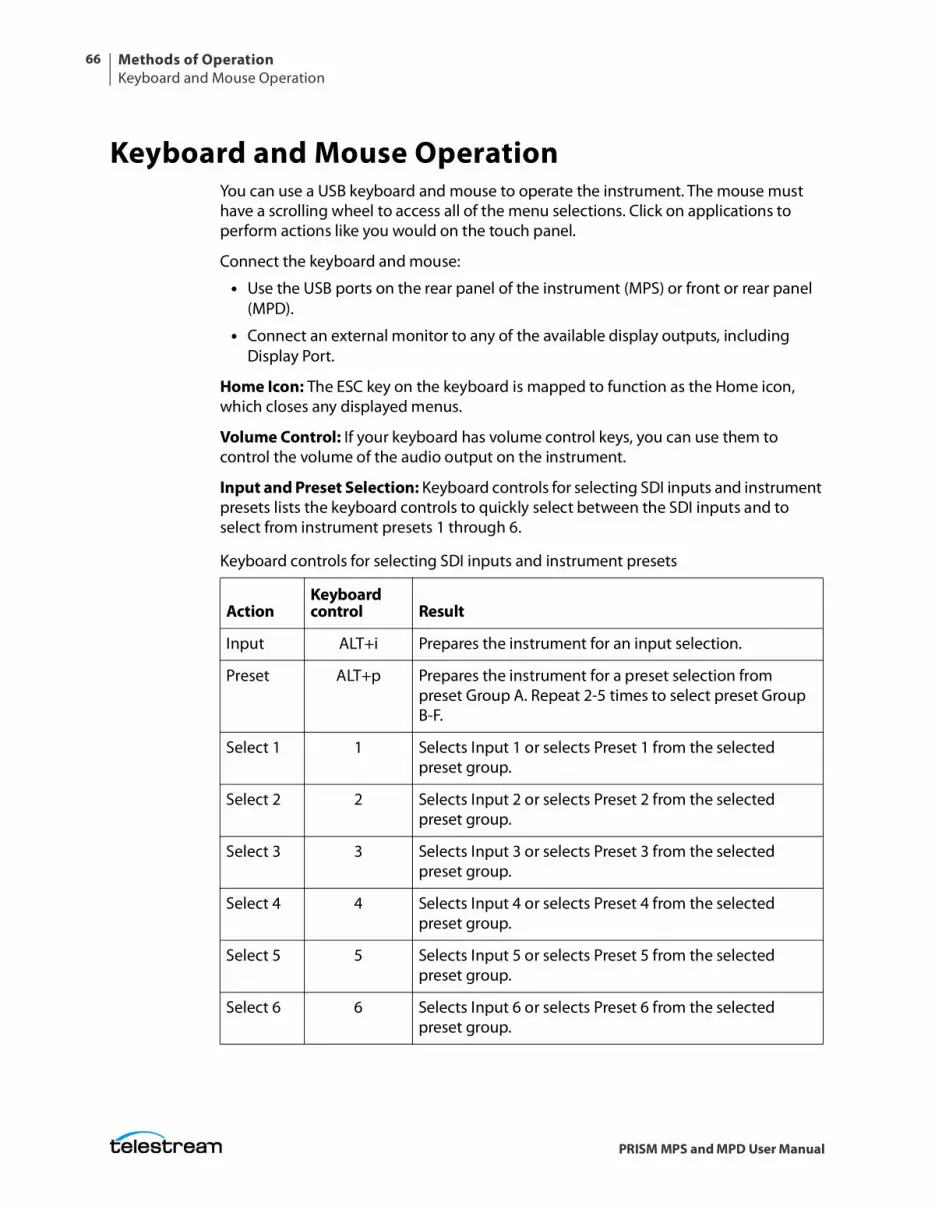
Methods of OperationKeyboard and Mouse Operation
66
PRISM MPS and MPD User Manual
Keyboard and Mouse OperationYou can use a USB keyboard and mouse to operate the instrument. The mouse must have a scrolling wheel to access all of the menu selections. Click on applications to perform actions like you would on the touch panel.
Connect the keyboard and mouse:
• Use the USB ports on the rear panel of the instrument (MPS) or front or rear panel (MPD).
• Connect an external monitor to any of the available display outputs, including Display Port.
Home Icon: The ESC key on the keyboard is mapped to function as the Home icon, which closes any displayed menus.
Volume Control: If your keyboard has volume control keys, you can use them to control the volume of the audio output on the instrument.
Input and Preset Selection: Keyboard controls for selecting SDI inputs and instrument presets lists the keyboard controls to quickly select between the SDI inputs and to select from instrument presets 1 through 6.
Keyboard controls for selecting SDI inputs and instrument presets
ActionKeyboard control Result
Input ALT+i Prepares the instrument for an input selection.
Preset ALT+p Prepares the instrument for a preset selection from preset Group A. Repeat 2-5 times to select preset Group B-F.
Select 1 1 Selects Input 1 or selects Preset 1 from the selected preset group.
Select 2 2 Selects Input 2 or selects Preset 2 from the selected preset group.
Select 3 3 Selects Input 3 or selects Preset 3 from the selected preset group.
Select 4 4 Selects Input 4 or selects Preset 4 from the selected preset group.
Select 5 5 Selects Input 5 or selects Preset 5 from the selected preset group.
Select 6 6 Selects Input 6 or selects Preset 6 from the selected preset group.

Methods of OperationKeyboard and Mouse Operation
67
PRISM MPS and MPD User Manual
To select an SDI input or instrument preset:
1. On the keyboard, use one of two options:
– Press ALT and i at the same time to make an input selection change.
– Press ALT and at the same time press p one time to recall a preset from Preset Group A. Press p 2-5 times to select a preset from another Preset Group (B-F). For example, press ALT and at the same time and press p three times to make a selection from Preset Group C.
2. Press a number from 1 to 6 to select the input or to select a preset from the selected Preset Group (A-F).
Methods of OperationExtended Display Operation
68
PRISM MPS and MPD User Manual
Extended Display OperationThis section explains how to set up a second (extended) display for an MPS. It also explains how to reconfigure the extended display in an MPD. The two procedures are similar but the MPD extended display is configured at the factory, so this procedure assumes an MPD reconfigure is necessary.
Configure MPS Extended DisplayWhen an extended display is connected to an MPS instrument, you have the option to extend the main display on the MPS to the extended display. Extending the display increases the number of application tiles in your workspace. Using the extended display function requires software option MPDSP-EXTNDSP; without the option the main display is duplicated onto the extended display.
1. Connect the MPS to the extended display and power on both products. (See PRISM MPS Rack Accessory Installation Instructions.)
2. In the primary MPS, select the Settings icon ( ) and then select Display.
3. Under EXTENDED DISPLAY, set Extended Display Mode to Enabled. If the Extended Display Mode setting is turned off, the second display duplicates the main display.
4. In the Identify Touchscreen, select Start.
5. Follow the on-screen instructions. When instructed to touch the Primary and Extended displays, make sure to touch on the touchscreens. Do not use a mouse. The touchscreens will not be properly identified if you use a mouse or if you configure remotely, such as with VNC.
Note: The process to identify the touchscreens can be performed again at any time. When the process completes successfully, it is not necessary to perform it again unless you change the touchscreen configuration, for example, if you change the USB port connections on the back of the instrument.
Reconfigure MPD Extended DisplayThe MPD extended display arrives configured. If it is necessary, you can reset the configuration of the display.
1. In the primary MPD display, select the Settings icon ( ) and then select Display.
2. Under EXTENDED DISPLAY, set Extended Display Mode to On. If the Extended Display Mode setting is turned off, the second display duplicates the main display.
3. In the Identify Touchscreen, select Start.
Follow the on-screen instructions. When instructed to touch the Primary and Extended displays, make sure to touch on the touchscreens. Do not use a mouse. The touchscreens will not be properly identified if you use a mouse or if you configure remotely, such as with VNC.
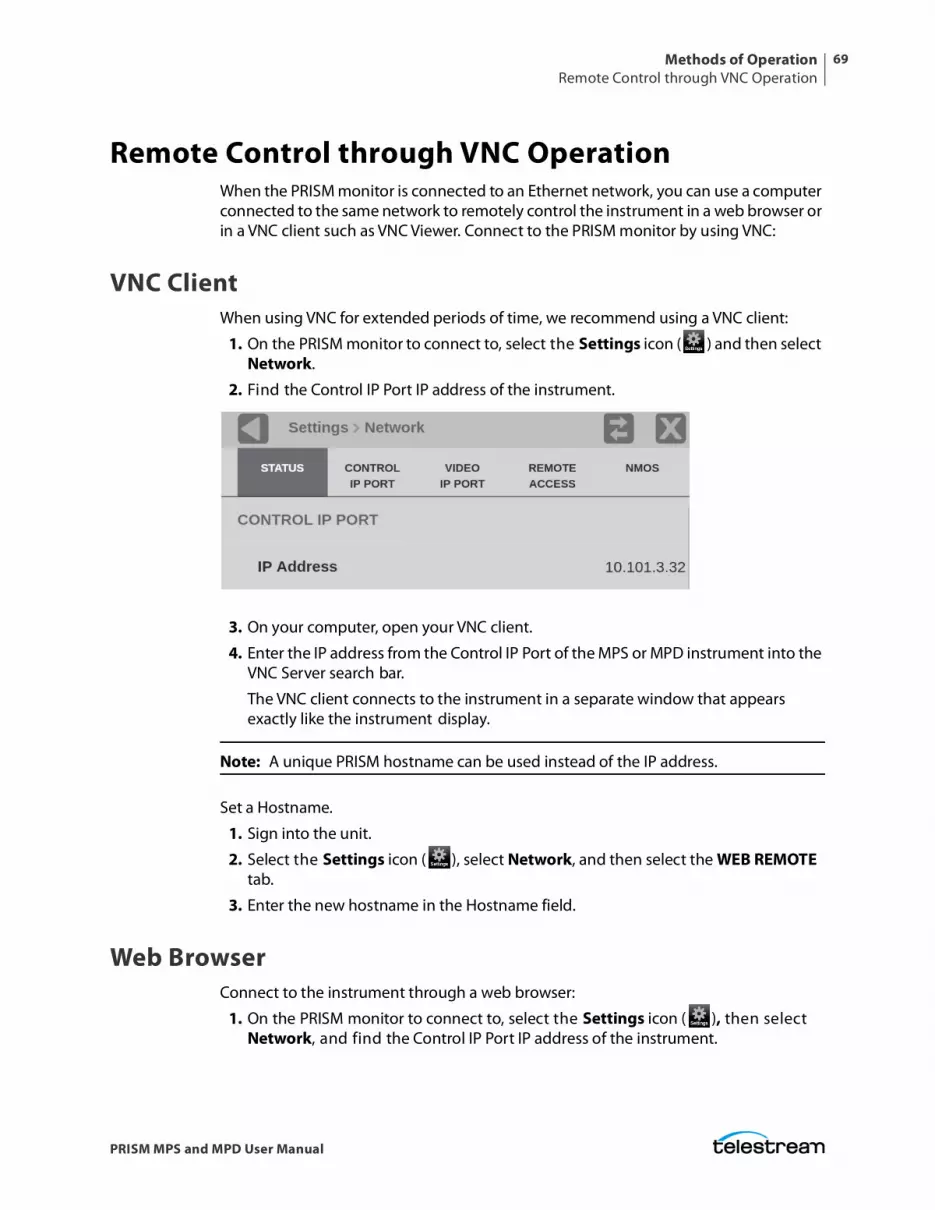
Methods of OperationRemote Control through VNC Operation
69
PRISM MPS and MPD User Manual
Remote Control through VNC OperationWhen the PRISM monitor is connected to an Ethernet network, you can use a computer connected to the same network to remotely control the instrument in a web browser or in a VNC client such as VNC Viewer. Connect to the PRISM monitor by using VNC:
VNC ClientWhen using VNC for extended periods of time, we recommend using a VNC client:
1. On the PRISM monitor to connect to, select the Settings icon ( ) and then select Network.
2. Find the Control IP Port IP address of the instrument.
3. On your computer, open your VNC client.
4. Enter the IP address from the Control IP Port of the MPS or MPD instrument into the VNC Server search bar.
The VNC client connects to the instrument in a separate window that appears exactly like the instrument display.
Note: A unique PRISM hostname can be used instead of the IP address.
Set a Hostname.
1. Sign into the unit.
2. Select the Settings icon ( ), select Network, and then select the WEB REMOTE tab.
3. Enter the new hostname in the Hostname field.
Web BrowserConnect to the instrument through a web browser:
1. On the PRISM monitor to connect to, select the Settings icon ( ), then select Network, and find the Control IP Port IP address of the instrument.
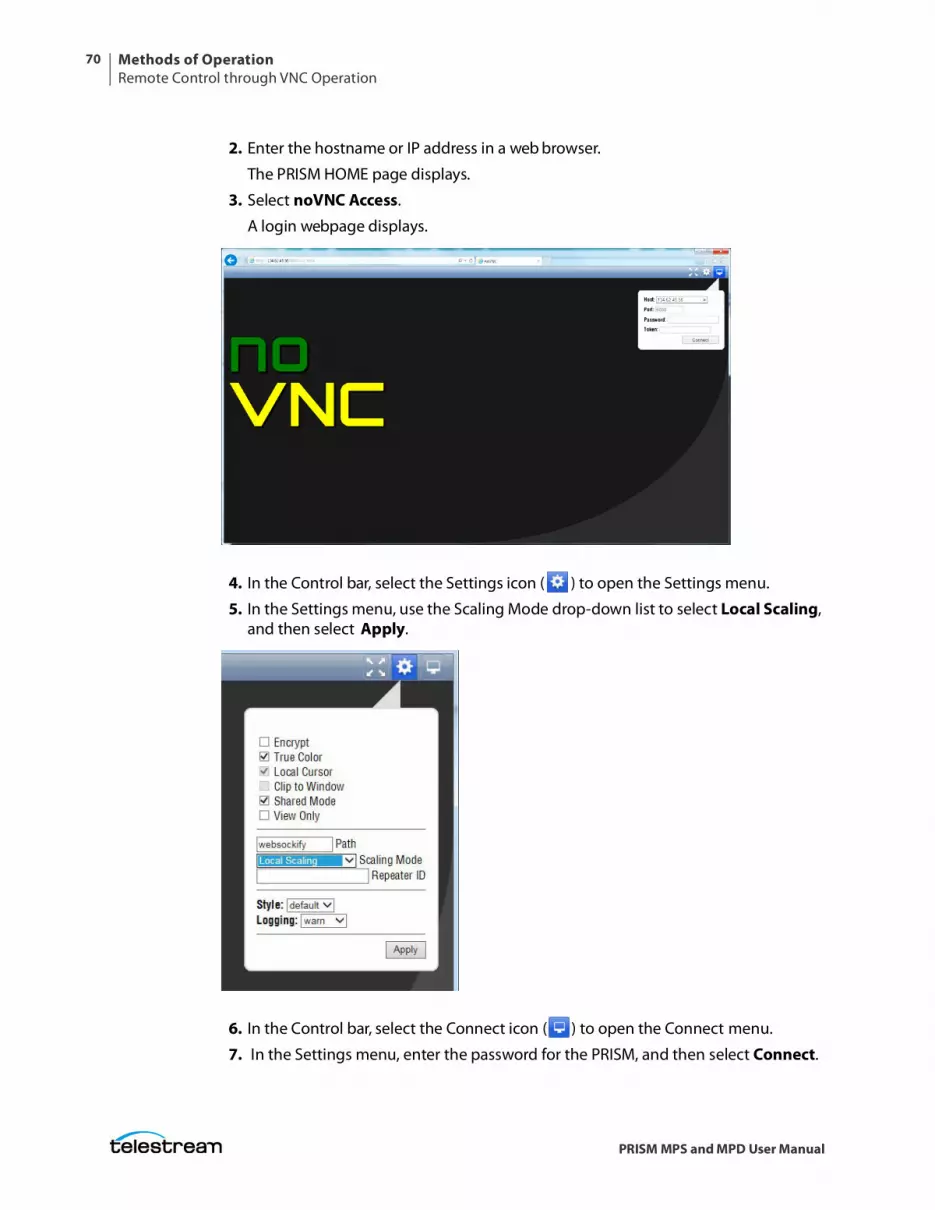
Methods of OperationRemote Control through VNC Operation
70
PRISM MPS and MPD User Manual
2. Enter the hostname or IP address in a web browser.
The PRISM HOME page displays.
3. Select noVNC Access.
A login webpage displays.
4. In the Control bar, select the Settings icon ( ) to open the Settings menu.
5. In the Settings menu, use the Scaling Mode drop-down list to select Local Scaling, and then select Apply.
6. In the Control bar, select the Connect icon ( ) to open the Connect menu.
7. In the Settings menu, enter the password for the PRISM, and then select Connect.
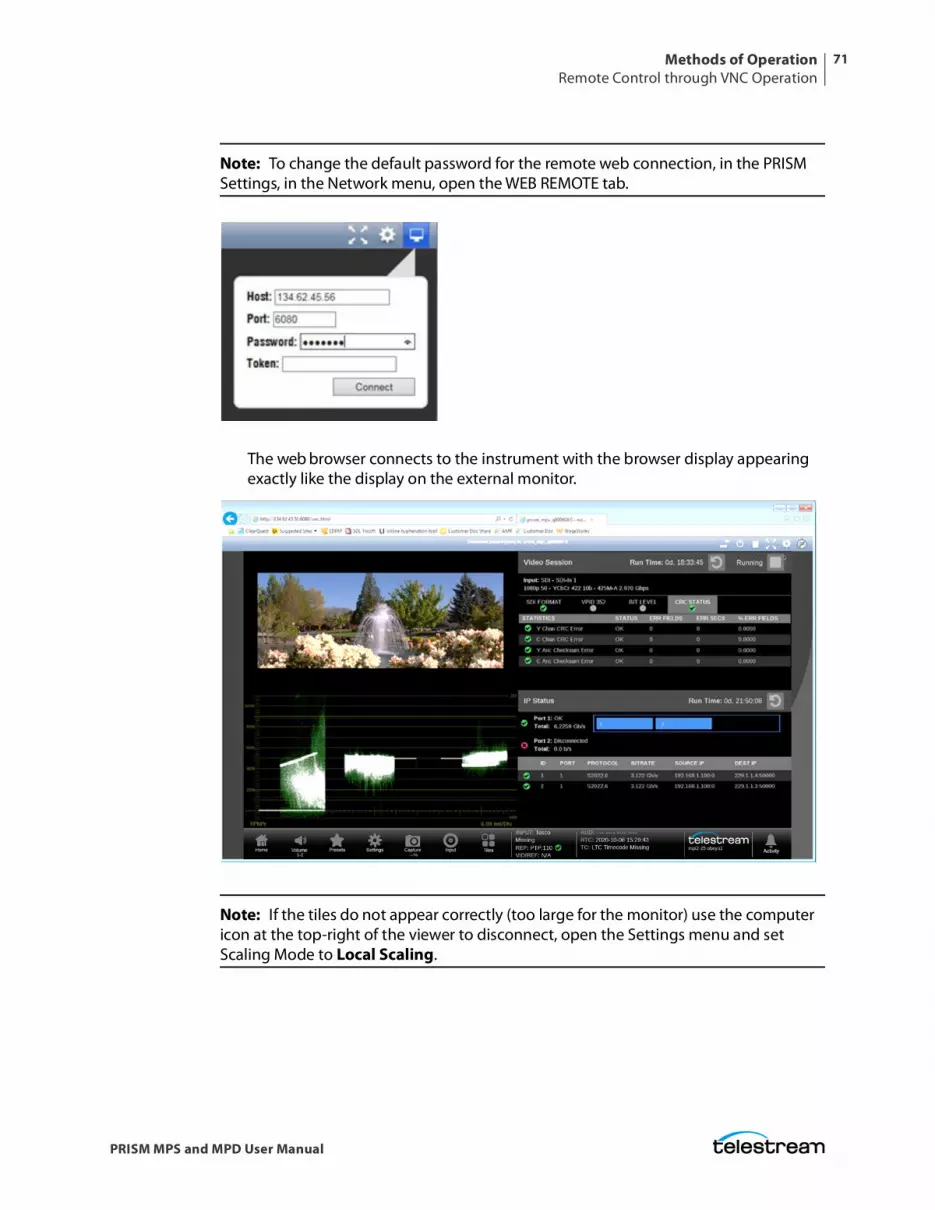
Methods of OperationRemote Control through VNC Operation
71
PRISM MPS and MPD User Manual
Note: To change the default password for the remote web connection, in the PRISM Settings, in the Network menu, open the WEB REMOTE tab.
The web browser connects to the instrument with the browser display appearing exactly like the display on the external monitor.
Note: If the tiles do not appear correctly (too large for the monitor) use the computer icon at the top-right of the viewer to disconnect, open the Settings menu and set Scaling Mode to Local Scaling.
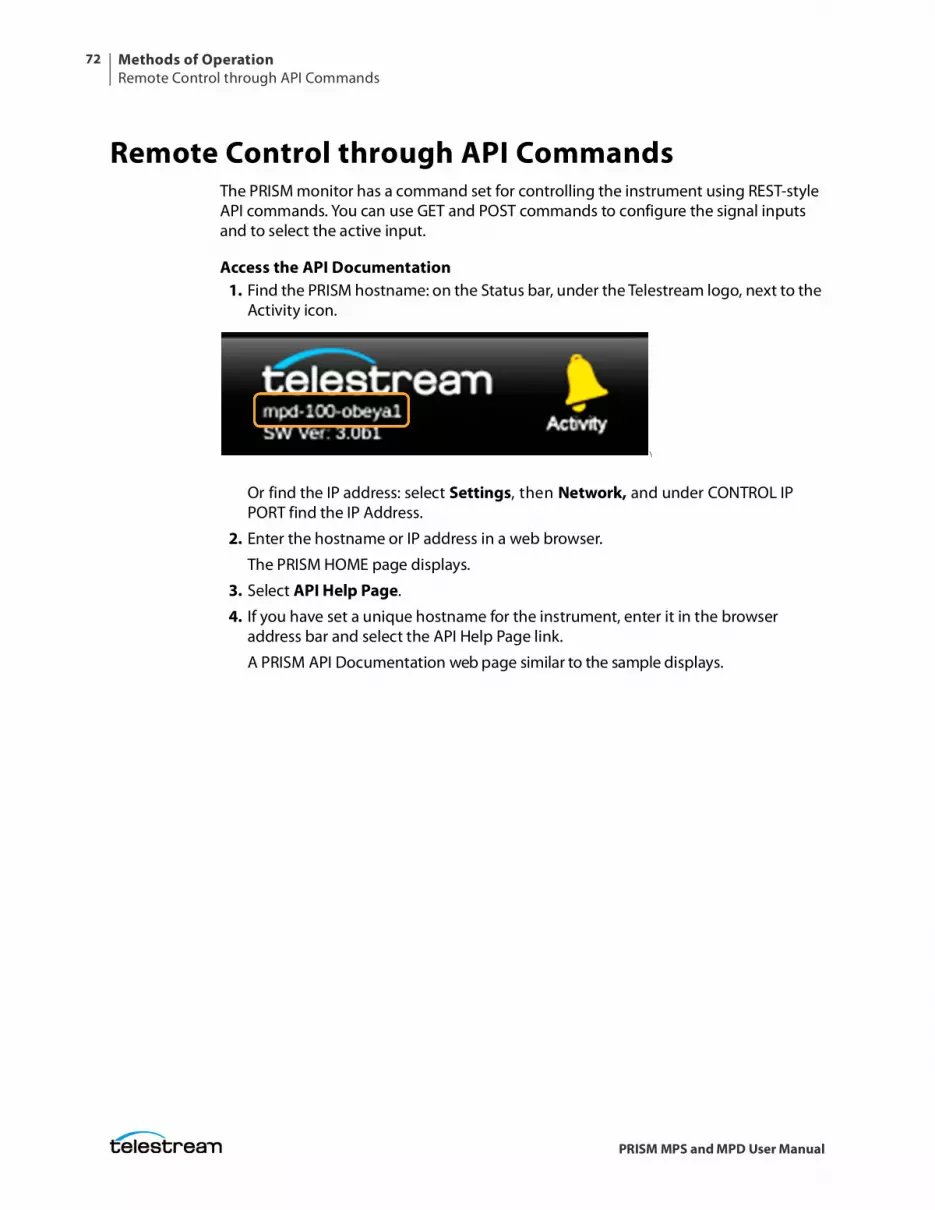
Methods of OperationRemote Control through API Commands
72
PRISM MPS and MPD User Manual
Remote Control through API CommandsThe PRISM monitor has a command set for controlling the instrument using REST-style API commands. You can use GET and POST commands to configure the signal inputs and to select the active input.
Access the API Documentation1. Find the PRISM hostname: on the Status bar, under the Telestream logo, next to the
Activity icon.
\
Or find the IP address: select Settings, then Network, and under CONTROL IP PORT find the IP Address.
2. Enter the hostname or IP address in a web browser.
The PRISM HOME page displays.
3. Select API Help Page.
4. If you have set a unique hostname for the instrument, enter it in the browser address bar and select the API Help Page link.
A PRISM API Documentation web page similar to the sample displays.
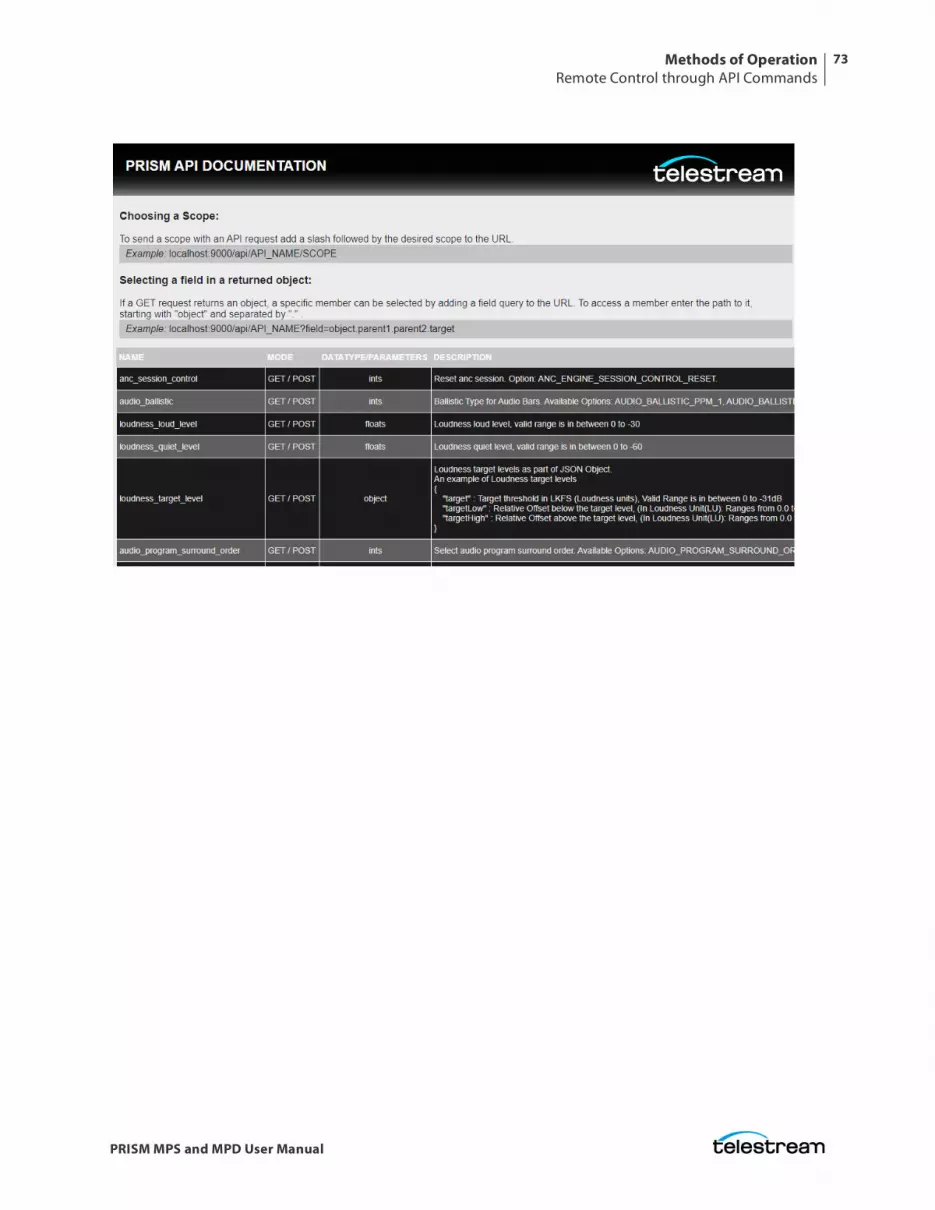
Methods of OperationRemote Control through API Commands
73
PRISM MPS and MPD User Manual
Configure the Instrument74
PRISM MPS and MPD User Manual
Configure the Instrument
Most of the instrument settings are controlled using the Settings menu. To access the global settings menu, select the Settings icon ( ) in the status bar. This section describes how to configure these instrument settings:
• Signal inputs: Configure and Select Signal Inputs
• HDR monitoring: Configure Instrument for HDR/WCG Monitoring
• PTP reference settings: Configure Reference Settings
• Presets: Set and Recall Instrument Presets
• Internal time and date: Set Time and Date
• Firmware upgrade: Upgrade Instrument Firmware
• Installed software and hardware versions: Verify Firmware Upgrade
Note: Some of the configuration settings require you to enter values. A USB keyboard can be used to enter these values instead of using the touchscreen keypad on the instrument.
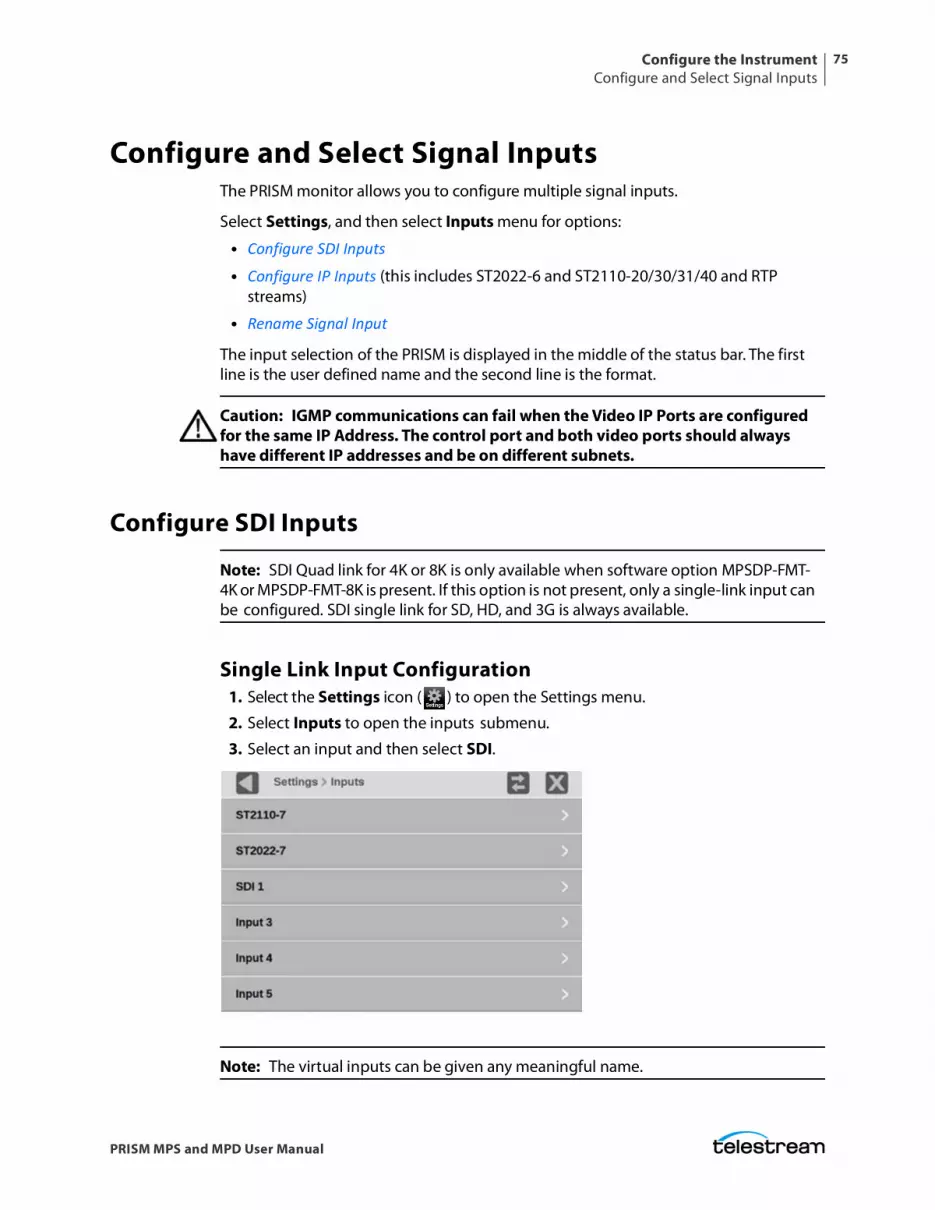
Configure the InstrumentConfigure and Select Signal Inputs
75
PRISM MPS and MPD User Manual
Configure and Select Signal InputsThe PRISM monitor allows you to configure multiple signal inputs.
Select Settings, and then select Inputs menu for options:
• Configure SDI Inputs
• Configure IP Inputs (this includes ST2022-6 and ST2110-20/30/31/40 and RTP streams)
• Rename Signal Input
The input selection of the PRISM is displayed in the middle of the status bar. The first line is the user defined name and the second line is the format.
Caution: IGMP communications can fail when the Video IP Ports are configured for the same IP Address. The control port and both video ports should always have different IP addresses and be on different subnets.
Configure SDI Inputs
Note: SDI Quad link for 4K or 8K is only available when software option MPSDP-FMT-4K or MPSDP-FMT-8K is present. If this option is not present, only a single-link input can be configured. SDI single link for SD, HD, and 3G is always available.
Single Link Input Configuration1. Select the Settings icon ( ) to open the Settings menu.
2. Select Inputs to open the inputs submenu.
3. Select an input and then select SDI.
Note: The virtual inputs can be given any meaningful name.
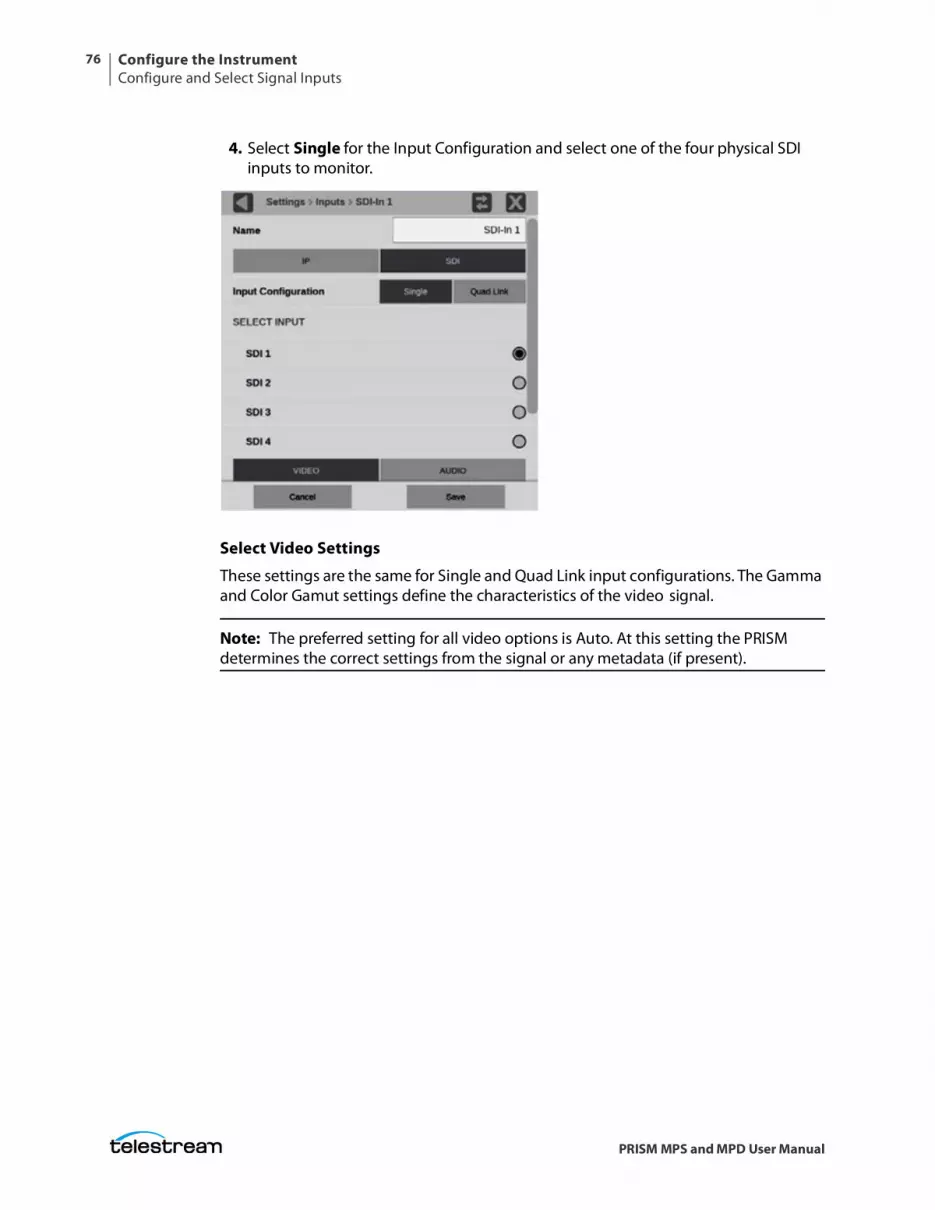
Configure the InstrumentConfigure and Select Signal Inputs
76
PRISM MPS and MPD User Manual
4. Select Single for the Input Configuration and select one of the four physical SDI inputs to monitor.
Select Video Settings
These settings are the same for Single and Quad Link input configurations. The Gamma and Color Gamut settings define the characteristics of the video signal.
Note: The preferred setting for all video options is Auto. At this setting the PRISM determines the correct settings from the signal or any metadata (if present).
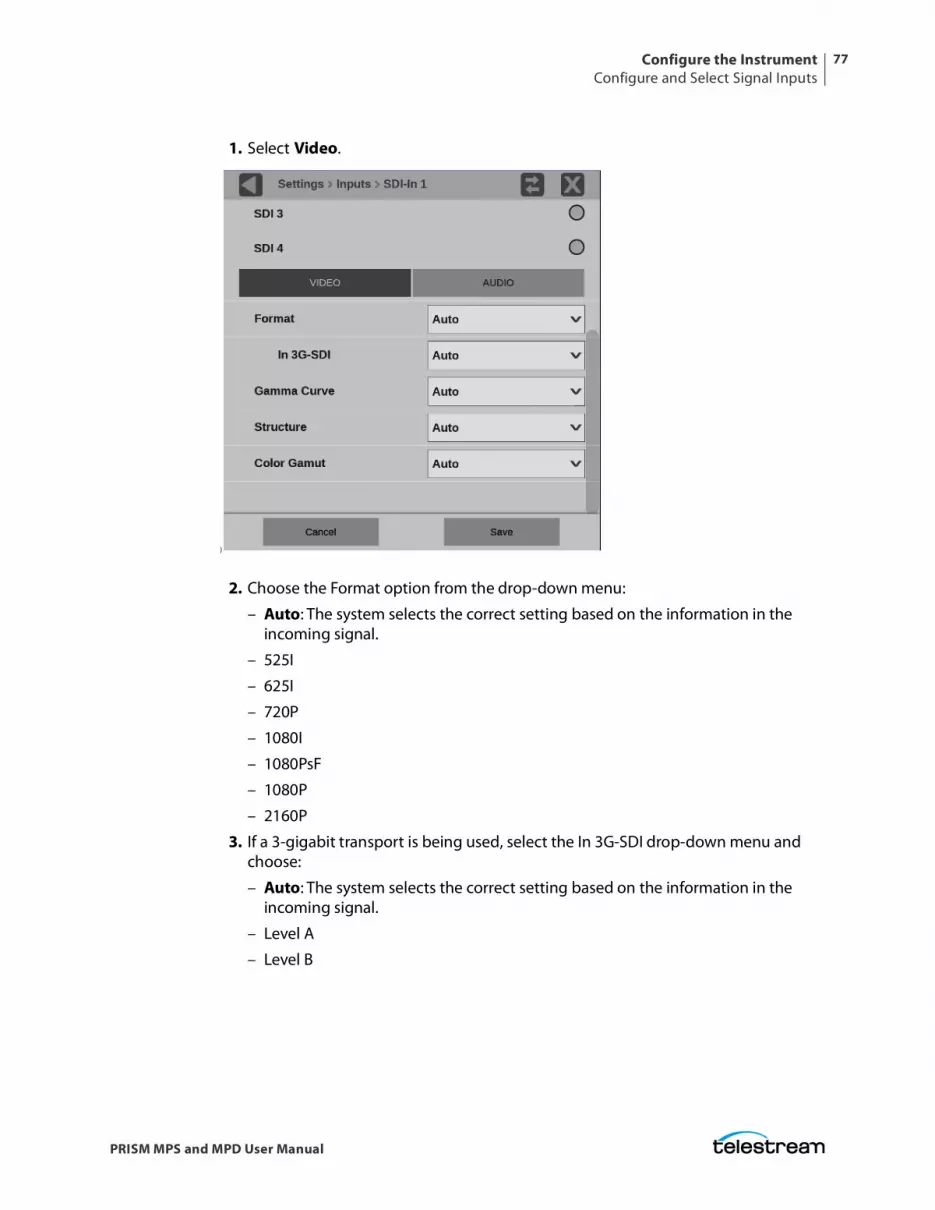
Configure the InstrumentConfigure and Select Signal Inputs
77
PRISM MPS and MPD User Manual
1. Select Video.
)
2. Choose the Format option from the drop-down menu:
– Auto: The system selects the correct setting based on the information in the incoming signal.
– 525I
– 625I
– 720P
– 1080I
– 1080PsF
– 1080P
– 2160P
3. If a 3-gigabit transport is being used, select the In 3G-SDI drop-down menu and choose:
– Auto: The system selects the correct setting based on the information in the incoming signal.
– Level A
– Level B
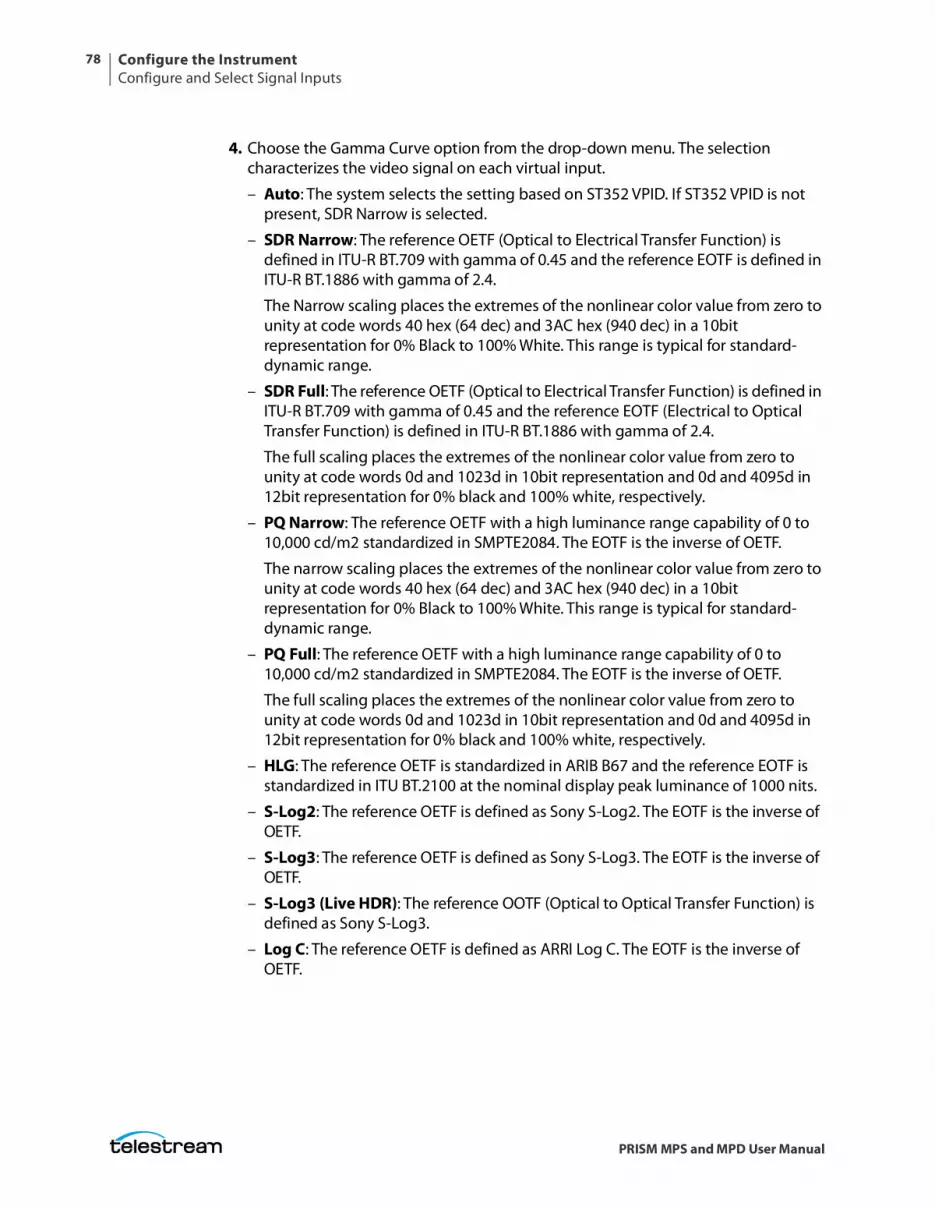
Configure the InstrumentConfigure and Select Signal Inputs
78
PRISM MPS and MPD User Manual
4. Choose the Gamma Curve option from the drop-down menu. The selection characterizes the video signal on each virtual input.
– Auto: The system selects the setting based on ST352 VPID. If ST352 VPID is not present, SDR Narrow is selected.
– SDR Narrow: The reference OETF (Optical to Electrical Transfer Function) is defined in ITU-R BT.709 with gamma of 0.45 and the reference EOTF is defined in ITU-R BT.1886 with gamma of 2.4.
The Narrow scaling places the extremes of the nonlinear color value from zero to unity at code words 40 hex (64 dec) and 3AC hex (940 dec) in a 10bit representation for 0% Black to 100% White. This range is typical for standard-dynamic range.
– SDR Full: The reference OETF (Optical to Electrical Transfer Function) is defined in ITU-R BT.709 with gamma of 0.45 and the reference EOTF (Electrical to Optical Transfer Function) is defined in ITU-R BT.1886 with gamma of 2.4.
The full scaling places the extremes of the nonlinear color value from zero to unity at code words 0d and 1023d in 10bit representation and 0d and 4095d in 12bit representation for 0% black and 100% white, respectively.
– PQ Narrow: The reference OETF with a high luminance range capability of 0 to 10,000 cd/m2 standardized in SMPTE2084. The EOTF is the inverse of OETF.
The narrow scaling places the extremes of the nonlinear color value from zero to unity at code words 40 hex (64 dec) and 3AC hex (940 dec) in a 10bit representation for 0% Black to 100% White. This range is typical for standard-dynamic range.
– PQ Full: The reference OETF with a high luminance range capability of 0 to 10,000 cd/m2 standardized in SMPTE2084. The EOTF is the inverse of OETF.
The full scaling places the extremes of the nonlinear color value from zero to unity at code words 0d and 1023d in 10bit representation and 0d and 4095d in 12bit representation for 0% black and 100% white, respectively.
– HLG: The reference OETF is standardized in ARIB B67 and the reference EOTF is standardized in ITU BT.2100 at the nominal display peak luminance of 1000 nits.
– S-Log2: The reference OETF is defined as Sony S-Log2. The EOTF is the inverse of OETF.
– S-Log3: The reference OETF is defined as Sony S-Log3. The EOTF is the inverse of OETF.
– S-Log3 (Live HDR): The reference OOTF (Optical to Optical Transfer Function) is defined as Sony S-Log3.
– Log C: The reference OETF is defined as ARRI Log C. The EOTF is the inverse of OETF.
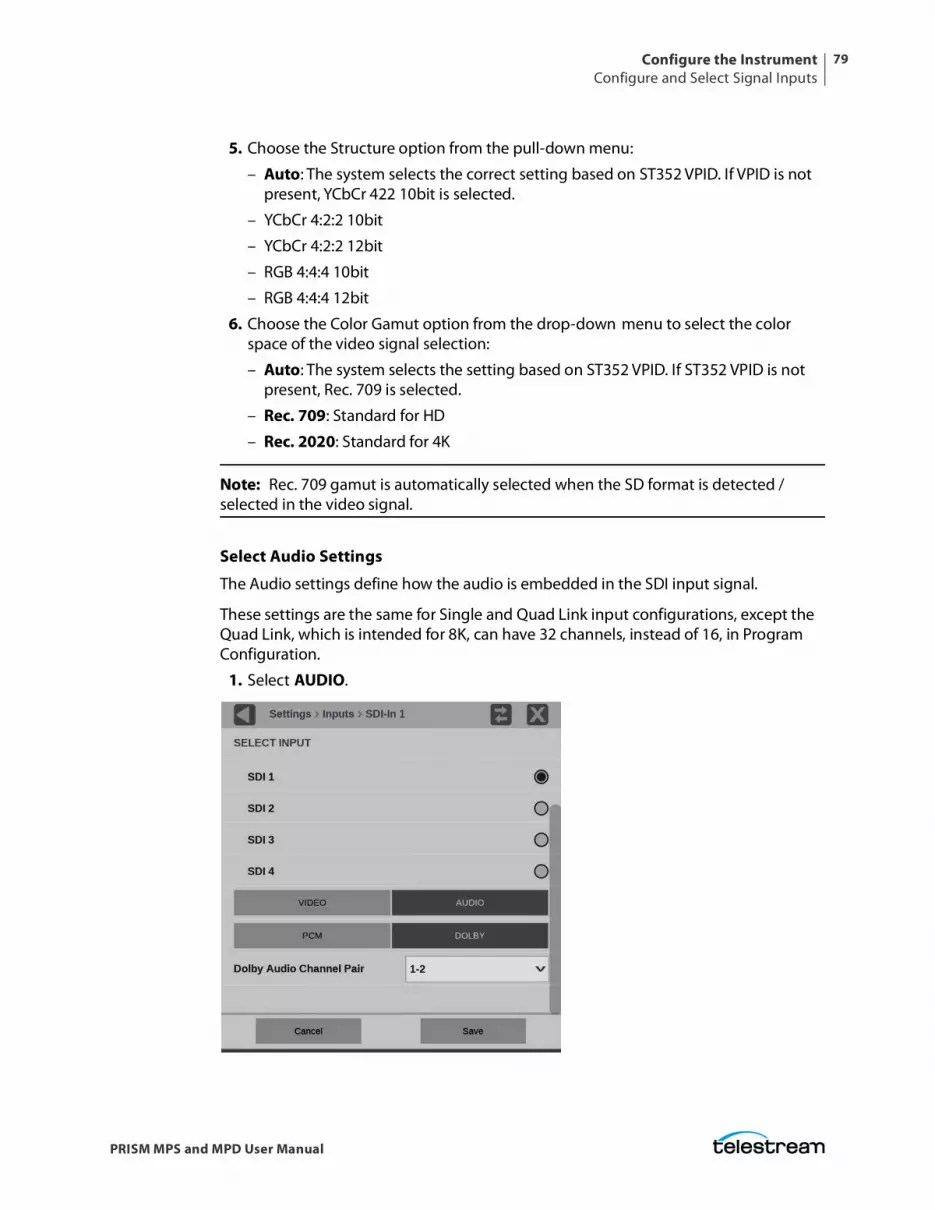
Configure the InstrumentConfigure and Select Signal Inputs
79
PRISM MPS and MPD User Manual
5. Choose the Structure option from the pull-down menu:
– Auto: The system selects the correct setting based on ST352 VPID. If VPID is not present, YCbCr 422 10bit is selected.
– YCbCr 4:2:2 10bit
– YCbCr 4:2:2 12bit
– RGB 4:4:4 10bit
– RGB 4:4:4 12bit
6. Choose the Color Gamut option from the drop-down menu to select the color space of the video signal selection:
– Auto: The system selects the setting based on ST352 VPID. If ST352 VPID is not present, Rec. 709 is selected.
– Rec. 709: Standard for HD
– Rec. 2020: Standard for 4K
Note: Rec. 709 gamut is automatically selected when the SD format is detected / selected in the video signal.
Select Audio Settings
The Audio settings define how the audio is embedded in the SDI input signal.
These settings are the same for Single and Quad Link input configurations, except the Quad Link, which is intended for 8K, can have 32 channels, instead of 16, in Program Configuration.
1. Select AUDIO.
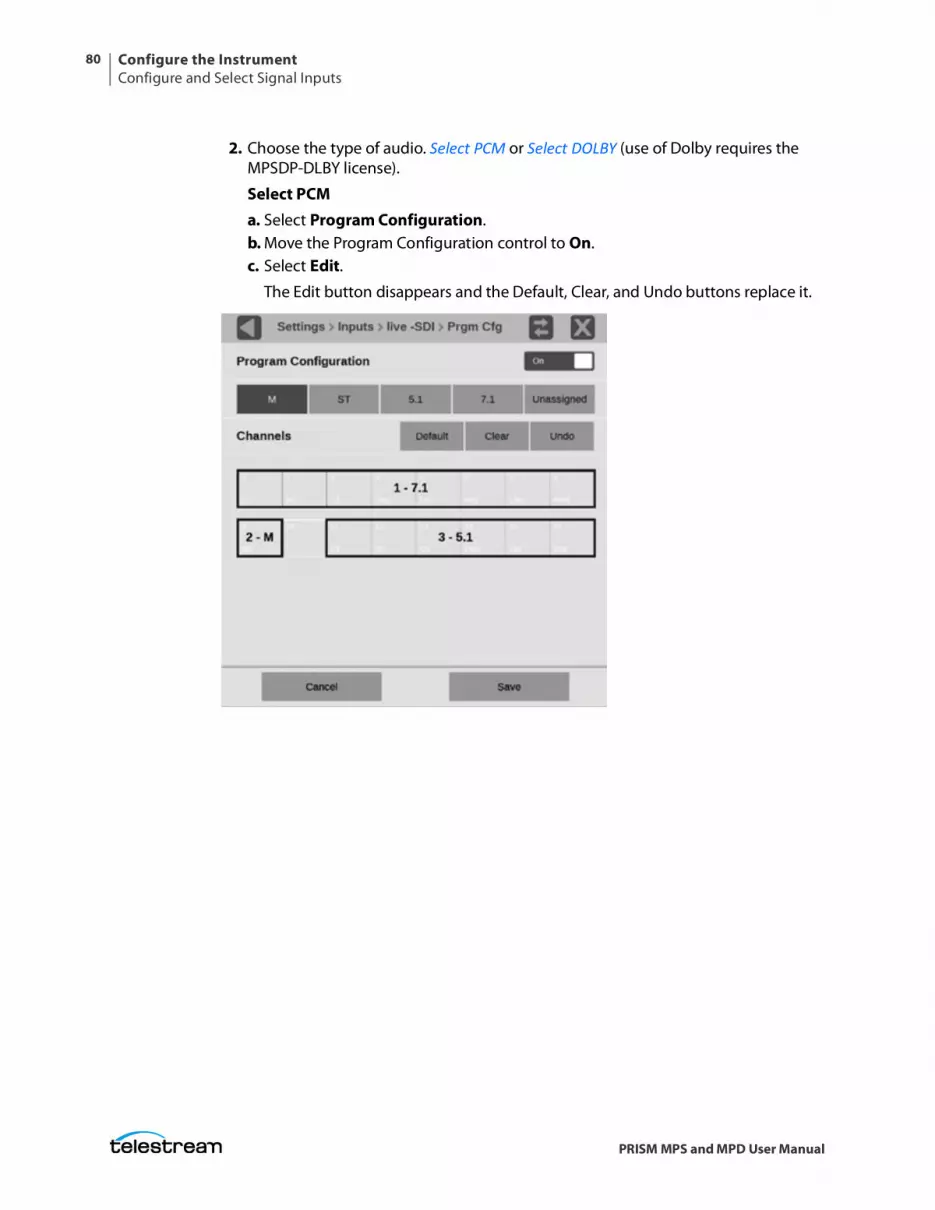
Configure the InstrumentConfigure and Select Signal Inputs
80
PRISM MPS and MPD User Manual
2. Choose the type of audio. Select PCM or Select DOLBY (use of Dolby requires the MPSDP-DLBY license).
Select PCMa. Select Program Configuration.b. Move the Program Configuration control to On.c. Select Edit.
The Edit button disappears and the Default, Clear, and Undo buttons replace it.
Configure the InstrumentConfigure and Select Signal Inputs
81
PRISM MPS and MPD User Manual
Note: Quad Link is intended for 8K and can have 32 channels, instead of 16, in Program Configuration.
d. Select the type of program (mono, stereo, etc.) and select the audio channel to assign it. Repeat until all the audio in the current input signal have programs assigned to channels.
M is mono, 1 channel.
ST is stereo, 2 channels.
5.1 is surround sound, 6 channels.
7.1 is surround sound, 8 channels.
Unassigned removes an assignment from a channel. Click Unassigned and click any block in an assignment, for example the middle of a 7.1 assignment, the entire assignment is removed and is not displayed on the Audio application.
Default resets the channels to 8 stereo pairs.
Clear removes all assignments, including the default.
e. Select Save and close the menu.
Note: You must save the program configuration to update the programs in the audio bars and loudness meter.
Select DOLBYa. Select DOLBY.b. In the Dolby Audio Channel Pair menu, select the audio channel pair that
contains Dolby audio.
Dolby audio in the selected channels are then decoded. Only Dolby D/D Plus/E decode is supported.
c. Select Save and close the menu.
Note: Audio programs configured in the Program Configuration menu are used to select a program for measurement by the Loudness application, to display audio bars in the Audio application, and to monitor with headphones. When all the channels are unassigned, all the channels are treated as stereo pairs. The audio programs in the Dolby stream are automatically set up based on the Dolby metadata.
Quad Link Input Configuration
Note: All four SDI inputs must be connected to a cable on the back of the PRISM to use Quad Link Inputs.
1. Select the Settings icon ( ) to open the Settings menu.
2. Select Inputs to open the Inputs submenu.
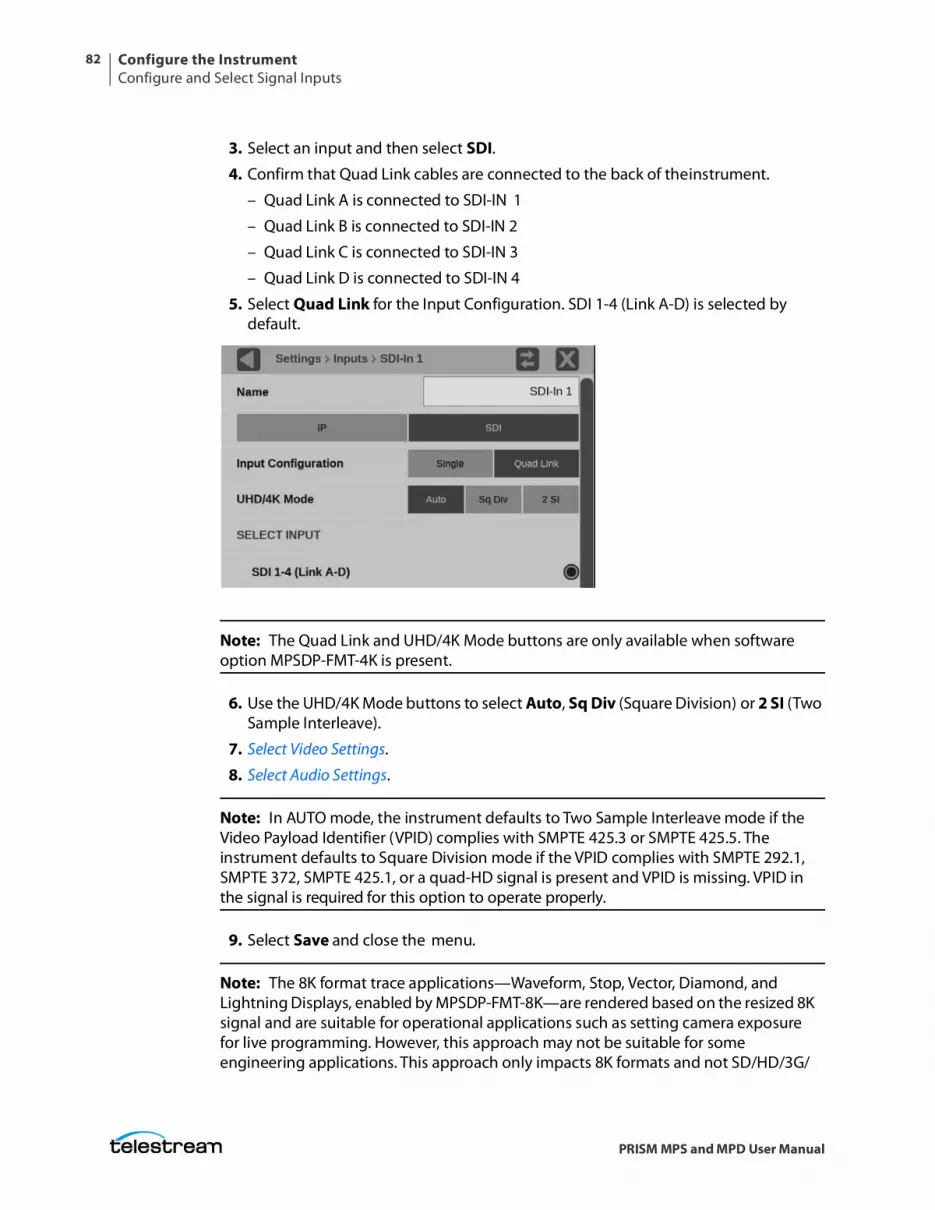
Configure the InstrumentConfigure and Select Signal Inputs
82
PRISM MPS and MPD User Manual
3. Select an input and then select SDI.4. Confirm that Quad Link cables are connected to the back of the instrument.
– Quad Link A is connected to SDI-IN 1
– Quad Link B is connected to SDI-IN 2
– Quad Link C is connected to SDI-IN 3
– Quad Link D is connected to SDI-IN 4
5. Select Quad Link for the Input Configuration. SDI 1-4 (Link A-D) is selected by default.
Note: The Quad Link and UHD/4K Mode buttons are only available when software option MPSDP-FMT-4K is present.
6. Use the UHD/4K Mode buttons to select Auto, Sq Div (Square Division) or 2 SI (Two Sample Interleave).
7. Select Video Settings.
8. Select Audio Settings.
Note: In AUTO mode, the instrument defaults to Two Sample Interleave mode if the Video Payload Identifier (VPID) complies with SMPTE 425.3 or SMPTE 425.5. The instrument defaults to Square Division mode if the VPID complies with SMPTE 292.1, SMPTE 372, SMPTE 425.1, or a quad-HD signal is present and VPID is missing. VPID in the signal is required for this option to operate properly.
9. Select Save and close the menu.
Note: The 8K format trace applications—Waveform, Stop, Vector, Diamond, and Lightning Displays, enabled by MPSDP-FMT-8K—are rendered based on the resized 8K signal and are suitable for operational applications such as setting camera exposure for live programming. However, this approach may not be suitable for some engineering applications. This approach only impacts 8K formats and not SD/HD/3G/
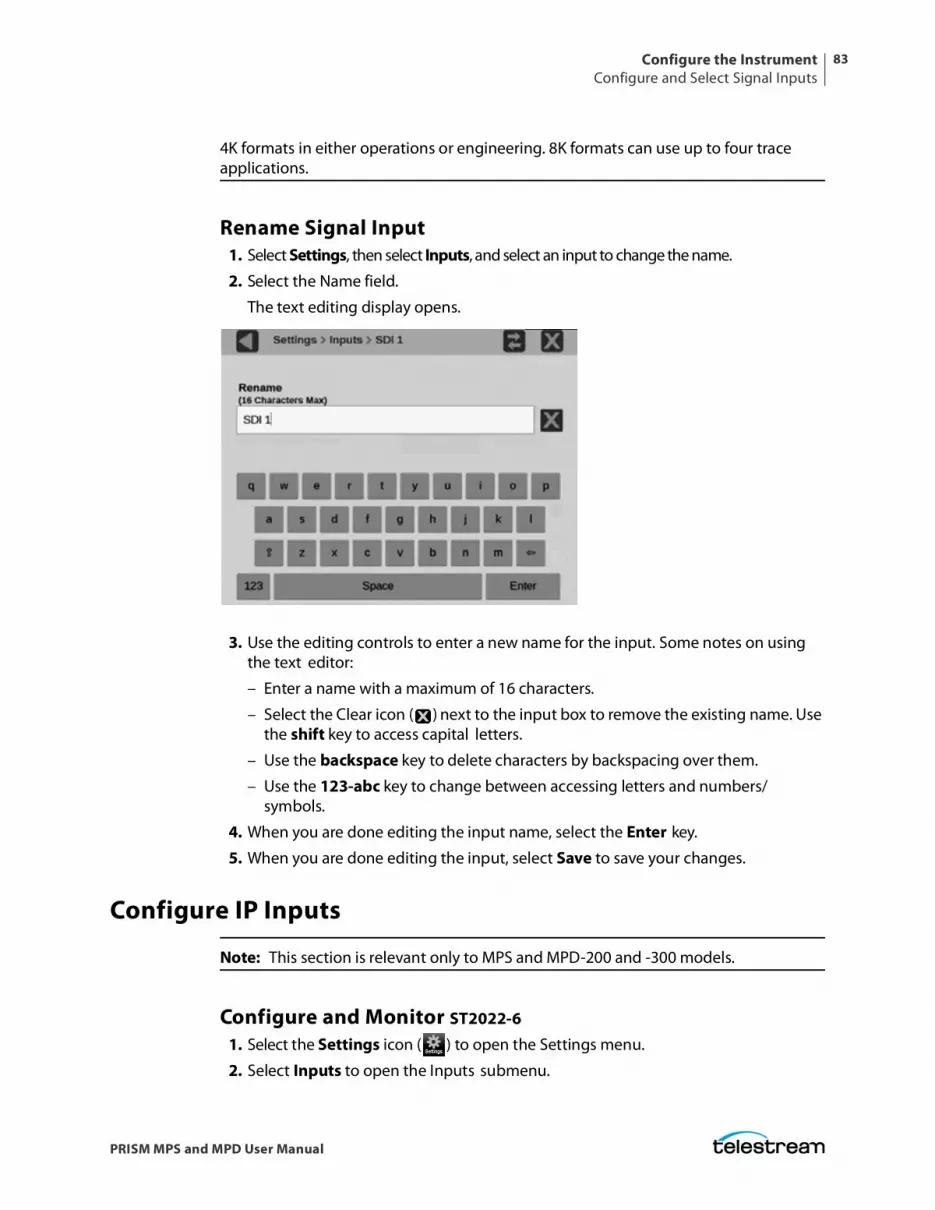
Configure the InstrumentConfigure and Select Signal Inputs
83
PRISM MPS and MPD User Manual
4K formats in either operations or engineering. 8K formats can use up to four trace applications.
Rename Signal Input1. Select Settings, then select Inputs, and select an input to change the name.
2. Select the Name field.
The text editing display opens.
3. Use the editing controls to enter a new name for the input. Some notes on using the text editor:
– Enter a name with a maximum of 16 characters.
– Select the Clear icon ( ) next to the input box to remove the existing name. Use the shift key to access capital letters.
– Use the backspace key to delete characters by backspacing over them.
– Use the 123-abc key to change between accessing letters and numbers/symbols.
4. When you are done editing the input name, select the Enter key.
5. When you are done editing the input, select Save to save your changes.
Configure IP Inputs
Note: This section is relevant only to MPS and MPD-200 and -300 models.
Configure and Monitor ST2022-61. Select the Settings icon ( ) to open the Settings menu.
2. Select Inputs to open the Inputs submenu.
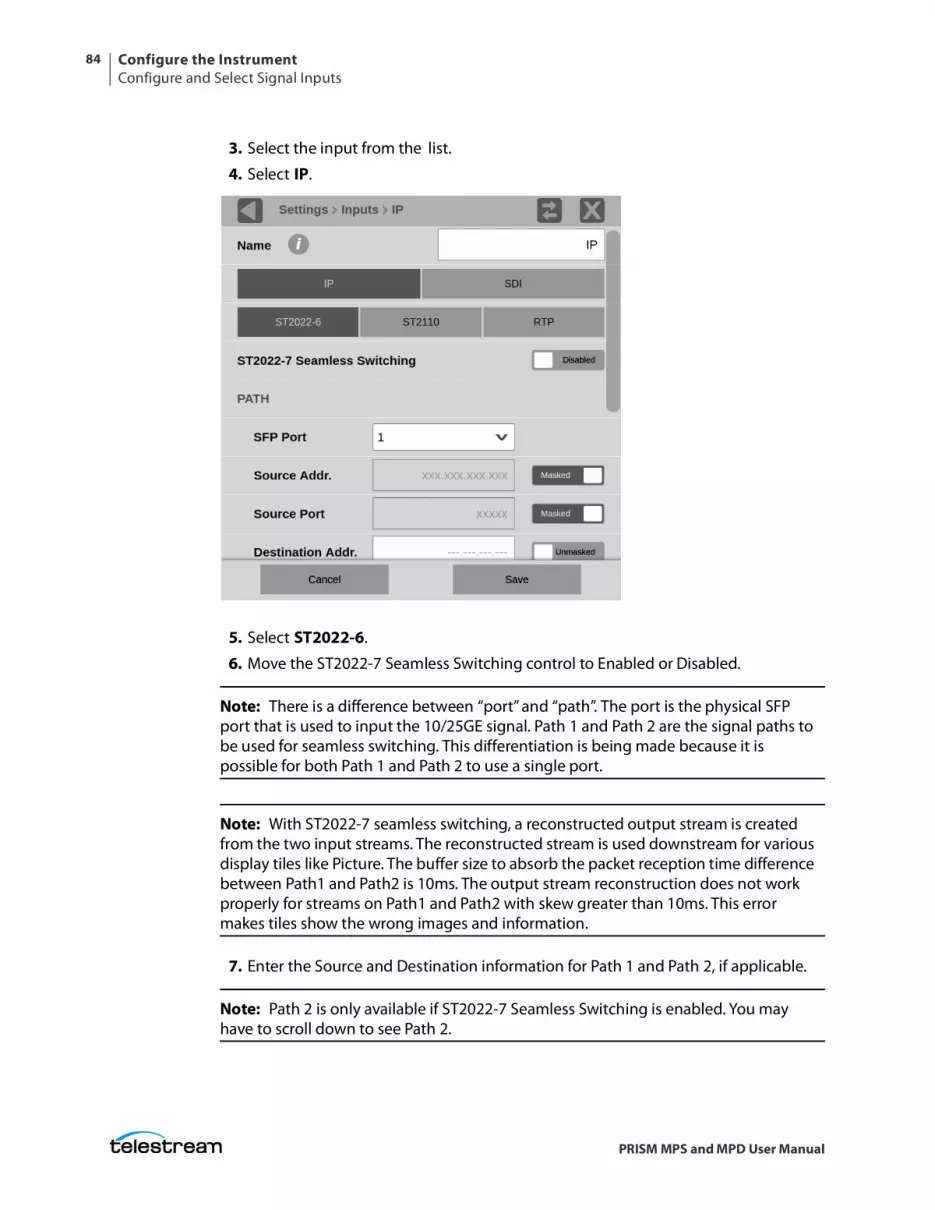
Configure the InstrumentConfigure and Select Signal Inputs
84
PRISM MPS and MPD User Manual
3. Select the input from the list.
4. Select IP.
5. Select ST2022-6.
6. Move the ST2022-7 Seamless Switching control to Enabled or Disabled.
Note: There is a difference between “port” and “path”. The port is the physical SFP port that is used to input the 10/25GE signal. Path 1 and Path 2 are the signal paths to be used for seamless switching. This differentiation is being made because it is possible for both Path 1 and Path 2 to use a single port.
Note: With ST2022-7 seamless switching, a reconstructed output stream is created from the two input streams. The reconstructed stream is used downstream for various display tiles like Picture. The buffer size to absorb the packet reception time difference between Path1 and Path2 is 10ms. The output stream reconstruction does not work properly for streams on Path1 and Path2 with skew greater than 10ms. This error makes tiles show the wrong images and information.
7. Enter the Source and Destination information for Path 1 and Path 2, if applicable.
Note: Path 2 is only available if ST2022-7 Seamless Switching is enabled. You may have to scroll down to see Path 2.
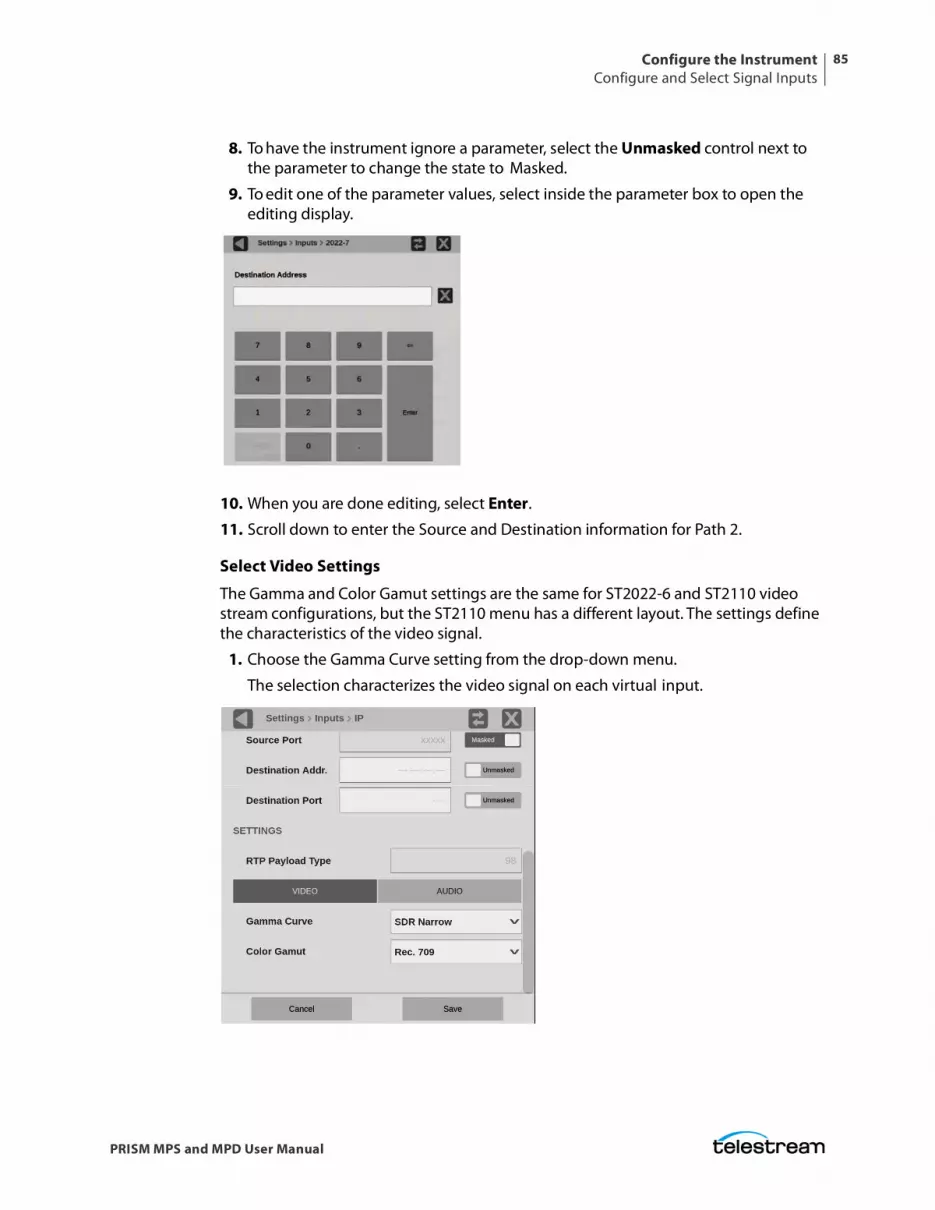
Configure the InstrumentConfigure and Select Signal Inputs
85
PRISM MPS and MPD User Manual
8. To have the instrument ignore a parameter, select the Unmasked control next to the parameter to change the state to Masked.
9. To edit one of the parameter values, select inside the parameter box to open the editing display.
10. When you are done editing, select Enter.
11. Scroll down to enter the Source and Destination information for Path 2.
Select Video Settings
The Gamma and Color Gamut settings are the same for ST2022-6 and ST2110 video stream configurations, but the ST2110 menu has a different layout. The settings define the characteristics of the video signal.
1. Choose the Gamma Curve setting from the drop-down menu.
The selection characterizes the video signal on each virtual input.
Configure the InstrumentConfigure and Select Signal Inputs
86
PRISM MPS and MPD User Manual
– SDR Narrow: The reference OETF (Optical to Electrical Transfer Function) is defined in ITU-R BT.709 with gamma of 0.45 and the reference EOTF (Electrical to Optical Transfer Function) is defined in ITU-R BT.1886 with gamma of 2.4.
The Narrow scaling places the extremes of the nonlinear color value from zero to unity at code words 40 hex (64 dec) and 3AC hex (940 dec) in a 10bit representation for 0% Black to 100% White. This range is typical for standard-dynamic range.
– SDR Full: The reference OETF (Optical to Electrical Transfer Function) is defined in ITU-R BT.709 with gamma of 0.45 and the reference EOTF (Electrical to Optical Transfer Function) is defined in ITU-R BT.1886 with gamma of 2.4.
The full scaling places the extremes of the nonlinear color value from zero to unity at code words 0d and 1023d in 10bit representation and 0d and 4095d in 12bit representation for 0% black and 100% white, respectively.
– PQ Narrow: The reference OETF (Optical to Electrical Transfer Function) with a high luminance range capability of 0 to 10,000 cd/m2 standardized in SMPTE2084. The EOTF (Electrical to Optical Transfer Function) is the inverse of OETF.
The narrow Scaling places the extremes of the nonlinear color value from zero to unity at code words 40 hex (64 dec) and 3AC hex (940 dec) in a 10bit representation for 0% Black to 100% White. This range is typical for standard-dynamic range.
– PQ Full: The reference OETF (Optical to Electrical Transfer Function) with a high luminance range capability of 0 to 10,000 cd/m2 standardized in SMPTE2084. The EOTF (Electrical to Optical Transfer Function) is the inverse of OETF.
The Full scaling places the extremes of the nonlinear color value from zero to unity at code words 0d and 1023d in 10bit representation and 0d and 4095d in 12bit representation for 0% black and 100% white, respectively.
– HLG: The reference OETF is standardized in ARIB B67 and the reference EOTF is standardized in ITU BT.2100 at the nominal display peak luminance of 1000 nits.
– S-Log2: The reference OETF is defined as Sony S-Log2. The EOTF is the inverse of OETF.
– S-Log3: The reference OETF is defined as Sony S-Log3. The EOTF is the inverse of OETF.
– S-Log3 (Live HDR): The reference OOTF (Optical to Optical Transfer Function) is defined as Sony S-Log3.
– Log C: The reference OETF is defined as ARRI Log C. The EOTF is the inverse of OETF.
2. Select Color Gamut settings in the drop-down menu.
The selection is the color space of the video signal.
– Rec. 709: Standard for HD.
– Rec. 2020: Standard for 4K.
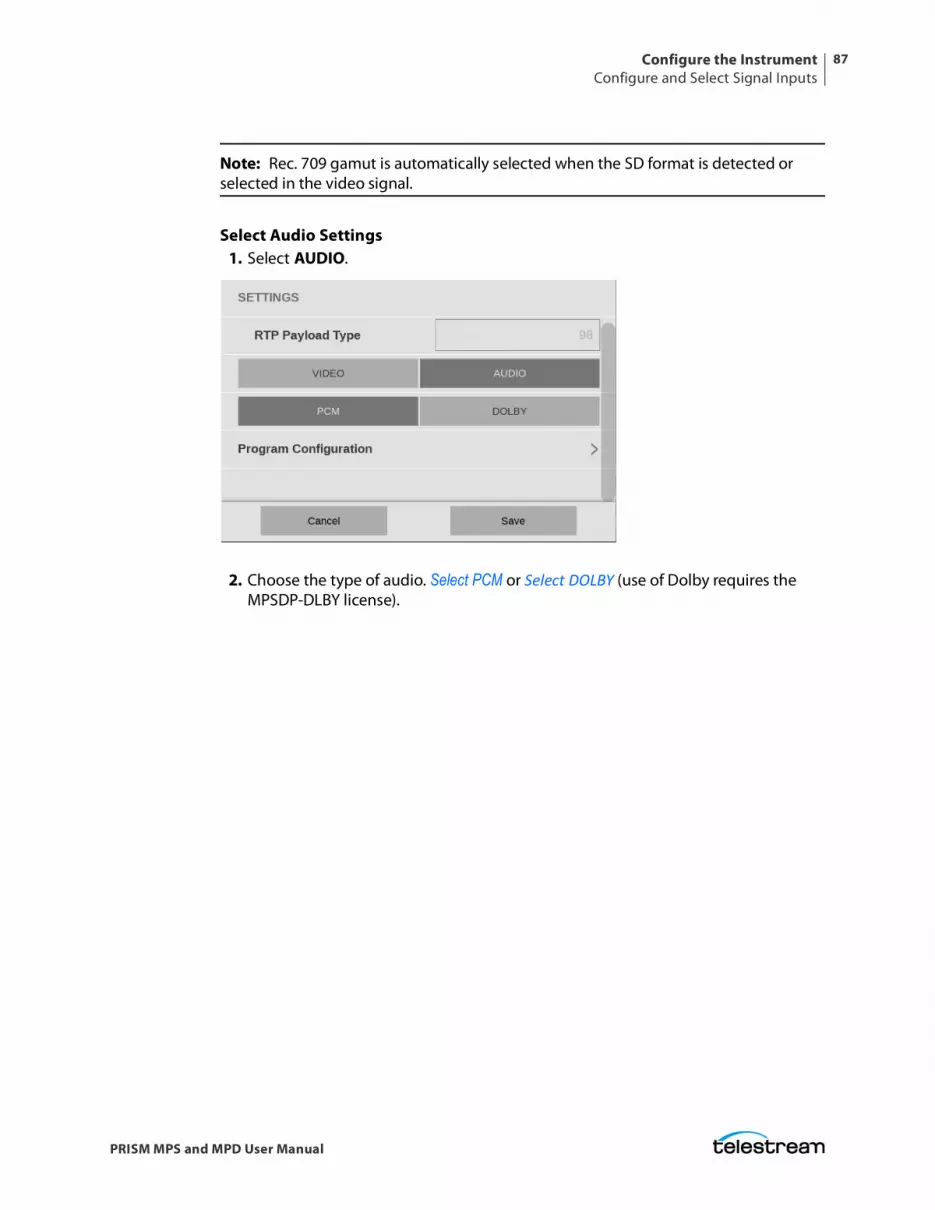
Configure the InstrumentConfigure and Select Signal Inputs
87
PRISM MPS and MPD User Manual
Note: Rec. 709 gamut is automatically selected when the SD format is detected or selected in the video signal.
Select Audio Settings1. Select AUDIO.
2. Choose the type of audio. Select PCM or Select DOLBY (use of Dolby requires the MPSDP-DLBY license).
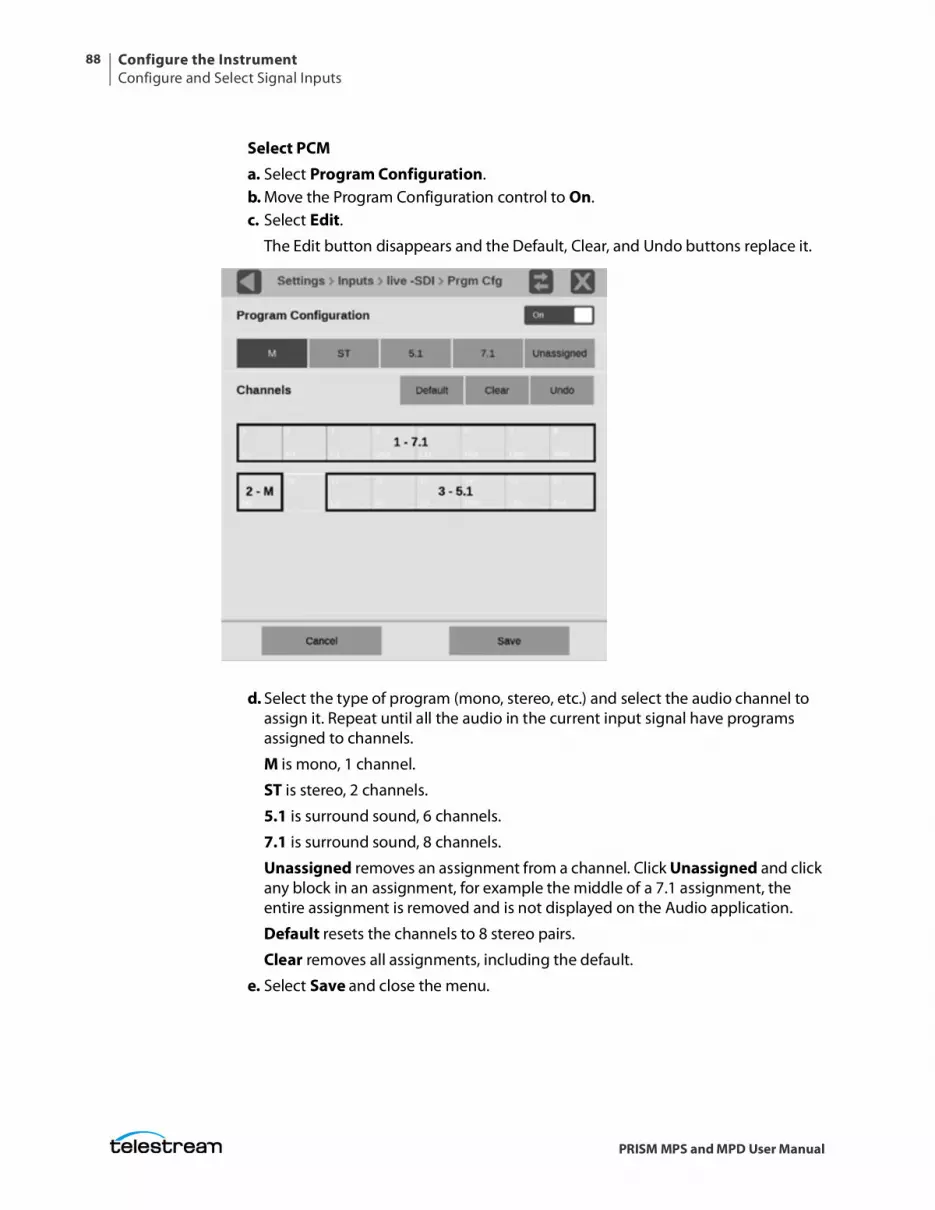
Configure the InstrumentConfigure and Select Signal Inputs
88
PRISM MPS and MPD User Manual
Select PCMa. Select Program Configuration.b. Move the Program Configuration control to On.c. Select Edit.
The Edit button disappears and the Default, Clear, and Undo buttons replace it.
d. Select the type of program (mono, stereo, etc.) and select the audio channel to assign it. Repeat until all the audio in the current input signal have programs assigned to channels.
M is mono, 1 channel.
ST is stereo, 2 channels.
5.1 is surround sound, 6 channels.
7.1 is surround sound, 8 channels.
Unassigned removes an assignment from a channel. Click Unassigned and click any block in an assignment, for example the middle of a 7.1 assignment, the entire assignment is removed and is not displayed on the Audio application.
Default resets the channels to 8 stereo pairs.
Clear removes all assignments, including the default.
e. Select Save and close the menu.
Configure the InstrumentConfigure and Select Signal Inputs
89
PRISM MPS and MPD User Manual
Note: You must save the program configuration to update the programs in the audio bars and loudness meter.
Select DOLBYa. Select DOLBY.b. In the Dolby Audio Channel Pair menu, select the audio channel pair that
contains Dolby audio.
Dolby audio in the selected channels are then decoded. Only Dolby D/D Plus/E decode is supported.
c. Select Save and close the menu.
Note: Audio programs configured in the Program Configuration menu are used to select a program for measurement by the Loudness application, to display audio bars in the Audio application, and to monitor with headphones. When all the channels are unassigned, all the channels are treated as stereo pairs. The audio programs in the Dolby E stream are automatically set up based on the Dolby D/D Plus/E metadata.
3. Configure the data rate. (See Configure Data Rate.)
4. To begin monitoring this input, select the configured input. (See Select Input.)
Configure and Monitor ST21101. Select the Settings icon ( ) to open the Settings menu.
2. Select Inputs to open the Inputs submenu.
3. Select the input from the list.
4. Select IP.
5. Select ST2110.
6. Move the NMOS control to Enabled or Disabled.
Enabling NMOS allows system management software to discover, register, configure the input, and select the active input for monitoring.
Note: NMOS Discovery and Registration must be enabled in the network settings for this control to be available. (See Enable NMOS Discovery and Registration.)
7. Move the Seamless Switching control to Enabled or Disabled.
Note: For Seamless Switching, the two Path 1 and Path 2 streams should be identical. If the streams are not identical, error messages are shown in the Status Bar. There is a difference between “port” and “path”. The port is the physical SFP port that is used to input the 10GE signal. Path 1 and Path 2 are the signal paths to be used for seamless switching.
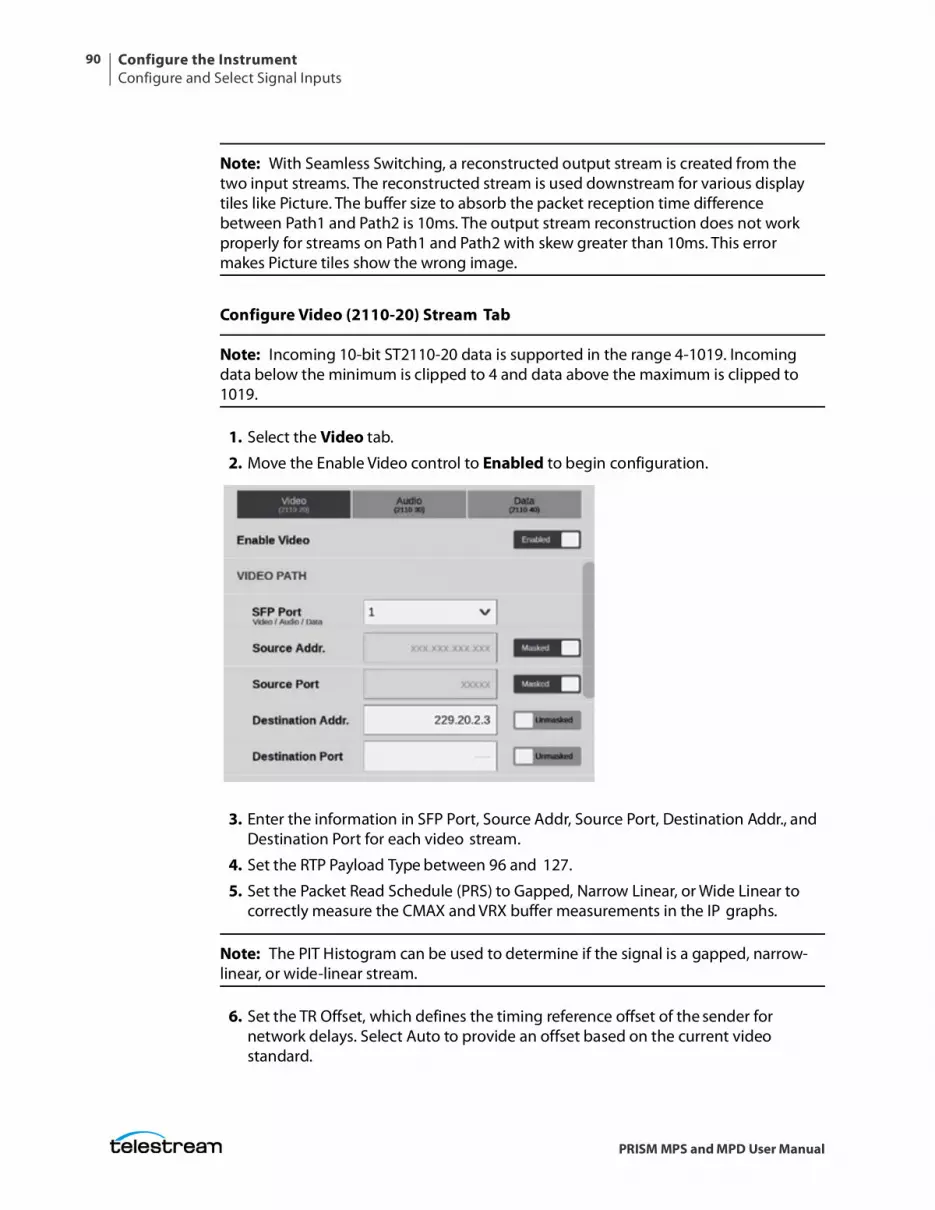
Configure the InstrumentConfigure and Select Signal Inputs
90
PRISM MPS and MPD User Manual
Note: With Seamless Switching, a reconstructed output stream is created from the two input streams. The reconstructed stream is used downstream for various display tiles like Picture. The buffer size to absorb the packet reception time difference between Path1 and Path2 is 10ms. The output stream reconstruction does not work properly for streams on Path1 and Path2 with skew greater than 10ms. This error makes Picture tiles show the wrong image.
Configure Video (2110-20) Stream Tab
Note: Incoming 10-bit ST2110-20 data is supported in the range 4-1019. Incoming data below the minimum is clipped to 4 and data above the maximum is clipped to 1019.
1. Select the Video tab.
2. Move the Enable Video control to Enabled to begin configuration.
3. Enter the information in SFP Port, Source Addr, Source Port, Destination Addr., and Destination Port for each video stream.
4. Set the RTP Payload Type between 96 and 127.
5. Set the Packet Read Schedule (PRS) to Gapped, Narrow Linear, or Wide Linear to correctly measure the CMAX and VRX buffer measurements in the IP graphs.
Note: The PIT Histogram can be used to determine if the signal is a gapped, narrow-linear, or wide-linear stream.
6. Set the TR Offset, which defines the timing reference offset of the sender for network delays. Select Auto to provide an offset based on the current video standard.
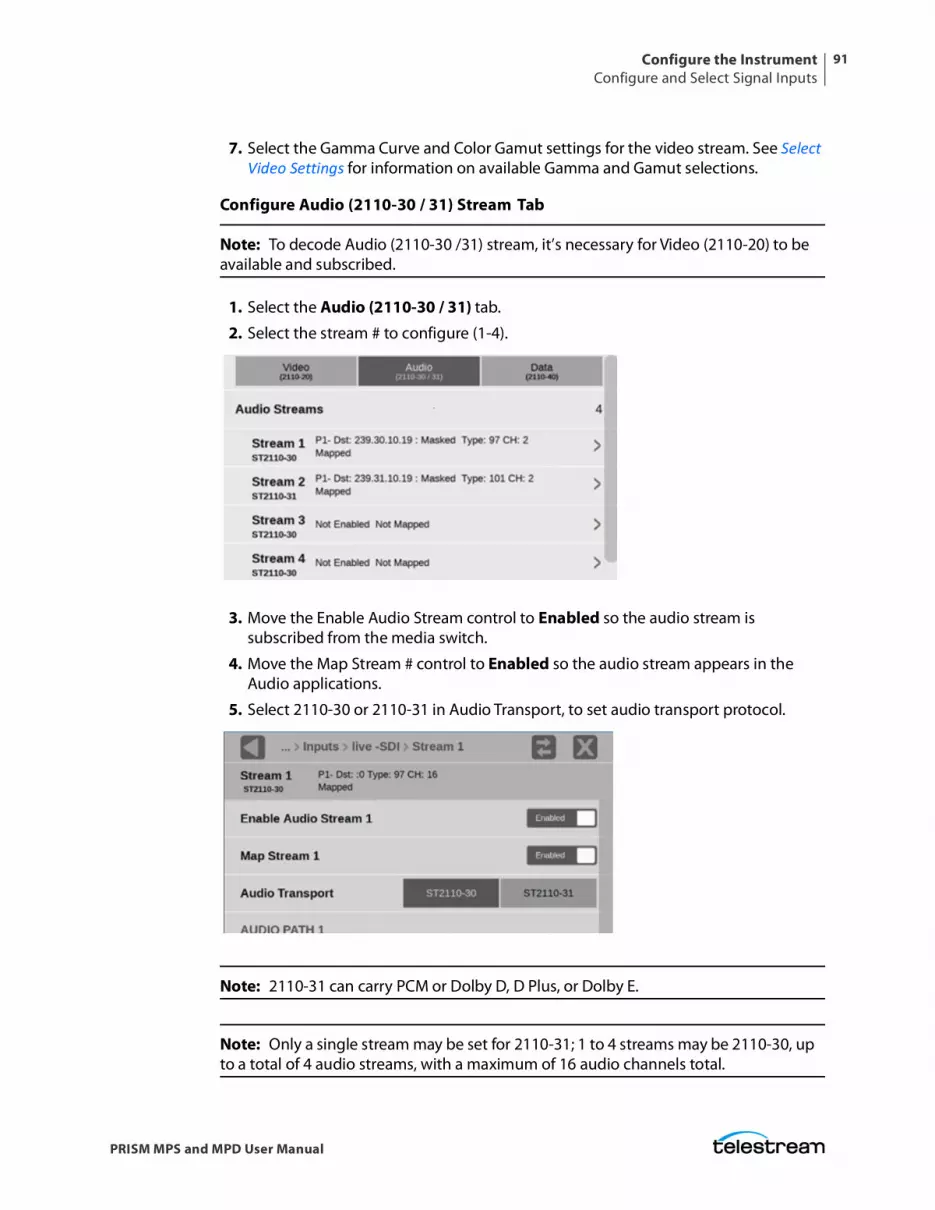
Configure the InstrumentConfigure and Select Signal Inputs
91
PRISM MPS and MPD User Manual
7. Select the Gamma Curve and Color Gamut settings for the video stream. See Select Video Settings for information on available Gamma and Gamut selections.
Configure Audio (2110-30 / 31) Stream Tab
Note: To decode Audio (2110-30 /31) stream, it’s necessary for Video (2110-20) to be available and subscribed.
1. Select the Audio (2110-30 / 31) tab.
2. Select the stream # to configure (1-4).
3. Move the Enable Audio Stream control to Enabled so the audio stream is subscribed from the media switch.
4. Move the Map Stream # control to Enabled so the audio stream appears in the Audio applications.
5. Select 2110-30 or 2110-31 in Audio Transport, to set audio transport protocol.
Note: 2110-31 can carry PCM or Dolby D, D Plus, or Dolby E.
Note: Only a single stream may be set for 2110-31; 1 to 4 streams may be 2110-30, up to a total of 4 audio streams, with a maximum of 16 audio channels total.
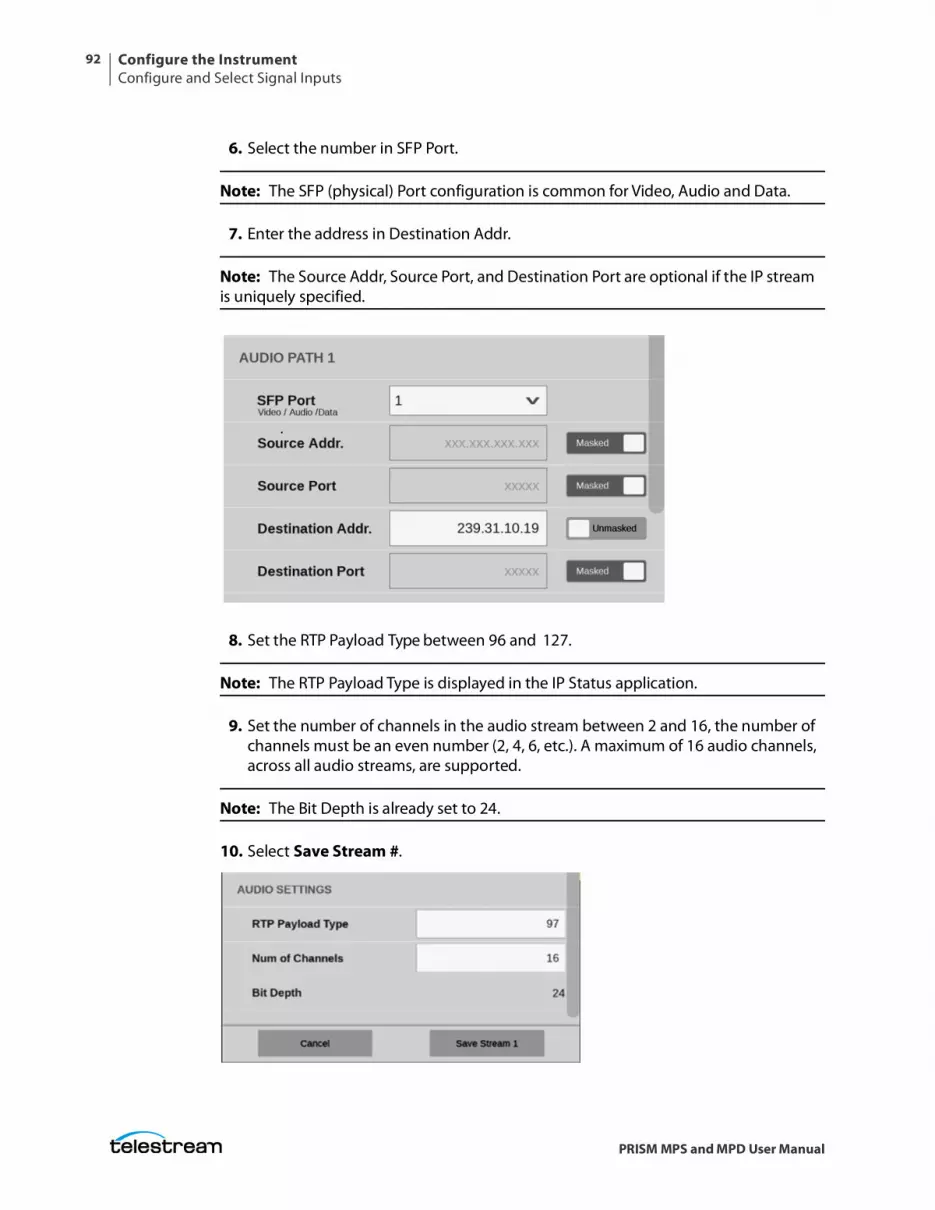
Configure the InstrumentConfigure and Select Signal Inputs
92
PRISM MPS and MPD User Manual
6. Select the number in SFP Port.
Note: The SFP (physical) Port configuration is common for Video, Audio and Data.
7. Enter the address in Destination Addr.
Note: The Source Addr, Source Port, and Destination Port are optional if the IP stream is uniquely specified.
8. Set the RTP Payload Type between 96 and 127.
Note: The RTP Payload Type is displayed in the IP Status application.
9. Set the number of channels in the audio stream between 2 and 16, the number of channels must be an even number (2, 4, 6, etc.). A maximum of 16 audio channels, across all audio streams, are supported.
Note: The Bit Depth is already set to 24.
10. Select Save Stream #.
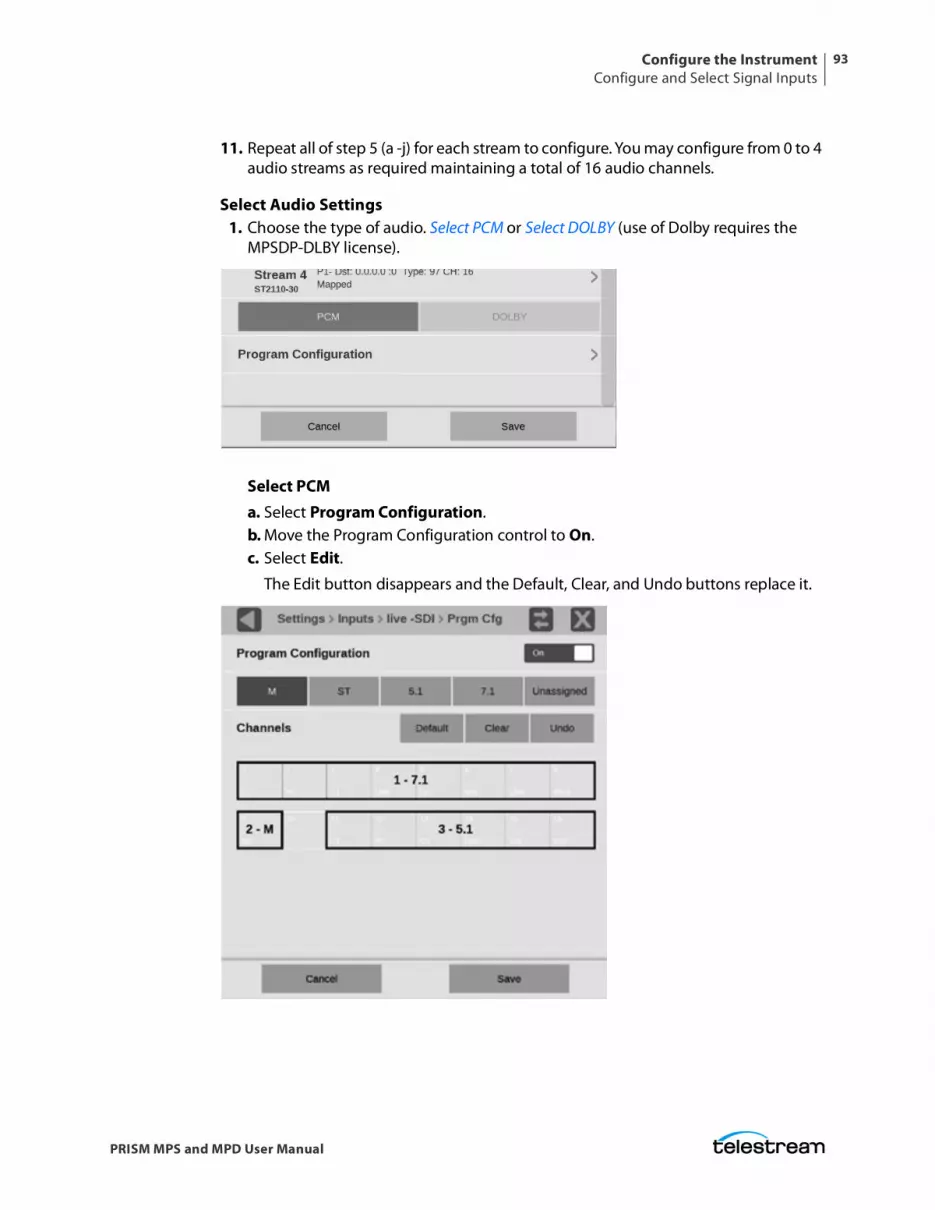
Configure the InstrumentConfigure and Select Signal Inputs
93
PRISM MPS and MPD User Manual
11. Repeat all of step 5 (a -j) for each stream to configure. You may configure from 0 to 4 audio streams as required maintaining a total of 16 audio channels.
Select Audio Settings1. Choose the type of audio. Select PCM or Select DOLBY (use of Dolby requires the
MPSDP-DLBY license).
Select PCMa. Select Program Configuration.b. Move the Program Configuration control to On.c. Select Edit.
The Edit button disappears and the Default, Clear, and Undo buttons replace it.
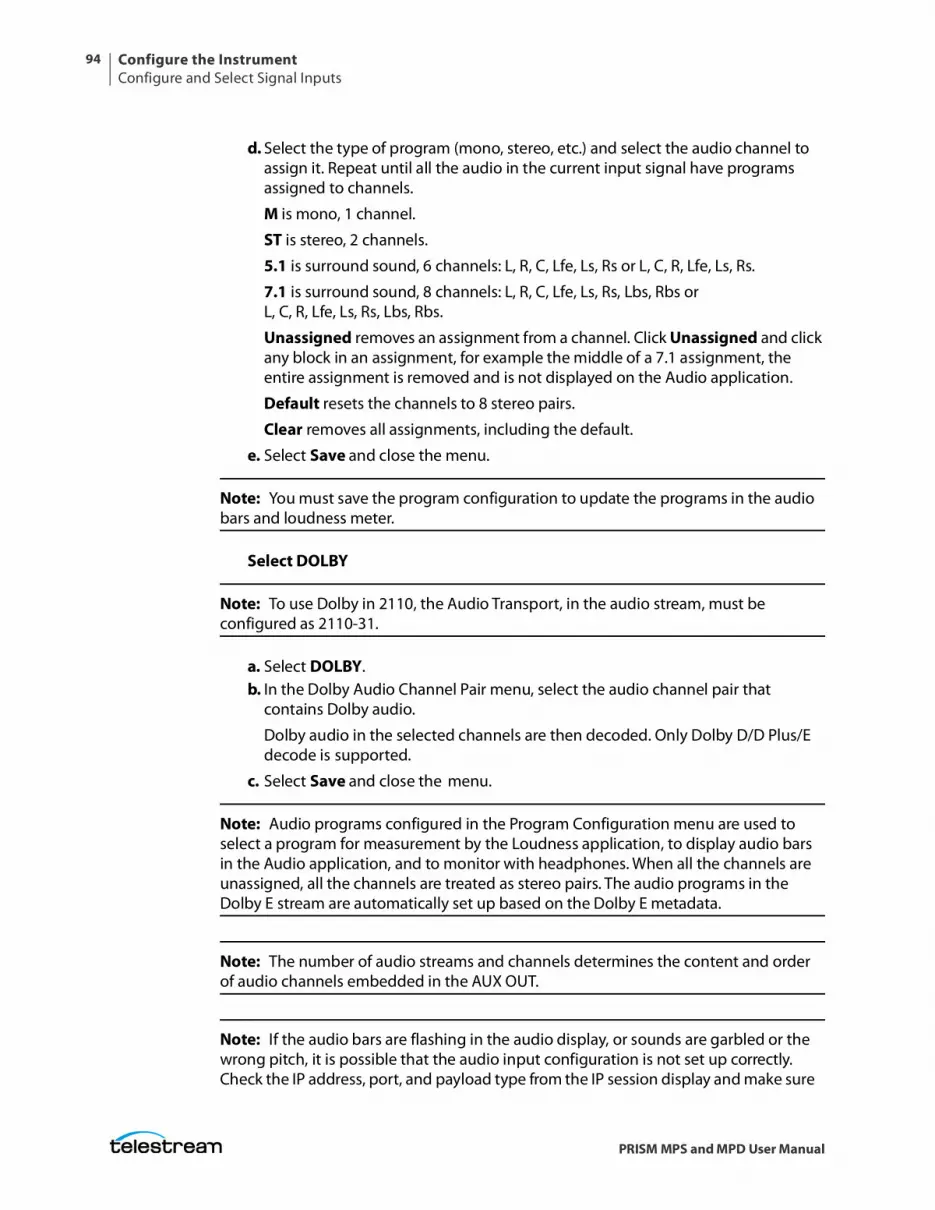
Configure the InstrumentConfigure and Select Signal Inputs
94
PRISM MPS and MPD User Manual
d. Select the type of program (mono, stereo, etc.) and select the audio channel to assign it. Repeat until all the audio in the current input signal have programs assigned to channels.
M is mono, 1 channel.
ST is stereo, 2 channels.
5.1 is surround sound, 6 channels: L, R, C, Lfe, Ls, Rs or L, C, R, Lfe, Ls, Rs.
7.1 is surround sound, 8 channels: L, R, C, Lfe, Ls, Rs, Lbs, Rbs or L, C, R, Lfe, Ls, Rs, Lbs, Rbs.
Unassigned removes an assignment from a channel. Click Unassigned and click any block in an assignment, for example the middle of a 7.1 assignment, the entire assignment is removed and is not displayed on the Audio application.
Default resets the channels to 8 stereo pairs.
Clear removes all assignments, including the default.
e. Select Save and close the menu.
Note: You must save the program configuration to update the programs in the audio bars and loudness meter.
Select DOLBY
Note: To use Dolby in 2110, the Audio Transport, in the audio stream, must be configured as 2110-31.
a. Select DOLBY.b. In the Dolby Audio Channel Pair menu, select the audio channel pair that
contains Dolby audio.
Dolby audio in the selected channels are then decoded. Only Dolby D/D Plus/E decode is supported.
c. Select Save and close the menu.
Note: Audio programs configured in the Program Configuration menu are used to select a program for measurement by the Loudness application, to display audio bars in the Audio application, and to monitor with headphones. When all the channels are unassigned, all the channels are treated as stereo pairs. The audio programs in the Dolby E stream are automatically set up based on the Dolby E metadata.
Note: The number of audio streams and channels determines the content and order of audio channels embedded in the AUX OUT.
Note: If the audio bars are flashing in the audio display, or sounds are garbled or the wrong pitch, it is possible that the audio input configuration is not set up correctly. Check the IP address, port, and payload type from the IP session display and make sure
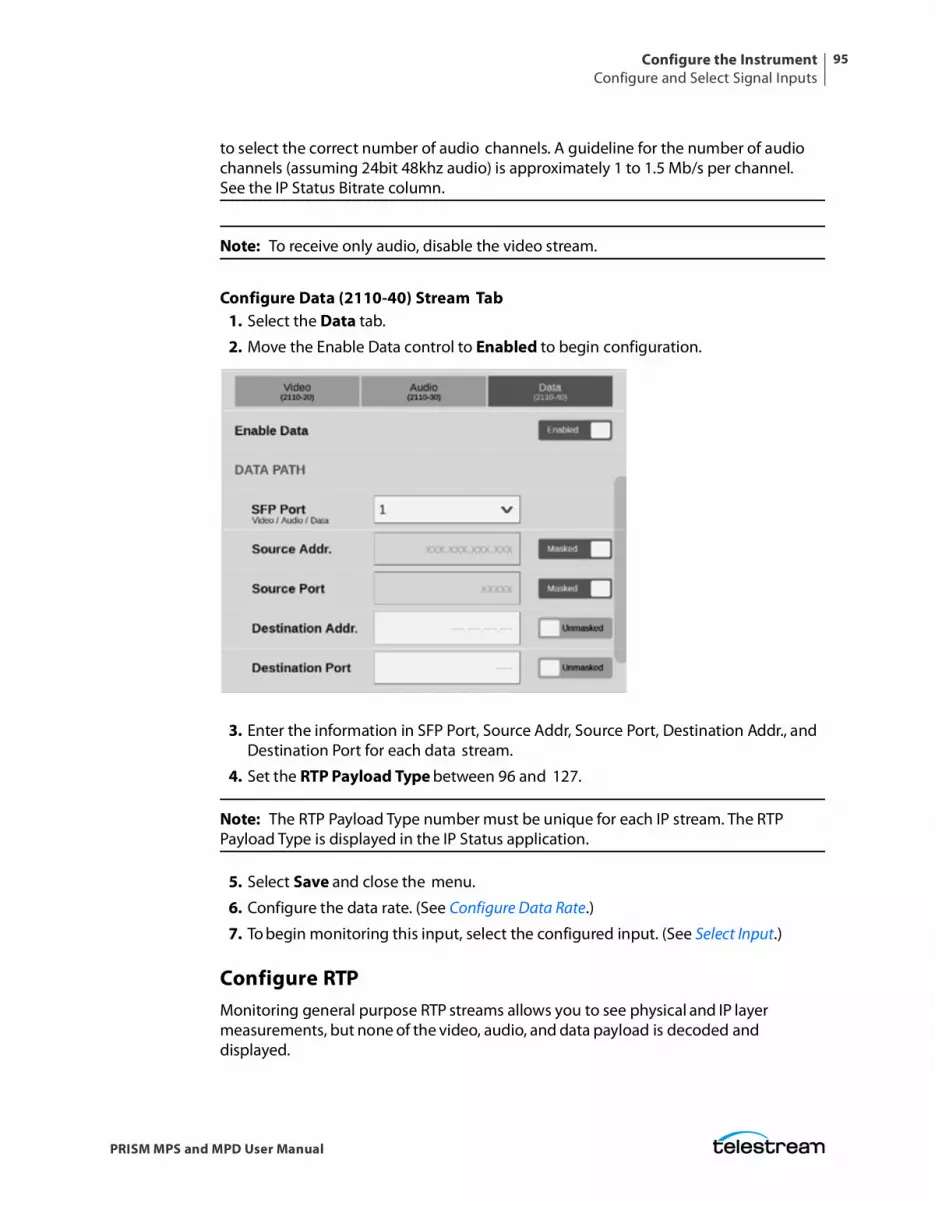
Configure the InstrumentConfigure and Select Signal Inputs
95
PRISM MPS and MPD User Manual
to select the correct number of audio channels. A guideline for the number of audio channels (assuming 24bit 48khz audio) is approximately 1 to 1.5 Mb/s per channel. See the IP Status Bitrate column.
Note: To receive only audio, disable the video stream.
Configure Data (2110-40) Stream Tab1. Select the Data tab.
2. Move the Enable Data control to Enabled to begin configuration.
3. Enter the information in SFP Port, Source Addr, Source Port, Destination Addr., and Destination Port for each data stream.
4. Set the RTP Payload Type between 96 and 127.
Note: The RTP Payload Type number must be unique for each IP stream. The RTP Payload Type is displayed in the IP Status application.
5. Select Save and close the menu.
6. Configure the data rate. (See Configure Data Rate.)
7. To begin monitoring this input, select the configured input. (See Select Input.)
Configure RTPMonitoring general purpose RTP streams allows you to see physical and IP layer measurements, but none of the video, audio, and data payload is decoded and displayed.
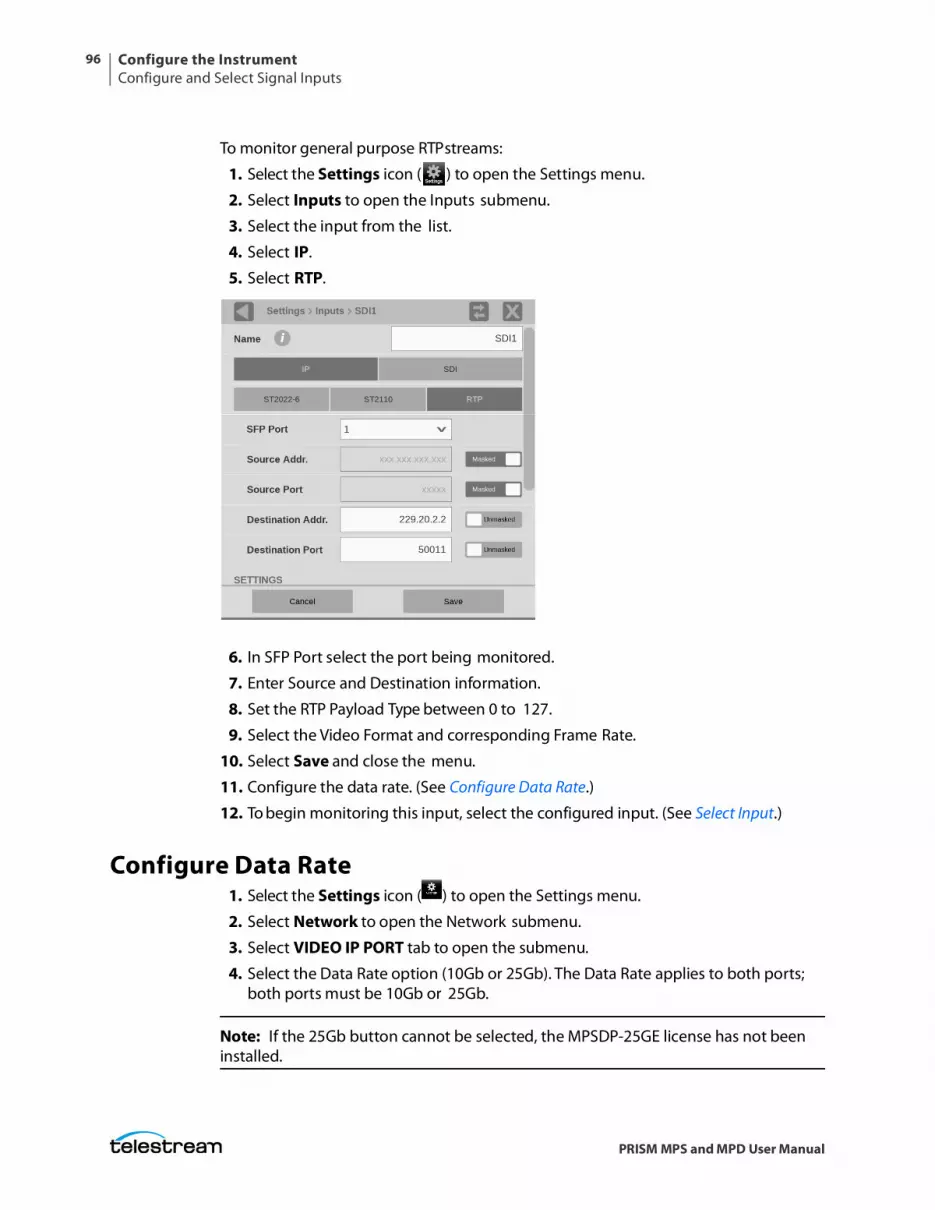
Configure the InstrumentConfigure and Select Signal Inputs
96
PRISM MPS and MPD User Manual
To monitor general purpose RTP streams:
1. Select the Settings icon ( ) to open the Settings menu.
2. Select Inputs to open the Inputs submenu.
3. Select the input from the list.
4. Select IP.
5. Select RTP.
6. In SFP Port select the port being monitored.
7. Enter Source and Destination information.
8. Set the RTP Payload Type between 0 to 127.
9. Select the Video Format and corresponding Frame Rate.
10. Select Save and close the menu.
11. Configure the data rate. (See Configure Data Rate.)
12. To begin monitoring this input, select the configured input. (See Select Input.)
Configure Data Rate1. Select the Settings icon ( ) to open the Settings menu.
2. Select Network to open the Network submenu.
3. Select VIDEO IP PORT tab to open the submenu.
4. Select the Data Rate option (10Gb or 25Gb). The Data Rate applies to both ports; both ports must be 10Gb or 25Gb.
Note: If the 25Gb button cannot be selected, the MPSDP-25GE license has not been installed.
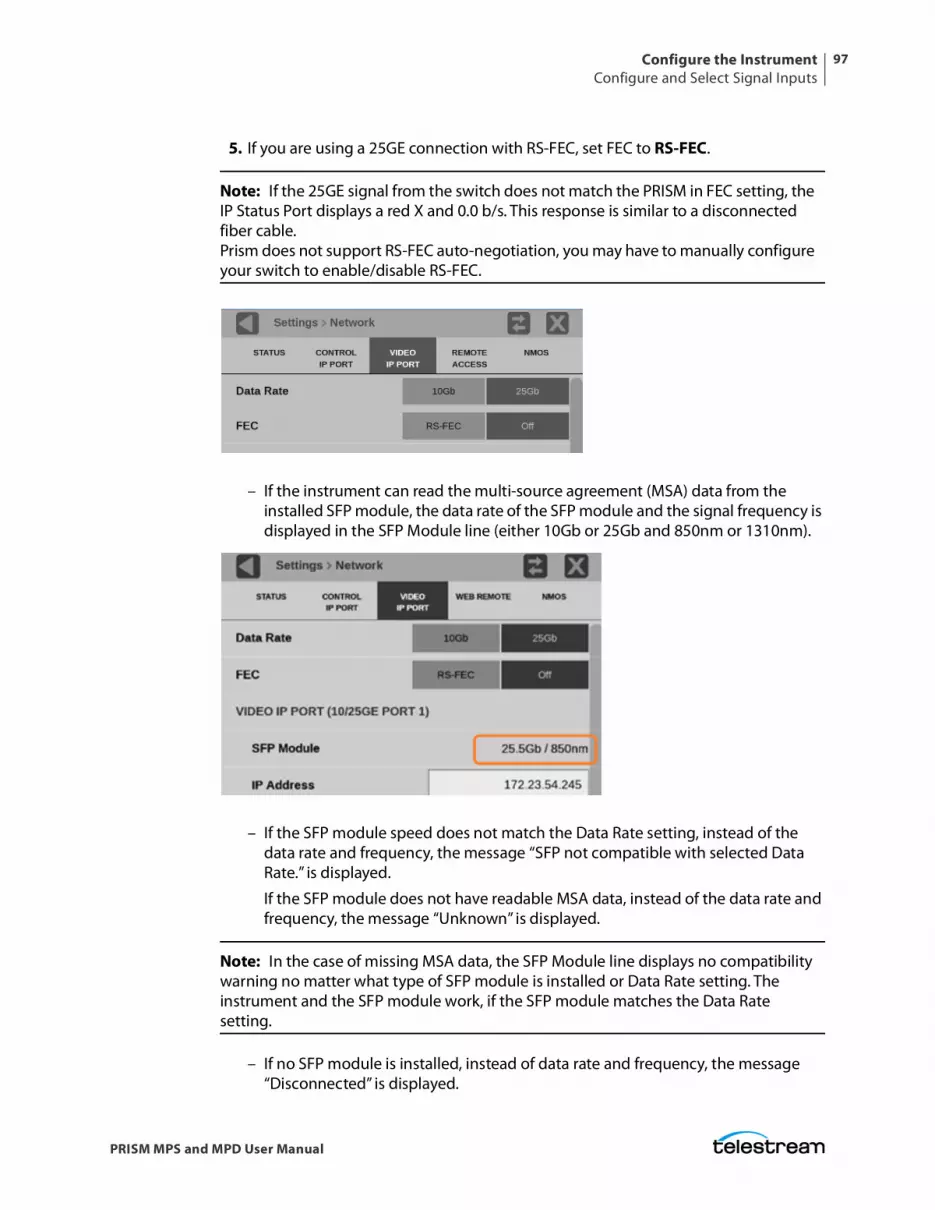
Configure the InstrumentConfigure and Select Signal Inputs
97
PRISM MPS and MPD User Manual
5. If you are using a 25GE connection with RS-FEC, set FEC to RS-FEC.
Note: If the 25GE signal from the switch does not match the PRISM in FEC setting, the IP Status Port displays a red X and 0.0 b/s. This response is similar to a disconnected fiber cable. Prism does not support RS-FEC auto-negotiation, you may have to manually configure your switch to enable/disable RS-FEC.
– If the instrument can read the multi-source agreement (MSA) data from the installed SFP module, the data rate of the SFP module and the signal frequency is displayed in the SFP Module line (either 10Gb or 25Gb and 850nm or 1310nm).
– If the SFP module speed does not match the Data Rate setting, instead of the data rate and frequency, the message “SFP not compatible with selected Data Rate.” is displayed.
If the SFP module does not have readable MSA data, instead of the data rate and frequency, the message “Unknown” is displayed.
Note: In the case of missing MSA data, the SFP Module line displays no compatibility warning no matter what type of SFP module is installed or Data Rate setting. The instrument and the SFP module work, if the SFP module matches the Data Rate setting.
– If no SFP module is installed, instead of data rate and frequency, the message “Disconnected” is displayed.
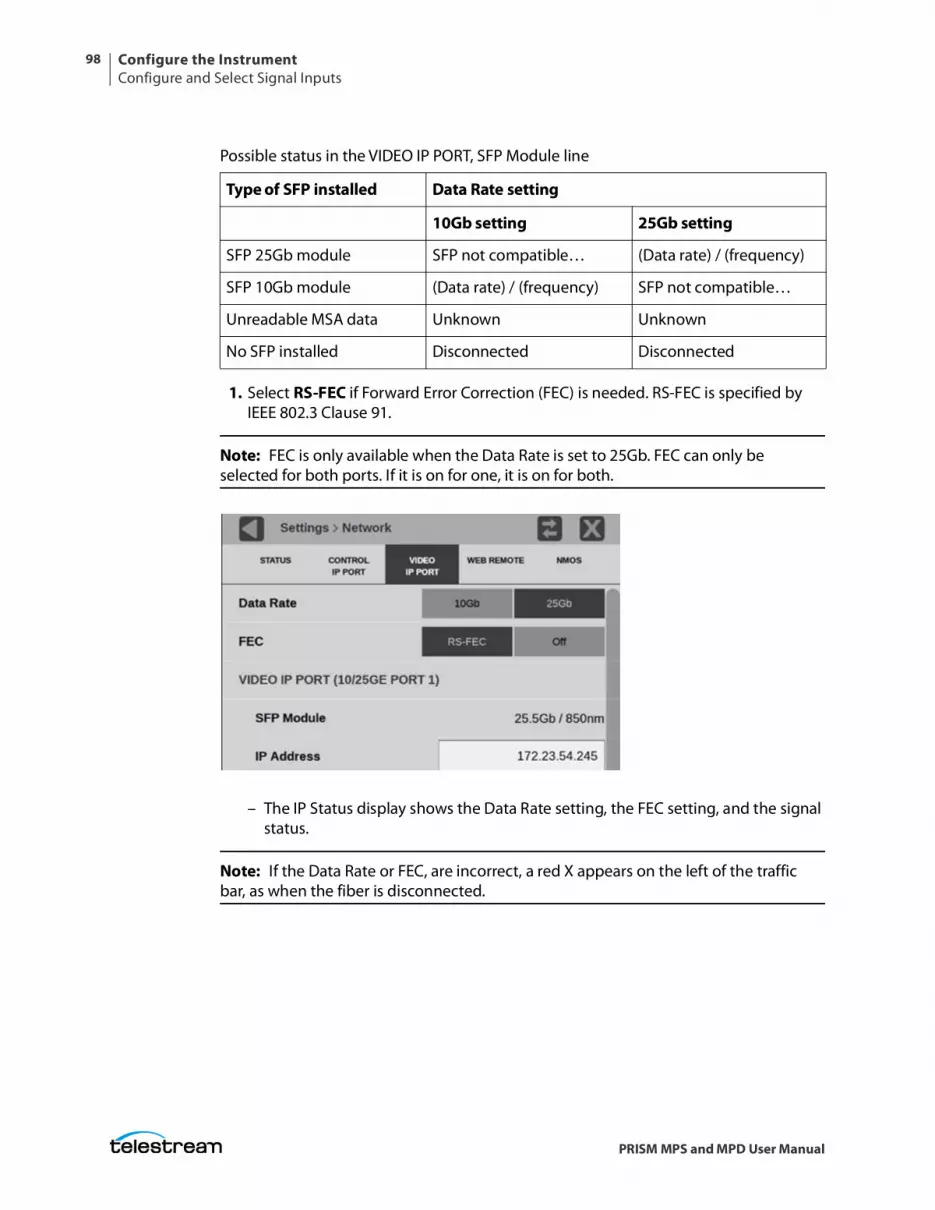
Configure the InstrumentConfigure and Select Signal Inputs
98
PRISM MPS and MPD User Manual
1. Select RS-FEC if Forward Error Correction (FEC) is needed. RS-FEC is specified by IEEE 802.3 Clause 91.
Note: FEC is only available when the Data Rate is set to 25Gb. FEC can only be selected for both ports. If it is on for one, it is on for both.
– The IP Status display shows the Data Rate setting, the FEC setting, and the signal status.
Note: If the Data Rate or FEC, are incorrect, a red X appears on the left of the traffic bar, as when the fiber is disconnected.
Possible status in the VIDEO IP PORT, SFP Module line
Type of SFP installed Data Rate setting
10Gb setting 25Gb setting
SFP 25Gb module SFP not compatible… (Data rate) / (frequency)
SFP 10Gb module (Data rate) / (frequency) SFP not compatible…
Unreadable MSA data Unknown Unknown
No SFP installed Disconnected Disconnected
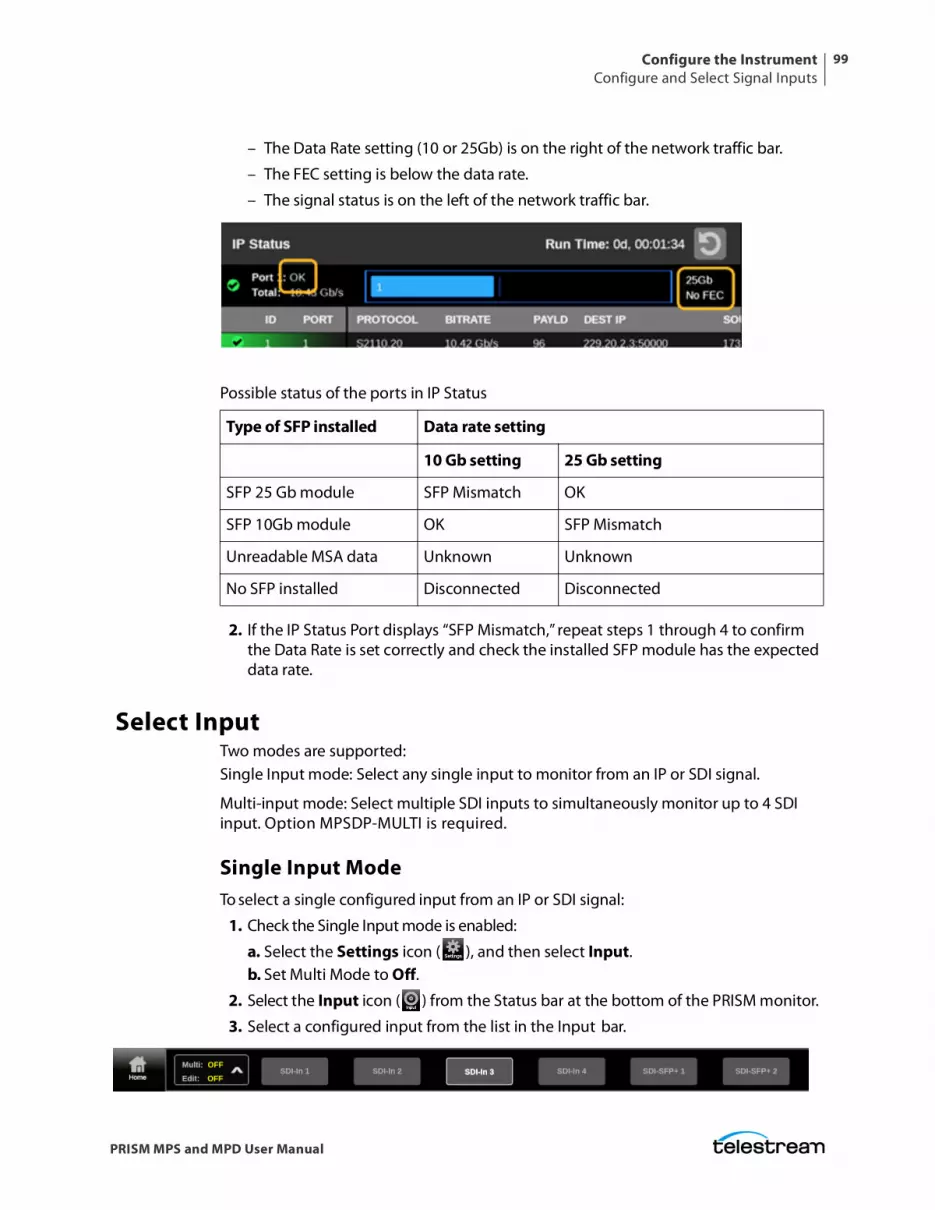
Configure the InstrumentConfigure and Select Signal Inputs
99
PRISM MPS and MPD User Manual
– The Data Rate setting (10 or 25Gb) is on the right of the network traffic bar.
– The FEC setting is below the data rate.
– The signal status is on the left of the network traffic bar.
2. If the IP Status Port displays “SFP Mismatch,” repeat steps 1 through 4 to confirm the Data Rate is set correctly and check the installed SFP module has the expected data rate.
Select InputTwo modes are supported:Single Input mode: Select any single input to monitor from an IP or SDI signal.
Multi-input mode: Select multiple SDI inputs to simultaneously monitor up to 4 SDI input. Option MPSDP-MULTI is required.
Single Input ModeTo select a single configured input from an IP or SDI signal:
1. Check the Single Input mode is enabled:
a. Select the Settings icon ( ), and then select Input.b. Set Multi Mode to Off.
2. Select the Input icon ( ) from the Status bar at the bottom of the PRISM monitor.
3. Select a configured input from the list in the Input bar.
Possible status of the ports in IP Status
Type of SFP installed Data rate setting
10 Gb setting 25 Gb setting
SFP 25 Gb module SFP Mismatch OK
SFP 10Gb module OK SFP Mismatch
Unreadable MSA data Unknown Unknown
No SFP installed Disconnected Disconnected
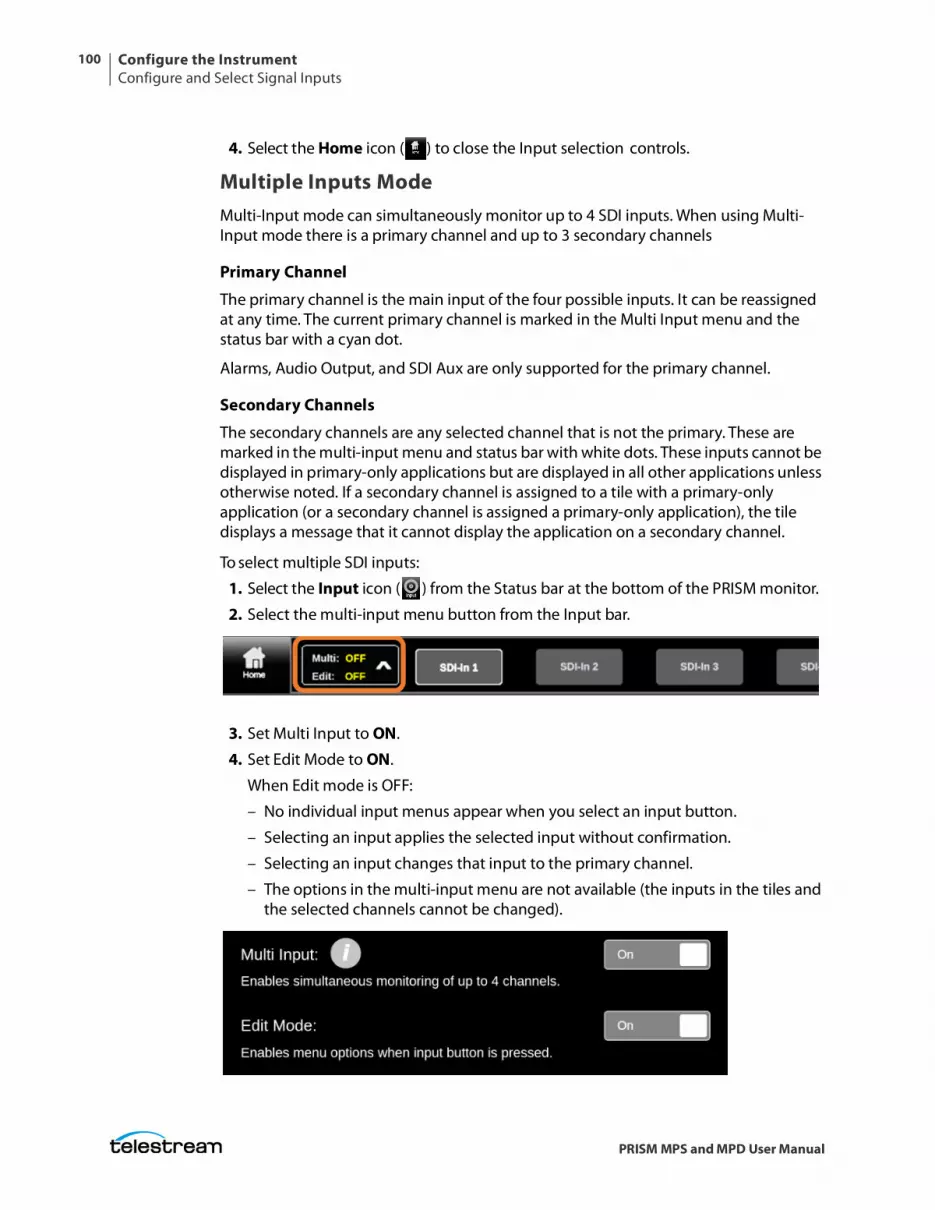
Configure the InstrumentConfigure and Select Signal Inputs
100
PRISM MPS and MPD User Manual
4. Select the Home icon ( ) to close the Input selection controls.
Multiple Inputs ModeMulti-Input mode can simultaneously monitor up to 4 SDI inputs. When using Multi-Input mode there is a primary channel and up to 3 secondary channels
Primary Channel
The primary channel is the main input of the four possible inputs. It can be reassigned at any time. The current primary channel is marked in the Multi Input menu and the status bar with a cyan dot.
Alarms, Audio Output, and SDI Aux are only supported for the primary channel.
Secondary Channels
The secondary channels are any selected channel that is not the primary. These are marked in the multi-input menu and status bar with white dots. These inputs cannot be displayed in primary-only applications but are displayed in all other applications unless otherwise noted. If a secondary channel is assigned to a tile with a primary-only application (or a secondary channel is assigned a primary-only application), the tile displays a message that it cannot display the application on a secondary channel.
To select multiple SDI inputs:
1. Select the Input icon ( ) from the Status bar at the bottom of the PRISM monitor.
2. Select the multi-input menu button from the Input bar.
3. Set Multi Input to ON.
4. Set Edit Mode to ON.
When Edit mode is OFF:
– No individual input menus appear when you select an input button.
– Selecting an input applies the selected input without confirmation.
– Selecting an input changes that input to the primary channel.
– The options in the multi-input menu are not available (the inputs in the tiles and the selected channels cannot be changed).
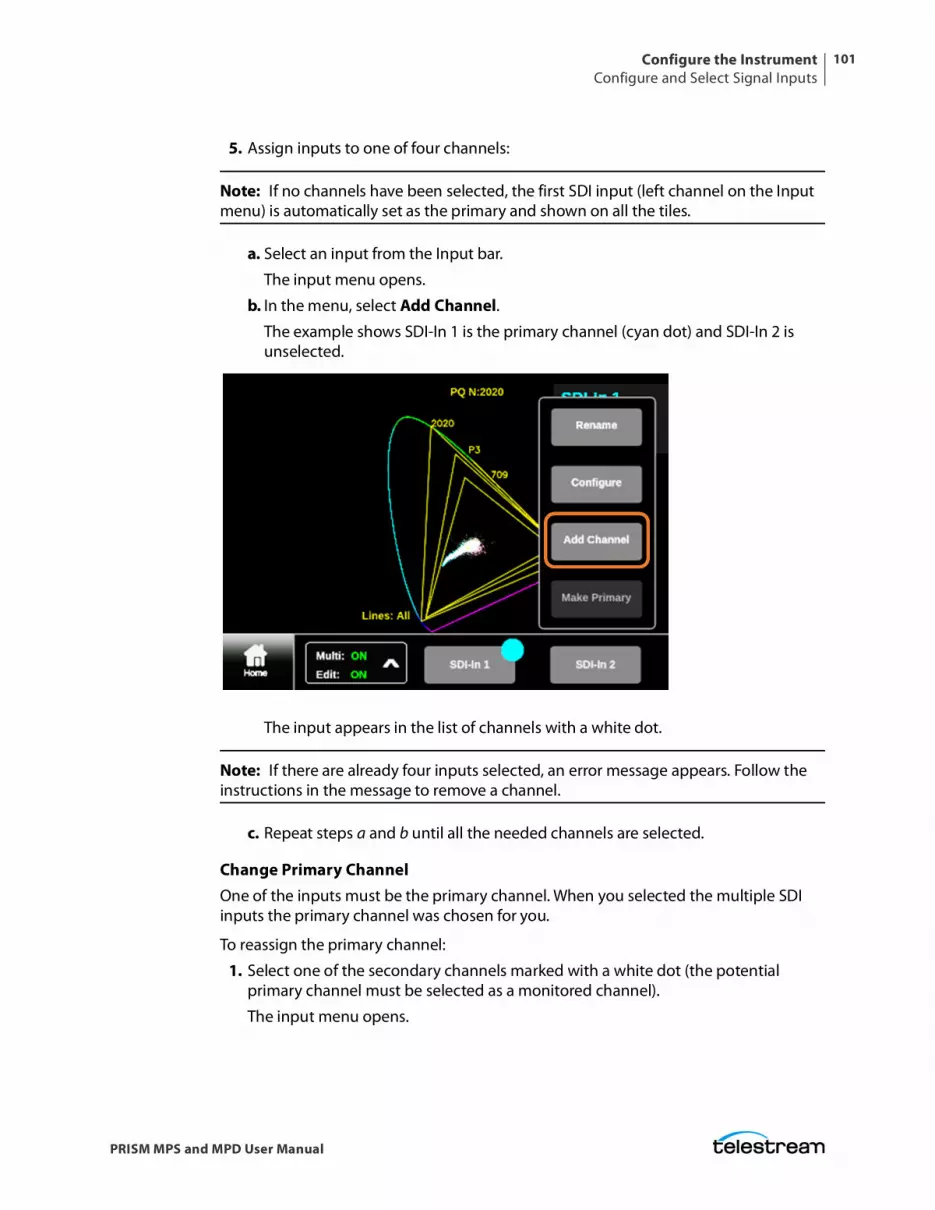
Configure the InstrumentConfigure and Select Signal Inputs
101
PRISM MPS and MPD User Manual
5. Assign inputs to one of four channels:
Note: If no channels have been selected, the first SDI input (left channel on the Input menu) is automatically set as the primary and shown on all the tiles.
a. Select an input from the Input bar.
The input menu opens.
b. In the menu, select Add Channel. The example shows SDI-In 1 is the primary channel (cyan dot) and SDI-In 2 is unselected.
The input appears in the list of channels with a white dot.
Note: If there are already four inputs selected, an error message appears. Follow the instructions in the message to remove a channel.
c. Repeat steps a and b until all the needed channels are selected.
Change Primary ChannelOne of the inputs must be the primary channel. When you selected the multiple SDI inputs the primary channel was chosen for you.
To reassign the primary channel:
1. Select one of the secondary channels marked with a white dot (the potential primary channel must be selected as a monitored channel).
The input menu opens.
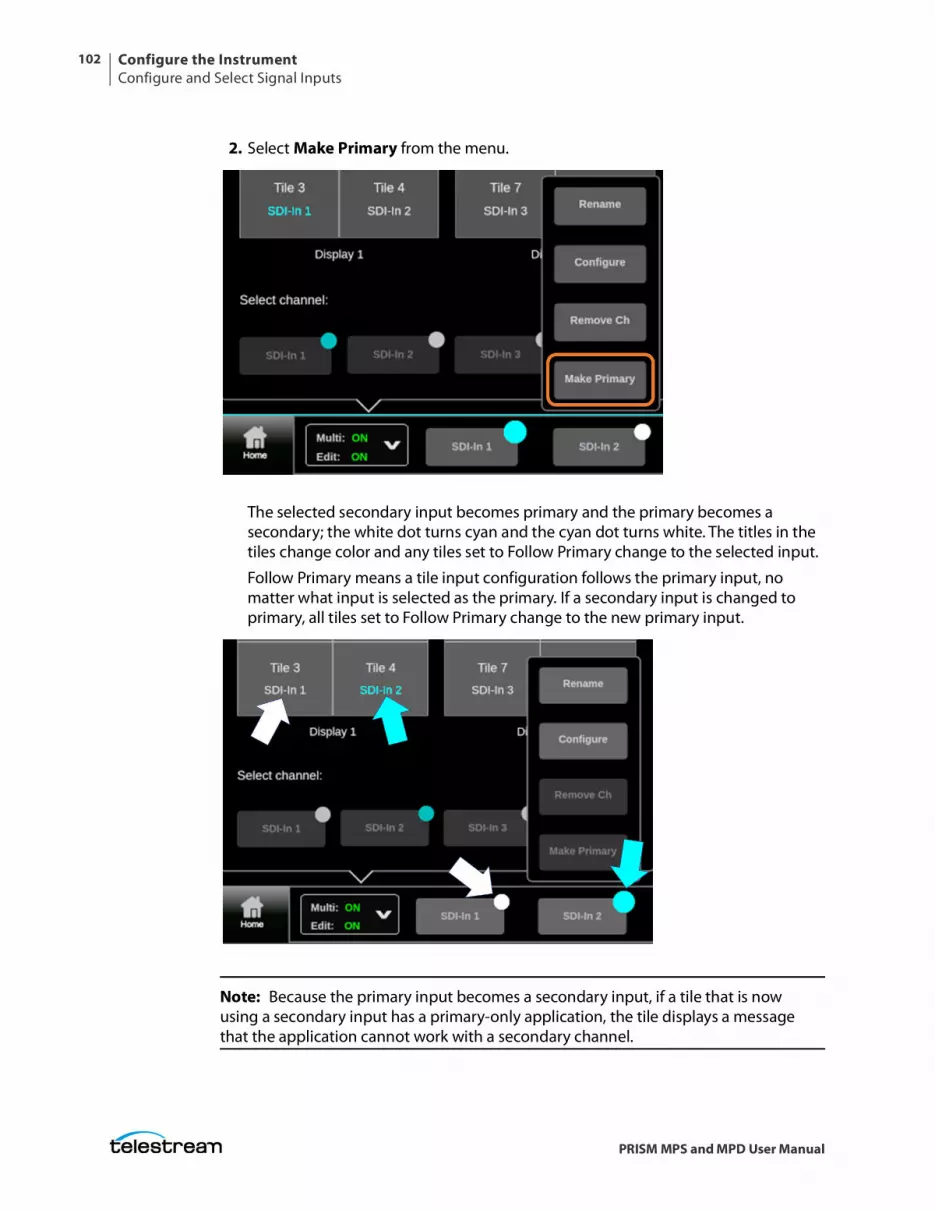
Configure the InstrumentConfigure and Select Signal Inputs
102
PRISM MPS and MPD User Manual
2. Select Make Primary from the menu.
The selected secondary input becomes primary and the primary becomes a secondary; the white dot turns cyan and the cyan dot turns white. The titles in the tiles change color and any tiles set to Follow Primary change to the selected input.
Follow Primary means a tile input configuration follows the primary input, no matter what input is selected as the primary. If a secondary input is changed to primary, all tiles set to Follow Primary change to the new primary input.
Note: Because the primary input becomes a secondary input, if a tile that is now using a secondary input has a primary-only application, the tile displays a message that the application cannot work with a secondary channel.
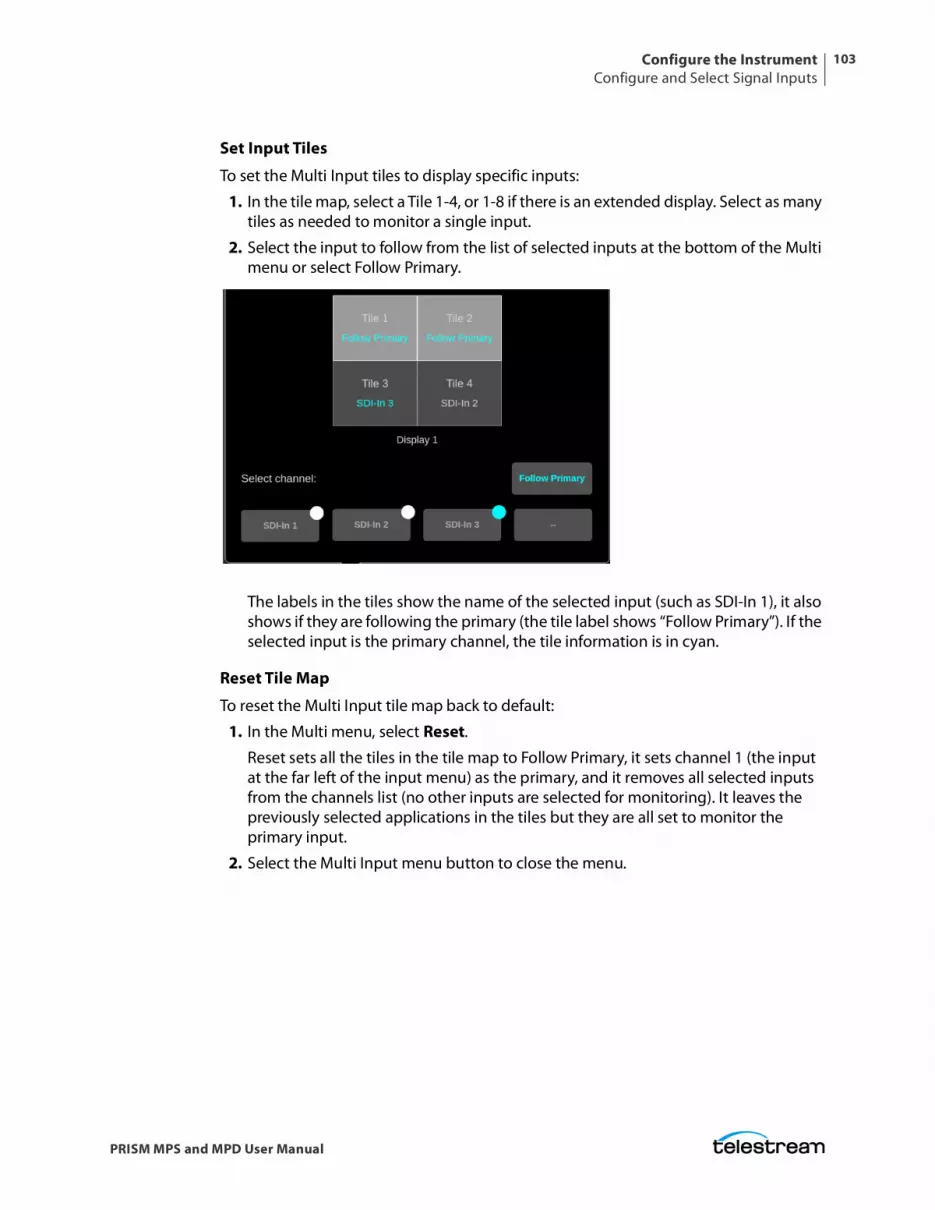
Configure the InstrumentConfigure and Select Signal Inputs
103
PRISM MPS and MPD User Manual
Set Input Tiles
To set the Multi Input tiles to display specific inputs:
1. In the tile map, select a Tile 1-4, or 1-8 if there is an extended display. Select as many tiles as needed to monitor a single input.
2. Select the input to follow from the list of selected inputs at the bottom of the Multi menu or select Follow Primary.
The labels in the tiles show the name of the selected input (such as SDI-In 1), it also shows if they are following the primary (the tile label shows “Follow Primary”). If the selected input is the primary channel, the tile information is in cyan.
Reset Tile Map
To reset the Multi Input tile map back to default:
1. In the Multi menu, select Reset.
Reset sets all the tiles in the tile map to Follow Primary, it sets channel 1 (the input at the far left of the input menu) as the primary, and it removes all selected inputs from the channels list (no other inputs are selected for monitoring). It leaves the previously selected applications in the tiles but they are all set to monitor the primary input.
2. Select the Multi Input menu button to close the menu.
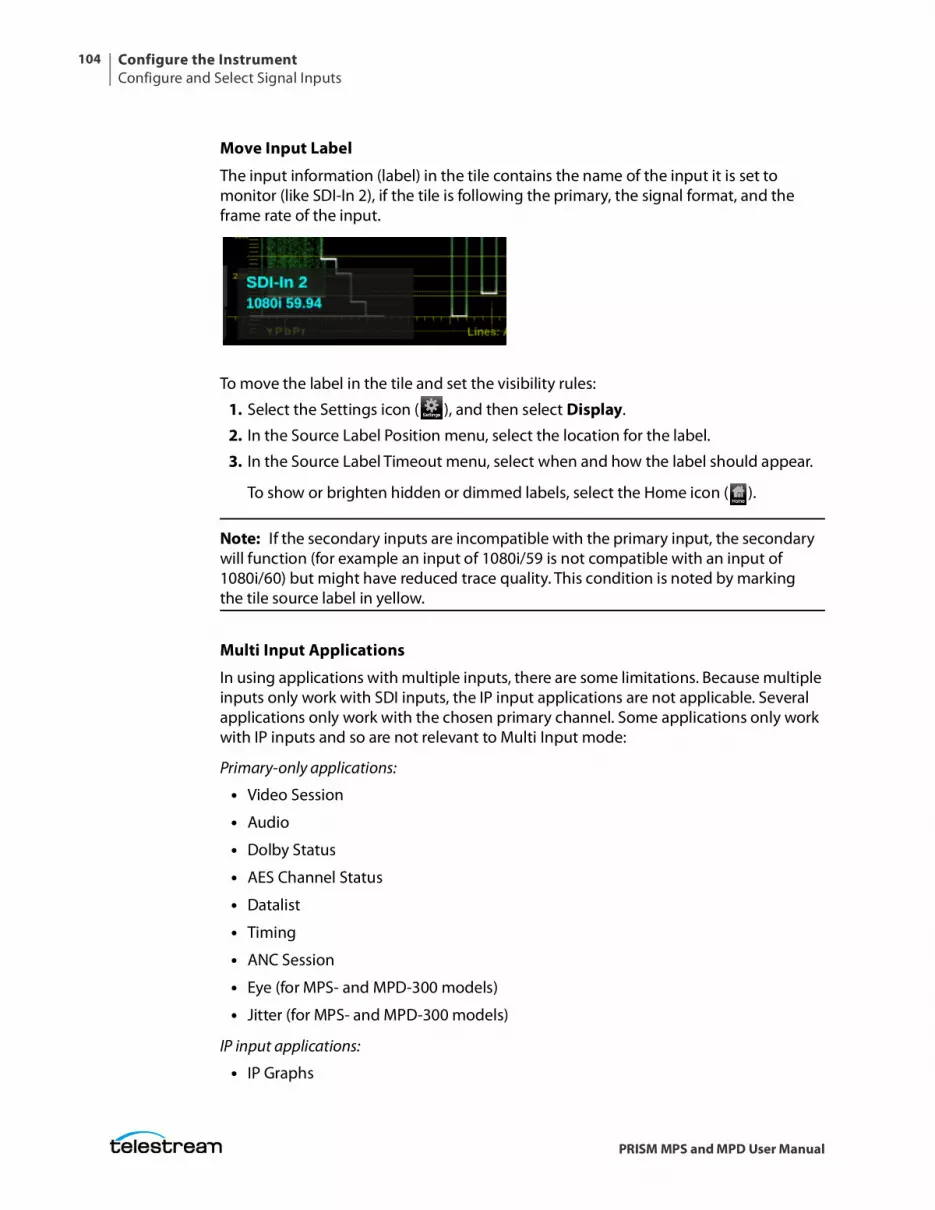
Configure the InstrumentConfigure and Select Signal Inputs
104
PRISM MPS and MPD User Manual
Move Input Label
The input information (label) in the tile contains the name of the input it is set to monitor (like SDI-In 2), if the tile is following the primary, the signal format, and the frame rate of the input.
To move the label in the tile and set the visibility rules:
1. Select the Settings icon ( ), and then select Display.
2. In the Source Label Position menu, select the location for the label.
3. In the Source Label Timeout menu, select when and how the label should appear.
To show or brighten hidden or dimmed labels, select the Home icon ( ).
Note: If the secondary inputs are incompatible with the primary input, the secondary will function (for example an input of 1080i/59 is not compatible with an input of 1080i/60) but might have reduced trace quality. This condition is noted by marking the tile source label in yellow.
Multi Input Applications
In using applications with multiple inputs, there are some limitations. Because multiple inputs only work with SDI inputs, the IP input applications are not applicable. Several applications only work with the chosen primary channel. Some applications only work with IP inputs and so are not relevant to Multi Input mode:
Primary-only applications:
• Video Session
• Audio
• Dolby Status
• AES Channel Status
• Datalist
• Timing
• ANC Session
• Eye (for MPS- and MPD-300 models)
• Jitter (for MPS- and MPD-300 models)
IP input applications:
• IP Graphs
Configure the InstrumentConfigure and Select Signal Inputs
105
PRISM MPS and MPD User Manual
• Stream Timing
• PIT Histogram
Note: These primary-only applications are marked with a cyan dot when the Multi Input mode is on. The applications are marked in the Application bar and the All Application menu.
IP applications that are not tied to IP Inputs are functional in Multi Input mode:
• IP Status
• IP Session (Layer 1, Layer 2, and PTP)
• PTP Graphs
Note: These Picture application functions are only available to the primary channel: closed captions (subtitles), picture measurements, and lightmeters.
Set for 2110 Fast Switching
Note: This step sets up the instrument for 2110 fast switching between inputs. This mode enables a make-before-break setting for 2110 signals. The system subscribes to the second video stream, switches during the marker bit, and then unsubscribes from the first stream.
Note: Twice the bandwidth is required to handle two IP streams during input transitions. If there is insufficient bandwidth for the make-before-break operation, the system will drop packets during the transition. In this situation you might want to disable this feature. This condition will likely occur for 4K/50p signals on a 10G network or if there are other signals on the link.
Fast switching benefits:• Switching between inputs displays complete frames on the picture application.
• It reduces switching errors in the event log.
• SDI Aux out switches between the two sources.
Prerequisites for 2110 fast switching:• The inputs must be the same exact resolution, frame rate and sample structure.
• The 2110-20 video inputs must both be locked to PTP and well timed.
• The virtual inputs being switched must have the format specified, or for NMOS applications the format specified in the SDP file.
Configure the InstrumentConfigure and Select Signal Inputs
106
PRISM MPS and MPD User Manual
Set 2110 Fast Switching through UI1. Set up the first IP input. See Configure and Monitor ST2110 for how to set up an IP
2110 input.
2. Set up the second input the same as the first.
– The second input must have an identical resolution, frame rate, and sample structure.
– The 2110-20 video inputs must both be locked to PTP and well timed.
Note: If the specified format parameter does not match the actual signal, fast switching is not possible and can result in an unlock condition.
3. Switch between the two configured IP inputs.
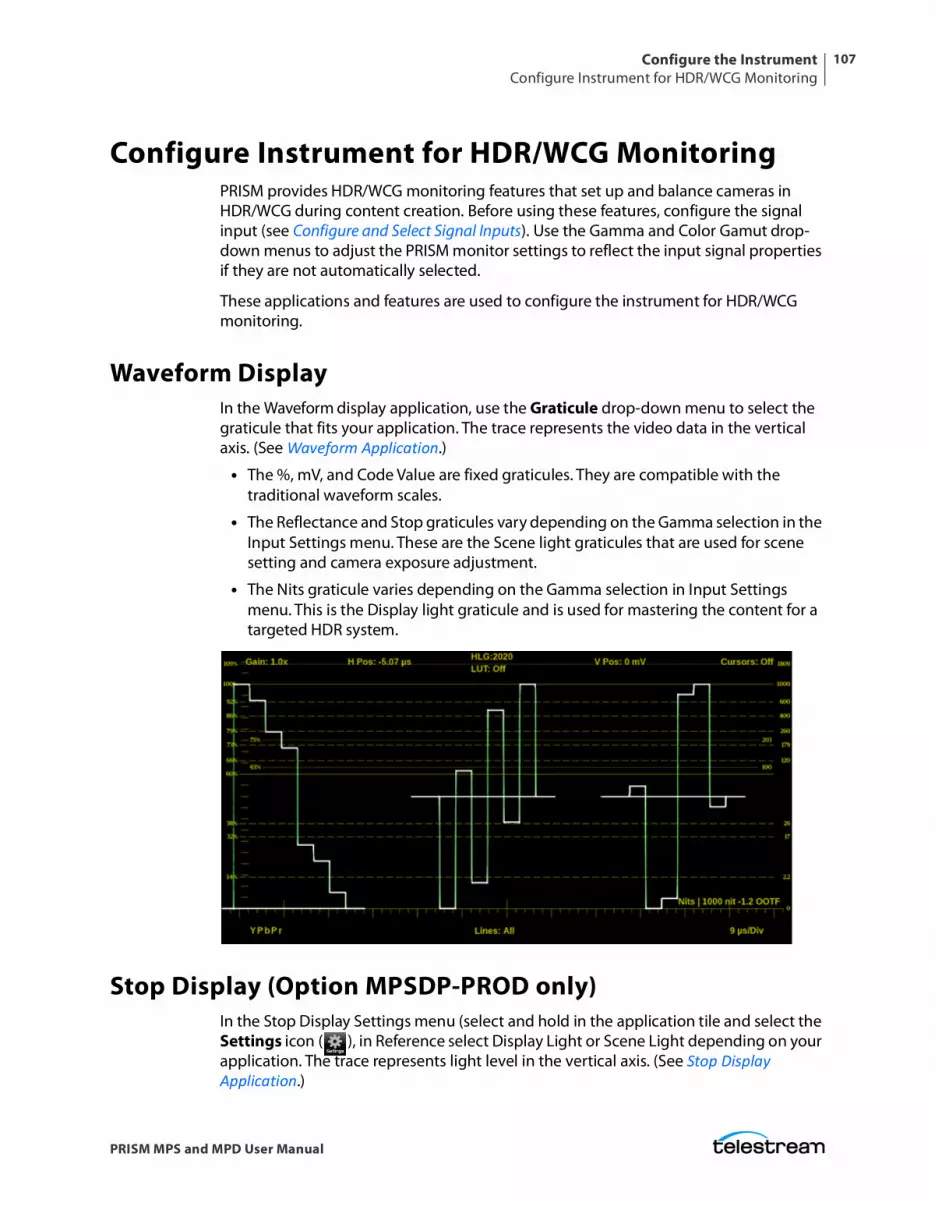
Configure the InstrumentConfigure Instrument for HDR/WCG Monitoring
107
PRISM MPS and MPD User Manual
Configure Instrument for HDR/WCG MonitoringPRISM provides HDR/WCG monitoring features that set up and balance cameras in HDR/WCG during content creation. Before using these features, configure the signal input (see Configure and Select Signal Inputs). Use the Gamma and Color Gamut drop-down menus to adjust the PRISM monitor settings to reflect the input signal properties if they are not automatically selected.
These applications and features are used to configure the instrument for HDR/WCG monitoring.
Waveform DisplayIn the Waveform display application, use the Graticule drop-down menu to select the graticule that fits your application. The trace represents the video data in the vertical axis. (See Waveform Application.)
• The %, mV, and Code Value are fixed graticules. They are compatible with the traditional waveform scales.
• The Reflectance and Stop graticules vary depending on the Gamma selection in the Input Settings menu. These are the Scene light graticules that are used for scene setting and camera exposure adjustment.
• The Nits graticule varies depending on the Gamma selection in Input Settings menu. This is the Display light graticule and is used for mastering the content for a targeted HDR system.
Stop Display (Option MPSDP-PROD only)In the Stop Display Settings menu (select and hold in the application tile and select the Settings icon ( ), in Reference select Display Light or Scene Light depending on your application. The trace represents light level in the vertical axis. (See Stop Display Application.)
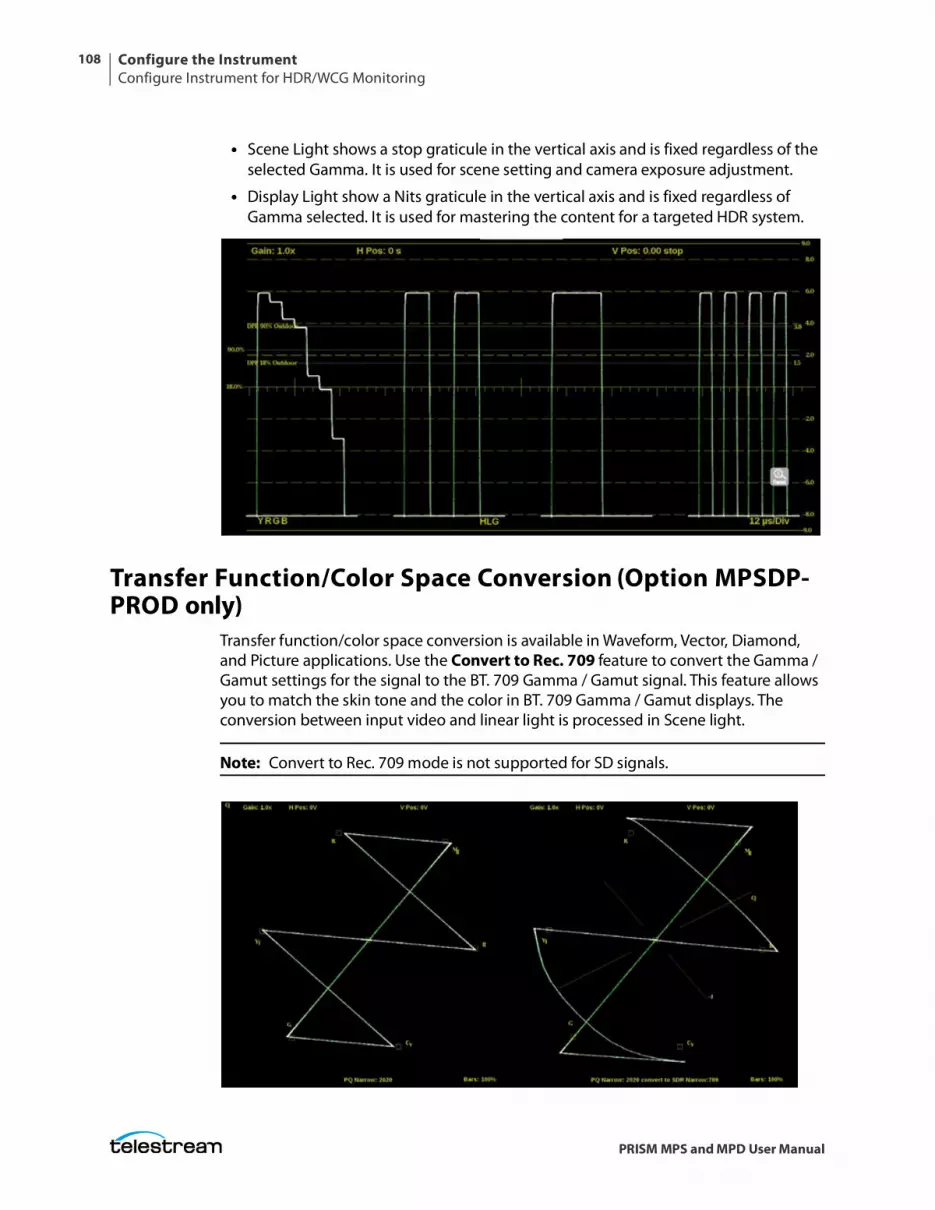
Configure the InstrumentConfigure Instrument for HDR/WCG Monitoring
108
PRISM MPS and MPD User Manual
• Scene Light shows a stop graticule in the vertical axis and is fixed regardless of the selected Gamma. It is used for scene setting and camera exposure adjustment.
• Display Light show a Nits graticule in the vertical axis and is fixed regardless of Gamma selected. It is used for mastering the content for a targeted HDR system.
Transfer Function/Color Space Conversion (Option MPSDP-PROD only)
Transfer function/color space conversion is available in Waveform, Vector, Diamond, and Picture applications. Use the Convert to Rec. 709 feature to convert the Gamma / Gamut settings for the signal to the BT. 709 Gamma / Gamut signal. This feature allows you to match the skin tone and the color in BT. 709 Gamma / Gamut displays. The conversion between input video and linear light is processed in Scene light.
Note: Convert to Rec. 709 mode is not supported for SD signals.
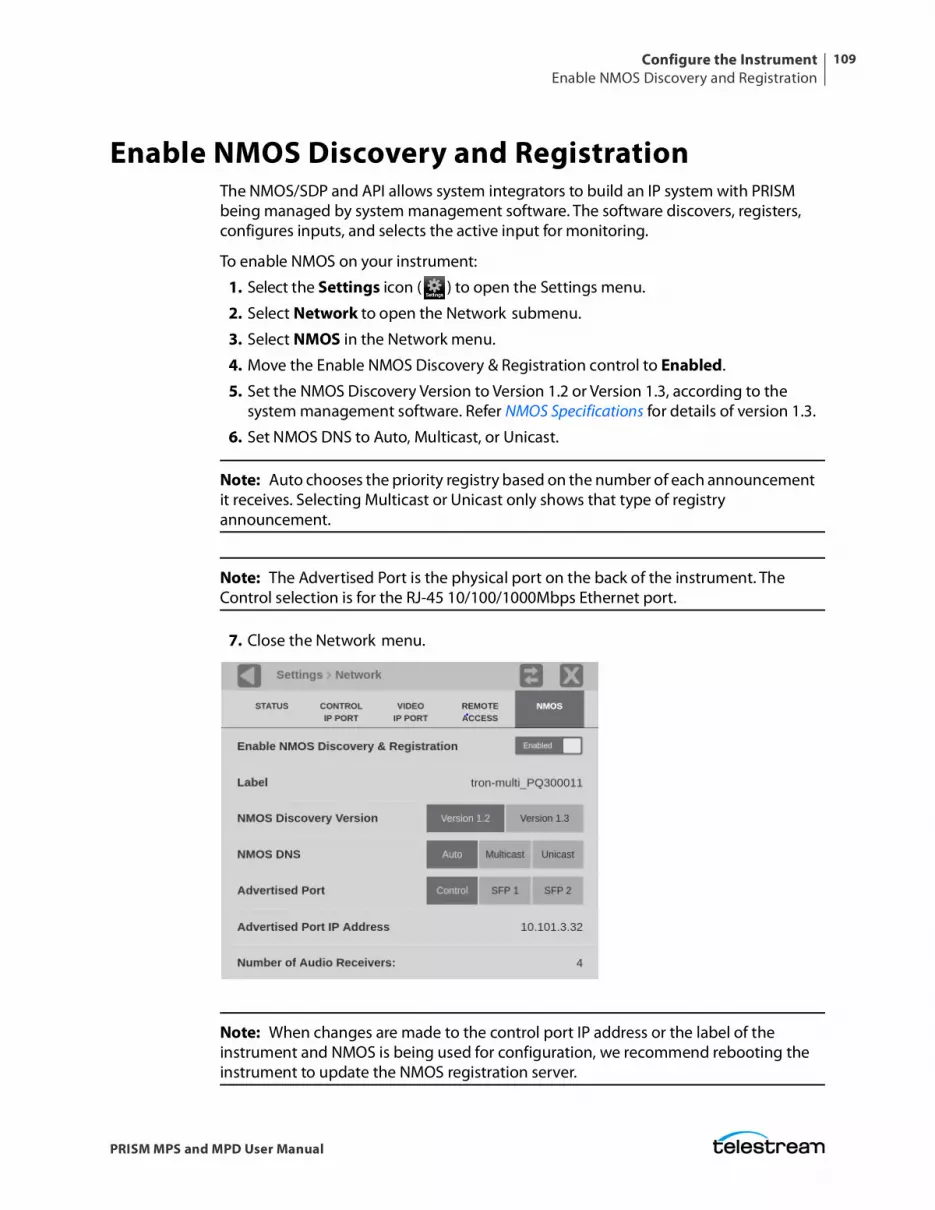
Configure the InstrumentEnable NMOS Discovery and Registration
109
PRISM MPS and MPD User Manual
Enable NMOS Discovery and RegistrationThe NMOS/SDP and API allows system integrators to build an IP system with PRISM being managed by system management software. The software discovers, registers, configures inputs, and selects the active input for monitoring.
To enable NMOS on your instrument:
1. Select the Settings icon ( ) to open the Settings menu.
2. Select Network to open the Network submenu.
3. Select NMOS in the Network menu.
4. Move the Enable NMOS Discovery & Registration control to Enabled.
5. Set the NMOS Discovery Version to Version 1.2 or Version 1.3, according to the system management software. Refer NMOS Specifications for details of version 1.3.
6. Set NMOS DNS to Auto, Multicast, or Unicast.
Note: Auto chooses the priority registry based on the number of each announcement it receives. Selecting Multicast or Unicast only shows that type of registry announcement.
Note: The Advertised Port is the physical port on the back of the instrument. The Control selection is for the RJ-45 10/100/1000Mbps Ethernet port.
7. Close the Network menu.
Note: When changes are made to the control port IP address or the label of the instrument and NMOS is being used for configuration, we recommend rebooting the instrument to update the NMOS registration server.
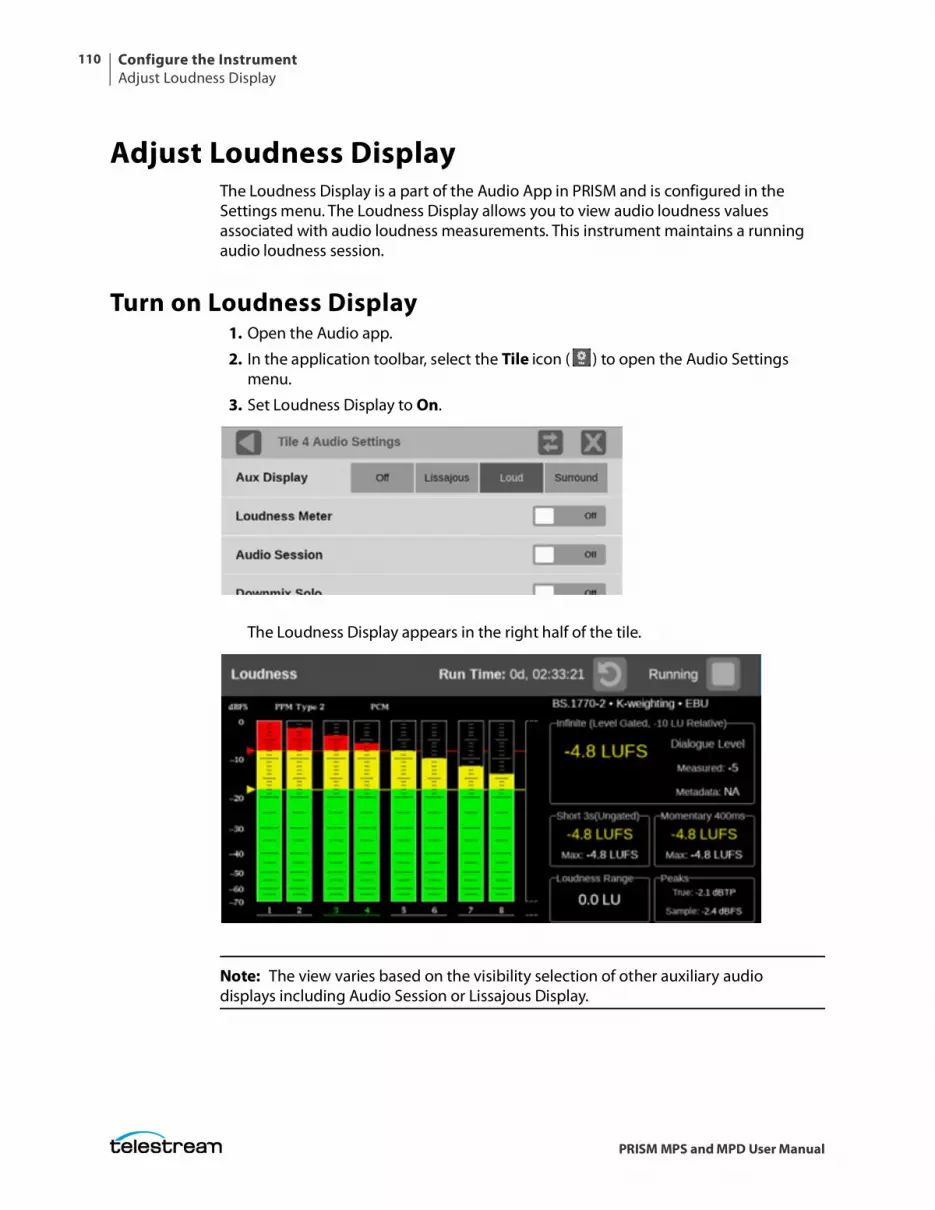
Configure the InstrumentAdjust Loudness Display
110
PRISM MPS and MPD User Manual
Adjust Loudness DisplayThe Loudness Display is a part of the Audio App in PRISM and is configured in the Settings menu. The Loudness Display allows you to view audio loudness values associated with audio loudness measurements. This instrument maintains a running audio loudness session.
Turn on Loudness Display1. Open the Audio app.
2. In the application toolbar, select the Tile icon ( ) to open the Audio Settings menu.
3. Set Loudness Display to On.
The Loudness Display appears in the right half of the tile.
Note: The view varies based on the visibility selection of other auxiliary audio displays including Audio Session or Lissajous Display.
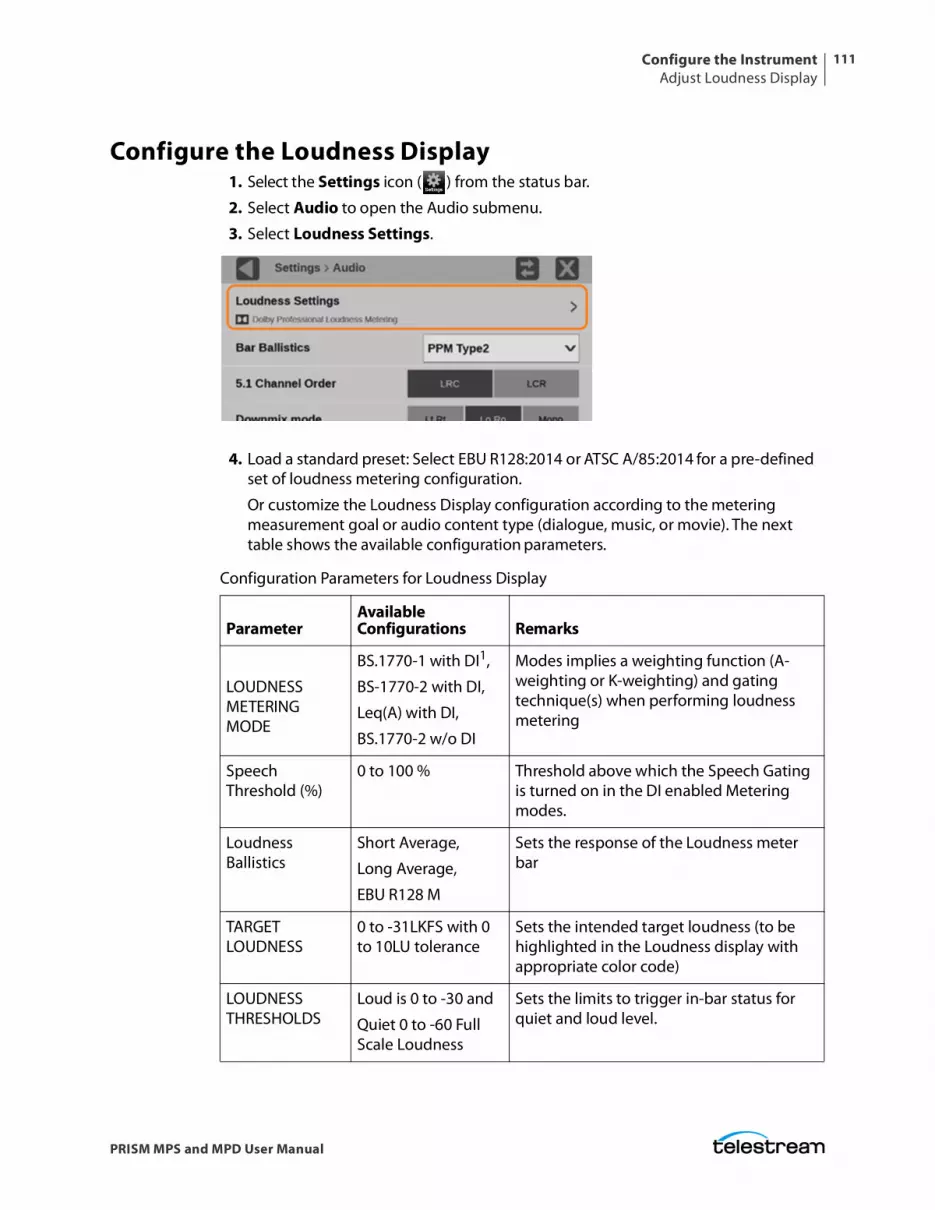
Configure the InstrumentAdjust Loudness Display
111
PRISM MPS and MPD User Manual
Configure the Loudness Display1. Select the Settings icon ( ) from the status bar.
2. Select Audio to open the Audio submenu.
3. Select Loudness Settings.
4. Load a standard preset: Select EBU R128:2014 or ATSC A/85:2014 for a pre-defined set of loudness metering configuration.
Or customize the Loudness Display configuration according to the metering measurement goal or audio content type (dialogue, music, or movie). The next table shows the available configuration parameters.
Configuration Parameters for Loudness Display
ParameterAvailableConfigurations Remarks
LOUDNESS METERING MODE
BS.1770-1 with DI1,
BS-1770-2 with DI,
Leq(A) with DI,
BS.1770-2 w/o DI
Modes implies a weighting function (A-weighting or K-weighting) and gating technique(s) when performing loudness metering
Speech Threshold (%)
0 to 100 % Threshold above which the Speech Gating is turned on in the DI enabled Metering modes.
Loudness Ballistics
Short Average,
Long Average,
EBU R128 M
Sets the response of the Loudness meter bar
TARGET LOUDNESS
0 to -31LKFS with 0 to 10LU tolerance
Sets the intended target loudness (to be highlighted in the Loudness display with appropriate color code)
LOUDNESS THRESHOLDS
Loud is 0 to -30 and
Quiet 0 to -60 Full Scale Loudness
Sets the limits to trigger in-bar status for quiet and loud level.
Configure the InstrumentAdjust Loudness Display
112
PRISM MPS and MPD User Manual
1 Dialogue Intelligence enabled
Note: The dialogue intelligence algorithm in PRISM introduces a latency of 2.048s in the effective measurement of the short-term and infinite Loudness. Other Loudness measurement parameters are not affected by the latency.
Note: The Loudness measurements are updated every 500ms in the user interface.
Note: Maximum short-term Loudness level can be considered as an alternative to using Loudness range for short audio clips.
Change Channels the Loudness Meter Measures
Select the correct program labels at the bottom of the level bars (green letters mean it is selected) and the Loudness meter measures the levels based on that audio program.
Short-Term
Gating Window
EBU R128(3s),
Legacy(10s)
Duration of the sliding windows for short-term loudness measurement
Full-Scale Units LKFS or LUFS Region specific selection; has no effect on measurement
TRUE PEAK DC Block and Emphasis Filter
Enable or Disable DC block simulates the effect of downstream devices that remove DC.
The emphasis filter compensates for dispersion effects from Nyquist filters in the broadcast chain that make it difficult to measure and control the peak levels of high‐frequency signals.
Configuration Parameters for Loudness Display
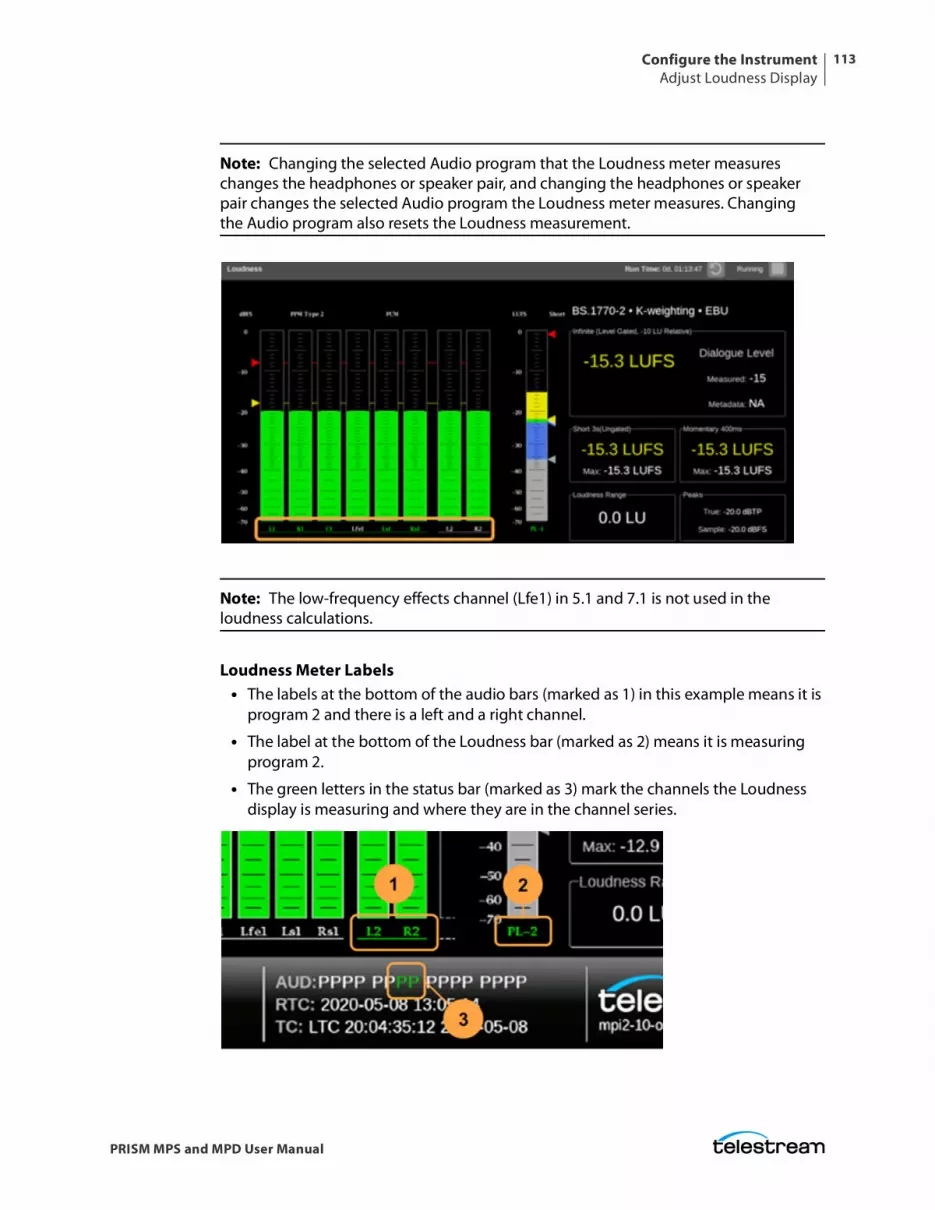
Configure the InstrumentAdjust Loudness Display
113
PRISM MPS and MPD User Manual
Note: Changing the selected Audio program that the Loudness meter measures changes the headphones or speaker pair, and changing the headphones or speaker pair changes the selected Audio program the Loudness meter measures. Changing the Audio program also resets the Loudness measurement.
Note: The low-frequency effects channel (Lfe1) in 5.1 and 7.1 is not used in the loudness calculations.
Loudness Meter Labels• The labels at the bottom of the audio bars (marked as 1) in this example means it is
program 2 and there is a left and a right channel.
• The label at the bottom of the Loudness bar (marked as 2) means it is measuring program 2.
• The green letters in the status bar (marked as 3) mark the channels the Loudness display is measuring and where they are in the channel series.
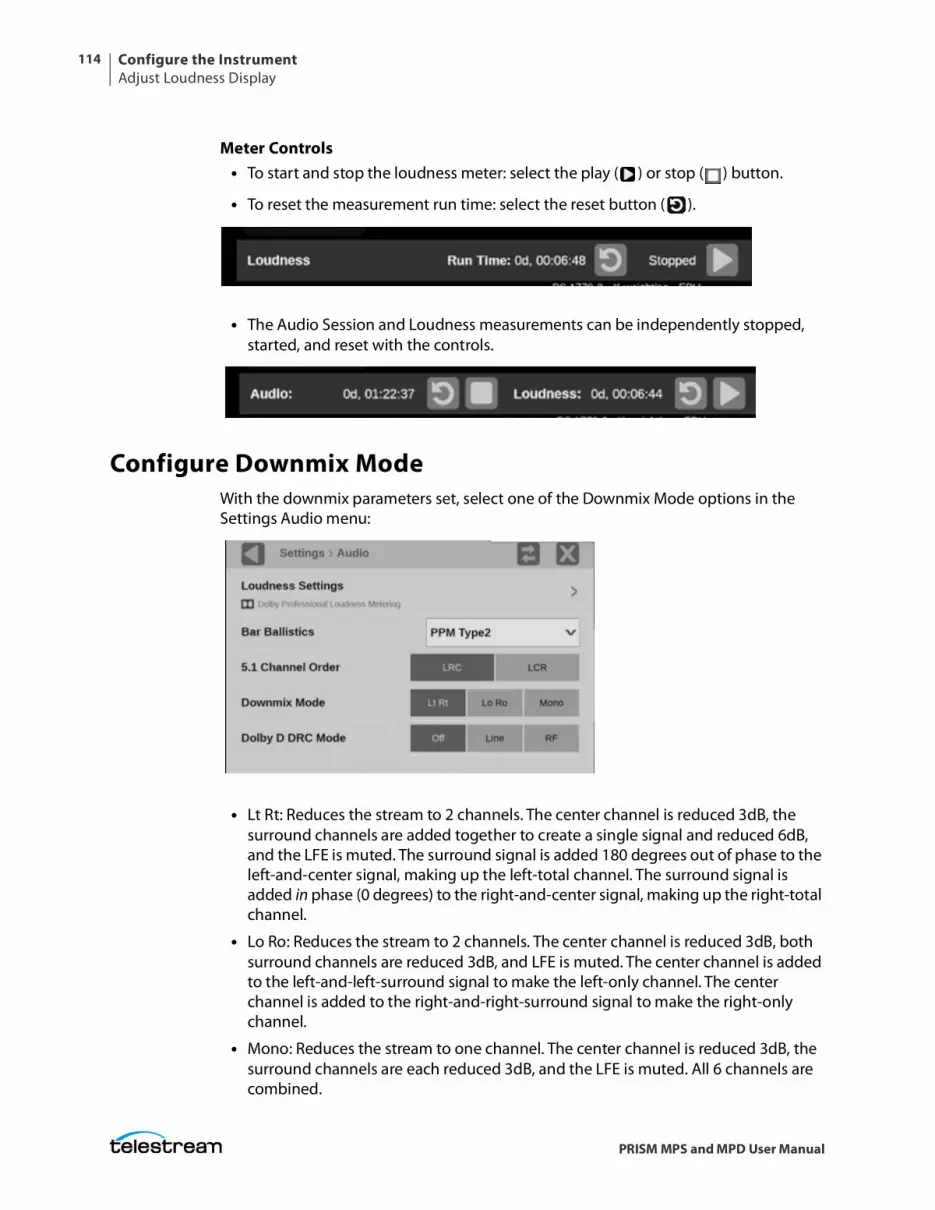
Configure the InstrumentAdjust Loudness Display
114
PRISM MPS and MPD User Manual
Meter Controls• To start and stop the loudness meter: select the play ( ) or stop ( ) button.
• To reset the measurement run time: select the reset button ( ).
• The Audio Session and Loudness measurements can be independently stopped, started, and reset with the controls.
Configure Downmix Mode With the downmix parameters set, select one of the Downmix Mode options in the Settings Audio menu:
• Lt Rt: Reduces the stream to 2 channels. The center channel is reduced 3dB, the surround channels are added together to create a single signal and reduced 6dB, and the LFE is muted. The surround signal is added 180 degrees out of phase to the left-and-center signal, making up the left-total channel. The surround signal is added in phase (0 degrees) to the right-and-center signal, making up the right-total channel.
• Lo Ro: Reduces the stream to 2 channels. The center channel is reduced 3dB, both surround channels are reduced 3dB, and LFE is muted. The center channel is added to the left-and-left-surround signal to make the left-only channel. The center channel is added to the right-and-right-surround signal to make the right-only channel.
• Mono: Reduces the stream to one channel. The center channel is reduced 3dB, the surround channels are each reduced 3dB, and the LFE is muted. All 6 channels are combined.
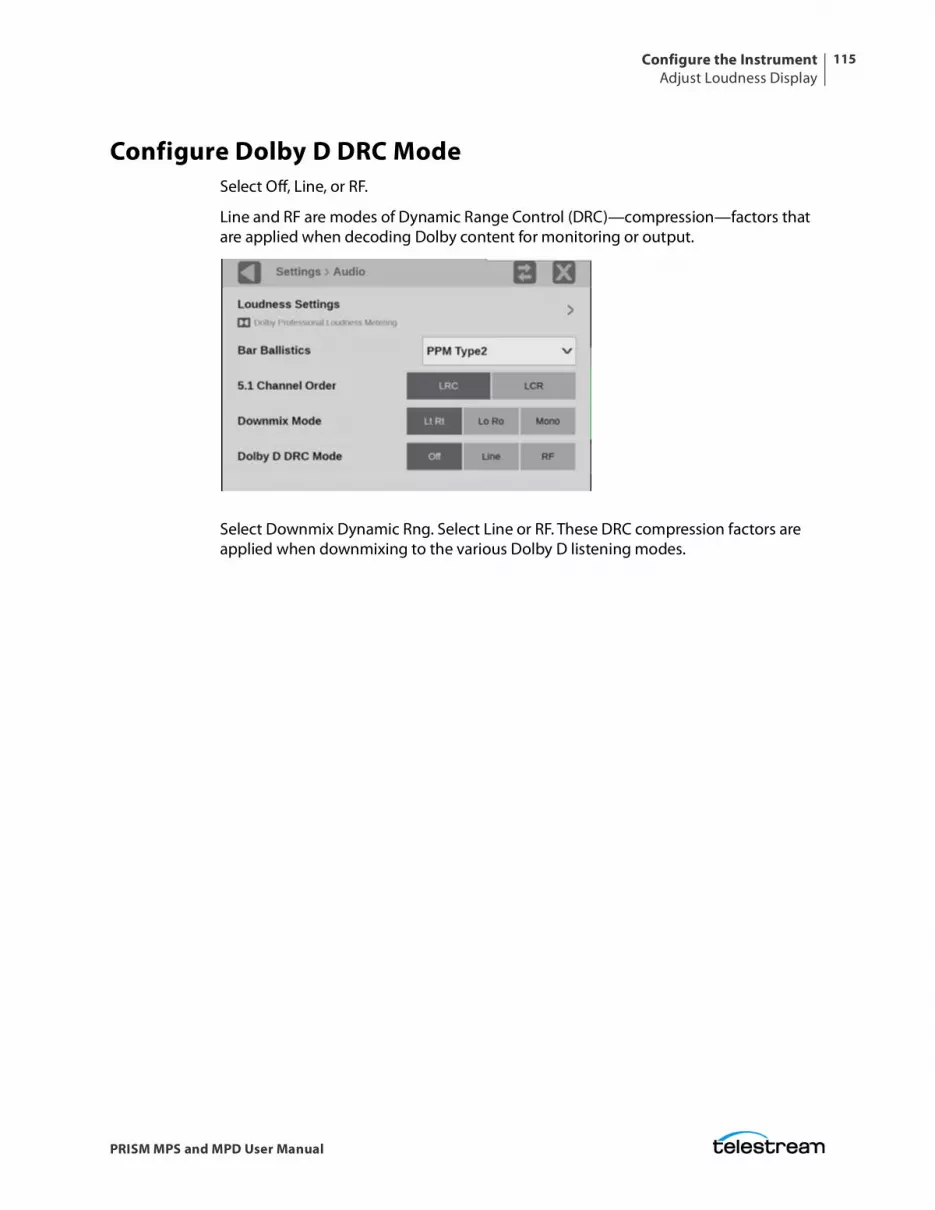
Configure the InstrumentAdjust Loudness Display
115
PRISM MPS and MPD User Manual
Configure Dolby D DRC Mode Select Off, Line, or RF.
Line and RF are modes of Dynamic Range Control (DRC)—compression—factors that are applied when decoding Dolby content for monitoring or output.
Select Downmix Dynamic Rng. Select Line or RF. These DRC compression factors are applied when downmixing to the various Dolby D listening modes.
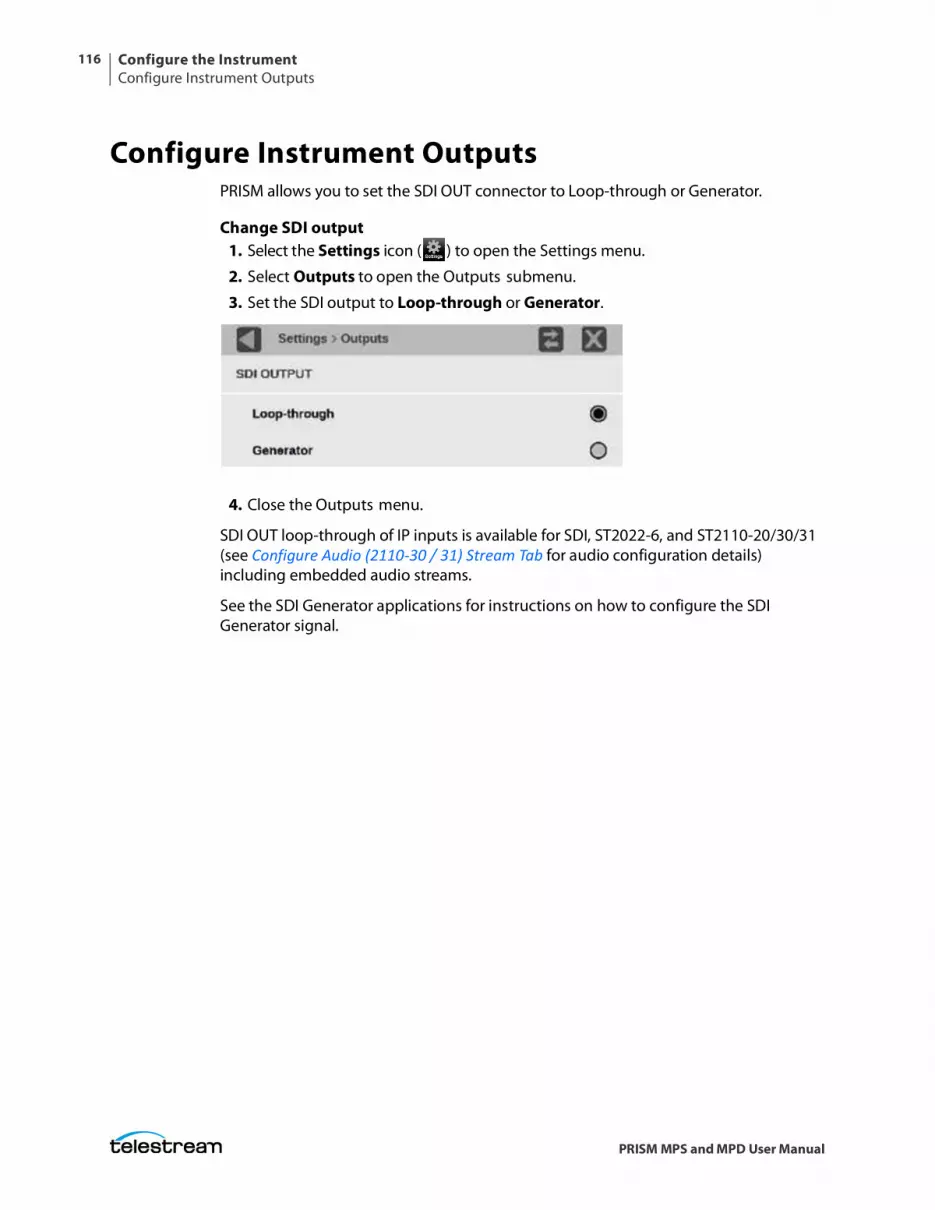
Configure the InstrumentConfigure Instrument Outputs
116
PRISM MPS and MPD User Manual
Configure Instrument OutputsPRISM allows you to set the SDI OUT connector to Loop-through or Generator.
Change SDI output1. Select the Settings icon ( ) to open the Settings menu.
2. Select Outputs to open the Outputs submenu.
3. Set the SDI output to Loop-through or Generator.
4. Close the Outputs menu.
SDI OUT loop-through of IP inputs is available for SDI, ST2022-6, and ST2110-20/30/31 (see Configure Audio (2110-30 / 31) Stream Tab for audio configuration details) including embedded audio streams.
See the SDI Generator applications for instructions on how to configure the SDI Generator signal.
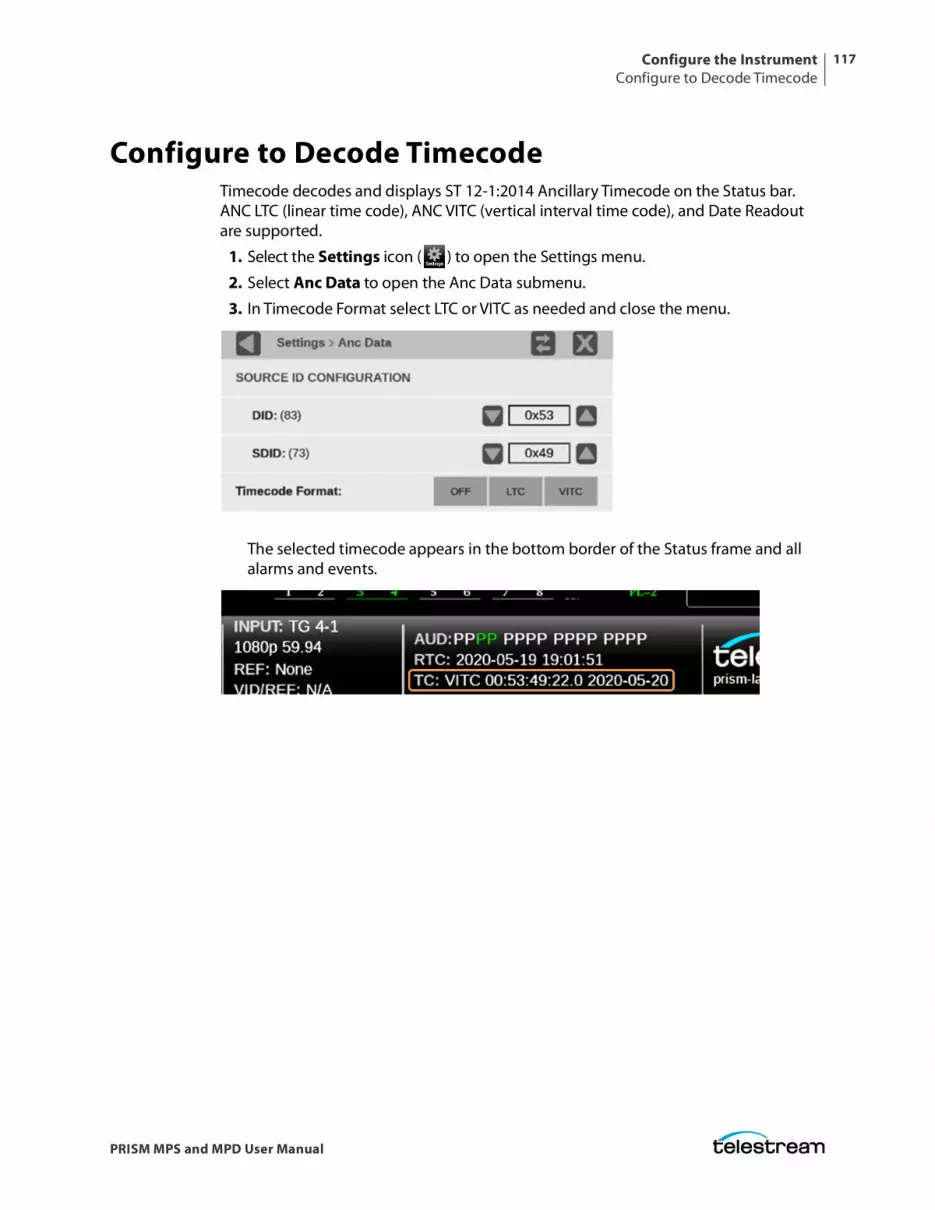
Configure the InstrumentConfigure to Decode Timecode
117
PRISM MPS and MPD User Manual
Configure to Decode TimecodeTimecode decodes and displays ST 12-1:2014 Ancillary Timecode on the Status bar. ANC LTC (linear time code), ANC VITC (vertical interval time code), and Date Readout are supported.
1. Select the Settings icon ( ) to open the Settings menu.
2. Select Anc Data to open the Anc Data submenu.
3. In Timecode Format select LTC or VITC as needed and close the menu.
The selected timecode appears in the bottom border of the Status frame and all alarms and events.
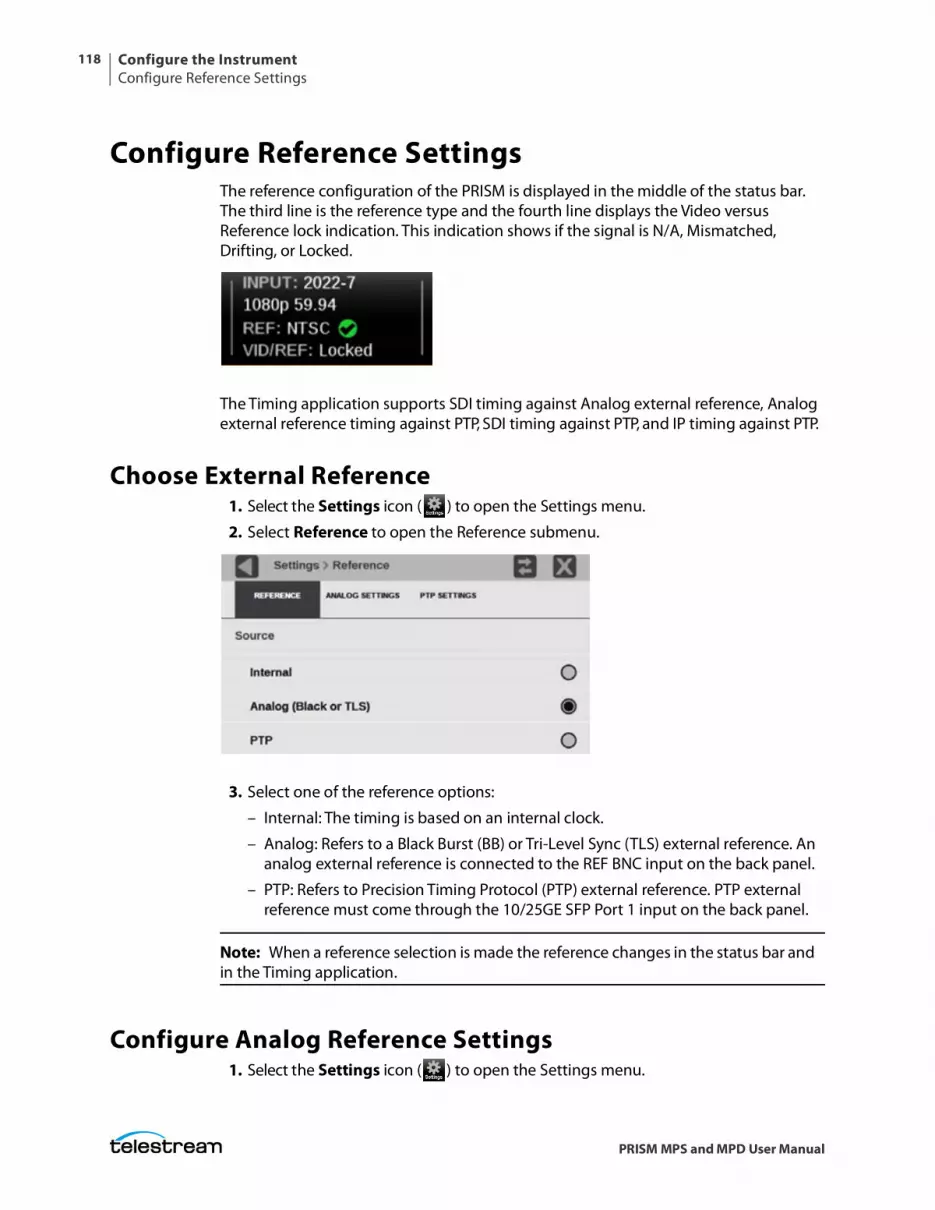
Configure the InstrumentConfigure Reference Settings
118
PRISM MPS and MPD User Manual
Configure Reference SettingsThe reference configuration of the PRISM is displayed in the middle of the status bar. The third line is the reference type and the fourth line displays the Video versus Reference lock indication. This indication shows if the signal is N/A, Mismatched, Drifting, or Locked.
The Timing application supports SDI timing against Analog external reference, Analog external reference timing against PTP, SDI timing against PTP, and IP timing against PTP.
Choose External Reference1. Select the Settings icon ( ) to open the Settings menu.
2. Select Reference to open the Reference submenu.
3. Select one of the reference options:
– Internal: The timing is based on an internal clock.
– Analog: Refers to a Black Burst (BB) or Tri-Level Sync (TLS) external reference. An analog external reference is connected to the REF BNC input on the back panel.
– PTP: Refers to Precision Timing Protocol (PTP) external reference. PTP external reference must come through the 10/25GE SFP Port 1 input on the back panel.
Note: When a reference selection is made the reference changes in the status bar and in the Timing application.
Configure Analog Reference Settings1. Select the Settings icon ( ) to open the Settings menu.
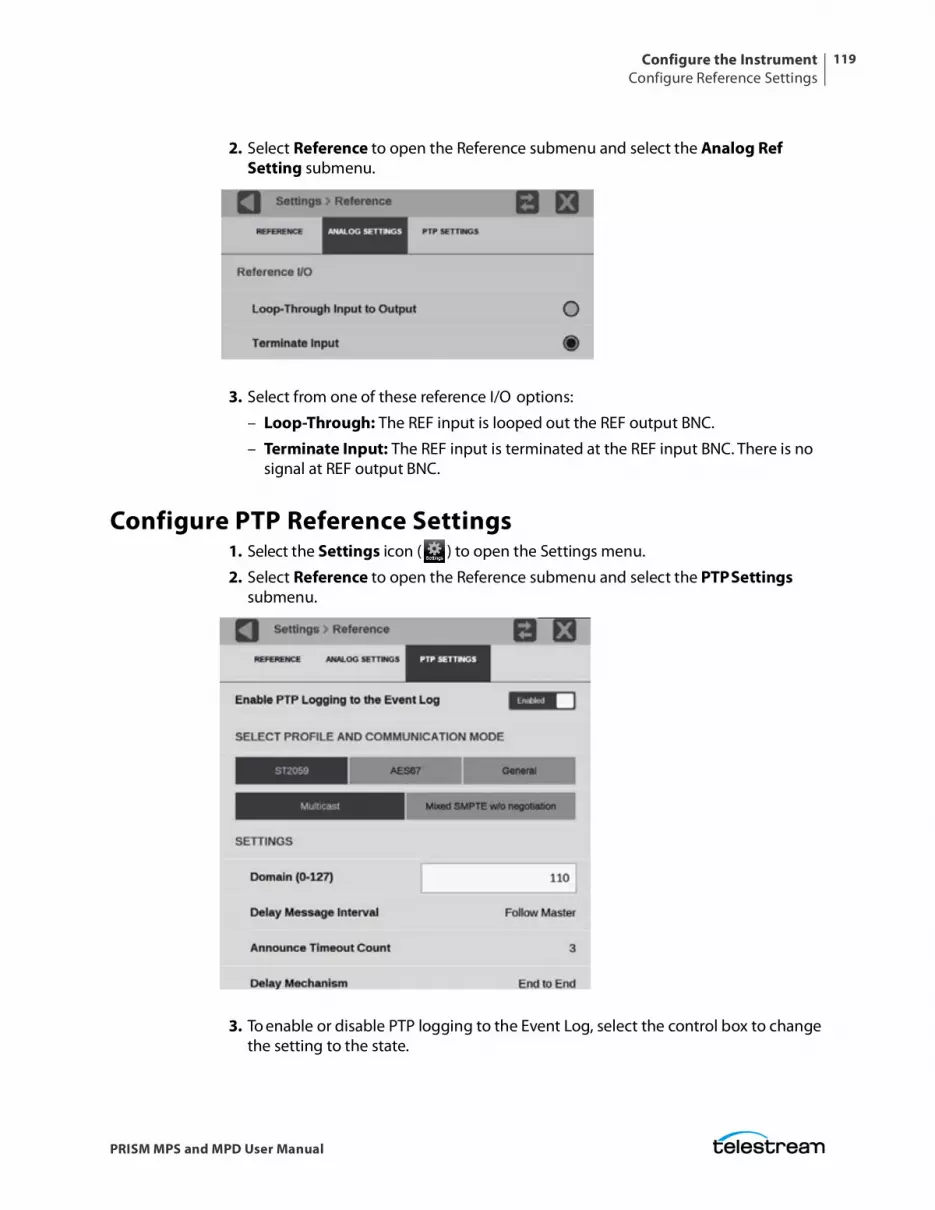
Configure the InstrumentConfigure Reference Settings
119
PRISM MPS and MPD User Manual
2. Select Reference to open the Reference submenu and select the Analog Ref Setting submenu.
3. Select from one of these reference I/O options:
– Loop-Through: The REF input is looped out the REF output BNC.
– Terminate Input: The REF input is terminated at the REF input BNC. There is no signal at REF output BNC.
Configure PTP Reference Settings1. Select the Settings icon ( ) to open the Settings menu.
2. Select Reference to open the Reference submenu and select the PTP Settings submenu.
3. To enable or disable PTP logging to the Event Log, select the control box to change the setting to the state.
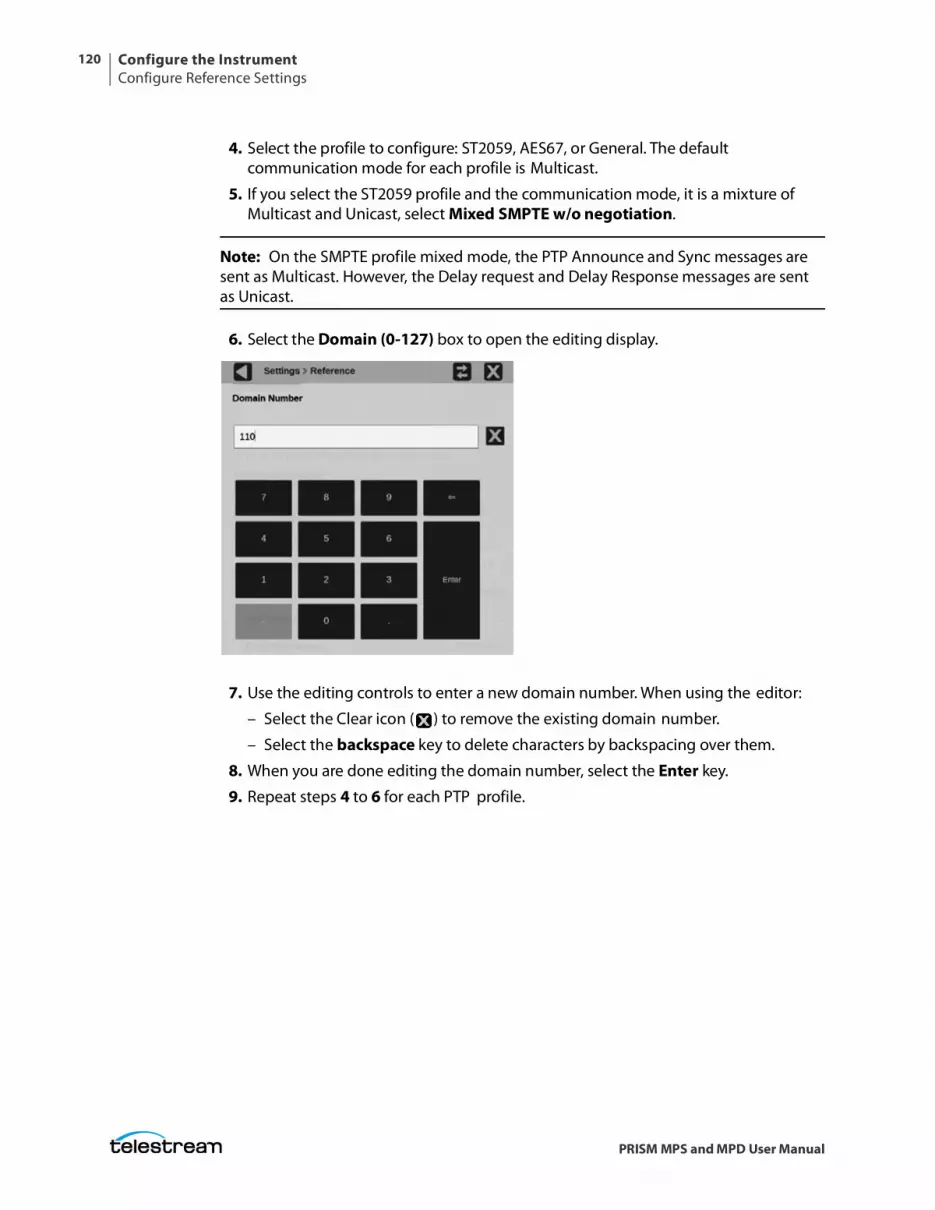
Configure the InstrumentConfigure Reference Settings
120
PRISM MPS and MPD User Manual
4. Select the profile to configure: ST2059, AES67, or General. The default communication mode for each profile is Multicast.
5. If you select the ST2059 profile and the communication mode, it is a mixture of Multicast and Unicast, select Mixed SMPTE w/o negotiation.
Note: On the SMPTE profile mixed mode, the PTP Announce and Sync messages are sent as Multicast. However, the Delay request and Delay Response messages are sent as Unicast.
6. Select the Domain (0-127) box to open the editing display.
7. Use the editing controls to enter a new domain number. When using the editor:
– Select the Clear icon ( ) to remove the existing domain number.
– Select the backspace key to delete characters by backspacing over them.
8. When you are done editing the domain number, select the Enter key.
9. Repeat steps 4 to 6 for each PTP profile.
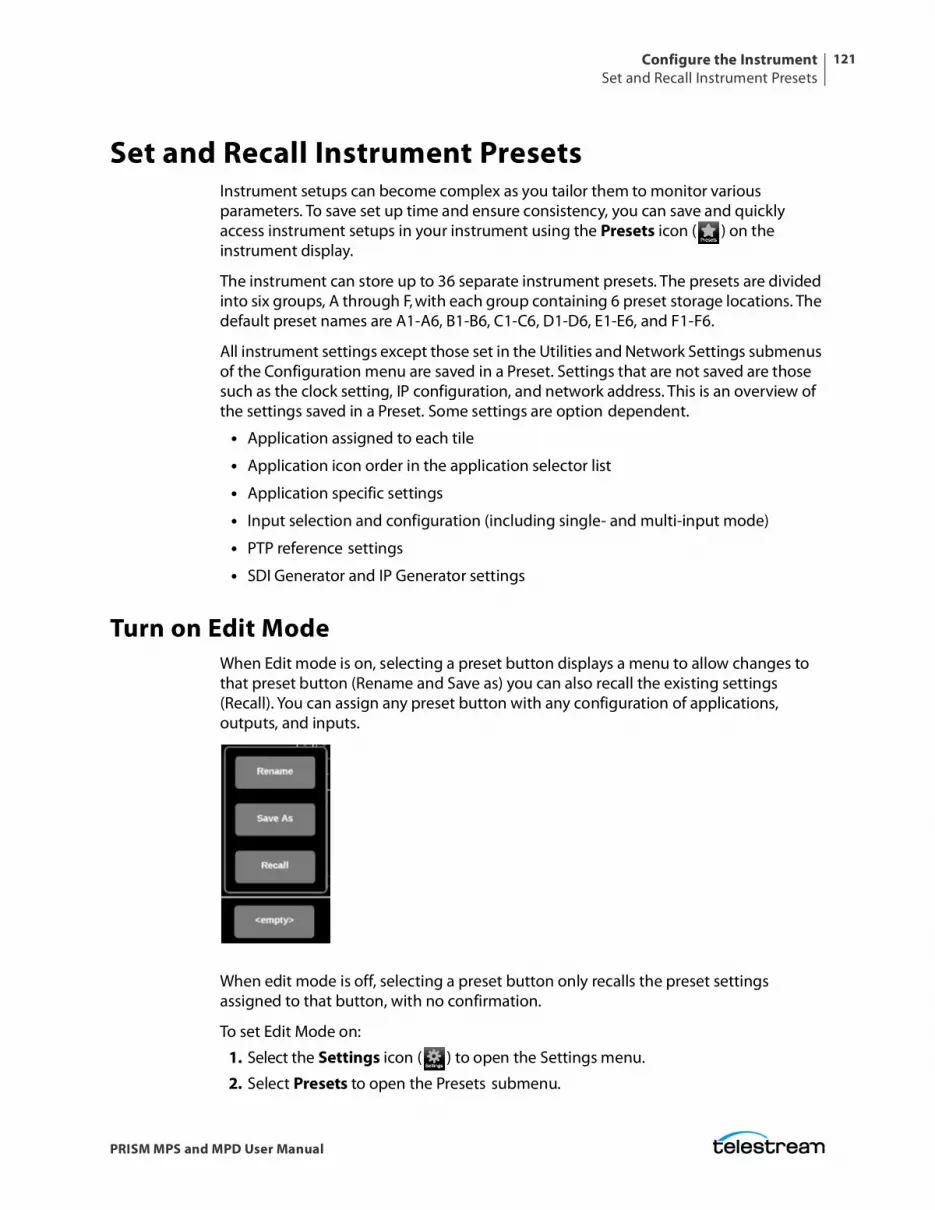
Configure the InstrumentSet and Recall Instrument Presets
121
PRISM MPS and MPD User Manual
Set and Recall Instrument PresetsInstrument setups can become complex as you tailor them to monitor various parameters. To save set up time and ensure consistency, you can save and quickly access instrument setups in your instrument using the Presets icon ( ) on the instrument display.
The instrument can store up to 36 separate instrument presets. The presets are divided into six groups, A through F, with each group containing 6 preset storage locations. The default preset names are A1-A6, B1-B6, C1-C6, D1-D6, E1-E6, and F1-F6.
All instrument settings except those set in the Utilities and Network Settings submenus of the Configuration menu are saved in a Preset. Settings that are not saved are those such as the clock setting, IP configuration, and network address. This is an overview of the settings saved in a Preset. Some settings are option dependent.
• Application assigned to each tile
• Application icon order in the application selector list
• Application specific settings
• Input selection and configuration (including single- and multi-input mode)
• PTP reference settings
• SDI Generator and IP Generator settings
Turn on Edit ModeWhen Edit mode is on, selecting a preset button displays a menu to allow changes to that preset button (Rename and Save as) you can also recall the existing settings (Recall). You can assign any preset button with any configuration of applications, outputs, and inputs.
When edit mode is off, selecting a preset button only recalls the preset settings assigned to that button, with no confirmation.
To set Edit Mode on:
1. Select the Settings icon ( ) to open the Settings menu.
2. Select Presets to open the Presets submenu.
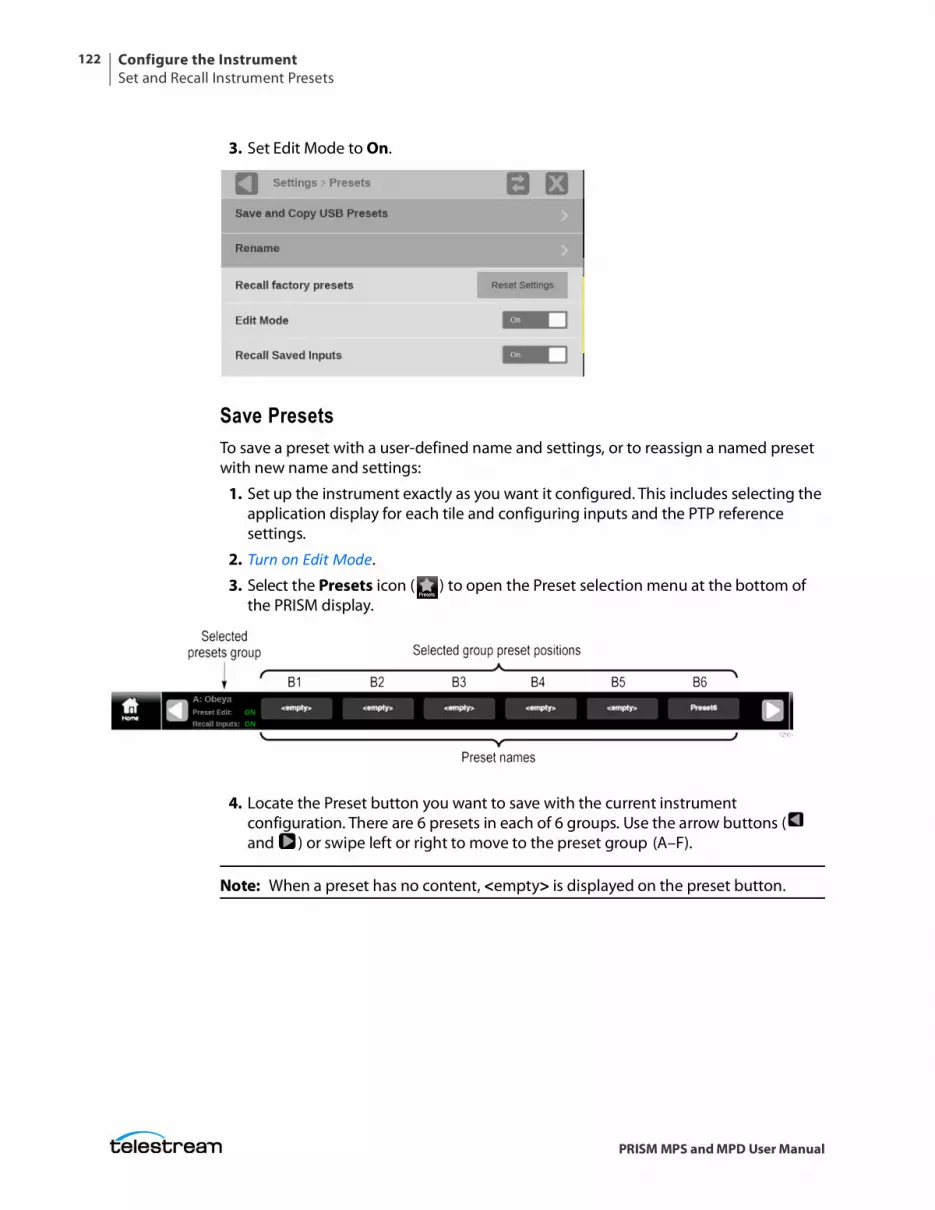
Configure the InstrumentSet and Recall Instrument Presets
122
PRISM MPS and MPD User Manual
3. Set Edit Mode to On.
Save PresetsTo save a preset with a user-defined name and settings, or to reassign a named preset with new name and settings:
1. Set up the instrument exactly as you want it configured. This includes selecting the application display for each tile and configuring inputs and the PTP reference settings.
2. Turn on Edit Mode.
3. Select the Presets icon ( ) to open the Preset selection menu at the bottom of the PRISM display.
4. Locate the Preset button you want to save with the current instrument configuration. There are 6 presets in each of 6 groups. Use the arrow buttons ( and ) or swipe left or right to move to the preset group (A–F).
Note: When a preset has no content, <empty> is displayed on the preset button.
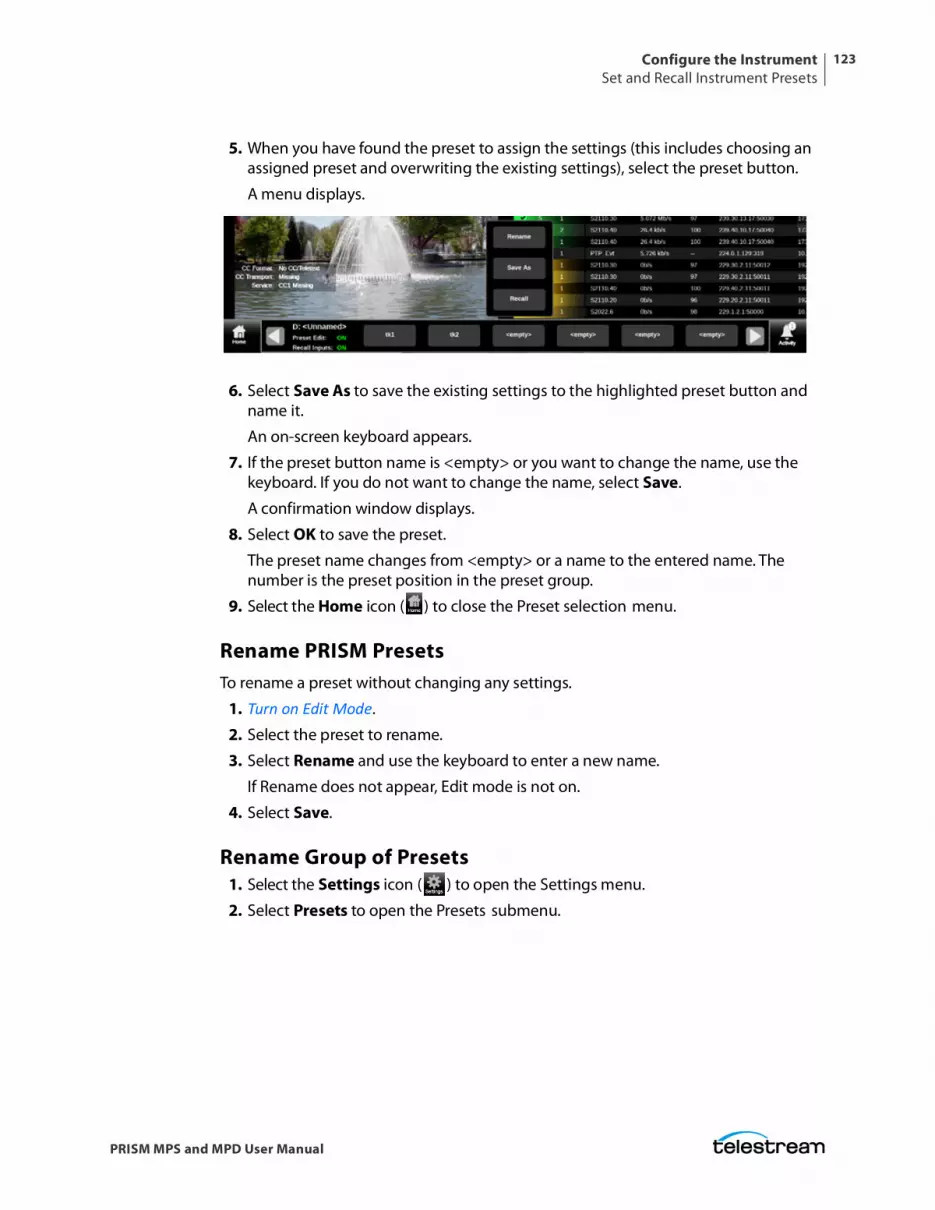
Configure the InstrumentSet and Recall Instrument Presets
123
PRISM MPS and MPD User Manual
5. When you have found the preset to assign the settings (this includes choosing an assigned preset and overwriting the existing settings), select the preset button.
A menu displays.
6. Select Save As to save the existing settings to the highlighted preset button and name it.
An on-screen keyboard appears.
7. If the preset button name is <empty> or you want to change the name, use the keyboard. If you do not want to change the name, select Save.
A confirmation window displays.
8. Select OK to save the preset.
The preset name changes from <empty> or a name to the entered name. The number is the preset position in the preset group.
9. Select the Home icon ( ) to close the Preset selection menu.
Rename PRISM PresetsTo rename a preset without changing any settings.
1. Turn on Edit Mode.
2. Select the preset to rename.
3. Select Rename and use the keyboard to enter a new name.
If Rename does not appear, Edit mode is not on.
4. Select Save.
Rename Group of Presets1. Select the Settings icon ( ) to open the Settings menu.
2. Select Presets to open the Presets submenu.
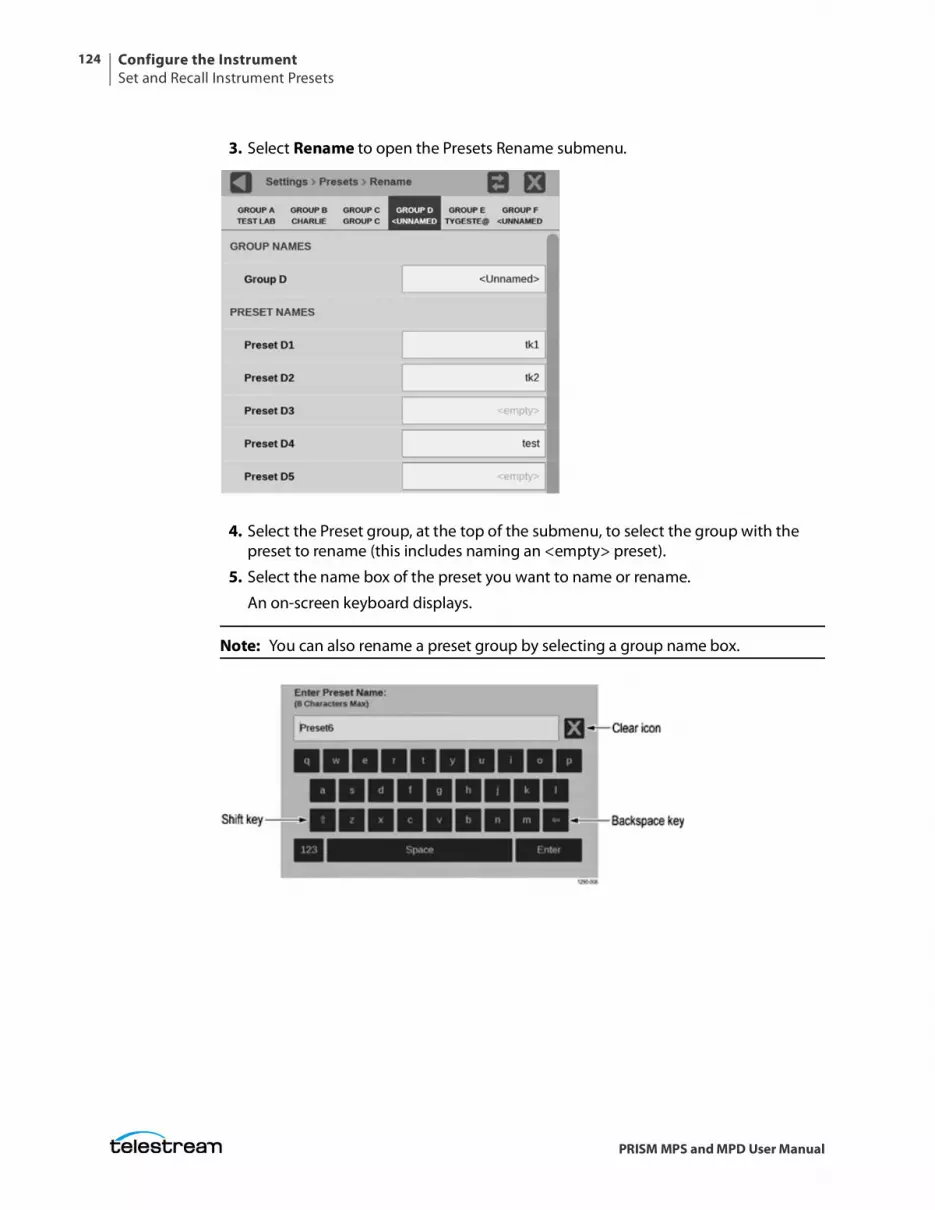
Configure the InstrumentSet and Recall Instrument Presets
124
PRISM MPS and MPD User Manual
3. Select Rename to open the Presets Rename submenu.
4. Select the Preset group, at the top of the submenu, to select the group with the preset to rename (this includes naming an <empty> preset).
5. Select the name box of the preset you want to name or rename.
An on-screen keyboard displays.
Note: You can also rename a preset group by selecting a group name box.
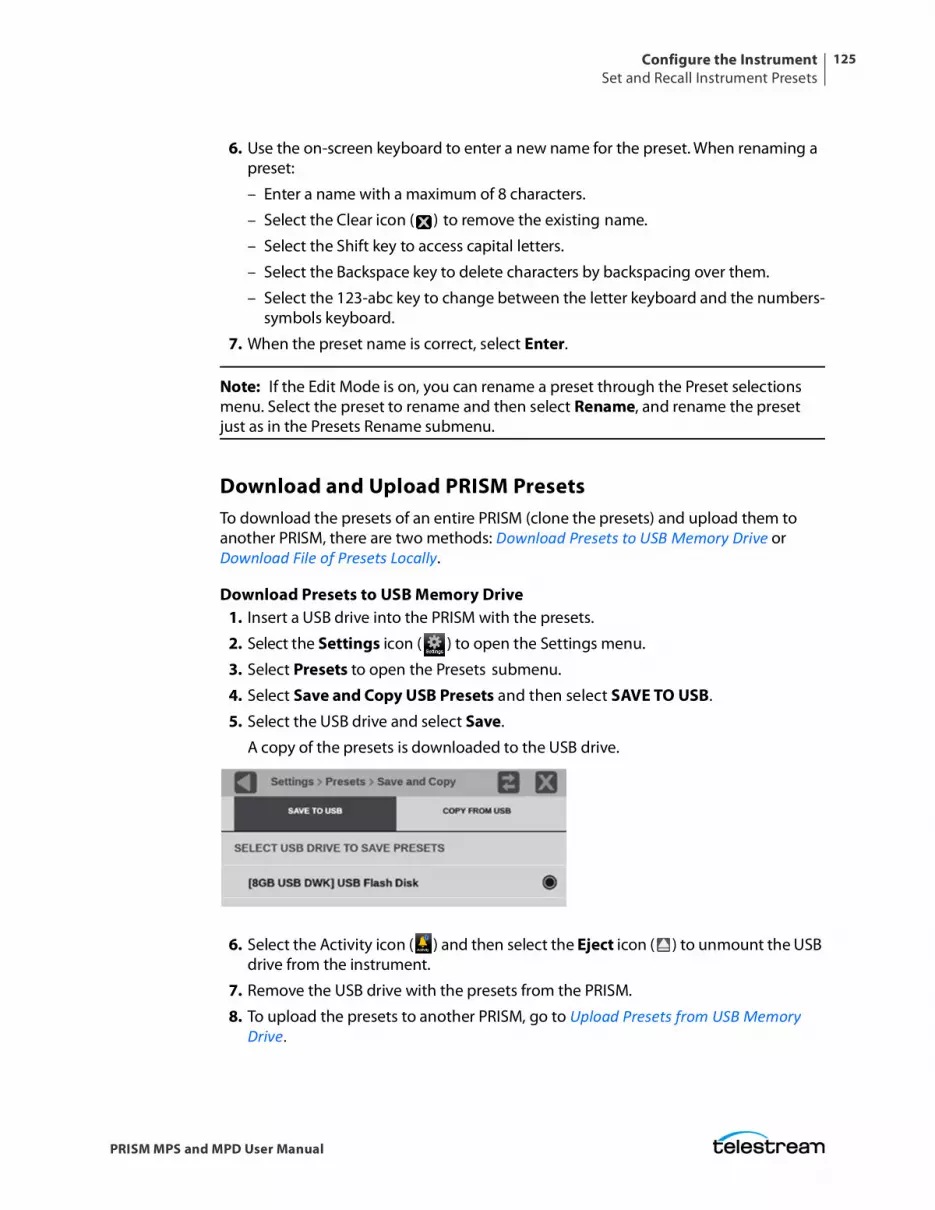
Configure the InstrumentSet and Recall Instrument Presets
125
PRISM MPS and MPD User Manual
6. Use the on-screen keyboard to enter a new name for the preset. When renaming a preset:
– Enter a name with a maximum of 8 characters.
– Select the Clear icon ( ) to remove the existing name.
– Select the Shift key to access capital letters.
– Select the Backspace key to delete characters by backspacing over them.
– Select the 123-abc key to change between the letter keyboard and the numbers-symbols keyboard.
7. When the preset name is correct, select Enter.
Note: If the Edit Mode is on, you can rename a preset through the Preset selections menu. Select the preset to rename and then select Rename, and rename the preset just as in the Presets Rename submenu.
Download and Upload PRISM PresetsTo download the presets of an entire PRISM (clone the presets) and upload them to another PRISM, there are two methods: Download Presets to USB Memory Drive or Download File of Presets Locally.
Download Presets to USB Memory Drive1. Insert a USB drive into the PRISM with the presets.
2. Select the Settings icon ( ) to open the Settings menu.
3. Select Presets to open the Presets submenu.
4. Select Save and Copy USB Presets and then select SAVE TO USB.
5. Select the USB drive and select Save.
A copy of the presets is downloaded to the USB drive.
6. Select the Activity icon ( ) and then select the Eject icon ( ) to unmount the USB drive from the instrument.
7. Remove the USB drive with the presets from the PRISM.
8. To upload the presets to another PRISM, go to Upload Presets from USB Memory Drive.
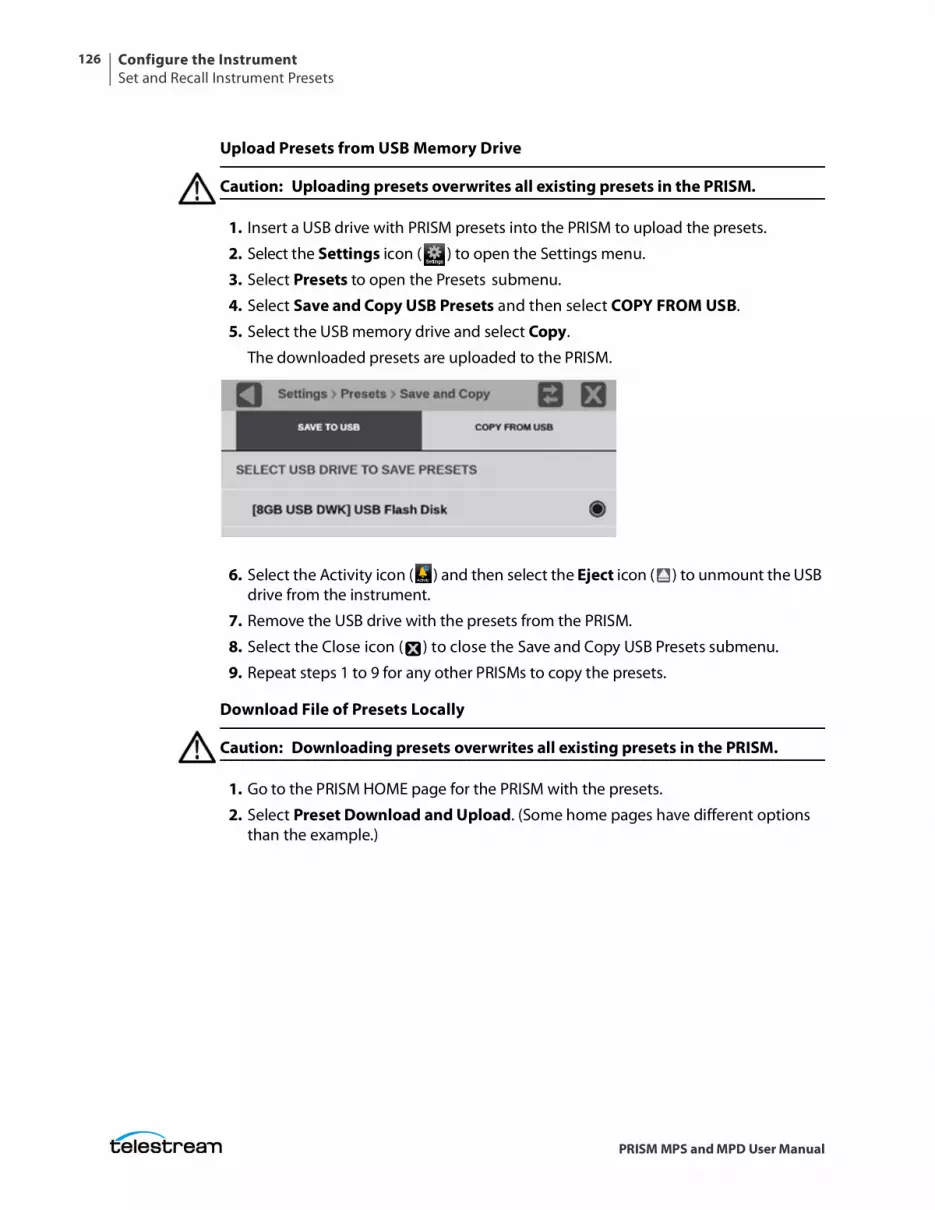
Configure the InstrumentSet and Recall Instrument Presets
126
PRISM MPS and MPD User Manual
Upload Presets from USB Memory Drive
Caution: Uploading presets overwrites all existing presets in the PRISM.
1. Insert a USB drive with PRISM presets into the PRISM to upload the presets.
2. Select the Settings icon ( ) to open the Settings menu.
3. Select Presets to open the Presets submenu.
4. Select Save and Copy USB Presets and then select COPY FROM USB.
5. Select the USB memory drive and select Copy.
The downloaded presets are uploaded to the PRISM.
6. Select the Activity icon ( ) and then select the Eject icon ( ) to unmount the USB drive from the instrument.
7. Remove the USB drive with the presets from the PRISM.
8. Select the Close icon ( ) to close the Save and Copy USB Presets submenu.
9. Repeat steps 1 to 9 for any other PRISMs to copy the presets.
Download File of Presets Locally
Caution: Downloading presets overwrites all existing presets in the PRISM.
1. Go to the PRISM HOME page for the PRISM with the presets.
2. Select Preset Download and Upload. (Some home pages have different options than the example.)
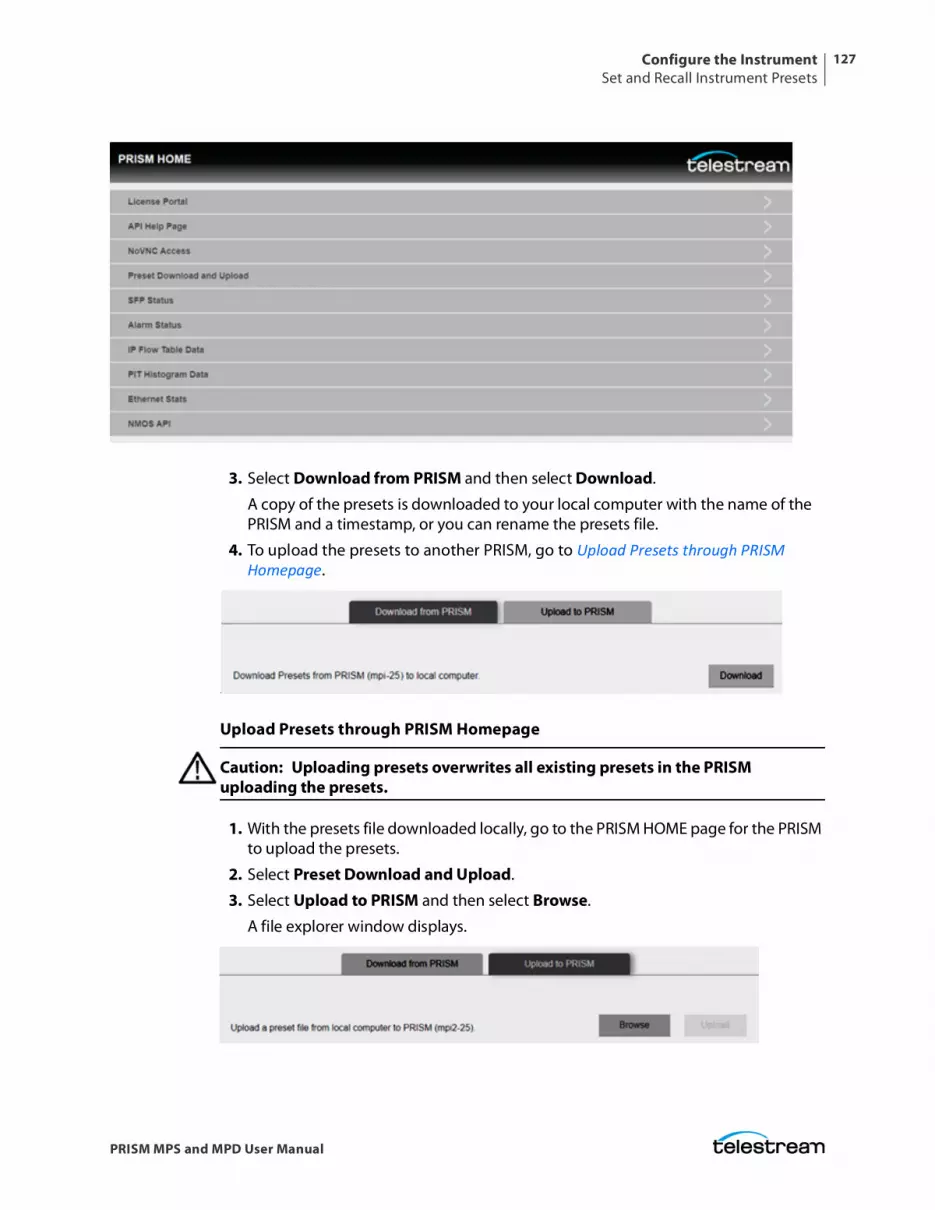
Configure the InstrumentSet and Recall Instrument Presets
127
PRISM MPS and MPD User Manual
3. Select Download from PRISM and then select Download.
A copy of the presets is downloaded to your local computer with the name of the PRISM and a timestamp, or you can rename the presets file.
4. To upload the presets to another PRISM, go to Upload Presets through PRISM Homepage.
.
Upload Presets through PRISM Homepage
Caution: Uploading presets overwrites all existing presets in the PRISM uploading the presets.
1. With the presets file downloaded locally, go to the PRISM HOME page for the PRISM to upload the presets.
2. Select Preset Download and Upload.
3. Select Upload to PRISM and then select Browse.
A file explorer window displays.
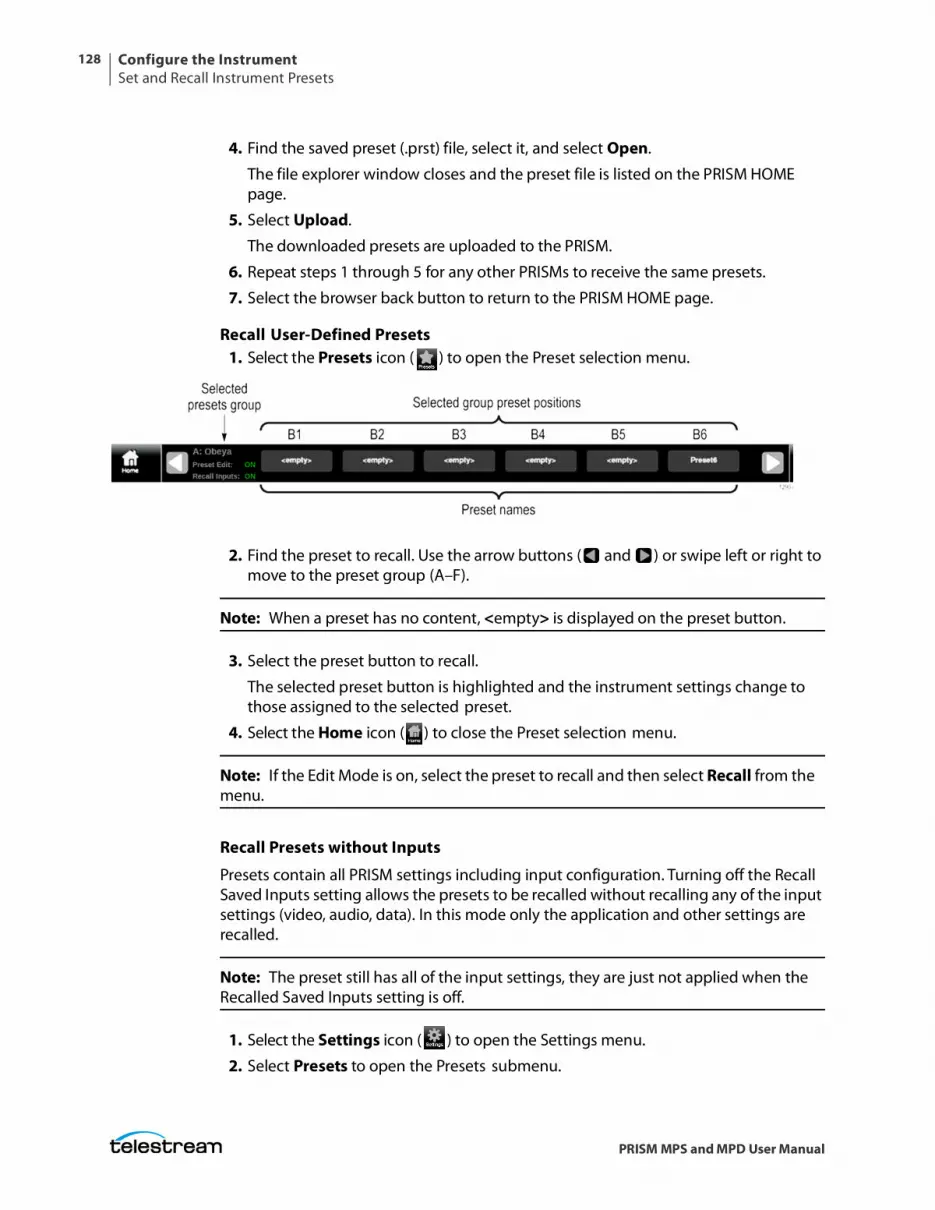
Configure the InstrumentSet and Recall Instrument Presets
128
PRISM MPS and MPD User Manual
4. Find the saved preset (.prst) file, select it, and select Open.
The file explorer window closes and the preset file is listed on the PRISM HOME page.
5. Select Upload.
The downloaded presets are uploaded to the PRISM.
6. Repeat steps 1 through 5 for any other PRISMs to receive the same presets.
7. Select the browser back button to return to the PRISM HOME page.
Recall User-Defined Presets1. Select the Presets icon ( ) to open the Preset selection menu.
2. Find the preset to recall. Use the arrow buttons ( and ) or swipe left or right to move to the preset group (A–F).
Note: When a preset has no content, <empty> is displayed on the preset button.
3. Select the preset button to recall.
The selected preset button is highlighted and the instrument settings change to those assigned to the selected preset.
4. Select the Home icon ( ) to close the Preset selection menu.
Note: If the Edit Mode is on, select the preset to recall and then select Recall from the menu.
Recall Presets without Inputs
Presets contain all PRISM settings including input configuration. Turning off the Recall Saved Inputs setting allows the presets to be recalled without recalling any of the input settings (video, audio, data). In this mode only the application and other settings are recalled.
Note: The preset still has all of the input settings, they are just not applied when the Recalled Saved Inputs setting is off.
1. Select the Settings icon ( ) to open the Settings menu.
2. Select Presets to open the Presets submenu.
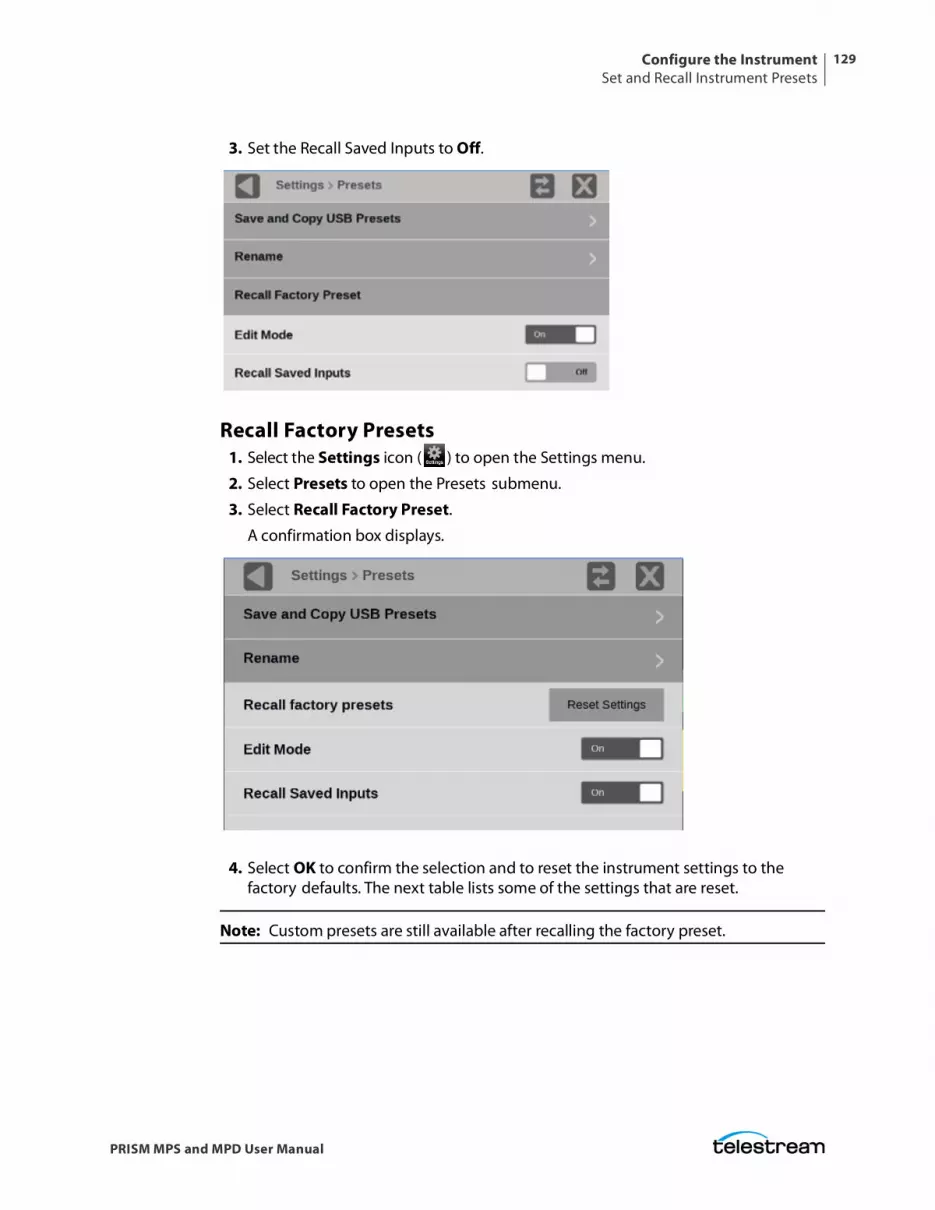
Configure the InstrumentSet and Recall Instrument Presets
129
PRISM MPS and MPD User Manual
3. Set the Recall Saved Inputs to Off.
Recall Factory Presets1. Select the Settings icon ( ) to open the Settings menu.
2. Select Presets to open the Presets submenu.
3. Select Recall Factory Preset.
A confirmation box displays.
4. Select OK to confirm the selection and to reset the instrument settings to the factory defaults. The next table lists some of the settings that are reset.
Note: Custom presets are still available after recalling the factory preset.
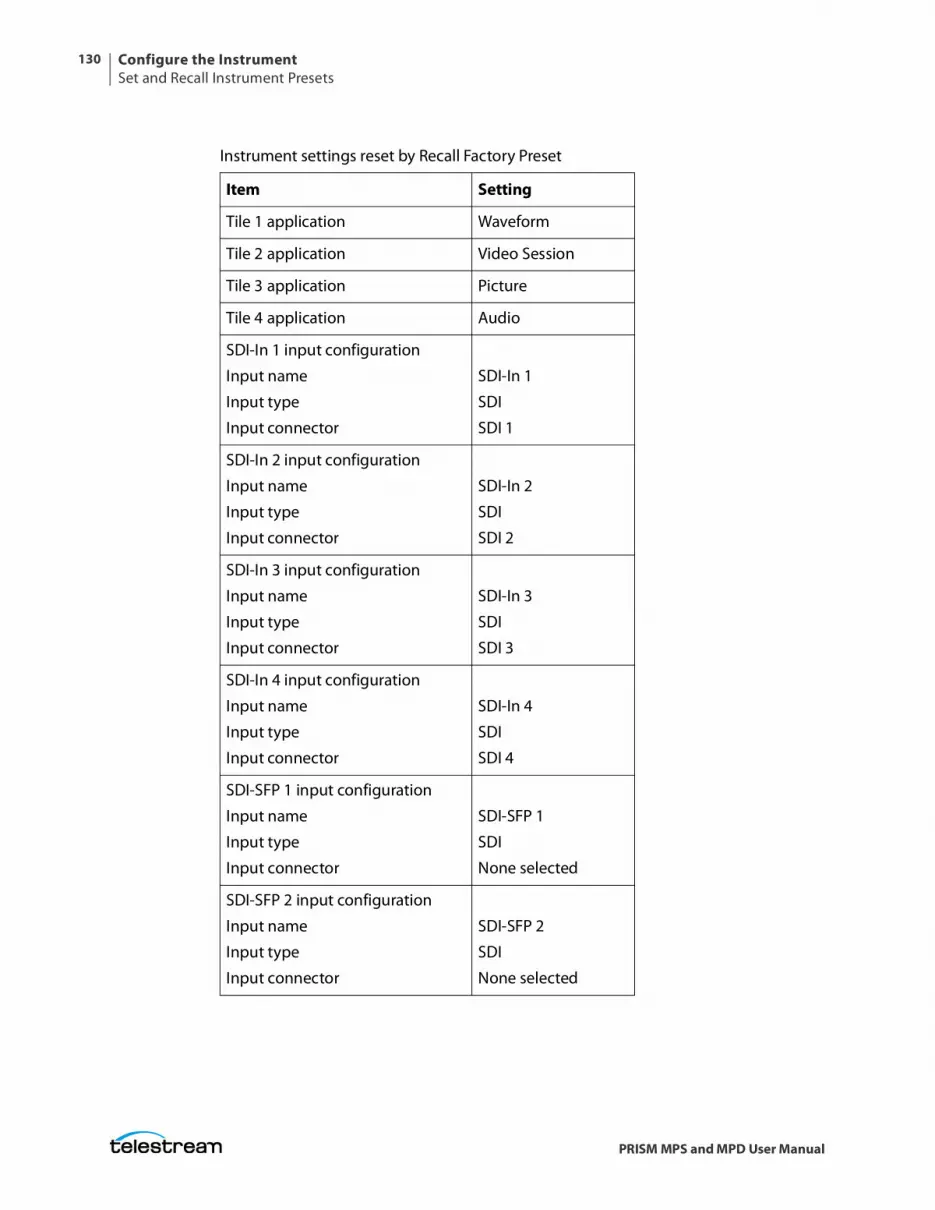
Configure the InstrumentSet and Recall Instrument Presets
130
PRISM MPS and MPD User Manual
Instrument settings reset by Recall Factory Preset
Item Setting
Tile 1 application Waveform
Tile 2 application Video Session
Tile 3 application Picture
Tile 4 application Audio
SDI-In 1 input configuration
Input name
Input type
Input connector
SDI-In 1
SDI
SDI 1
SDI-In 2 input configuration
Input name
Input type
Input connector
SDI-In 2
SDI
SDI 2
SDI-In 3 input configuration
Input name
Input type
Input connector
SDI-In 3
SDI
SDI 3
SDI-In 4 input configuration
Input name
Input type
Input connector
SDI-In 4
SDI
SDI 4
SDI-SFP 1 input configuration
Input name
Input type
Input connector
SDI-SFP 1
SDI
None selected
SDI-SFP 2 input configuration
Input name
Input type
Input connector
SDI-SFP 2
SDI
None selected
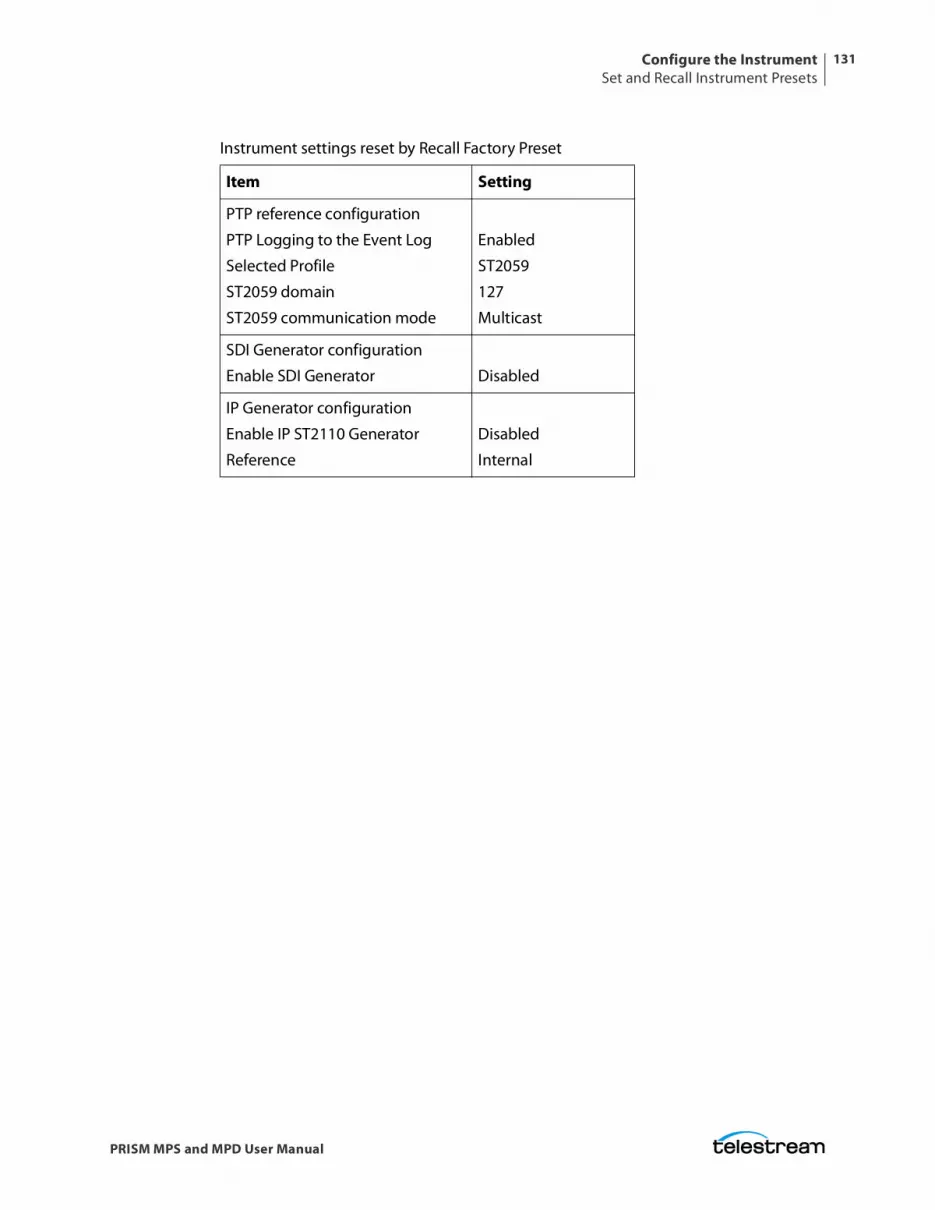
Configure the InstrumentSet and Recall Instrument Presets
131
PRISM MPS and MPD User Manual
PTP reference configuration
PTP Logging to the Event Log
Selected Profile
ST2059 domain
ST2059 communication mode
Enabled
ST2059
127
Multicast
SDI Generator configuration
Enable SDI Generator Disabled
IP Generator configuration
Enable IP ST2110 Generator
Reference
Disabled
Internal
Instrument settings reset by Recall Factory Preset
Item Setting
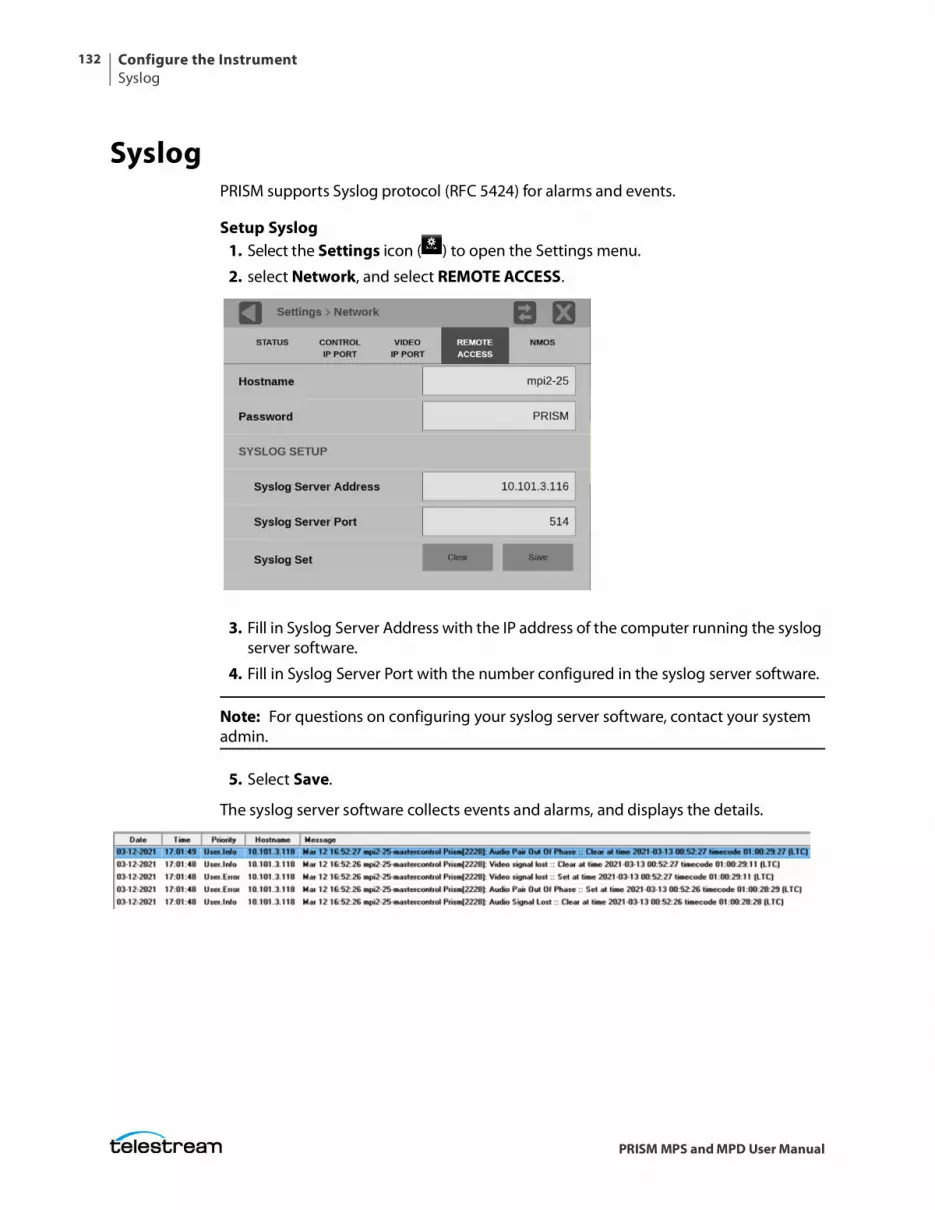
Configure the InstrumentSyslog
132
PRISM MPS and MPD User Manual
SyslogPRISM supports Syslog protocol (RFC 5424) for alarms and events.
Setup Syslog1. Select the Settings icon ( ) to open the Settings menu.
2. select Network, and select REMOTE ACCESS.
3. Fill in Syslog Server Address with the IP address of the computer running the syslog server software.
4. Fill in Syslog Server Port with the number configured in the syslog server software.
Note: For questions on configuring your syslog server software, contact your system admin.
5. Select Save.
The syslog server software collects events and alarms, and displays the details.
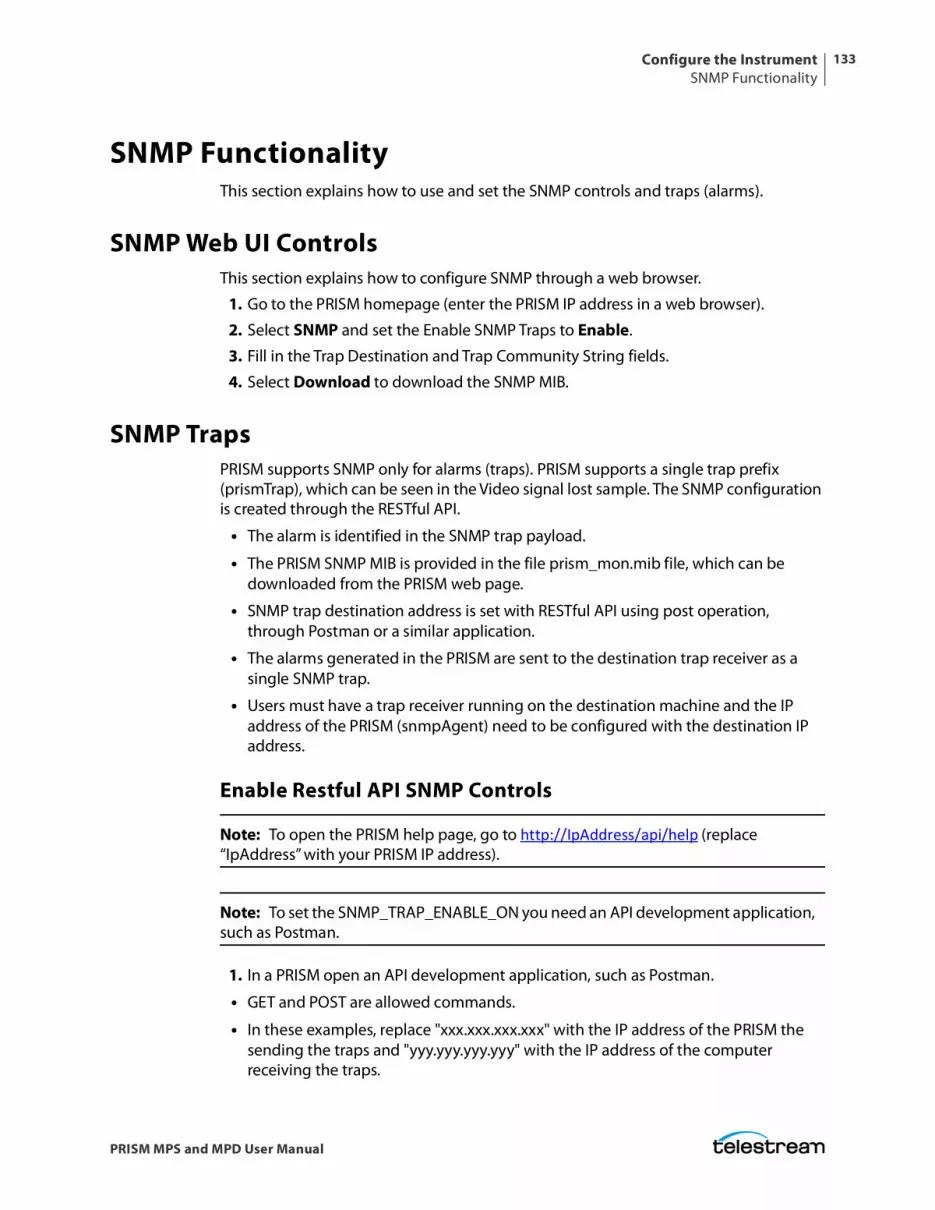
Configure the InstrumentSNMP Functionality
133
PRISM MPS and MPD User Manual
SNMP FunctionalityThis section explains how to use and set the SNMP controls and traps (alarms).
SNMP Web UI ControlsThis section explains how to configure SNMP through a web browser.
1. Go to the PRISM homepage (enter the PRISM IP address in a web browser).
2. Select SNMP and set the Enable SNMP Traps to Enable.
3. Fill in the Trap Destination and Trap Community String fields.
4. Select Download to download the SNMP MIB.
SNMP TrapsPRISM supports SNMP only for alarms (traps). PRISM supports a single trap prefix (prismTrap), which can be seen in the Video signal lost sample. The SNMP configuration is created through the RESTful API.
• The alarm is identified in the SNMP trap payload.
• The PRISM SNMP MIB is provided in the file prism_mon.mib file, which can be downloaded from the PRISM web page.
• SNMP trap destination address is set with RESTful API using post operation, through Postman or a similar application.
• The alarms generated in the PRISM are sent to the destination trap receiver as a single SNMP trap.
• Users must have a trap receiver running on the destination machine and the IP address of the PRISM (snmpAgent) need to be configured with the destination IP address.
Enable Restful API SNMP Controls
Note: To open the PRISM help page, go to http://IpAddress/api/help (replace “IpAddress” with your PRISM IP address).
Note: To set the SNMP_TRAP_ENABLE_ON you need an API development application, such as Postman.
1. In a PRISM open an API development application, such as Postman.
• GET and POST are allowed commands.
• In these examples, replace "xxx.xxx.xxx.xxx" with the IP address of the PRISM the sending the traps and "yyy.yyy.yyy.yyy" with the IP address of the computer receiving the traps.
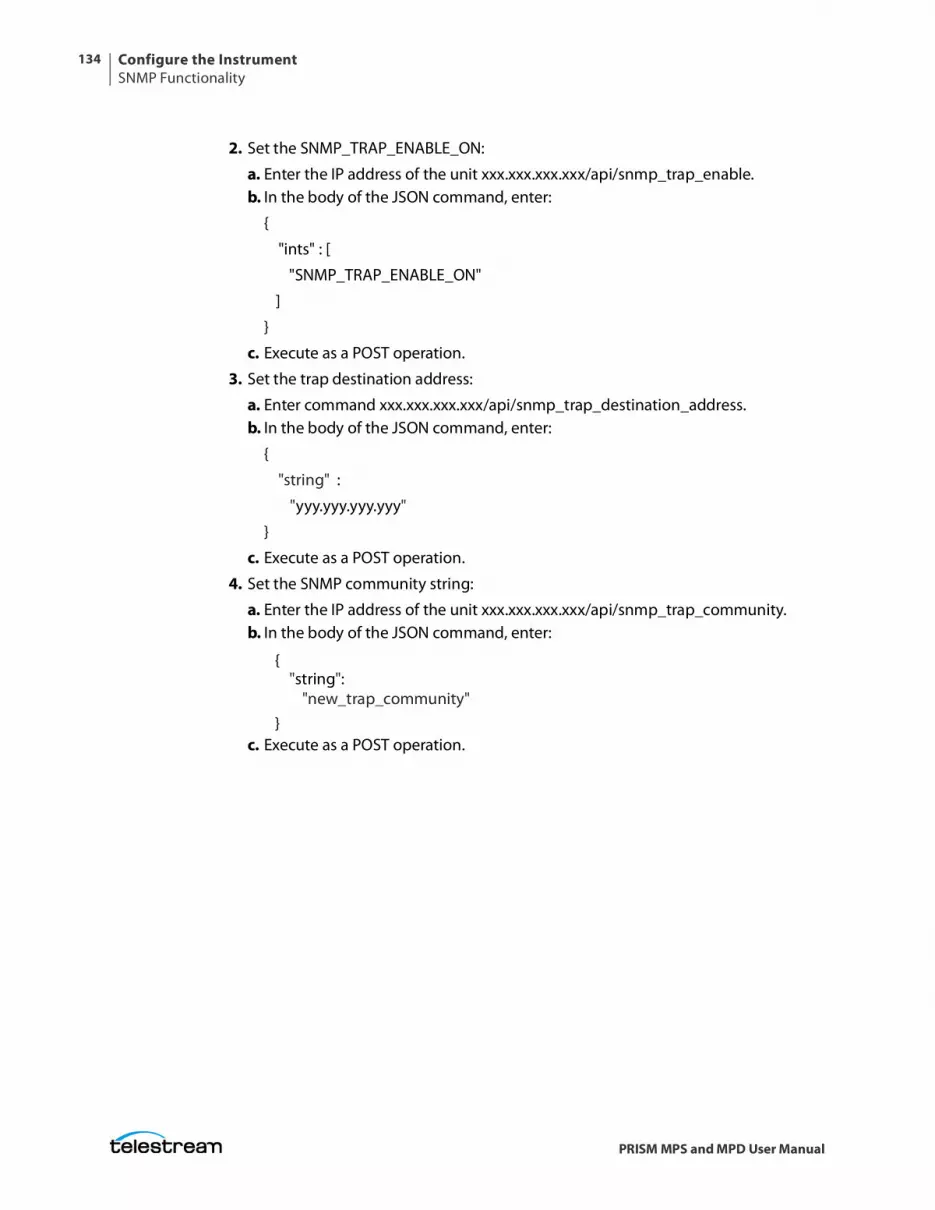
Configure the InstrumentSNMP Functionality
134
PRISM MPS and MPD User Manual
2. Set the SNMP_TRAP_ENABLE_ON:
a. Enter the IP address of the unit xxx.xxx.xxx.xxx/api/snmp_trap_enable. b. In the body of the JSON command, enter:
{
"ints" : [
"SNMP_TRAP_ENABLE_ON"
]
}
c. Execute as a POST operation.
3. Set the trap destination address:
a. Enter command xxx.xxx.xxx.xxx/api/snmp_trap_destination_address. b. In the body of the JSON command, enter:
{
"string" :
"yyy.yyy.yyy.yyy"
}
c. Execute as a POST operation.
4. Set the SNMP community string:
a. Enter the IP address of the unit xxx.xxx.xxx.xxx/api/snmp_trap_community. b. In the body of the JSON command, enter:
{ "string":
"new_trap_community"}
c. Execute as a POST operation.
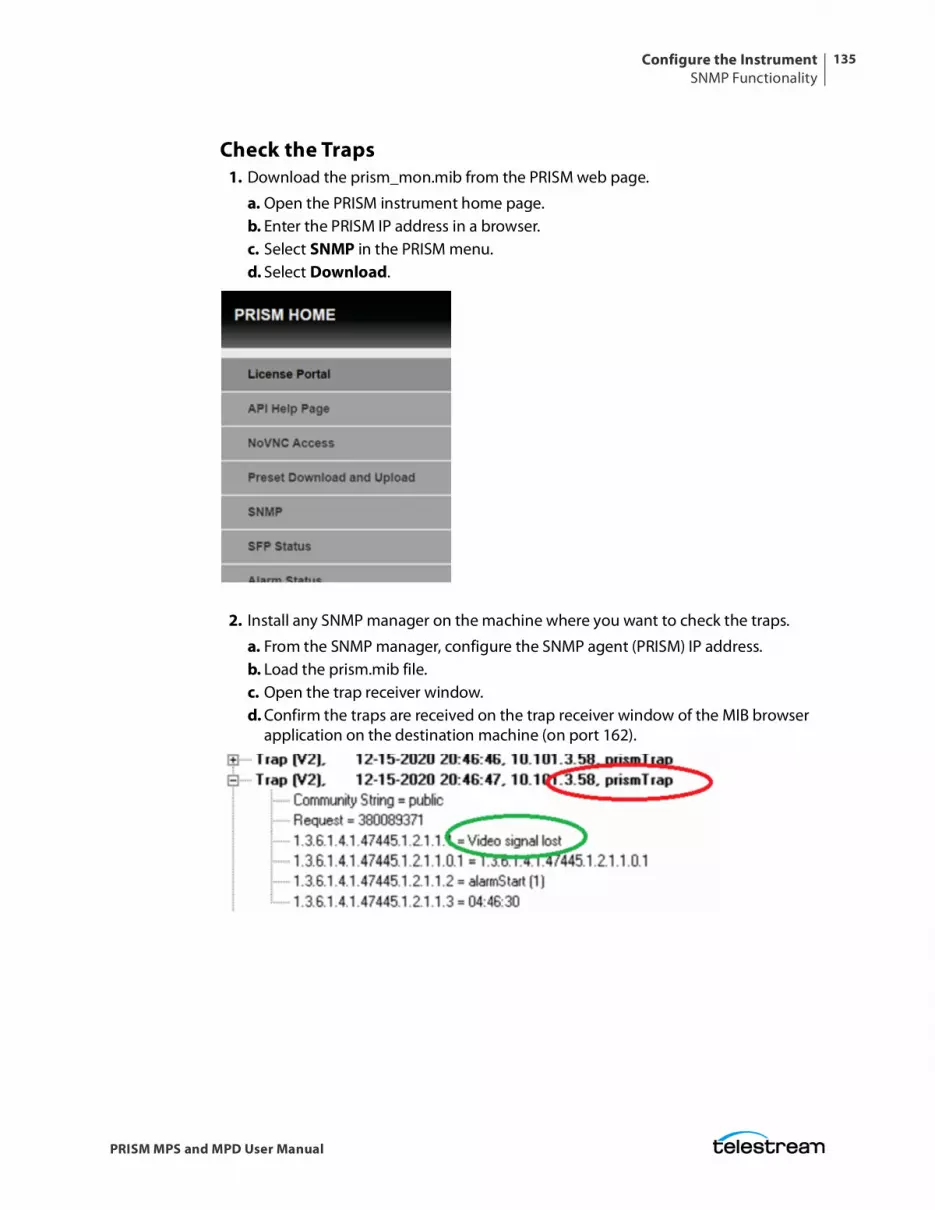
Configure the InstrumentSNMP Functionality
135
PRISM MPS and MPD User Manual
Check the Traps1. Download the prism_mon.mib from the PRISM web page.
a. Open the PRISM instrument home page.b. Enter the PRISM IP address in a browser.c. Select SNMP in the PRISM menu.d. Select Download.
2. Install any SNMP manager on the machine where you want to check the traps.
a. From the SNMP manager, configure the SNMP agent (PRISM) IP address.b. Load the prism.mib file.c. Open the trap receiver window.d. Confirm the traps are received on the trap receiver window of the MIB browser
application on the destination machine (on port 162).
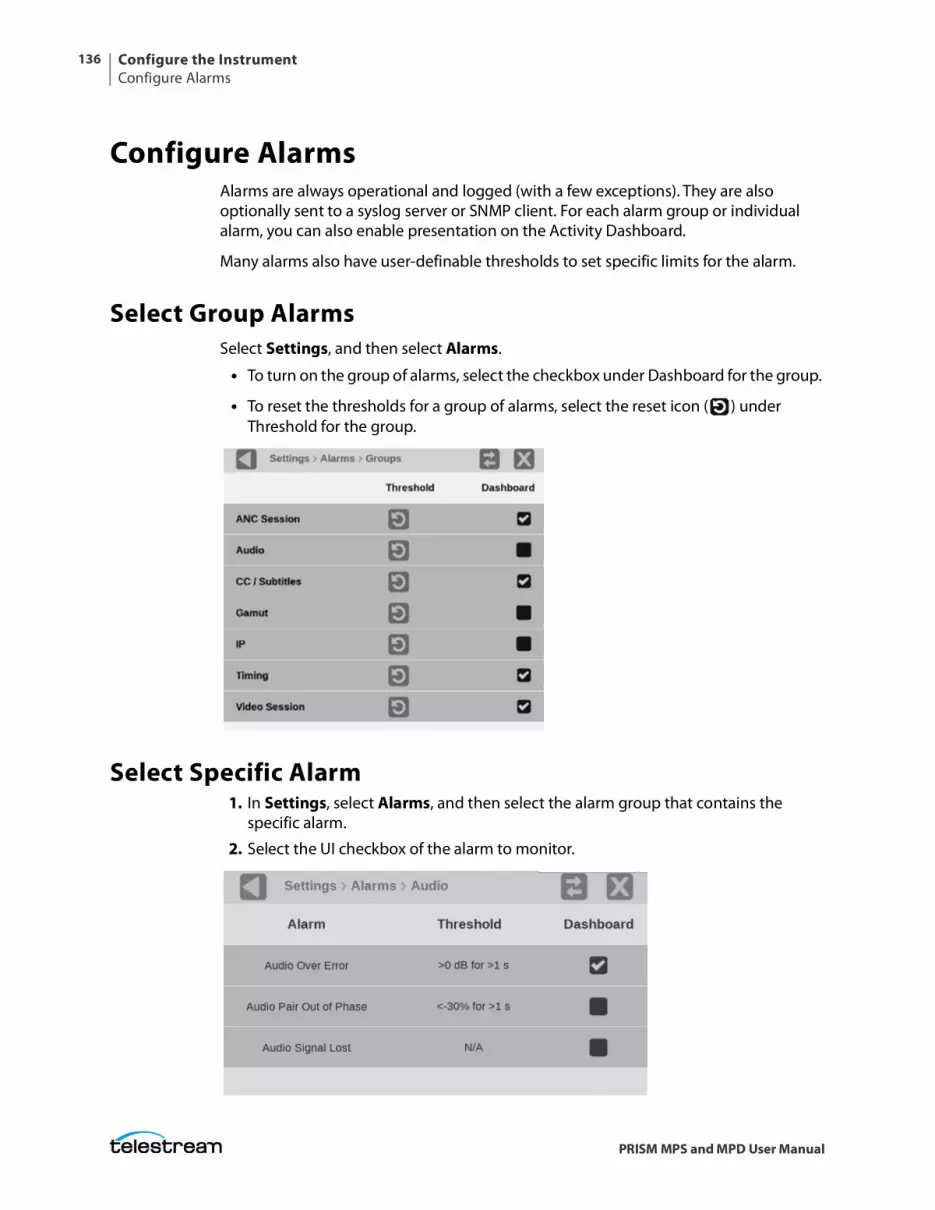
Configure the InstrumentConfigure Alarms
136
PRISM MPS and MPD User Manual
Configure AlarmsAlarms are always operational and logged (with a few exceptions). They are also optionally sent to a syslog server or SNMP client. For each alarm group or individual alarm, you can also enable presentation on the Activity Dashboard.
Many alarms also have user-definable thresholds to set specific limits for the alarm.
Select Group AlarmsSelect Settings, and then select Alarms.
• To turn on the group of alarms, select the checkbox under Dashboard for the group.
• To reset the thresholds for a group of alarms, select the reset icon ( ) under Threshold for the group.
Select Specific Alarm1. In Settings, select Alarms, and then select the alarm group that contains the
specific alarm.
2. Select the UI checkbox of the alarm to monitor.
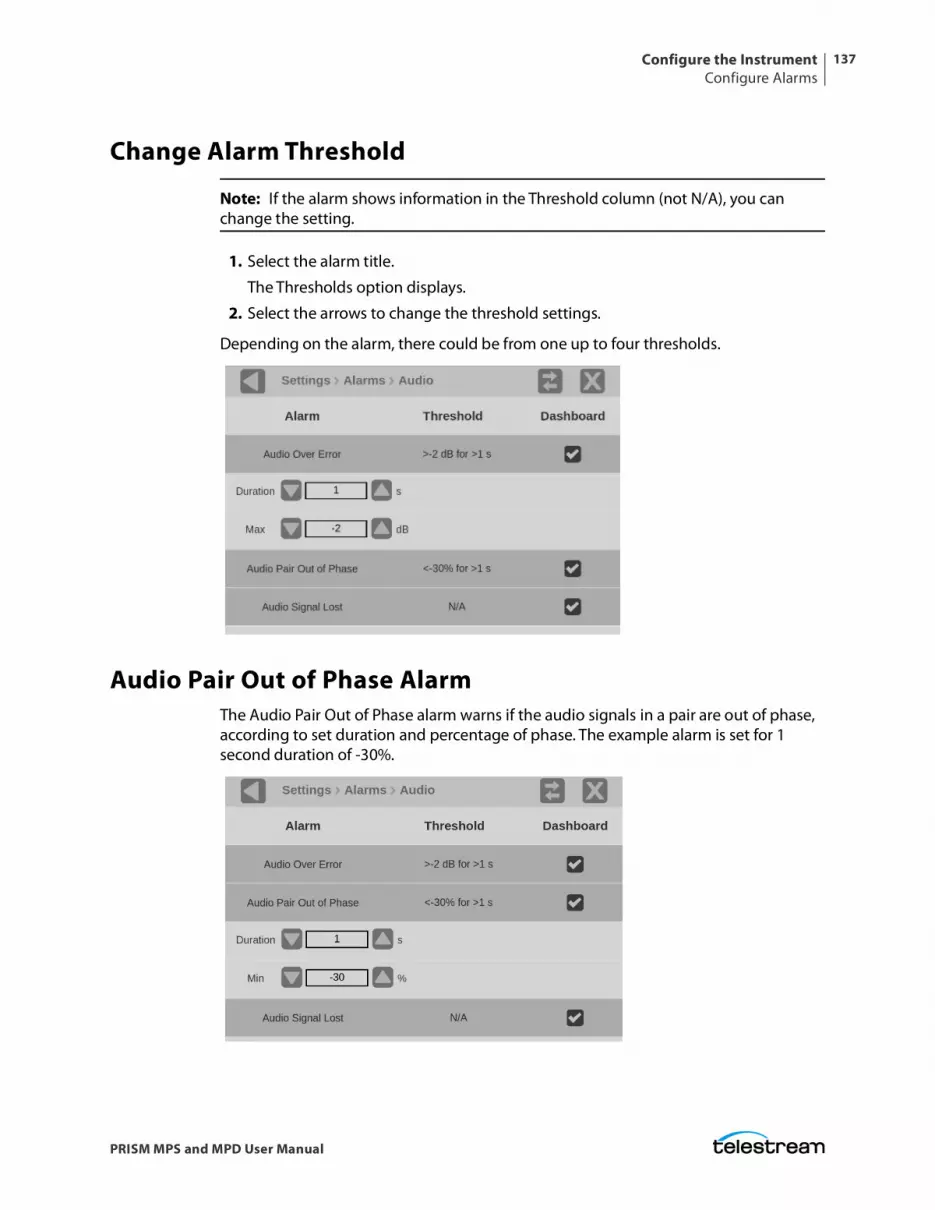
Configure the InstrumentConfigure Alarms
137
PRISM MPS and MPD User Manual
Change Alarm Threshold
Note: If the alarm shows information in the Threshold column (not N/A), you can change the setting.
1. Select the alarm title.
The Thresholds option displays.
2. Select the arrows to change the threshold settings.
Depending on the alarm, there could be from one up to four thresholds.
Audio Pair Out of Phase AlarmThe Audio Pair Out of Phase alarm warns if the audio signals in a pair are out of phase, according to set duration and percentage of phase. The example alarm is set for 1 second duration of -30%.
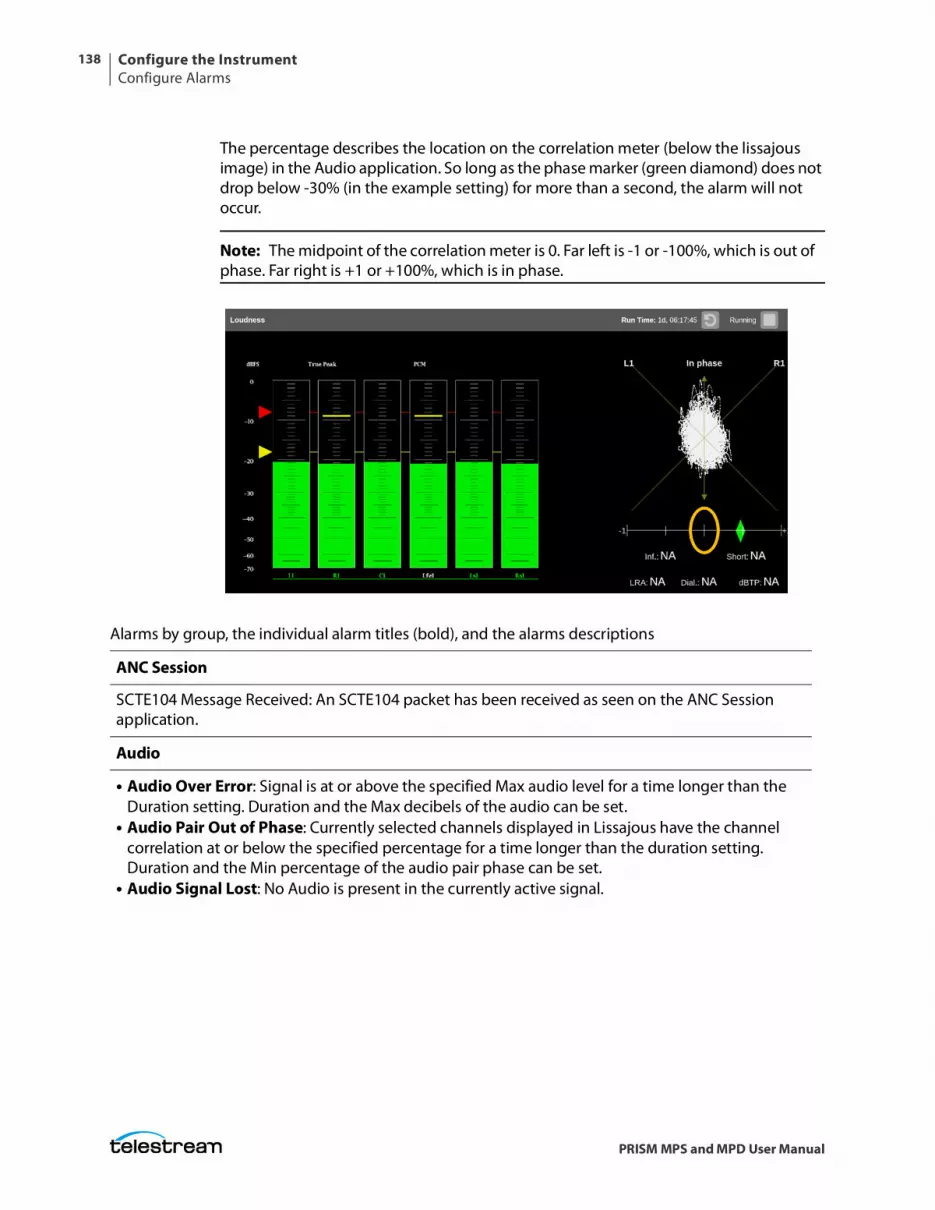
Configure the InstrumentConfigure Alarms
138
PRISM MPS and MPD User Manual
The percentage describes the location on the correlation meter (below the lissajous image) in the Audio application. So long as the phase marker (green diamond) does not drop below -30% (in the example setting) for more than a second, the alarm will not occur.
Note: The midpoint of the correlation meter is 0. Far left is -1 or -100%, which is out of phase. Far right is +1 or +100%, which is in phase.
Alarms by group, the individual alarm titles (bold), and the alarms descriptions
ANC Session
SCTE104 Message Received: An SCTE104 packet has been received as seen on the ANC Session application.
Audio
• Audio Over Error: Signal is at or above the specified Max audio level for a time longer than the Duration setting. Duration and the Max decibels of the audio can be set.
• Audio Pair Out of Phase: Currently selected channels displayed in Lissajous have the channel correlation at or below the specified percentage for a time longer than the duration setting. Duration and the Min percentage of the audio pair phase can be set.
• Audio Signal Lost: No Audio is present in the currently active signal.
Configure the InstrumentConfigure Alarms
139
PRISM MPS and MPD User Manual
CC (Closed Captions) / Subtitles
• CEA708 Closed Captions Lost: No valid CEA708 closed caption packets in the ancillary data space were found. Duration of the loss can be set.
• OP-47 Multipacket Teletext Lost: No valid Operational Practice 47 multi data packets were found in the ancillary data space of the signal. Duration of the loss can be set.
• OP-47 SDP Teletext Lost: No valid Operational Practice 47 SDP data packets were found in the ancillary data space of the signal. Duration of the loss can be set.
• S334-1 CEA 608 Closed Captions Lost: No valid S334-1 CEA 608 closed caption packets were found in the ancillary data space. Duration of the loss can be set.
• S334-2 CEA 608 Closed Captions Lost: No valid S334-2 CEA 608 closed caption packets were found in the ancillary data space. Duration of the loss can be set.
• SMPTE 2031 Teletext Lost: No valid SMPTE 2031 ANC data packets were found in the ancillary data space. Duration of the loss can be set.
Gamut
Gamut Preset: Indicates when the input signal contains colors that violate the currently set limits for YRGB gamut, which are specified by the Settings/Alarms/Gamut. These measurements conform to the EBU R103 standard. YRGB Minimum and Maximum, Picture Area percentage, and Frame Duration can be set.
Gamut measurements are supported for SD, 720p,1080p slow frame rate, 1080i, and 1080p levelA 422-10bit and 444-12bit.
Gamut measurements can be totally disabled to minimize CPU loading to enable quieter operation. To disable the Gamut measurements, set Gamut Enable to Off.
Note: When Gamut is disabled, no Gamut alarms are generated or logged.
Note: The Gamut Preset button, EBU R103, only resets the YRGB numbers, not the Picture Area or Frame Duration.
Configure the InstrumentConfigure Alarms
140
PRISM MPS and MPD User Manual
IP
• Combined RTP Sequence Error: RTP sequence error occurred in the combined output of a media stream protected using RTP packet reordering or ST2022.7 seamless switching.
• Data Rate Invalid or Unstable: Detected data rate of a video input is unstable or nonstandard.• Ethernet BER Excessive: Excessive bit-error rate has been detected on Ethernet interface.• Ethernet Buffer Overflow: Overflow was detected on IP Video Ports.• Ethernet CRC Error: CRC error was detected in an Ethernet frame.• Ethernet Interface Saturated: Ethernet interface is saturated.• HBRMT Header Invalid: Error occurred in the HBRMT header.• HBRMT Sequence Error: Packets are dropped, out of order, or duplicated; or a sequence number
in a flow does not change.• HBRMT Timestamp Error: HBRMT timestamp is corrupt or is not updating at the correct
frequency for the specified media type.• L4 Protocol Checksum Error: Checksum error was detected in an IP or UDP packet.• Network Connection Lost: Fiber connection to SFP port has been removed or FEC mode is in the
wrong state.• RTP Header Invalid: Error occurred in the RTP header.• RTP Marker Frequency Error: RTP marker bit is not designated at the correct frequency for the
specified media type.• RTP Sequence Error: Sequence errors can be caused by dropped, out of order, or duplicated
packets. They can also be triggered when the sequence number within a flow does not change.• RTP Timestamp Error: RTP timestamp is corrupt or is not updating at the correct frequency for
the specified media type.• S2022/7 Path Missing: One of the data paths in a S2022.7 seamless switching configuration is
missing.
Timing
• External Reference Lost: External reference signal is not detected.• Link Timing Error: Timing difference between any two links exceeds 400 nanoseconds, according
to ST425-6 2014.• PTP Unlocked: PTP is unlocked or missing.• Timing Drift: Input signal is not frequency locked to the reference signal. Drift rate is >10us of
timing change on a 20-second window, larger drift rates are detected faster.• Video and Reference Mismatch: Detected format of the external reference signal is not
compatible with the input signal format.
Video Session
• Format Unsupported: Detected video format is not supported.• Inter-link Format Mismatch: Four links of a quad-link signal are not the same format.• SD Video Detected: Detected video format is standard definition, for example 525 or 625.• SDI Active Field Length Error: Input signal is not frequency locked to the reference signal.
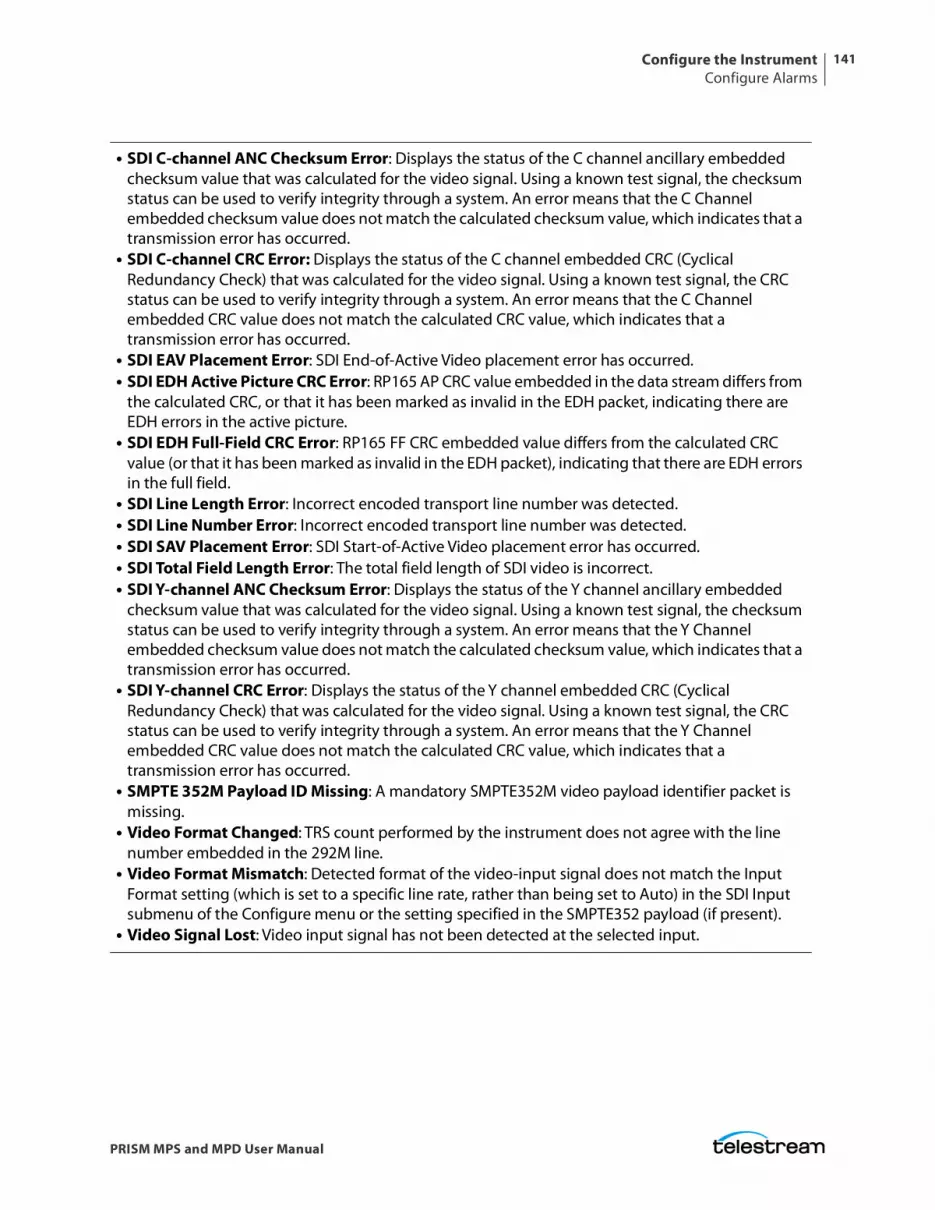
Configure the InstrumentConfigure Alarms
141
PRISM MPS and MPD User Manual
• SDI C-channel ANC Checksum Error: Displays the status of the C channel ancillary embedded checksum value that was calculated for the video signal. Using a known test signal, the checksum status can be used to verify integrity through a system. An error means that the C Channel embedded checksum value does not match the calculated checksum value, which indicates that a transmission error has occurred.
• SDI C-channel CRC Error: Displays the status of the C channel embedded CRC (Cyclical Redundancy Check) that was calculated for the video signal. Using a known test signal, the CRC status can be used to verify integrity through a system. An error means that the C Channel embedded CRC value does not match the calculated CRC value, which indicates that a transmission error has occurred.
• SDI EAV Placement Error: SDI End-of-Active Video placement error has occurred.• SDI EDH Active Picture CRC Error: RP165 AP CRC value embedded in the data stream differs from
the calculated CRC, or that it has been marked as invalid in the EDH packet, indicating there are EDH errors in the active picture.
• SDI EDH Full-Field CRC Error: RP165 FF CRC embedded value differs from the calculated CRC value (or that it has been marked as invalid in the EDH packet), indicating that there are EDH errors in the full field.
• SDI Line Length Error: Incorrect encoded transport line number was detected.• SDI Line Number Error: Incorrect encoded transport line number was detected.• SDI SAV Placement Error: SDI Start-of-Active Video placement error has occurred.• SDI Total Field Length Error: The total field length of SDI video is incorrect.• SDI Y-channel ANC Checksum Error: Displays the status of the Y channel ancillary embedded
checksum value that was calculated for the video signal. Using a known test signal, the checksum status can be used to verify integrity through a system. An error means that the Y Channel embedded checksum value does not match the calculated checksum value, which indicates that a transmission error has occurred.
• SDI Y-channel CRC Error: Displays the status of the Y channel embedded CRC (Cyclical Redundancy Check) that was calculated for the video signal. Using a known test signal, the CRC status can be used to verify integrity through a system. An error means that the Y Channel embedded CRC value does not match the calculated CRC value, which indicates that a transmission error has occurred.
• SMPTE 352M Payload ID Missing: A mandatory SMPTE352M video payload identifier packet is missing.
• Video Format Changed: TRS count performed by the instrument does not agree with the line number embedded in the 292M line.
• Video Format Mismatch: Detected format of the video-input signal does not match the Input Format setting (which is set to a specific line rate, rather than being set to Auto) in the SDI Input submenu of the Configure menu or the setting specified in the SMPTE352 payload (if present).
• Video Signal Lost: Video input signal has not been detected at the selected input.
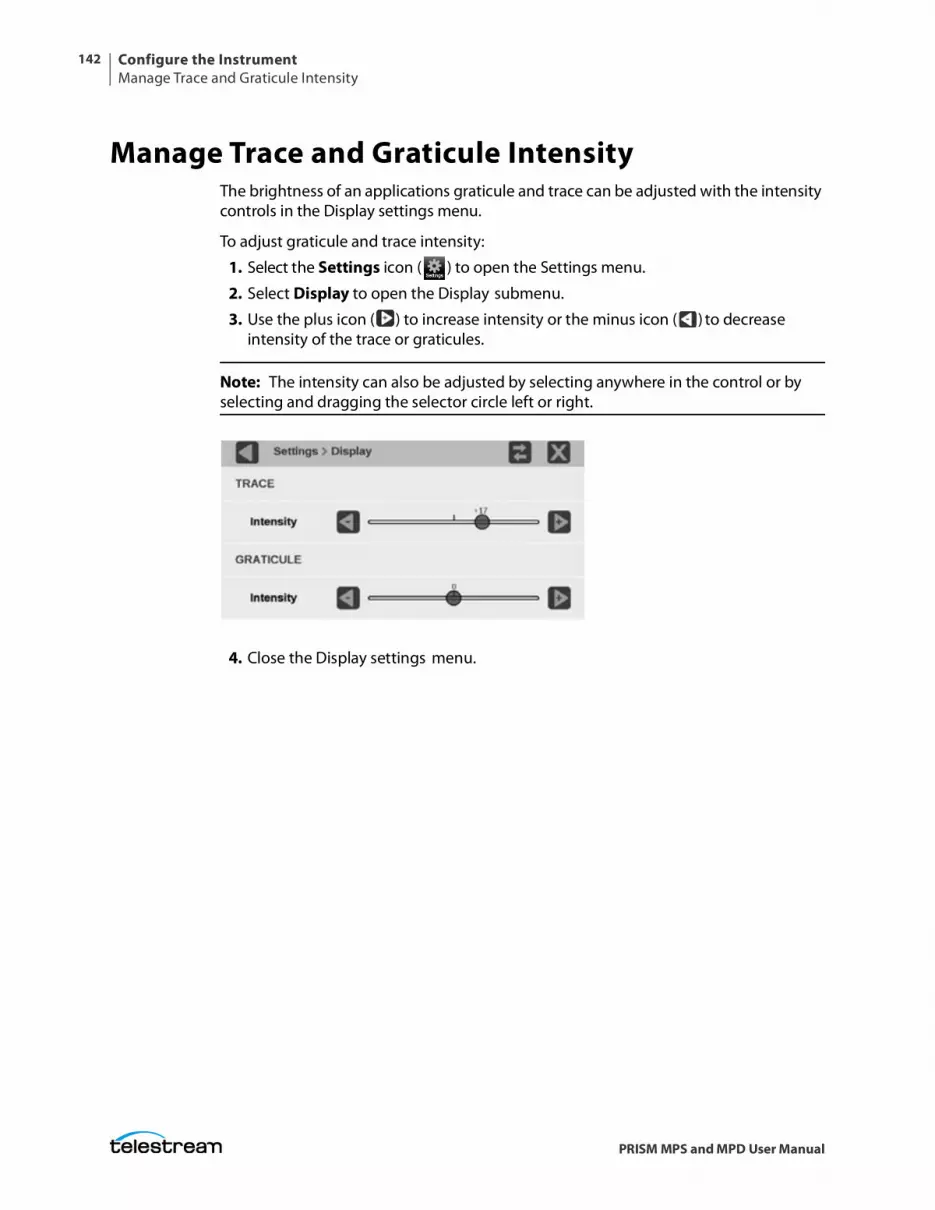
Configure the InstrumentManage Trace and Graticule Intensity
142
PRISM MPS and MPD User Manual
Manage Trace and Graticule IntensityThe brightness of an applications graticule and trace can be adjusted with the intensity controls in the Display settings menu.
To adjust graticule and trace intensity:
1. Select the Settings icon ( ) to open the Settings menu.
2. Select Display to open the Display submenu.
3. Use the plus icon ( ) to increase intensity or the minus icon ( ) to decrease intensity of the trace or graticules.
Note: The intensity can also be adjusted by selecting anywhere in the control or by selecting and dragging the selector circle left or right.
4. Close the Display settings menu.
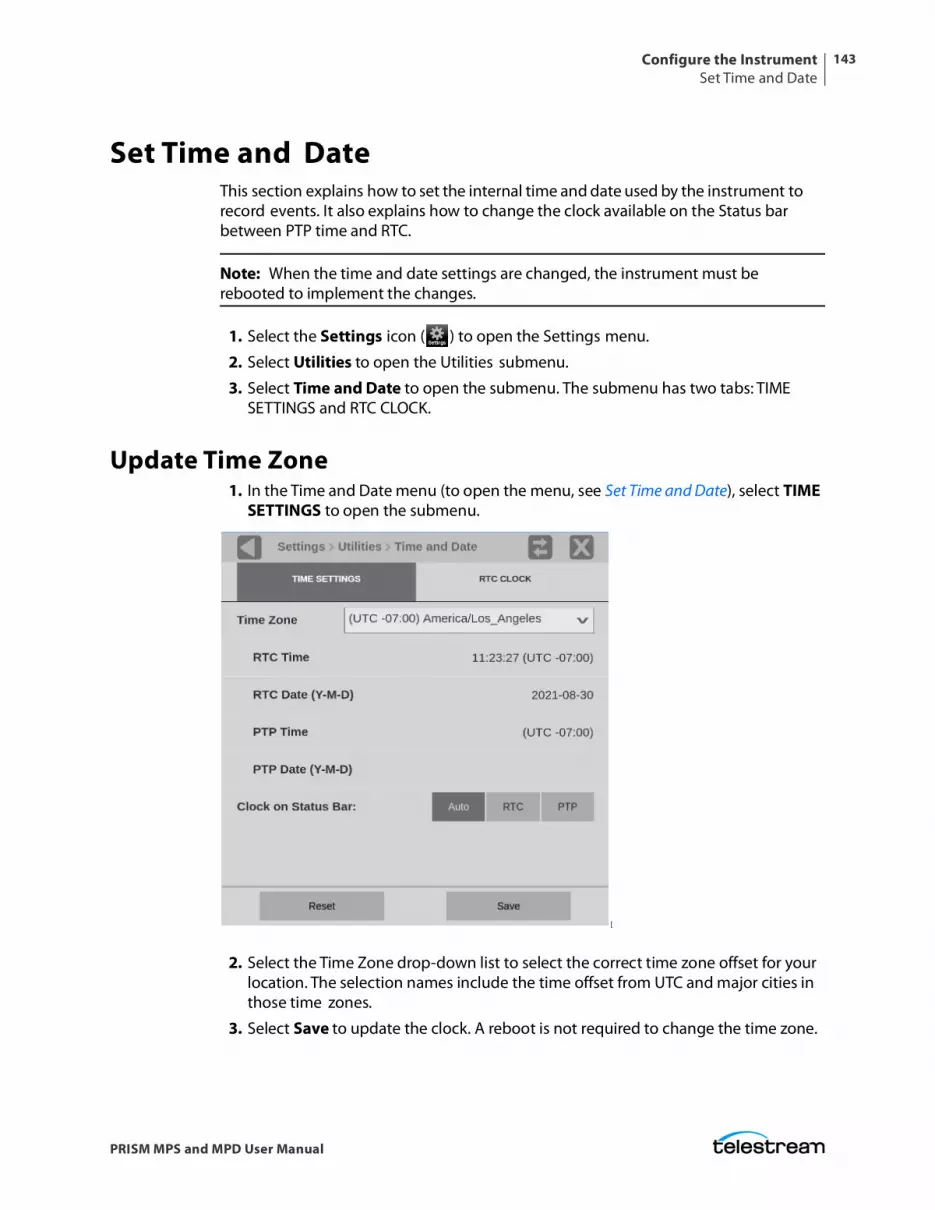
Configure the InstrumentSet Time and Date
143
PRISM MPS and MPD User Manual
Set Time and DateThis section explains how to set the internal time and date used by the instrument to record events. It also explains how to change the clock available on the Status bar between PTP time and RTC.
Note: When the time and date settings are changed, the instrument must be rebooted to implement the changes.
1. Select the Settings icon ( ) to open the Settings menu.
2. Select Utilities to open the Utilities submenu.
3. Select Time and Date to open the submenu. The submenu has two tabs: TIME SETTINGS and RTC CLOCK.
Update Time Zone1. In the Time and Date menu (to open the menu, see Set Time and Date), select TIME
SETTINGS to open the submenu.
[
2. Select the Time Zone drop-down list to select the correct time zone offset for your location. The selection names include the time offset from UTC and major cities in those time zones.
3. Select Save to update the clock. A reboot is not required to change the time zone.
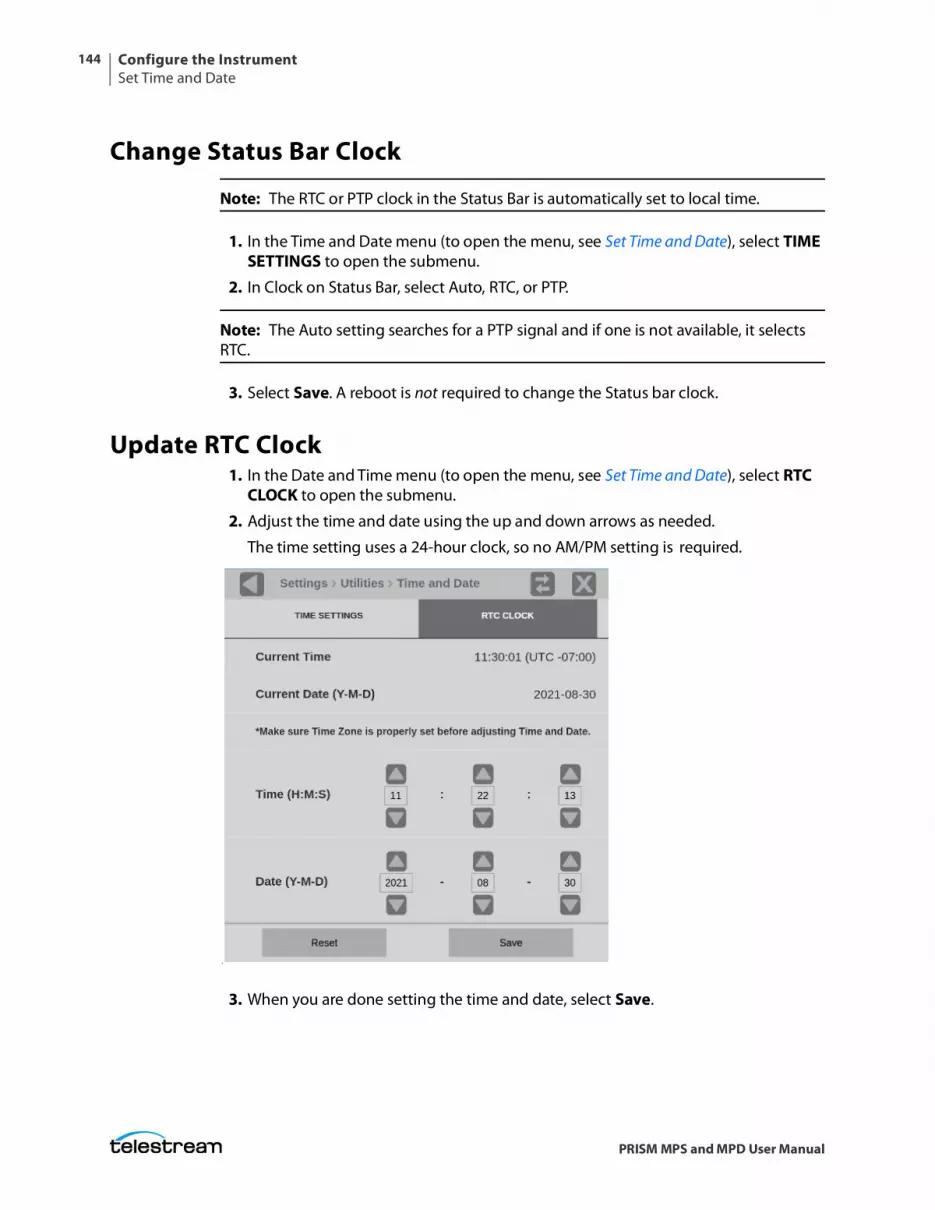
Configure the InstrumentSet Time and Date
144
PRISM MPS and MPD User Manual
Change Status Bar Clock
Note: The RTC or PTP clock in the Status Bar is automatically set to local time.
1. In the Time and Date menu (to open the menu, see Set Time and Date), select TIME SETTINGS to open the submenu.
2. In Clock on Status Bar, select Auto, RTC, or PTP.
Note: The Auto setting searches for a PTP signal and if one is not available, it selects RTC.
3. Select Save. A reboot is not required to change the Status bar clock.
Update RTC Clock1. In the Date and Time menu (to open the menu, see Set Time and Date), select RTC
CLOCK to open the submenu.
2. Adjust the time and date using the up and down arrows as needed.
The time setting uses a 24-hour clock, so no AM/PM setting is required.
.
3. When you are done setting the time and date, select Save.
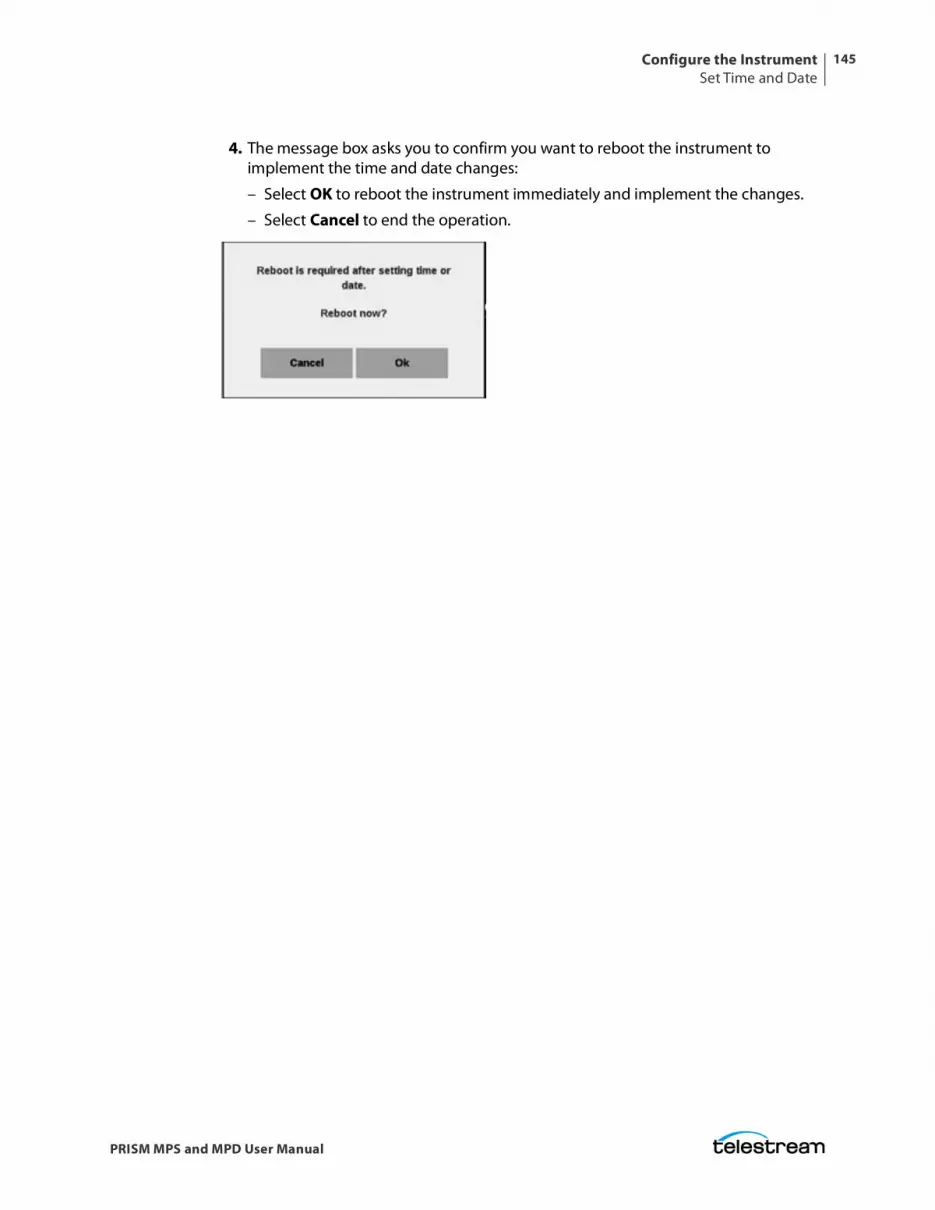
Configure the InstrumentSet Time and Date
145
PRISM MPS and MPD User Manual
4. The message box asks you to confirm you want to reboot the instrument to implement the time and date changes:
– Select OK to reboot the instrument immediately and implement the changes.
– Select Cancel to end the operation.
Configure the InstrumentUpgrade Instrument Firmware
146
PRISM MPS and MPD User Manual
Upgrade Instrument Firmware
Before You BeginTelestream releases updates to product firmware to add new features or to fix reported problems. Check the Telestream website regularly for new firmware releases.
You do not need to perform a firmware upgrade if your instrument has the latest version of firmware already installed. To determine if the firmware on your instrument must be upgraded:
1. Power on the instrument.
2. Verify the current software version installed on the instrument:
a. Select the Settings icon ( ) to open the Settings menu.b. Select Utilities to open the Utilities submenu.c. Select Version to open the Version display.d. In the Software section, make a note of the version number installed on the
instrument.
3. Verify the latest version of firmware at the Telestream website:
a. Use a web browser and go to the Telestream website software page: www.telestream.net/video/resources.htm#Software.
b. Click the product and model title that best matches your instrument (such as PRISM) and in the list, find the software-upgrade package for your instrument.
c. Note the latest version number of the software-upgrade package(s).
4. If the latest firmware version at the website is newer than the version on your instrument, you should upgrade the firmware.
5. Click the Firmware Release version for your instrument to download the update.
Caution: After the instrument has started the upgrade process, DO NOT remove power from the instrument. If you do, the instrument flash will be corrupted. The instrument must be sent to a Telestream factory service center to have the system firmware restored.
6. Go to Upgrade Firmware.
Note: The time required to complete the upgrade is about 15 minutes.
If you want the details of what has changed in the release, download the Release Notes for the version.
Instrument firmware version number
Website firmware version number
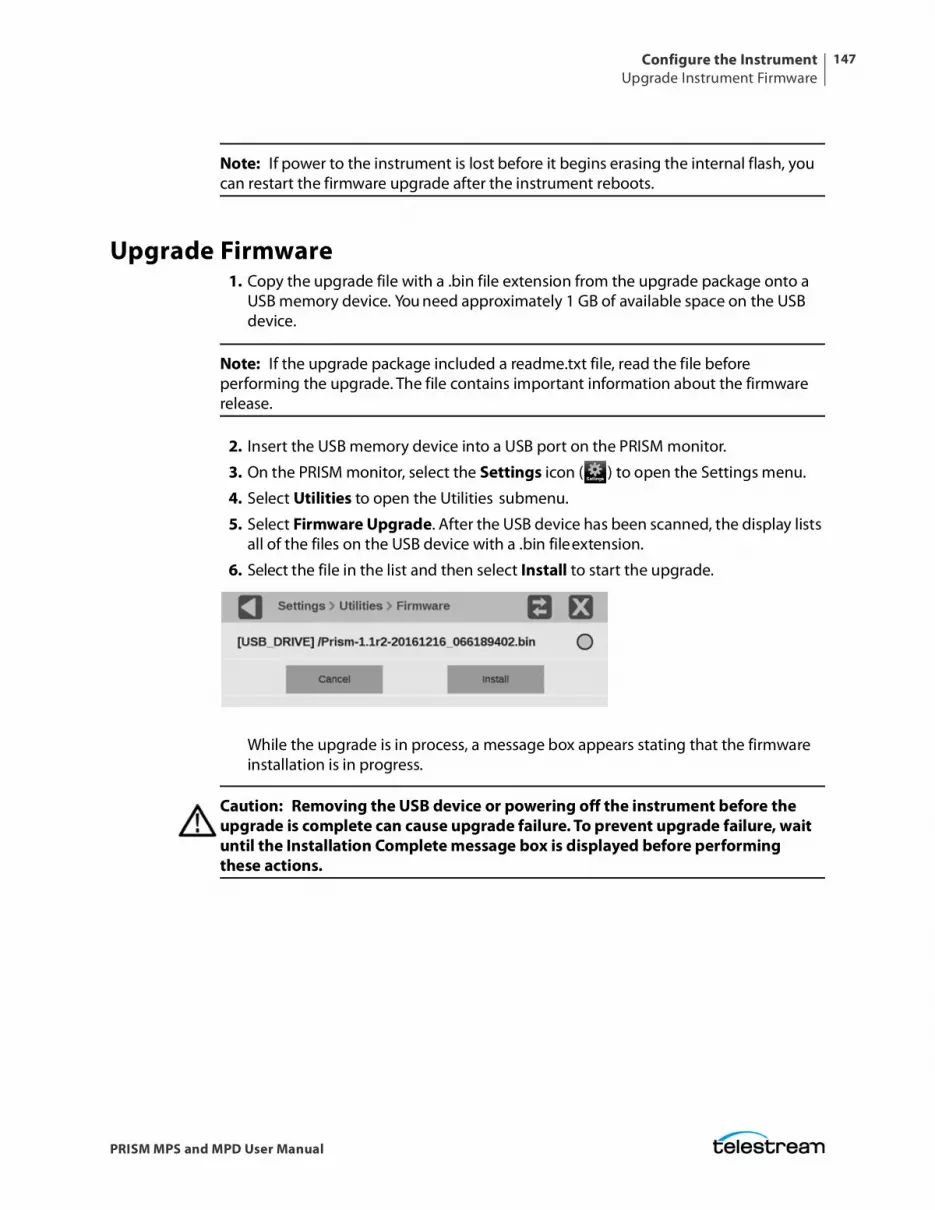
Configure the InstrumentUpgrade Instrument Firmware
147
PRISM MPS and MPD User Manual
Note: If power to the instrument is lost before it begins erasing the internal flash, you can restart the firmware upgrade after the instrument reboots.
Upgrade Firmware1. Copy the upgrade file with a .bin file extension from the upgrade package onto a
USB memory device. You need approximately 1 GB of available space on the USB device.
Note: If the upgrade package included a readme.txt file, read the file before performing the upgrade. The file contains important information about the firmware release.
2. Insert the USB memory device into a USB port on the PRISM monitor.
3. On the PRISM monitor, select the Settings icon ( ) to open the Settings menu.
4. Select Utilities to open the Utilities submenu.
5. Select Firmware Upgrade. After the USB device has been scanned, the display lists all of the files on the USB device with a .bin file extension.
6. Select the file in the list and then select Install to start the upgrade.
While the upgrade is in process, a message box appears stating that the firmware installation is in progress.
Caution: Removing the USB device or powering off the instrument before the upgrade is complete can cause upgrade failure. To prevent upgrade failure, wait until the Installation Complete message box is displayed before performing these actions.
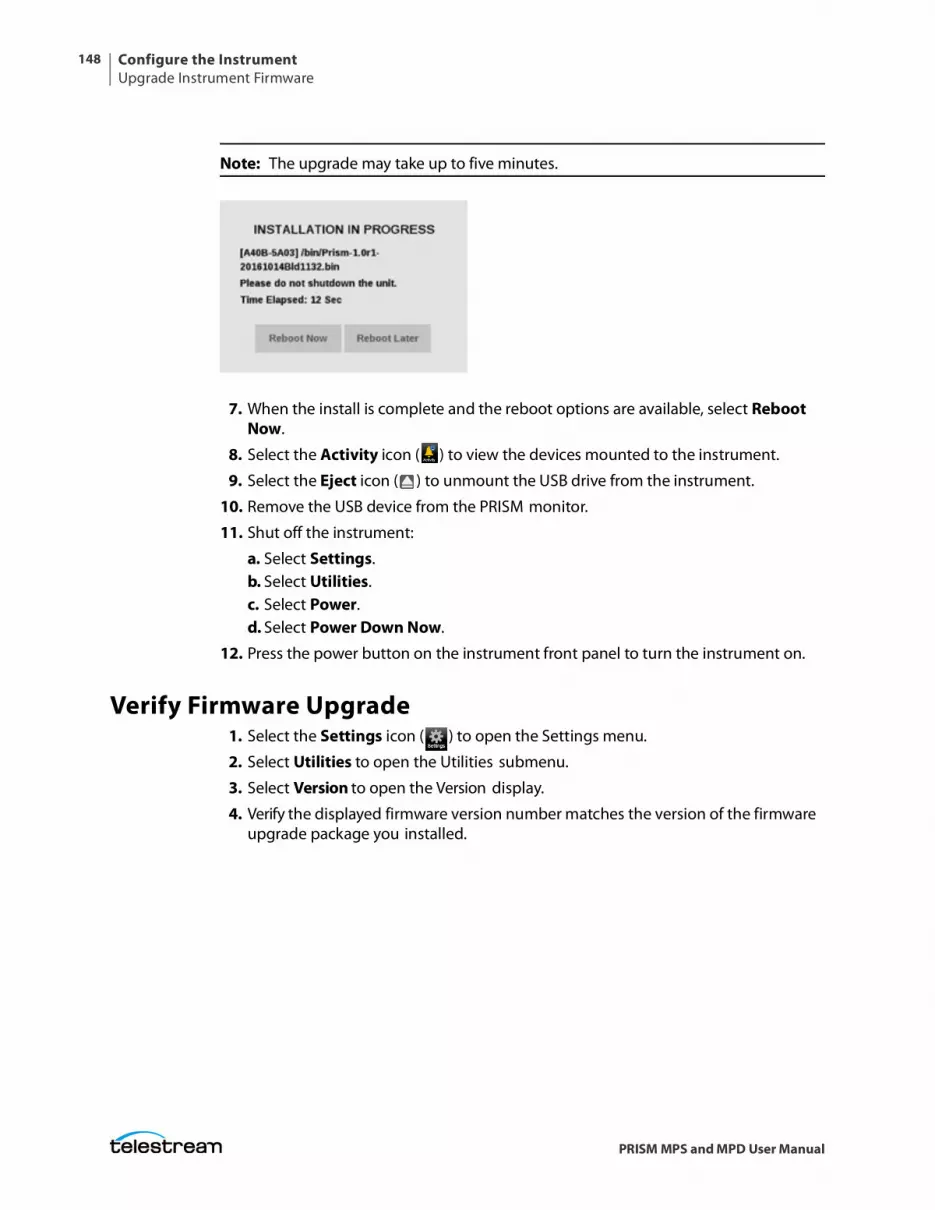
Configure the InstrumentUpgrade Instrument Firmware
148
PRISM MPS and MPD User Manual
Note: The upgrade may take up to five minutes.
7. When the install is complete and the reboot options are available, select Reboot Now.
8. Select the Activity icon ( ) to view the devices mounted to the instrument.
9. Select the Eject icon ( ) to unmount the USB drive from the instrument.
10. Remove the USB device from the PRISM monitor.
11. Shut off the instrument:
a. Select Settings.b. Select Utilities.c. Select Power.d. Select Power Down Now.
12. Press the power button on the instrument front panel to turn the instrument on.
Verify Firmware Upgrade1. Select the Settings icon ( ) to open the Settings menu.
2. Select Utilities to open the Utilities submenu.
3. Select Version to open the Version display.
4. Verify the displayed firmware version number matches the version of the firmware upgrade package you installed.
Configure the InstrumentUpgrade Software License
149
PRISM MPS and MPD User Manual
Upgrade Software LicenseA software license upgrade allows you to add optional software features to your instrument. Go to www.telestream.net for the latest list of features that can be licensed
Install Software License UpgradeTo activate your licenses your instrument must be accessible by another computer on your local network. Your instrument does not need to access the internet.
To activate your licenses:
1. Connect your PRISM instrument to a local network and turn on power.
2. After the instrument has booted, find the IP address: select Settings, then Network, and finally select the STATUS tab.
3. Copy the IP address of the instrument under the CONTROL IP PORT heading.
4. Enter the IP address in a web browser.
5. Select License Portal and follow the instructions on the page.
For further assistance, contact our technical support team:www.telestream.net/telestream-support/video/support.htm.
Verify Software License Upgrade1. Select the Settings icon ( ) to open the Settings menu.
2. Select Utilities to open the Utilities submenu.
3. Select Options to open the Options display.
4. Verify that the displayed option(s) match the option(s) you installed.

Configure the InstrumentTroubleshooting
150
PRISM MPS and MPD User Manual
Troubleshooting
Create Diagnostics ReportYou can download a zip file containing a service report of instrument diagnostics using the Settings menu. If your instrument needs service, you may be asked to provide the diagnostics file to Telestream to aid in troubleshooting problems with the instrument.
1. Select the Settings icon ( ) to open the Settings menu.
2. Select Utilities to open the Utilities submenu.
3. Select Diagnostics to open the Diagnostics submenu.
4. Insert a USB device into one of the USB ports on the PRISM monitor.
5. Select Save Diagnostics to save the diagnostics report to the USB device.
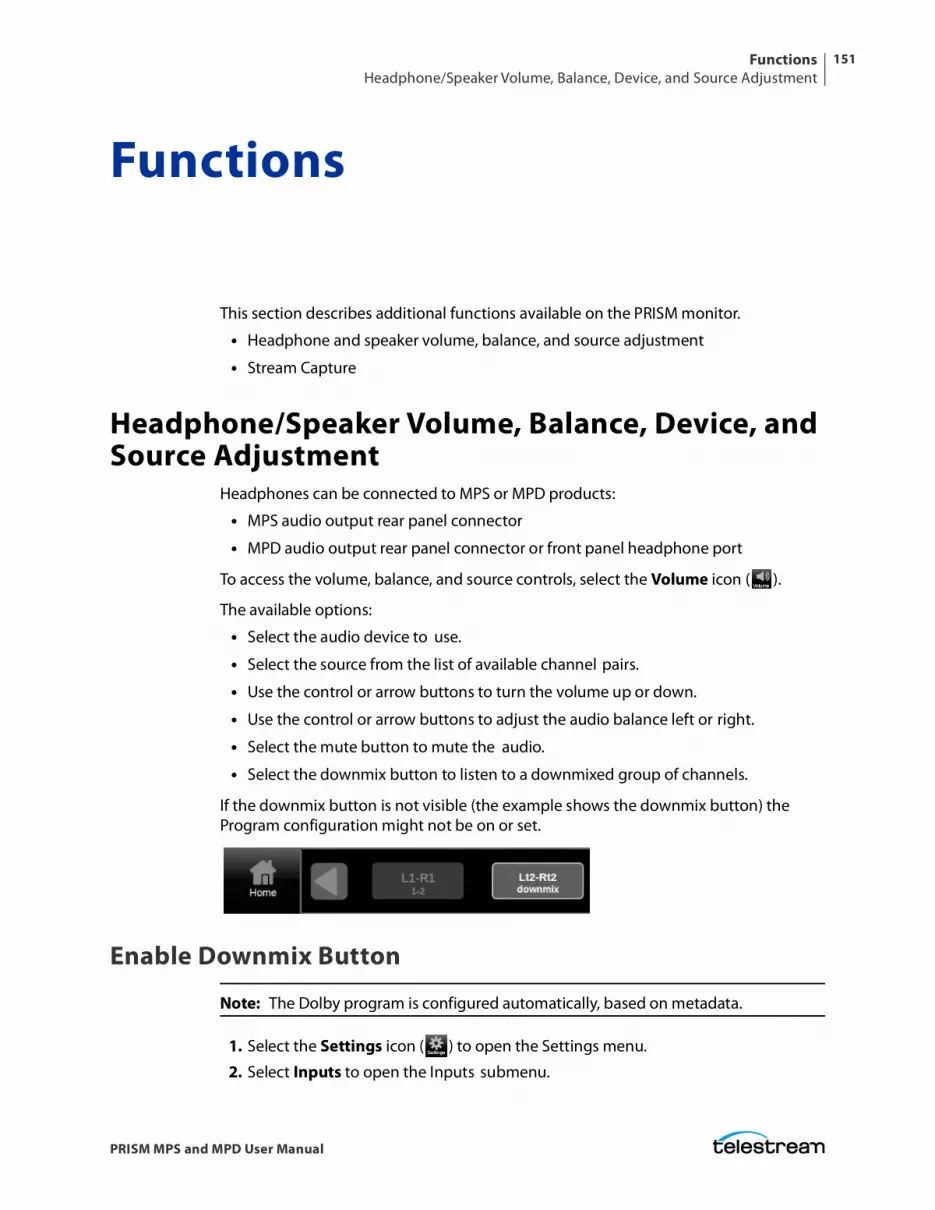
FunctionsHeadphone/Speaker Volume, Balance, Device, and Source Adjustment
151
PRISM MPS and MPD User Manual
Functions
This section describes additional functions available on the PRISM monitor.
• Headphone and speaker volume, balance, and source adjustment
• Stream Capture
Headphone/Speaker Volume, Balance, Device, and Source Adjustment
Headphones can be connected to MPS or MPD products:
• MPS audio output rear panel connector
• MPD audio output rear panel connector or front panel headphone port
To access the volume, balance, and source controls, select the Volume icon ( ).
The available options:
• Select the audio device to use.
• Select the source from the list of available channel pairs.
• Use the control or arrow buttons to turn the volume up or down.
• Use the control or arrow buttons to adjust the audio balance left or right.
• Select the mute button to mute the audio.
• Select the downmix button to listen to a downmixed group of channels.
If the downmix button is not visible (the example shows the downmix button) the Program configuration might not be on or set.
Enable Downmix Button
Note: The Dolby program is configured automatically, based on metadata.
1. Select the Settings icon ( ) to open the Settings menu.
2. Select Inputs to open the Inputs submenu.
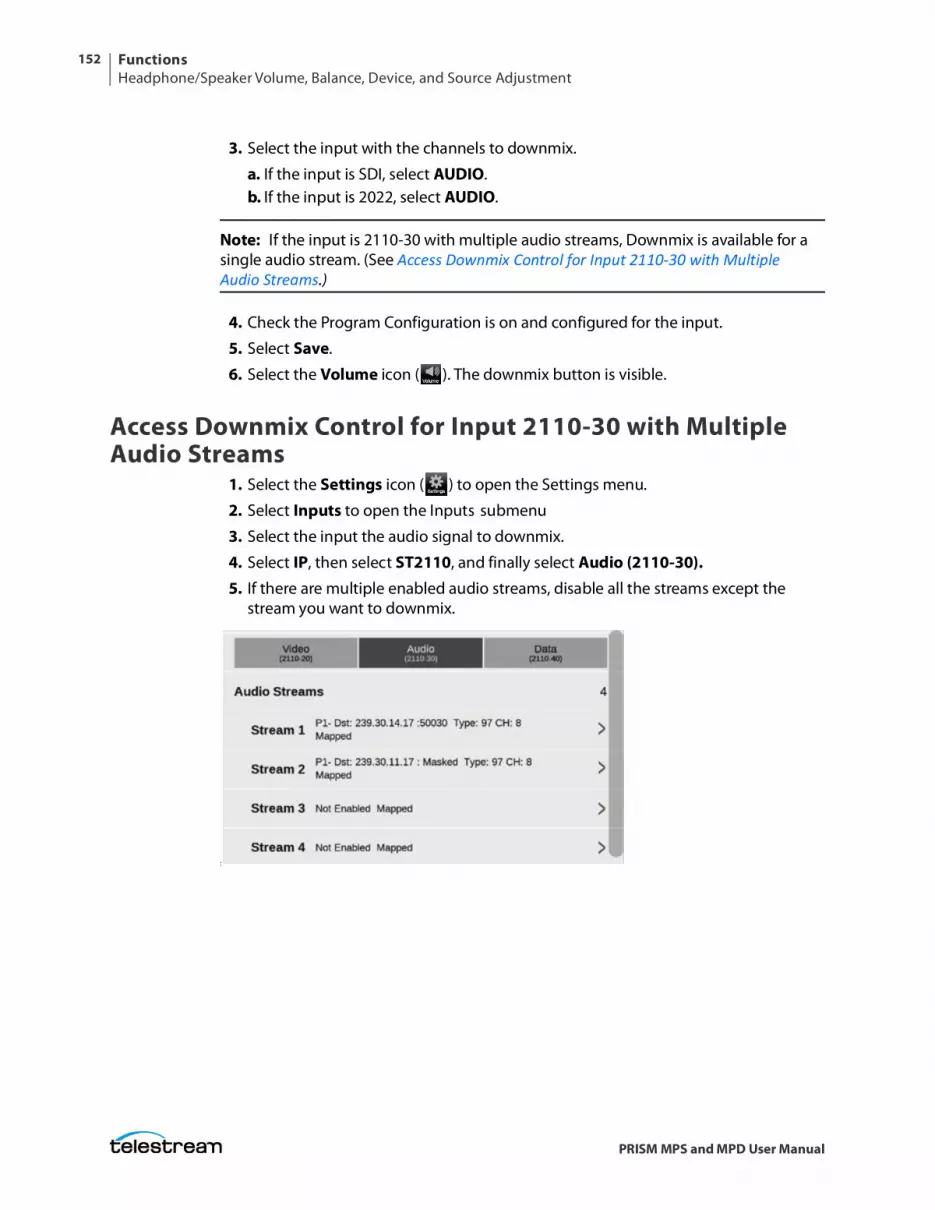
FunctionsHeadphone/Speaker Volume, Balance, Device, and Source Adjustment
152
PRISM MPS and MPD User Manual
3. Select the input with the channels to downmix.
a. If the input is SDI, select AUDIO.b. If the input is 2022, select AUDIO.
Note: If the input is 2110-30 with multiple audio streams, Downmix is available for a single audio stream. (See Access Downmix Control for Input 2110-30 with Multiple Audio Streams.)
4. Check the Program Configuration is on and configured for the input.
5. Select Save.
6. Select the Volume icon ( ). The downmix button is visible.
Access Downmix Control for Input 2110-30 with Multiple Audio Streams
1. Select the Settings icon ( ) to open the Settings menu.
2. Select Inputs to open the Inputs submenu
3. Select the input the audio signal to downmix.
4. Select IP, then select ST2110, and finally select Audio (2110-30).5. If there are multiple enabled audio streams, disable all the streams except the
stream you want to downmix.
:
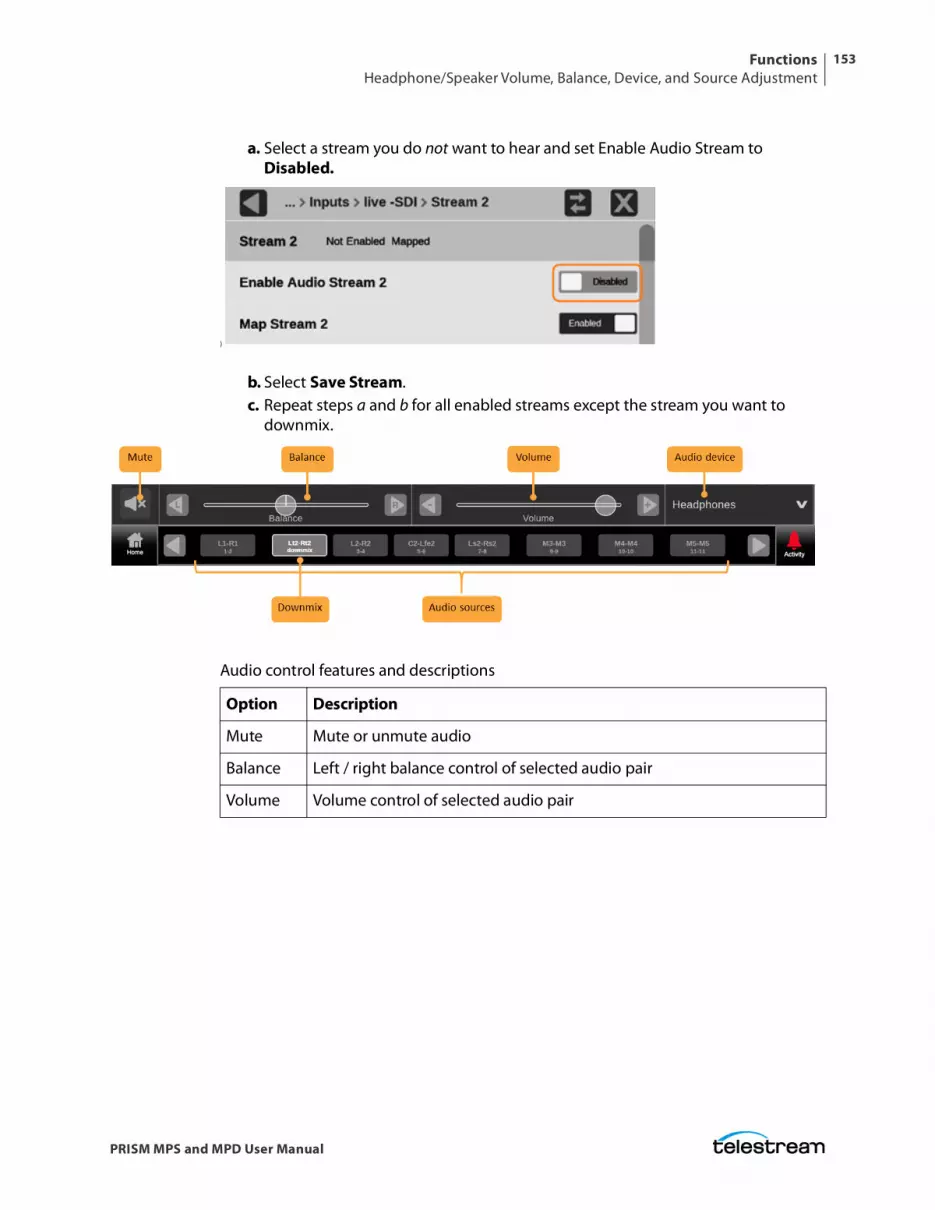
FunctionsHeadphone/Speaker Volume, Balance, Device, and Source Adjustment
153
PRISM MPS and MPD User Manual
a. Select a stream you do not want to hear and set Enable Audio Stream to Disabled.
)
b. Select Save Stream.c. Repeat steps a and b for all enabled streams except the stream you want to
downmix.
Audio control features and descriptions
Option Description
Mute Mute or unmute audio
Balance Left / right balance control of selected audio pair
Volume Volume control of selected audio pair
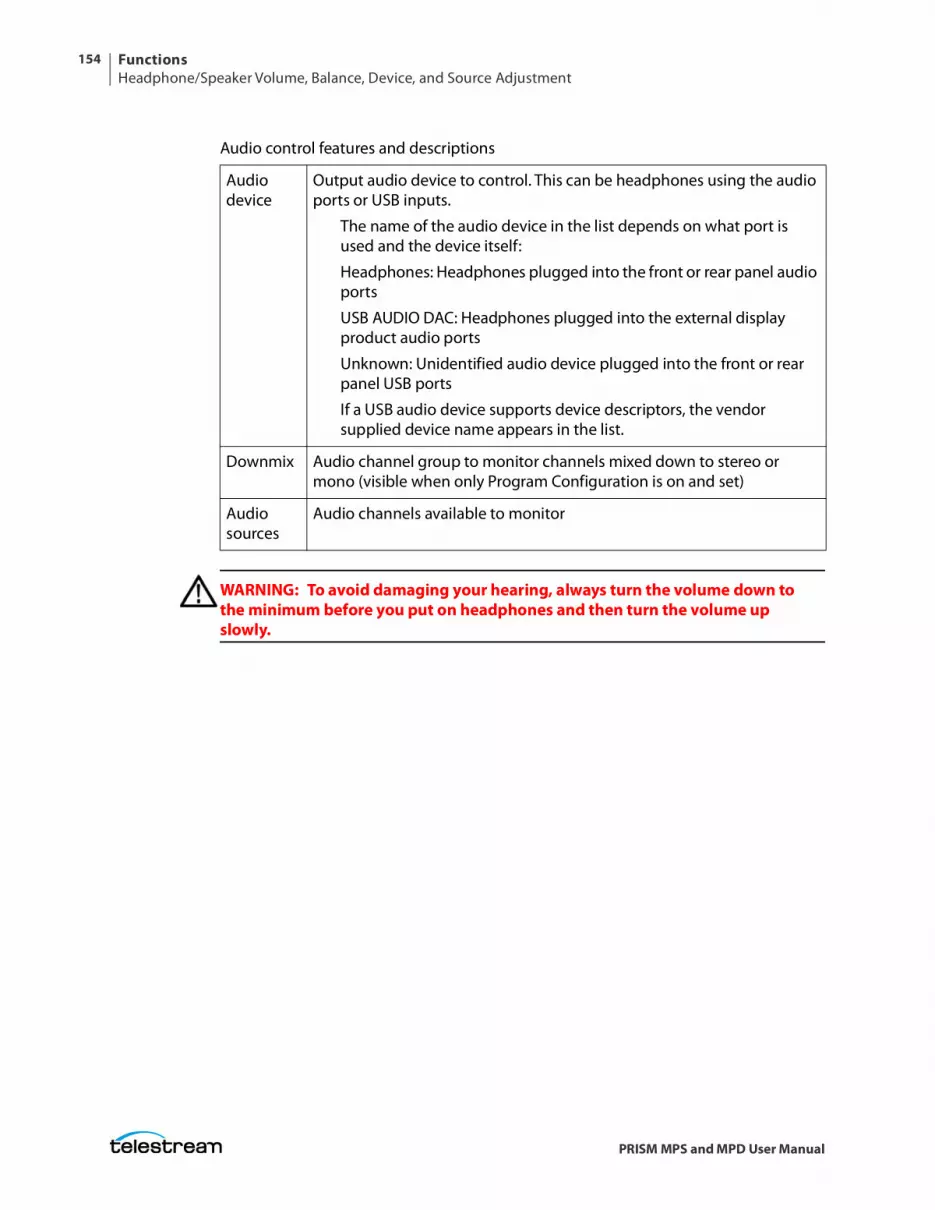
FunctionsHeadphone/Speaker Volume, Balance, Device, and Source Adjustment
154
PRISM MPS and MPD User Manual
WARNING: To avoid damaging your hearing, always turn the volume down to the minimum before you put on headphones and then turn the volume up slowly.
Audio device
Output audio device to control. This can be headphones using the audio ports or USB inputs.
The name of the audio device in the list depends on what port is used and the device itself:
Headphones: Headphones plugged into the front or rear panel audio ports
USB AUDIO DAC: Headphones plugged into the external display product audio ports
Unknown: Unidentified audio device plugged into the front or rear panel USB ports
If a USB audio device supports device descriptors, the vendor supplied device name appears in the list.
Downmix Audio channel group to monitor channels mixed down to stereo or mono (visible when only Program Configuration is on and set)
Audio sources
Audio channels available to monitor
Audio control features and descriptions
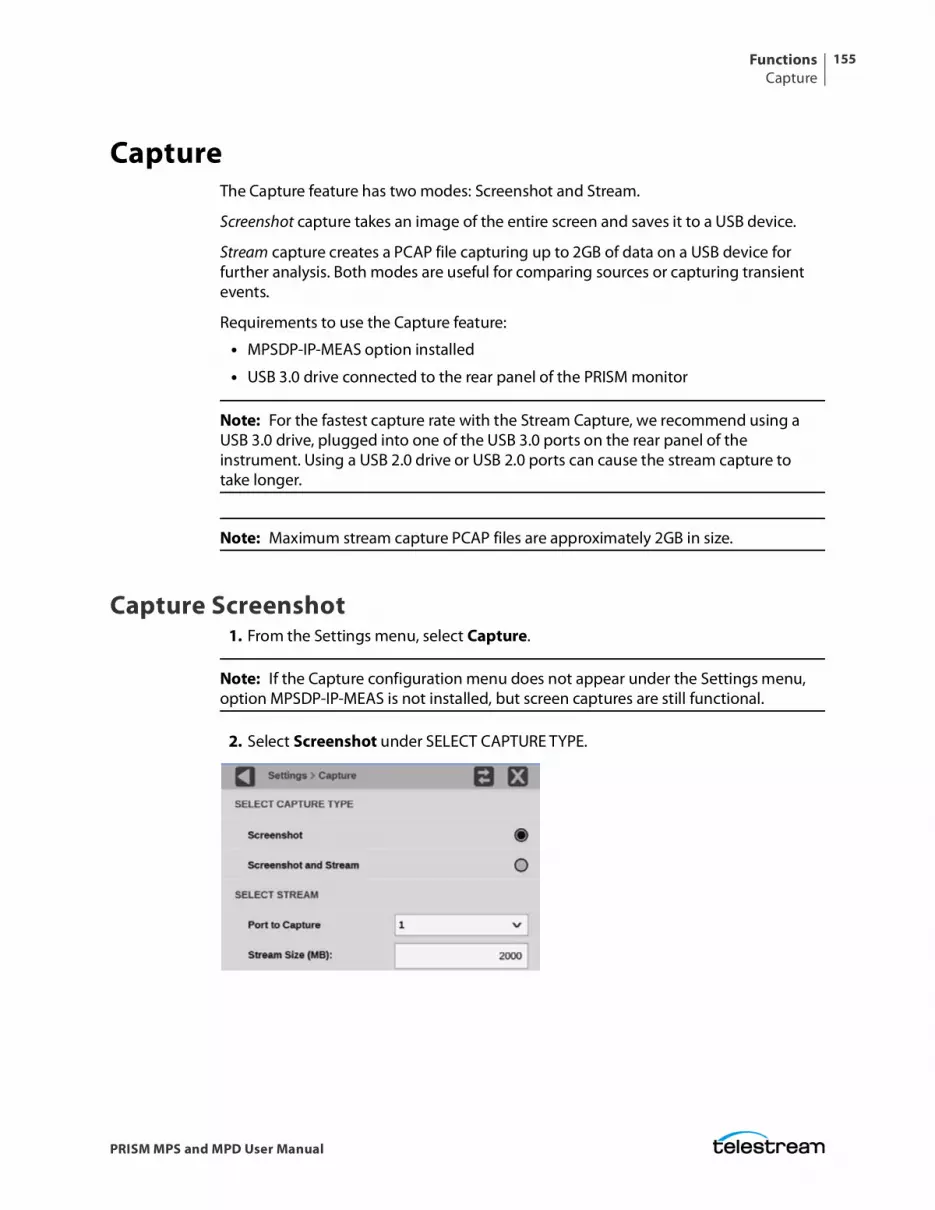
FunctionsCapture
155
PRISM MPS and MPD User Manual
CaptureThe Capture feature has two modes: Screenshot and Stream.
Screenshot capture takes an image of the entire screen and saves it to a USB device.
Stream capture creates a PCAP file capturing up to 2GB of data on a USB device for further analysis. Both modes are useful for comparing sources or capturing transient events.
Requirements to use the Capture feature:
• MPSDP-IP-MEAS option installed
• USB 3.0 drive connected to the rear panel of the PRISM monitor
Note: For the fastest capture rate with the Stream Capture, we recommend using a USB 3.0 drive, plugged into one of the USB 3.0 ports on the rear panel of the instrument. Using a USB 2.0 drive or USB 2.0 ports can cause the stream capture to take longer.
Note: Maximum stream capture PCAP files are approximately 2GB in size.
Capture Screenshot1. From the Settings menu, select Capture.
Note: If the Capture configuration menu does not appear under the Settings menu, option MPSDP-IP-MEAS is not installed, but screen captures are still functional.
2. Select Screenshot under SELECT CAPTURE TYPE.
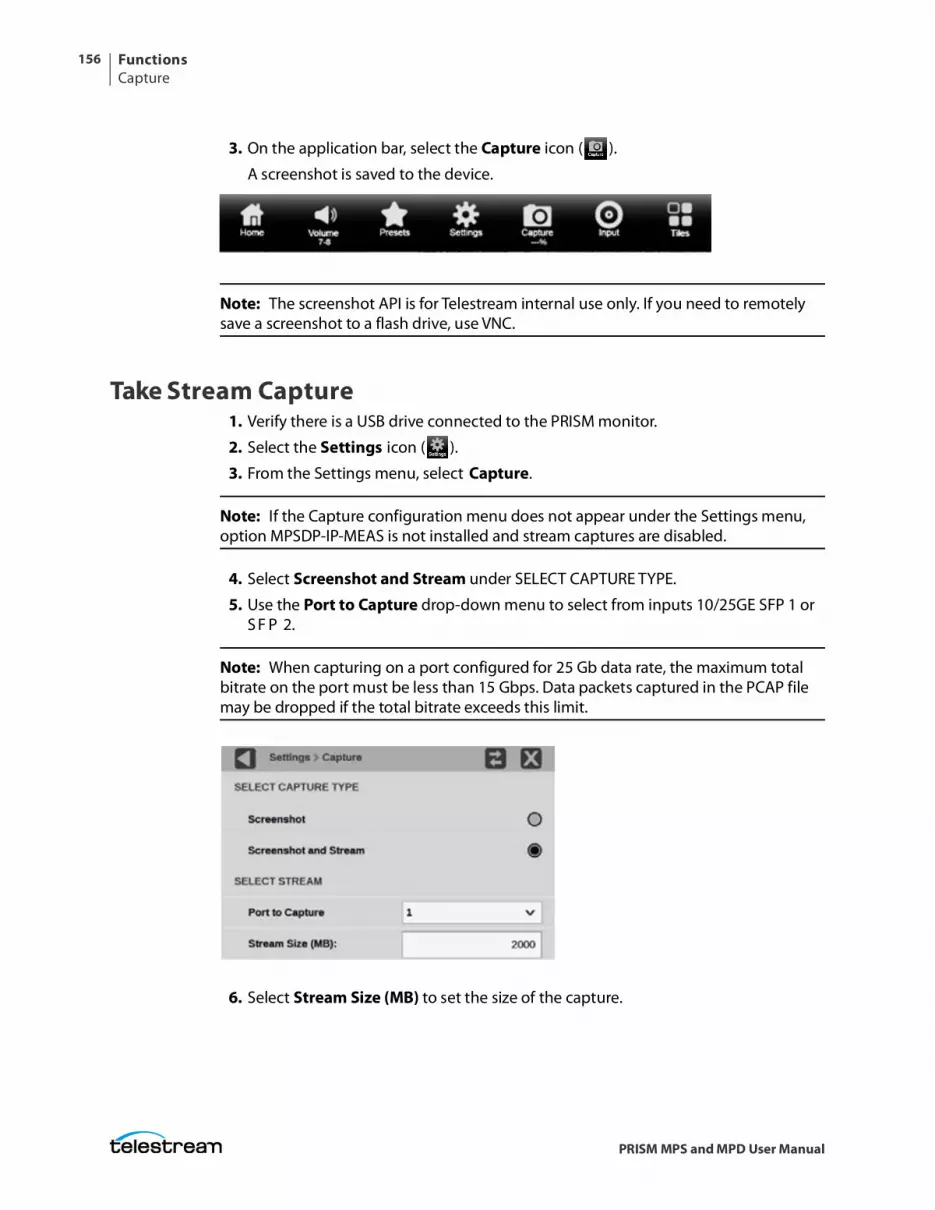
FunctionsCapture
156
PRISM MPS and MPD User Manual
3. On the application bar, select the Capture icon ( ).
A screenshot is saved to the device.
Note: The screenshot API is for Telestream internal use only. If you need to remotely save a screenshot to a flash drive, use VNC.
Take Stream Capture1. Verify there is a USB drive connected to the PRISM monitor.
2. Select the Settings icon ( ).
3. From the Settings menu, select Capture.
Note: If the Capture configuration menu does not appear under the Settings menu, option MPSDP-IP-MEAS is not installed and stream captures are disabled.
4. Select Screenshot and Stream under SELECT CAPTURE TYPE.
5. Use the Port to Capture drop-down menu to select from inputs 10/25GE SFP 1 or S F P 2.
Note: When capturing on a port configured for 25 Gb data rate, the maximum total bitrate on the port must be less than 15 Gbps. Data packets captured in the PCAP file may be dropped if the total bitrate exceeds this limit.
6. Select Stream Size (MB) to set the size of the capture.
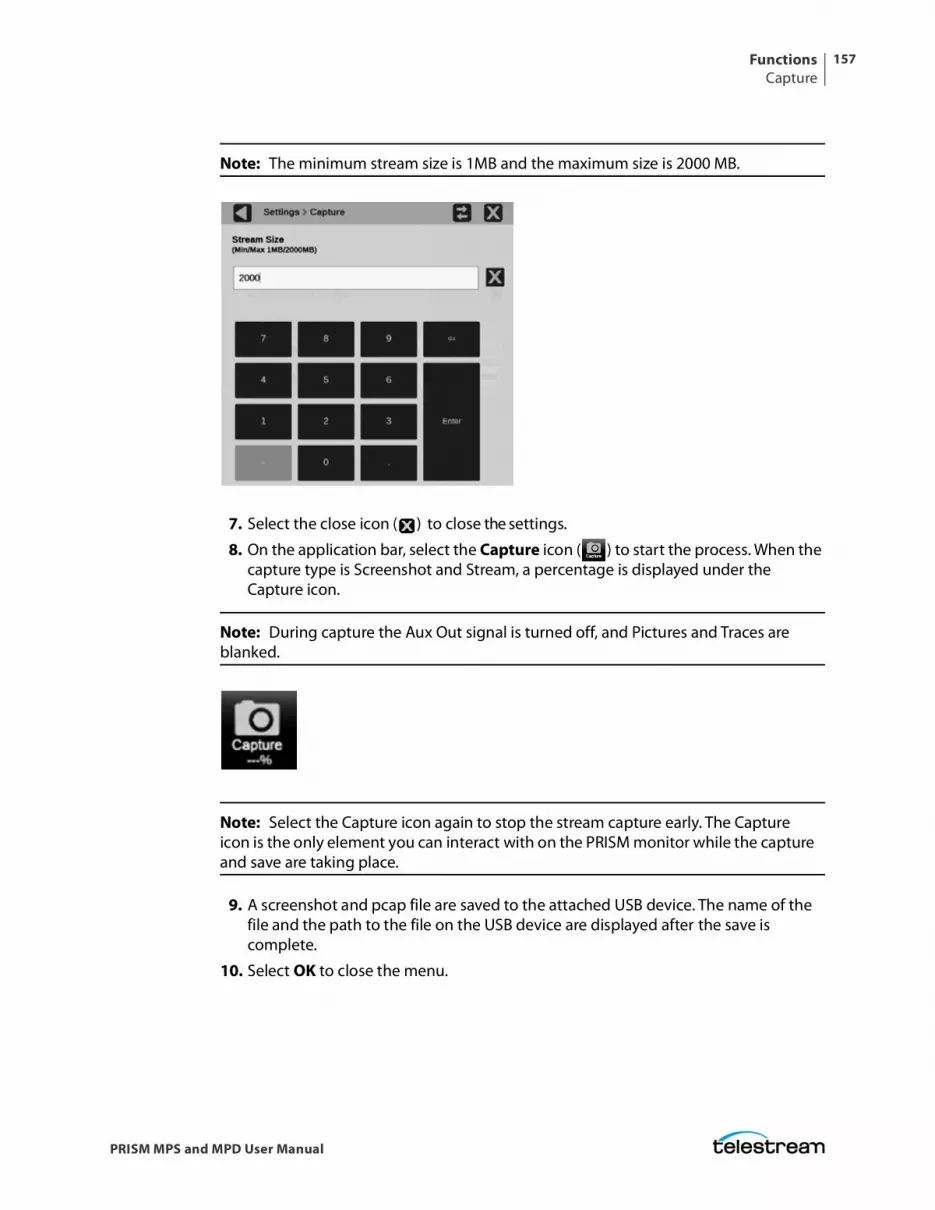
FunctionsCapture
157
PRISM MPS and MPD User Manual
Note: The minimum stream size is 1MB and the maximum size is 2000 MB.
7. Select the close icon ( ) to close the settings.
8. On the application bar, select the Capture icon ( ) to start the process. When the capture type is Screenshot and Stream, a percentage is displayed under the Capture icon.
Note: During capture the Aux Out signal is turned off, and Pictures and Traces are blanked.
Note: Select the Capture icon again to stop the stream capture early. The Capture icon is the only element you can interact with on the PRISM monitor while the capture and save are taking place.
9. A screenshot and pcap file are saved to the attached USB device. The name of the file and the path to the file on the USB device are displayed after the save is complete.
10. Select OK to close the menu.
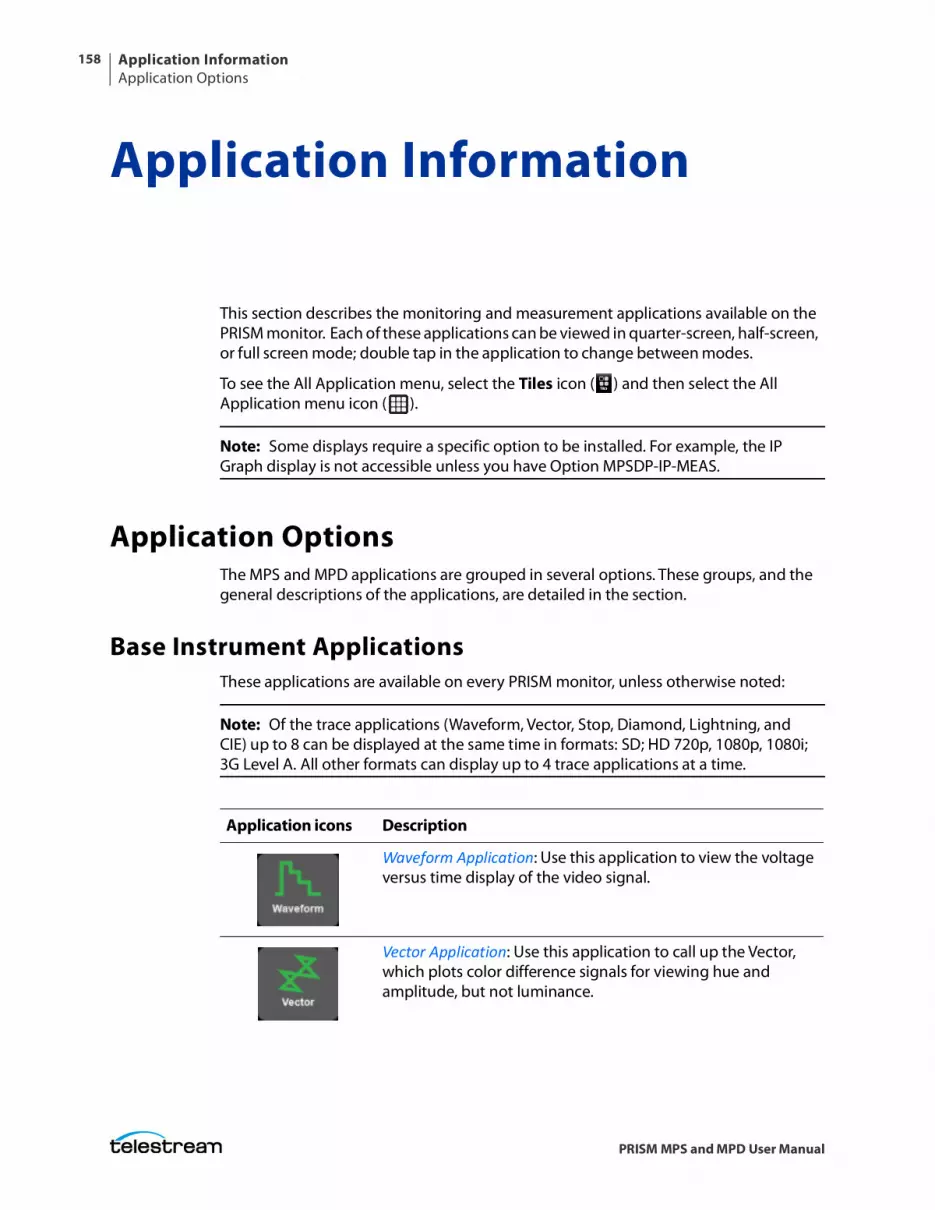
Application InformationApplication Options
158
PRISM MPS and MPD User Manual
Application Information
This section describes the monitoring and measurement applications available on the PRISM monitor. Each of these applications can be viewed in quarter-screen, half-screen, or full screen mode; double tap in the application to change between modes.
To see the All Application menu, select the Tiles icon ( ) and then select the All Application menu icon ( ).
Note: Some displays require a specific option to be installed. For example, the IP Graph display is not accessible unless you have Option MPSDP-IP-MEAS.
Application OptionsThe MPS and MPD applications are grouped in several options. These groups, and the general descriptions of the applications, are detailed in the section.
Base Instrument ApplicationsThese applications are available on every PRISM monitor, unless otherwise noted:
Note: Of the trace applications (Waveform, Vector, Stop, Diamond, Lightning, and CIE) up to 8 can be displayed at the same time in formats: SD; HD 720p, 1080p, 1080i; 3G Level A. All other formats can display up to 4 trace applications at a time.
Application icons Description
Waveform Application: Use this application to view the voltage versus time display of the video signal.
Vector Application: Use this application to call up the Vector, which plots color difference signals for viewing hue and amplitude, but not luminance.
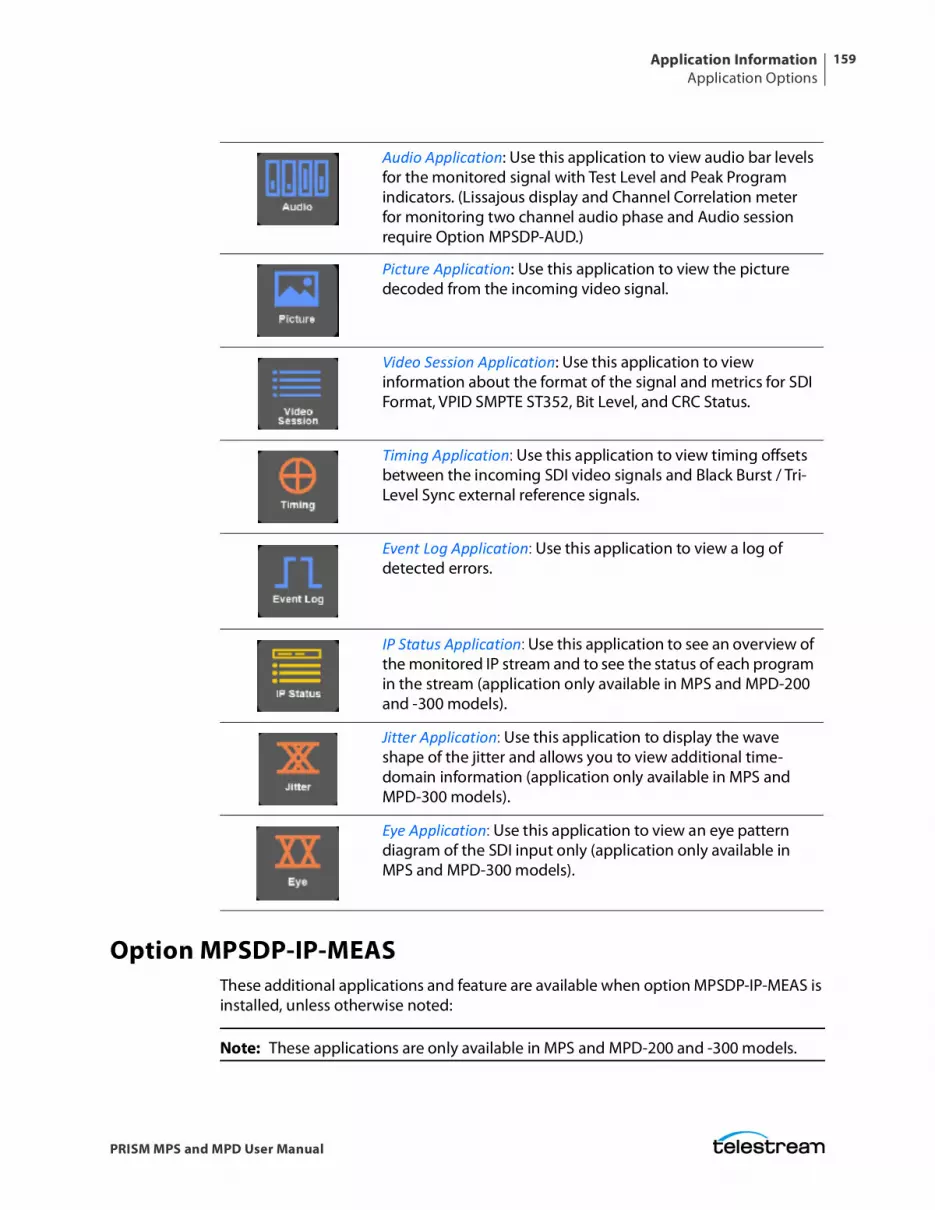
Application InformationApplication Options
159
PRISM MPS and MPD User Manual
Option MPSDP-IP-MEASThese additional applications and feature are available when option MPSDP-IP-MEAS is installed, unless otherwise noted:
Note: These applications are only available in MPS and MPD-200 and -300 models.
Audio Application: Use this application to view audio bar levels for the monitored signal with Test Level and Peak Program indicators. (Lissajous display and Channel Correlation meter for monitoring two channel audio phase and Audio session require Option MPSDP-AUD.)
Picture Application: Use this application to view the picture decoded from the incoming video signal.
Video Session Application: Use this application to view information about the format of the signal and metrics for SDI Format, VPID SMPTE ST352, Bit Level, and CRC Status.
Timing Application: Use this application to view timing offsets between the incoming SDI video signals and Black Burst / Tri-Level Sync external reference signals.
Event Log Application: Use this application to view a log of detected errors.
IP Status Application: Use this application to see an overview of the monitored IP stream and to see the status of each program in the stream (application only available in MPS and MPD-200 and -300 models).
Jitter Application: Use this application to display the wave shape of the jitter and allows you to view additional time-domain information (application only available in MPS and MPD-300 models).
Eye Application: Use this application to view an eye pattern diagram of the SDI input only (application only available in MPS and MPD-300 models).

Application InformationApplication Options
160
PRISM MPS and MPD User Manual
IP Stream Capture: This feature allows the capture IP streams to a PCAP file. The maximum capture size is 2 GB, which allows for the capture of 10 seconds of HD video.
Application icons Description
IP Session Application: Use this application to view various performance parameters of the IP stream including Layer 2, video and PTP parameters.
IP Graphs Application: Use this application to view trend graphs of various performance parameters of the IP stream including total bit rate, session bit rate, PIT, RTP sequence errors, video CRC errors, and TS-DF.
PIT Histogram Application: Use this application to view a histogram of the PIT (Packet Interval Time) to monitor network delay variation statistics.
PTP Graphs Application: Use this application to view trend graphs of various performance parameters of the PTP signal include Master-to-Slave and Slave-to-Master delays and variances.
Timing Application (for IP signals): Adds features to the standard Timing application including to view timing offsets between the incoming 2022-6 and 2110-20 video signals and PTP signals.
Stream Timing Application: Use this application to view the timing of the ST2110 video, audio, and data as it was received relative to the embedded RTP time stamps.
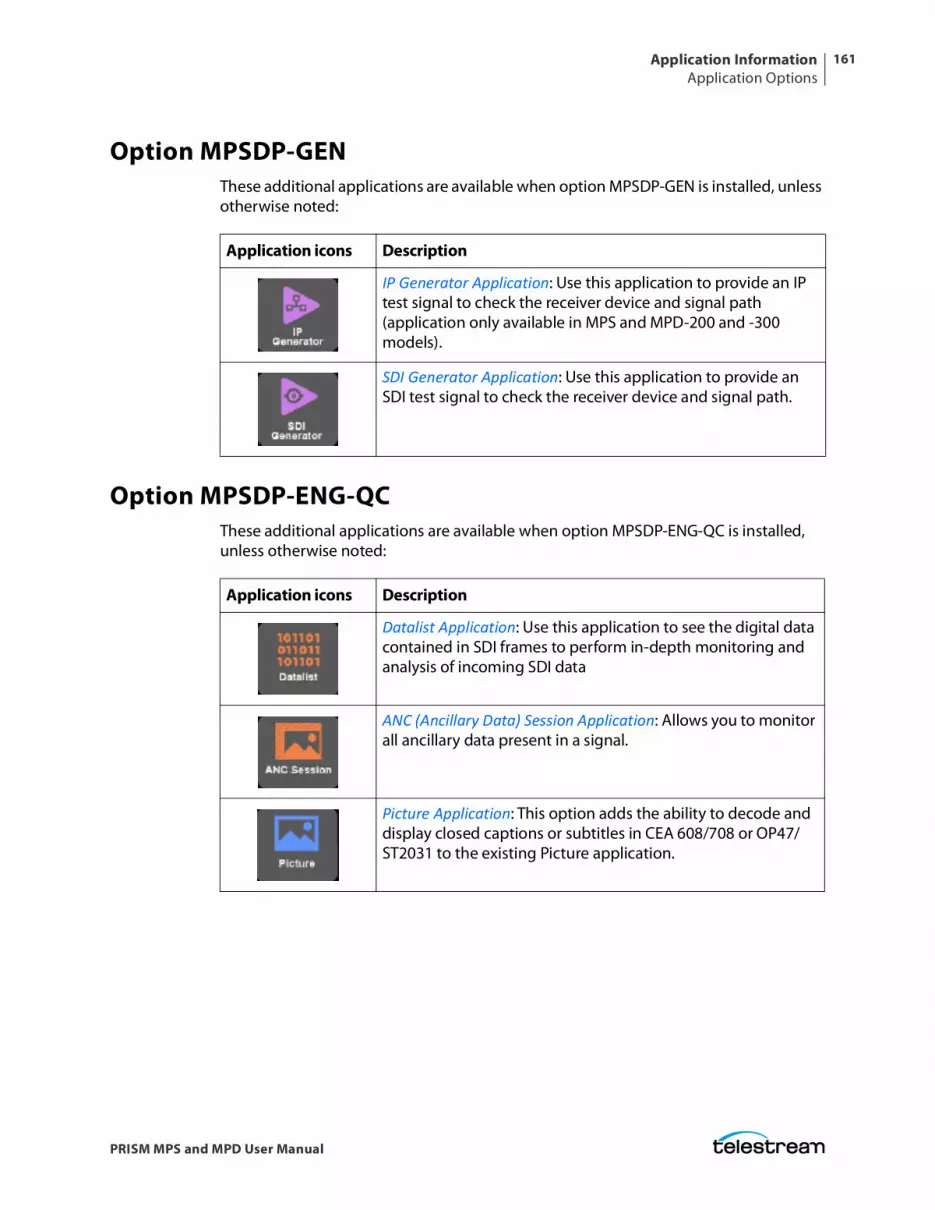
Application InformationApplication Options
161
PRISM MPS and MPD User Manual
Option MPSDP-GENThese additional applications are available when option MPSDP-GEN is installed, unless otherwise noted:
Option MPSDP-ENG-QCThese additional applications are available when option MPSDP-ENG-QC is installed, unless otherwise noted:
Application icons Description
IP Generator Application: Use this application to provide an IP test signal to check the receiver device and signal path (application only available in MPS and MPD-200 and -300 models).
SDI Generator Application: Use this application to provide an SDI test signal to check the receiver device and signal path.
Application icons Description
Datalist Application: Use this application to see the digital data contained in SDI frames to perform in-depth monitoring and analysis of incoming SDI data
ANC (Ancillary Data) Session Application: Allows you to monitor all ancillary data present in a signal.
Picture Application: This option adds the ability to decode and display closed captions or subtitles in CEA 608/708 or OP47/ST2031 to the existing Picture application.
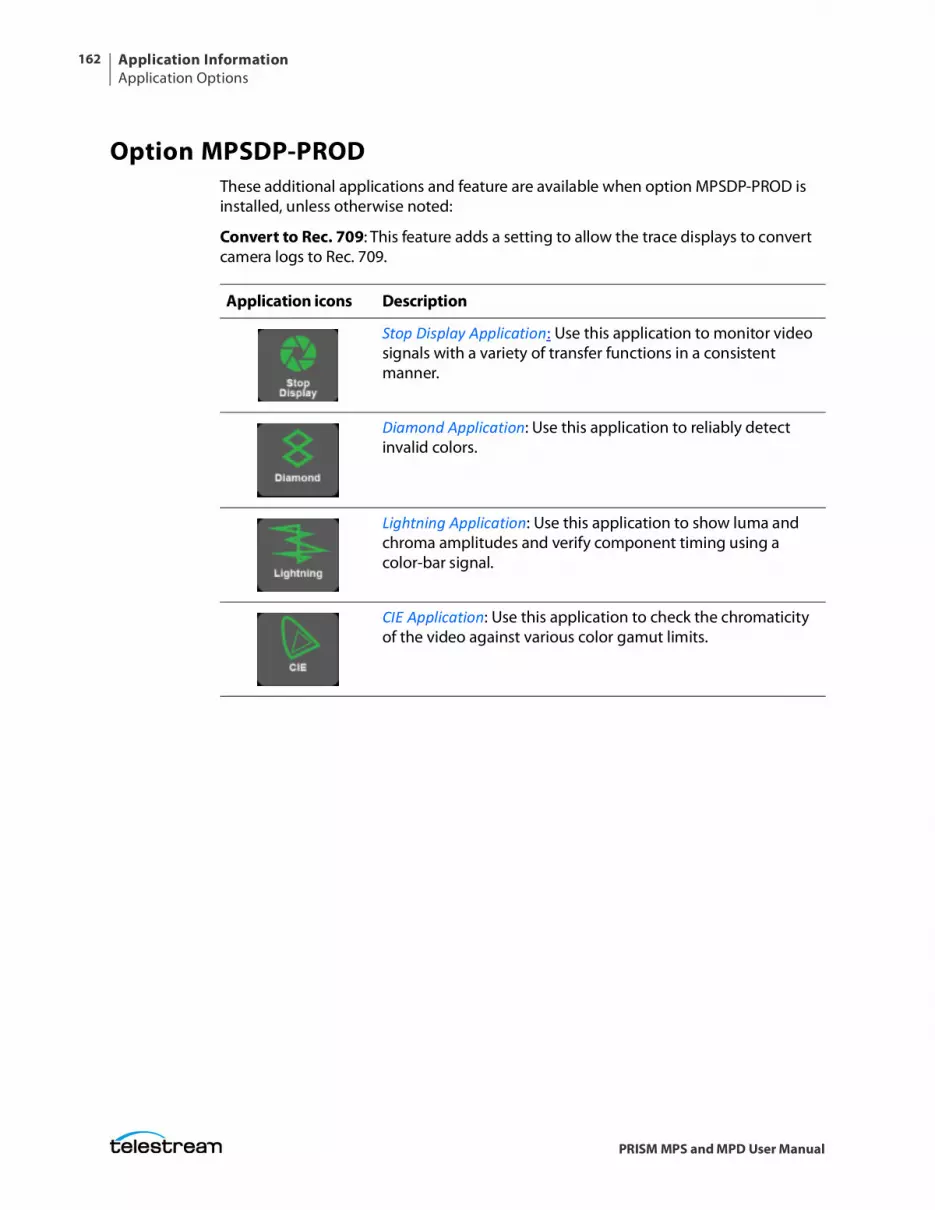
Application InformationApplication Options
162
PRISM MPS and MPD User Manual
Option MPSDP-PRODThese additional applications and feature are available when option MPSDP-PROD is installed, unless otherwise noted:
Convert to Rec. 709: This feature adds a setting to allow the trace displays to convert camera logs to Rec. 709.
Application icons Description
Stop Display Application: Use this application to monitor video signals with a variety of transfer functions in a consistent manner.
Diamond Application: Use this application to reliably detect invalid colors.
Lightning Application: Use this application to show luma and chroma amplitudes and verify component timing using a color-bar signal.
CIE Application: Use this application to check the chromaticity of the video against various color gamut limits.
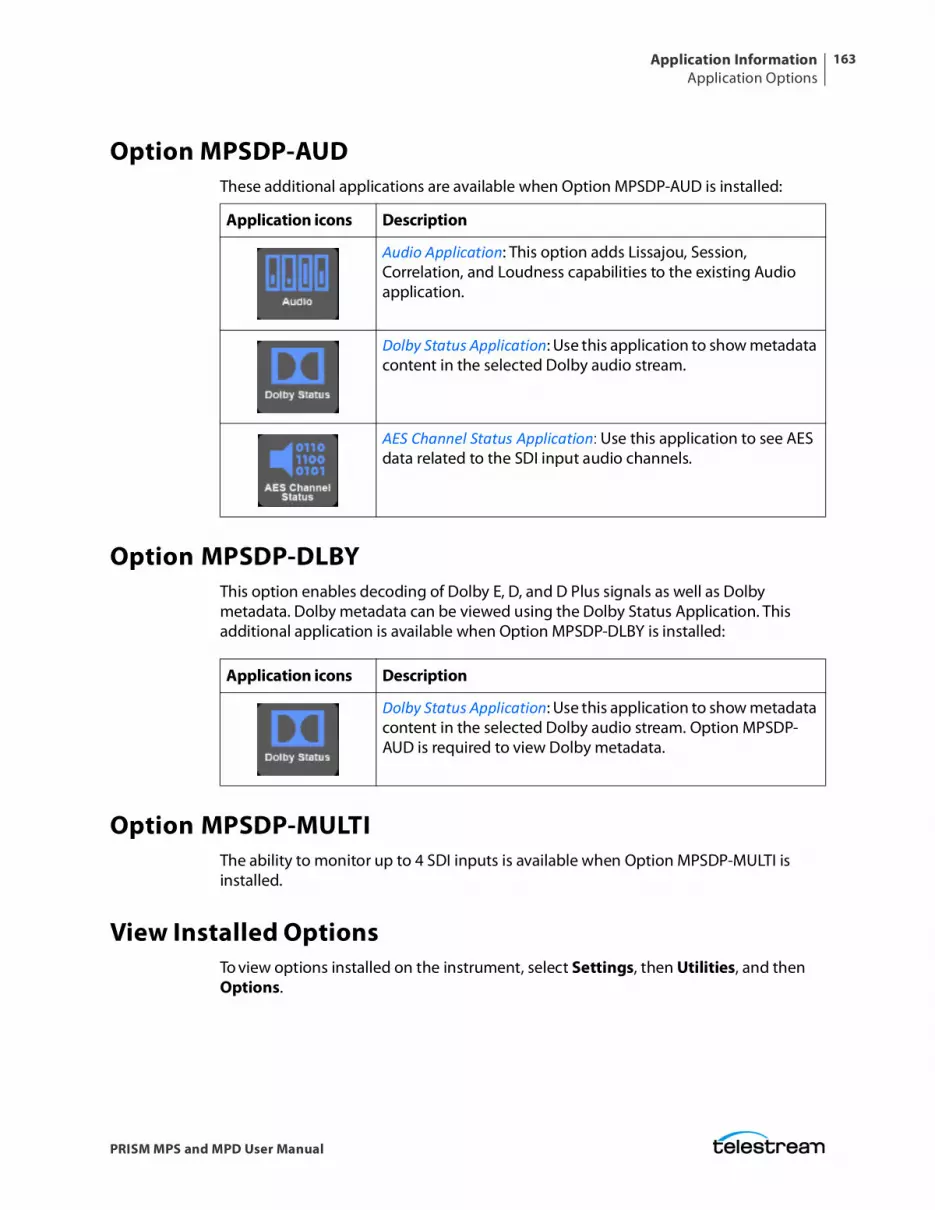
Application InformationApplication Options
163
PRISM MPS and MPD User Manual
Option MPSDP-AUDThese additional applications are available when Option MPSDP-AUD is installed:
Option MPSDP-DLBYThis option enables decoding of Dolby E, D, and D Plus signals as well as Dolby metadata. Dolby metadata can be viewed using the Dolby Status Application. This additional application is available when Option MPSDP-DLBY is installed:
Option MPSDP-MULTIThe ability to monitor up to 4 SDI inputs is available when Option MPSDP-MULTI is installed.
View Installed OptionsTo view options installed on the instrument, select Settings, then Utilities, and then Options.
Application icons Description
Audio Application: This option adds Lissajou, Session, Correlation, and Loudness capabilities to the existing Audio application.
Dolby Status Application: Use this application to show metadata content in the selected Dolby audio stream.
AES Channel Status Application: Use this application to see AES data related to the SDI input audio channels.
Application icons Description
Dolby Status Application: Use this application to show metadata content in the selected Dolby audio stream. Option MPSDP-AUD is required to view Dolby metadata.
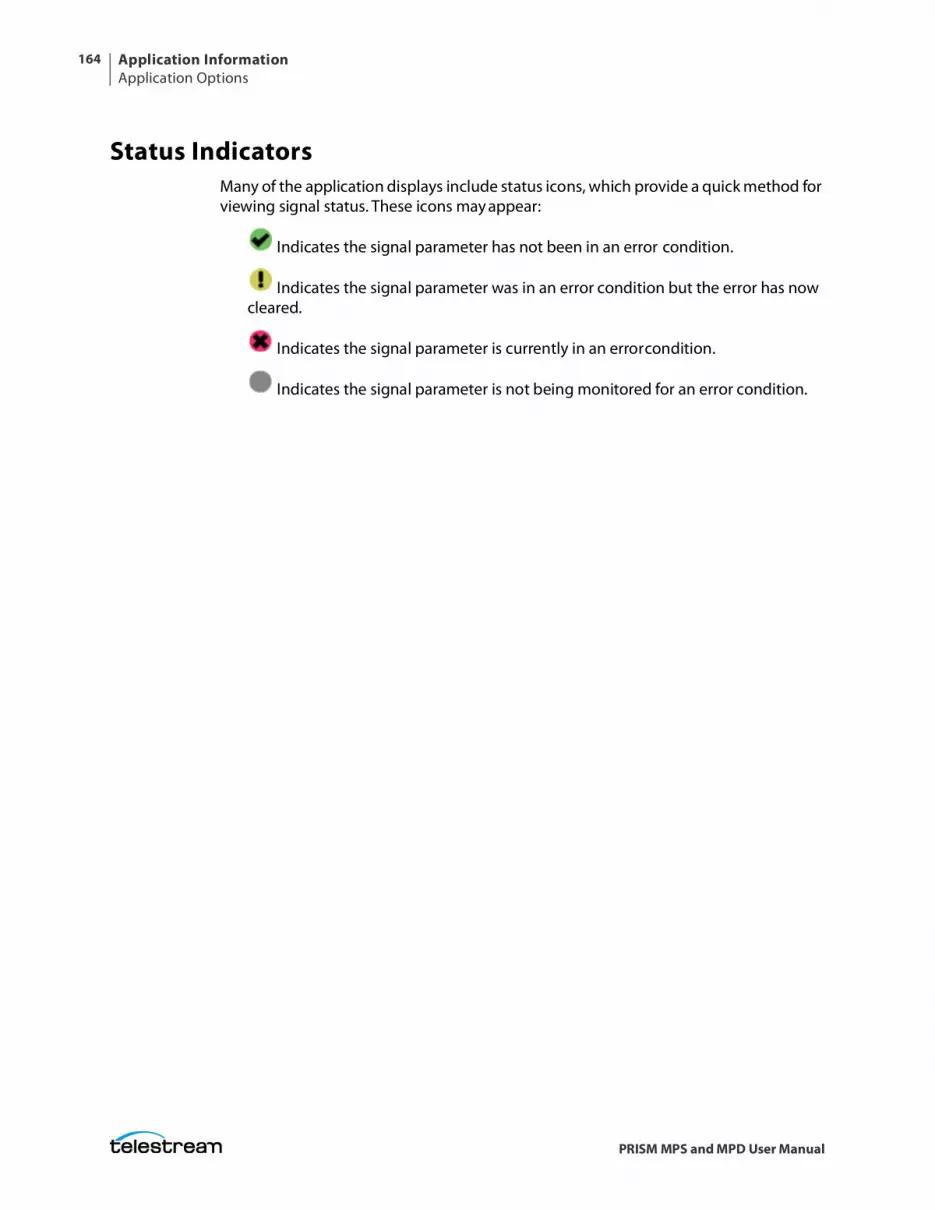
Application InformationApplication Options
164
PRISM MPS and MPD User Manual
Status IndicatorsMany of the application displays include status icons, which provide a quick method for viewing signal status. These icons may appear:
Indicates the signal parameter has not been in an error condition.
Indicates the signal parameter was in an error condition but the error has now cleared.
Indicates the signal parameter is currently in an error condition.
Indicates the signal parameter is not being monitored for an error condition.
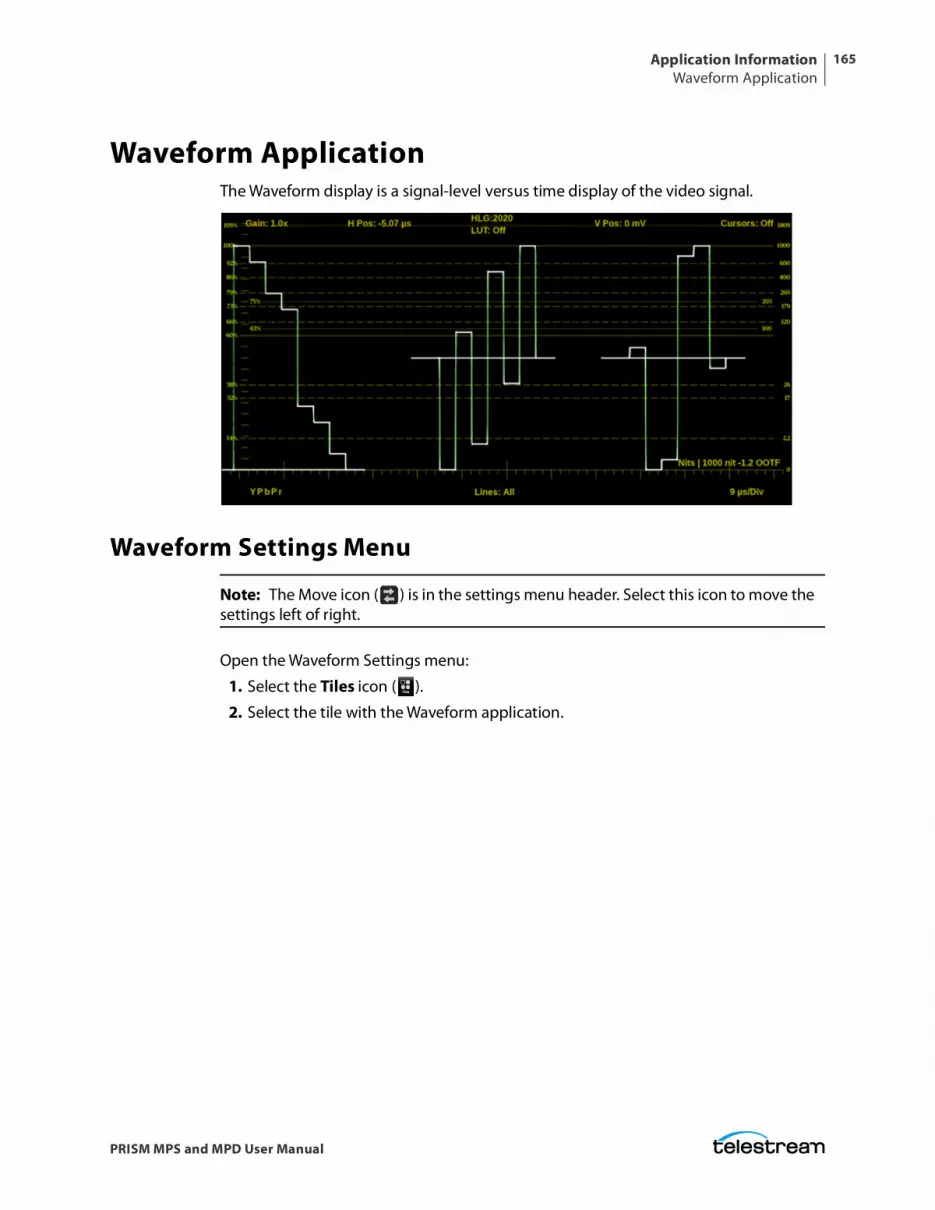
Application InformationWaveform Application
165
PRISM MPS and MPD User Manual
Waveform ApplicationThe Waveform display is a signal-level versus time display of the video signal.
Waveform Settings Menu
Note: The Move icon ( ) is in the settings menu header. Select this icon to move the settings left of right.
Open the Waveform Settings menu:
1. Select the Tiles icon ( ).
2. Select the tile with the Waveform application.
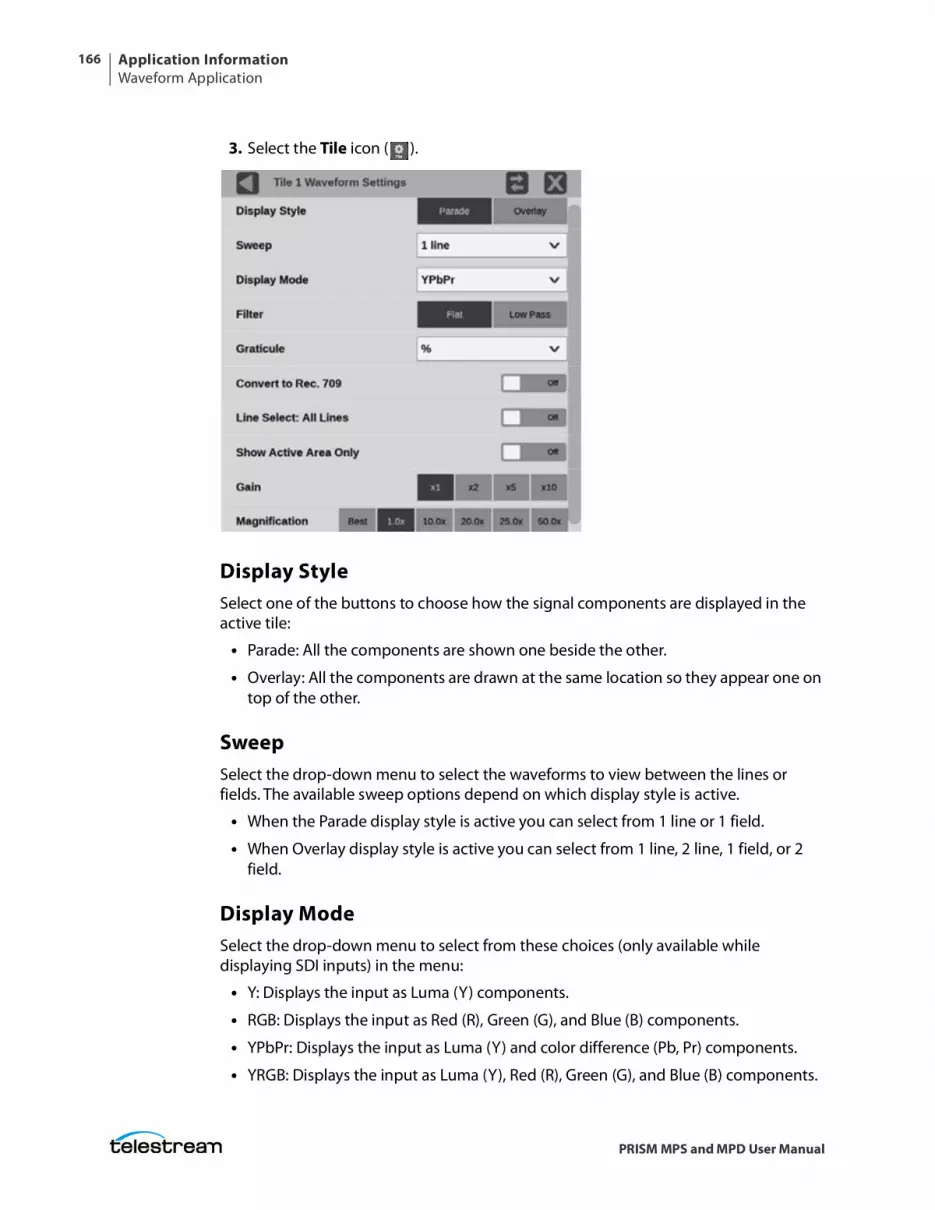
Application InformationWaveform Application
166
PRISM MPS and MPD User Manual
3. Select the Tile icon ( ).
Display StyleSelect one of the buttons to choose how the signal components are displayed in the active tile:
• Parade: All the components are shown one beside the other.
• Overlay: All the components are drawn at the same location so they appear one on top of the other.
SweepSelect the drop-down menu to select the waveforms to view between the lines or fields. The available sweep options depend on which display style is active.
• When the Parade display style is active you can select from 1 line or 1 field.
• When Overlay display style is active you can select from 1 line, 2 line, 1 field, or 2 field.
Display ModeSelect the drop-down menu to select from these choices (only available while displaying SDI inputs) in the menu:
• Y: Displays the input as Luma (Y) components.
• RGB: Displays the input as Red (R), Green (G), and Blue (B) components.
• YPbPr: Displays the input as Luma (Y) and color difference (Pb, Pr) components.
• YRGB: Displays the input as Luma (Y), Red (R), Green (G), and Blue (B) components.
Application InformationWaveform Application
167
PRISM MPS and MPD User Manual
FilterSelect one of the buttons to set the waveform filter. This is useful for isolating a specific characteristic of the input. For example, you may enable a Low Pass filter for quick camera exposure setting.
These filters are available:
• Flat: Display with the full available bandwidth.
• Low Pass: Display only the low frequency part of the signal.
GraticuleSelect the drop-down menu to choose a vertical scale value.
Note: The Code Value vertical unit is a hex value. The Stop, Reflectance, and Nits scale are drawn differently depending on the gamma setting in the input menu.
Convert to Rec. 709Move this control to On to allow the trace displays to convert the Gamma and Color Gamut settings for the signal to SDR Narrow and BT. 709 (requires Option MPSDP-PROD).
Note: Conversion to Rec. 709 automatically converts to BT.709, otherwise the graticule selection must be manually changed. (See Configure Instrument for HDR/WCG Monitoring.) Conversion to Rec. 709 mode is not supported for SD signals.
Line SelectMove the control to On to select 1 Line or Off to select All Lines.
If Line Select is set to On (Line Select: Line 1), the display only shows results for the selected line in the picture. The line can be selected using the on-screen tools; see Line Select Function. Or the line can be selected directly on the Picture.
Show Active Area OnlyTurn this on to remove the trace of vertical / horizontal blanking data.
GainSelect from the options to set to x1, x2, x5, or x10.
MagnificationSelect from the options to set to the magnification to Best View, x1, x10, x20, x25, or x50.
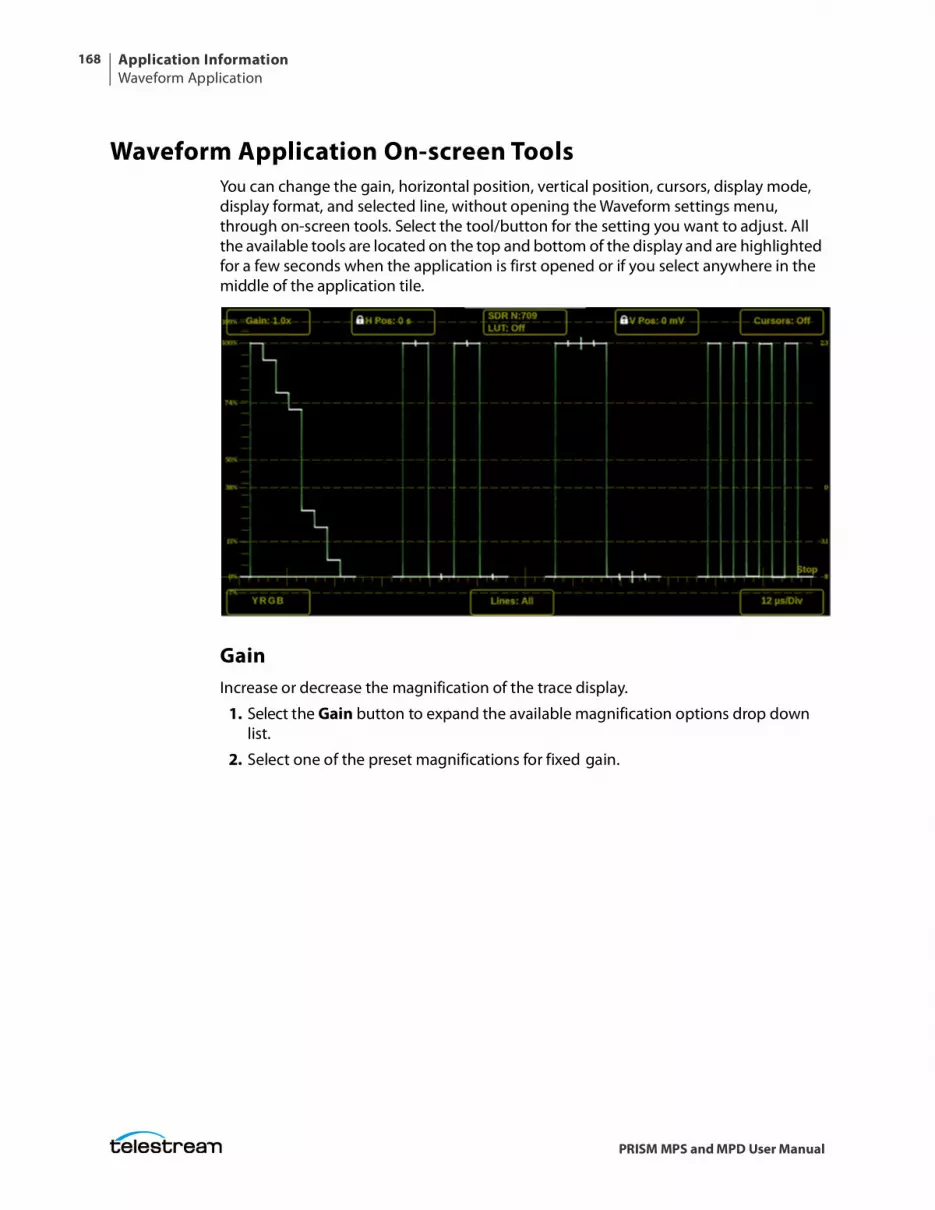
Application InformationWaveform Application
168
PRISM MPS and MPD User Manual
Waveform Application On-screen ToolsYou can change the gain, horizontal position, vertical position, cursors, display mode, display format, and selected line, without opening the Waveform settings menu, through on-screen tools. Select the tool/button for the setting you want to adjust. All the available tools are located on the top and bottom of the display and are highlighted for a few seconds when the application is first opened or if you select anywhere in the middle of the application tile.
GainIncrease or decrease the magnification of the trace display.
1. Select the Gain button to expand the available magnification options drop down list.
2. Select one of the preset magnifications for fixed gain.
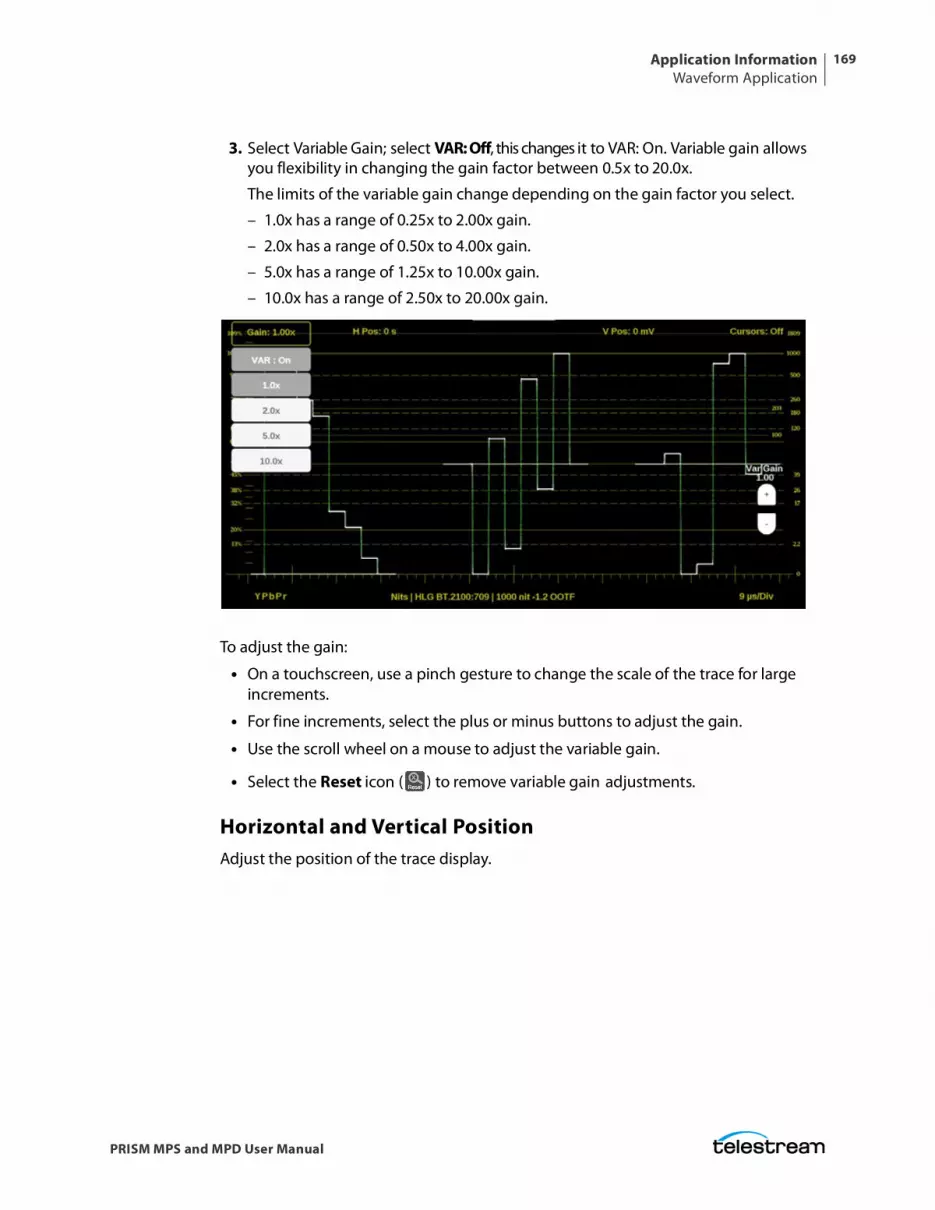
Application InformationWaveform Application
169
PRISM MPS and MPD User Manual
3. Select Variable Gain; select VAR: Off, this changes it to VAR: On. Variable gain allows you flexibility in changing the gain factor between 0.5x to 20.0x.
The limits of the variable gain change depending on the gain factor you select.
– 1.0x has a range of 0.25x to 2.00x gain.
– 2.0x has a range of 0.50x to 4.00x gain.
– 5.0x has a range of 1.25x to 10.00x gain.
– 10.0x has a range of 2.50x to 20.00x gain.
To adjust the gain:
• On a touchscreen, use a pinch gesture to change the scale of the trace for large increments.
• For fine increments, select the plus or minus buttons to adjust the gain.
• Use the scroll wheel on a mouse to adjust the variable gain.
• Select the Reset icon ( ) to remove variable gain adjustments.
Horizontal and Vertical PositionAdjust the position of the trace display.
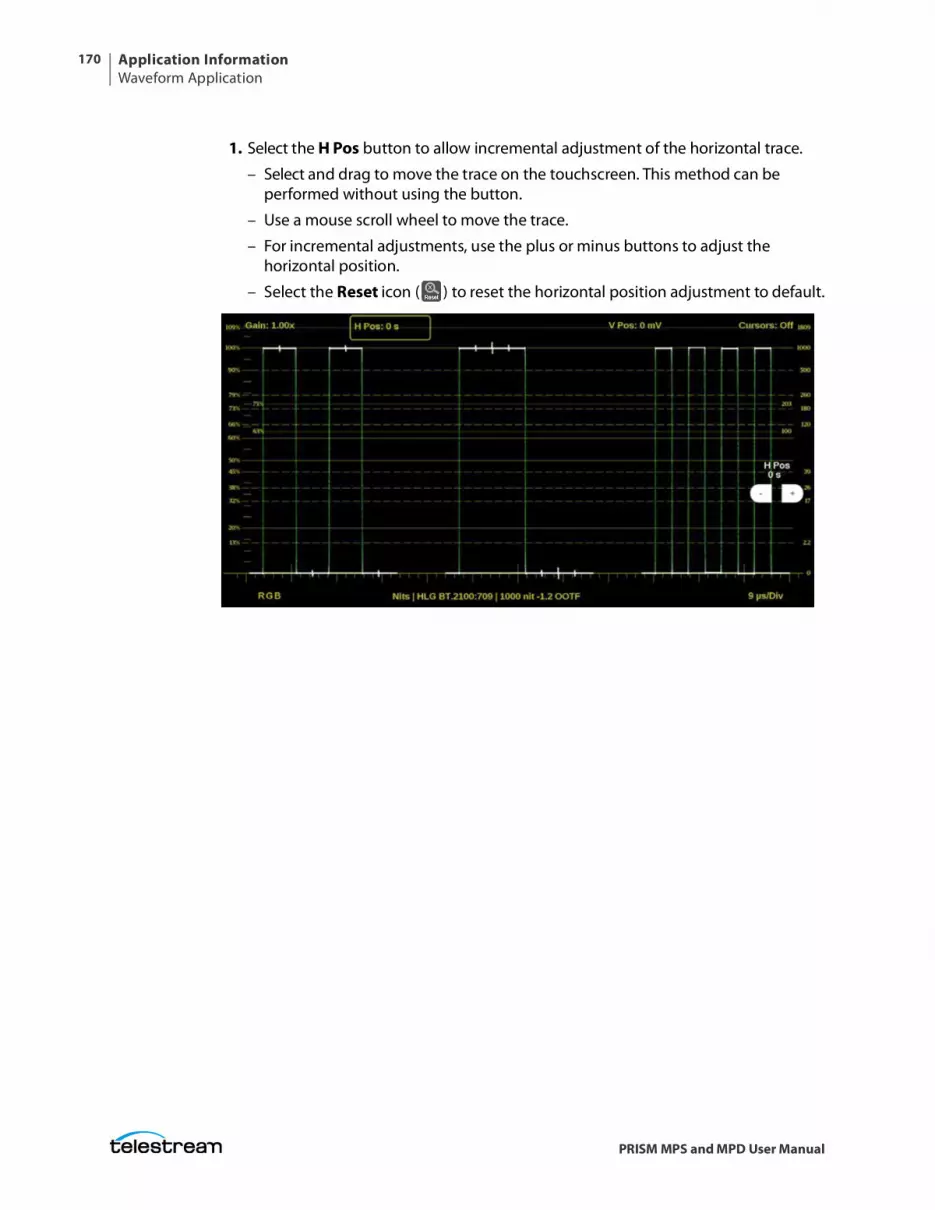
Application InformationWaveform Application
170
PRISM MPS and MPD User Manual
1. Select the H Pos button to allow incremental adjustment of the horizontal trace.
– Select and drag to move the trace on the touchscreen. This method can be performed without using the button.
– Use a mouse scroll wheel to move the trace.
– For incremental adjustments, use the plus or minus buttons to adjust the horizontal position.
– Select the Reset icon ( ) to reset the horizontal position adjustment to default.
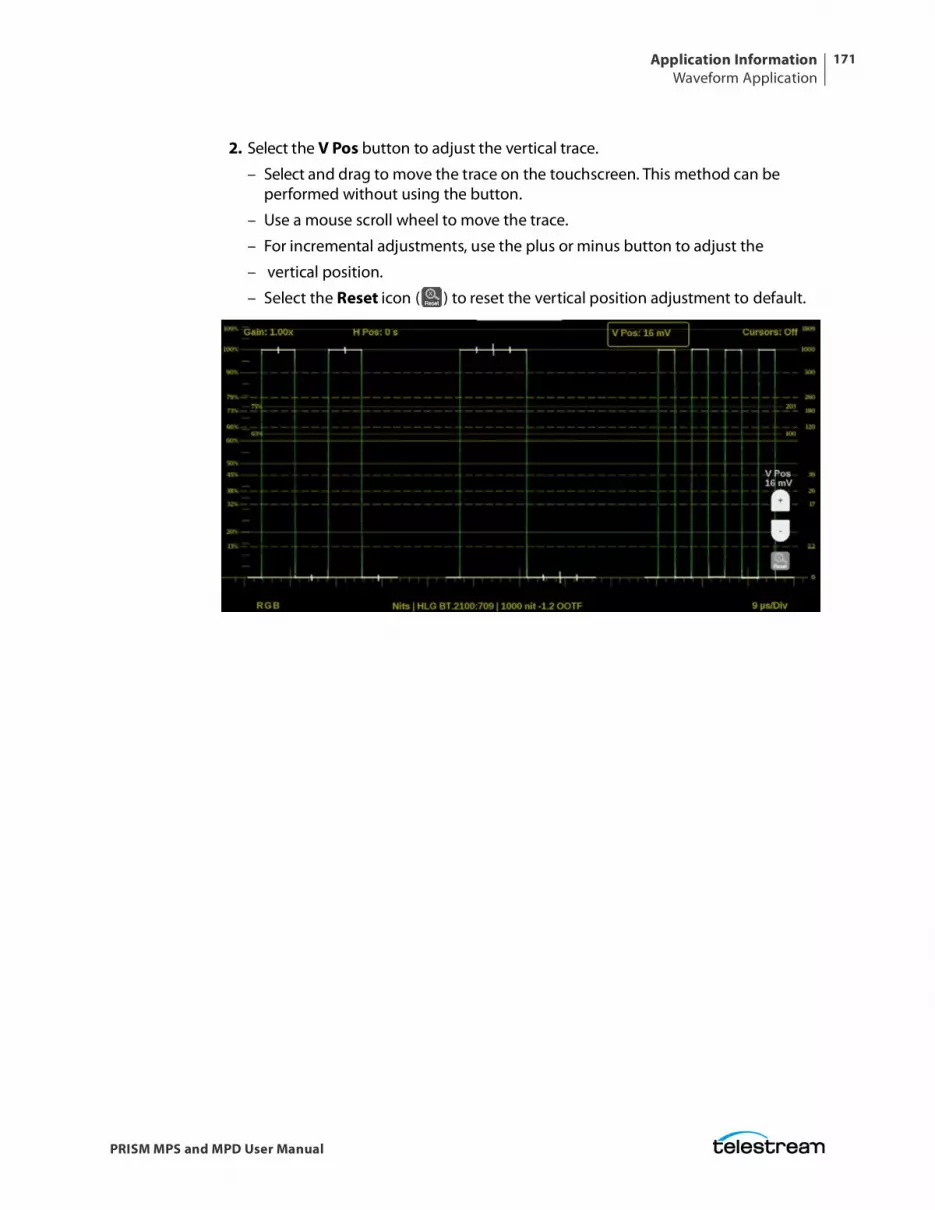
Application InformationWaveform Application
171
PRISM MPS and MPD User Manual
2. Select the V Pos button to adjust the vertical trace.
– Select and drag to move the trace on the touchscreen. This method can be performed without using the button.
– Use a mouse scroll wheel to move the trace.
– For incremental adjustments, use the plus or minus button to adjust the
– vertical position.
– Select the Reset icon ( ) to reset the vertical position adjustment to default.
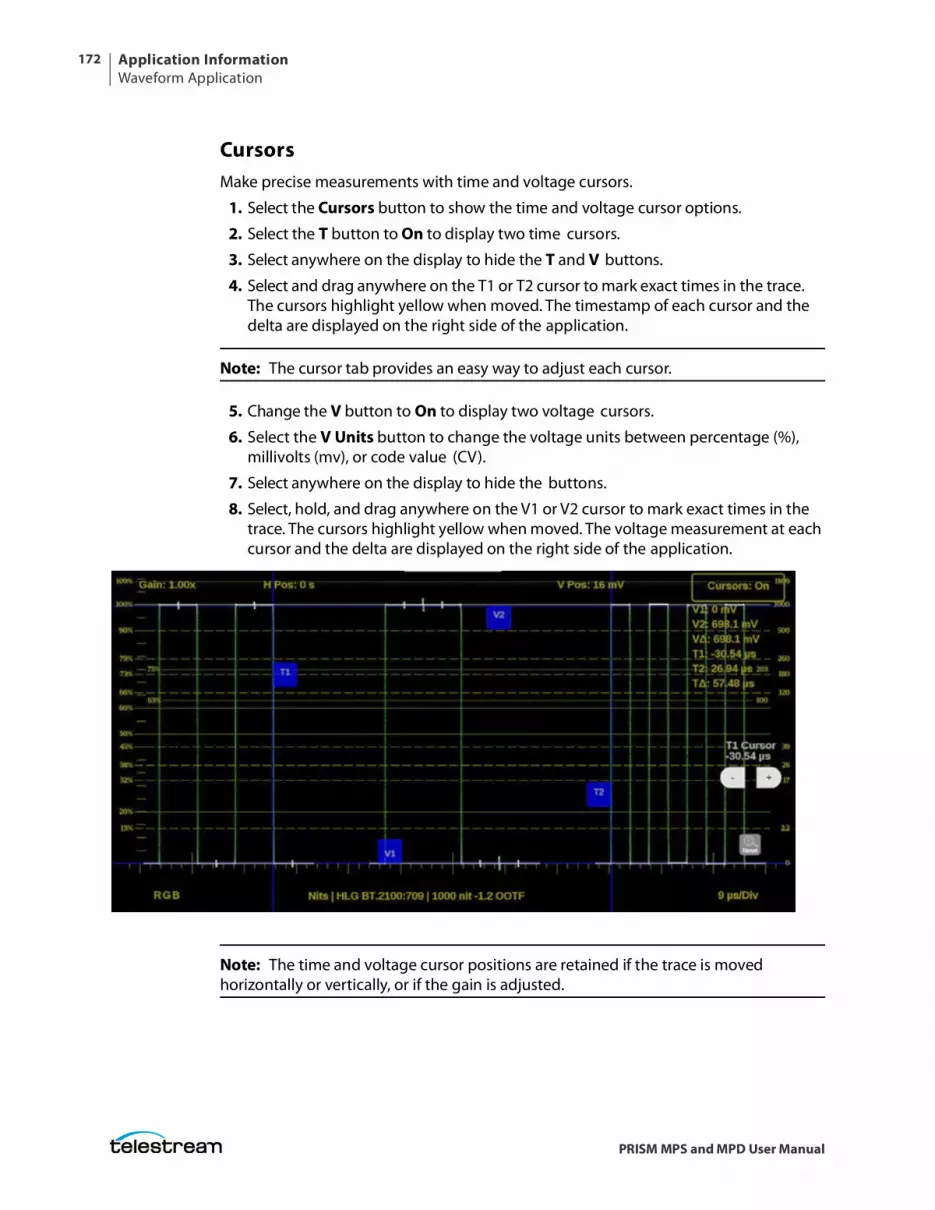
Application InformationWaveform Application
172
PRISM MPS and MPD User Manual
CursorsMake precise measurements with time and voltage cursors.
1. Select the Cursors button to show the time and voltage cursor options.
2. Select the T button to On to display two time cursors.
3. Select anywhere on the display to hide the T and V buttons.
4. Select and drag anywhere on the T1 or T2 cursor to mark exact times in the trace. The cursors highlight yellow when moved. The timestamp of each cursor and the delta are displayed on the right side of the application.
Note: The cursor tab provides an easy way to adjust each cursor.
5. Change the V button to On to display two voltage cursors.
6. Select the V Units button to change the voltage units between percentage (%), millivolts (mv), or code value (CV).
7. Select anywhere on the display to hide the buttons.
8. Select, hold, and drag anywhere on the V1 or V2 cursor to mark exact times in the trace. The cursors highlight yellow when moved. The voltage measurement at each cursor and the delta are displayed on the right side of the application.
Note: The time and voltage cursor positions are retained if the trace is moved horizontally or vertically, or if the gain is adjusted.
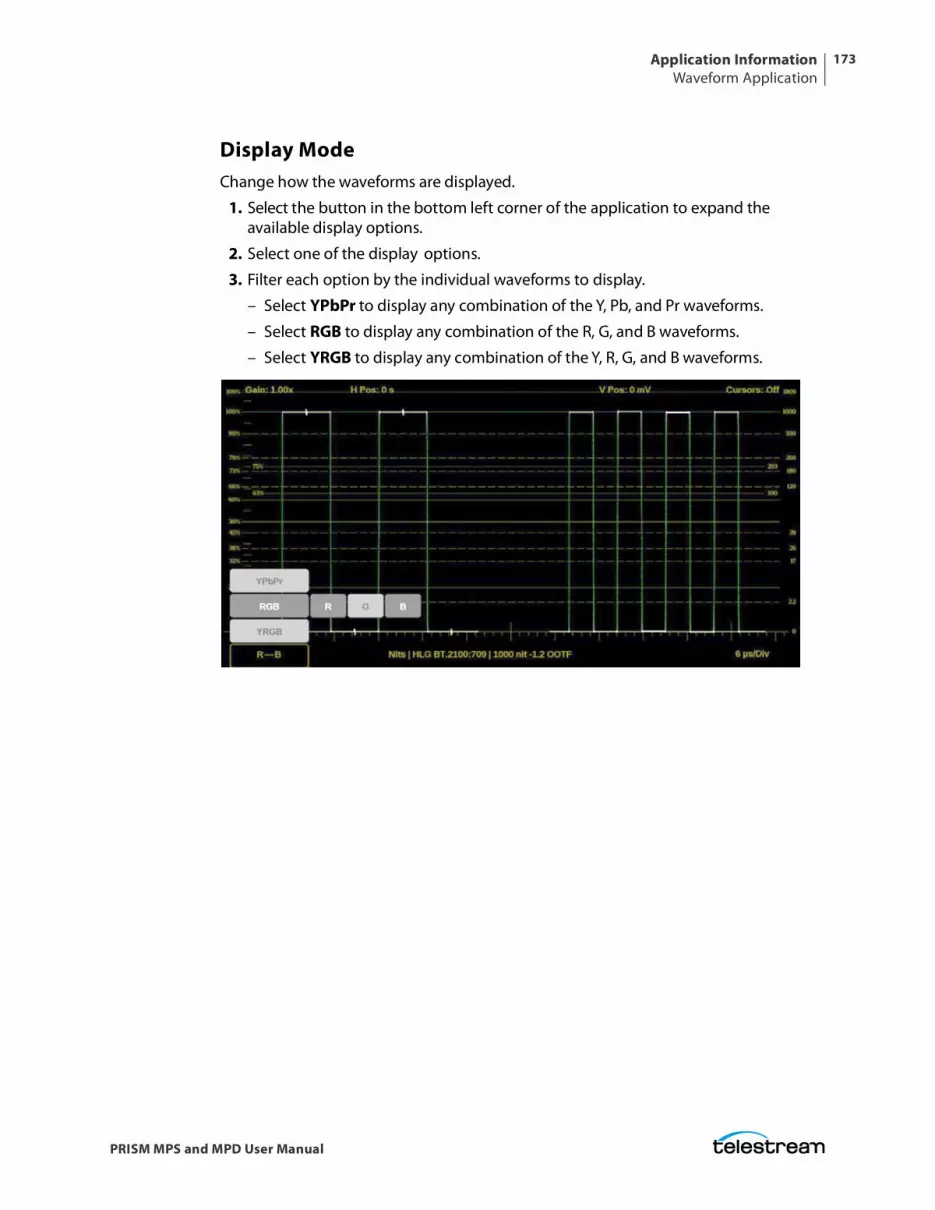
Application InformationWaveform Application
173
PRISM MPS and MPD User Manual
Display ModeChange how the waveforms are displayed.
1. Select the button in the bottom left corner of the application to expand the available display options.
2. Select one of the display options.
3. Filter each option by the individual waveforms to display.
– Select YPbPr to display any combination of the Y, Pb, and Pr waveforms.
– Select RGB to display any combination of the R, G, and B waveforms.
– Select YRGB to display any combination of the Y, R, G, and B waveforms.
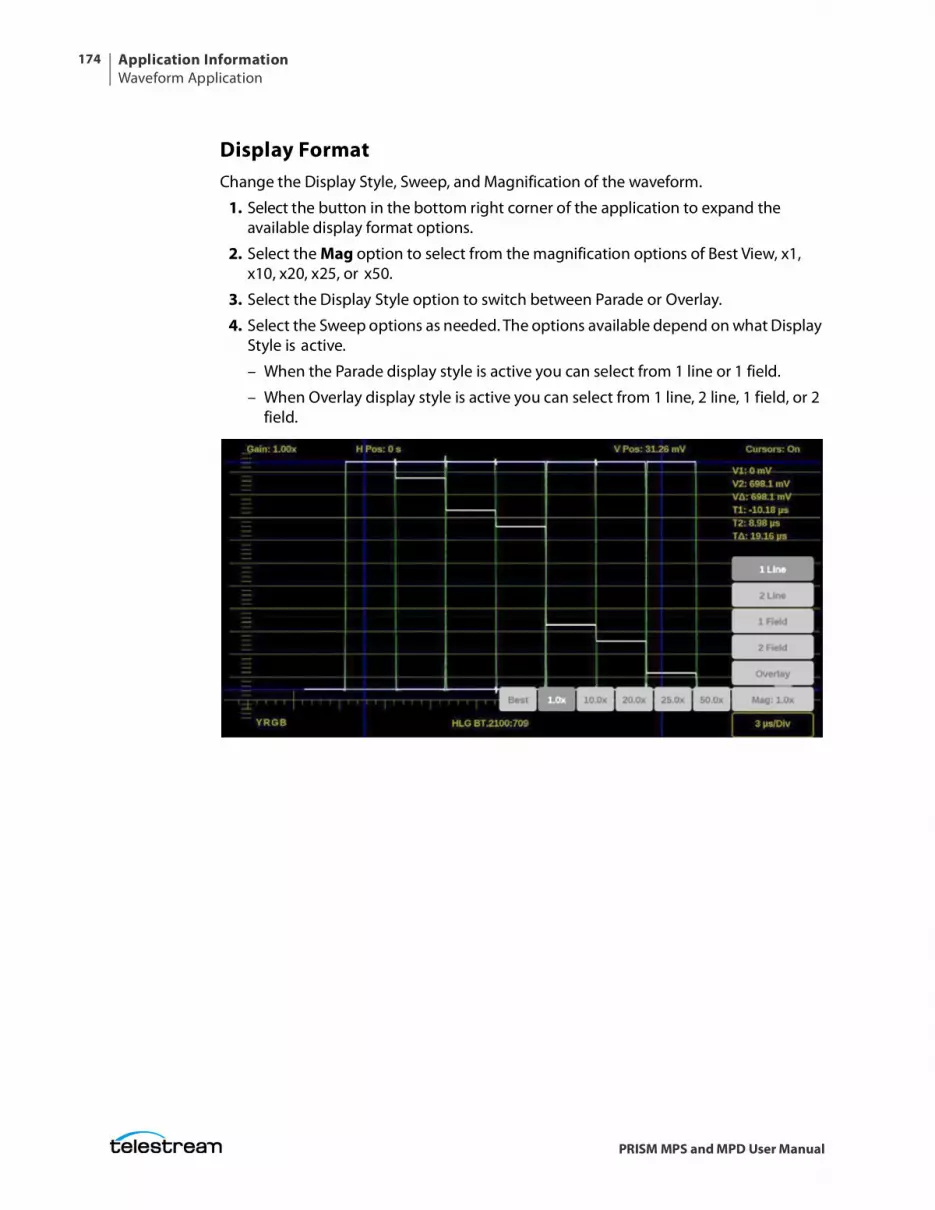
Application InformationWaveform Application
174
PRISM MPS and MPD User Manual
Display FormatChange the Display Style, Sweep, and Magnification of the waveform.
1. Select the button in the bottom right corner of the application to expand the available display format options.
2. Select the Mag option to select from the magnification options of Best View, x1, x10, x20, x25, or x50.
3. Select the Display Style option to switch between Parade or Overlay.
4. Select the Sweep options as needed. The options available depend on what Display Style is active.
– When the Parade display style is active you can select from 1 line or 1 field.
– When Overlay display style is active you can select from 1 line, 2 line, 1 field, or 2 field.
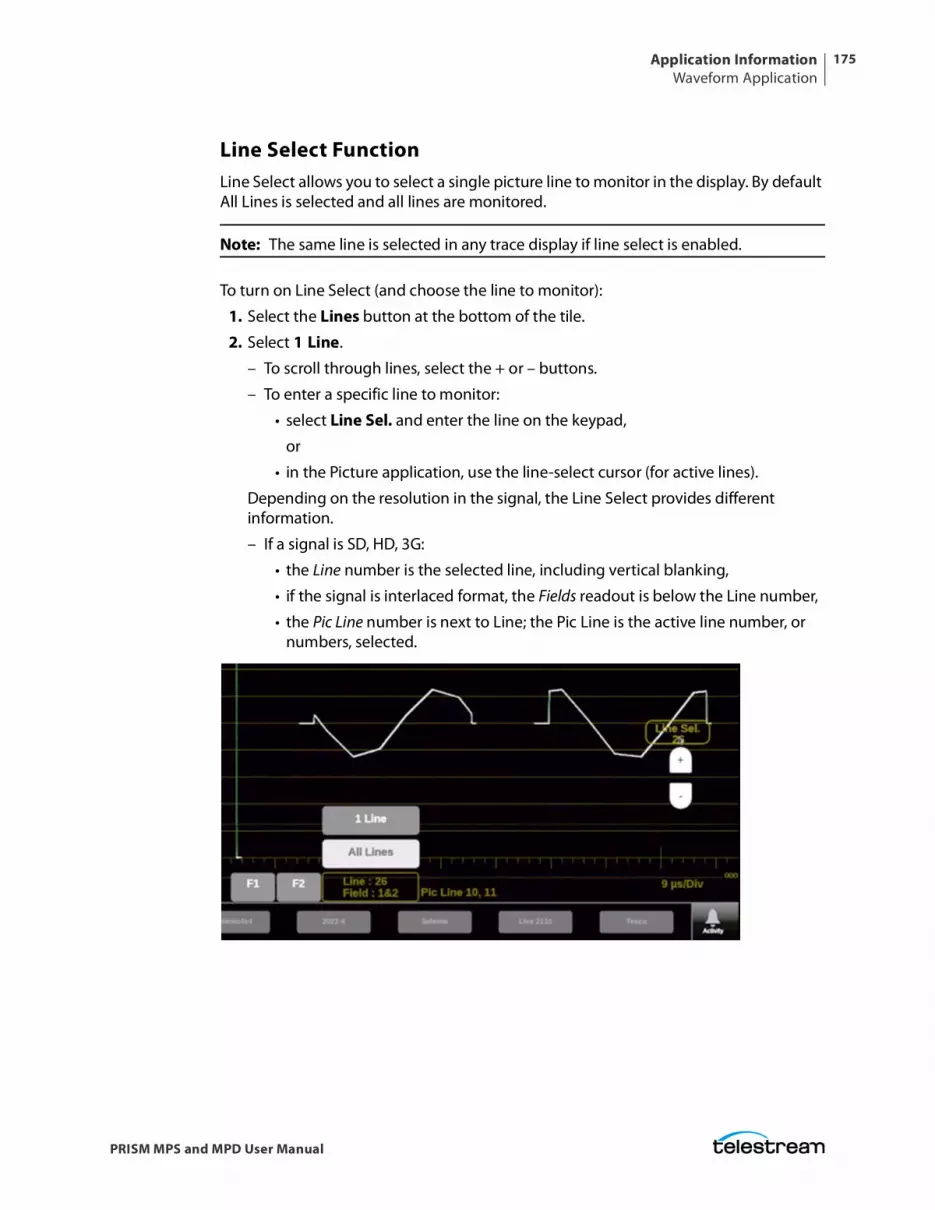
Application InformationWaveform Application
175
PRISM MPS and MPD User Manual
Line Select FunctionLine Select allows you to select a single picture line to monitor in the display. By default All Lines is selected and all lines are monitored.
Note: The same line is selected in any trace display if line select is enabled.
To turn on Line Select (and choose the line to monitor):
1. Select the Lines button at the bottom of the tile.
2. Select 1 Line.
– To scroll through lines, select the + or – buttons.
– To enter a specific line to monitor:
• select Line Sel. and enter the line on the keypad,
or
• in the Picture application, use the line-select cursor (for active lines).
Depending on the resolution in the signal, the Line Select provides different information.
– If a signal is SD, HD, 3G:
• the Line number is the selected line, including vertical blanking,
• if the signal is interlaced format, the Fields readout is below the Line number,
• the Pic Line number is next to Line; the Pic Line is the active line number, or numbers, selected.

Application InformationWaveform Application
176
PRISM MPS and MPD User Manual
– If a signal is UHD, 4K:
• the Line number is the selected raster line,
• the SDI Line is the selected line including vertical blanking,
• the link number appears below the SDI Line.
Note: In link, the letters (A, B, C, or D) refers to the physical links. The numbers (1, 2, 3, or 4) refers to the virtual links. For example, A3/62 indicates it is physical link 1 and virtual link 3 (in a 2-sample interleave, 12G transport).
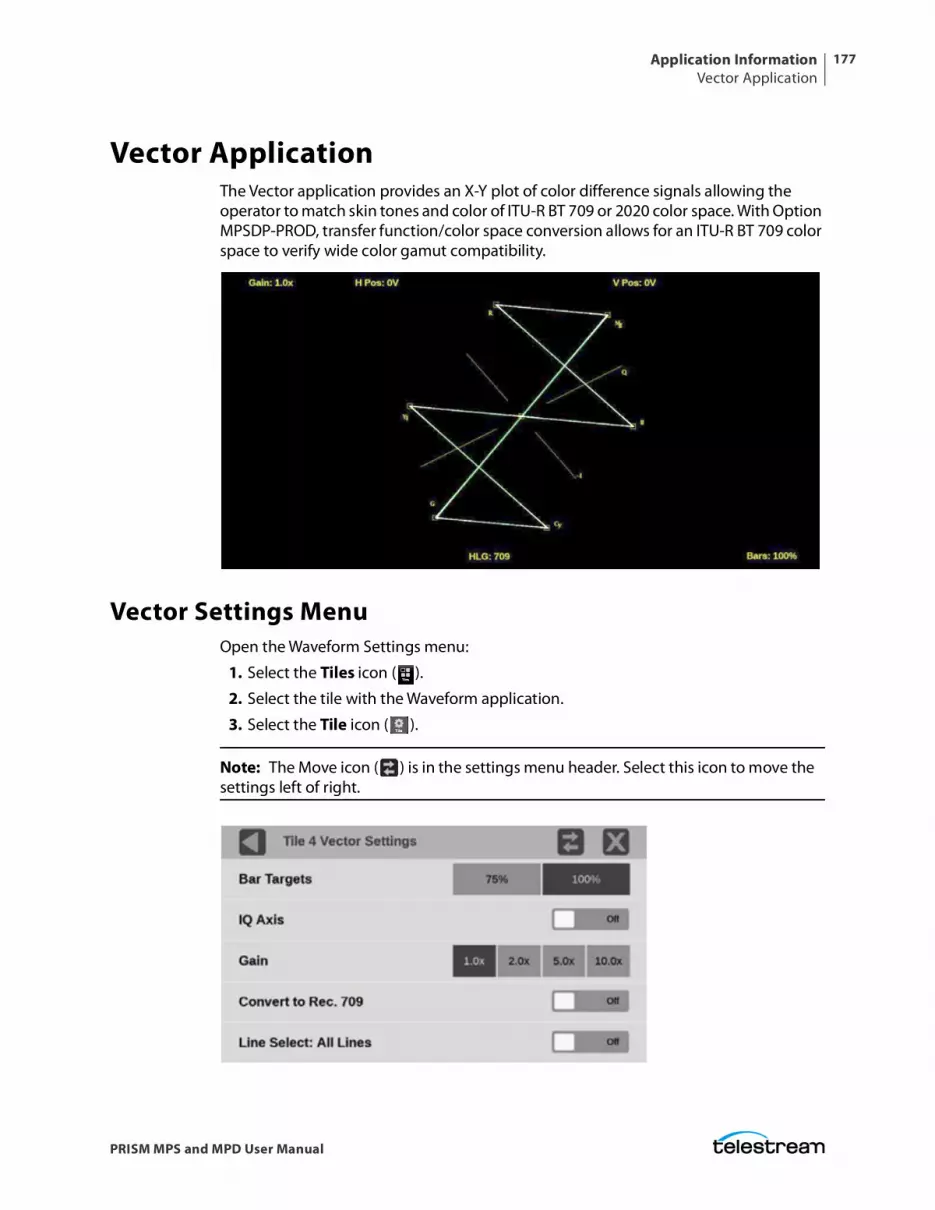
Application InformationVector Application
177
PRISM MPS and MPD User Manual
Vector ApplicationThe Vector application provides an X-Y plot of color difference signals allowing the operator to match skin tones and color of ITU-R BT 709 or 2020 color space. With Option MPSDP-PROD, transfer function/color space conversion allows for an ITU-R BT 709 color space to verify wide color gamut compatibility.
Vector Settings MenuOpen the Waveform Settings menu:
1. Select the Tiles icon ( ).
2. Select the tile with the Waveform application.
3. Select the Tile icon ( ).
Note: The Move icon ( ) is in the settings menu header. Select this icon to move the settings left of right.
Application InformationVector Application
178
PRISM MPS and MPD User Manual
Bar TargetsSelect between 75% or 100% scaling.
IQ AxisSelect this to turn the IQ Axis On or Off.
GainSelect one of the trace vector magnifications: x1, x2, x5 or x10.
Convert to Rec. 709Turn this setting On to allow the trace displays to convert the Gamma and Color Gamut settings for the signal to SDR Narrow and BT. 709 (requires Option MPSDP-PROD).
Note: Set Convert to Rec. 709 to On to automatically convert settings to BT.709, otherwise the graticule selection must be manually changed. (See Configure Instrument for HDR/WCG Monitoring.) Convert to Rec. 709 mode is not supported for SD signals.
Line SelectLine Select allows you to choose the picture lines to monitor in the display. Either All Lines or 1 Line can be selected.
If 1 Line is selected then the display only shows results for the selected line in the picture. The line can be selected using the on-screen tools; see Line Select Function. Or the line can be selected directly on the Picture.
Vector Application On-screen ToolsYou can change the gain, horizontal position, vertical position, and bar targets without opening the Vector settings menu through on-screen tools. Select the tool/button for the setting you want to adjust. All the available tools are located on the top and bottom
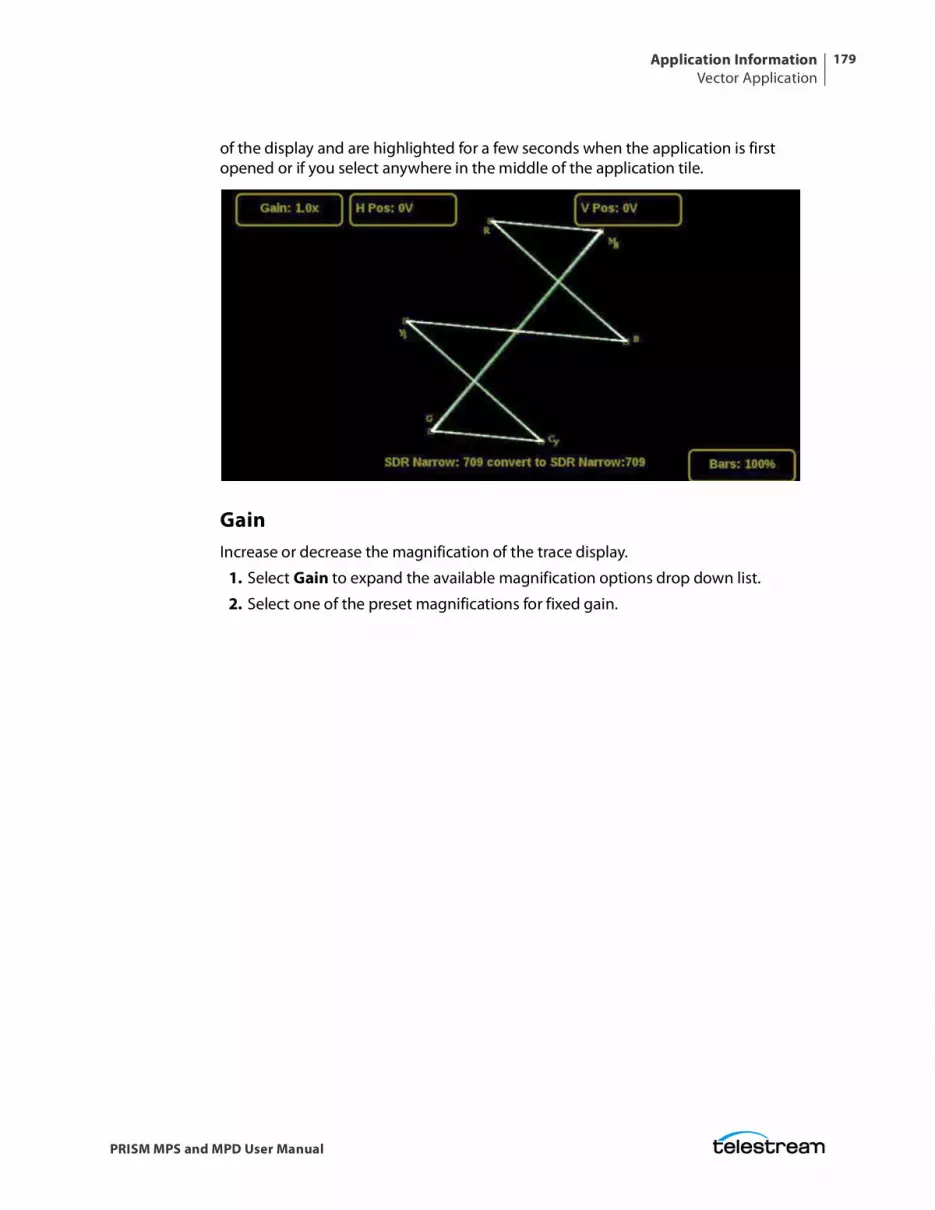
Application InformationVector Application
179
PRISM MPS and MPD User Manual
of the display and are highlighted for a few seconds when the application is first opened or if you select anywhere in the middle of the application tile.
GainIncrease or decrease the magnification of the trace display.
1. Select Gain to expand the available magnification options drop down list.
2. Select one of the preset magnifications for fixed gain.
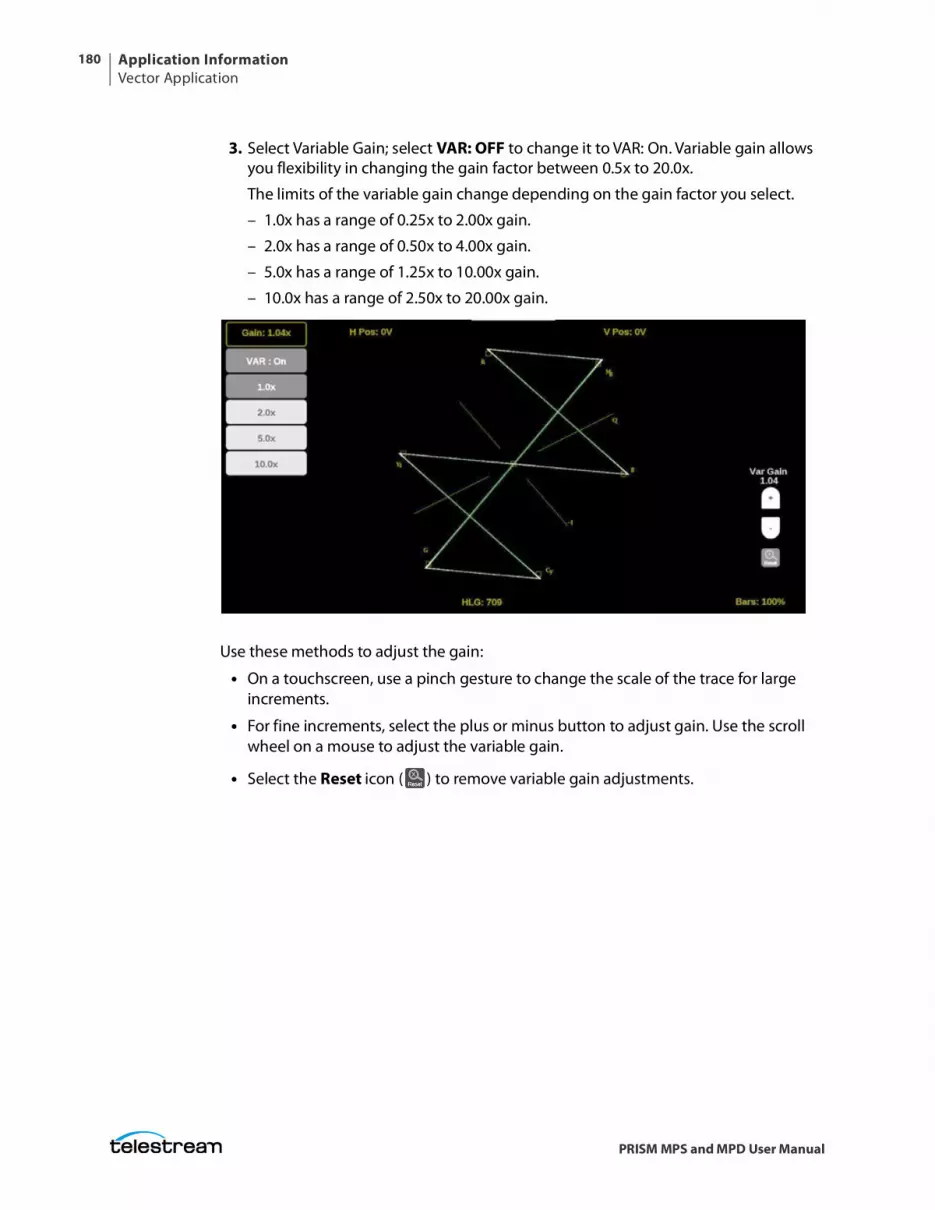
Application InformationVector Application
180
PRISM MPS and MPD User Manual
3. Select Variable Gain; select VAR: OFF to change it to VAR: On. Variable gain allows you flexibility in changing the gain factor between 0.5x to 20.0x.
The limits of the variable gain change depending on the gain factor you select.
– 1.0x has a range of 0.25x to 2.00x gain.
– 2.0x has a range of 0.50x to 4.00x gain.
– 5.0x has a range of 1.25x to 10.00x gain.
– 10.0x has a range of 2.50x to 20.00x gain.
Use these methods to adjust the gain:
• On a touchscreen, use a pinch gesture to change the scale of the trace for large increments.
• For fine increments, select the plus or minus button to adjust gain. Use the scroll wheel on a mouse to adjust the variable gain.
• Select the Reset icon ( ) to remove variable gain adjustments.
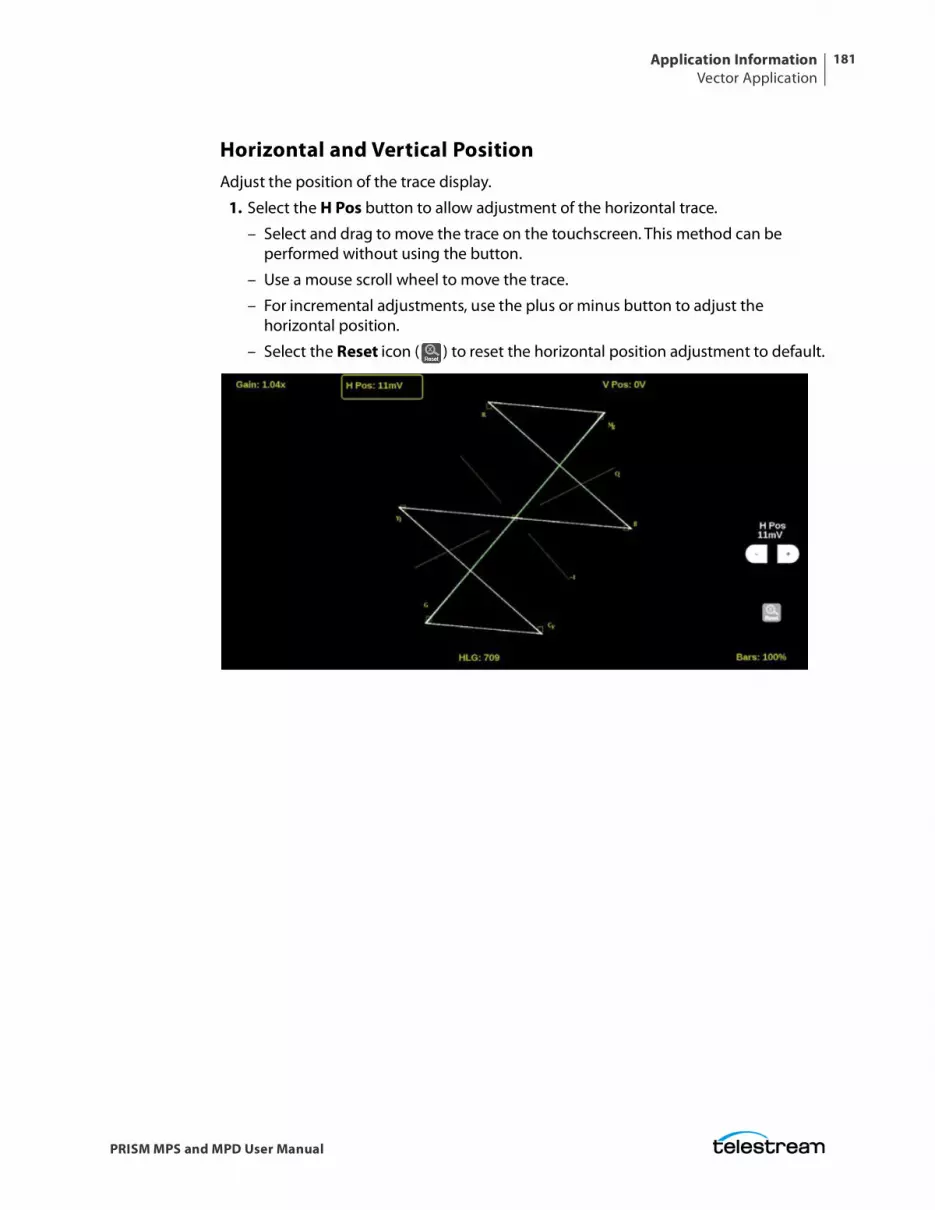
Application InformationVector Application
181
PRISM MPS and MPD User Manual
Horizontal and Vertical PositionAdjust the position of the trace display.
1. Select the H Pos button to allow adjustment of the horizontal trace.
– Select and drag to move the trace on the touchscreen. This method can be performed without using the button.
– Use a mouse scroll wheel to move the trace.
– For incremental adjustments, use the plus or minus button to adjust the horizontal position.
– Select the Reset icon ( ) to reset the horizontal position adjustment to default.
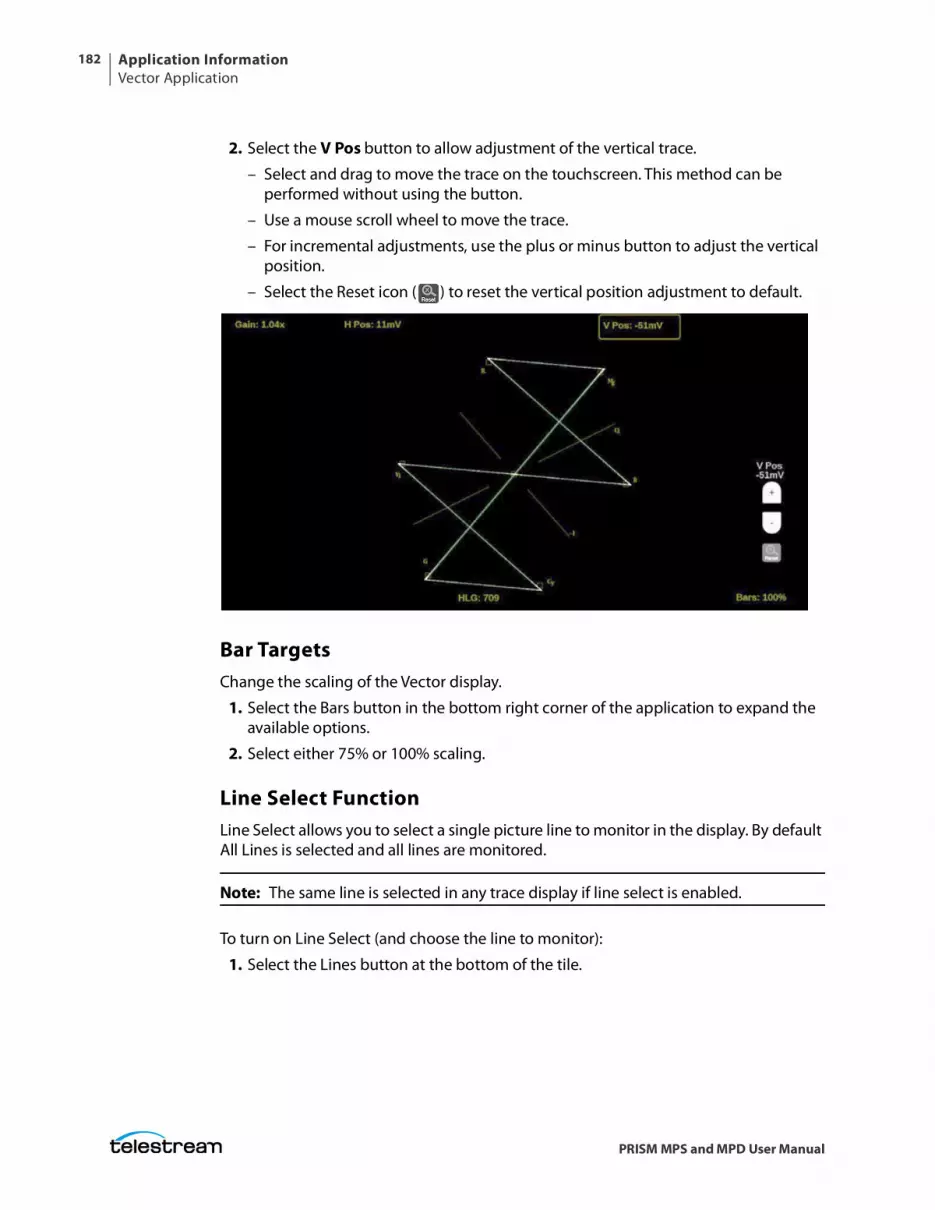
Application InformationVector Application
182
PRISM MPS and MPD User Manual
2. Select the V Pos button to allow adjustment of the vertical trace.
– Select and drag to move the trace on the touchscreen. This method can be performed without using the button.
– Use a mouse scroll wheel to move the trace.
– For incremental adjustments, use the plus or minus button to adjust the vertical position.
– Select the Reset icon ( ) to reset the vertical position adjustment to default.
Bar TargetsChange the scaling of the Vector display.
1. Select the Bars button in the bottom right corner of the application to expand the available options.
2. Select either 75% or 100% scaling.
Line Select FunctionLine Select allows you to select a single picture line to monitor in the display. By default All Lines is selected and all lines are monitored.
Note: The same line is selected in any trace display if line select is enabled.
To turn on Line Select (and choose the line to monitor):
1. Select the Lines button at the bottom of the tile.
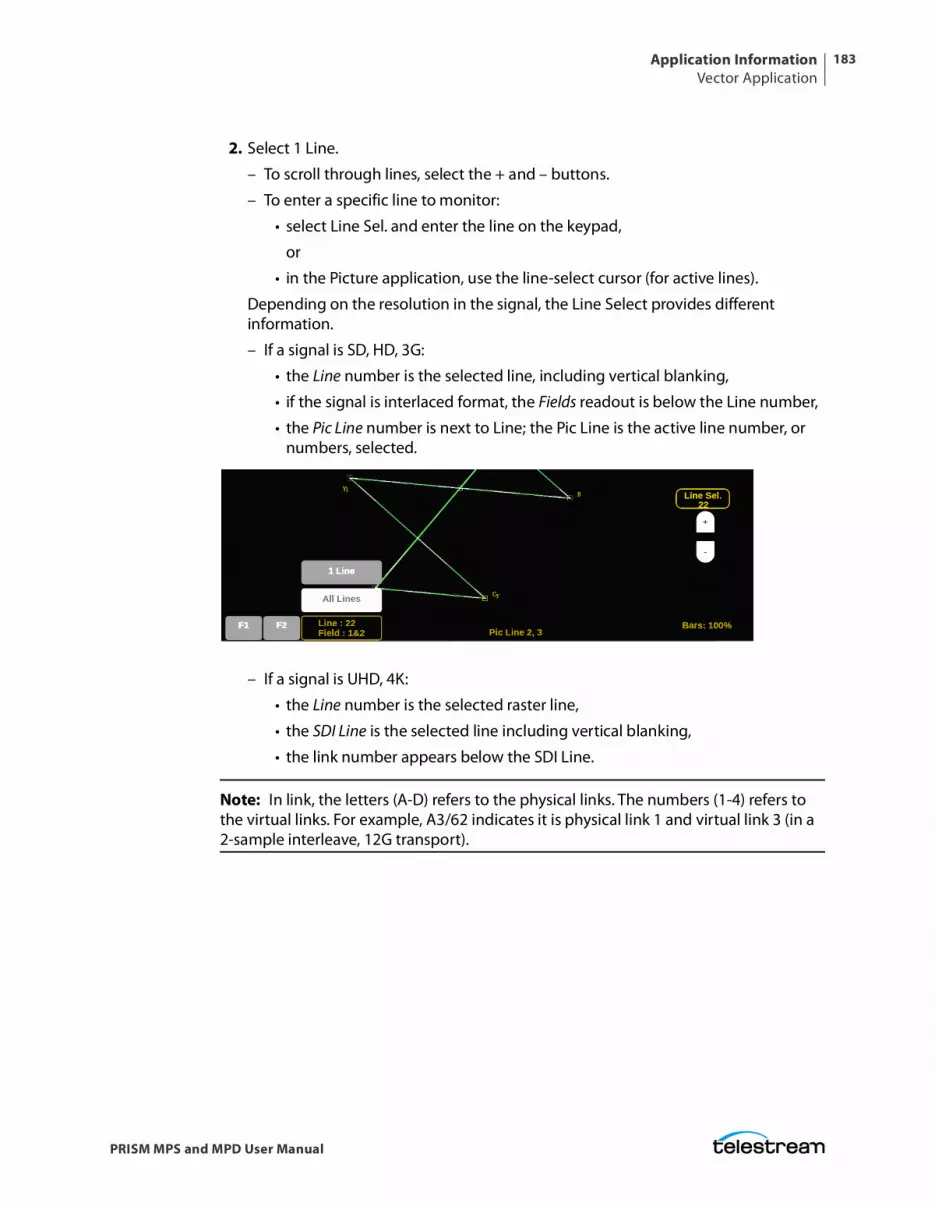
Application InformationVector Application
183
PRISM MPS and MPD User Manual
2. Select 1 Line.
– To scroll through lines, select the + and – buttons.
– To enter a specific line to monitor:
• select Line Sel. and enter the line on the keypad,
or
• in the Picture application, use the line-select cursor (for active lines).
Depending on the resolution in the signal, the Line Select provides different information.
– If a signal is SD, HD, 3G:
• the Line number is the selected line, including vertical blanking,
• if the signal is interlaced format, the Fields readout is below the Line number,
• the Pic Line number is next to Line; the Pic Line is the active line number, or numbers, selected.
– If a signal is UHD, 4K:
• the Line number is the selected raster line,
• the SDI Line is the selected line including vertical blanking,
• the link number appears below the SDI Line.
Note: In link, the letters (A-D) refers to the physical links. The numbers (1-4) refers to the virtual links. For example, A3/62 indicates it is physical link 1 and virtual link 3 (in a 2-sample interleave, 12G transport).
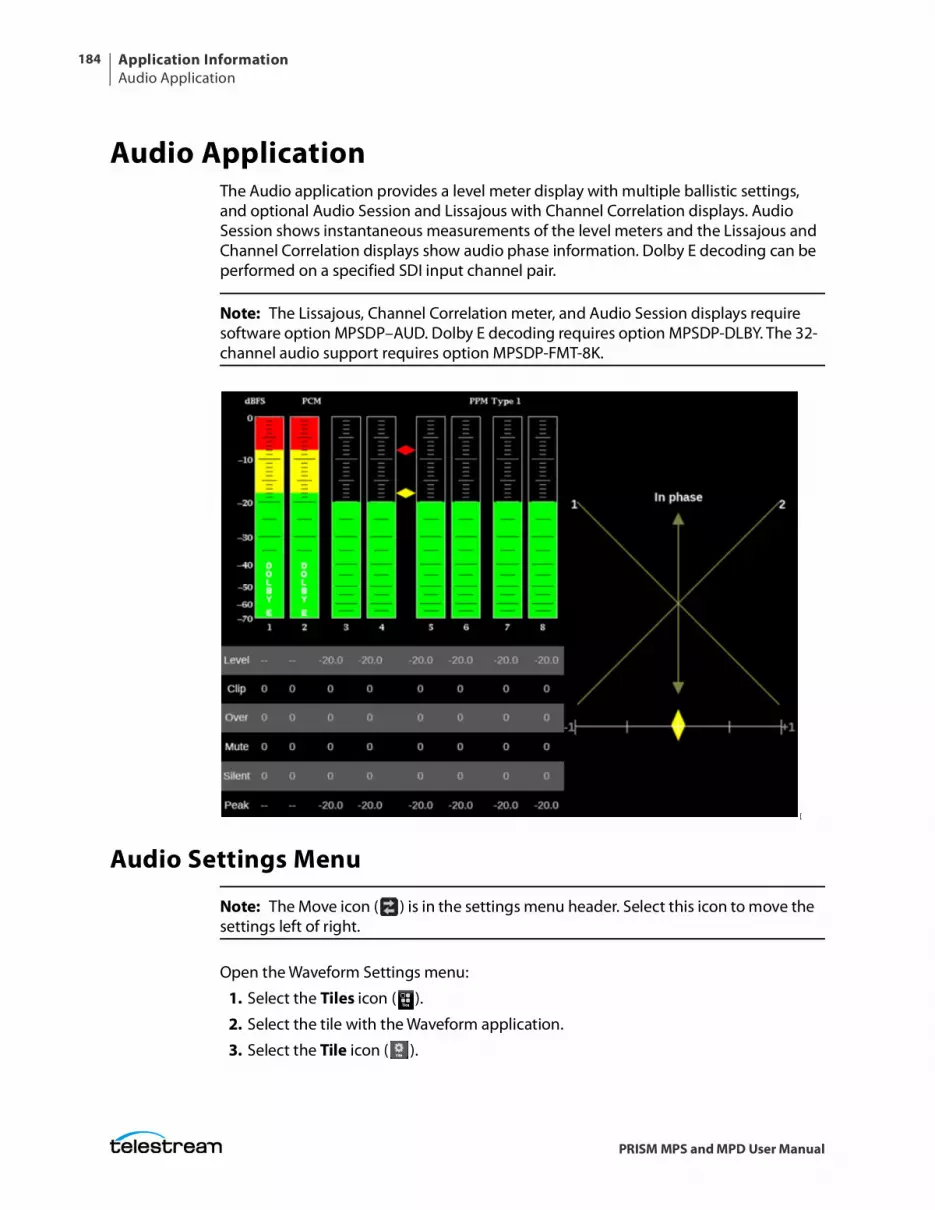
Application InformationAudio Application
184
PRISM MPS and MPD User Manual
Audio ApplicationThe Audio application provides a level meter display with multiple ballistic settings, and optional Audio Session and Lissajous with Channel Correlation displays. Audio Session shows instantaneous measurements of the level meters and the Lissajous and Channel Correlation displays show audio phase information. Dolby E decoding can be performed on a specified SDI input channel pair.
Note: The Lissajous, Channel Correlation meter, and Audio Session displays require software option MPSDP–AUD. Dolby E decoding requires option MPSDP-DLBY. The 32-channel audio support requires option MPSDP-FMT-8K.
[
Audio Settings Menu
Note: The Move icon ( ) is in the settings menu header. Select this icon to move the settings left of right.
Open the Waveform Settings menu:
1. Select the Tiles icon ( ).
2. Select the tile with the Waveform application.
3. Select the Tile icon ( ).
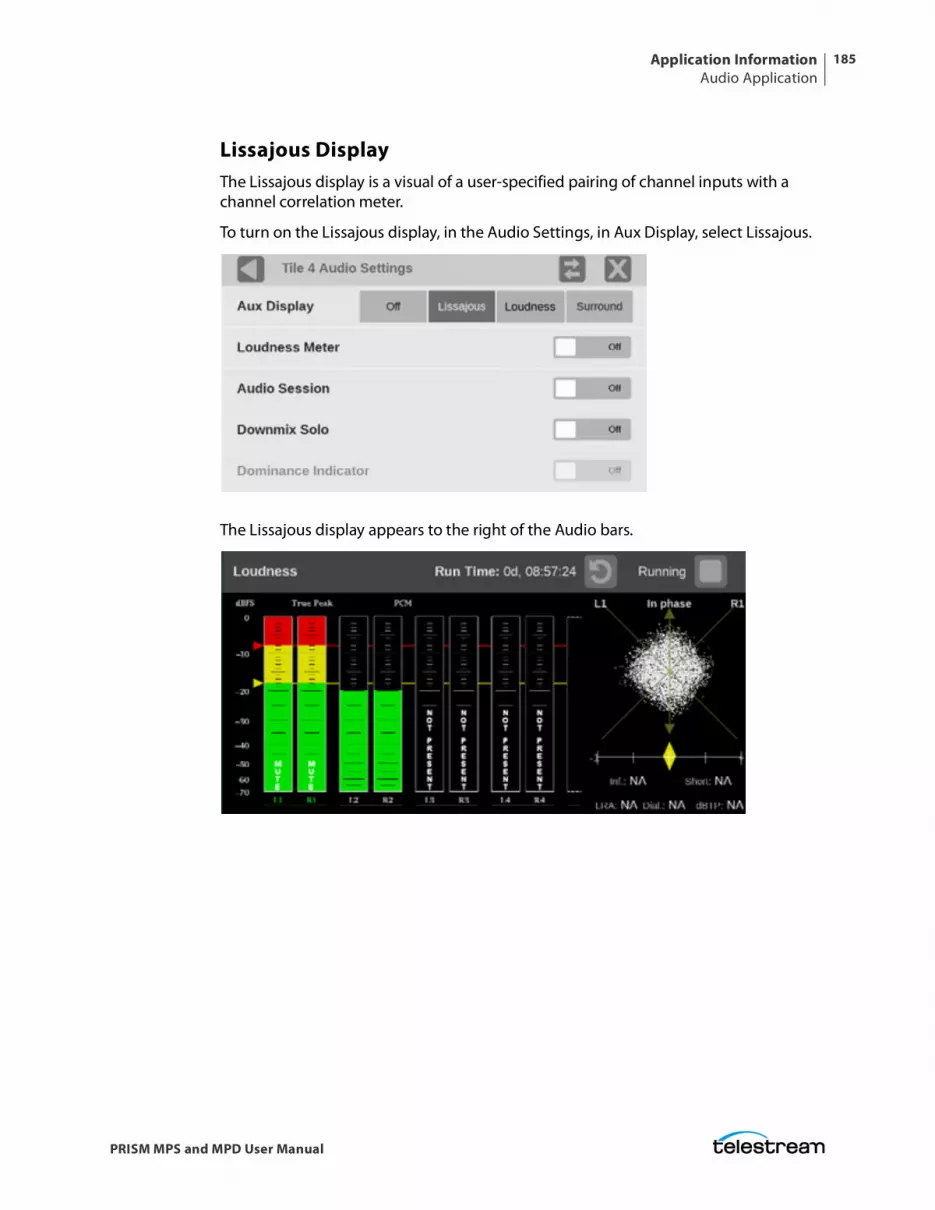
Application InformationAudio Application
185
PRISM MPS and MPD User Manual
Lissajous DisplayThe Lissajous display is a visual of a user-specified pairing of channel inputs with a channel correlation meter.
To turn on the Lissajous display, in the Audio Settings, in Aux Display, select Lissajous.
The Lissajous display appears to the right of the Audio bars.
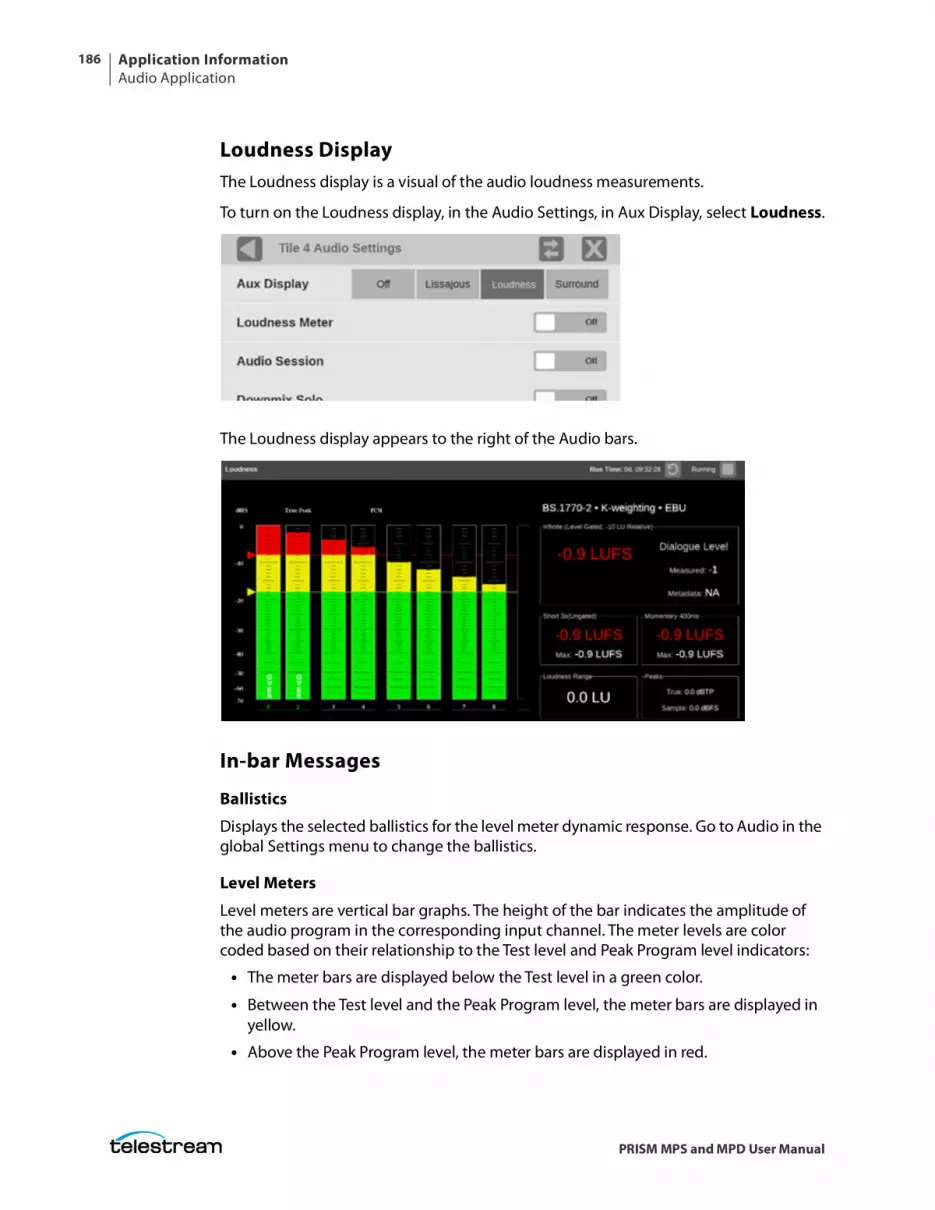
Application InformationAudio Application
186
PRISM MPS and MPD User Manual
Loudness DisplayThe Loudness display is a visual of the audio loudness measurements.
To turn on the Loudness display, in the Audio Settings, in Aux Display, select Loudness.
The Loudness display appears to the right of the Audio bars.
In-bar Messages
Ballistics
Displays the selected ballistics for the level meter dynamic response. Go to Audio in the global Settings menu to change the ballistics.
Level Meters
Level meters are vertical bar graphs. The height of the bar indicates the amplitude of the audio program in the corresponding input channel. The meter levels are color coded based on their relationship to the Test level and Peak Program level indicators:
• The meter bars are displayed below the Test level in a green color.
• Between the Test level and the Peak Program level, the meter bars are displayed in yellow.
• Above the Peak Program level, the meter bars are displayed in red.
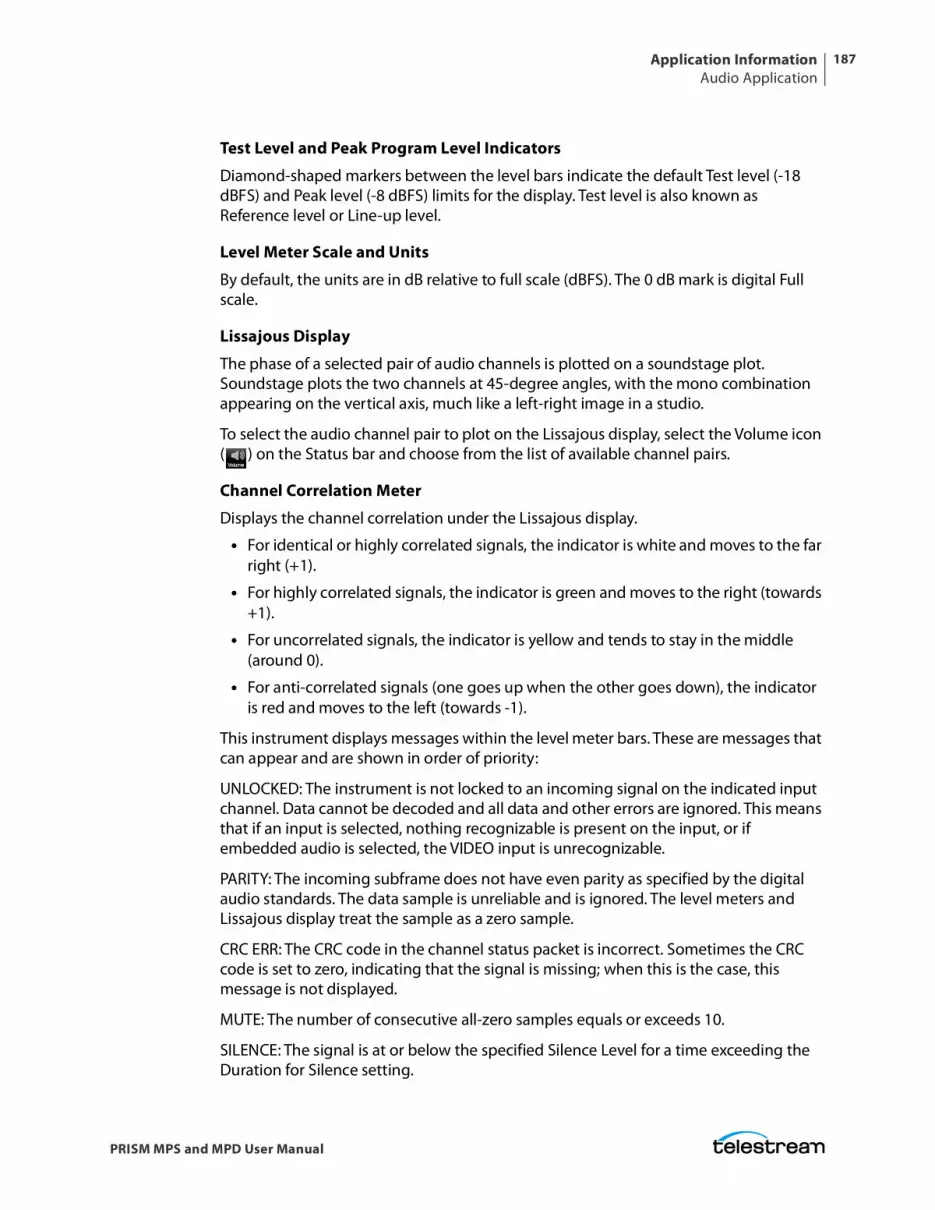
Application InformationAudio Application
187
PRISM MPS and MPD User Manual
Test Level and Peak Program Level Indicators
Diamond-shaped markers between the level bars indicate the default Test level (-18 dBFS) and Peak level (-8 dBFS) limits for the display. Test level is also known as Reference level or Line-up level.
Level Meter Scale and Units
By default, the units are in dB relative to full scale (dBFS). The 0 dB mark is digital Full scale.
Lissajous Display
The phase of a selected pair of audio channels is plotted on a soundstage plot. Soundstage plots the two channels at 45-degree angles, with the mono combination appearing on the vertical axis, much like a left-right image in a studio.
To select the audio channel pair to plot on the Lissajous display, select the Volume icon ( ) on the Status bar and choose from the list of available channel pairs.
Channel Correlation Meter
Displays the channel correlation under the Lissajous display.
• For identical or highly correlated signals, the indicator is white and moves to the far right (+1).
• For highly correlated signals, the indicator is green and moves to the right (towards +1).
• For uncorrelated signals, the indicator is yellow and tends to stay in the middle (around 0).
• For anti-correlated signals (one goes up when the other goes down), the indicator is red and moves to the left (towards -1).
This instrument displays messages within the level meter bars. These are messages that can appear and are shown in order of priority:
UNLOCKED: The instrument is not locked to an incoming signal on the indicated input channel. Data cannot be decoded and all data and other errors are ignored. This means that if an input is selected, nothing recognizable is present on the input, or if embedded audio is selected, the VIDEO input is unrecognizable.
PARITY: The incoming subframe does not have even parity as specified by the digital audio standards. The data sample is unreliable and is ignored. The level meters and Lissajous display treat the sample as a zero sample.
CRC ERR: The CRC code in the channel status packet is incorrect. Sometimes the CRC code is set to zero, indicating that the signal is missing; when this is the case, this message is not displayed.
MUTE: The number of consecutive all-zero samples equals or exceeds 10.
SILENCE: The signal is at or below the specified Silence Level for a time exceeding the Duration for Silence setting.
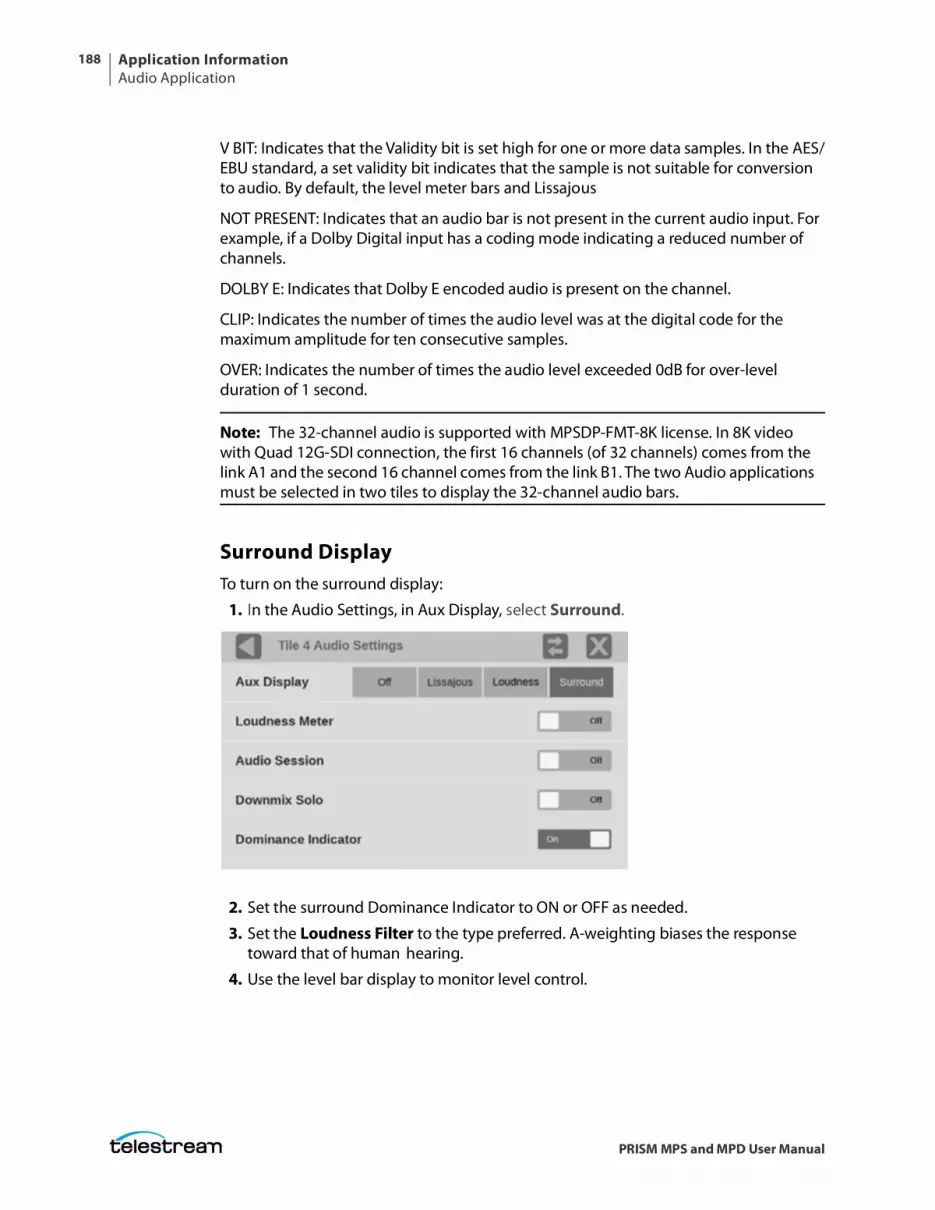
Application InformationAudio Application
188
PRISM MPS and MPD User Manual
V BIT: Indicates that the Validity bit is set high for one or more data samples. In the AES/EBU standard, a set validity bit indicates that the sample is not suitable for conversion to audio. By default, the level meter bars and Lissajous
NOT PRESENT: Indicates that an audio bar is not present in the current audio input. For example, if a Dolby Digital input has a coding mode indicating a reduced number of channels.
DOLBY E: Indicates that Dolby E encoded audio is present on the channel.
CLIP: Indicates the number of times the audio level was at the digital code for the maximum amplitude for ten consecutive samples.
OVER: Indicates the number of times the audio level exceeded 0dB for over-level duration of 1 second.
Note: The 32-channel audio is supported with MPSDP-FMT-8K license. In 8K video with Quad 12G-SDI connection, the first 16 channels (of 32 channels) comes from the link A1 and the second 16 channel comes from the link B1. The two Audio applications must be selected in two tiles to display the 32-channel audio bars.
Surround DisplayTo turn on the surround display:
1. In the Audio Settings, in Aux Display, select Surround.
2. Set the surround Dominance Indicator to ON or OFF as needed.
3. Set the Loudness Filter to the type preferred. A-weighting biases the response toward that of human hearing.
4. Use the level bar display to monitor level control.
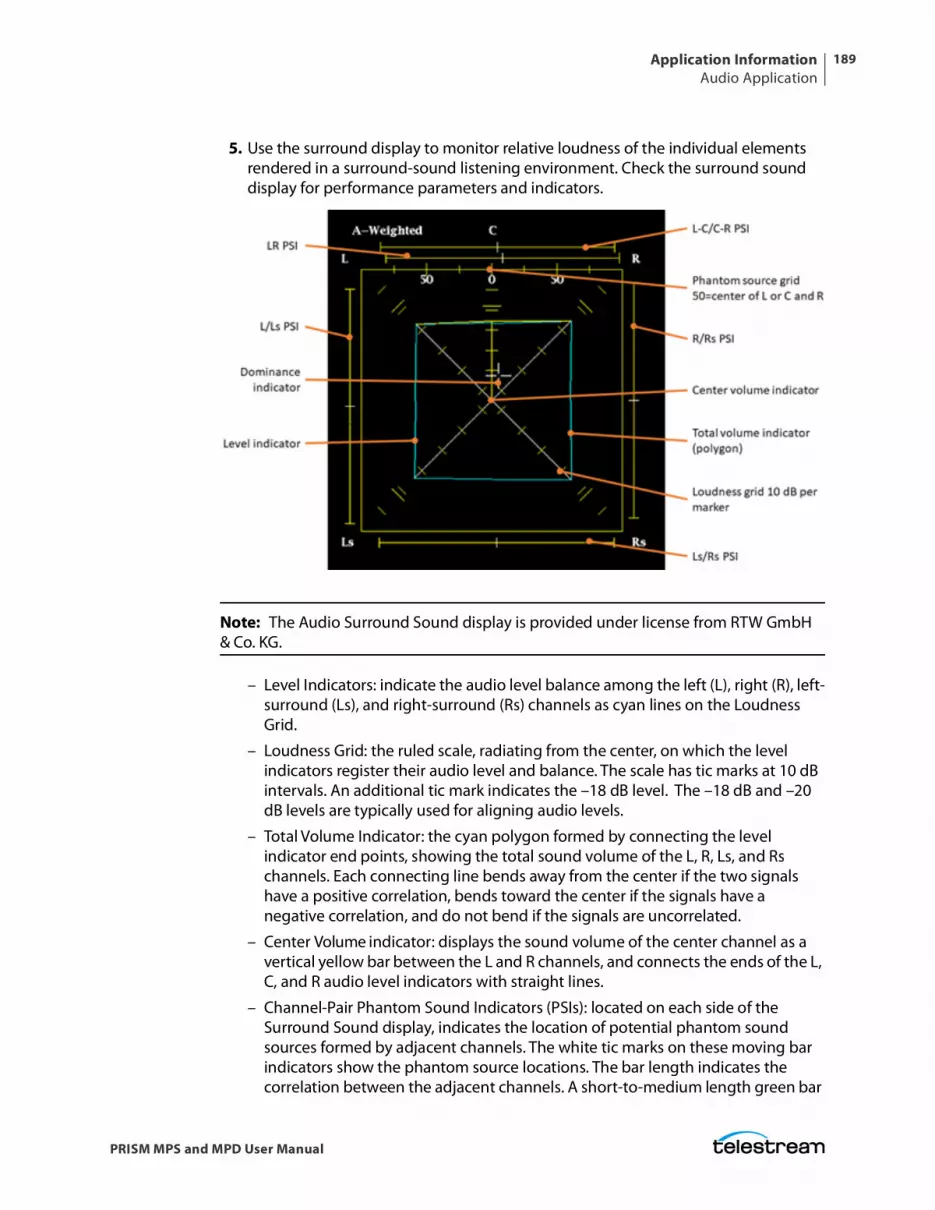
Application InformationAudio Application
189
PRISM MPS and MPD User Manual
5. Use the surround display to monitor relative loudness of the individual elements rendered in a surround-sound listening environment. Check the surround sound display for performance parameters and indicators.
Note: The Audio Surround Sound display is provided under license from RTW GmbH & Co. KG.
– Level Indicators: indicate the audio level balance among the left (L), right (R), left-surround (Ls), and right-surround (Rs) channels as cyan lines on the Loudness Grid.
– Loudness Grid: the ruled scale, radiating from the center, on which the level indicators register their audio level and balance. The scale has tic marks at 10 dB intervals. An additional tic mark indicates the –18 dB level. The –18 dB and –20 dB levels are typically used for aligning audio levels.
– Total Volume Indicator: the cyan polygon formed by connecting the level indicator end points, showing the total sound volume of the L, R, Ls, and Rs channels. Each connecting line bends away from the center if the two signals have a positive correlation, bends toward the center if the signals have a negative correlation, and do not bend if the signals are uncorrelated.
– Center Volume indicator: displays the sound volume of the center channel as a vertical yellow bar between the L and R channels, and connects the ends of the L, C, and R audio level indicators with straight lines.
– Channel-Pair Phantom Sound Indicators (PSIs): located on each side of the Surround Sound display, indicates the location of potential phantom sound sources formed by adjacent channels. The white tic marks on these moving bar indicators show the phantom source locations. The bar length indicates the correlation between the adjacent channels. A short-to-medium length green bar
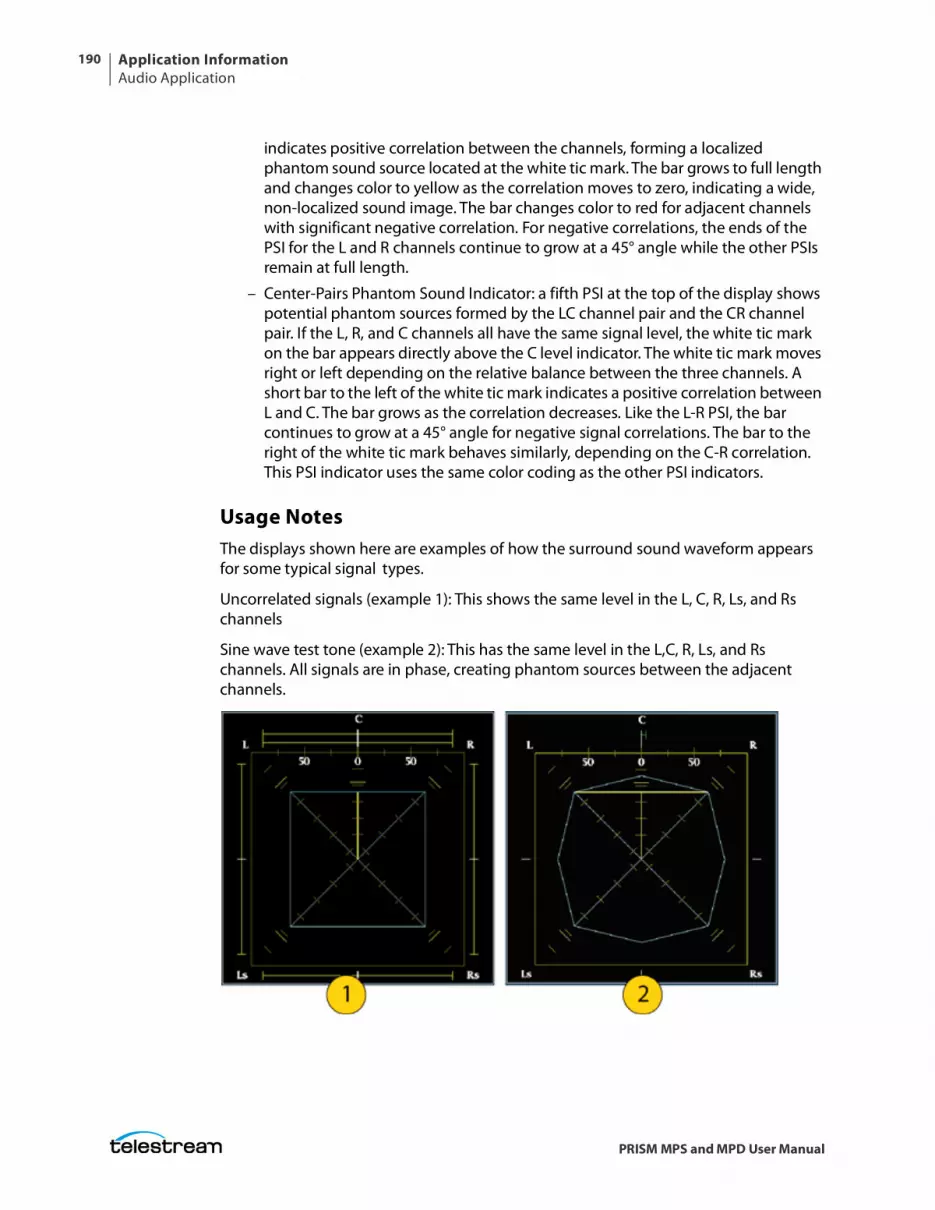
Application InformationAudio Application
190
PRISM MPS and MPD User Manual
indicates positive correlation between the channels, forming a localized phantom sound source located at the white tic mark. The bar grows to full length and changes color to yellow as the correlation moves to zero, indicating a wide, non-localized sound image. The bar changes color to red for adjacent channels with significant negative correlation. For negative correlations, the ends of the PSI for the L and R channels continue to grow at a 45° angle while the other PSIs remain at full length.
– Center-Pairs Phantom Sound Indicator: a fifth PSI at the top of the display shows potential phantom sources formed by the LC channel pair and the CR channel pair. If the L, R, and C channels all have the same signal level, the white tic mark on the bar appears directly above the C level indicator. The white tic mark moves right or left depending on the relative balance between the three channels. A short bar to the left of the white tic mark indicates a positive correlation between L and C. The bar grows as the correlation decreases. Like the L-R PSI, the bar continues to grow at a 45° angle for negative signal correlations. The bar to the right of the white tic mark behaves similarly, depending on the C-R correlation. This PSI indicator uses the same color coding as the other PSI indicators.
Usage NotesThe displays shown here are examples of how the surround sound waveform appears for some typical signal types.
Uncorrelated signals (example 1): This shows the same level in the L, C, R, Ls, and Rs channels
Sine wave test tone (example 2): This has the same level in the L,C, R, Ls, and Rs channels. All signals are in phase, creating phantom sources between the adjacent channels.
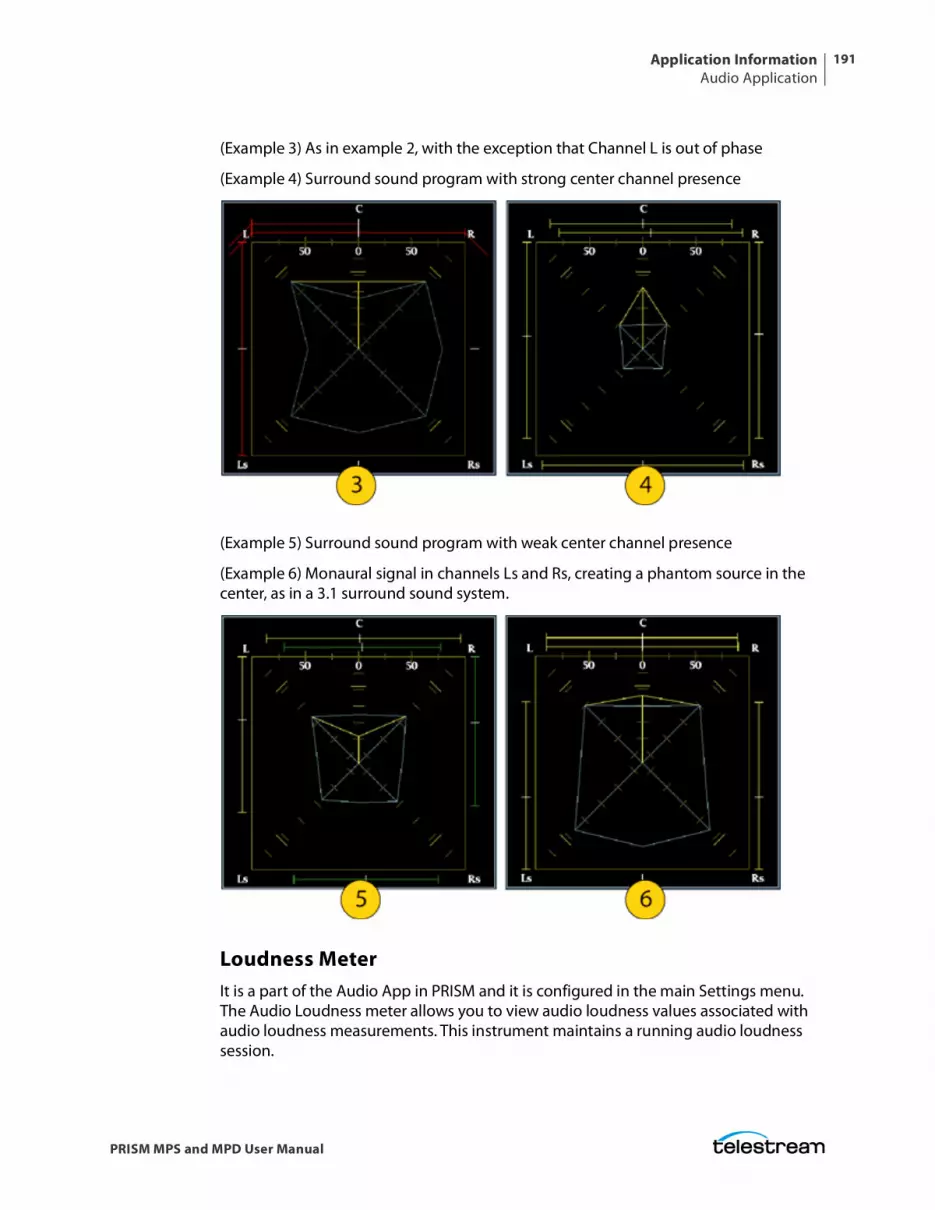
Application InformationAudio Application
191
PRISM MPS and MPD User Manual
(Example 3) As in example 2, with the exception that Channel L is out of phase
(Example 4) Surround sound program with strong center channel presence
(Example 5) Surround sound program with weak center channel presence
(Example 6) Monaural signal in channels Ls and Rs, creating a phantom source in the center, as in a 3.1 surround sound system.
Loudness MeterIt is a part of the Audio App in PRISM and it is configured in the main Settings menu. The Audio Loudness meter allows you to view audio loudness values associated with audio loudness measurements. This instrument maintains a running audio loudness session.
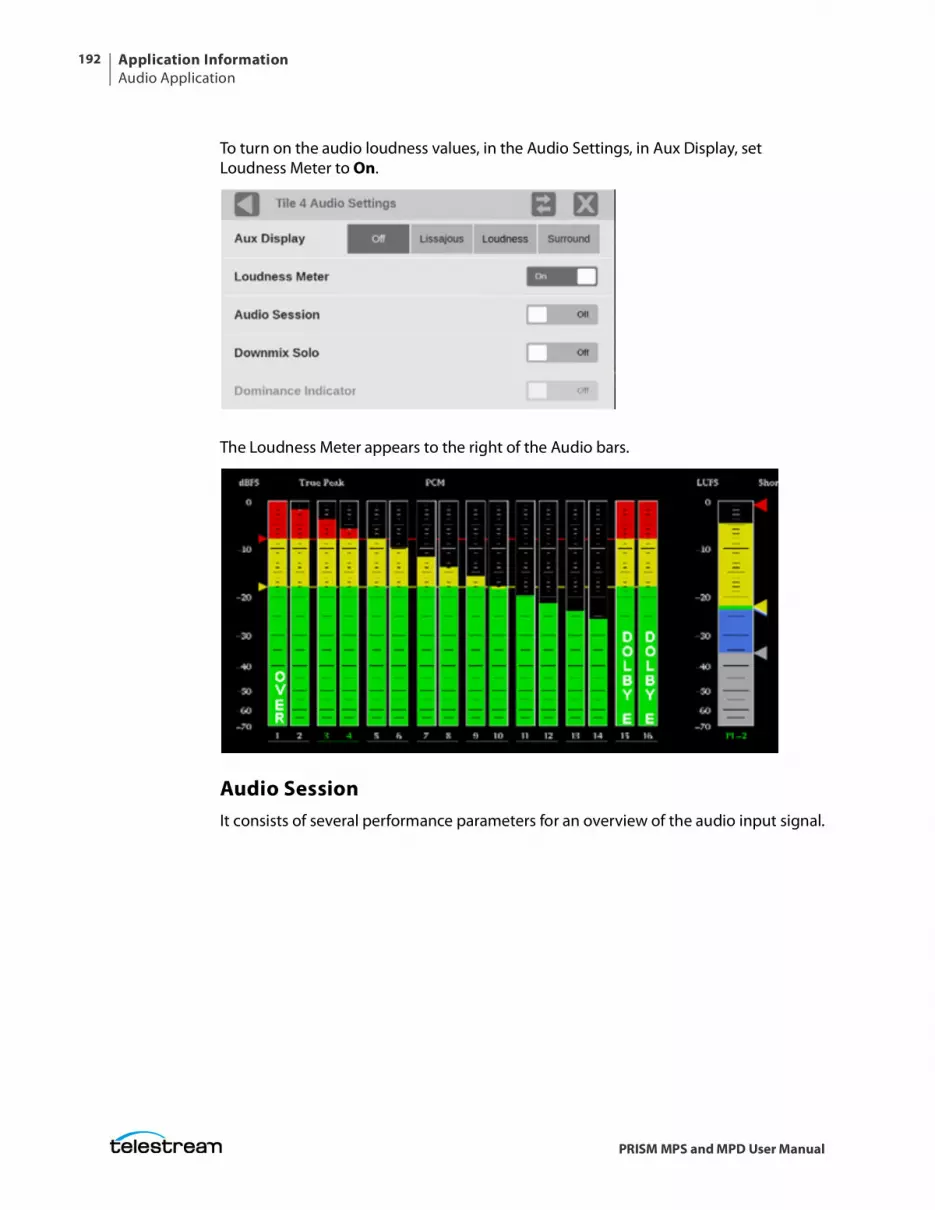
Application InformationAudio Application
192
PRISM MPS and MPD User Manual
To turn on the audio loudness values, in the Audio Settings, in Aux Display, set Loudness Meter to On.
The Loudness Meter appears to the right of the Audio bars.
Audio SessionIt consists of several performance parameters for an overview of the audio input signal.
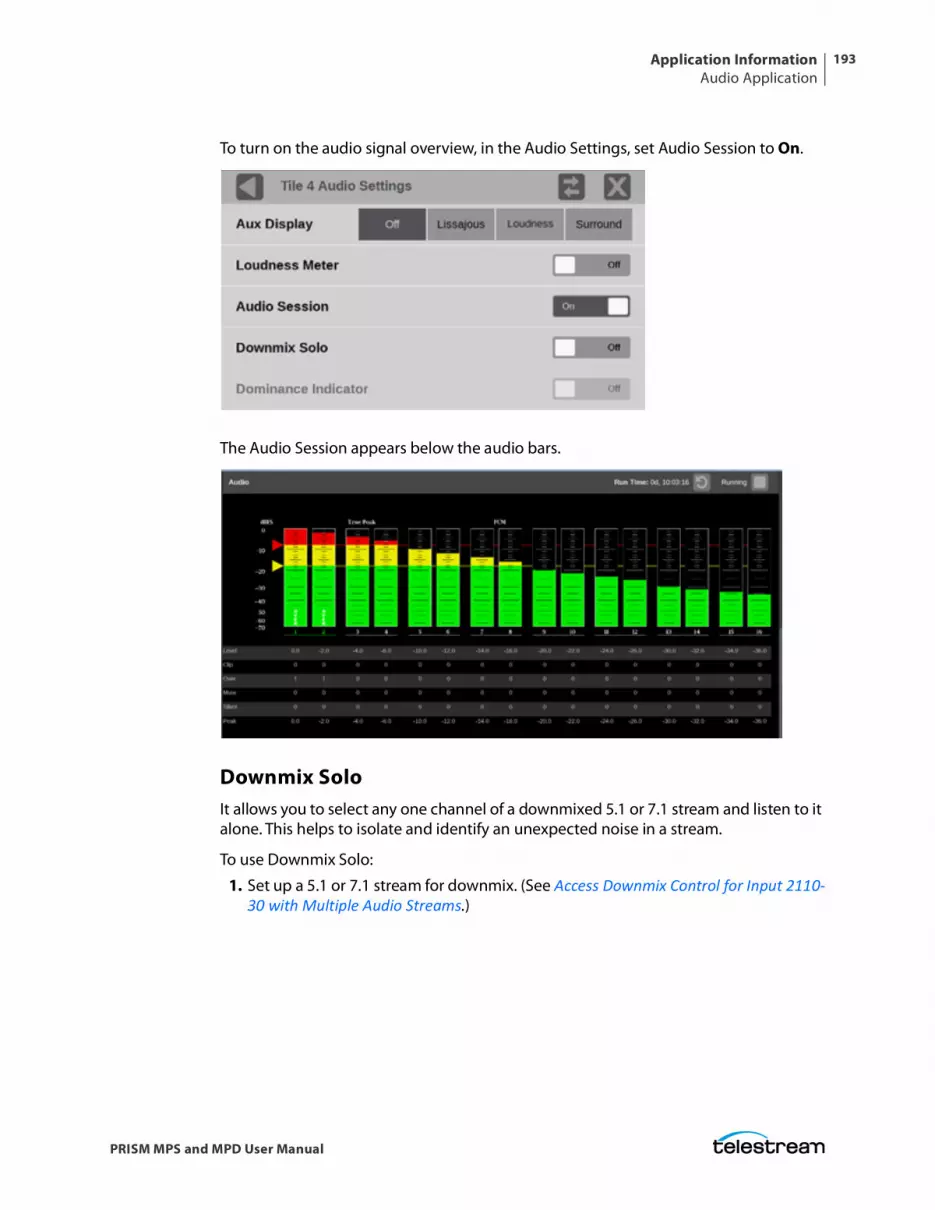
Application InformationAudio Application
193
PRISM MPS and MPD User Manual
To turn on the audio signal overview, in the Audio Settings, set Audio Session to On.
The Audio Session appears below the audio bars.
Downmix SoloIt allows you to select any one channel of a downmixed 5.1 or 7.1 stream and listen to it alone. This helps to isolate and identify an unexpected noise in a stream.
To use Downmix Solo:
1. Set up a 5.1 or 7.1 stream for downmix. (See Access Downmix Control for Input 2110-30 with Multiple Audio Streams.)
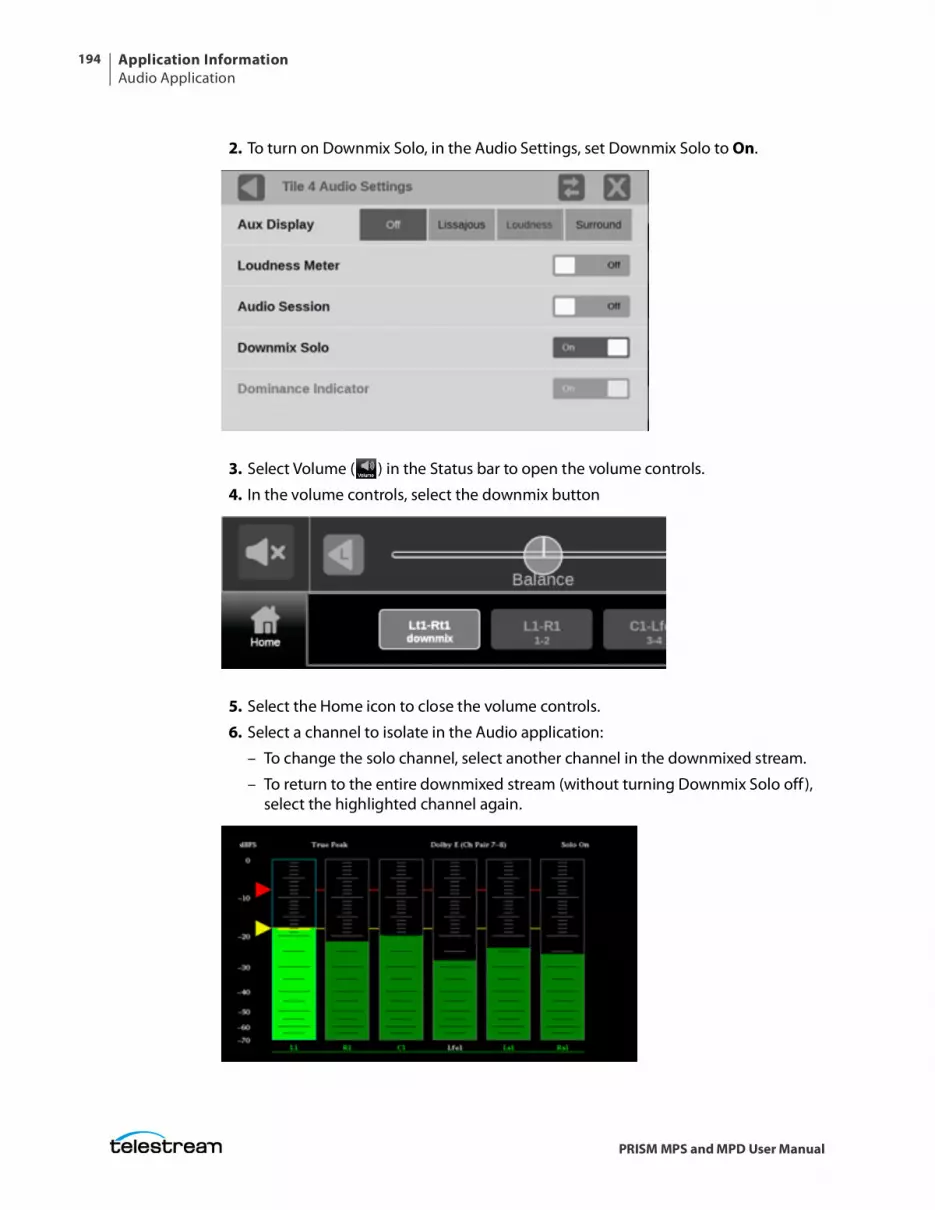
Application InformationAudio Application
194
PRISM MPS and MPD User Manual
2. To turn on Downmix Solo, in the Audio Settings, set Downmix Solo to On.
3. Select Volume ( ) in the Status bar to open the volume controls.
4. In the volume controls, select the downmix button
5. Select the Home icon to close the volume controls.
6. Select a channel to isolate in the Audio application:
– To change the solo channel, select another channel in the downmixed stream.
– To return to the entire downmixed stream (without turning Downmix Solo off ), select the highlighted channel again.

Application InformationPicture Application
195
PRISM MPS and MPD User Manual
Picture ApplicationThe Picture display lets you see the picture generated by the video signal.
(Copyright 2008, Blender Foundation / www.bigbuckbunny.org)
Picture Settings Menu
Note: The Move icon ( ) is in the settings menu header. Select this icon to move the settings left of right.
Open the Picture Settings menu:
1. Select the Tiles icon ( ).
2. Select the tile with the Waveform application.
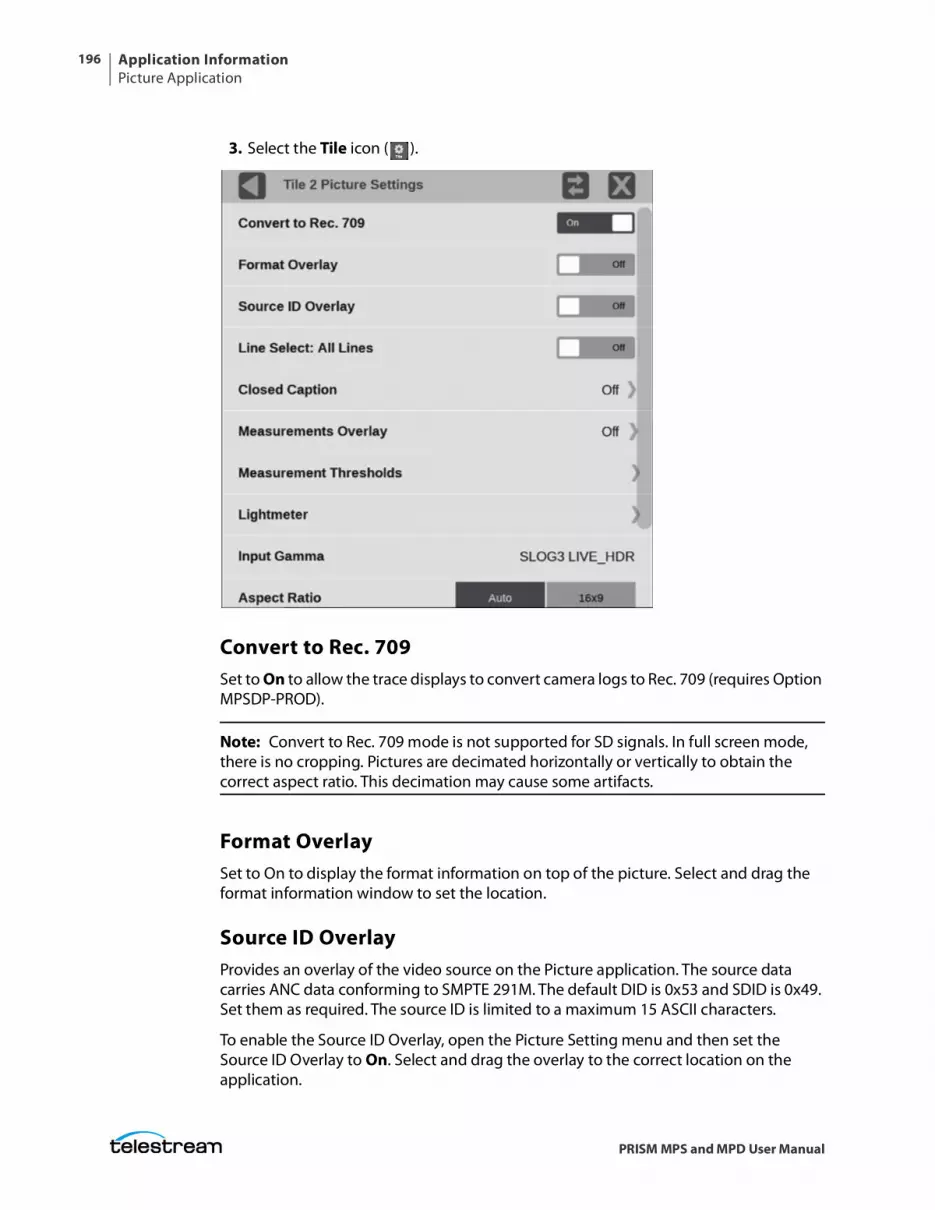
Application InformationPicture Application
196
PRISM MPS and MPD User Manual
3. Select the Tile icon ( ).
Convert to Rec. 709Set to On to allow the trace displays to convert camera logs to Rec. 709 (requires Option MPSDP-PROD).
Note: Convert to Rec. 709 mode is not supported for SD signals. In full screen mode, there is no cropping. Pictures are decimated horizontally or vertically to obtain the correct aspect ratio. This decimation may cause some artifacts.
Format OverlaySet to On to display the format information on top of the picture. Select and drag the format information window to set the location.
Source ID OverlayProvides an overlay of the video source on the Picture application. The source data carries ANC data conforming to SMPTE 291M. The default DID is 0x53 and SDID is 0x49. Set them as required. The source ID is limited to a maximum 15 ASCII characters.
To enable the Source ID Overlay, open the Picture Setting menu and then set the Source ID Overlay to On. Select and drag the overlay to the correct location on the application.
Application InformationPicture Application
197
PRISM MPS and MPD User Manual
Line SelectAllows you to select the picture line to monitor a line in the available trace displays, including Waveform, Stop, Vector, Diamond, Lightning, and CIE. Either All Lines (Line Select is Off ) or 1 Line (Line Select is On) can be selected.
If 1 Line is selected then a horizontal line appears on the picture. Select and drag the line to choose a line to monitor. The selected line number is noted on the line.
Closed CaptionSettings for closed captions/subtitles formats and services. See Closed Caption/Subtitles for more information about this feature.
Measurements OverlayThe visibility of the available picture measurements can be adjusted by selecting this menu item. See Picture Measurements for more information about this feature.
Measurement ThresholdsThreshold for the HDR picture measurements are made in this menu. See Picture Measurements for more information about this feature.
LightmeterDisplays the light level (in nits or stops) at the point marked by the Lightmeter cursor in the Picture display. (See Configure the Lightmeters.)
Input GammaReports the input Gamma set in the Settings menu for the selected input.
False ColorThree false-color displays are available, which apply a color palette to the picture to highlight attributes associated with images.
• Gamut: Used for a quick check of gamut compliance to Rec. 709 and P3 gamut limits.
• % Area: A fixed false-color palette is applied to regions of the picture: Brightest, Area, and Darkest.
• Luminance: Create a user defined false color palette based on luminance values. (See Luminance False Color.)
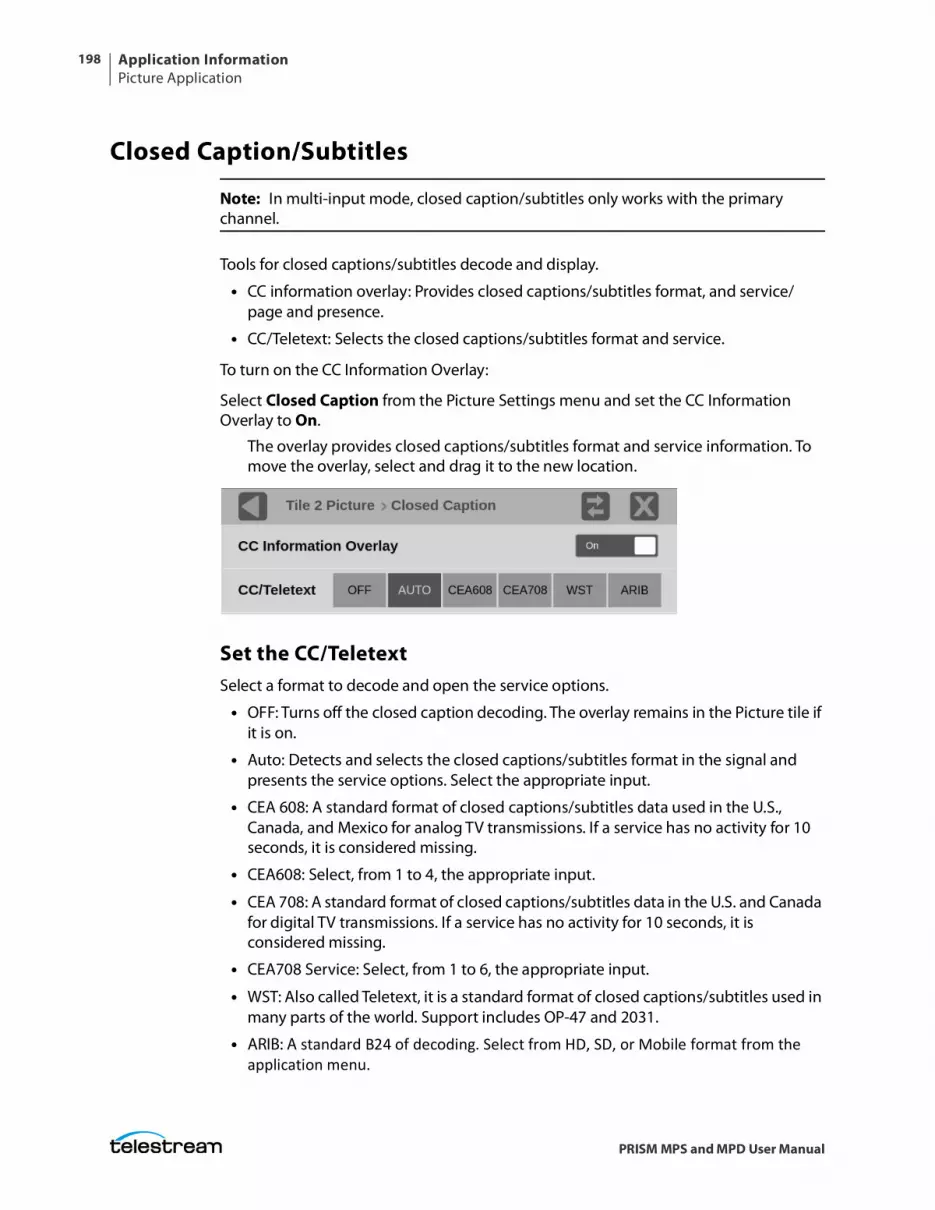
Application InformationPicture Application
198
PRISM MPS and MPD User Manual
Closed Caption/Subtitles
Note: In multi-input mode, closed caption/subtitles only works with the primary channel.
Tools for closed captions/subtitles decode and display.
• CC information overlay: Provides closed captions/subtitles format, and service/page and presence.
• CC/Teletext: Selects the closed captions/subtitles format and service.
To turn on the CC Information Overlay:
Select Closed Caption from the Picture Settings menu and set the CC Information Overlay to On.
The overlay provides closed captions/subtitles format and service information. To move the overlay, select and drag it to the new location.
Set the CC/TeletextSelect a format to decode and open the service options.
• OFF: Turns off the closed caption decoding. The overlay remains in the Picture tile if it is on.
• Auto: Detects and selects the closed captions/subtitles format in the signal and presents the service options. Select the appropriate input.
• CEA 608: A standard format of closed captions/subtitles data used in the U.S., Canada, and Mexico for analog TV transmissions. If a service has no activity for 10 seconds, it is considered missing.
• CEA608: Select, from 1 to 4, the appropriate input.
• CEA 708: A standard format of closed captions/subtitles data in the U.S. and Canada for digital TV transmissions. If a service has no activity for 10 seconds, it is considered missing.
• CEA708 Service: Select, from 1 to 6, the appropriate input.
• WST: Also called Teletext, it is a standard format of closed captions/subtitles used in many parts of the world. Support includes OP-47 and 2031.
• ARIB: A standard B24 of decoding. Select from HD, SD, or Mobile format from the application menu.
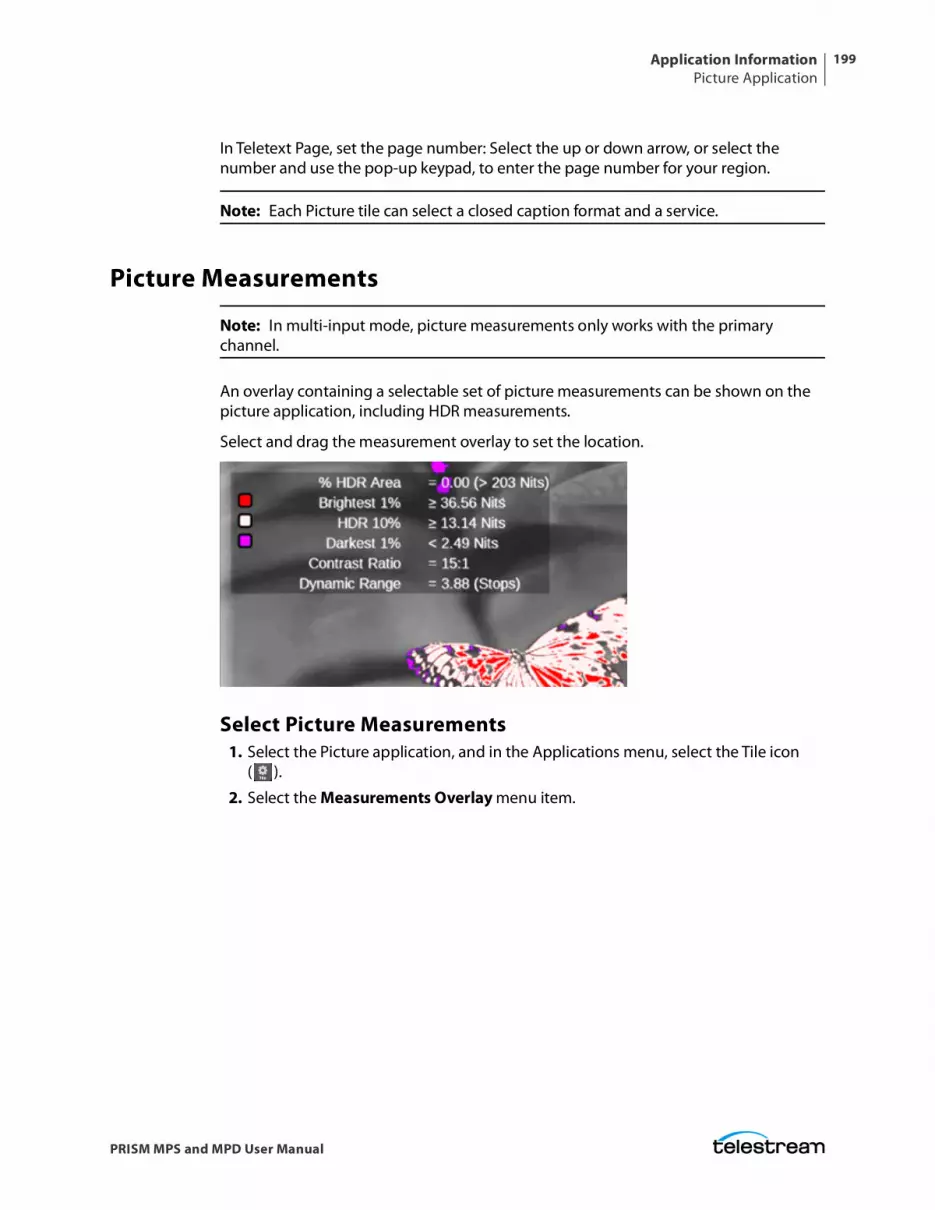
Application InformationPicture Application
199
PRISM MPS and MPD User Manual
In Teletext Page, set the page number: Select the up or down arrow, or select the number and use the pop-up keypad, to enter the page number for your region.
Note: Each Picture tile can select a closed caption format and a service.
Picture Measurements
Note: In multi-input mode, picture measurements only works with the primary channel.
An overlay containing a selectable set of picture measurements can be shown on the picture application, including HDR measurements.
Select and drag the measurement overlay to set the location.
Select Picture Measurements1. Select the Picture application, and in the Applications menu, select the Tile icon
( ).
2. Select the Measurements Overlay menu item.
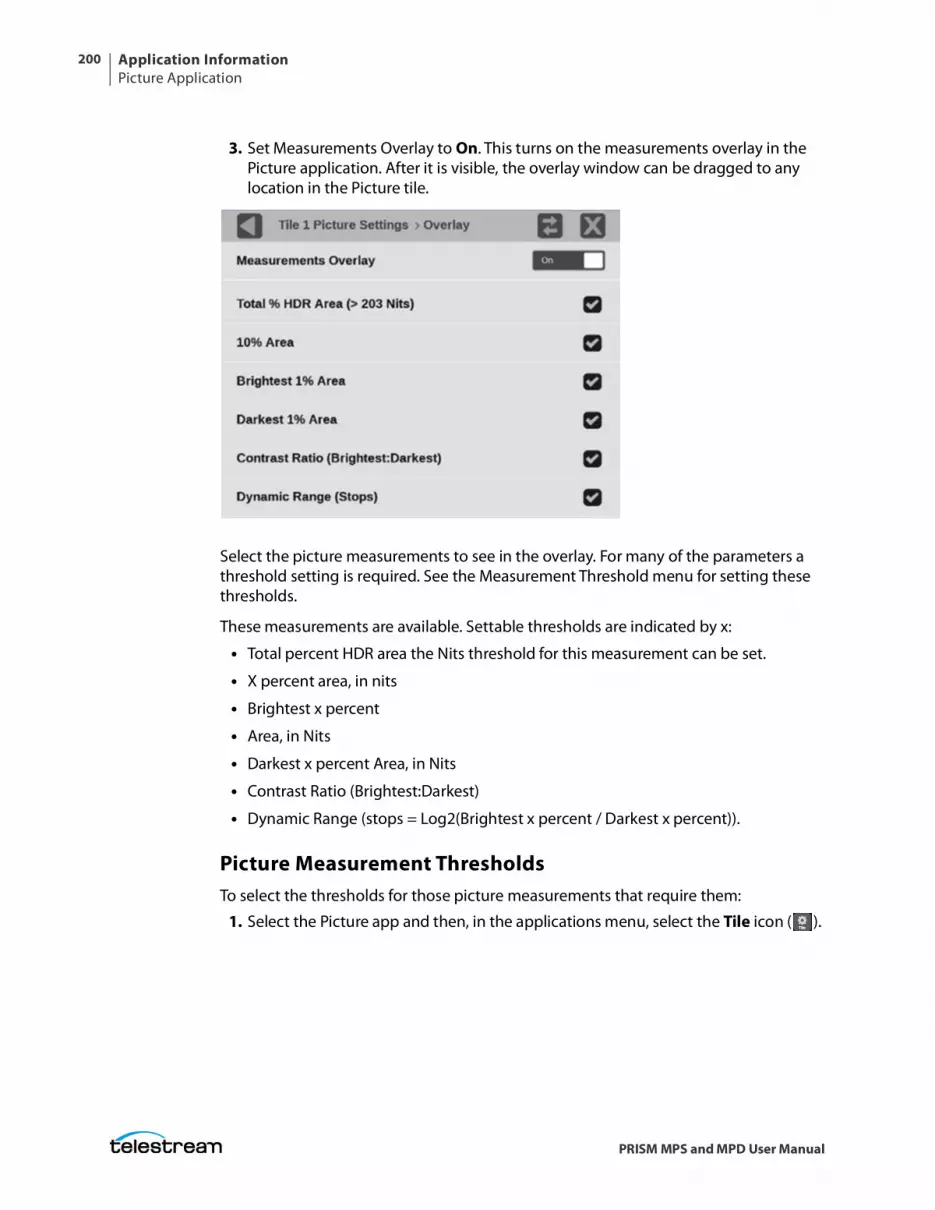
Application InformationPicture Application
200
PRISM MPS and MPD User Manual
3. Set Measurements Overlay to On. This turns on the measurements overlay in the Picture application. After it is visible, the overlay window can be dragged to any location in the Picture tile.
Select the picture measurements to see in the overlay. For many of the parameters a threshold setting is required. See the Measurement Threshold menu for setting these thresholds.
These measurements are available. Settable thresholds are indicated by x:
• Total percent HDR area the Nits threshold for this measurement can be set.
• X percent area, in nits
• Brightest x percent
• Area, in Nits
• Darkest x percent Area, in Nits
• Contrast Ratio (Brightest:Darkest)
• Dynamic Range (stops = Log2(Brightest x percent / Darkest x percent)).
Picture Measurement ThresholdsTo select the thresholds for those picture measurements that require them:
1. Select the Picture app and then, in the applications menu, select the Tile icon ( ).
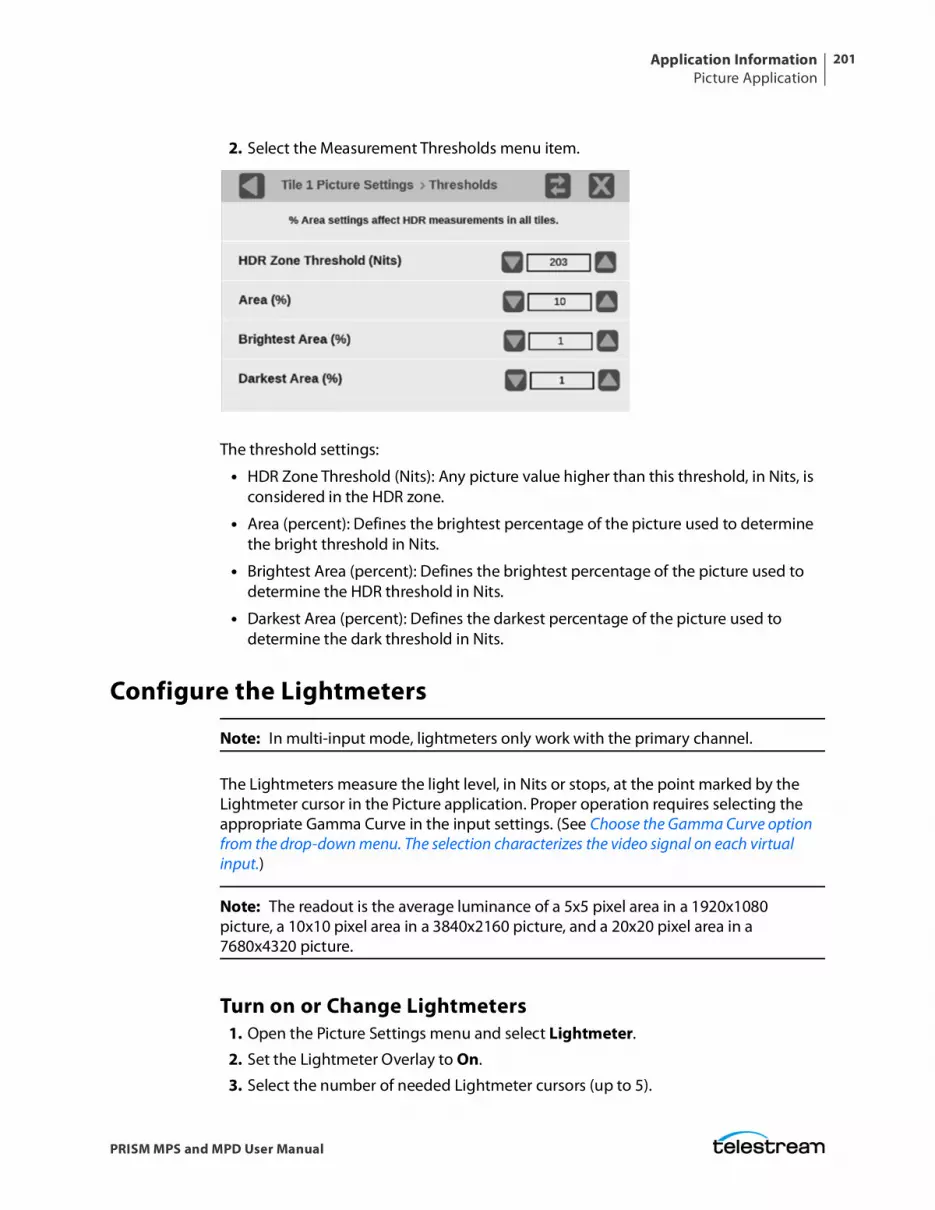
Application InformationPicture Application
201
PRISM MPS and MPD User Manual
2. Select the Measurement Thresholds menu item.
The threshold settings:
• HDR Zone Threshold (Nits): Any picture value higher than this threshold, in Nits, is considered in the HDR zone.
• Area (percent): Defines the brightest percentage of the picture used to determine the bright threshold in Nits.
• Brightest Area (percent): Defines the brightest percentage of the picture used to determine the HDR threshold in Nits.
• Darkest Area (percent): Defines the darkest percentage of the picture used to determine the dark threshold in Nits.
Configure the Lightmeters
Note: In multi-input mode, lightmeters only work with the primary channel.
The Lightmeters measure the light level, in Nits or stops, at the point marked by the Lightmeter cursor in the Picture application. Proper operation requires selecting the appropriate Gamma Curve in the input settings. (See Choose the Gamma Curve option from the drop-down menu. The selection characterizes the video signal on each virtual input.)
Note: The readout is the average luminance of a 5x5 pixel area in a 1920x1080 picture, a 10x10 pixel area in a 3840x2160 picture, and a 20x20 pixel area in a 7680x4320 picture.
Turn on or Change Lightmeters1. Open the Picture Settings menu and select Lightmeter.
2. Set the Lightmeter Overlay to On.
3. Select the number of needed Lightmeter cursors (up to 5).
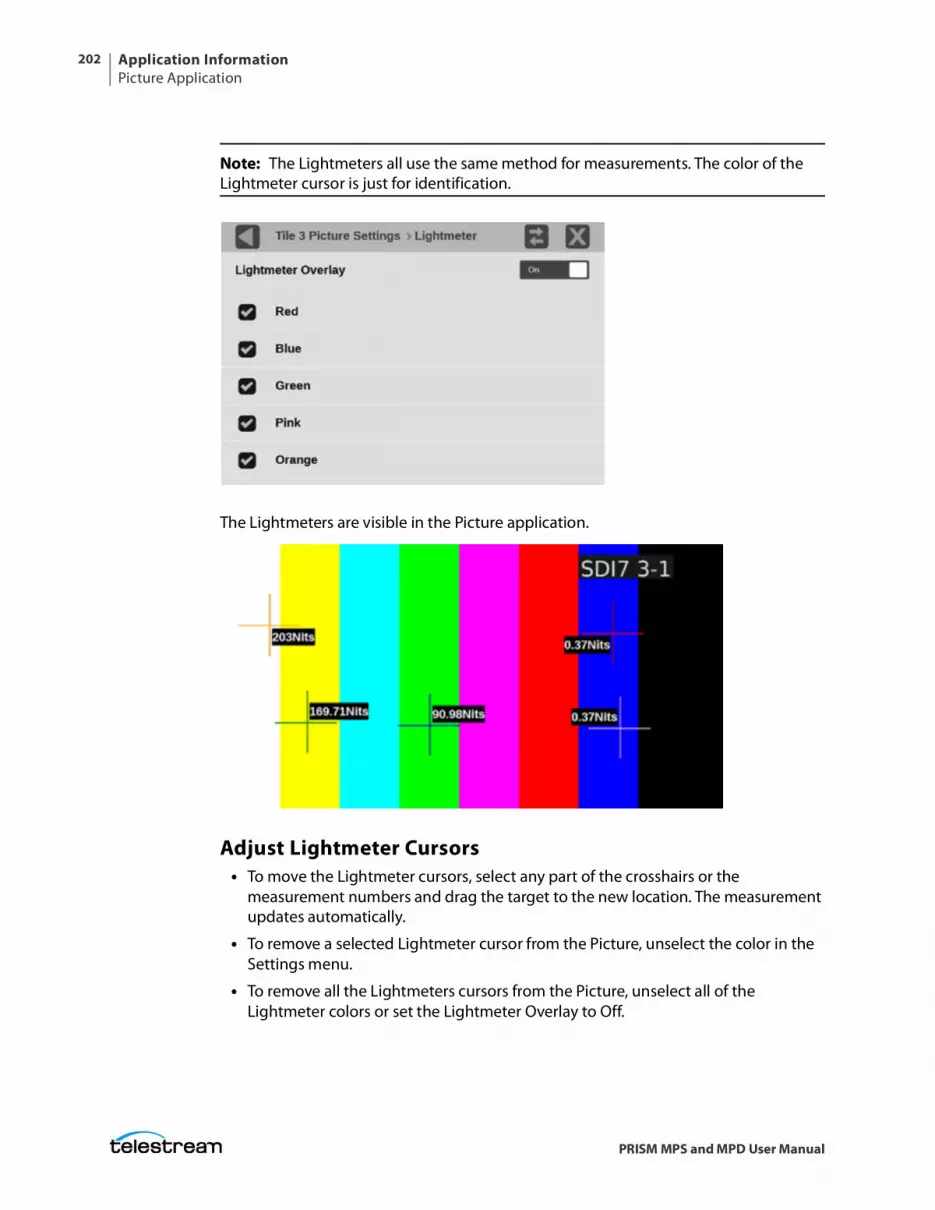
Application InformationPicture Application
202
PRISM MPS and MPD User Manual
Note: The Lightmeters all use the same method for measurements. The color of the Lightmeter cursor is just for identification.
The Lightmeters are visible in the Picture application.
Adjust Lightmeter Cursors• To move the Lightmeter cursors, select any part of the crosshairs or the
measurement numbers and drag the target to the new location. The measurement updates automatically.
• To remove a selected Lightmeter cursor from the Picture, unselect the color in the Settings menu.
• To remove all the Lightmeters cursors from the Picture, unselect all of the Lightmeter colors or set the Lightmeter Overlay to Off.
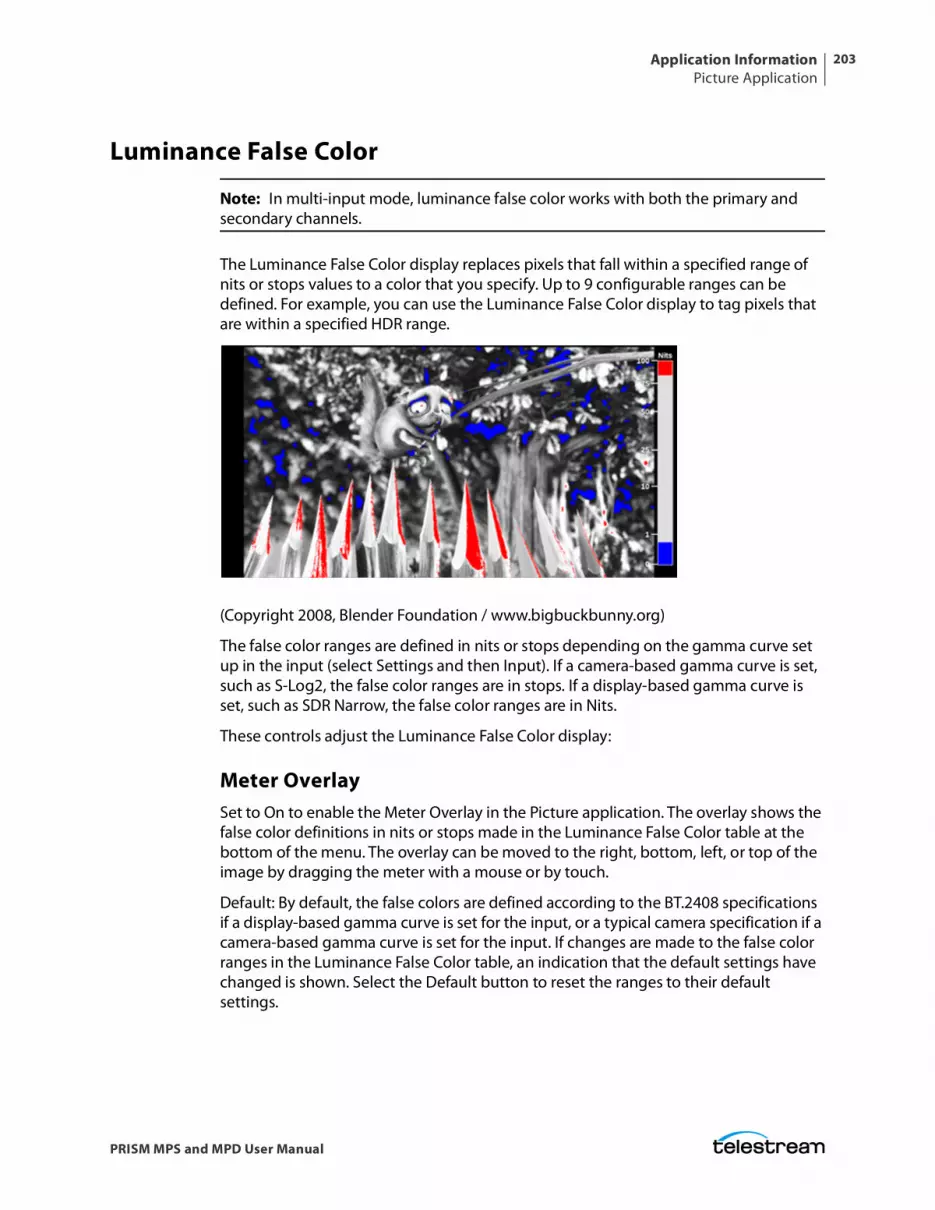
Application InformationPicture Application
203
PRISM MPS and MPD User Manual
Luminance False Color
Note: In multi-input mode, luminance false color works with both the primary and secondary channels.
The Luminance False Color display replaces pixels that fall within a specified range of nits or stops values to a color that you specify. Up to 9 configurable ranges can be defined. For example, you can use the Luminance False Color display to tag pixels that are within a specified HDR range.
(Copyright 2008, Blender Foundation / www.bigbuckbunny.org)
The false color ranges are defined in nits or stops depending on the gamma curve set up in the input (select Settings and then Input). If a camera-based gamma curve is set, such as S-Log2, the false color ranges are in stops. If a display-based gamma curve is set, such as SDR Narrow, the false color ranges are in Nits.
These controls adjust the Luminance False Color display:
Meter OverlaySet to On to enable the Meter Overlay in the Picture application. The overlay shows the false color definitions in nits or stops made in the Luminance False Color table at the bottom of the menu. The overlay can be moved to the right, bottom, left, or top of the image by dragging the meter with a mouse or by touch.
Default: By default, the false colors are defined according to the BT.2408 specifications if a display-based gamma curve is set for the input, or a typical camera specification if a camera-based gamma curve is set for the input. If changes are made to the false color ranges in the Luminance False Color table, an indication that the default settings have changed is shown. Select the Default button to reset the ranges to their default settings.
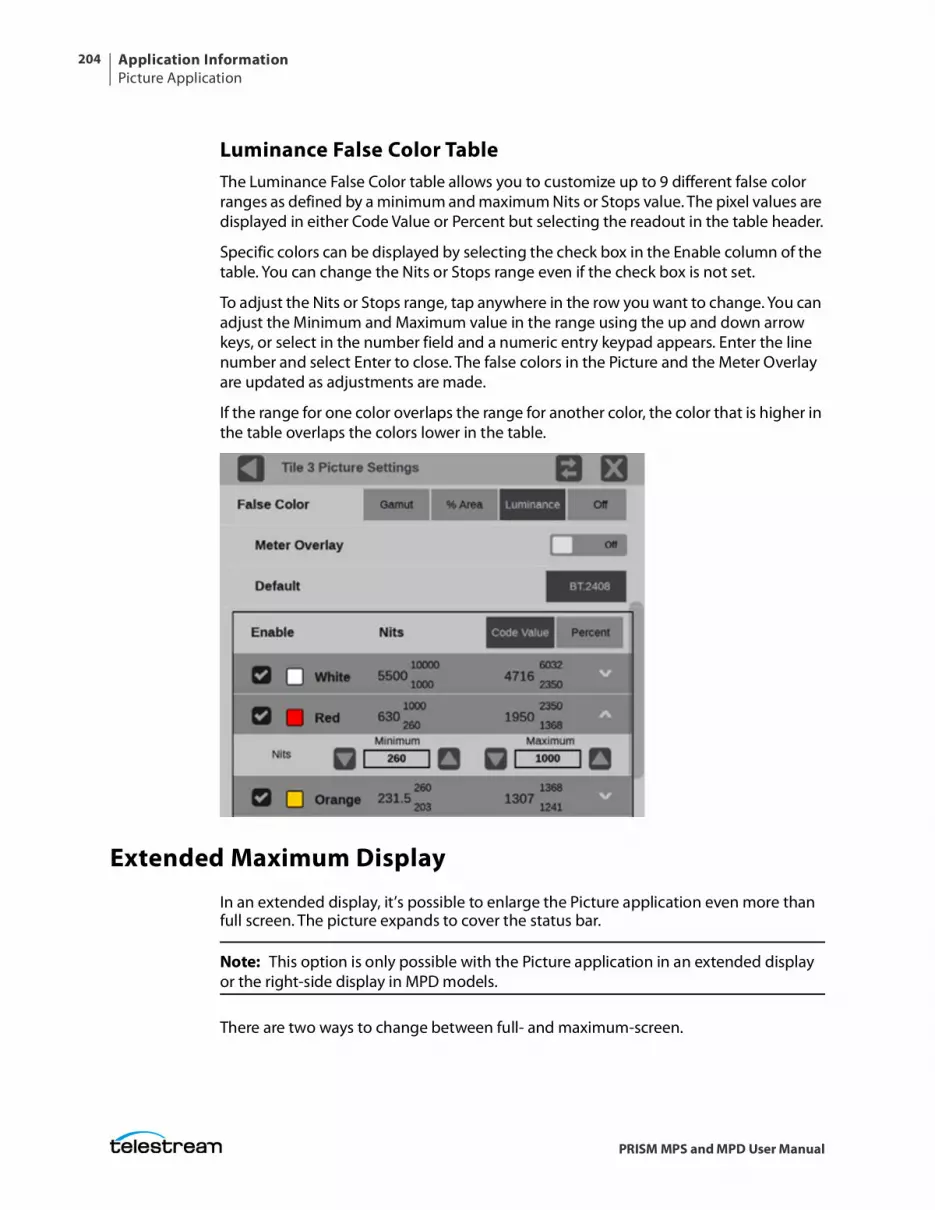
Application InformationPicture Application
204
PRISM MPS and MPD User Manual
Luminance False Color TableThe Luminance False Color table allows you to customize up to 9 different false color ranges as defined by a minimum and maximum Nits or Stops value. The pixel values are displayed in either Code Value or Percent but selecting the readout in the table header.
Specific colors can be displayed by selecting the check box in the Enable column of the table. You can change the Nits or Stops range even if the check box is not set.
To adjust the Nits or Stops range, tap anywhere in the row you want to change. You can adjust the Minimum and Maximum value in the range using the up and down arrow keys, or select in the number field and a numeric entry keypad appears. Enter the line number and select Enter to close. The false colors in the Picture and the Meter Overlay are updated as adjustments are made.
If the range for one color overlaps the range for another color, the color that is higher in the table overlaps the colors lower in the table.
Extended Maximum Display
In an extended display, it’s possible to enlarge the Picture application even more than full screen. The picture expands to cover the status bar.
Note: This option is only possible with the Picture application in an extended display or the right-side display in MPD models.
There are two ways to change between full- and maximum-screen.
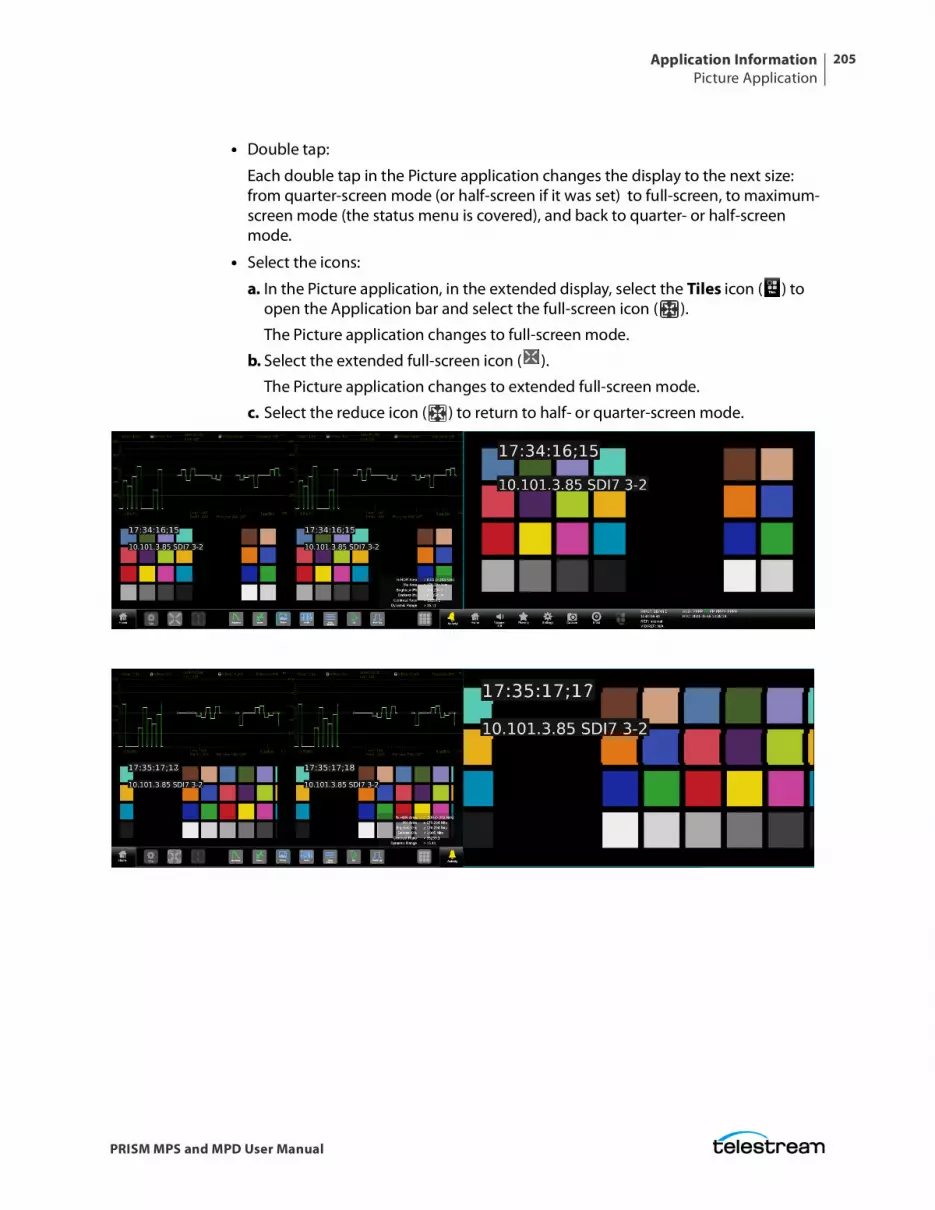
Application InformationPicture Application
205
PRISM MPS and MPD User Manual
• Double tap:
Each double tap in the Picture application changes the display to the next size: from quarter-screen mode (or half-screen if it was set) to full-screen, to maximum-screen mode (the status menu is covered), and back to quarter- or half-screen mode.
• Select the icons:
a. In the Picture application, in the extended display, select the Tiles icon ( ) to open the Application bar and select the full-screen icon ( ).
The Picture application changes to full-screen mode.
b. Select the extended full-screen icon ( ).
The Picture application changes to extended full-screen mode.
c. Select the reduce icon ( ) to return to half- or quarter-screen mode.
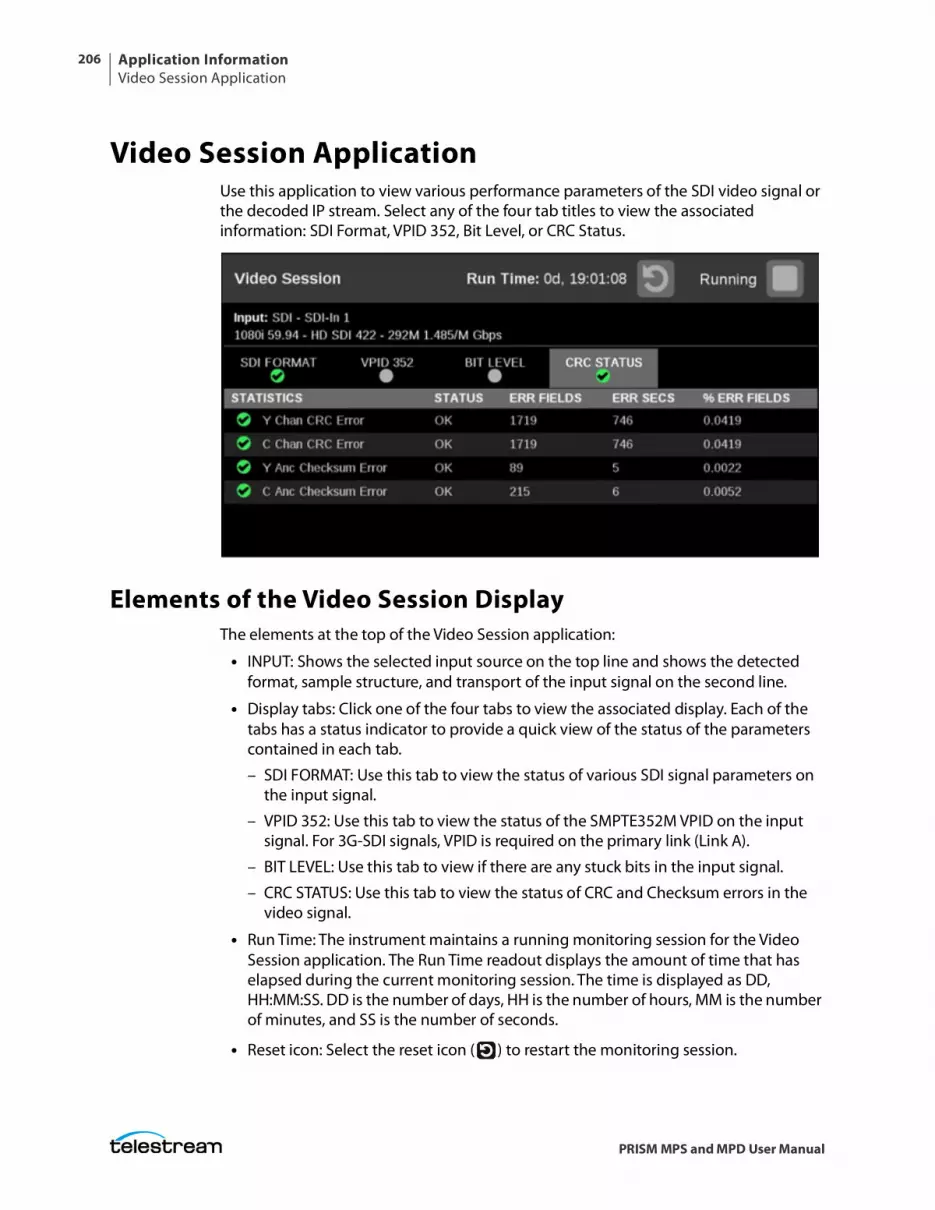
Application InformationVideo Session Application
206
PRISM MPS and MPD User Manual
Video Session ApplicationUse this application to view various performance parameters of the SDI video signal or the decoded IP stream. Select any of the four tab titles to view the associated information: SDI Format, VPID 352, Bit Level, or CRC Status.
Elements of the Video Session DisplayThe elements at the top of the Video Session application:
• INPUT: Shows the selected input source on the top line and shows the detected format, sample structure, and transport of the input signal on the second line.
• Display tabs: Click one of the four tabs to view the associated display. Each of the tabs has a status indicator to provide a quick view of the status of the parameters contained in each tab.
– SDI FORMAT: Use this tab to view the status of various SDI signal parameters on the input signal.
– VPID 352: Use this tab to view the status of the SMPTE352M VPID on the input signal. For 3G-SDI signals, VPID is required on the primary link (Link A).
– BIT LEVEL: Use this tab to view if there are any stuck bits in the input signal.
– CRC STATUS: Use this tab to view the status of CRC and Checksum errors in the video signal.
• Run Time: The instrument maintains a running monitoring session for the Video Session application. The Run Time readout displays the amount of time that has elapsed during the current monitoring session. The time is displayed as DD, HH:MM:SS. DD is the number of days, HH is the number of hours, MM is the number of minutes, and SS is the number of seconds.
• Reset icon: Select the reset icon ( ) to restart the monitoring session.
Application InformationVideo Session Application
207
PRISM MPS and MPD User Manual
• Run / Stop icons: When the monitoring session is running (collecting error data), select the Stop icon ( ) to stop the session. When the monitoring session is stopped (no error data collection and no display updates), select the Play icon ( ) to restart the session.
SDI FORMAT Tab DisplayUse the SDI FORMAT tab display to view the status of various SDI signal parameters on the input signal.
Elements of the SDI FORMAT tab display
• SAV Place Err: Indicates whether a Start-of-Active-Video Placement error has occurred.
• EAV Place Err: Indicates whether an End-of-Active-Video Placement error has occurred.
• Field Length Err: Indicates whether a Field Length error has occurred.
• Line Length Err: Indicates whether a Line Length error has occurred.
• Line Number Err: Indicates whether a Line Number error has occurred.
• Ancillary Data: Indicates whether Ancillary Data is present in the video signal. The displayed values are either Present or None for SD signals, or Y and C Present and None for HD and 3 Gb/s signals.
• Statistics: This section of the display shows the status and statistical values for certain errors. For information about the errors in this section, view the help file in your instrument: When the Video Session is active in a tile, select the HELP button.
• Status: Shows the status of the associated error as either OK, Invalid, Missing, or Error.
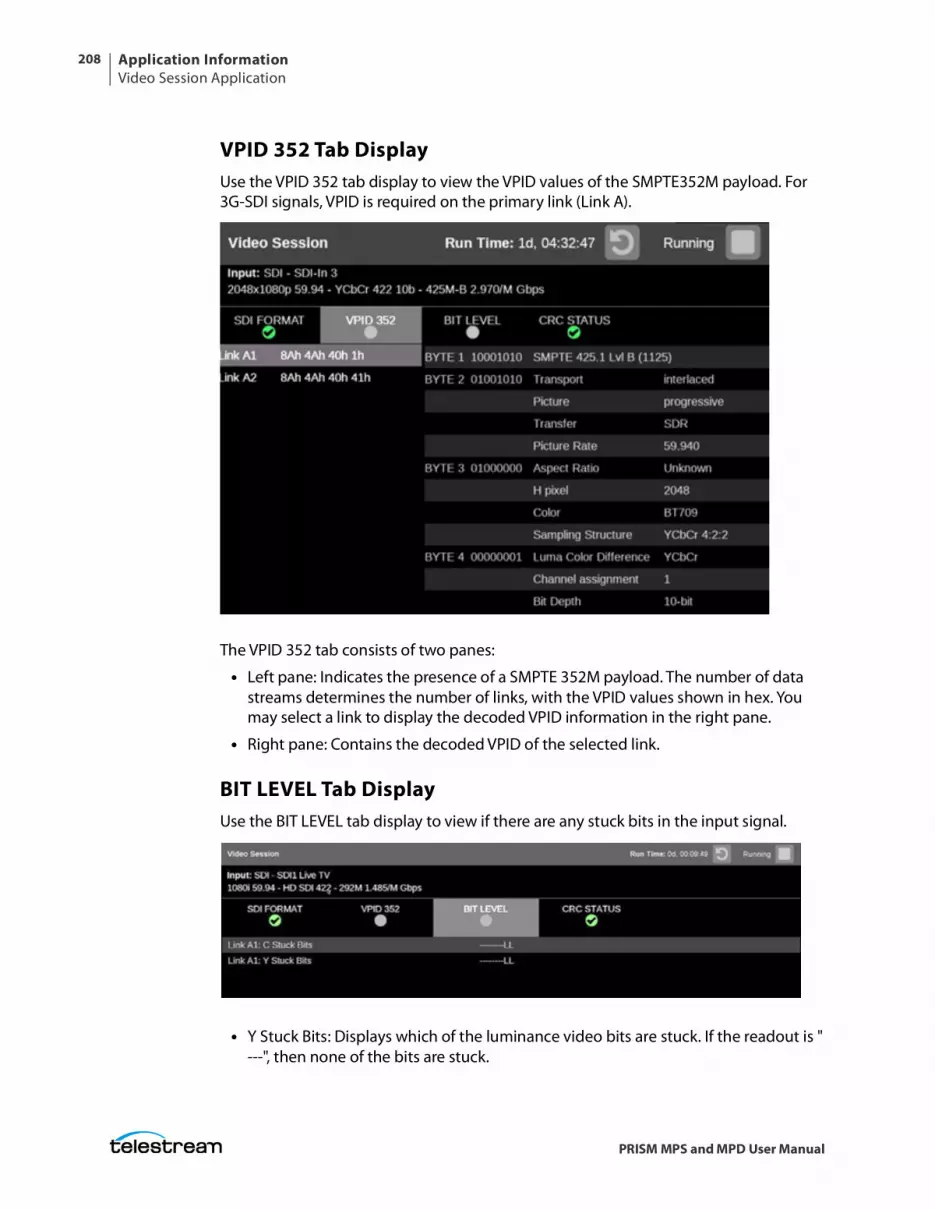
Application InformationVideo Session Application
208
PRISM MPS and MPD User Manual
VPID 352 Tab DisplayUse the VPID 352 tab display to view the VPID values of the SMPTE352M payload. For 3G-SDI signals, VPID is required on the primary link (Link A).
The VPID 352 tab consists of two panes:
• Left pane: Indicates the presence of a SMPTE 352M payload. The number of data streams determines the number of links, with the VPID values shown in hex. You may select a link to display the decoded VPID information in the right pane.
• Right pane: Contains the decoded VPID of the selected link.
BIT LEVEL Tab DisplayUse the BIT LEVEL tab display to view if there are any stuck bits in the input signal.
• Y Stuck Bits: Displays which of the luminance video bits are stuck. If the readout is "---", then none of the bits are stuck.
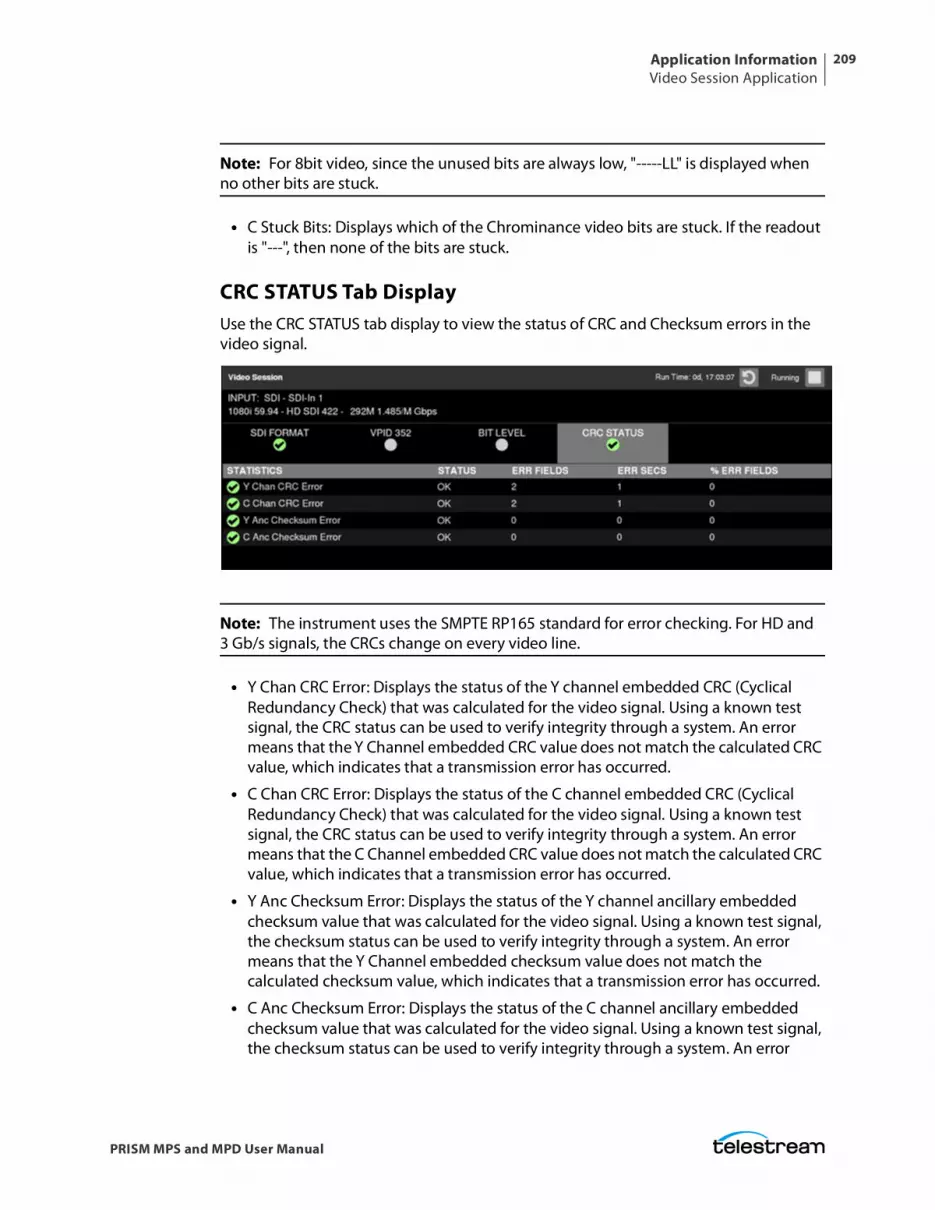
Application InformationVideo Session Application
209
PRISM MPS and MPD User Manual
Note: For 8bit video, since the unused bits are always low, "-----LL" is displayed when no other bits are stuck.
• C Stuck Bits: Displays which of the Chrominance video bits are stuck. If the readout is "---", then none of the bits are stuck.
CRC STATUS Tab DisplayUse the CRC STATUS tab display to view the status of CRC and Checksum errors in the video signal.
Note: The instrument uses the SMPTE RP165 standard for error checking. For HD and 3 Gb/s signals, the CRCs change on every video line.
• Y Chan CRC Error: Displays the status of the Y channel embedded CRC (Cyclical Redundancy Check) that was calculated for the video signal. Using a known test signal, the CRC status can be used to verify integrity through a system. An error means that the Y Channel embedded CRC value does not match the calculated CRC value, which indicates that a transmission error has occurred.
• C Chan CRC Error: Displays the status of the C channel embedded CRC (Cyclical Redundancy Check) that was calculated for the video signal. Using a known test signal, the CRC status can be used to verify integrity through a system. An error means that the C Channel embedded CRC value does not match the calculated CRC value, which indicates that a transmission error has occurred.
• Y Anc Checksum Error: Displays the status of the Y channel ancillary embedded checksum value that was calculated for the video signal. Using a known test signal, the checksum status can be used to verify integrity through a system. An error means that the Y Channel embedded checksum value does not match the calculated checksum value, which indicates that a transmission error has occurred.
• C Anc Checksum Error: Displays the status of the C channel ancillary embedded checksum value that was calculated for the video signal. Using a known test signal, the checksum status can be used to verify integrity through a system. An error

Application InformationVideo Session Application
210
PRISM MPS and MPD User Manual
means that the C Channel embedded checksum value does not match the calculated checksum value, which indicates that a transmission error has occurred.
The CRC Status display is also divided into four columns:
• Status: Shows the status of the associated error:
– OK: No error is currently detected.
– Invalid: The data for the item is currently invalid.
– Missing: The data for the item is currently missing.
– Error: The associated error is currently in an error state.
• Err Fields: The number of fields, since the last reset, that contained at least one error.
• Err Secs: The number of seconds, since the last reset, that contained at least one error.
• % Err Fields: Shows a calculated number showing the percentage of all fields since the last reset that contained at least one error.
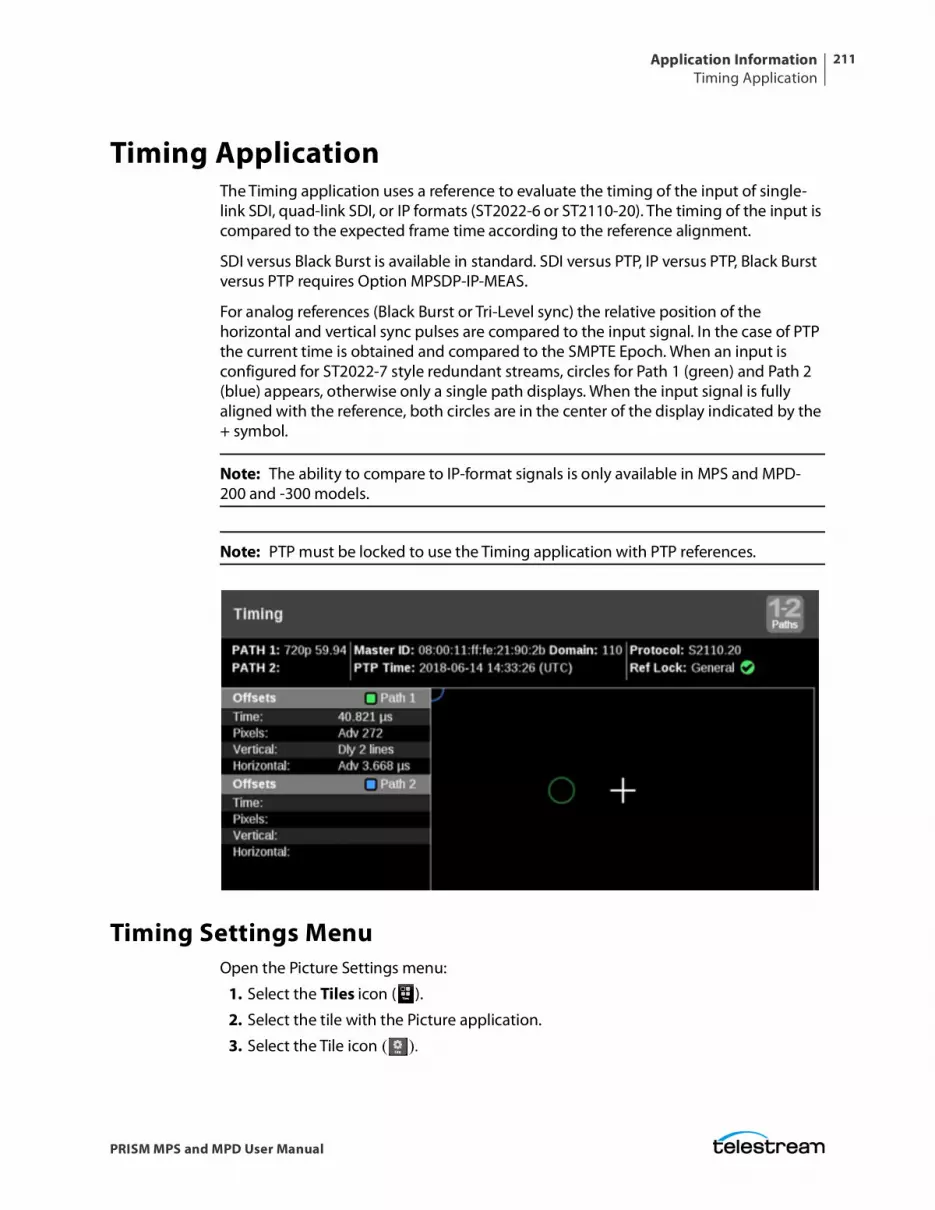
Application InformationTiming Application
211
PRISM MPS and MPD User Manual
Timing ApplicationThe Timing application uses a reference to evaluate the timing of the input of single-link SDI, quad-link SDI, or IP formats (ST2022-6 or ST2110-20). The timing of the input is compared to the expected frame time according to the reference alignment.
SDI versus Black Burst is available in standard. SDI versus PTP, IP versus PTP, Black Burst versus PTP requires Option MPSDP-IP-MEAS.
For analog references (Black Burst or Tri-Level sync) the relative position of the horizontal and vertical sync pulses are compared to the input signal. In the case of PTP the current time is obtained and compared to the SMPTE Epoch. When an input is configured for ST2022-7 style redundant streams, circles for Path 1 (green) and Path 2 (blue) appears, otherwise only a single path displays. When the input signal is fully aligned with the reference, both circles are in the center of the display indicated by the + symbol.
Note: The ability to compare to IP-format signals is only available in MPS and MPD-200 and -300 models.
Note: PTP must be locked to use the Timing application with PTP references.
Timing Settings MenuOpen the Picture Settings menu:
1. Select the Tiles icon ( ).
2. Select the tile with the Picture application.
3. Select the Tile icon ( ).
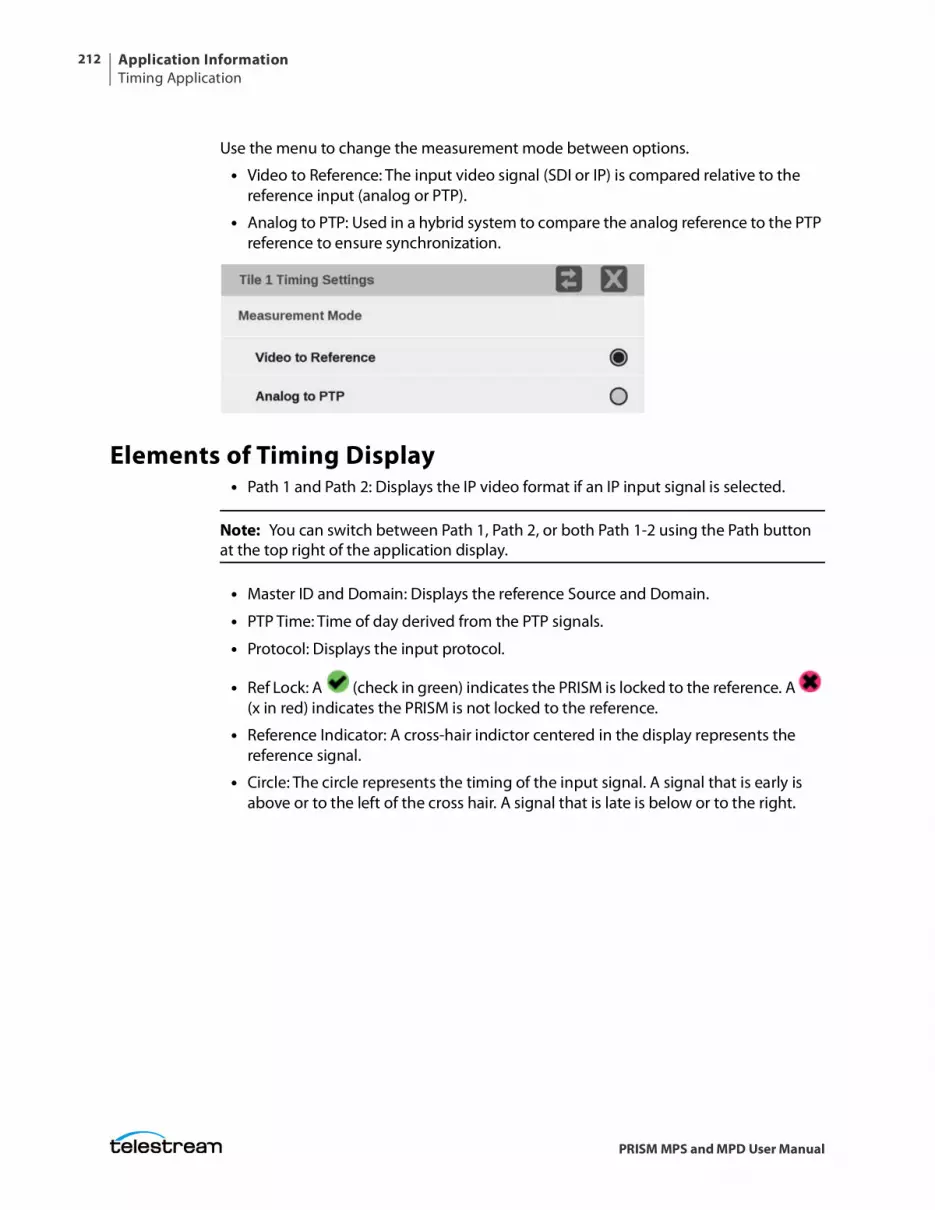
Application InformationTiming Application
212
PRISM MPS and MPD User Manual
Use the menu to change the measurement mode between options.
• Video to Reference: The input video signal (SDI or IP) is compared relative to the reference input (analog or PTP).
• Analog to PTP: Used in a hybrid system to compare the analog reference to the PTP reference to ensure synchronization.
Elements of Timing Display• Path 1 and Path 2: Displays the IP video format if an IP input signal is selected.
Note: You can switch between Path 1, Path 2, or both Path 1-2 using the Path button at the top right of the application display.
• Master ID and Domain: Displays the reference Source and Domain.
• PTP Time: Time of day derived from the PTP signals.
• Protocol: Displays the input protocol.
• Ref Lock: A (check in green) indicates the PRISM is locked to the reference. A (x in red) indicates the PRISM is not locked to the reference.
• Reference Indicator: A cross-hair indictor centered in the display represents the reference signal.
• Circle: The circle represents the timing of the input signal. A signal that is early is above or to the left of the cross hair. A signal that is late is below or to the right.
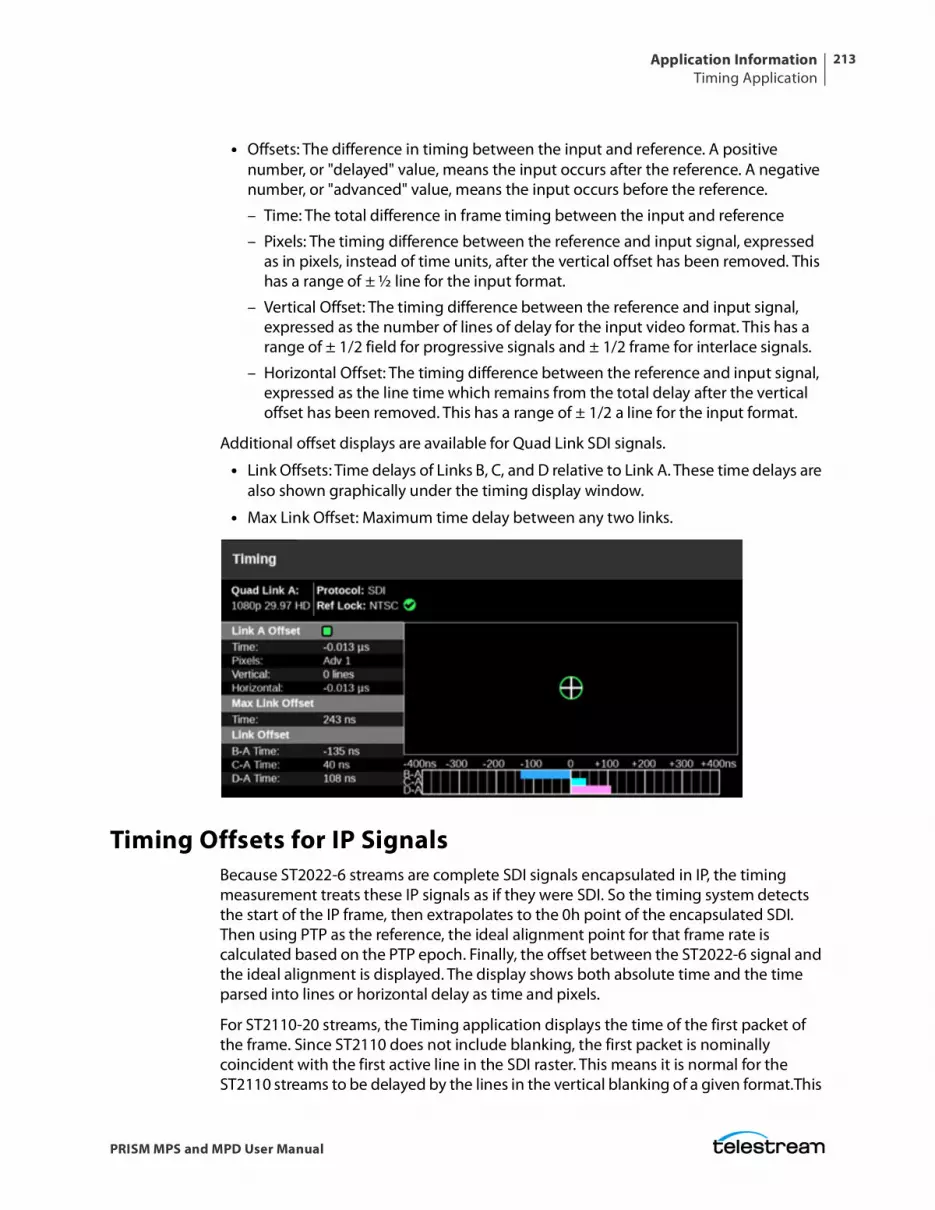
Application InformationTiming Application
213
PRISM MPS and MPD User Manual
• Offsets: The difference in timing between the input and reference. A positive number, or "delayed" value, means the input occurs after the reference. A negative number, or "advanced" value, means the input occurs before the reference.
– Time: The total difference in frame timing between the input and reference
– Pixels: The timing difference between the reference and input signal, expressed as in pixels, instead of time units, after the vertical offset has been removed. This has a range of ± ½ line for the input format.
– Vertical Offset: The timing difference between the reference and input signal, expressed as the number of lines of delay for the input video format. This has a range of ± 1/2 field for progressive signals and ± 1/2 frame for interlace signals.
– Horizontal Offset: The timing difference between the reference and input signal, expressed as the line time which remains from the total delay after the vertical offset has been removed. This has a range of ± 1/2 a line for the input format.
Additional offset displays are available for Quad Link SDI signals.
• Link Offsets: Time delays of Links B, C, and D relative to Link A. These time delays are also shown graphically under the timing display window.
• Max Link Offset: Maximum time delay between any two links.
Timing Offsets for IP SignalsBecause ST2022-6 streams are complete SDI signals encapsulated in IP, the timing measurement treats these IP signals as if they were SDI. So the timing system detects the start of the IP frame, then extrapolates to the 0h point of the encapsulated SDI. Then using PTP as the reference, the ideal alignment point for that frame rate is calculated based on the PTP epoch. Finally, the offset between the ST2022-6 signal and the ideal alignment is displayed. The display shows both absolute time and the time parsed into lines or horizontal delay as time and pixels.
For ST2110-20 streams, the Timing application displays the time of the first packet of the frame. Since ST2110 does not include blanking, the first packet is nominally coincident with the first active line in the SDI raster. This means it is normal for the ST2110 streams to be delayed by the lines in the vertical blanking of a given format.This
Application InformationTiming Application
214
PRISM MPS and MPD User Manual
value varies by format: HD (21 lines), 3G (42 lines), 4K/UHD (84 lines). According to ST2110-21, both gapped and linear flows should have the start of frame delayed by the equivalent of vertical blanking.
Use Cases for Measuring TimingOne use case for the Timing application is to measure the delay in a gateway and network. If a properly timed SDI signal is applied to a gateway, then the timing measurement on the resulting IP flow displays the combined latency in the gateway and the network.
Each ST2110 stream also carries time stamps. The Stream Timing application allows for the analysis of these time stamps.
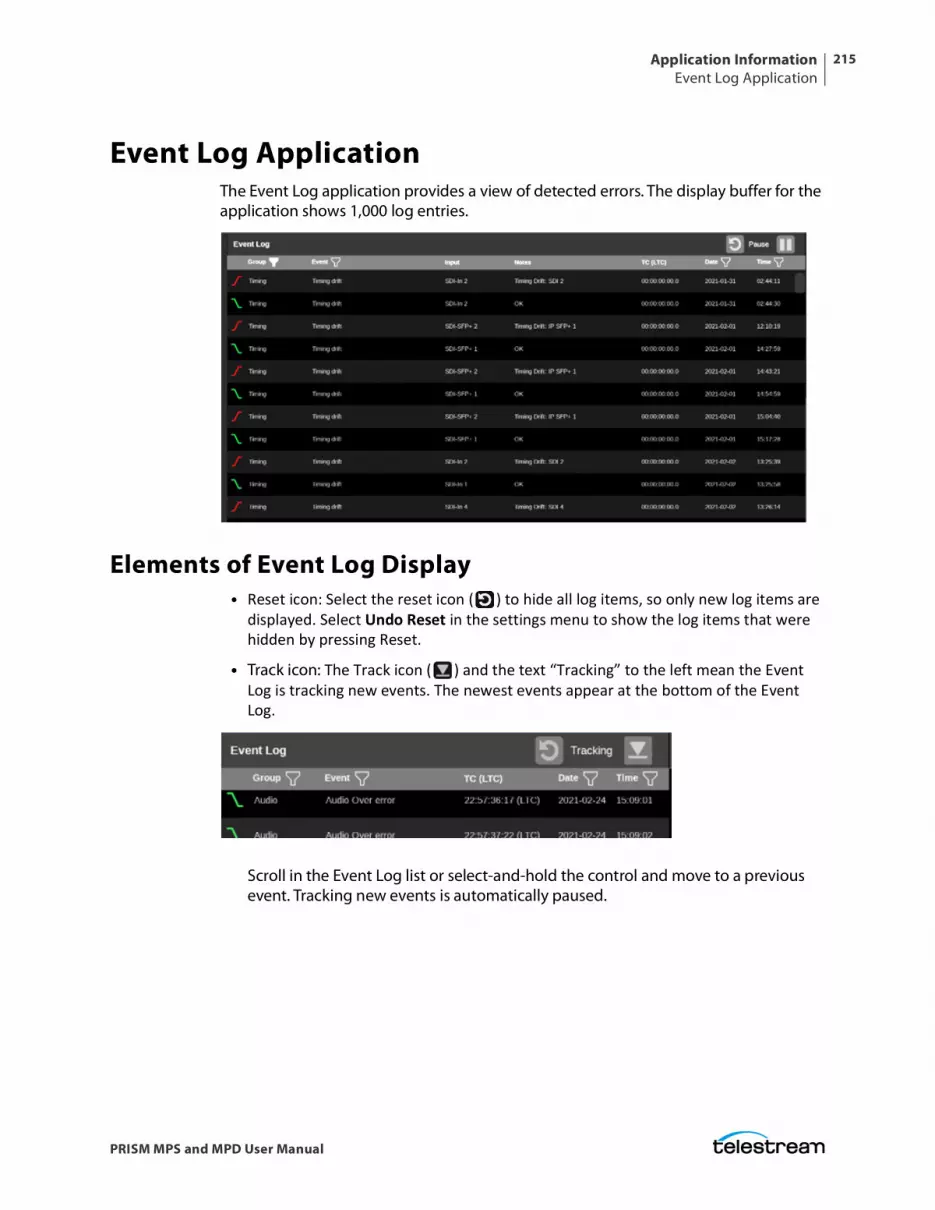
Application InformationEvent Log Application
215
PRISM MPS and MPD User Manual
Event Log ApplicationThe Event Log application provides a view of detected errors. The display buffer for the application shows 1,000 log entries.
Elements of Event Log Display• Reset icon: Select the reset icon ( ) to hide all log items, so only new log items are
displayed. Select Undo Reset in the settings menu to show the log items that were hidden by pressing Reset.
• Track icon: The Track icon ( ) and the text “Tracking” to the left mean the Event Log is tracking new events. The newest events appear at the bottom of the Event Log.
Scroll in the Event Log list or select-and-hold the control and move to a previous event. Tracking new events is automatically paused.
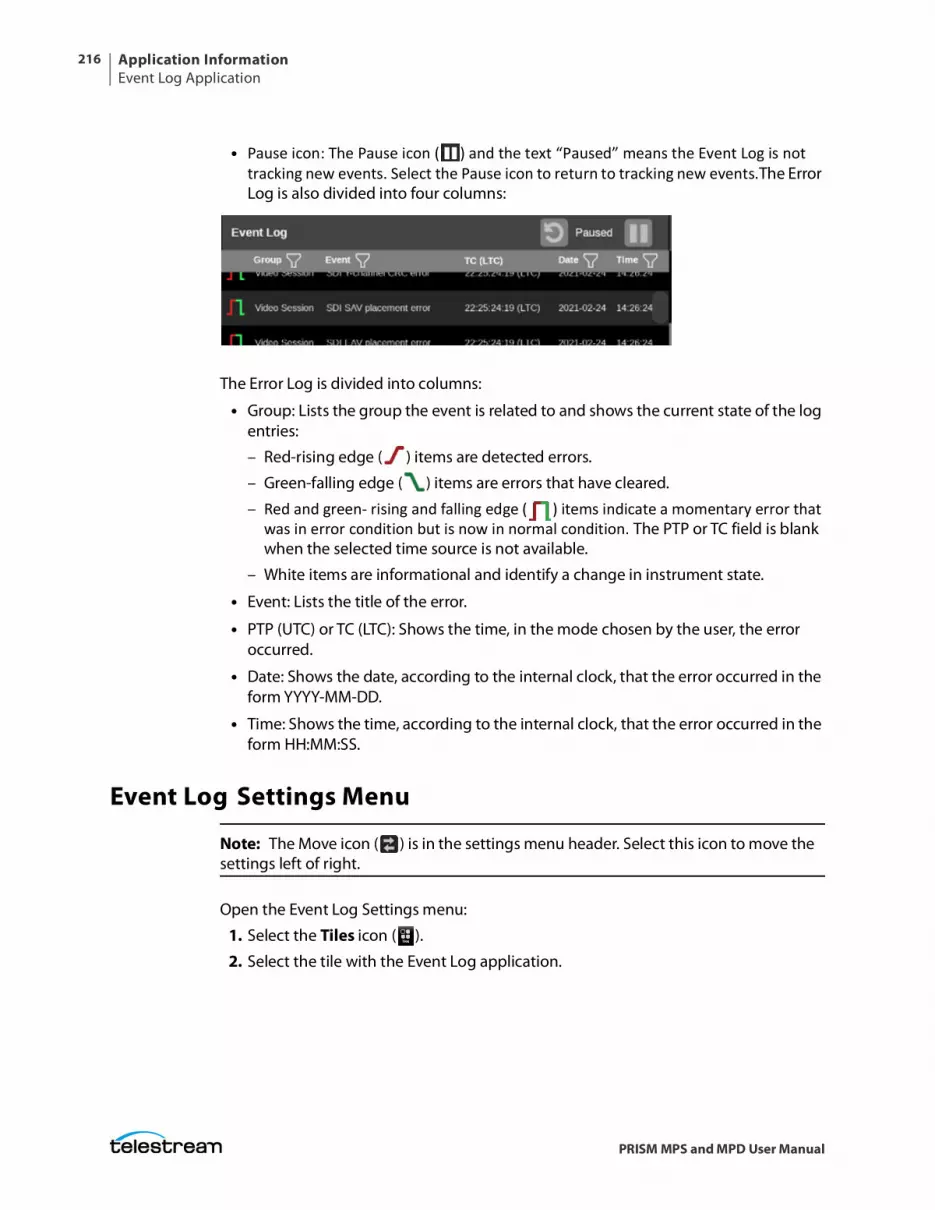
Application InformationEvent Log Application
216
PRISM MPS and MPD User Manual
• Pause icon: The Pause icon ( ) and the text “Paused” means the Event Log is not tracking new events. Select the Pause icon to return to tracking new events.The Error Log is also divided into four columns:
The Error Log is divided into columns:
• Group: Lists the group the event is related to and shows the current state of the log entries:
– Red-rising edge ( ) items are detected errors.
– Green-falling edge ( ) items are errors that have cleared.
– Red and green- rising and falling edge ( ) items indicate a momentary error that was in error condition but is now in normal condition. The PTP or TC field is blank when the selected time source is not available.
– White items are informational and identify a change in instrument state.
• Event: Lists the title of the error.
• PTP (UTC) or TC (LTC): Shows the time, in the mode chosen by the user, the error occurred.
• Date: Shows the date, according to the internal clock, that the error occurred in the form YYYY-MM-DD.
• Time: Shows the time, according to the internal clock, that the error occurred in the form HH:MM:SS.
Event Log Settings Menu
Note: The Move icon ( ) is in the settings menu header. Select this icon to move the settings left of right.
Open the Event Log Settings menu:
1. Select the Tiles icon ( ).
2. Select the tile with the Event Log application.
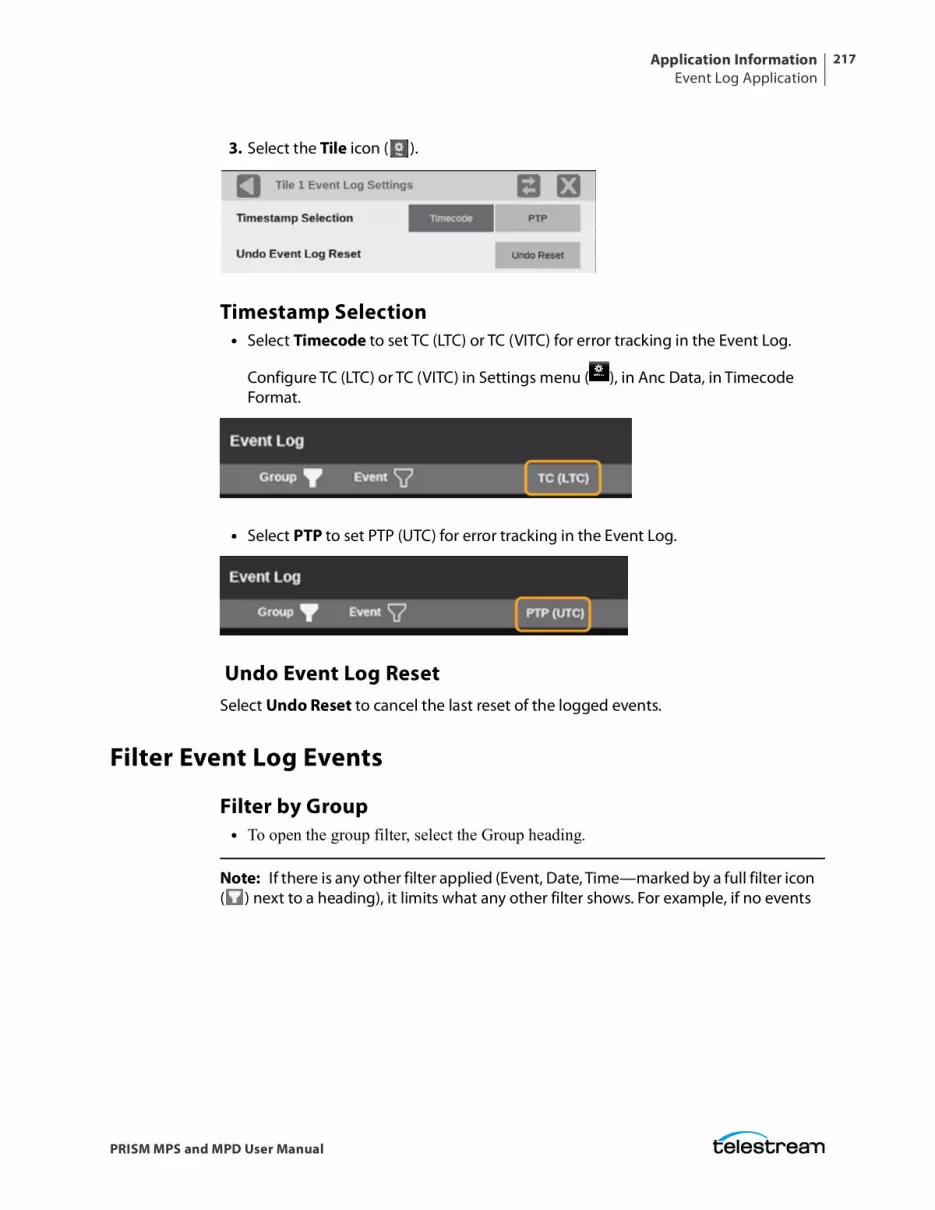
Application InformationEvent Log Application
217
PRISM MPS and MPD User Manual
3. Select the Tile icon ( ).
Timestamp Selection• Select Timecode to set TC (LTC) or TC (VITC) for error tracking in the Event Log.
Configure TC (LTC) or TC (VITC) in Settings menu ( ), in Anc Data, in Timecode Format.
• Select PTP to set PTP (UTC) for error tracking in the Event Log.
Undo Event Log ResetSelect Undo Reset to cancel the last reset of the logged events.
Filter Event Log Events
Filter by Group• To open the group filter, select the Group heading.
Note: If there is any other filter applied (Event, Date, Time—marked by a full filter icon ( ) next to a heading), it limits what any other filter shows. For example, if no events
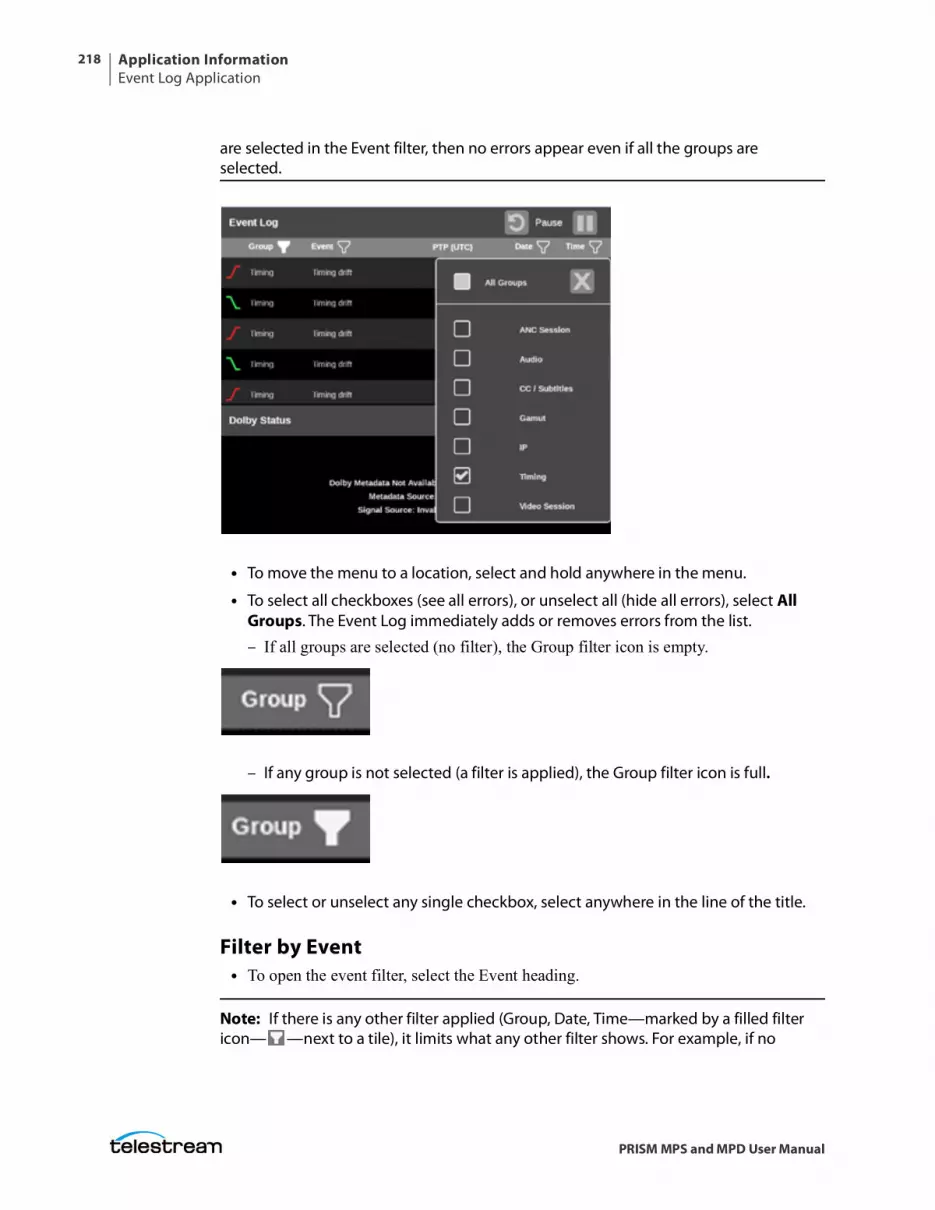
Application InformationEvent Log Application
218
PRISM MPS and MPD User Manual
are selected in the Event filter, then no errors appear even if all the groups are selected.
• To move the menu to a location, select and hold anywhere in the menu.
• To select all checkboxes (see all errors), or unselect all (hide all errors), select All Groups. The Event Log immediately adds or removes errors from the list.
– If all groups are selected (no filter), the Group filter icon is empty.
– If any group is not selected (a filter is applied), the Group filter icon is full.
• To select or unselect any single checkbox, select anywhere in the line of the title.
Filter by Event• To open the event filter, select the Event heading.
Note: If there is any other filter applied (Group, Date, Time—marked by a filled filter icon— —next to a tile), it limits what any other filter shows. For example, if no
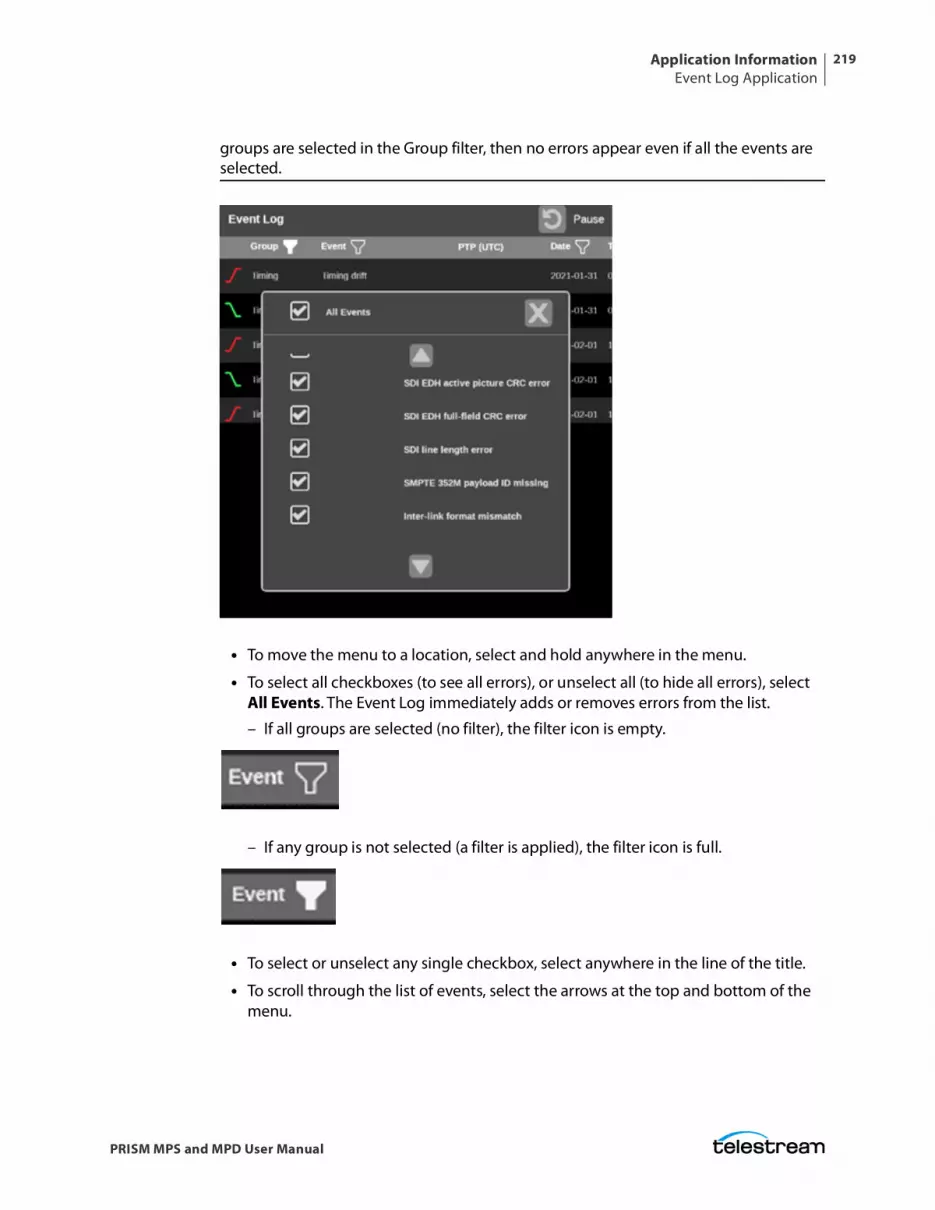
Application InformationEvent Log Application
219
PRISM MPS and MPD User Manual
groups are selected in the Group filter, then no errors appear even if all the events are selected.
• To move the menu to a location, select and hold anywhere in the menu.
• To select all checkboxes (to see all errors), or unselect all (to hide all errors), select All Events. The Event Log immediately adds or removes errors from the list.
– If all groups are selected (no filter), the filter icon is empty.
– If any group is not selected (a filter is applied), the filter icon is full.
• To select or unselect any single checkbox, select anywhere in the line of the title.
• To scroll through the list of events, select the arrows at the top and bottom of the menu.
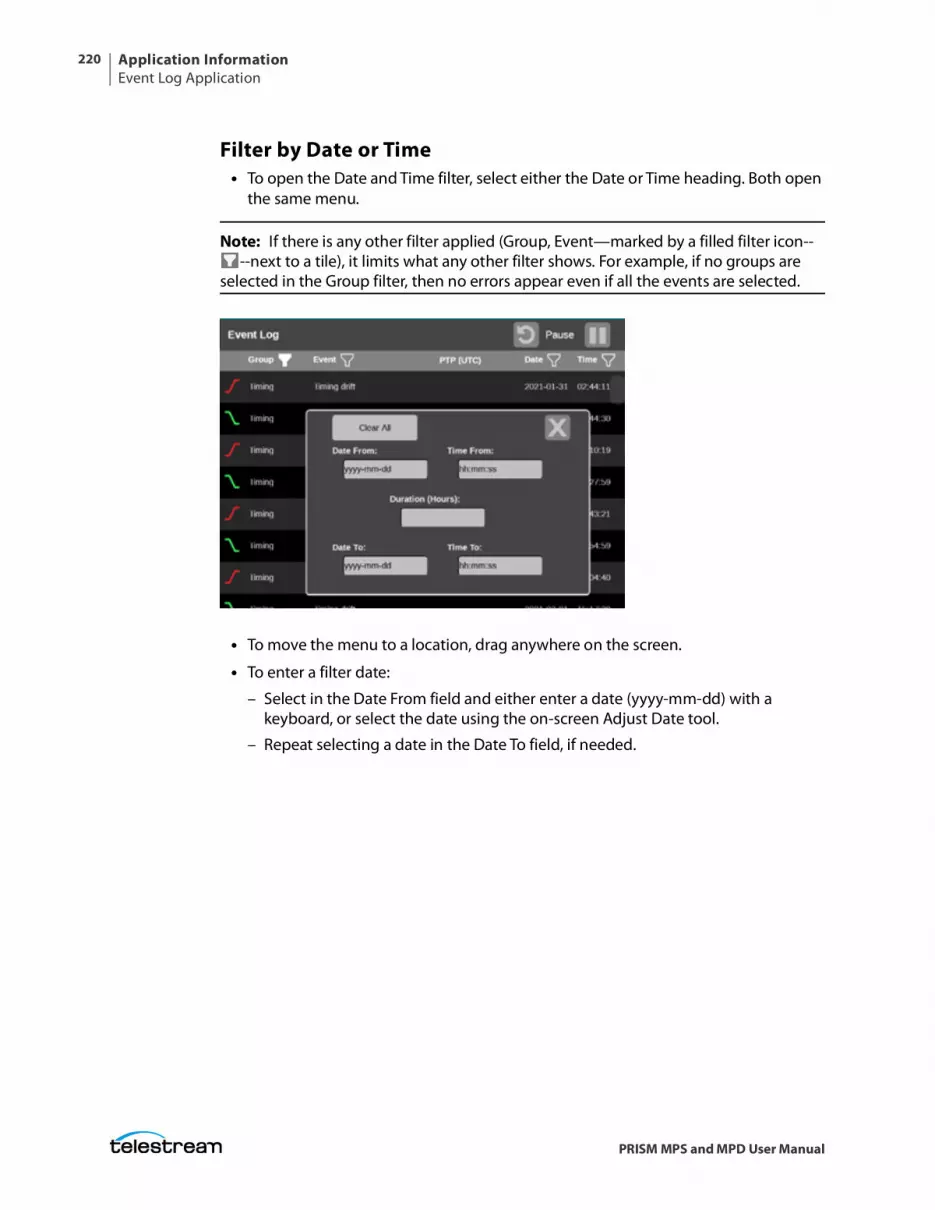
Application InformationEvent Log Application
220
PRISM MPS and MPD User Manual
Filter by Date or Time• To open the Date and Time filter, select either the Date or Time heading. Both open
the same menu.
Note: If there is any other filter applied (Group, Event—marked by a filled filter icon----next to a tile), it limits what any other filter shows. For example, if no groups are
selected in the Group filter, then no errors appear even if all the events are selected.
• To move the menu to a location, drag anywhere on the screen.
• To enter a filter date:
– Select in the Date From field and either enter a date (yyyy-mm-dd) with a keyboard, or select the date using the on-screen Adjust Date tool.
– Repeat selecting a date in the Date To field, if needed.
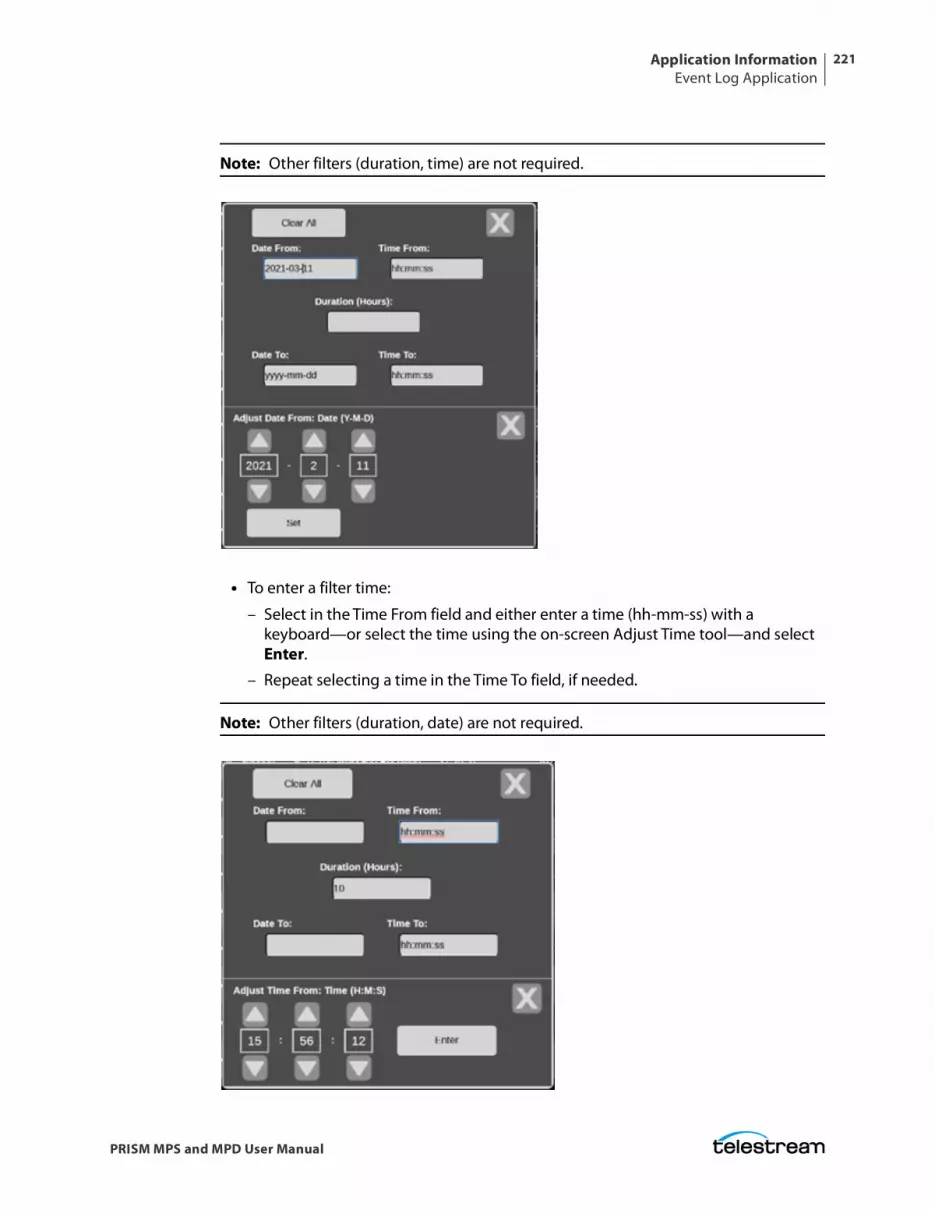
Application InformationEvent Log Application
221
PRISM MPS and MPD User Manual
Note: Other filters (duration, time) are not required.
• To enter a filter time:
– Select in the Time From field and either enter a time (hh-mm-ss) with a keyboard—or select the time using the on-screen Adjust Time tool—and select Enter.
– Repeat selecting a time in the Time To field, if needed.
Note: Other filters (duration, date) are not required.
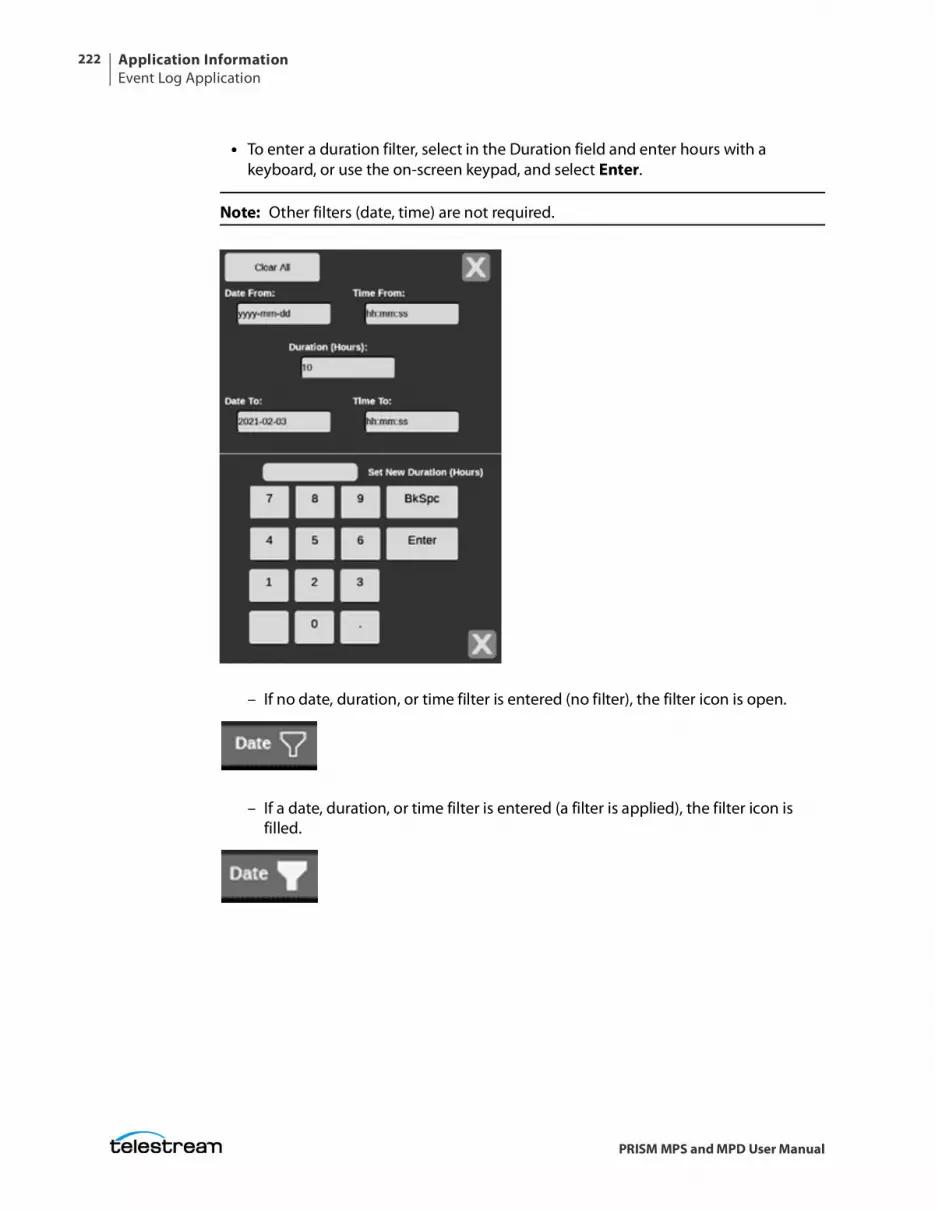
Application InformationEvent Log Application
222
PRISM MPS and MPD User Manual
• To enter a duration filter, select in the Duration field and enter hours with a keyboard, or use the on-screen keypad, and select Enter.
Note: Other filters (date, time) are not required.
– If no date, duration, or time filter is entered (no filter), the filter icon is open.
– If a date, duration, or time filter is entered (a filter is applied), the filter icon is filled.
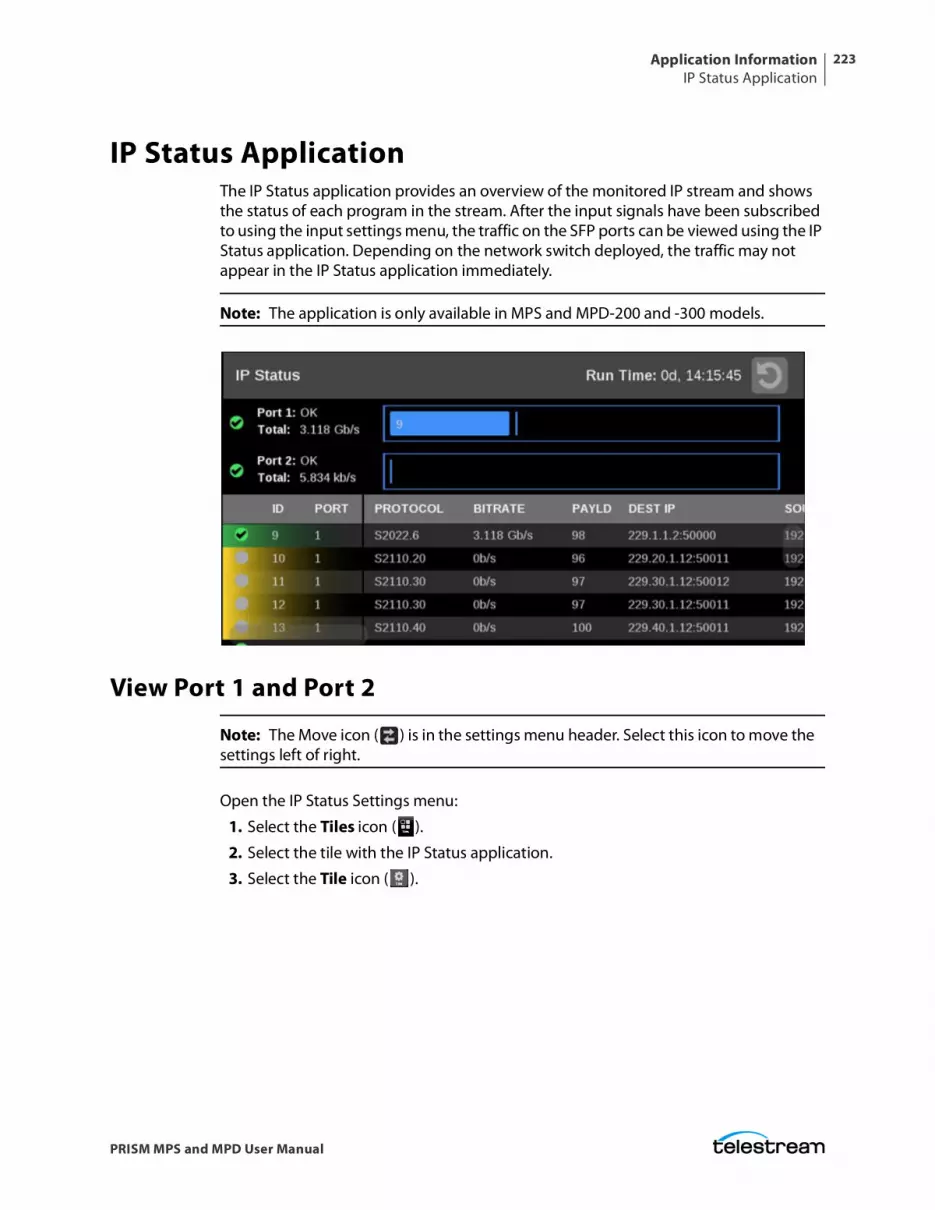
Application InformationIP Status Application
223
PRISM MPS and MPD User Manual
IP Status ApplicationThe IP Status application provides an overview of the monitored IP stream and shows the status of each program in the stream. After the input signals have been subscribed to using the input settings menu, the traffic on the SFP ports can be viewed using the IP Status application. Depending on the network switch deployed, the traffic may not appear in the IP Status application immediately.
Note: The application is only available in MPS and MPD-200 and -300 models.
View Port 1 and Port 2
Note: The Move icon ( ) is in the settings menu header. Select this icon to move the settings left of right.
Open the IP Status Settings menu:
1. Select the Tiles icon ( ).
2. Select the tile with the IP Status application.
3. Select the Tile icon ( ).
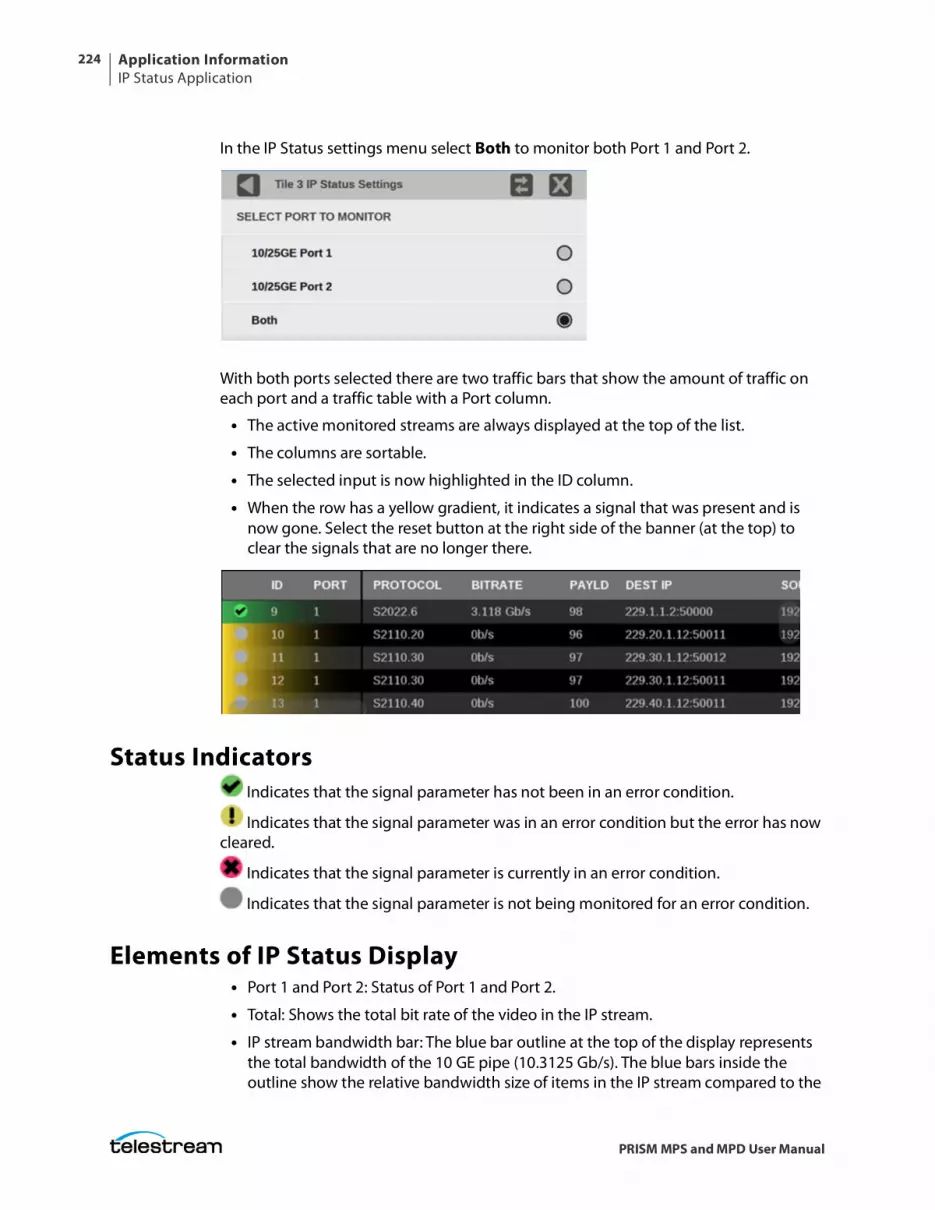
Application InformationIP Status Application
224
PRISM MPS and MPD User Manual
In the IP Status settings menu select Both to monitor both Port 1 and Port 2.
With both ports selected there are two traffic bars that show the amount of traffic on each port and a traffic table with a Port column.
• The active monitored streams are always displayed at the top of the list.
• The columns are sortable.
• The selected input is now highlighted in the ID column.
• When the row has a yellow gradient, it indicates a signal that was present and is now gone. Select the reset button at the right side of the banner (at the top) to clear the signals that are no longer there.
Status Indicators Indicates that the signal parameter has not been in an error condition.
Indicates that the signal parameter was in an error condition but the error has now cleared.
Indicates that the signal parameter is currently in an error condition.
Indicates that the signal parameter is not being monitored for an error condition.
Elements of IP Status Display• Port 1 and Port 2: Status of Port 1 and Port 2.
• Total: Shows the total bit rate of the video in the IP stream.
• IP stream bandwidth bar: The blue bar outline at the top of the display represents the total bandwidth of the 10 GE pipe (10.3125 Gb/s). The blue bars inside the outline show the relative bandwidth size of items in the IP stream compared to the
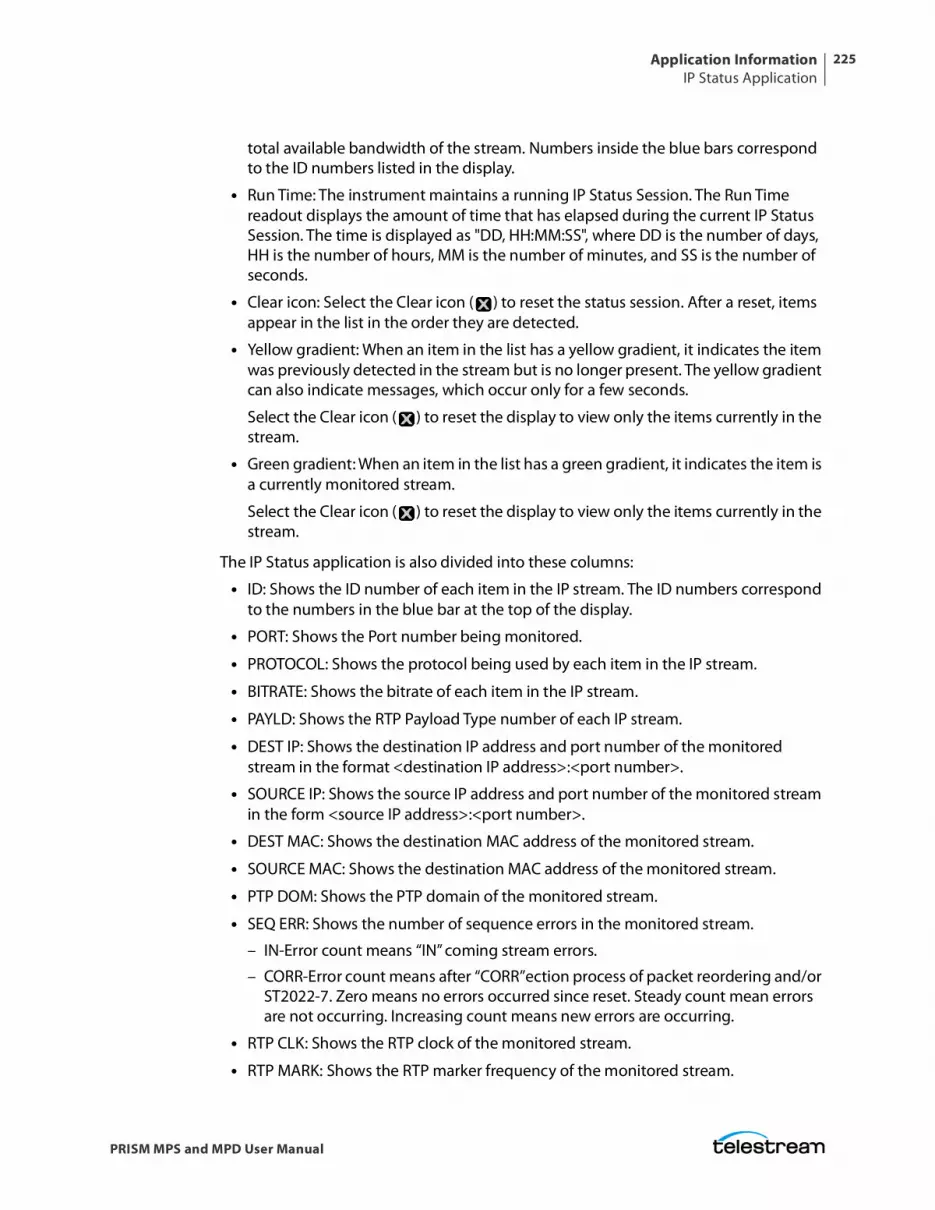
Application InformationIP Status Application
225
PRISM MPS and MPD User Manual
total available bandwidth of the stream. Numbers inside the blue bars correspond to the ID numbers listed in the display.
• Run Time: The instrument maintains a running IP Status Session. The Run Time readout displays the amount of time that has elapsed during the current IP Status Session. The time is displayed as "DD, HH:MM:SS", where DD is the number of days, HH is the number of hours, MM is the number of minutes, and SS is the number of seconds.
• Clear icon: Select the Clear icon ( ) to reset the status session. After a reset, items appear in the list in the order they are detected.
• Yellow gradient: When an item in the list has a yellow gradient, it indicates the item was previously detected in the stream but is no longer present. The yellow gradient can also indicate messages, which occur only for a few seconds.
Select the Clear icon ( ) to reset the display to view only the items currently in the stream.
• Green gradient: When an item in the list has a green gradient, it indicates the item is a currently monitored stream.
Select the Clear icon ( ) to reset the display to view only the items currently in the stream.
The IP Status application is also divided into these columns:
• ID: Shows the ID number of each item in the IP stream. The ID numbers correspond to the numbers in the blue bar at the top of the display.
• PORT: Shows the Port number being monitored.
• PROTOCOL: Shows the protocol being used by each item in the IP stream.
• BITRATE: Shows the bitrate of each item in the IP stream.
• PAYLD: Shows the RTP Payload Type number of each IP stream.
• DEST IP: Shows the destination IP address and port number of the monitored stream in the format <destination IP address>:<port number>.
• SOURCE IP: Shows the source IP address and port number of the monitored stream in the form <source IP address>:<port number>.
• DEST MAC: Shows the destination MAC address of the monitored stream.
• SOURCE MAC: Shows the destination MAC address of the monitored stream.
• PTP DOM: Shows the PTP domain of the monitored stream.
• SEQ ERR: Shows the number of sequence errors in the monitored stream.
– IN-Error count means “IN” coming stream errors.
– CORR-Error count means after “CORR”ection process of packet reordering and/or ST2022-7. Zero means no errors occurred since reset. Steady count mean errors are not occurring. Increasing count means new errors are occurring.
• RTP CLK: Shows the RTP clock of the monitored stream.
• RTP MARK: Shows the RTP marker frequency of the monitored stream.
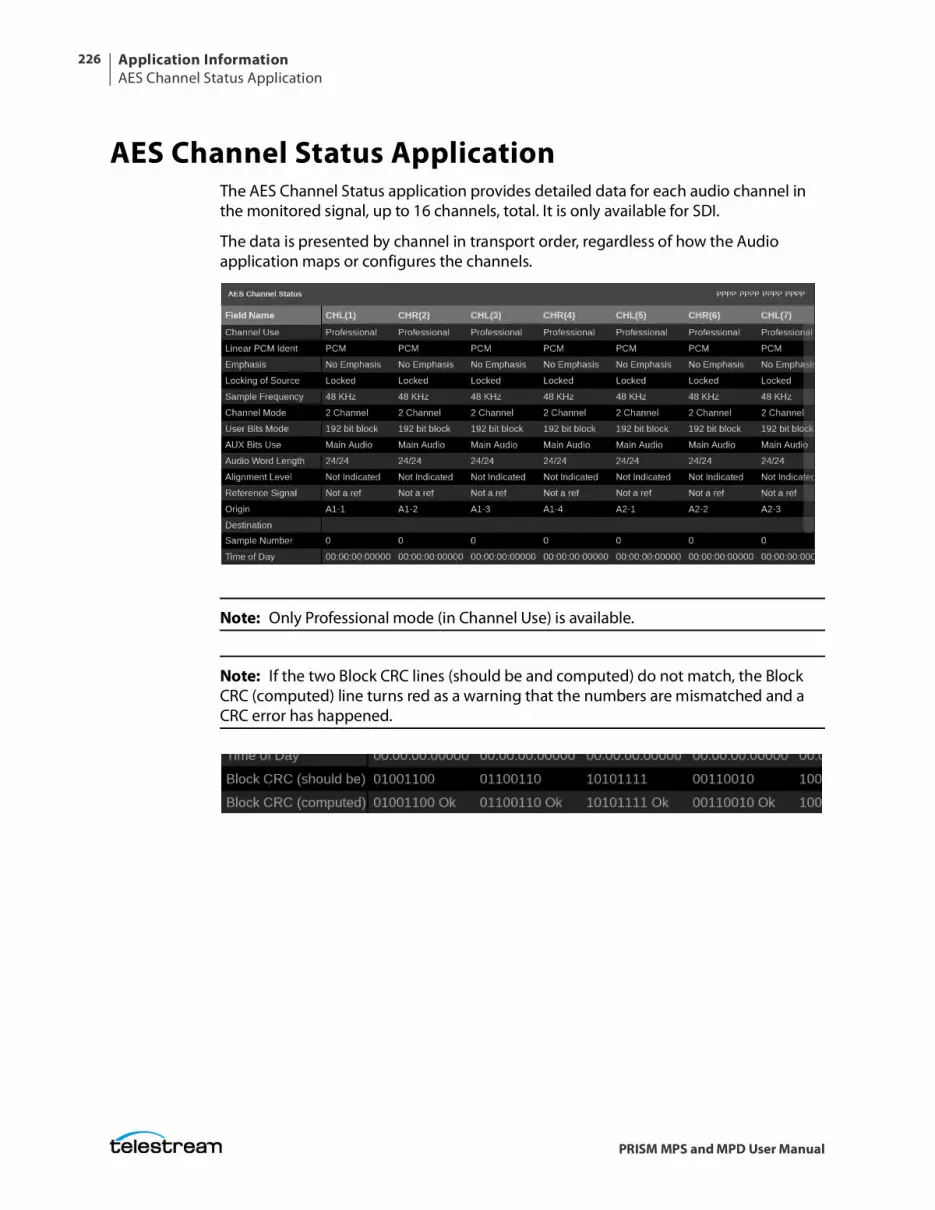
Application InformationAES Channel Status Application
226
PRISM MPS and MPD User Manual
AES Channel Status ApplicationThe AES Channel Status application provides detailed data for each audio channel in the monitored signal, up to 16 channels, total. It is only available for SDI.
The data is presented by channel in transport order, regardless of how the Audio application maps or configures the channels.
Note: Only Professional mode (in Channel Use) is available.
Note: If the two Block CRC lines (should be and computed) do not match, the Block CRC (computed) line turns red as a warning that the numbers are mismatched and a CRC error has happened.
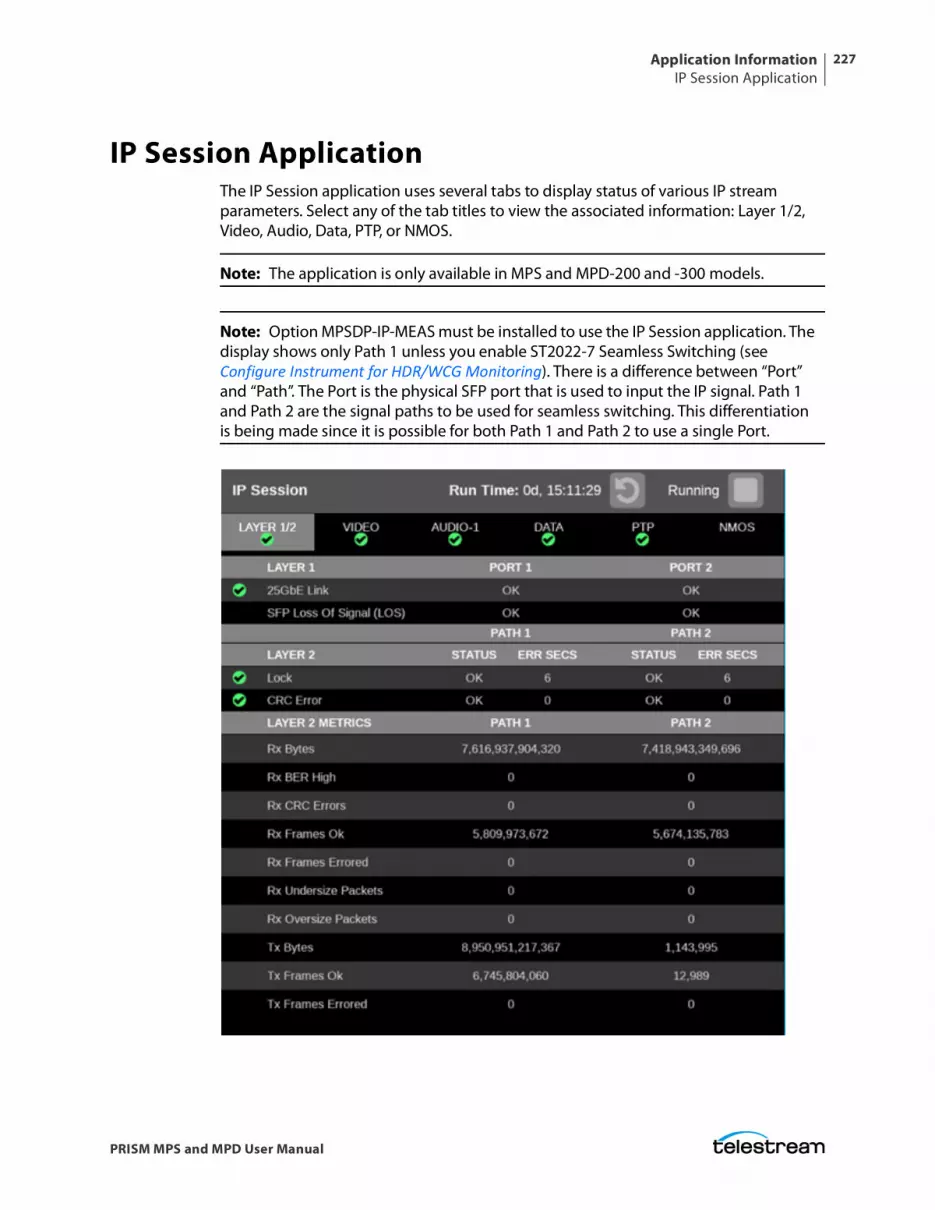
Application InformationIP Session Application
227
PRISM MPS and MPD User Manual
IP Session ApplicationThe IP Session application uses several tabs to display status of various IP stream parameters. Select any of the tab titles to view the associated information: Layer 1/2, Video, Audio, Data, PTP, or NMOS.
Note: The application is only available in MPS and MPD-200 and -300 models.
Note: Option MPSDP-IP-MEAS must be installed to use the IP Session application. The display shows only Path 1 unless you enable ST2022-7 Seamless Switching (see Configure Instrument for HDR/WCG Monitoring). There is a difference between “Port” and “Path”. The Port is the physical SFP port that is used to input the IP signal. Path 1 and Path 2 are the signal paths to be used for seamless switching. This differentiation is being made since it is possible for both Path 1 and Path 2 to use a single Port.
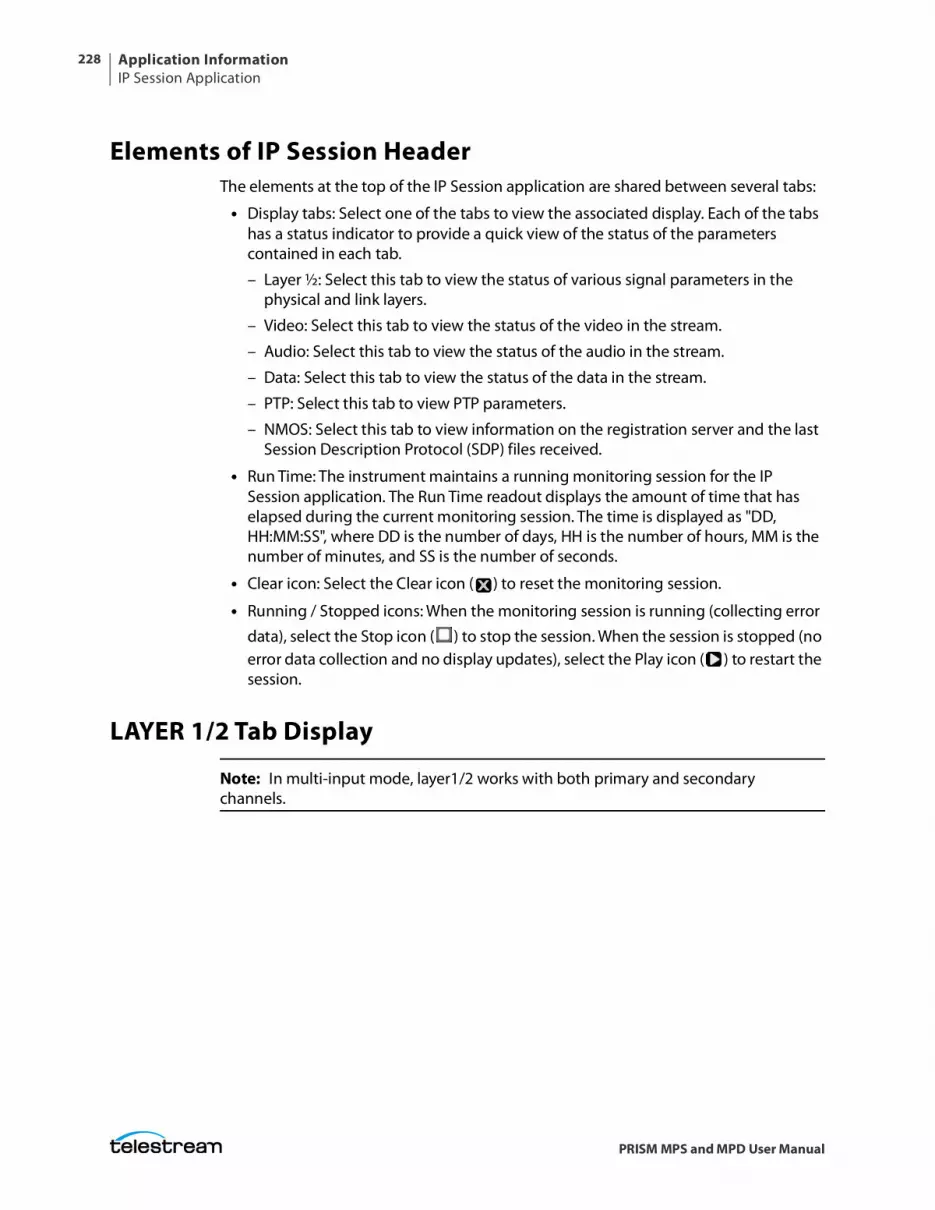
Application InformationIP Session Application
228
PRISM MPS and MPD User Manual
Elements of IP Session HeaderThe elements at the top of the IP Session application are shared between several tabs:
• Display tabs: Select one of the tabs to view the associated display. Each of the tabs has a status indicator to provide a quick view of the status of the parameters contained in each tab.
– Layer ½: Select this tab to view the status of various signal parameters in the physical and link layers.
– Video: Select this tab to view the status of the video in the stream.
– Audio: Select this tab to view the status of the audio in the stream.
– Data: Select this tab to view the status of the data in the stream.
– PTP: Select this tab to view PTP parameters.
– NMOS: Select this tab to view information on the registration server and the last Session Description Protocol (SDP) files received.
• Run Time: The instrument maintains a running monitoring session for the IP Session application. The Run Time readout displays the amount of time that has elapsed during the current monitoring session. The time is displayed as "DD, HH:MM:SS", where DD is the number of days, HH is the number of hours, MM is the number of minutes, and SS is the number of seconds.
• Clear icon: Select the Clear icon ( ) to reset the monitoring session.
• Running / Stopped icons: When the monitoring session is running (collecting error
data), select the Stop icon ( ) to stop the session. When the session is stopped (no error data collection and no display updates), select the Play icon ( ) to restart the session.
LAYER 1/2 Tab Display
Note: In multi-input mode, layer1/2 works with both primary and secondary channels.
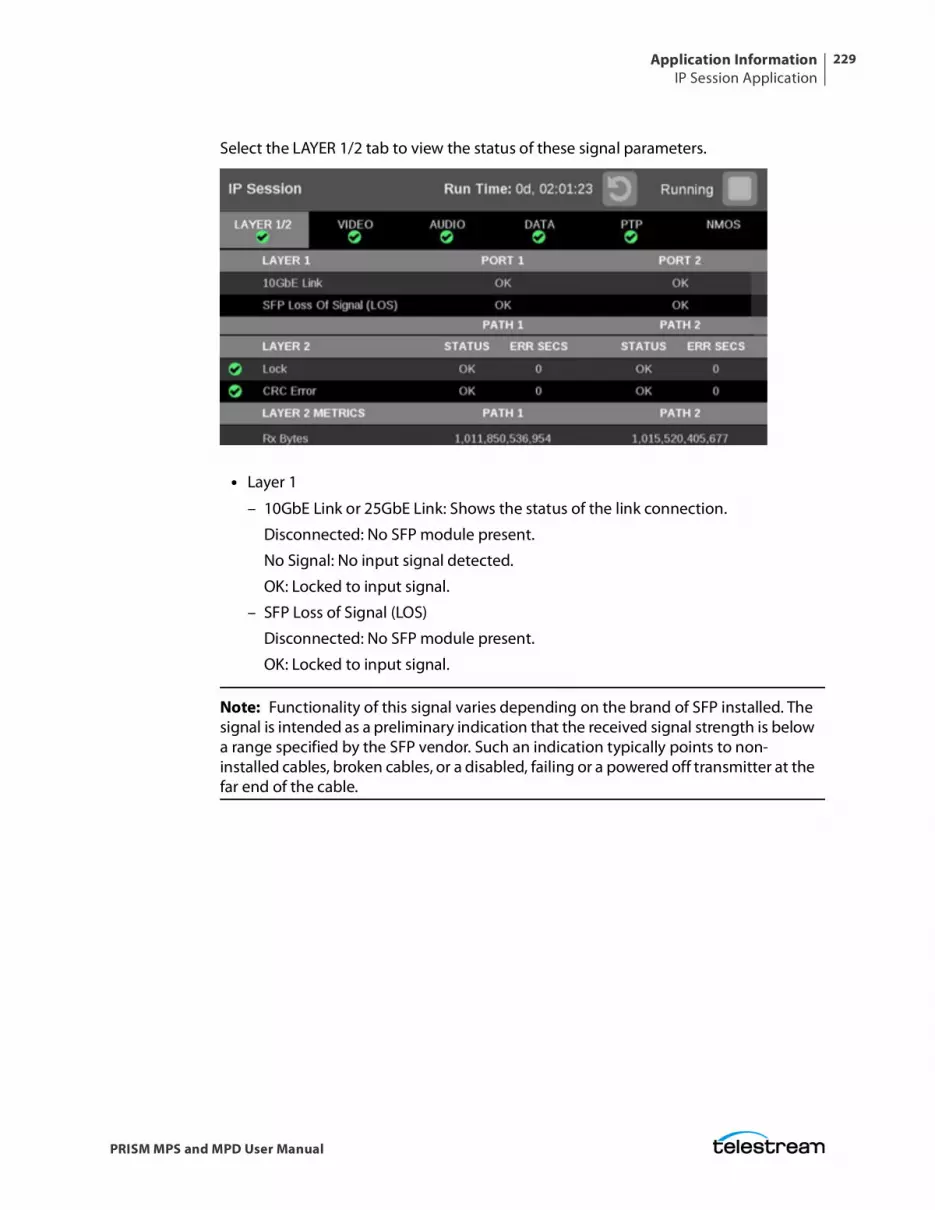
Application InformationIP Session Application
229
PRISM MPS and MPD User Manual
Select the LAYER 1/2 tab to view the status of these signal parameters.
• Layer 1
– 10GbE Link or 25GbE Link: Shows the status of the link connection.
Disconnected: No SFP module present.
No Signal: No input signal detected.
OK: Locked to input signal.
– SFP Loss of Signal (LOS)
Disconnected: No SFP module present.
OK: Locked to input signal.
Note: Functionality of this signal varies depending on the brand of SFP installed. The signal is intended as a preliminary indication that the received signal strength is below a range specified by the SFP vendor. Such an indication typically points to non-installed cables, broken cables, or a disabled, failing or a powered off transmitter at the far end of the cable.
Application InformationIP Session Application
230
PRISM MPS and MPD User Manual
• Layer 2
– Lock: Shows the lock status of the link:
OK: The 10/25G Ethernet Phy Rx port is successfully locked to the inbound Ethernet signal.
ERROR: The 10/25G Ethernet Phy Rx port lost lock to the incoming Ethernet signal during the last second. This indicates there is likely a physical layer problem with the link.
– CRC Error columns:
STATUS: There have been no overflow errors in the Ethernet MAC during the last second.
ERR SECS: An errored second is an interval of a second during which any error has occurred, regardless of whether that error was a single bit error, or a complete loss of communication for that entire second.
• Layer 2 Metrics:
– Rx Bytes: A count of the number of bytes received.
– Rx BER High: Indicates that the Sync Header BER is greater than 10-4.
– Rx CRC Errors: A count of the number of CRC errors detected.
– Rx Frames Ok: A count of the number of Ethernet frames received without error.
– Rx Frames Errored: A count of the number of Ethernet frames received with errors detected.
– Rx Undersize Packets: A count of the number of Ethernet frames received that are less than 64 bytes long.
– Rx Oversize Packets: A count of the number of Ethernet frames received that are greater than 1522 bytes long.
– Tx Bytes: A count of the number of bytes transmitted.
– Tx Frames Ok: A count of the number of Ethernet frames transmitted without error.
– Tx Frames Errored: A count of the number of Ethernet frames transmitted with errors detected.
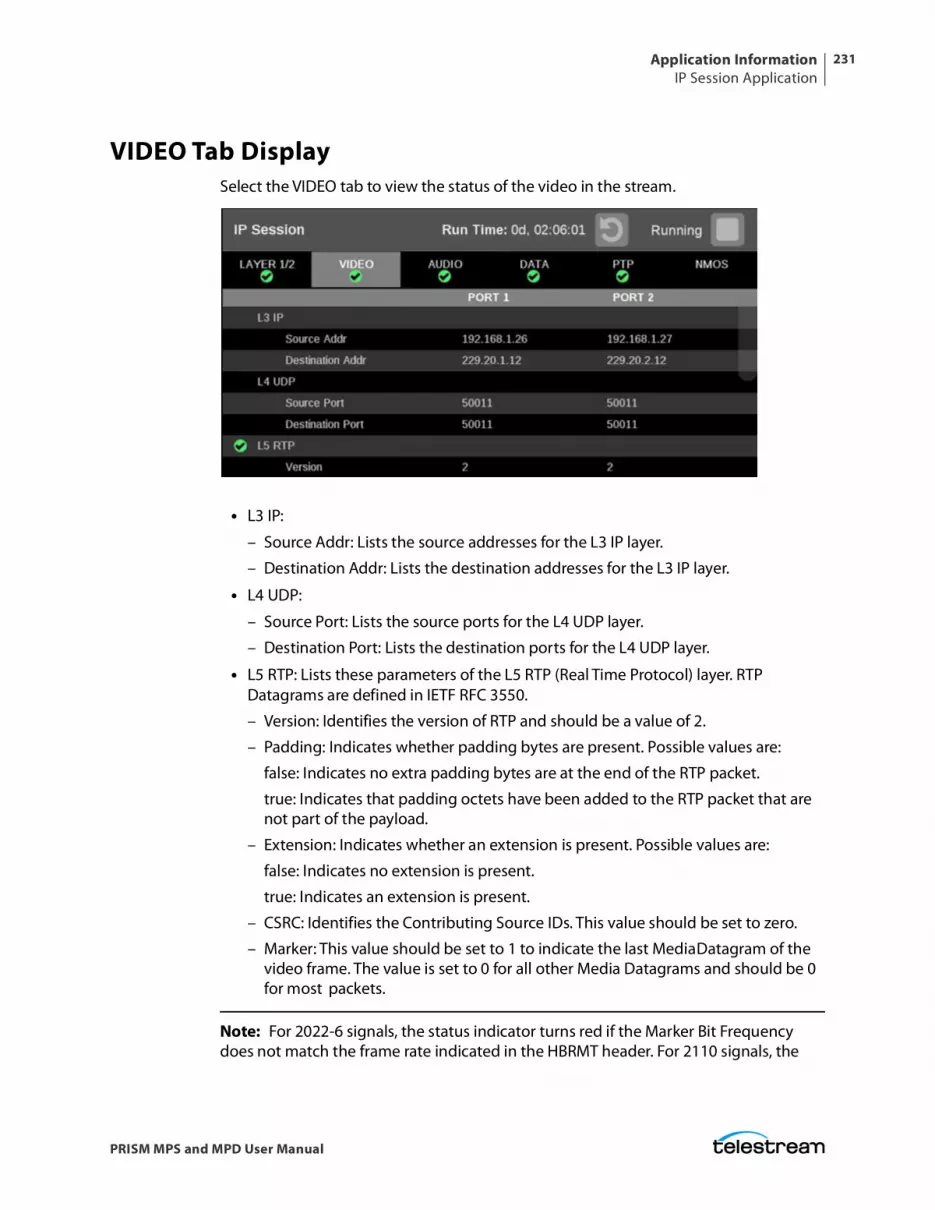
Application InformationIP Session Application
231
PRISM MPS and MPD User Manual
VIDEO Tab DisplaySelect the VIDEO tab to view the status of the video in the stream.
• L3 IP:
– Source Addr: Lists the source addresses for the L3 IP layer.
– Destination Addr: Lists the destination addresses for the L3 IP layer.
• L4 UDP:
– Source Port: Lists the source ports for the L4 UDP layer.
– Destination Port: Lists the destination ports for the L4 UDP layer.
• L5 RTP: Lists these parameters of the L5 RTP (Real Time Protocol) layer. RTP Datagrams are defined in IETF RFC 3550.
– Version: Identifies the version of RTP and should be a value of 2.
– Padding: Indicates whether padding bytes are present. Possible values are:
false: Indicates no extra padding bytes are at the end of the RTP packet.
true: Indicates that padding octets have been added to the RTP packet that are not part of the payload.
– Extension: Indicates whether an extension is present. Possible values are:
false: Indicates no extension is present.
true: Indicates an extension is present.
– CSRC: Identifies the Contributing Source IDs. This value should be set to zero.
– Marker: This value should be set to 1 to indicate the last Media Datagram of the video frame. The value is set to 0 for all other Media Datagrams and should be 0 for most packets.
Note: For 2022-6 signals, the status indicator turns red if the Marker Bit Frequency does not match the frame rate indicated in the HBRMT header. For 2110 signals, the
Application InformationIP Session Application
232
PRISM MPS and MPD User Manual
status indicator turns red if the Marker Bit Frequency does not match the measured field rate of the detected format.
– Payload type: Identifies the type of RTP payload:
98: Indicates a SMPTE 2022.6 High Bit-rate Media transport.
99: Indicates a SMPTE 2022.5 High Bit-rate Media Forward Error Correction (FEC) payload.
33: Indicates a SMPTE 2022.2 Constant Bit Rate MPEG-2 Transport Stream Adaptive Sample Picture Encapsulation (ASPEN) payload.
Note: The Payload type for ST2110 streams should be between 96 and 127. The Payload type is set by the user/device.
– Sequence number: RTP sequence counter that changes by one for each RTP Media Datagram that is sent.
Note: The status indicator turns red if the received RTP sequence numbers do not change by 1 on every packet.
– Time Stamp: The timestamp reflects the sampling instant of the first octet in the RTP datagram. This value can be used to determine packet sequence errors and jitter calculations to be made.
Note: For 2022-6 signals, the status indicator turns red if the Time Stamp field does not change at the rate of 27 MHz on every packet. For 2110 signals, the status indicator turns red if the Time Stamp field does not change at the start of every field or frame at the rate of 90 kHz on every packet.
– SSRC: Identifies the Synchronization Source ID and is set in compliance with RFC3550. This identifier is chosen randomly and should be unique so no two SSRC have the same value with an RTP session.
• Interface Sampling Frequency Error: This error indicates that the incoming video is arriving at a frequency outside of the supported range to maintain stable video lock. The signal on the SDI Out video connector may be affected. Possible interface sampling frequency declaration in stream header is incorrect for the stream type being carried.
Note: The status indicator turns red if the received frame rate is not stable enough during conversion to SDI. Marker Bit Frequency Errors can also trigger this indicator.
• HBRMT: Lists these parameters of the High Bit Rate Media Payload Header:
Application InformationIP Session Application
233
PRISM MPS and MPD User Manual
Note: The HBRMT parameters do not apply to ST2110-20 streams.
– Video Source Format: Identifies whether source formatting is present:
Not Present: Indicates no Source Format information is present.
Present: Indicates source formatting is present.
– Video Source ID: Identifies the video source:
Primary (0x0): Indicates a primary stream.
Protect (0x1): Indicates a protected stream.
Reserved (n): When n is a number other than 0 or 1, indicates that a reserved value is being used.
Frame Count: The Video Frame counter changes in value for the next RTP sequence and rolls over after 255.
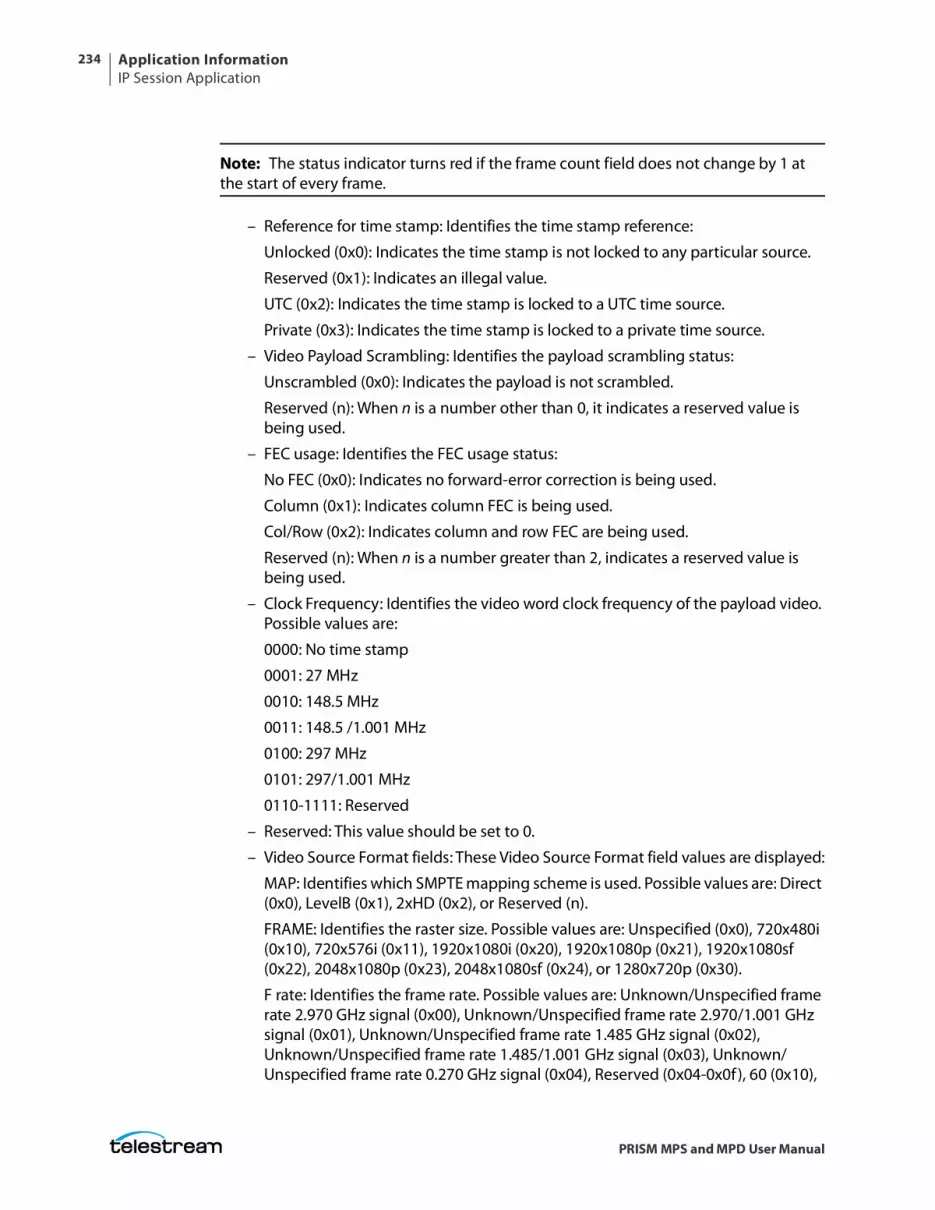
Application InformationIP Session Application
234
PRISM MPS and MPD User Manual
Note: The status indicator turns red if the frame count field does not change by 1 at the start of every frame.
– Reference for time stamp: Identifies the time stamp reference:
Unlocked (0x0): Indicates the time stamp is not locked to any particular source.
Reserved (0x1): Indicates an illegal value.
UTC (0x2): Indicates the time stamp is locked to a UTC time source.
Private (0x3): Indicates the time stamp is locked to a private time source.
– Video Payload Scrambling: Identifies the payload scrambling status:
Unscrambled (0x0): Indicates the payload is not scrambled.
Reserved (n): When n is a number other than 0, it indicates a reserved value is being used.
– FEC usage: Identifies the FEC usage status:
No FEC (0x0): Indicates no forward-error correction is being used.
Column (0x1): Indicates column FEC is being used.
Col/Row (0x2): Indicates column and row FEC are being used.
Reserved (n): When n is a number greater than 2, indicates a reserved value is being used.
– Clock Frequency: Identifies the video word clock frequency of the payload video. Possible values are:
0000: No time stamp
0001: 27 MHz
0010: 148.5 MHz
0011: 148.5 /1.001 MHz
0100: 297 MHz
0101: 297/1.001 MHz
0110-1111: Reserved
– Reserved: This value should be set to 0.
– Video Source Format fields: These Video Source Format field values are displayed:
MAP: Identifies which SMPTE mapping scheme is used. Possible values are: Direct (0x0), LevelB (0x1), 2xHD (0x2), or Reserved (n).
FRAME: Identifies the raster size. Possible values are: Unspecified (0x0), 720x480i (0x10), 720x576i (0x11), 1920x1080i (0x20), 1920x1080p (0x21), 1920x1080sf (0x22), 2048x1080p (0x23), 2048x1080sf (0x24), or 1280x720p (0x30).
F rate: Identifies the frame rate. Possible values are: Unknown/Unspecified frame rate 2.970 GHz signal (0x00), Unknown/Unspecified frame rate 2.970/1.001 GHz signal (0x01), Unknown/Unspecified frame rate 1.485 GHz signal (0x02), Unknown/Unspecified frame rate 1.485/1.001 GHz signal (0x03), Unknown/Unspecified frame rate 0.270 GHz signal (0x04), Reserved (0x04-0x0f), 60 (0x10),
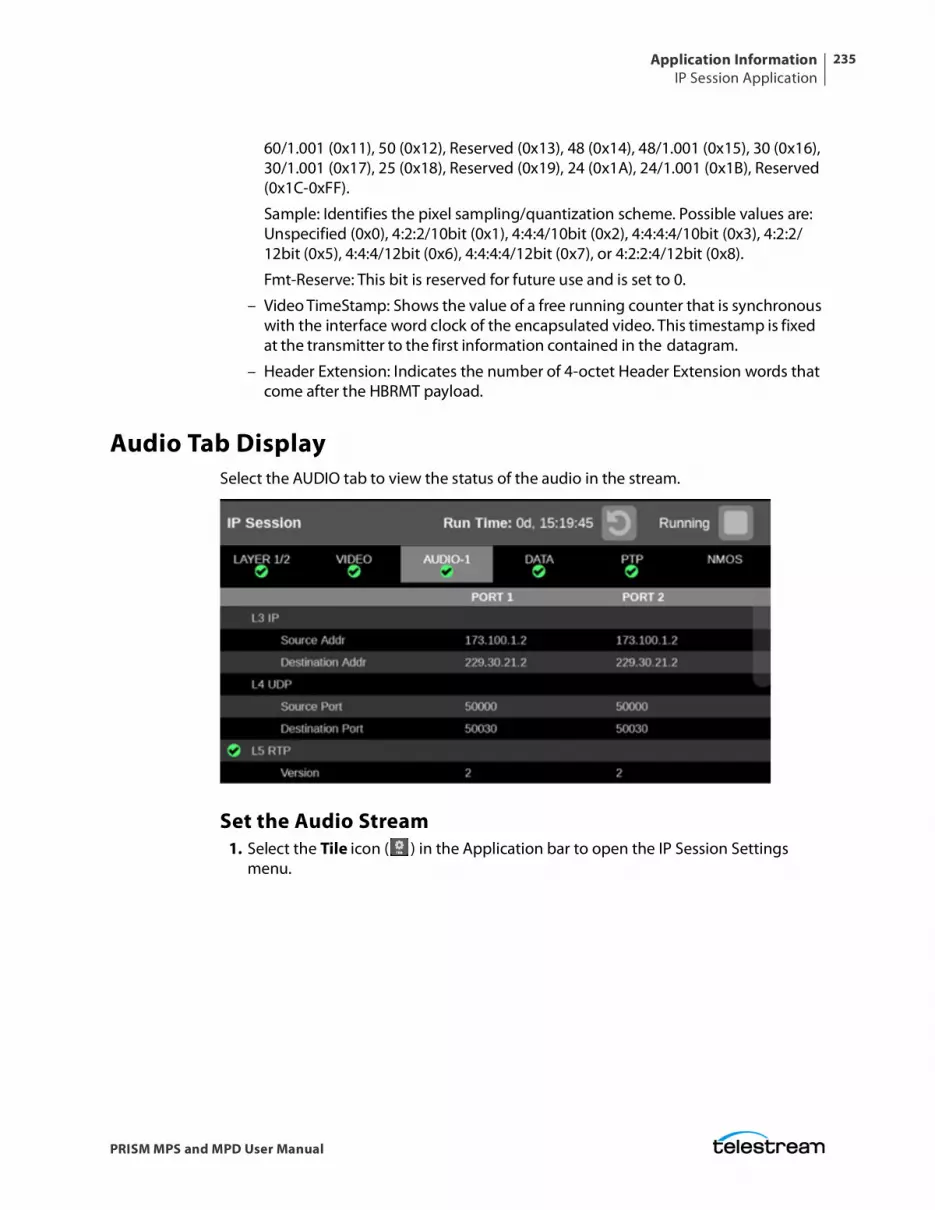
Application InformationIP Session Application
235
PRISM MPS and MPD User Manual
60/1.001 (0x11), 50 (0x12), Reserved (0x13), 48 (0x14), 48/1.001 (0x15), 30 (0x16), 30/1.001 (0x17), 25 (0x18), Reserved (0x19), 24 (0x1A), 24/1.001 (0x1B), Reserved (0x1C-0xFF).
Sample: Identifies the pixel sampling/quantization scheme. Possible values are: Unspecified (0x0), 4:2:2/10bit (0x1), 4:4:4/10bit (0x2), 4:4:4:4/10bit (0x3), 4:2:2/12bit (0x5), 4:4:4/12bit (0x6), 4:4:4:4/12bit (0x7), or 4:2:2:4/12bit (0x8).
Fmt-Reserve: This bit is reserved for future use and is set to 0.
– Video TimeStamp: Shows the value of a free running counter that is synchronous with the interface word clock of the encapsulated video. This timestamp is fixed at the transmitter to the first information contained in the datagram.
– Header Extension: Indicates the number of 4-octet Header Extension words that come after the HBRMT payload.
Audio Tab DisplaySelect the AUDIO tab to view the status of the audio in the stream.
Set the Audio Stream1. Select the Tile icon ( ) in the Application bar to open the IP Session Settings
menu.
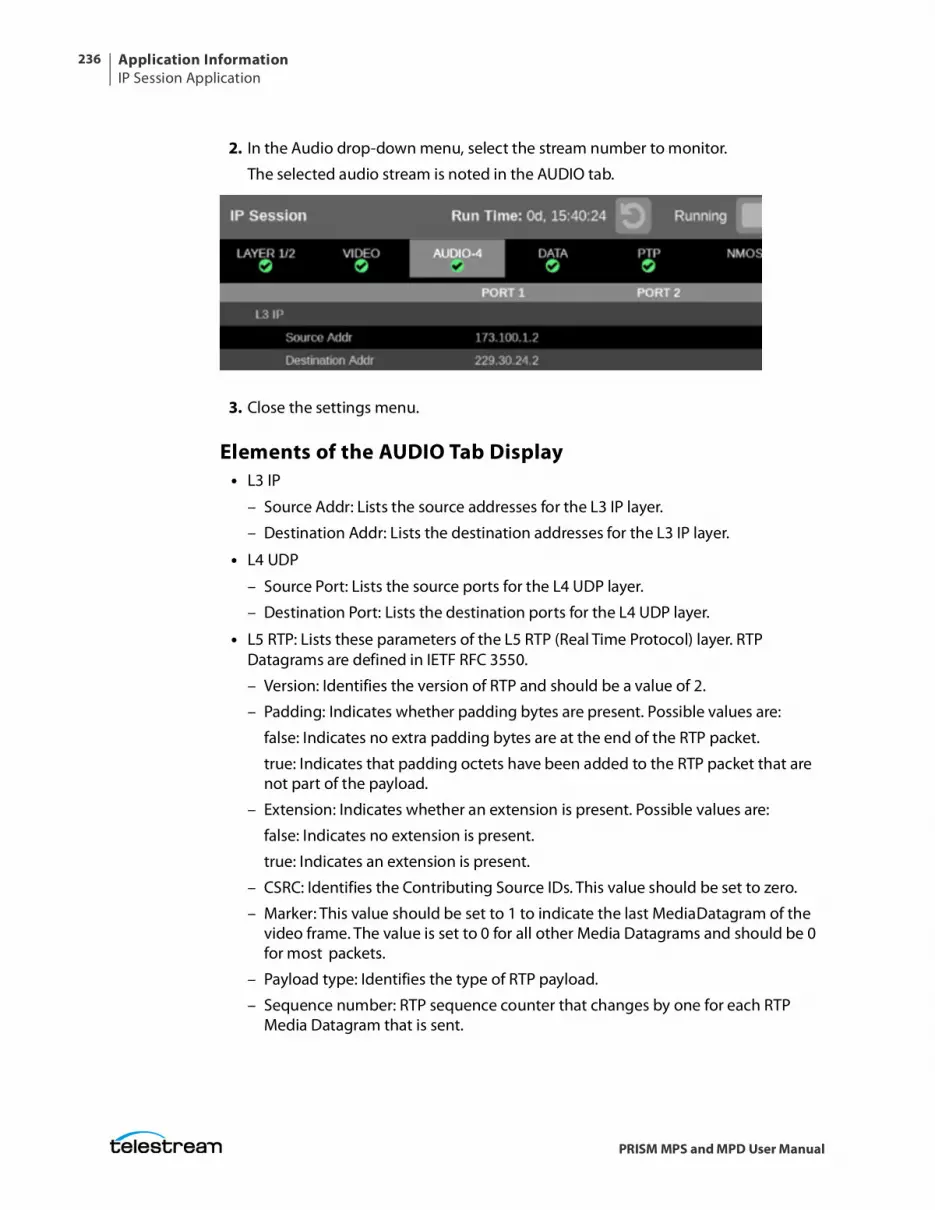
Application InformationIP Session Application
236
PRISM MPS and MPD User Manual
2. In the Audio drop-down menu, select the stream number to monitor.
The selected audio stream is noted in the AUDIO tab.
3. Close the settings menu.
Elements of the AUDIO Tab Display• L3 IP
– Source Addr: Lists the source addresses for the L3 IP layer.
– Destination Addr: Lists the destination addresses for the L3 IP layer.
• L4 UDP
– Source Port: Lists the source ports for the L4 UDP layer.
– Destination Port: Lists the destination ports for the L4 UDP layer.
• L5 RTP: Lists these parameters of the L5 RTP (Real Time Protocol) layer. RTP Datagrams are defined in IETF RFC 3550.
– Version: Identifies the version of RTP and should be a value of 2.
– Padding: Indicates whether padding bytes are present. Possible values are:
false: Indicates no extra padding bytes are at the end of the RTP packet.
true: Indicates that padding octets have been added to the RTP packet that are not part of the payload.
– Extension: Indicates whether an extension is present. Possible values are:
false: Indicates no extension is present.
true: Indicates an extension is present.
– CSRC: Identifies the Contributing Source IDs. This value should be set to zero.
– Marker: This value should be set to 1 to indicate the last Media Datagram of the video frame. The value is set to 0 for all other Media Datagrams and should be 0 for most packets.
– Payload type: Identifies the type of RTP payload.
– Sequence number: RTP sequence counter that changes by one for each RTP Media Datagram that is sent.
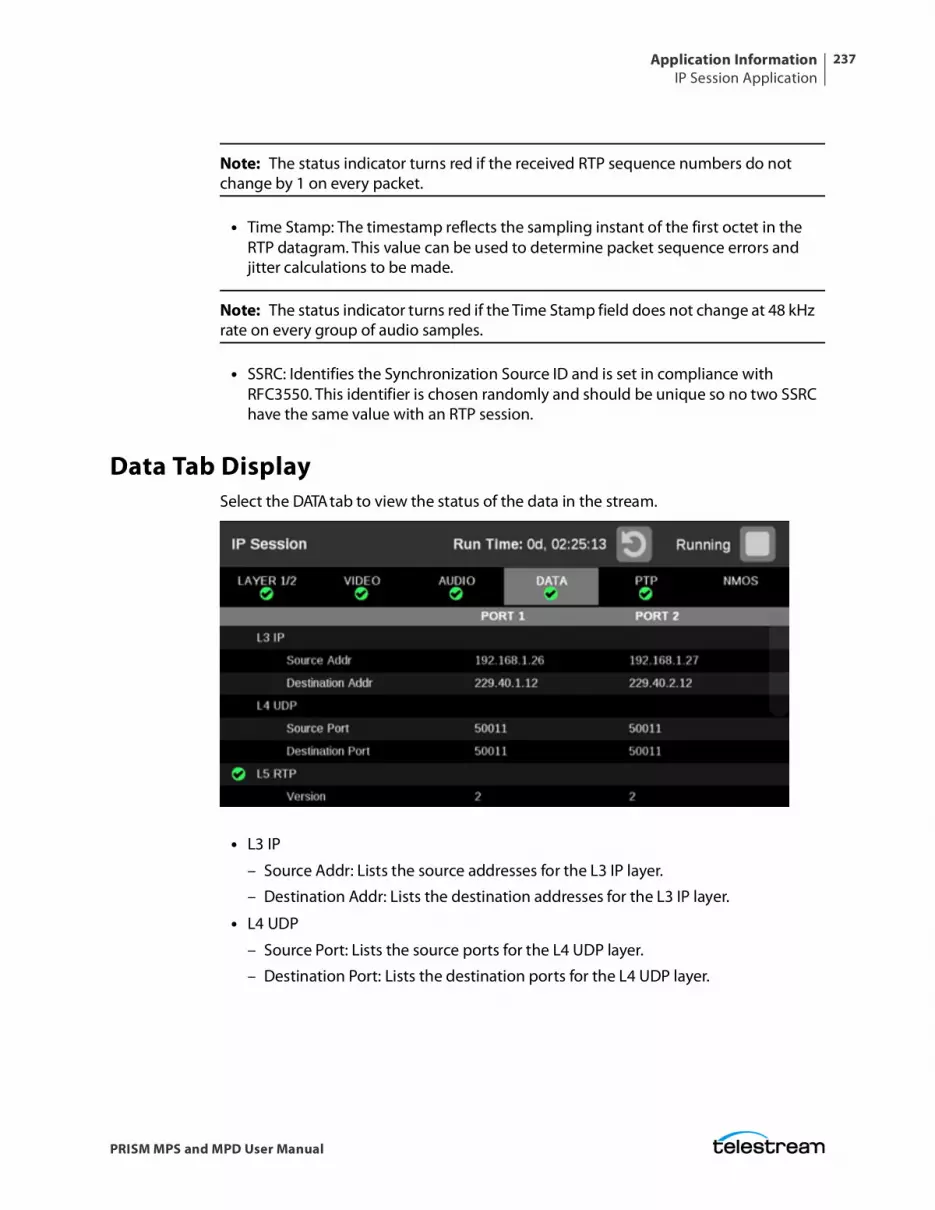
Application InformationIP Session Application
237
PRISM MPS and MPD User Manual
Note: The status indicator turns red if the received RTP sequence numbers do not change by 1 on every packet.
• Time Stamp: The timestamp reflects the sampling instant of the first octet in the RTP datagram. This value can be used to determine packet sequence errors and jitter calculations to be made.
Note: The status indicator turns red if the Time Stamp field does not change at 48 kHz rate on every group of audio samples.
• SSRC: Identifies the Synchronization Source ID and is set in compliance with RFC3550. This identifier is chosen randomly and should be unique so no two SSRC have the same value with an RTP session.
Data Tab DisplaySelect the DATA tab to view the status of the data in the stream.
• L3 IP
– Source Addr: Lists the source addresses for the L3 IP layer.
– Destination Addr: Lists the destination addresses for the L3 IP layer.
• L4 UDP
– Source Port: Lists the source ports for the L4 UDP layer.
– Destination Port: Lists the destination ports for the L4 UDP layer.
Application InformationIP Session Application
238
PRISM MPS and MPD User Manual
• L5 RTP: Lists these parameters of the L5 RTP (Real Time Protocol) layer. RTP Datagrams are defined in IETF RFC 3550.
– Version: Identifies the version of RTP and should be a value of 2.
– Padding: Indicates whether padding bytes are present. Possible values are:
false: Indicates no extra padding bytes are at the end of the RTP packet.
true: Indicates that padding octets have been added to the RTP packet that are not part of the payload.
– Extension: Indicates whether an extension is present. Possible values are:
false: Indicates no extension is present.
true: Indicates an extension is present.
– CSRC: Identifies the Contributing Source IDs. This value should be set to zero.
– Marker: This value should be set to 1 to indicate the last Media Datagram of the video frame. The value is set to 0 for all other Media Datagrams and should be 0 for most packets.
Note: For 2022-6 signals, the status indicator turns red if the Marker Bit Frequency does not match the frame rate indicated in the HBRMT header. For 2110 signals, the status indicator turns red if the Marker Bit Frequency does not match the measured field rate of the detected format.
– Payload type: Identifies the type of RTP payload.
– Sequence Number: RTP sequence counter changes in increments of one for each RTP Media Datagram that is sent.
– Time Stamp: The timestamp reflects the sampling instant of the first octet in the RTP datagram. This value can be used to determine packet sequence errors and jitter calculations to be made.
Note: For 2022-6 signals, the status indicator turns red if the Time Stamp field does not change at the rate of 27 MHz on every packet. For 2110 signals, the status indicator turns red if the Time Stamp field does not change at the start of every field or frame at the rate of 90 kHz on every packet.
– SSRC: Identifies the Synchronization Source ID and is set in compliance with RFC3550. This identifier is chosen randomly and should be unique so no two SSRC have the same value with an RTP session.
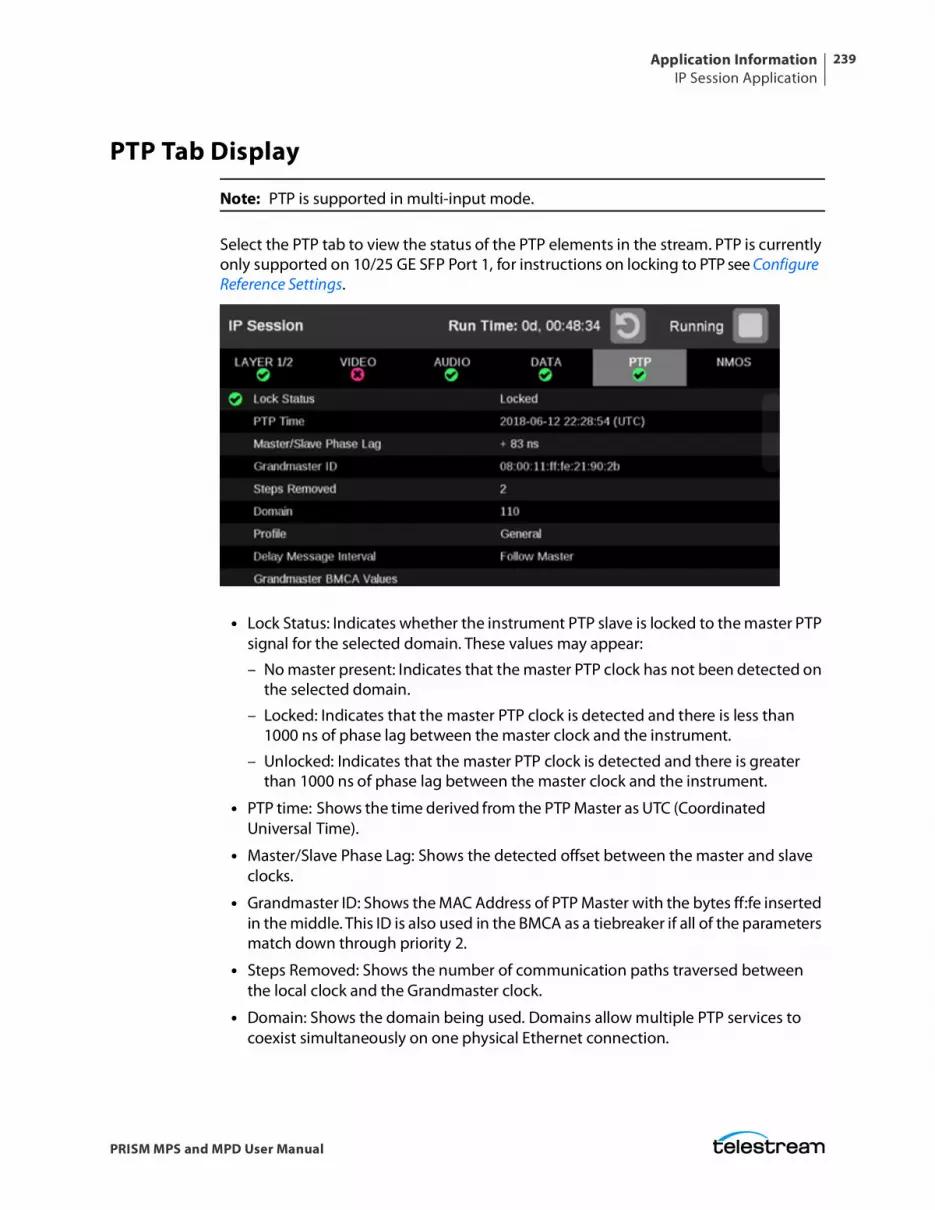
Application InformationIP Session Application
239
PRISM MPS and MPD User Manual
PTP Tab Display
Note: PTP is supported in multi-input mode.
Select the PTP tab to view the status of the PTP elements in the stream. PTP is currently only supported on 10/25 GE SFP Port 1, for instructions on locking to PTP see Configure Reference Settings.
• Lock Status: Indicates whether the instrument PTP slave is locked to the master PTP signal for the selected domain. These values may appear:
– No master present: Indicates that the master PTP clock has not been detected on the selected domain.
– Locked: Indicates that the master PTP clock is detected and there is less than 1000 ns of phase lag between the master clock and the instrument.
– Unlocked: Indicates that the master PTP clock is detected and there is greater than 1000 ns of phase lag between the master clock and the instrument.
• PTP time: Shows the time derived from the PTP Master as UTC (Coordinated Universal Time).
• Master/Slave Phase Lag: Shows the detected offset between the master and slave clocks.
• Grandmaster ID: Shows the MAC Address of PTP Master with the bytes ff:fe inserted in the middle. This ID is also used in the BMCA as a tiebreaker if all of the parameters match down through priority 2.
• Steps Removed: Shows the number of communication paths traversed between the local clock and the Grandmaster clock.
• Domain: Shows the domain being used. Domains allow multiple PTP services to coexist simultaneously on one physical Ethernet connection.
Application InformationIP Session Application
240
PRISM MPS and MPD User Manual
• Profile: Shows the profile being used: General, AES67, or ST2059. This is the user-selected profile set on the Settings > Reference configuration menu page and is not detected on the input.
• Delay Message Interval: For Multicast communication mode, the only delay message interval allowed is "Follow Master". In this mode, the slave sets the delay request rate according to the information sent by the master in the delay response message.
Note: The PRISM monitor currently supports Multicast communication mode and SMPTE mixed mode without negotiation.
• Grandmaster BCMA Values: Lists these values for the Grandmaster BCMA (Best Master Clock Algorithm) in order of precedence:
– Priority 1: This parameter defines which clocks are allowed to be considered as masters. To be considered as a master, the value should be set to 128 or less. Priority 1 is the first criteria in the BMCA, so if Priority 1 is set to a lower value than other devices on the system, then it is chosen even if the clock quality is poor. Typically, all the masters in a domain should have the same value for the Priority 1 parameter.
– Clock Class: This value characterizes the TAI (International Atomic Time) traceability. The clock class value varies to indicate the type of reference in use by the Grandmaster clock. For example, when locked to GPS the PTP grandmaster reports a class 6. However, if in holdover mode after locking to GPS, then it reports a class of 7.
– Clock Accuracy: This value characterizes the clock accuracy for the purpose of determining the best master clock.
– Clock Variance: This value is reported by the PTP master to indicate the variance of the clock over a one second interval. A lower number indicates a more stable clock and is preferred by the BMCA.
– Priority 2: This parameter is used to break the tie between masters that have the same clock quality. Several values may be used to define a hierarchy of devices. Most profiles use 128 as a default, so a value of 127 or lower would indicate a preferred master.
• Clock Source: The clock source field is not used by the BMCA. The field is set to indicate the type of reference in use by the Grandmaster clock.
• Communication Mode: There are three basic message modes for PTP: Multicast, Unicast, and mixed Multicast and Unicast. For full Multicast or Unicast modes, all of the PTP messages are sent in the selected mode type.
Application InformationIP Session Application
241
PRISM MPS and MPD User Manual
Note: The PRISM monitor currently supports Multicast communication mode and SMPTE mixed mode without negotiation. In later firmware releases, other communication modes will be supported.
For some profiles, such as some telecom profiles and the SMPTE ST2059 profile, a mixture of Multicast and Unicast are allowed. On the SMPTE profile unique mixed mode, the Announce and Sync messages are sent as multicast. However, the Delay request and Delay Response messages are sent as Unicast.
– Some points to understand about communication modes:
– Whatever mode is chosen, the master and slave must match or be compatible.
– Multicast and Mixed mode may need IGMP joins and leaves Full Unicast must have the master address in all slave AMTs.
– Unicast without negotiation does not allow master to regulate load.
– Two masters can be used on different domains to serve slaves on different communication modes.
• Delay Mechanism: Shows the delay mechanism mode being used:
Note: The PRISM monitor currently supports only the End-to-End delay mechanism.
– End-to-End: In this mode, the sync, follow up, delay request, and delay response messages go through the network all the way between the master and slave. End-to-End mode is useful in PTP networks where some or all devices are not PTP aware.
– Peer-to-Peer: In this mode, the Pdelay request and Pdelay response messages are local to each link in the network. Each device determines the local link and device delays. The sync message from the master then collects the corrections as it propagates from the master to slave. Peer-to-Peer mode is useful in PTP networks where the routing configuration changes. For Peer-to-Peer mode to work well, all of the devices need to be PTP aware.
• Message rates:
– Announce: Displays the rate of the Announce messages received from the master. Typical values are 1 to 4 messages a second, but a wide range is allowed by some profiles. If the value is lower than expected, it may indicate a problem in the network or the master.
– Sync: Displays the rate of the Sync messages received from the master. Typical values are 1 to 16 messages a second, but some profiles allow much higher rates. If the value is lower than expected, it may indicate a problem in the network or the master.
– Delay Request: Displays the rate of the Delay Request messages sent by the slave. In multi-cast mode, the Delay Request rate is required to be set in response to a field in the Delay Response message from the master. Typically the master sets this field such that the Delay Request message rate is equal to the Sync message rate.
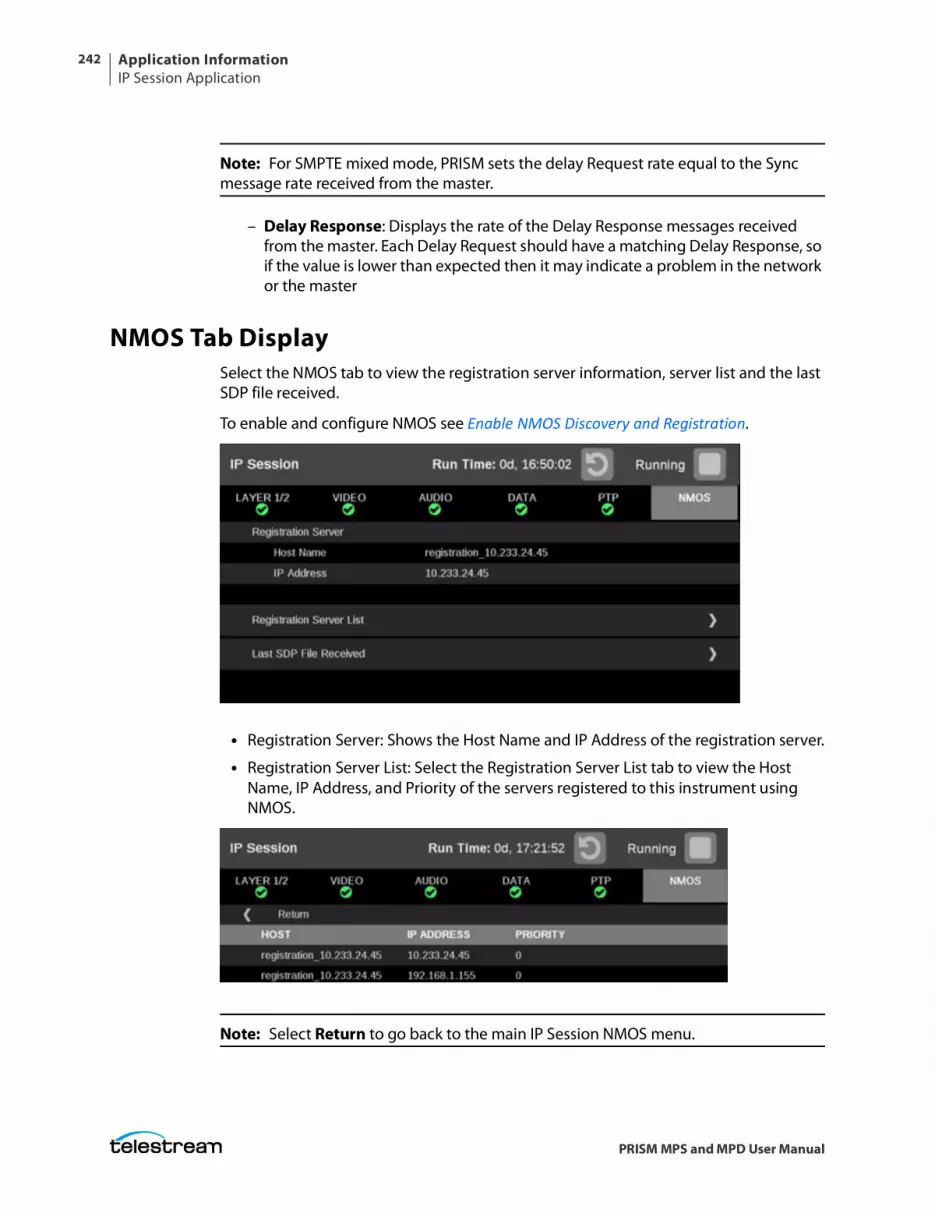
Application InformationIP Session Application
242
PRISM MPS and MPD User Manual
Note: For SMPTE mixed mode, PRISM sets the delay Request rate equal to the Sync message rate received from the master.
– Delay Response: Displays the rate of the Delay Response messages received from the master. Each Delay Request should have a matching Delay Response, so if the value is lower than expected then it may indicate a problem in the network or the master
NMOS Tab DisplaySelect the NMOS tab to view the registration server information, server list and the last SDP file received.
To enable and configure NMOS see Enable NMOS Discovery and Registration.
• Registration Server: Shows the Host Name and IP Address of the registration server.
• Registration Server List: Select the Registration Server List tab to view the Host Name, IP Address, and Priority of the servers registered to this instrument using NMOS.
Note: Select Return to go back to the main IP Session NMOS menu.
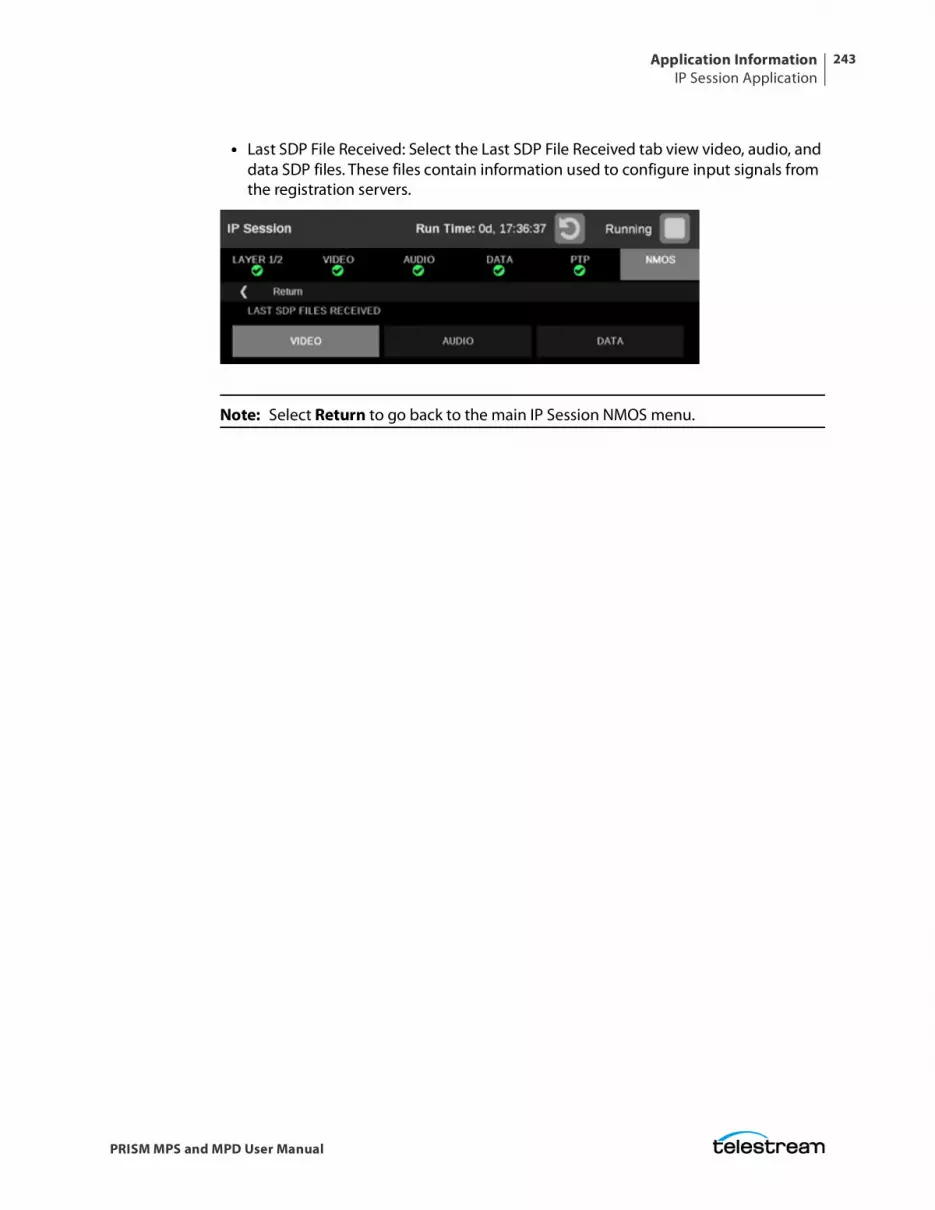
Application InformationIP Session Application
243
PRISM MPS and MPD User Manual
• Last SDP File Received: Select the Last SDP File Received tab view video, audio, and data SDP files. These files contain information used to configure input signals from the registration servers.
Note: Select Return to go back to the main IP Session NMOS menu.
Application InformationIP Graphs Application
244
PRISM MPS and MPD User Manual
IP Graphs ApplicationNote: IP Graphs are not supported in multi-input mode because IP inputs are not supported in multi-input mode.
Use the IP Graphs application to view various graphs that show aspects of the IP stream. As you scroll through the various graphs, the top of the selected graph moves to the top of the display area to help view the complete graph. The displayed graph is included in a saved preset.
Note: The application is only available in MPS and MPD-200 and -300 models.
Note: Option MPSDP-IP-MEAS must be installed to use the IP Graphs application.
If ST2022-7 monitoring is configured, the IP Graphs application includes Path 1 and Path 2. The graph data can be switched between viewing only Path 1, only Path 2, or both by selecting the Path button in the upper right of the screen.
Note: The Path button only works with 2022-7 seamless switching enabled in input configuration.
Note: If 2110 monitoring is configured, you can select Video, Audio (1 stream at a time, selectable in Tile Settings), or Data.
If ST2022-6 monitoring is configured, the IP Graphs include:
Video CRC Error graph: The Video CRC Error graph shows any present CRC errors in the currently decoded signal and can be compared to other time graphs such as RTP Sequence Errors.
TS-DF graph: The TS-DF graph shows the Time Stamped Delay Factor, as defined in EBU Tech 3337, which is a method for measuring network jitter in RTP streams.
IP Graphs Settings Menu
Note: The Move icon ( ) is in the settings menu header. Select this icon to move the settings left of right.
Open the IP FGraphs Settings menu:
1. Select the Tiles icon ( ).
2. Select the tile with the IP Graphs application.
3. Select the Tile icon ( ).
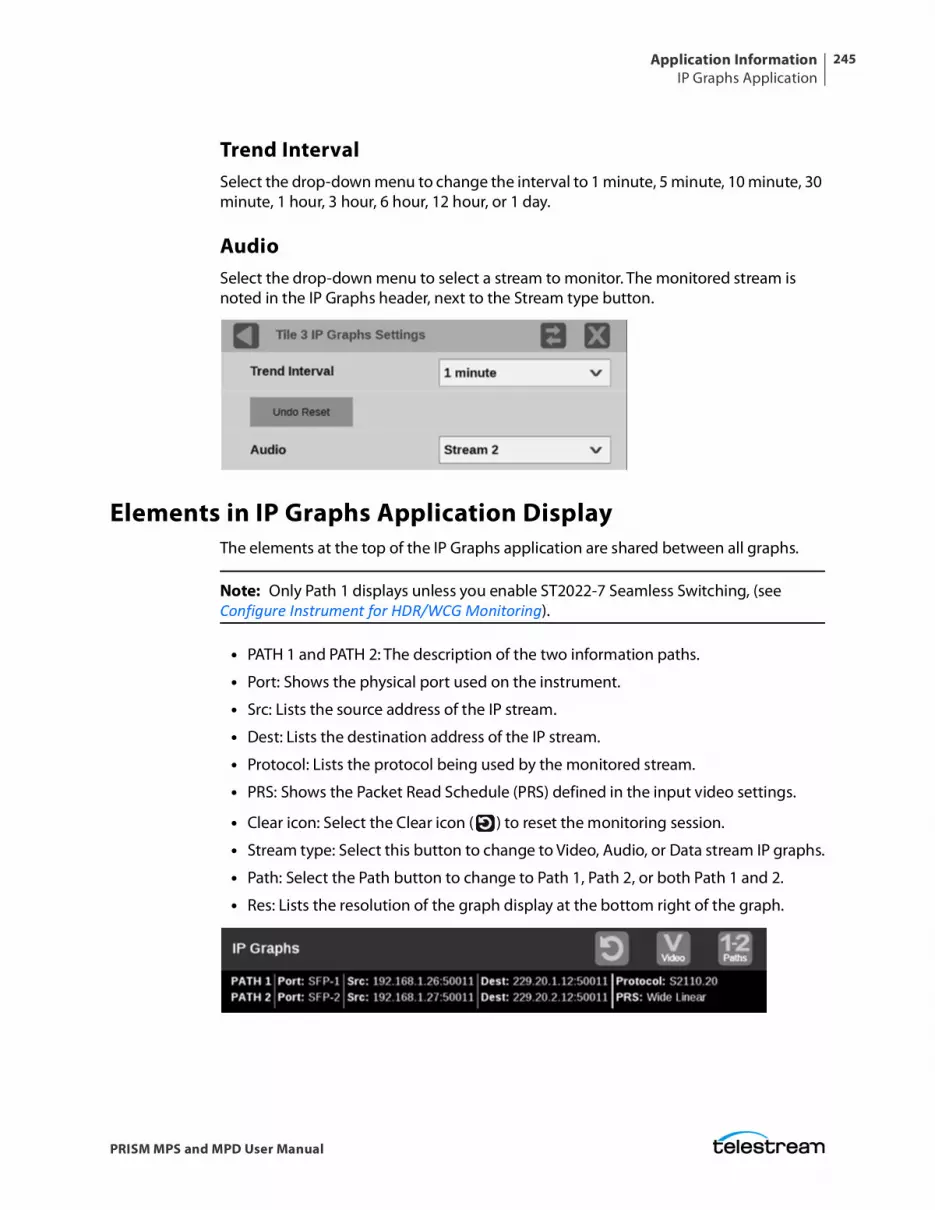
Application InformationIP Graphs Application
245
PRISM MPS and MPD User Manual
Trend IntervalSelect the drop-down menu to change the interval to 1 minute, 5 minute, 10 minute, 30 minute, 1 hour, 3 hour, 6 hour, 12 hour, or 1 day.
AudioSelect the drop-down menu to select a stream to monitor. The monitored stream is noted in the IP Graphs header, next to the Stream type button.
Elements in IP Graphs Application Display The elements at the top of the IP Graphs application are shared between all graphs.
Note: Only Path 1 displays unless you enable ST2022-7 Seamless Switching, (see Configure Instrument for HDR/WCG Monitoring).
• PATH 1 and PATH 2: The description of the two information paths.
• Port: Shows the physical port used on the instrument.
• Src: Lists the source address of the IP stream.
• Dest: Lists the destination address of the IP stream.
• Protocol: Lists the protocol being used by the monitored stream.
• PRS: Shows the Packet Read Schedule (PRS) defined in the input video settings.
• Clear icon: Select the Clear icon ( ) to reset the monitoring session.
• Stream type: Select this button to change to Video, Audio, or Data stream IP graphs.
• Path: Select the Path button to change to Path 1, Path 2, or both Path 1 and 2.
• Res: Lists the resolution of the graph display at the bottom right of the graph.
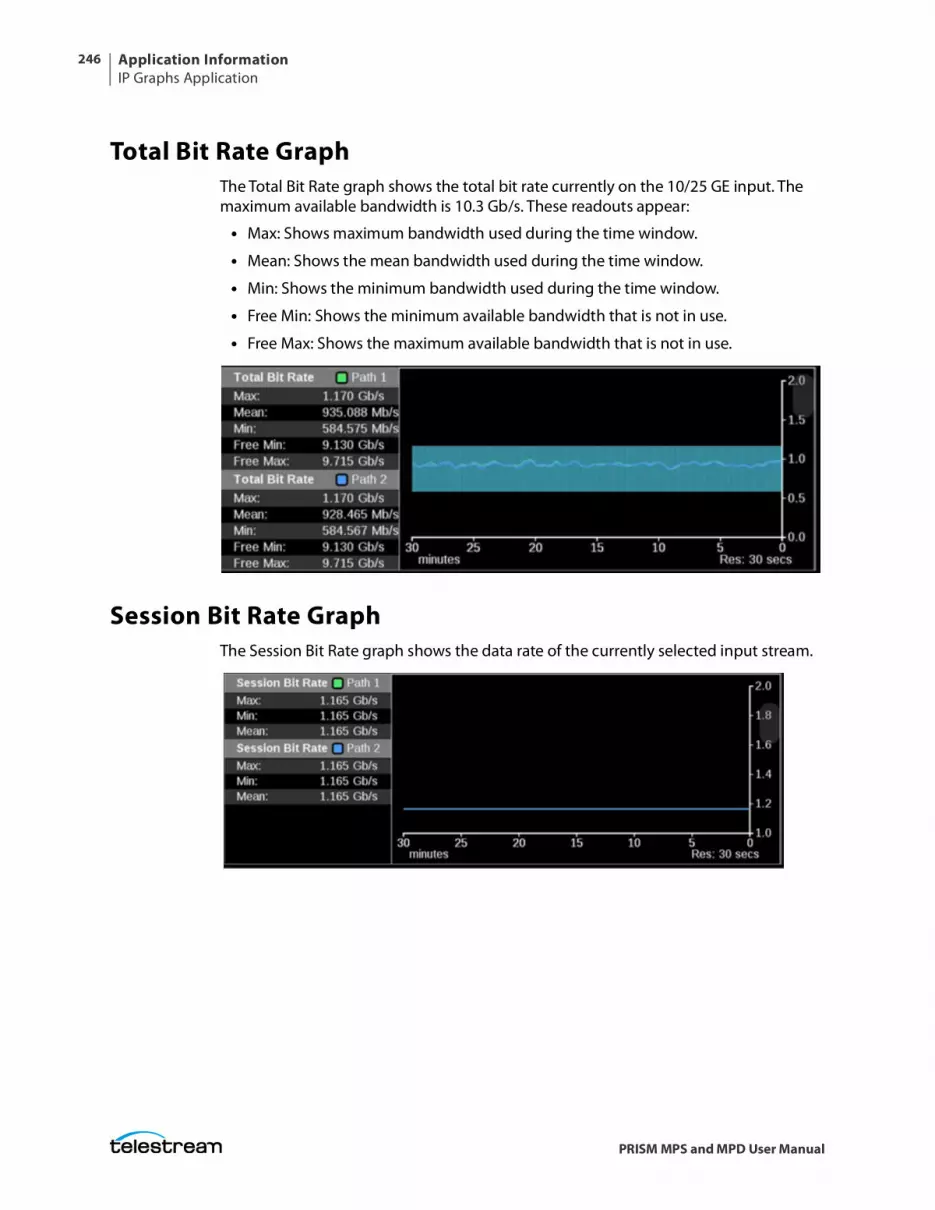
Application InformationIP Graphs Application
246
PRISM MPS and MPD User Manual
Total Bit Rate GraphThe Total Bit Rate graph shows the total bit rate currently on the 10/25 GE input. The maximum available bandwidth is 10.3 Gb/s. These readouts appear:
• Max: Shows maximum bandwidth used during the time window.
• Mean: Shows the mean bandwidth used during the time window.
• Min: Shows the minimum bandwidth used during the time window.
• Free Min: Shows the minimum available bandwidth that is not in use.
• Free Max: Shows the maximum available bandwidth that is not in use.
Session Bit Rate GraphThe Session Bit Rate graph shows the data rate of the currently selected input stream.
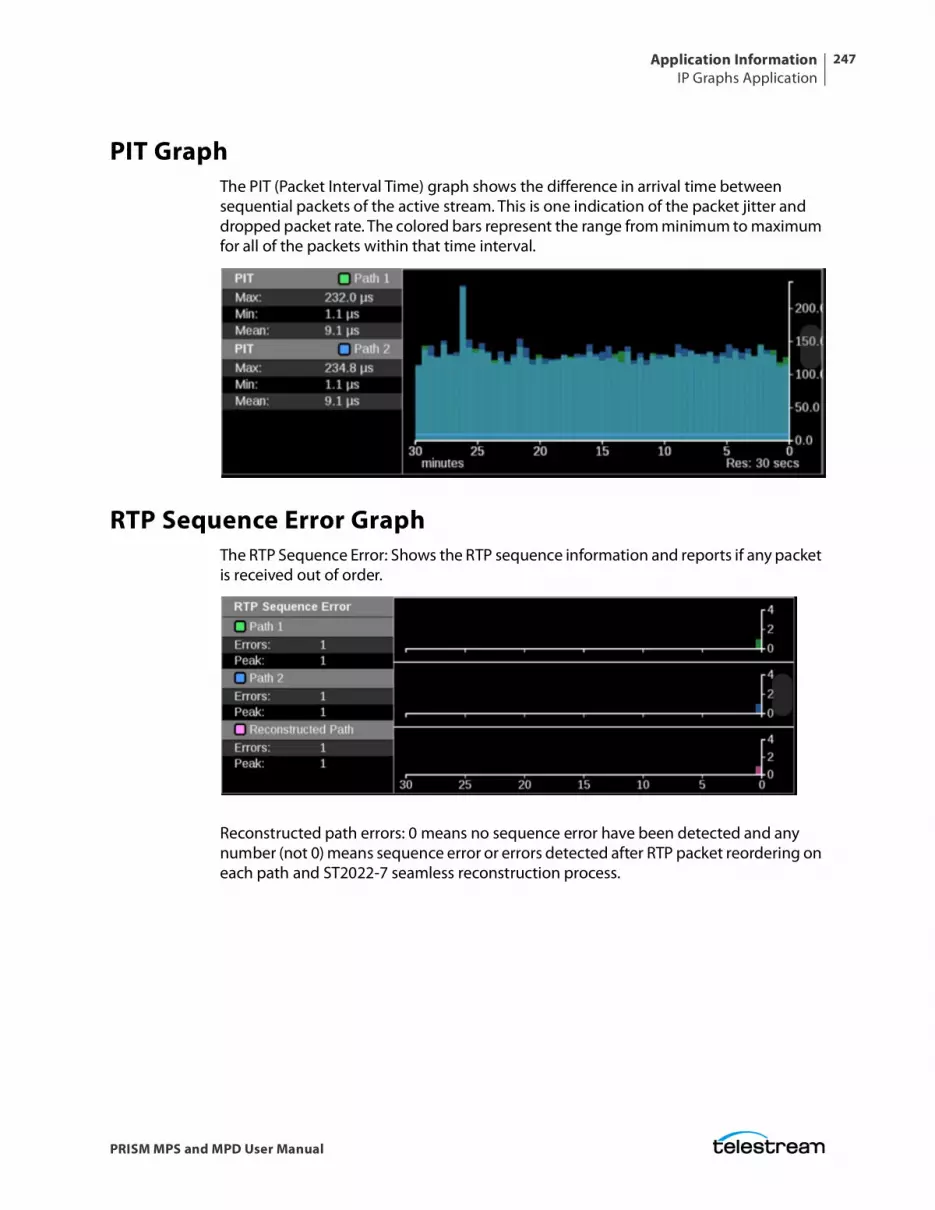
Application InformationIP Graphs Application
247
PRISM MPS and MPD User Manual
PIT GraphThe PIT (Packet Interval Time) graph shows the difference in arrival time between sequential packets of the active stream. This is one indication of the packet jitter and dropped packet rate. The colored bars represent the range from minimum to maximum for all of the packets within that time interval.
RTP Sequence Error GraphThe RTP Sequence Error: Shows the RTP sequence information and reports if any packet is received out of order.
Reconstructed path errors: 0 means no sequence error have been detected and any number (not 0) means sequence error or errors detected after RTP packet reordering on each path and ST2022-7 seamless reconstruction process.
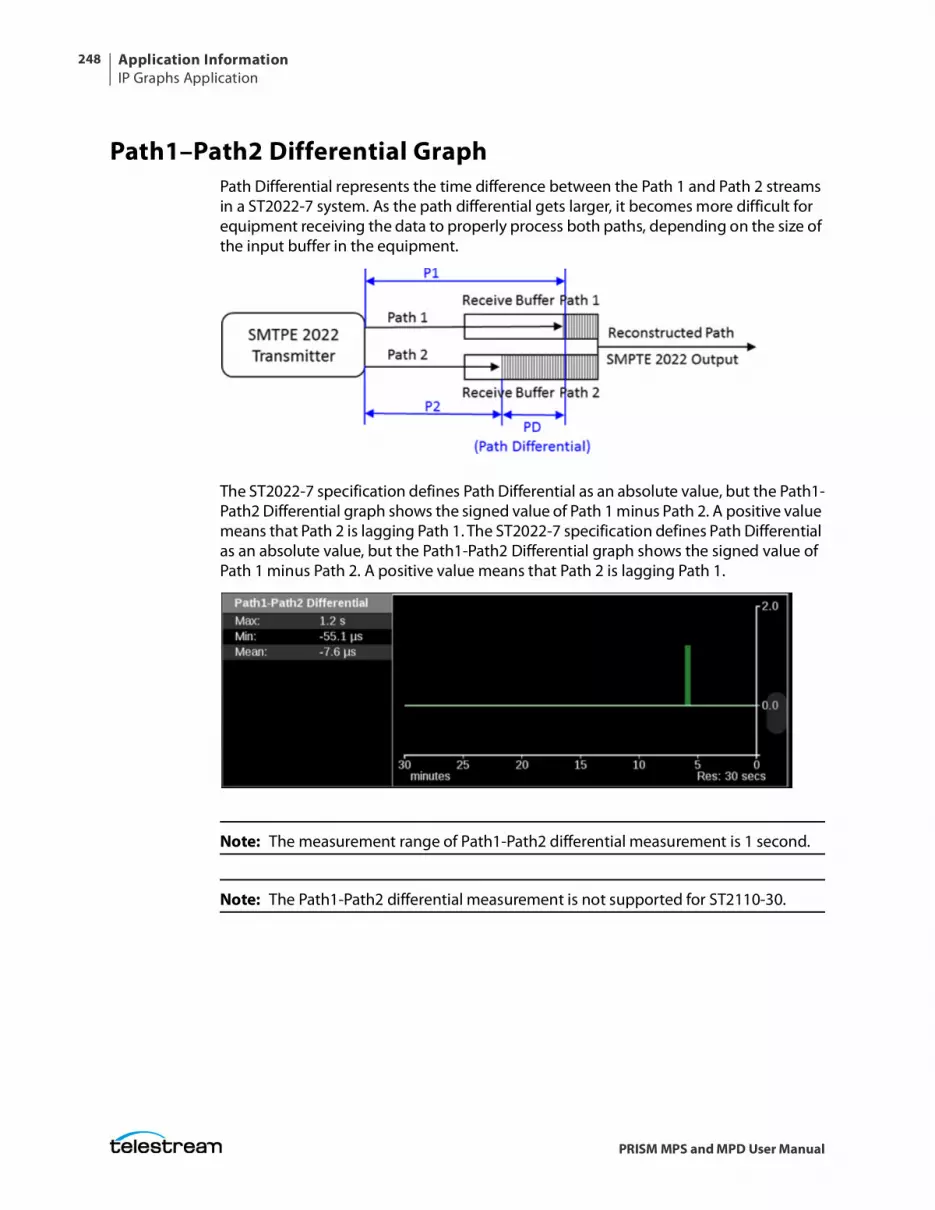
Application InformationIP Graphs Application
248
PRISM MPS and MPD User Manual
Path1–Path2 Differential GraphPath Differential represents the time difference between the Path 1 and Path 2 streams in a ST2022-7 system. As the path differential gets larger, it becomes more difficult for equipment receiving the data to properly process both paths, depending on the size of the input buffer in the equipment.
The ST2022-7 specification defines Path Differential as an absolute value, but the Path1-Path2 Differential graph shows the signed value of Path 1 minus Path 2. A positive value means that Path 2 is lagging Path 1. The ST2022-7 specification defines Path Differential as an absolute value, but the Path1-Path2 Differential graph shows the signed value of Path 1 minus Path 2. A positive value means that Path 2 is lagging Path 1.
Note: The measurement range of Path1-Path2 differential measurement is 1 second.
Note: The Path1-Path2 differential measurement is not supported for ST2110-30.
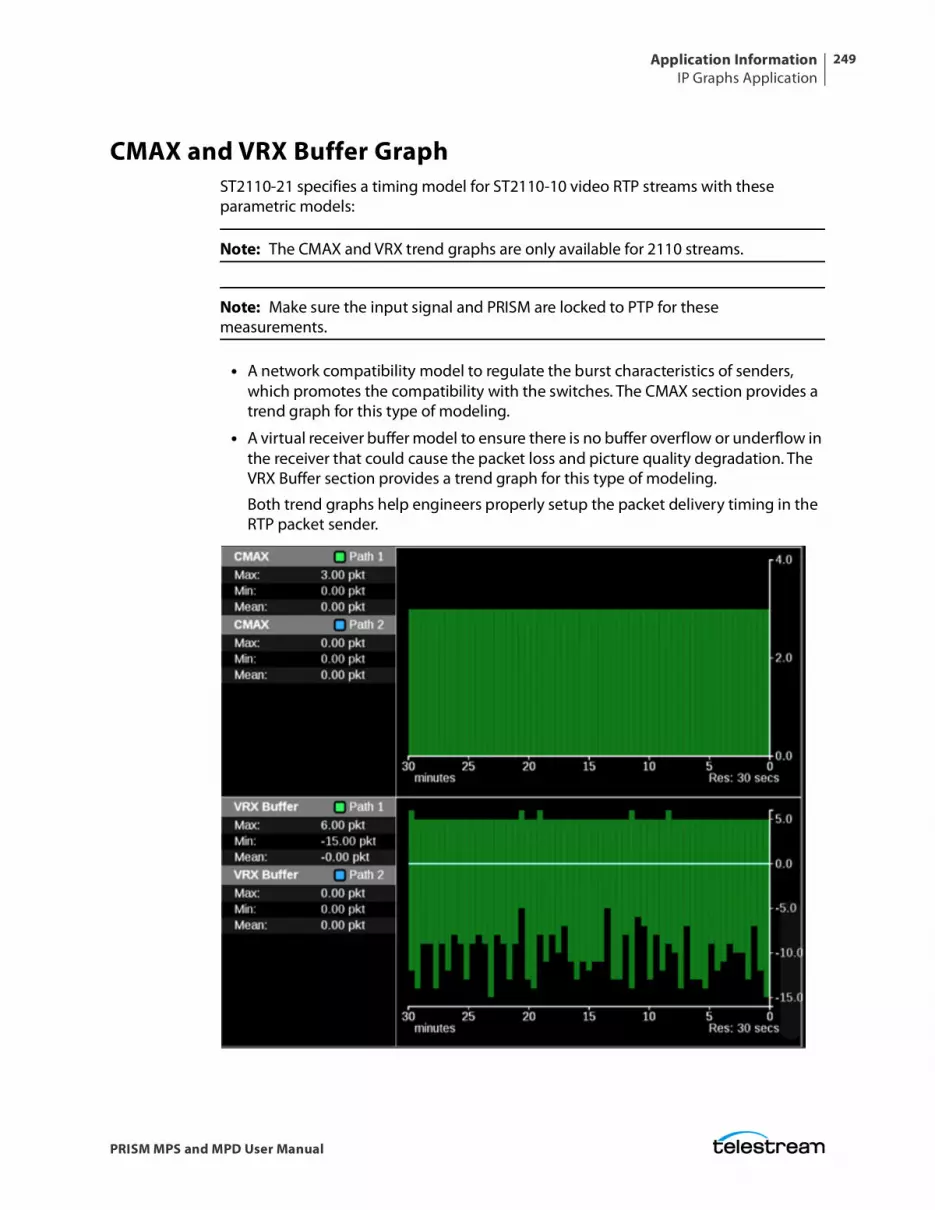
Application InformationIP Graphs Application
249
PRISM MPS and MPD User Manual
CMAX and VRX Buffer GraphST2110-21 specifies a timing model for ST2110-10 video RTP streams with these parametric models:
Note: The CMAX and VRX trend graphs are only available for 2110 streams.
Note: Make sure the input signal and PRISM are locked to PTP for these measurements.
• A network compatibility model to regulate the burst characteristics of senders, which promotes the compatibility with the switches. The CMAX section provides a trend graph for this type of modeling.
• A virtual receiver buffer model to ensure there is no buffer overflow or underflow in the receiver that could cause the packet loss and picture quality degradation. The VRX Buffer section provides a trend graph for this type of modeling.
Both trend graphs help engineers properly setup the packet delivery timing in the RTP packet sender.
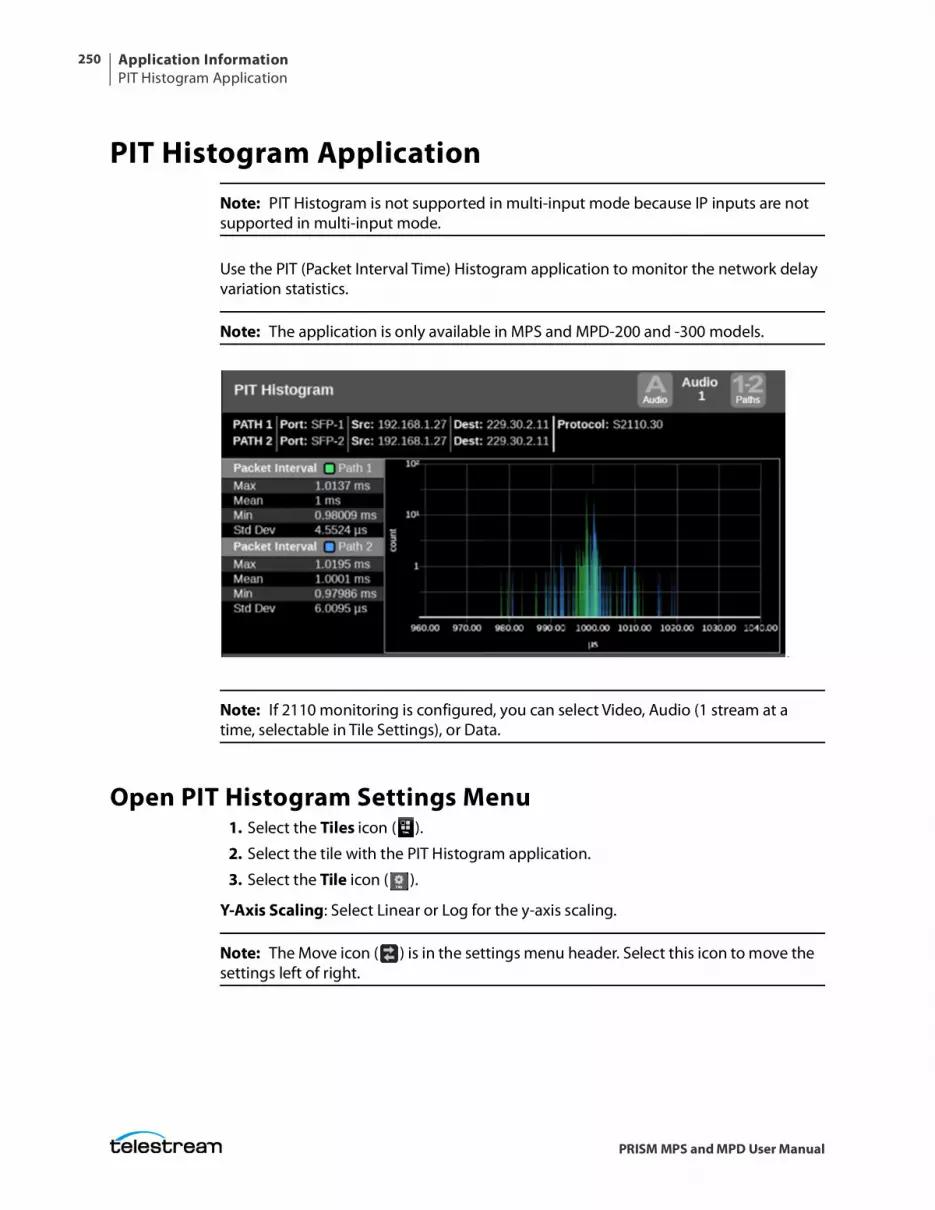
Application InformationPIT Histogram Application
250
PRISM MPS and MPD User Manual
PIT Histogram ApplicationNote: PIT Histogram is not supported in multi-input mode because IP inputs are not supported in multi-input mode.
Use the PIT (Packet Interval Time) Histogram application to monitor the network delay variation statistics.
Note: The application is only available in MPS and MPD-200 and -300 models.
-
Note: If 2110 monitoring is configured, you can select Video, Audio (1 stream at a time, selectable in Tile Settings), or Data.
Open PIT Histogram Settings Menu1. Select the Tiles icon ( ).
2. Select the tile with the PIT Histogram application.
3. Select the Tile icon ( ).
Y-Axis Scaling: Select Linear or Log for the y-axis scaling.
Note: The Move icon ( ) is in the settings menu header. Select this icon to move the settings left of right.
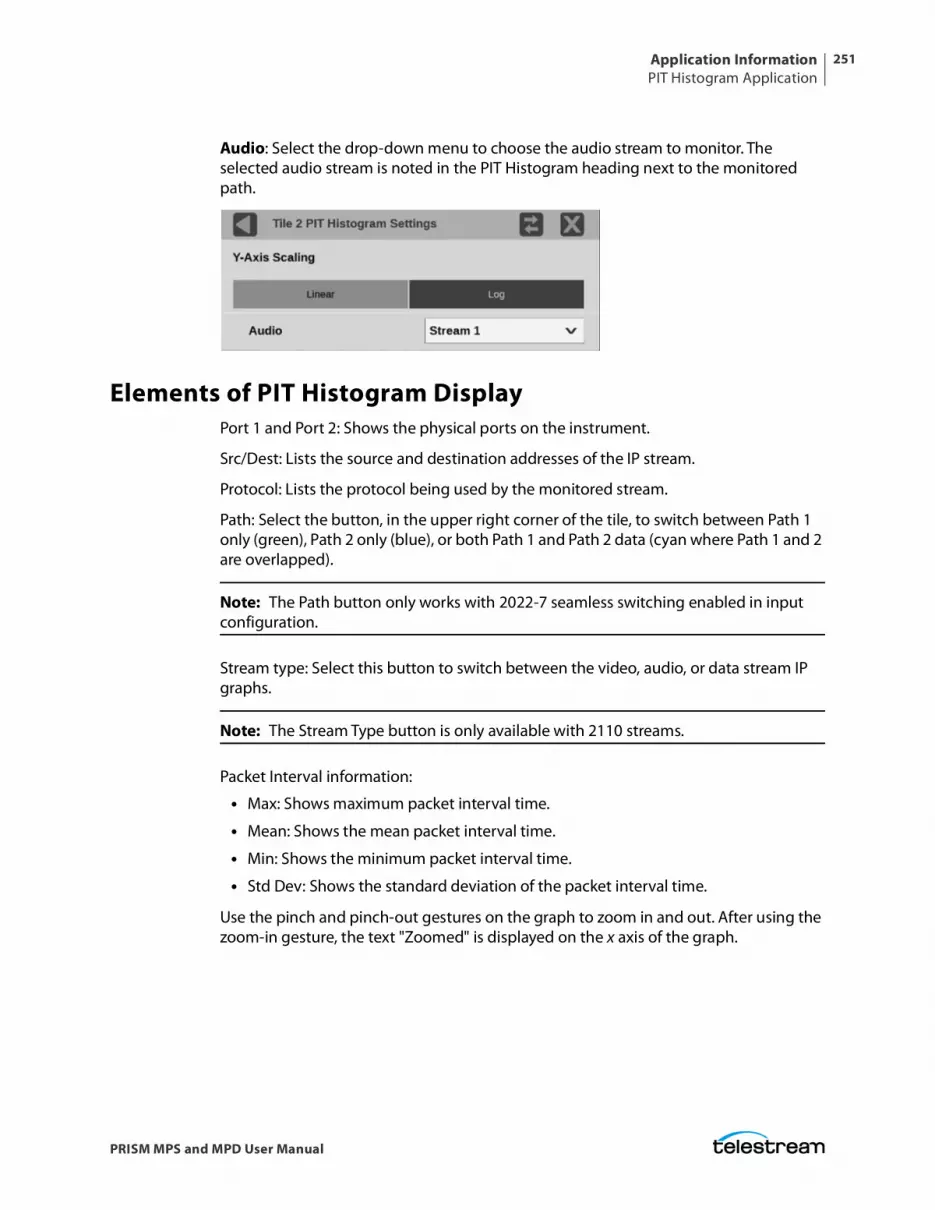
Application InformationPIT Histogram Application
251
PRISM MPS and MPD User Manual
Audio: Select the drop-down menu to choose the audio stream to monitor. The selected audio stream is noted in the PIT Histogram heading next to the monitored path.
Elements of PIT Histogram DisplayPort 1 and Port 2: Shows the physical ports on the instrument.
Src/Dest: Lists the source and destination addresses of the IP stream.
Protocol: Lists the protocol being used by the monitored stream.
Path: Select the button, in the upper right corner of the tile, to switch between Path 1 only (green), Path 2 only (blue), or both Path 1 and Path 2 data (cyan where Path 1 and 2 are overlapped).
Note: The Path button only works with 2022-7 seamless switching enabled in input configuration.
Stream type: Select this button to switch between the video, audio, or data stream IP graphs.
Note: The Stream Type button is only available with 2110 streams.
Packet Interval information:
• Max: Shows maximum packet interval time.
• Mean: Shows the mean packet interval time.
• Min: Shows the minimum packet interval time.
• Std Dev: Shows the standard deviation of the packet interval time.
Use the pinch and pinch-out gestures on the graph to zoom in and out. After using the zoom-in gesture, the text "Zoomed" is displayed on the x axis of the graph.
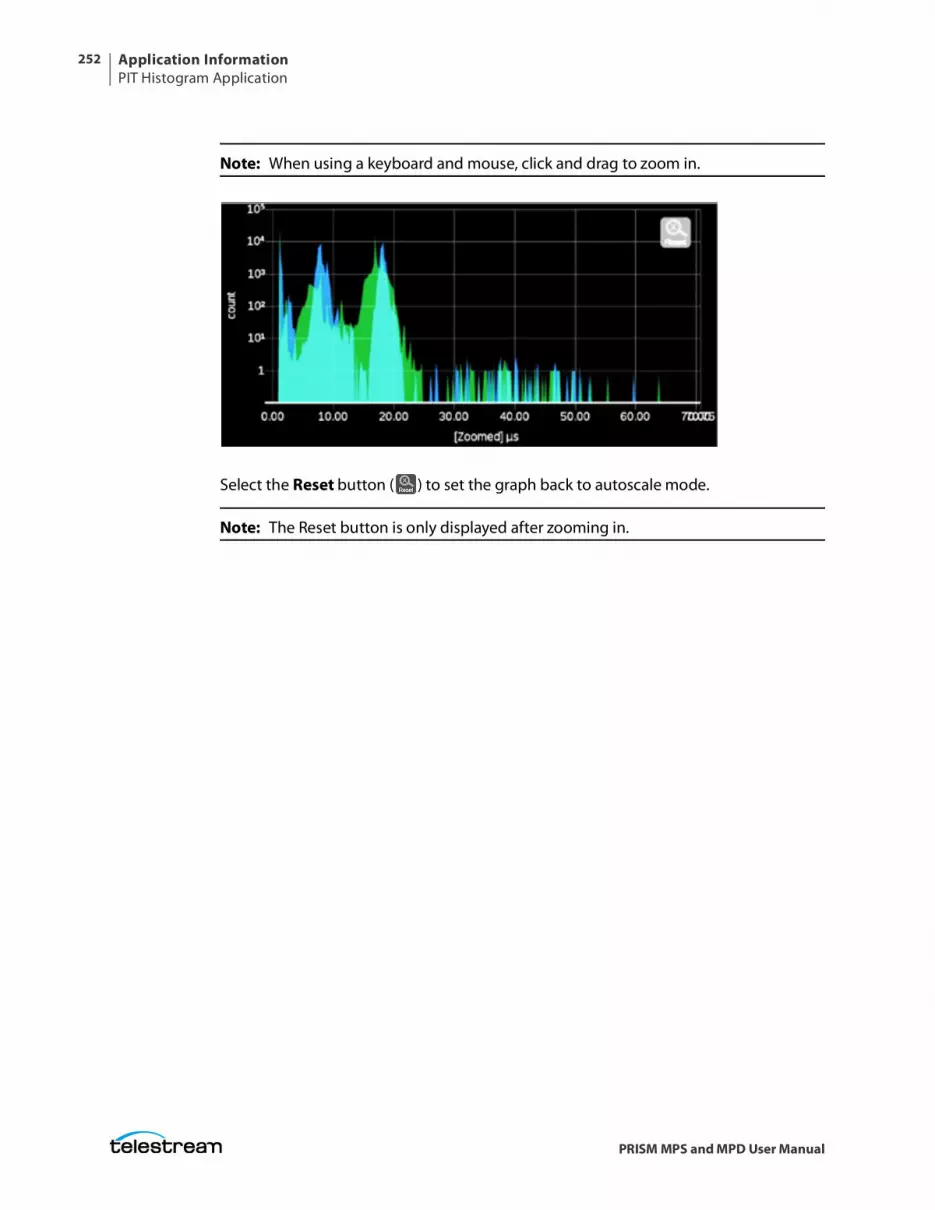
Application InformationPIT Histogram Application
252
PRISM MPS and MPD User Manual
Note: When using a keyboard and mouse, click and drag to zoom in.
Select the Reset button ( ) to set the graph back to autoscale mode.
Note: The Reset button is only displayed after zooming in.
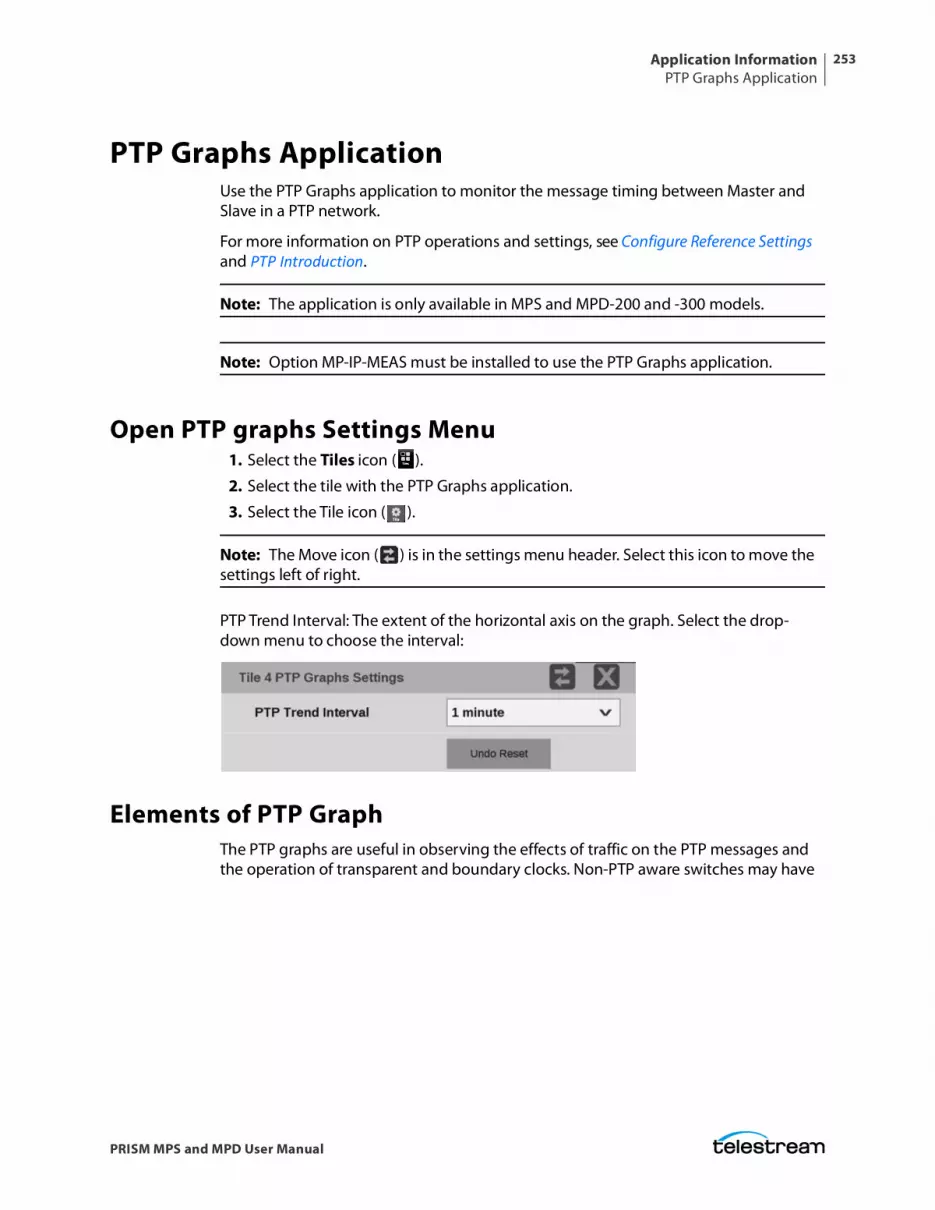
Application InformationPTP Graphs Application
253
PRISM MPS and MPD User Manual
PTP Graphs ApplicationUse the PTP Graphs application to monitor the message timing between Master and Slave in a PTP network.
For more information on PTP operations and settings, see Configure Reference Settings and PTP Introduction.
Note: The application is only available in MPS and MPD-200 and -300 models.
Note: Option MP-IP-MEAS must be installed to use the PTP Graphs application.
Open PTP graphs Settings Menu1. Select the Tiles icon ( ).
2. Select the tile with the PTP Graphs application.
3. Select the Tile icon ( ).
Note: The Move icon ( ) is in the settings menu header. Select this icon to move the settings left of right.
PTP Trend Interval: The extent of the horizontal axis on the graph. Select the drop-down menu to choose the interval:
Elements of PTP GraphThe PTP graphs are useful in observing the effects of traffic on the PTP messages and the operation of transparent and boundary clocks. Non-PTP aware switches may have
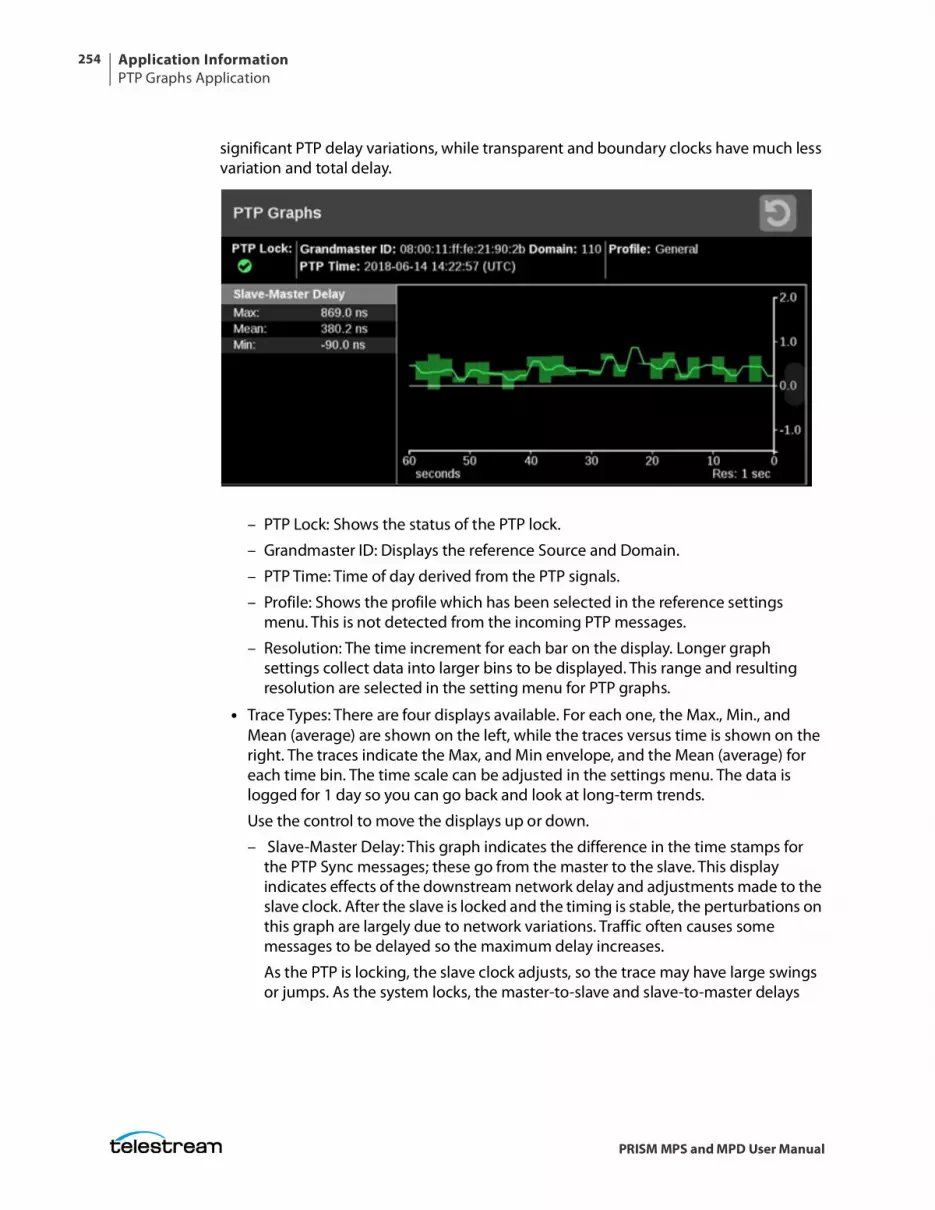
Application InformationPTP Graphs Application
254
PRISM MPS and MPD User Manual
significant PTP delay variations, while transparent and boundary clocks have much less variation and total delay.
– PTP Lock: Shows the status of the PTP lock.
– Grandmaster ID: Displays the reference Source and Domain.
– PTP Time: Time of day derived from the PTP signals.
– Profile: Shows the profile which has been selected in the reference settings menu. This is not detected from the incoming PTP messages.
– Resolution: The time increment for each bar on the display. Longer graph settings collect data into larger bins to be displayed. This range and resulting resolution are selected in the setting menu for PTP graphs.
• Trace Types: There are four displays available. For each one, the Max., Min., and Mean (average) are shown on the left, while the traces versus time is shown on the right. The traces indicate the Max, and Min envelope, and the Mean (average) for each time bin. The time scale can be adjusted in the settings menu. The data is logged for 1 day so you can go back and look at long-term trends.
Use the control to move the displays up or down.
– Slave-Master Delay: This graph indicates the difference in the time stamps for the PTP Sync messages; these go from the master to the slave. This display indicates effects of the downstream network delay and adjustments made to the slave clock. After the slave is locked and the timing is stable, the perturbations on this graph are largely due to network variations. Traffic often causes some messages to be delayed so the maximum delay increases.
As the PTP is locking, the slave clock adjusts, so the trace may have large swings or jumps. As the system locks, the master-to-slave and slave-to-master delays
Application InformationPTP Graphs Application
255
PRISM MPS and MPD User Manual
should converge on the same value. This value represents the average network delay between the master and slave for the traffic in both directions.
If the network delay is too unstable, then the PTP might never lock. This appears as large variations on this trace.
– Master Slave Variation: The master-to-slave variation graph is derived from the same data as the master-to-slave delay. The absolute value of the changes in delay are filtered according to RFC1889 and displayed. This display then shows a measure of the variation of the network delay. A low value indicates a PTP slave is likely to quickly lock, a large value indicates it could be difficult for a PTP slave to lock.
– Slave to Master Delay: This graph indicates the difference in the time stamps for the PTP Delay Request messages that go from the slave to the master. This display indicates effects of the upstream network delay and adjustments made to the slave clock. After the slave is locked and the timing is stable, the perturbations on this graph are largely due to network variations. Traffic often causes some messages to be delayed so the maximum delay increases.
As the PTP is locking, the slave clock adjusts, so the trace may have large swings or jumps. As the system locks, the master-to-slave and slave-to master-delays should converge on the same value. This value represents the average network delay between the master and slave for the traffic in both directions.
If the network delay is too unstable, then the PTP might never lock. This appears as large variations on this trace.
– Slave to Master Variation: The master-to-slave variation is derived from the same data as the master-to-slave delay. The absolute value of the changes in delay are filtered according to RFC1889 and displayed. This display then shows a measure of the variation of the network delay. A low value indicates a PTP slave is likely to quickly lock. A large value indicates it could be difficult for a PTP slave to lock.
– PTP Phase Lag: The graph shows the error in the slave clock phase as measured by the PTP time stamps. This value is used to adjust the slave clock to drive the error toward zero.
The PTP phase lag is the phase error of the phase-locked loop, which controls the slave clock. The phase lag is a reasonable estimate of how well the PTP slave is locked to the master; however, the phase lag does not indicate if there is any asymmetry in the network.
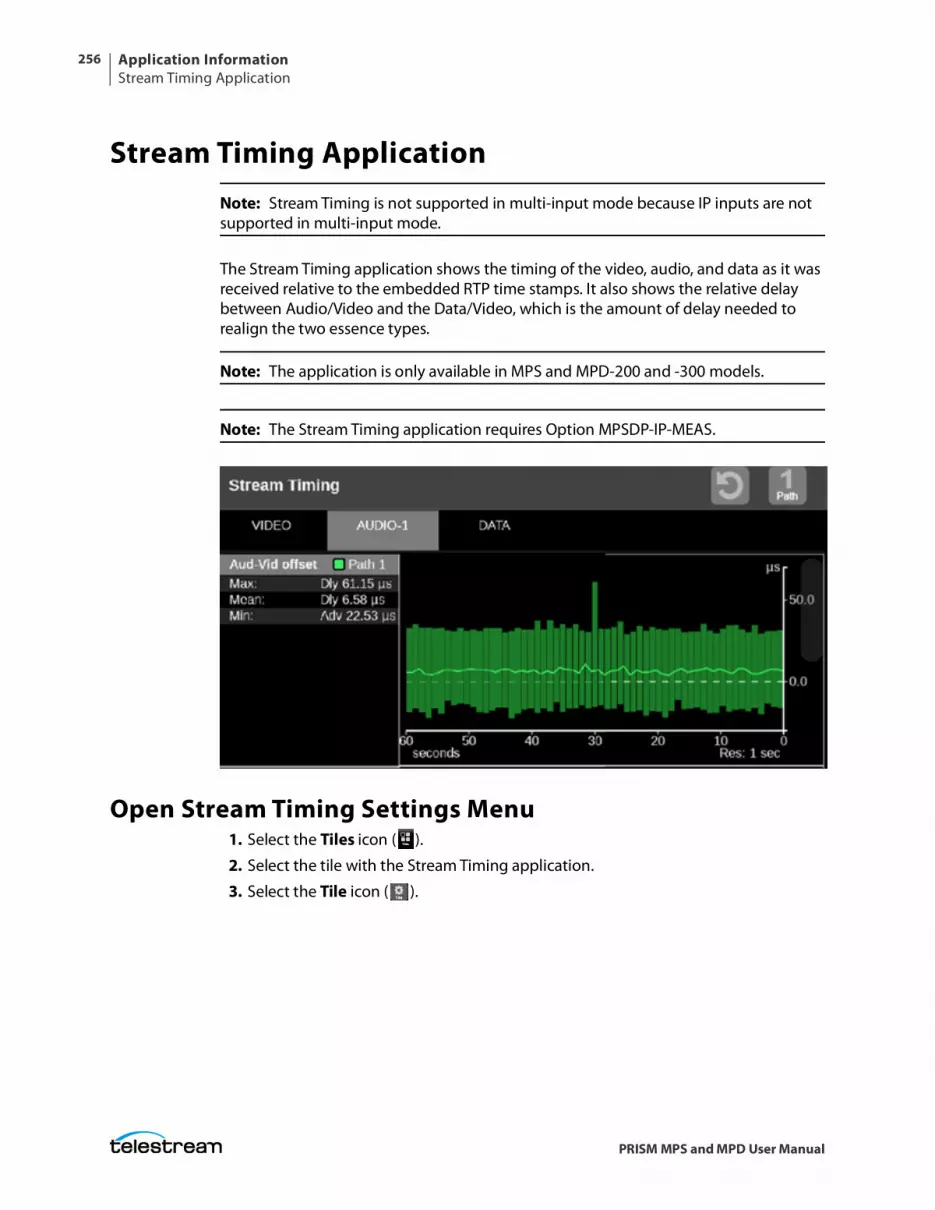
Application InformationStream Timing Application
256
PRISM MPS and MPD User Manual
Stream Timing ApplicationNote: Stream Timing is not supported in multi-input mode because IP inputs are not supported in multi-input mode.
The Stream Timing application shows the timing of the video, audio, and data as it was received relative to the embedded RTP time stamps. It also shows the relative delay between Audio/Video and the Data/Video, which is the amount of delay needed to realign the two essence types.
Note: The application is only available in MPS and MPD-200 and -300 models.
Note: The Stream Timing application requires Option MPSDP-IP-MEAS.
Open Stream Timing Settings Menu1. Select the Tiles icon ( ).
2. Select the tile with the Stream Timing application.
3. Select the Tile icon ( ).
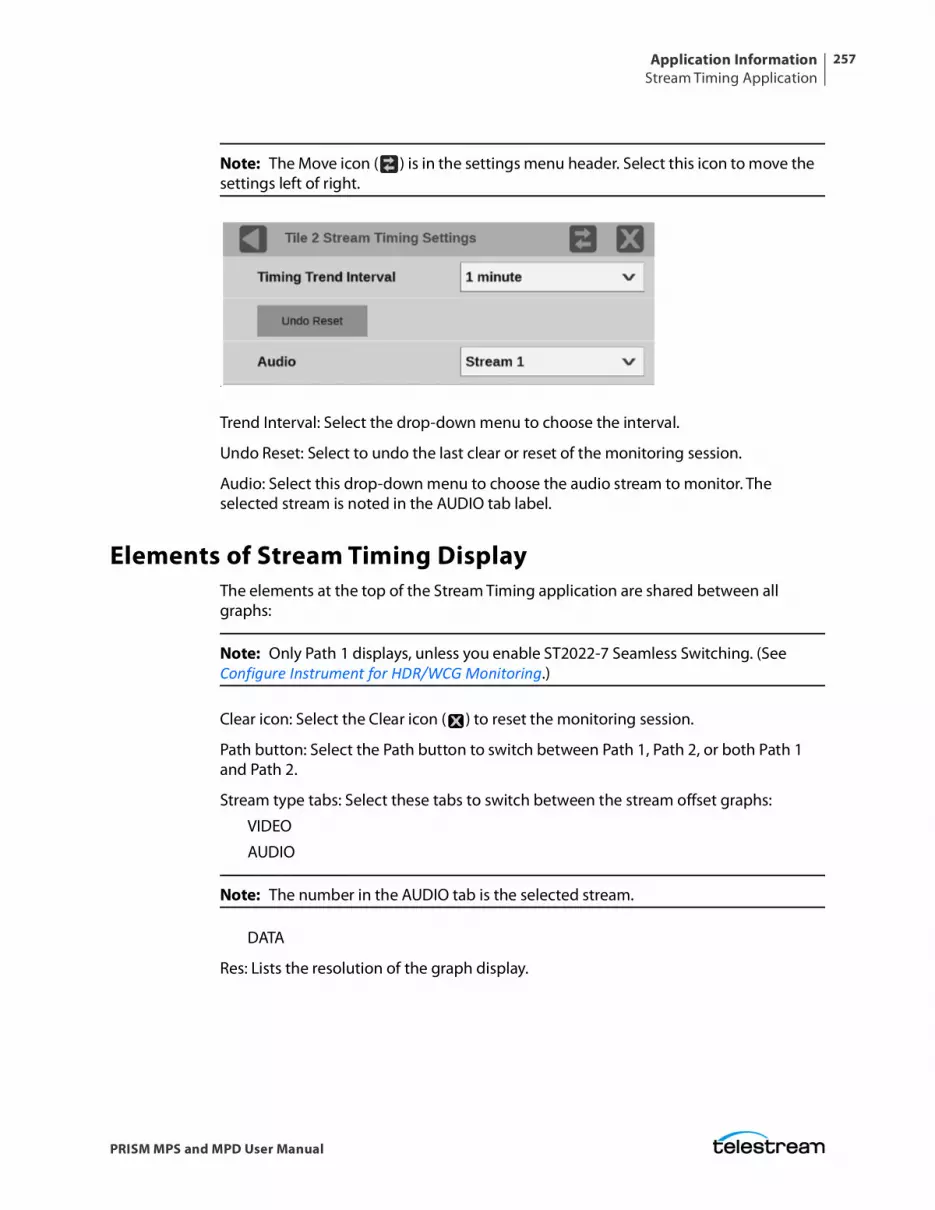
Application InformationStream Timing Application
257
PRISM MPS and MPD User Manual
Note: The Move icon ( ) is in the settings menu header. Select this icon to move the settings left of right.
.
Trend Interval: Select the drop-down menu to choose the interval.
Undo Reset: Select to undo the last clear or reset of the monitoring session.
Audio: Select this drop-down menu to choose the audio stream to monitor. The selected stream is noted in the AUDIO tab label.
Elements of Stream Timing DisplayThe elements at the top of the Stream Timing application are shared between all graphs:
Note: Only Path 1 displays, unless you enable ST2022-7 Seamless Switching. (See Configure Instrument for HDR/WCG Monitoring.)
Clear icon: Select the Clear icon ( ) to reset the monitoring session.
Path button: Select the Path button to switch between Path 1, Path 2, or both Path 1 and Path 2.
Stream type tabs: Select these tabs to switch between the stream offset graphs:
VIDEO
AUDIO
Note: The number in the AUDIO tab is the selected stream.
DATA
Res: Lists the resolution of the graph display.
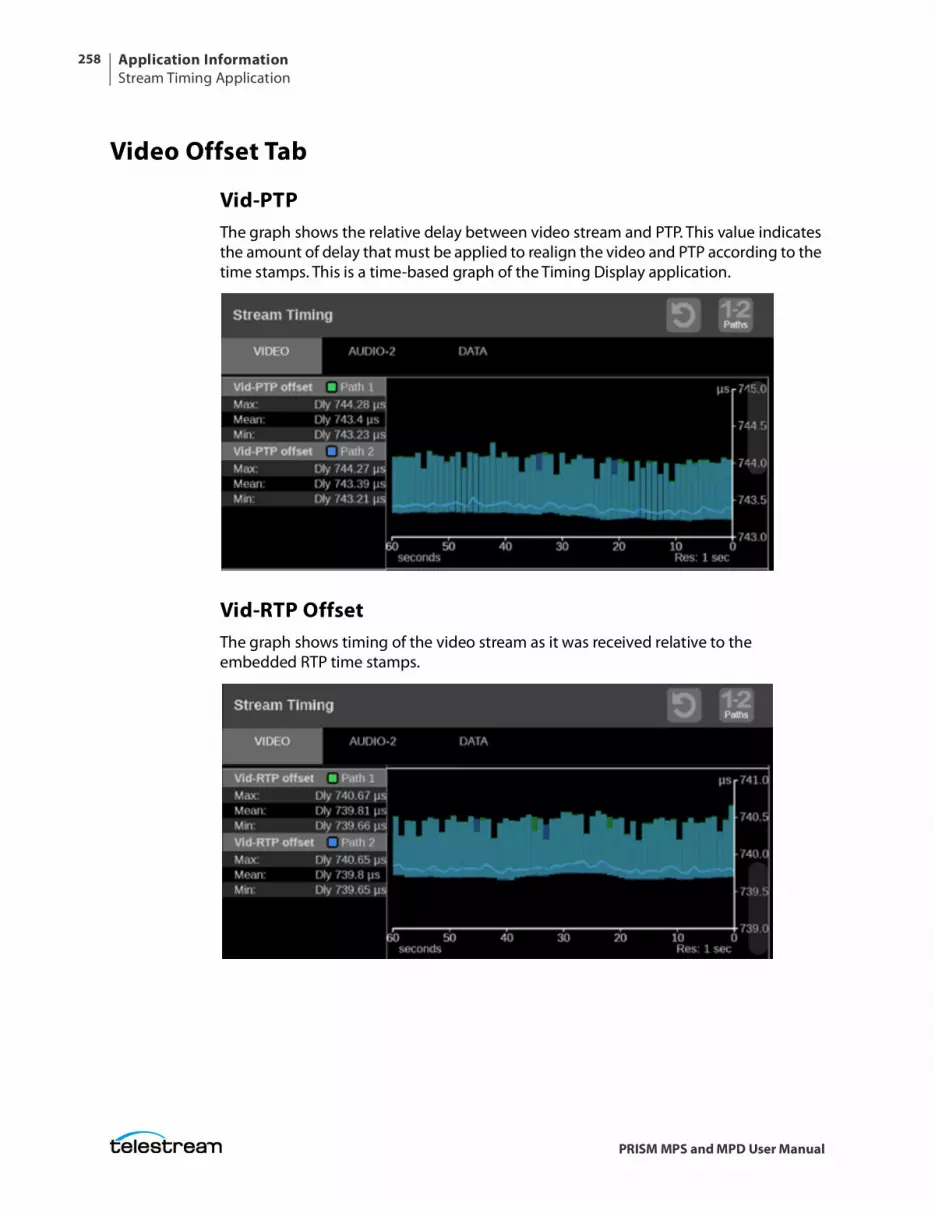
Application InformationStream Timing Application
258
PRISM MPS and MPD User Manual
Video Offset Tab
Vid-PTPThe graph shows the relative delay between video stream and PTP. This value indicates the amount of delay that must be applied to realign the video and PTP according to the time stamps. This is a time-based graph of the Timing Display application.
Vid-RTP OffsetThe graph shows timing of the video stream as it was received relative to the embedded RTP time stamps.
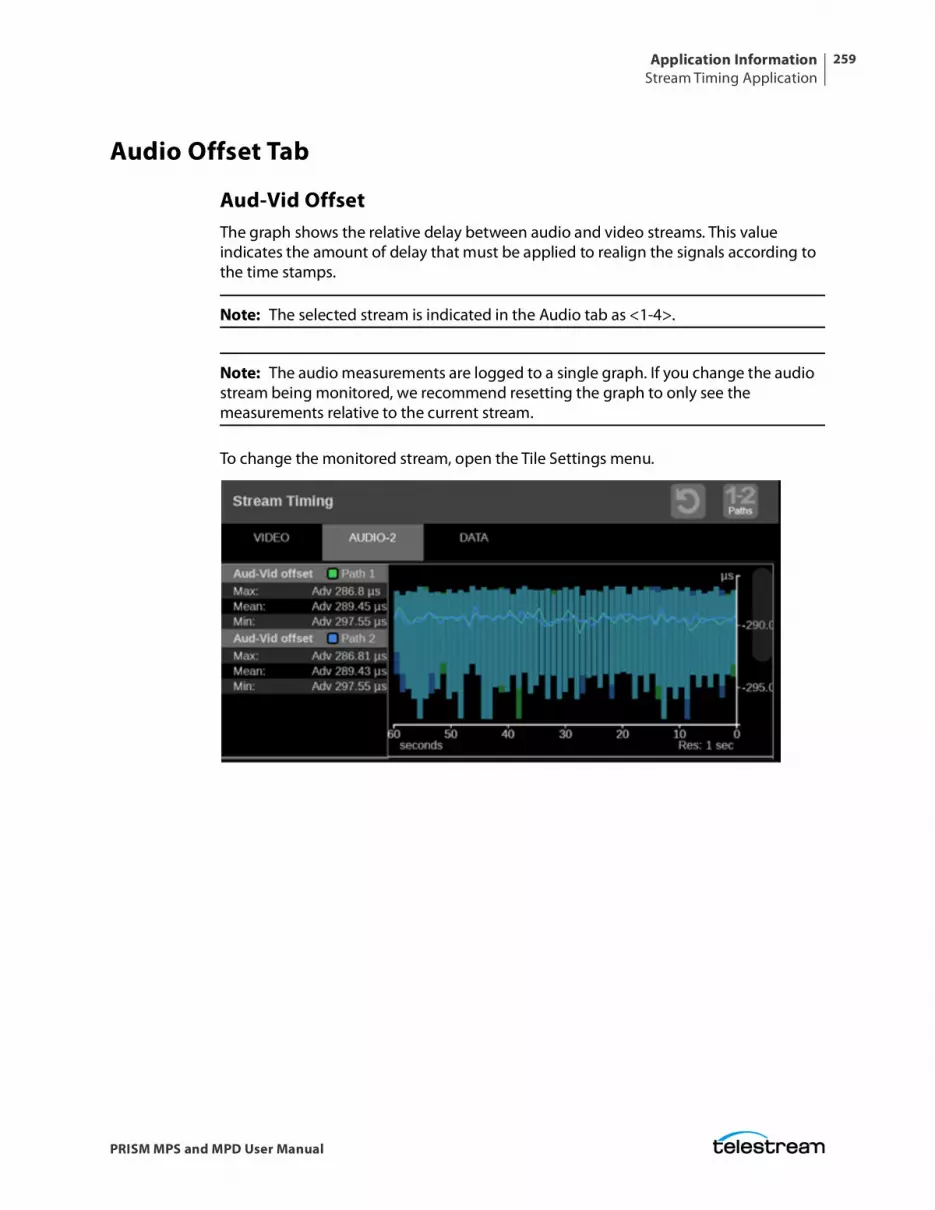
Application InformationStream Timing Application
259
PRISM MPS and MPD User Manual
Audio Offset Tab
Aud-Vid OffsetThe graph shows the relative delay between audio and video streams. This value indicates the amount of delay that must be applied to realign the signals according to the time stamps.
Note: The selected stream is indicated in the Audio tab as <1-4>.
Note: The audio measurements are logged to a single graph. If you change the audio stream being monitored, we recommend resetting the graph to only see the measurements relative to the current stream.
To change the monitored stream, open the Tile Settings menu.
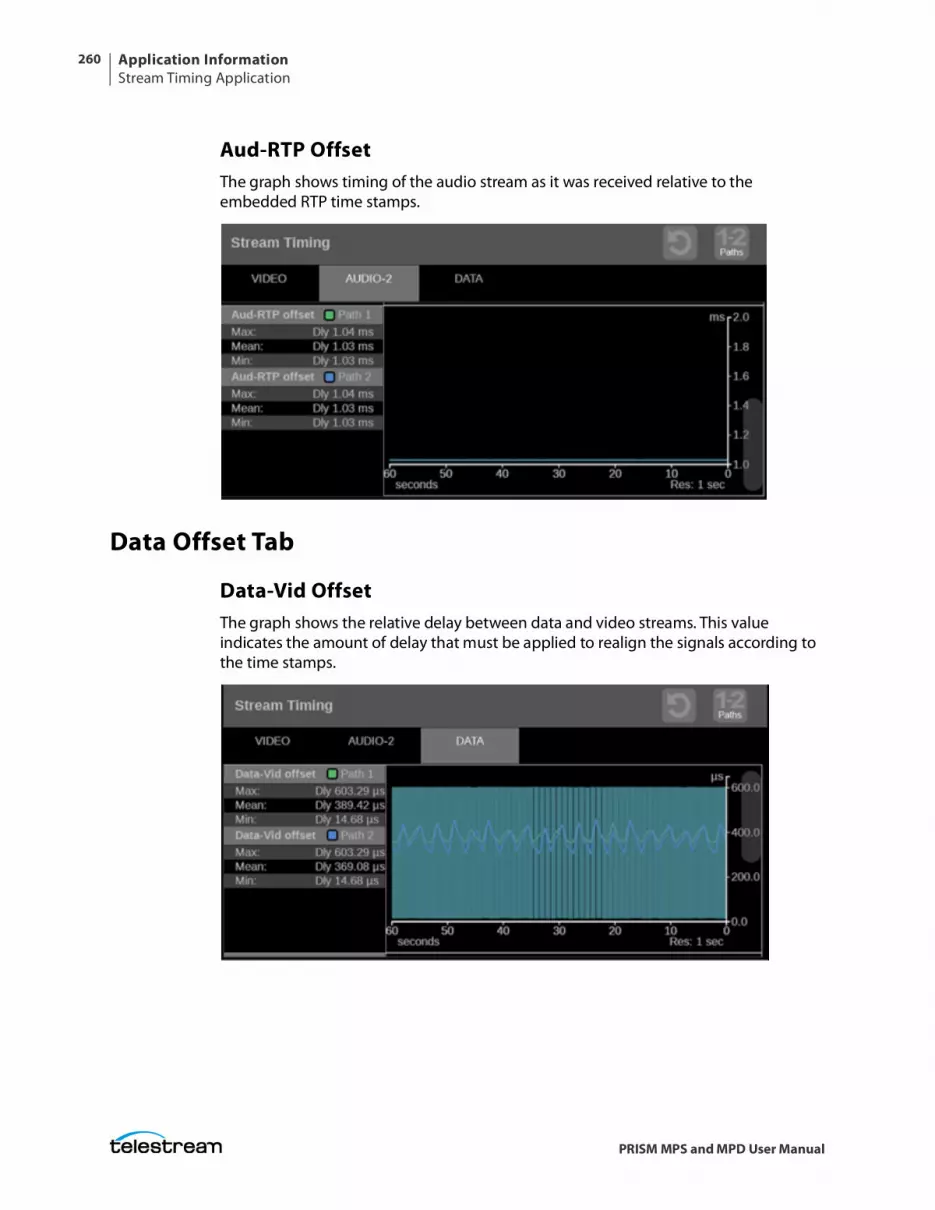
Application InformationStream Timing Application
260
PRISM MPS and MPD User Manual
Aud-RTP OffsetThe graph shows timing of the audio stream as it was received relative to the embedded RTP time stamps.
Data Offset Tab
Data-Vid OffsetThe graph shows the relative delay between data and video streams. This value indicates the amount of delay that must be applied to realign the signals according to the time stamps.
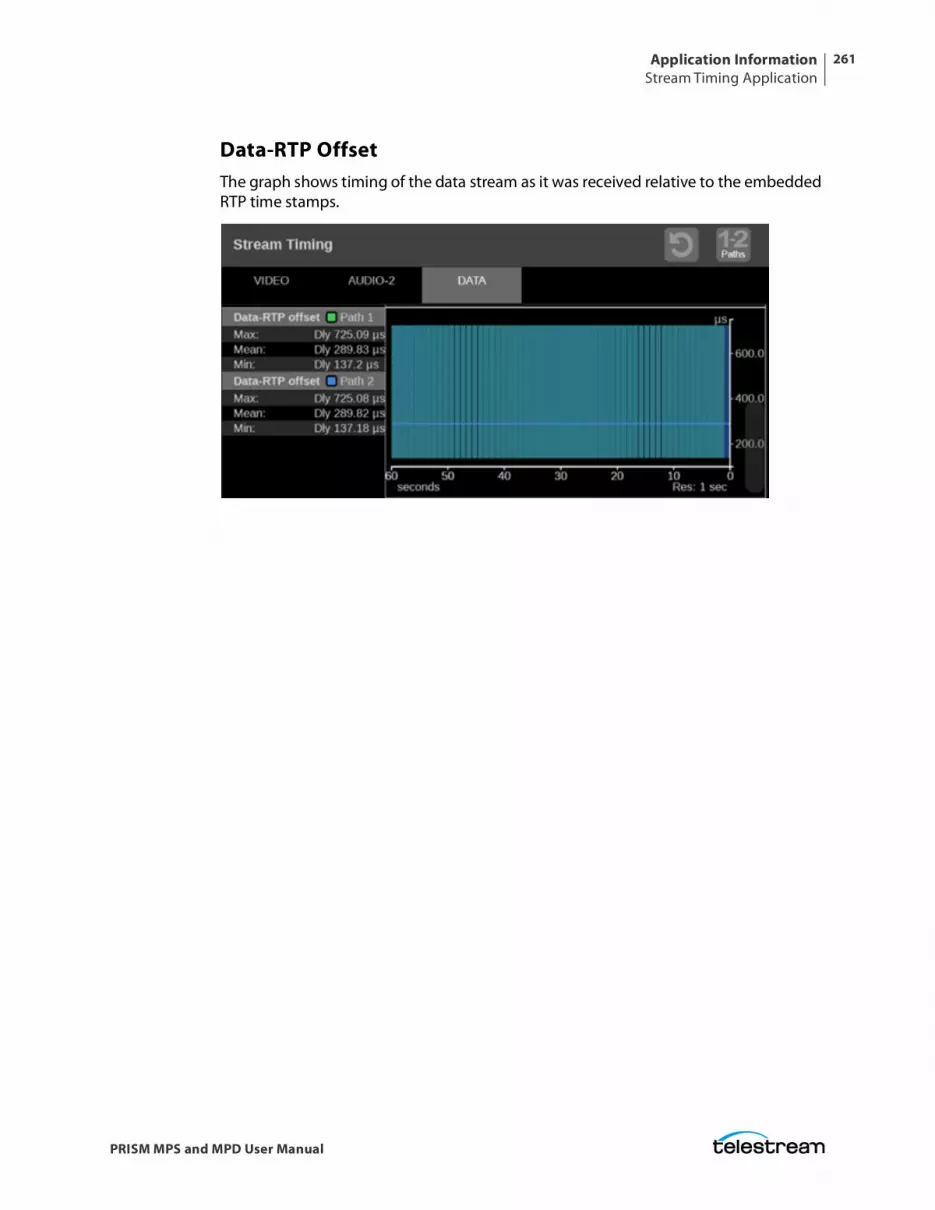
Application InformationStream Timing Application
261
PRISM MPS and MPD User Manual
Data-RTP OffsetThe graph shows timing of the data stream as it was received relative to the embedded RTP time stamps.
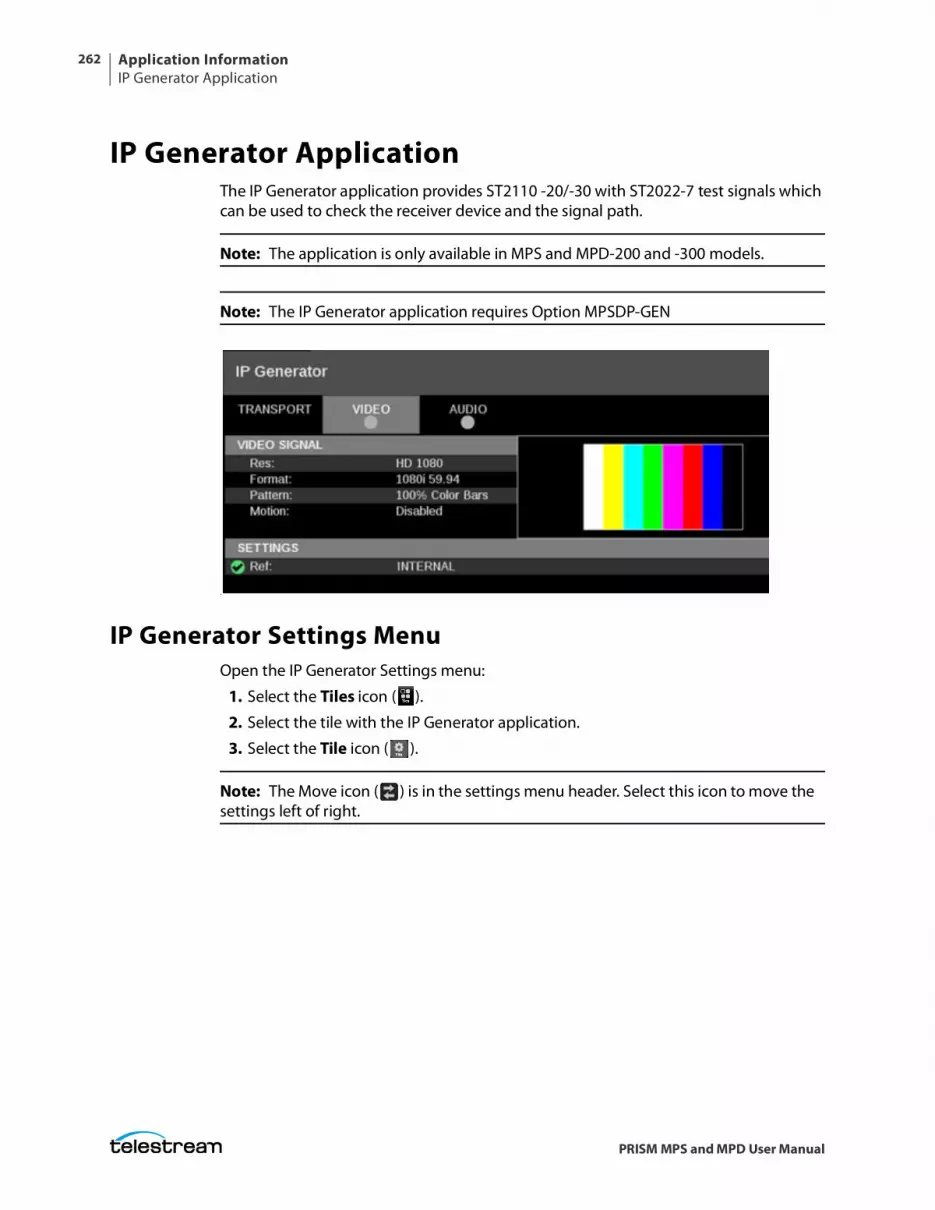
Application InformationIP Generator Application
262
PRISM MPS and MPD User Manual
IP Generator ApplicationThe IP Generator application provides ST2110 -20/-30 with ST2022-7 test signals which can be used to check the receiver device and the signal path.
Note: The application is only available in MPS and MPD-200 and -300 models.
Note: The IP Generator application requires Option MPSDP-GEN
.
IP Generator Settings MenuOpen the IP Generator Settings menu:
1. Select the Tiles icon ( ).
2. Select the tile with the IP Generator application.
3. Select the Tile icon ( ).
Note: The Move icon ( ) is in the settings menu header. Select this icon to move the settings left of right.
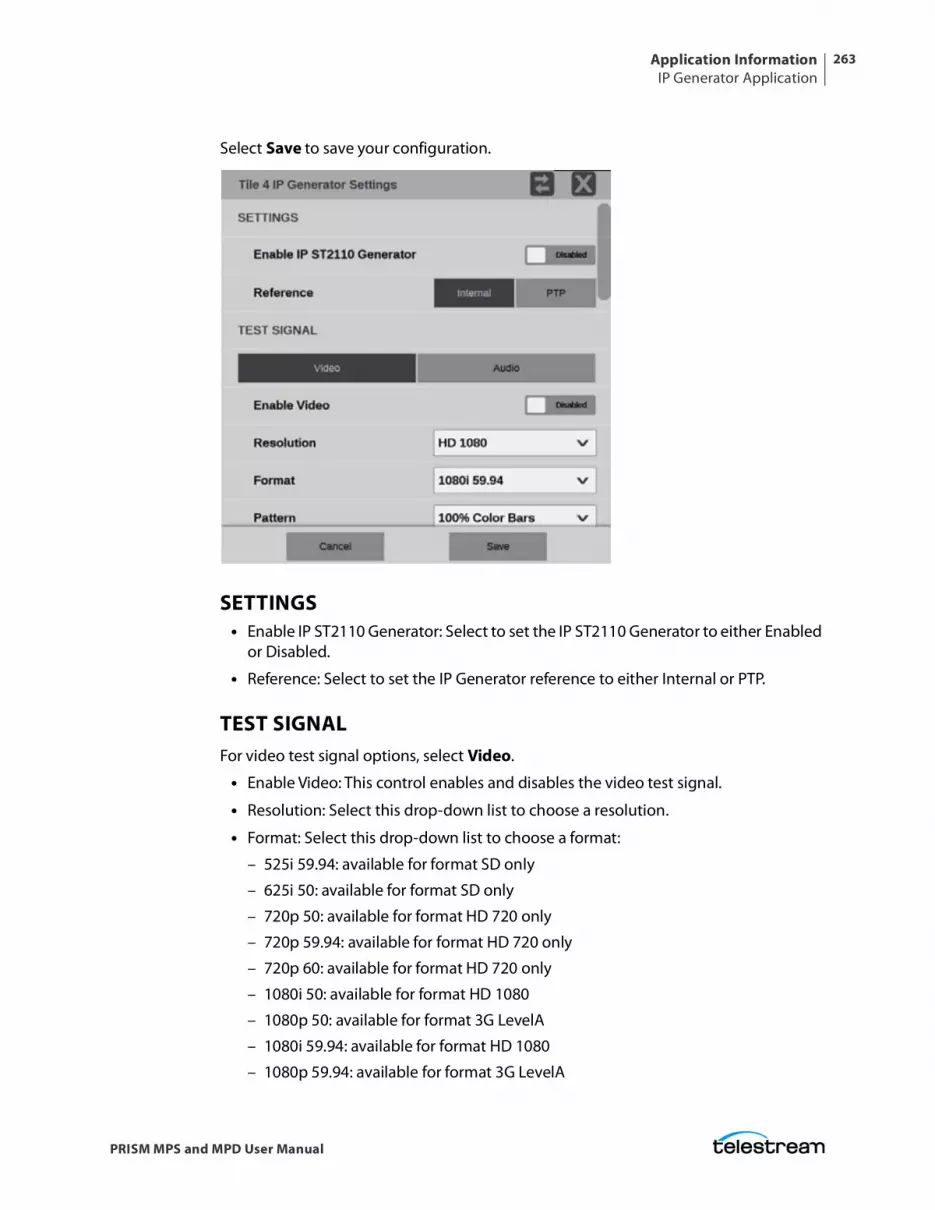
Application InformationIP Generator Application
263
PRISM MPS and MPD User Manual
Select Save to save your configuration.
SETTINGS • Enable IP ST2110 Generator: Select to set the IP ST2110 Generator to either Enabled
or Disabled.
• Reference: Select to set the IP Generator reference to either Internal or PTP.
TEST SIGNALFor video test signal options, select Video.
• Enable Video: This control enables and disables the video test signal.
• Resolution: Select this drop-down list to choose a resolution.
• Format: Select this drop-down list to choose a format:
– 525i 59.94: available for format SD only
– 625i 50: available for format SD only
– 720p 50: available for format HD 720 only
– 720p 59.94: available for format HD 720 only
– 720p 60: available for format HD 720 only
– 1080i 50: available for format HD 1080
– 1080p 50: available for format 3G LevelA
– 1080i 59.94: available for format HD 1080
– 1080p 59.94: available for format 3G LevelA
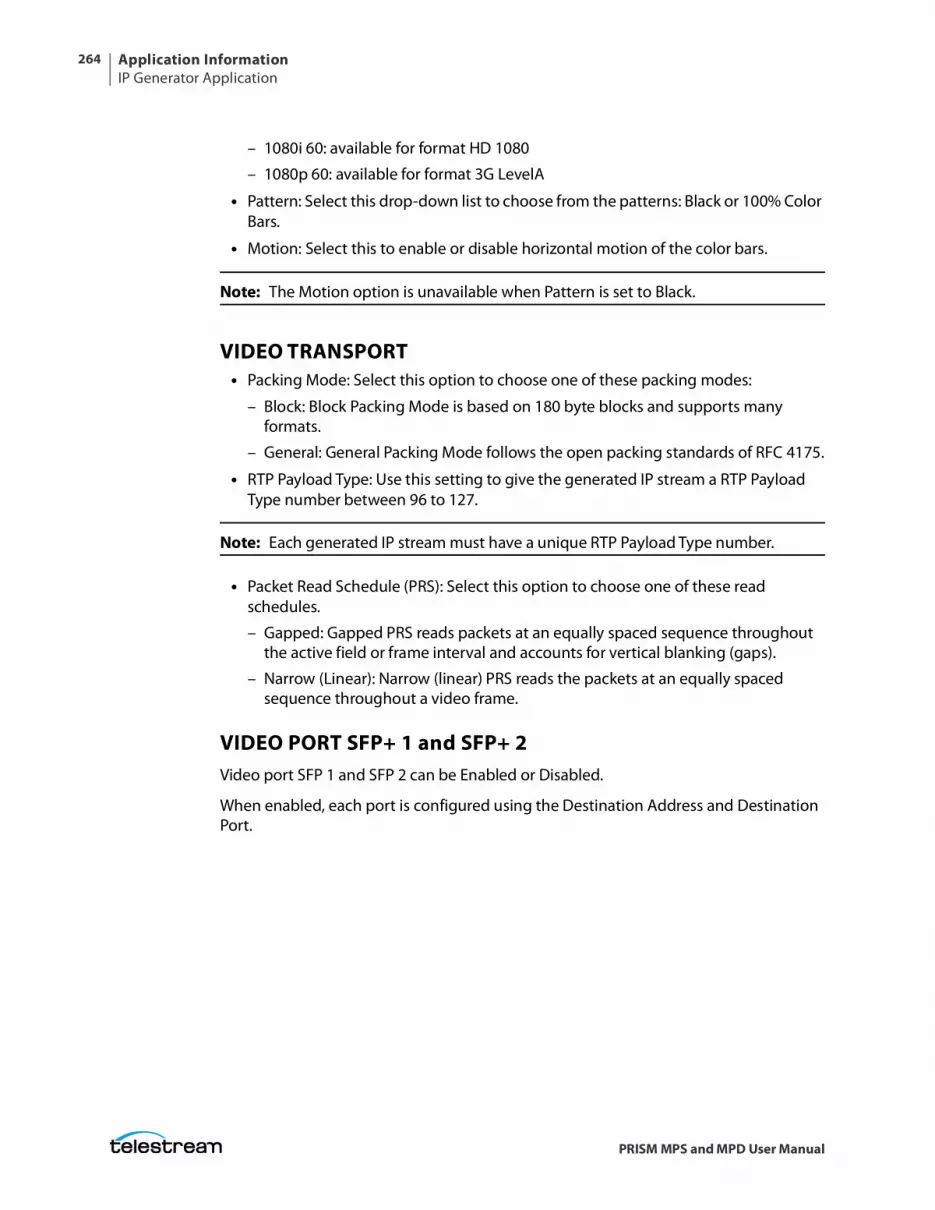
Application InformationIP Generator Application
264
PRISM MPS and MPD User Manual
– 1080i 60: available for format HD 1080
– 1080p 60: available for format 3G LevelA
• Pattern: Select this drop-down list to choose from the patterns: Black or 100% Color Bars.
• Motion: Select this to enable or disable horizontal motion of the color bars.
Note: The Motion option is unavailable when Pattern is set to Black.
VIDEO TRANSPORT• Packing Mode: Select this option to choose one of these packing modes:
– Block: Block Packing Mode is based on 180 byte blocks and supports many formats.
– General: General Packing Mode follows the open packing standards of RFC 4175.
• RTP Payload Type: Use this setting to give the generated IP stream a RTP Payload Type number between 96 to 127.
Note: Each generated IP stream must have a unique RTP Payload Type number.
• Packet Read Schedule (PRS): Select this option to choose one of these read schedules.
– Gapped: Gapped PRS reads packets at an equally spaced sequence throughout the active field or frame interval and accounts for vertical blanking (gaps).
– Narrow (Linear): Narrow (linear) PRS reads the packets at an equally spaced sequence throughout a video frame.
VIDEO PORT SFP+ 1 and SFP+ 2Video port SFP 1 and SFP 2 can be Enabled or Disabled.
When enabled, each port is configured using the Destination Address and Destination Port.
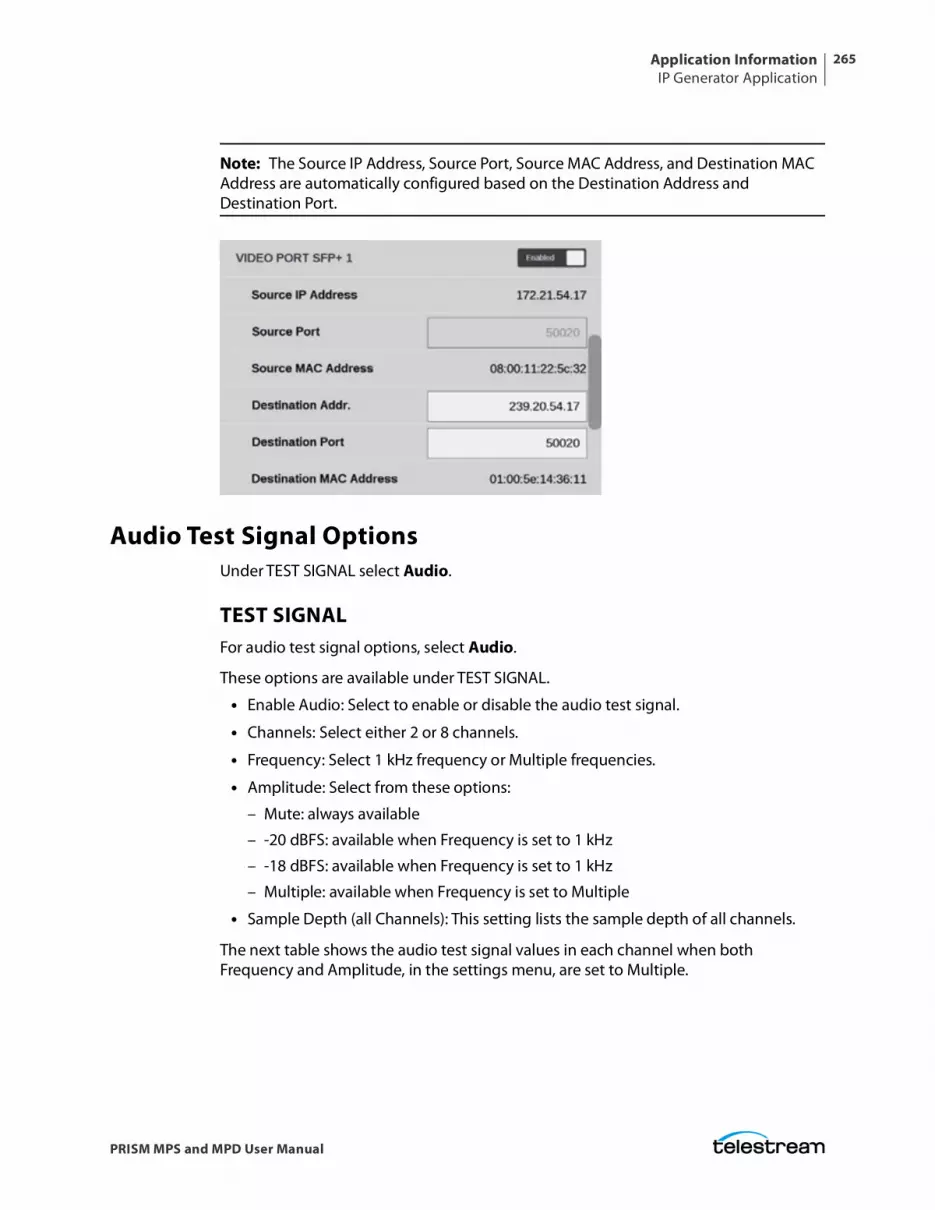
Application InformationIP Generator Application
265
PRISM MPS and MPD User Manual
Note: The Source IP Address, Source Port, Source MAC Address, and Destination MAC Address are automatically configured based on the Destination Address and Destination Port.
Audio Test Signal OptionsUnder TEST SIGNAL select Audio.
TEST SIGNALFor audio test signal options, select Audio.
These options are available under TEST SIGNAL.
• Enable Audio: Select to enable or disable the audio test signal.
• Channels: Select either 2 or 8 channels.
• Frequency: Select 1 kHz frequency or Multiple frequencies.
• Amplitude: Select from these options:
– Mute: always available
– -20 dBFS: available when Frequency is set to 1 kHz
– -18 dBFS: available when Frequency is set to 1 kHz
– Multiple: available when Frequency is set to Multiple
• Sample Depth (all Channels): This setting lists the sample depth of all channels.
The next table shows the audio test signal values in each channel when both Frequency and Amplitude, in the settings menu, are set to Multiple.
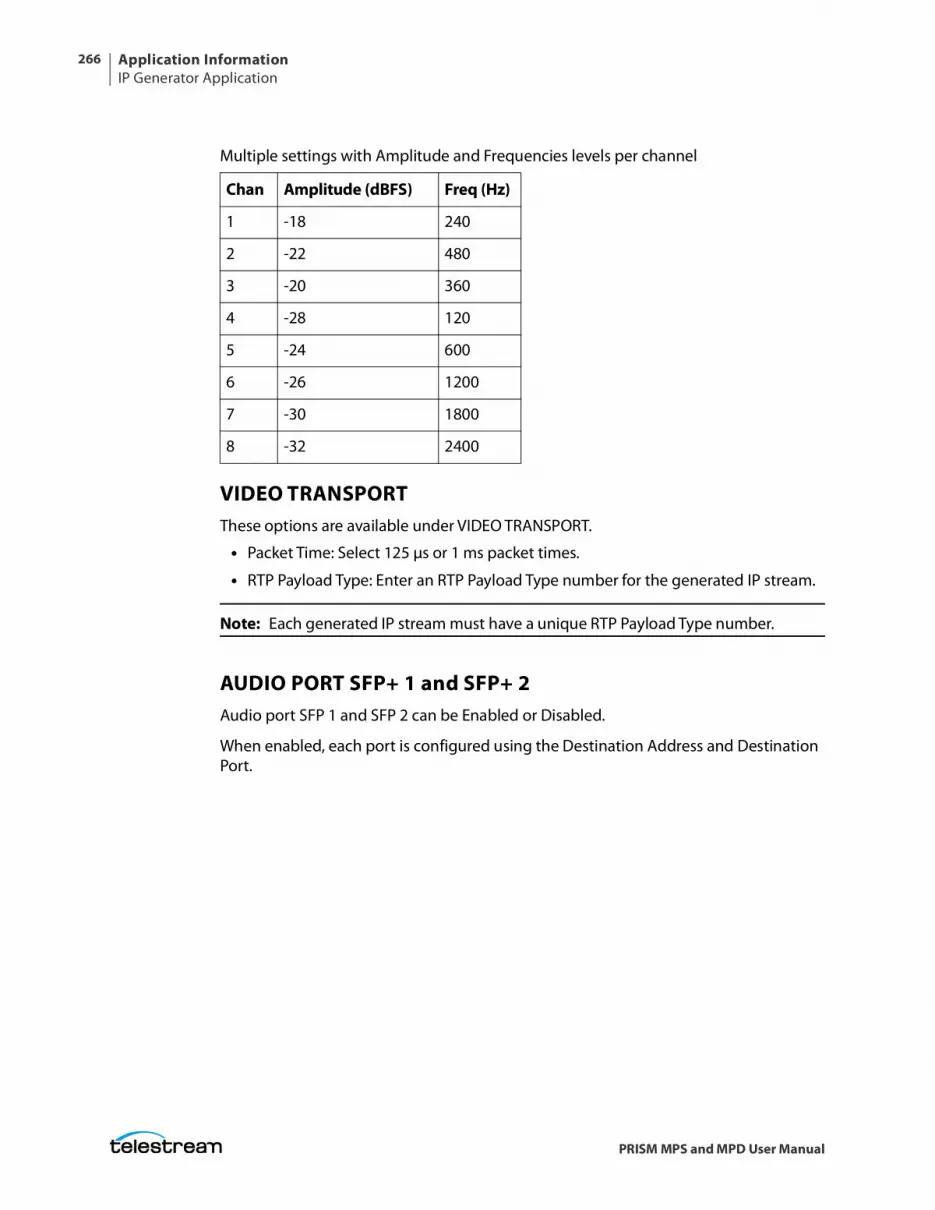
Application InformationIP Generator Application
266
PRISM MPS and MPD User Manual
VIDEO TRANSPORTThese options are available under VIDEO TRANSPORT.
• Packet Time: Select 125 µs or 1 ms packet times.
• RTP Payload Type: Enter an RTP Payload Type number for the generated IP stream.
Note: Each generated IP stream must have a unique RTP Payload Type number.
AUDIO PORT SFP+ 1 and SFP+ 2Audio port SFP 1 and SFP 2 can be Enabled or Disabled.
When enabled, each port is configured using the Destination Address and Destination Port.
Multiple settings with Amplitude and Frequencies levels per channel
Chan Amplitude (dBFS) Freq (Hz)
1 -18 240
2 -22 480
3 -20 360
4 -28 120
5 -24 600
6 -26 1200
7 -30 1800
8 -32 2400
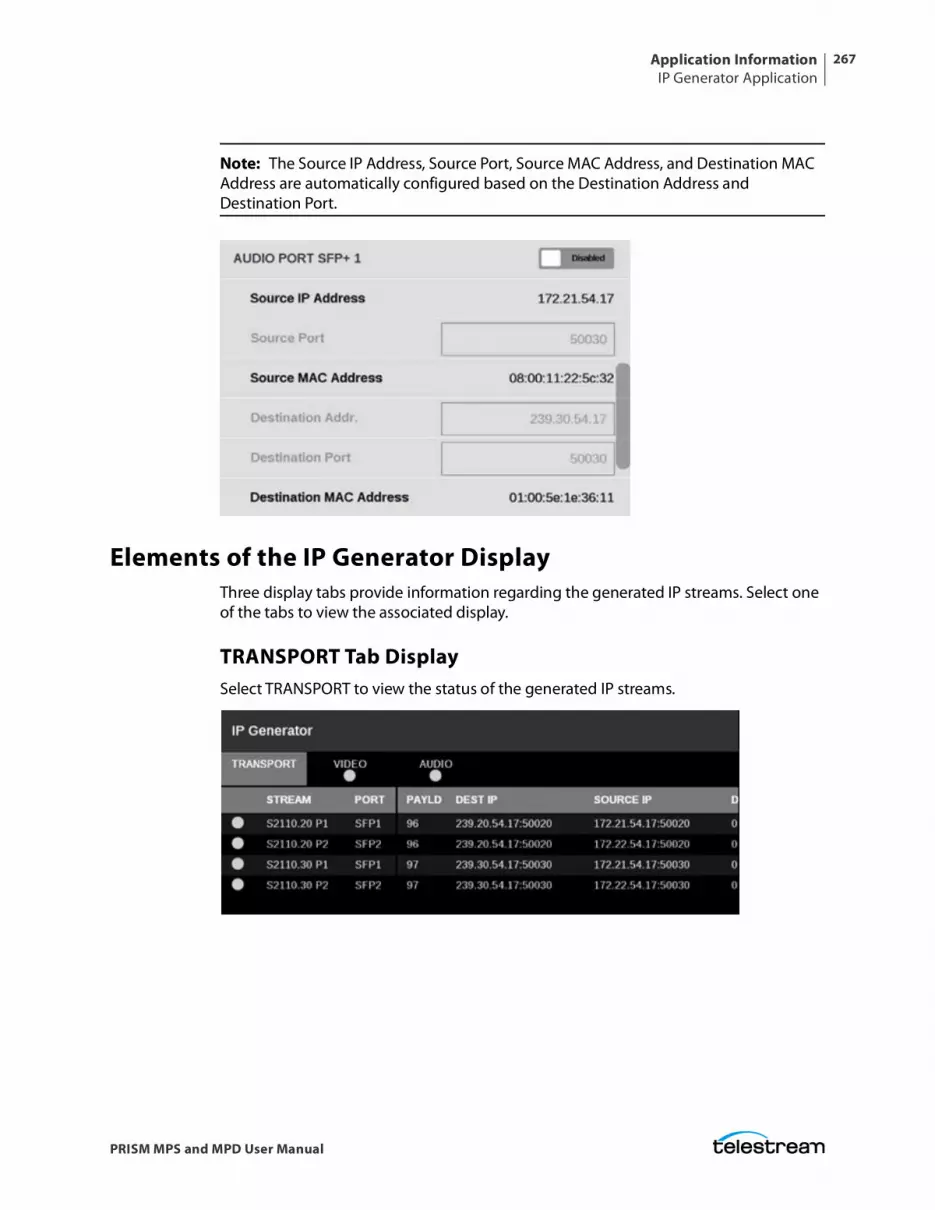
Application InformationIP Generator Application
267
PRISM MPS and MPD User Manual
Note: The Source IP Address, Source Port, Source MAC Address, and Destination MAC Address are automatically configured based on the Destination Address and Destination Port.
Elements of the IP Generator DisplayThree display tabs provide information regarding the generated IP streams. Select one of the tabs to view the associated display.
TRANSPORT Tab DisplaySelect TRANSPORT to view the status of the generated IP streams.
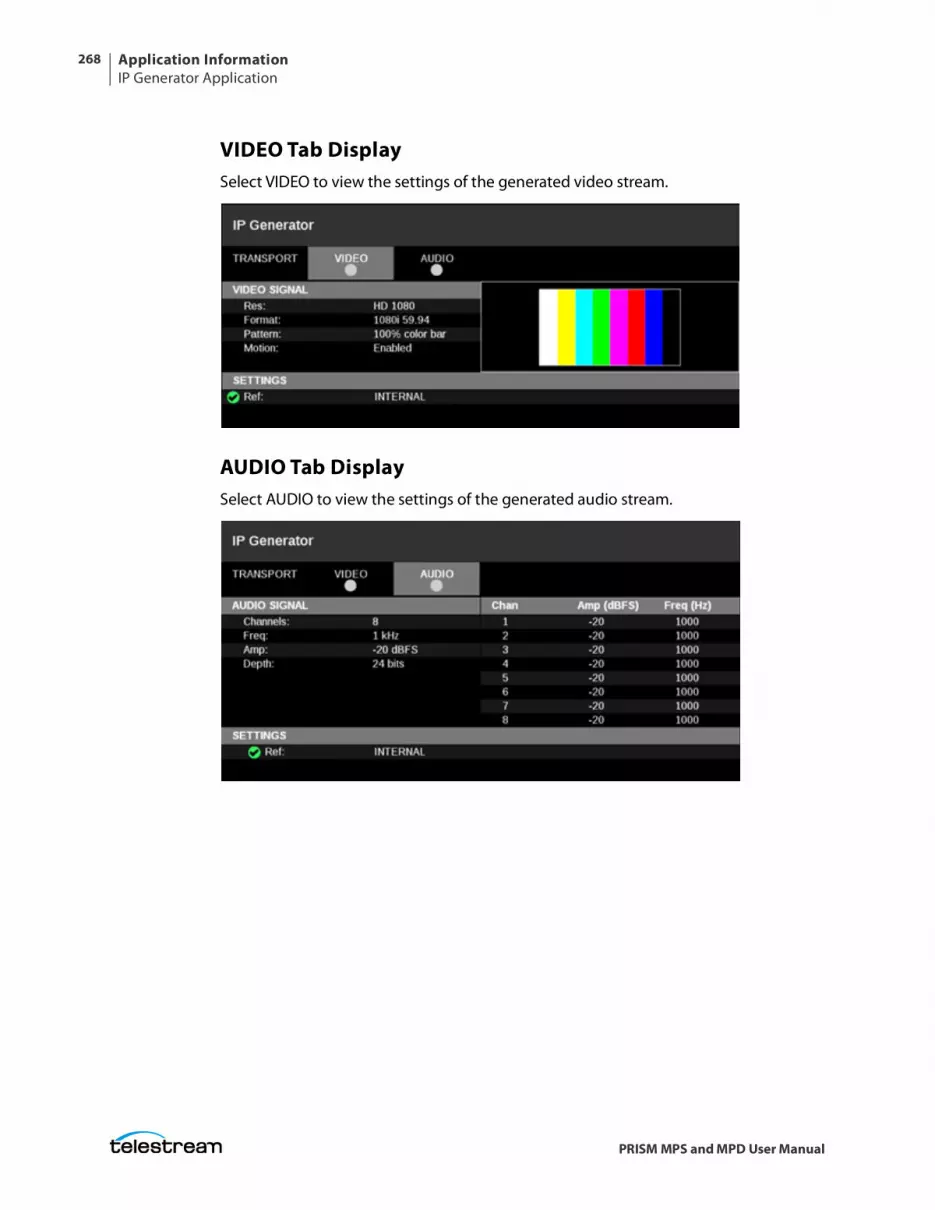
Application InformationIP Generator Application
268
PRISM MPS and MPD User Manual
VIDEO Tab DisplaySelect VIDEO to view the settings of the generated video stream.
AUDIO Tab DisplaySelect AUDIO to view the settings of the generated audio stream.
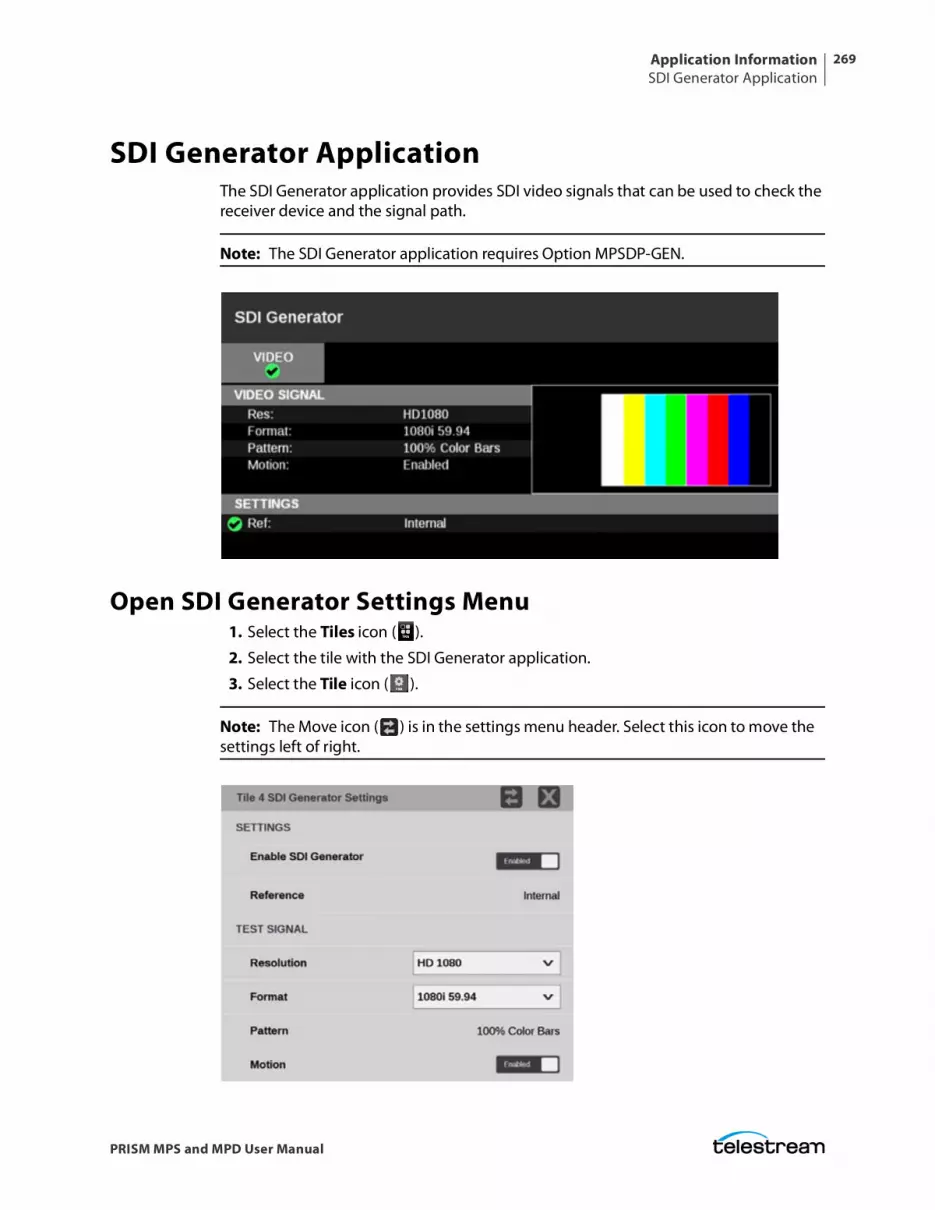
Application InformationSDI Generator Application
269
PRISM MPS and MPD User Manual
SDI Generator ApplicationThe SDI Generator application provides SDI video signals that can be used to check the receiver device and the signal path.
Note: The SDI Generator application requires Option MPSDP-GEN.
Open SDI Generator Settings Menu1. Select the Tiles icon ( ).
2. Select the tile with the SDI Generator application.
3. Select the Tile icon ( ).
Note: The Move icon ( ) is in the settings menu header. Select this icon to move the settings left of right.
Application InformationSDI Generator Application
270
PRISM MPS and MPD User Manual
SETTINGS
Enable SDI Generator
Select this to set the SDI Generator to Enabled or Disabled.
Reference
The SDI Generator uses an internal reference.
TEST SIGNAL OptionsThese options are available to configure the test signal.
Resolution
Select this drop-down list to choose the resolution.
Format
Select this drop-down list to choose from these formats:
• 525i 59.94: available for format SD only
• 625i 50: available for format SD only
• 720p 50: available for format HD 720 only
• 720p 59.94: available for format HD 720 only
• 720p 60: available for format HD 720 only
• 1080i 50: available for format HD 1080 only
• 1080p 50: available for format 3G LevelA or 3G LevelB only
• 1080i 59.94: available for format HD 1080 only
• 1080p 59.94: available for format 3G LevelA or 3G LevelB only
• 1080i 60: available for format HD 1080 only
• 1080p 60: available for format 3G LevelA or 3G LevelB only
• 3840p 23.98: available for format 6G UHD only
• 3840p 24: available for format 6G UHD only
• 3840p 25: available for format 6G UHD only
• 3840p 29.97: available for format 6G UHD only
• 3840p 30: available for format 6G UHD only
• 3840p 50: available for format 12G UHD only
• 3840p 59.94: available for format 12G UHD only
• 3840p 60: available for format 12G UHD only
Pattern
The only pattern available is 100% Color Bars.
Application InformationSDI Generator Application
271
PRISM MPS and MPD User Manual
Motion
Select to enable or disable horizontal motion of the color bars.
Elements of SDI Generator DisplaySelect the VIDEO tab to view the settings of the generated SDI stream.
Note: SDI audio and data generation is not yet available.
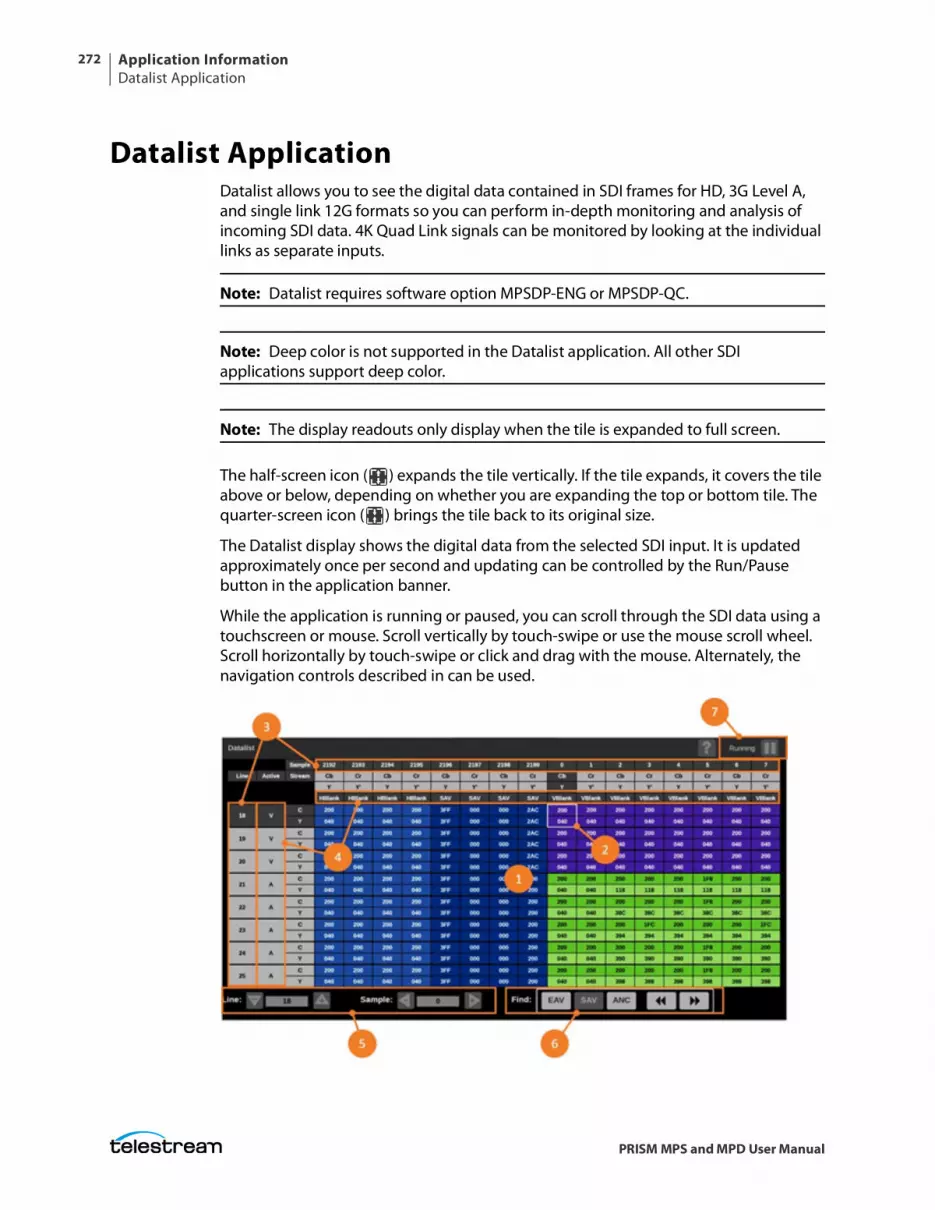
Application InformationDatalist Application
272
PRISM MPS and MPD User Manual
Datalist ApplicationDatalist allows you to see the digital data contained in SDI frames for HD, 3G Level A, and single link 12G formats so you can perform in-depth monitoring and analysis of incoming SDI data. 4K Quad Link signals can be monitored by looking at the individual links as separate inputs.
Note: Datalist requires software option MPSDP-ENG or MPSDP-QC.
Note: Deep color is not supported in the Datalist application. All other SDI applications support deep color.
Note: The display readouts only display when the tile is expanded to full screen.
The half-screen icon ( ) expands the tile vertically. If the tile expands, it covers the tile above or below, depending on whether you are expanding the top or bottom tile. The quarter-screen icon ( ) brings the tile back to its original size.
The Datalist display shows the digital data from the selected SDI input. It is updated approximately once per second and updating can be controlled by the Run/Pause button in the application banner.
While the application is running or paused, you can scroll through the SDI data using a touchscreen or mouse. Scroll vertically by touch-swipe or use the mouse scroll wheel. Scroll horizontally by touch-swipe or click and drag with the mouse. Alternately, the navigation controls described in can be used.
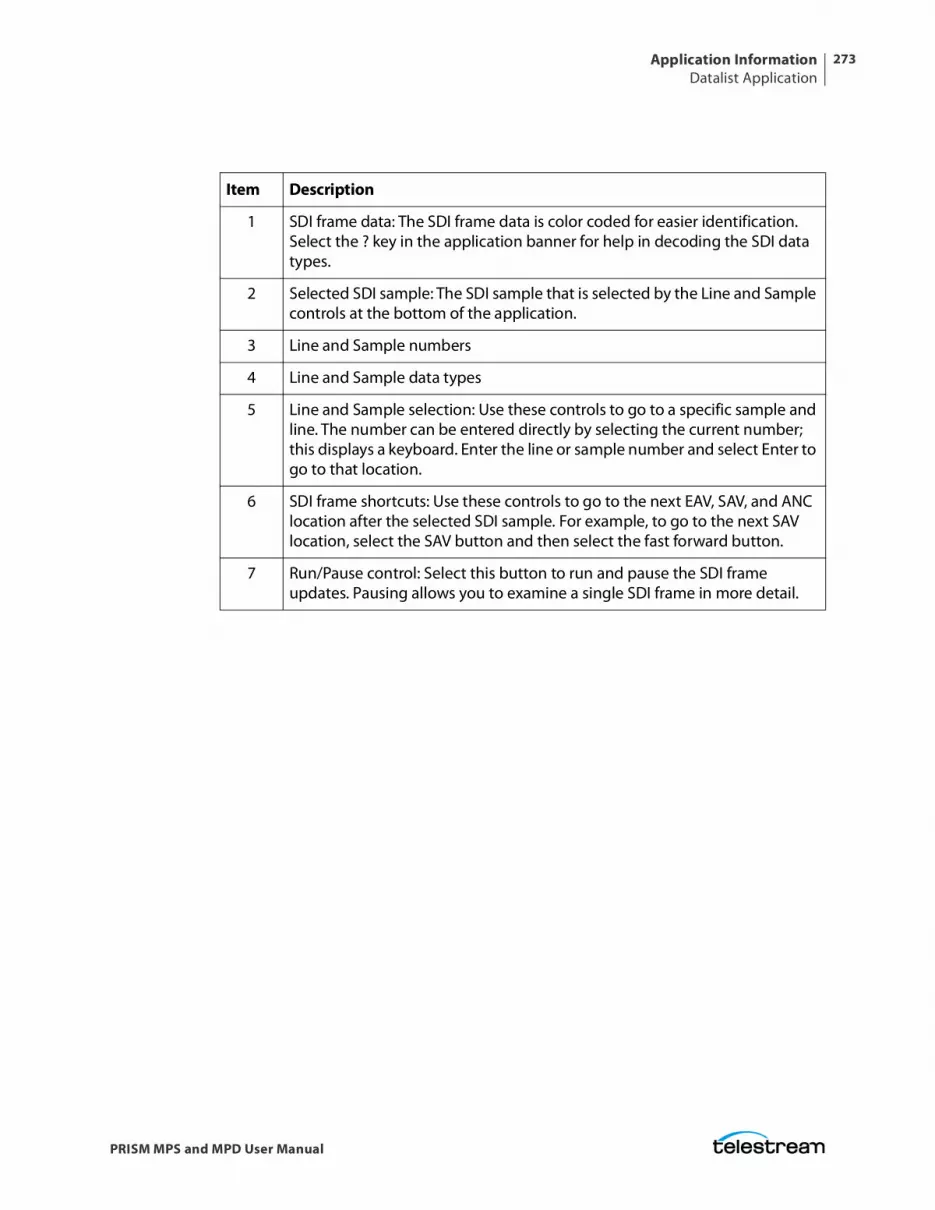
Application InformationDatalist Application
273
PRISM MPS and MPD User Manual
Item Description
1 SDI frame data: The SDI frame data is color coded for easier identification. Select the ? key in the application banner for help in decoding the SDI data types.
2 Selected SDI sample: The SDI sample that is selected by the Line and Sample controls at the bottom of the application.
3 Line and Sample numbers
4 Line and Sample data types
5 Line and Sample selection: Use these controls to go to a specific sample and line. The number can be entered directly by selecting the current number; this displays a keyboard. Enter the line or sample number and select Enter to go to that location.
6 SDI frame shortcuts: Use these controls to go to the next EAV, SAV, and ANC location after the selected SDI sample. For example, to go to the next SAV location, select the SAV button and then select the fast forward button.
7 Run/Pause control: Select this button to run and pause the SDI frame updates. Pausing allows you to examine a single SDI frame in more detail.
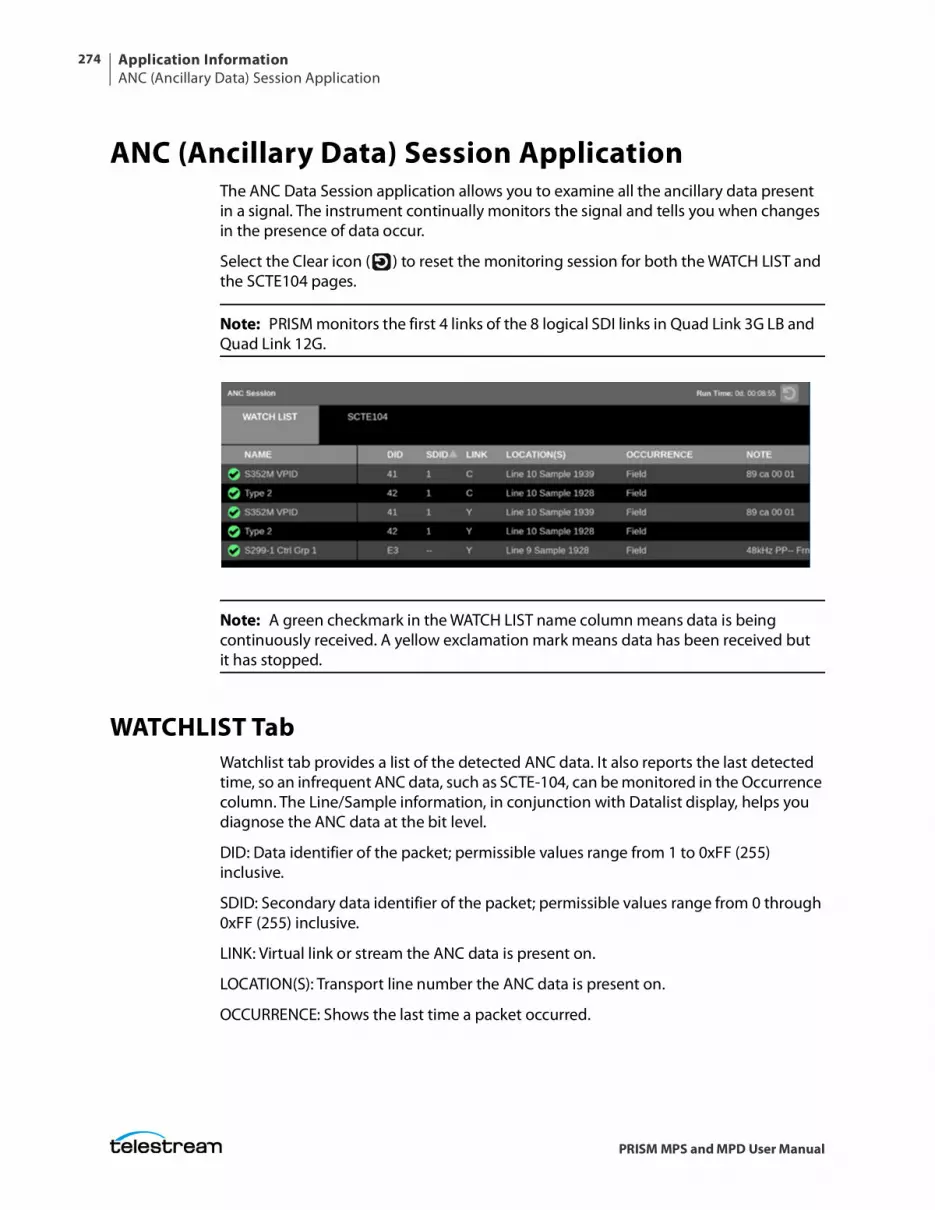
Application InformationANC (Ancillary Data) Session Application
274
PRISM MPS and MPD User Manual
ANC (Ancillary Data) Session ApplicationThe ANC Data Session application allows you to examine all the ancillary data present in a signal. The instrument continually monitors the signal and tells you when changes in the presence of data occur.
Select the Clear icon ( ) to reset the monitoring session for both the WATCH LIST and the SCTE104 pages.
Note: PRISM monitors the first 4 links of the 8 logical SDI links in Quad Link 3G LB and Quad Link 12G.
Note: A green checkmark in the WATCH LIST name column means data is being continuously received. A yellow exclamation mark means data has been received but it has stopped.
WATCHLIST TabWatchlist tab provides a list of the detected ANC data. It also reports the last detected time, so an infrequent ANC data, such as SCTE-104, can be monitored in the Occurrence column. The Line/Sample information, in conjunction with Datalist display, helps you diagnose the ANC data at the bit level.
DID: Data identifier of the packet; permissible values range from 1 to 0xFF (255) inclusive.
SDID: Secondary data identifier of the packet; permissible values range from 0 through 0xFF (255) inclusive.
LINK: Virtual link or stream the ANC data is present on.
LOCATION(S): Transport line number the ANC data is present on.
OCCURRENCE: Shows the last time a packet occurred.
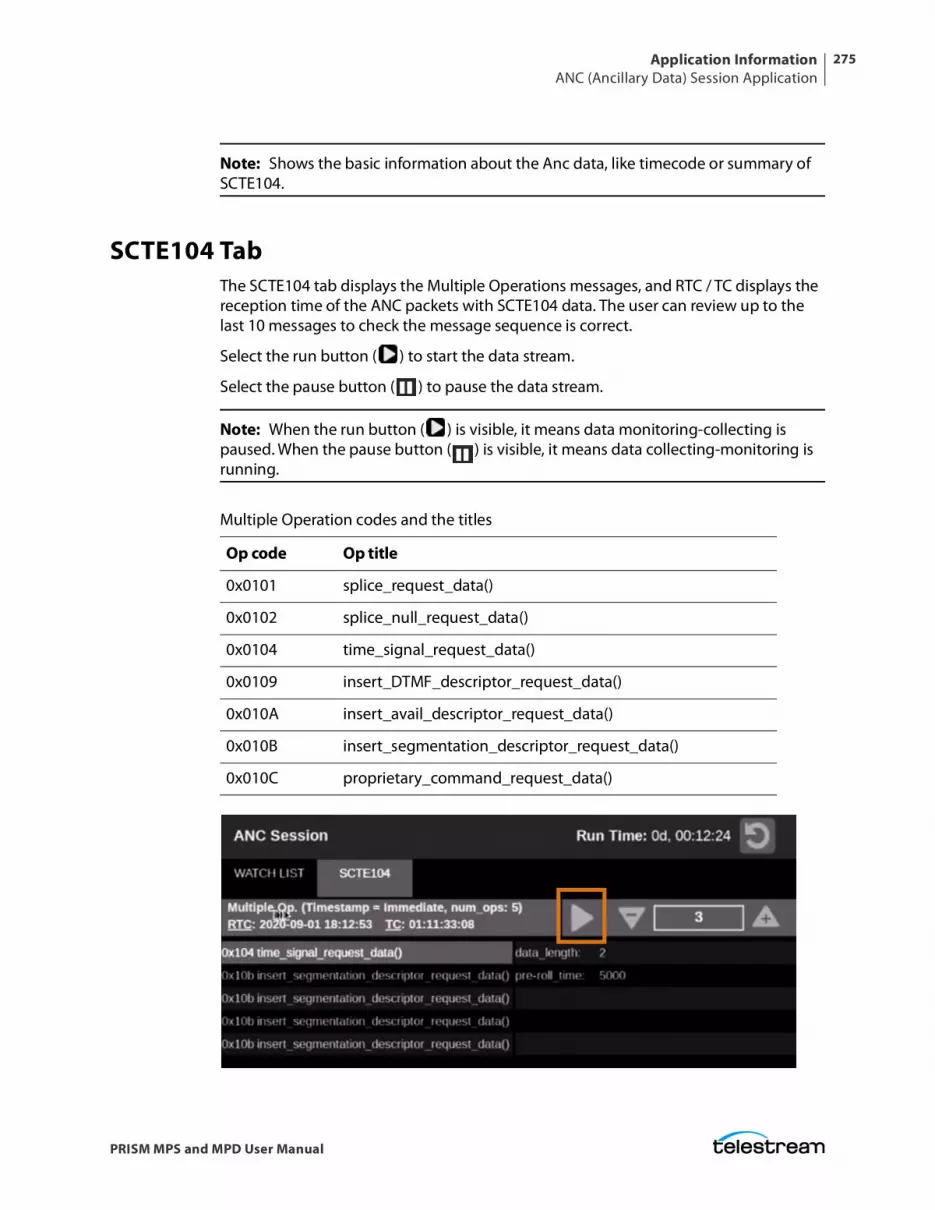
Application InformationANC (Ancillary Data) Session Application
275
PRISM MPS and MPD User Manual
Note: Shows the basic information about the Anc data, like timecode or summary of SCTE104.
SCTE104 TabThe SCTE104 tab displays the Multiple Operations messages, and RTC / TC displays the reception time of the ANC packets with SCTE104 data. The user can review up to the last 10 messages to check the message sequence is correct.
Select the run button ( ) to start the data stream.
Select the pause button ( ) to pause the data stream.
Note: When the run button ( ) is visible, it means data monitoring-collecting is paused. When the pause button ( ) is visible, it means data collecting-monitoring is running.
Multiple Operation codes and the titles
Op code Op title
0x0101 splice_request_data()
0x0102 splice_null_request_data()
0x0104 time_signal_request_data()
0x0109 insert_DTMF_descriptor_request_data()
0x010A insert_avail_descriptor_request_data()
0x010B insert_segmentation_descriptor_request_data()
0x010C proprietary_command_request_data()
Application InformationANC (Ancillary Data) Session Application
276
PRISM MPS and MPD User Manual
Note: The RTC (real-time clock) and TC (time code) numbers in the SCTE104 page match the RTC and TC in the PRISM status menu.
The number in the left column of the SCTE104 page is the number of operations received. Select the Plus icon ( ) or Minus icon ( ) to scroll through the list of up to the last 10 received messages.
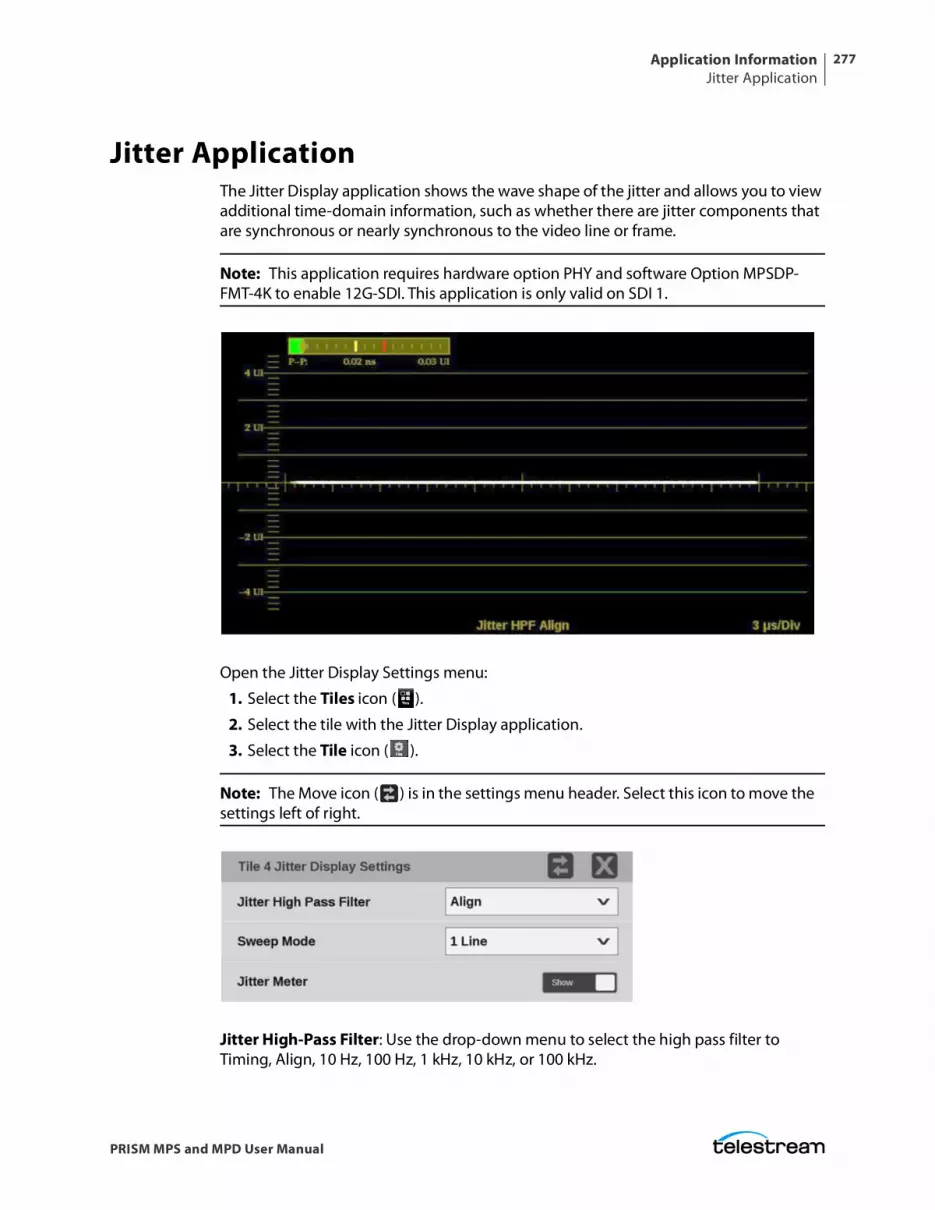
Application InformationJitter Application
277
PRISM MPS and MPD User Manual
Jitter ApplicationThe Jitter Display application shows the wave shape of the jitter and allows you to view additional time-domain information, such as whether there are jitter components that are synchronous or nearly synchronous to the video line or frame.
Note: This application requires hardware option PHY and software Option MPSDP-FMT-4K to enable 12G-SDI. This application is only valid on SDI 1.
Open the Jitter Display Settings menu:
1. Select the Tiles icon ( ).
2. Select the tile with the Jitter Display application.
3. Select the Tile icon ( ).
Note: The Move icon ( ) is in the settings menu header. Select this icon to move the settings left of right.
Jitter High-Pass Filter: Use the drop-down menu to select the high pass filter to Timing, Align, 10 Hz, 100 Hz, 1 kHz, 10 kHz, or 100 kHz.

Application InformationJitter Application
278
PRISM MPS and MPD User Manual
Sweep Mode: Use the drop-down menu to select 1 Line, 2 Line, 1 Field, or 2 Field.
Jitter Meter: Select this to hide or show the jitter meter at the top of the display.
Note: Eye measurements are displayed when the Jitter Display application is in full screen mode.
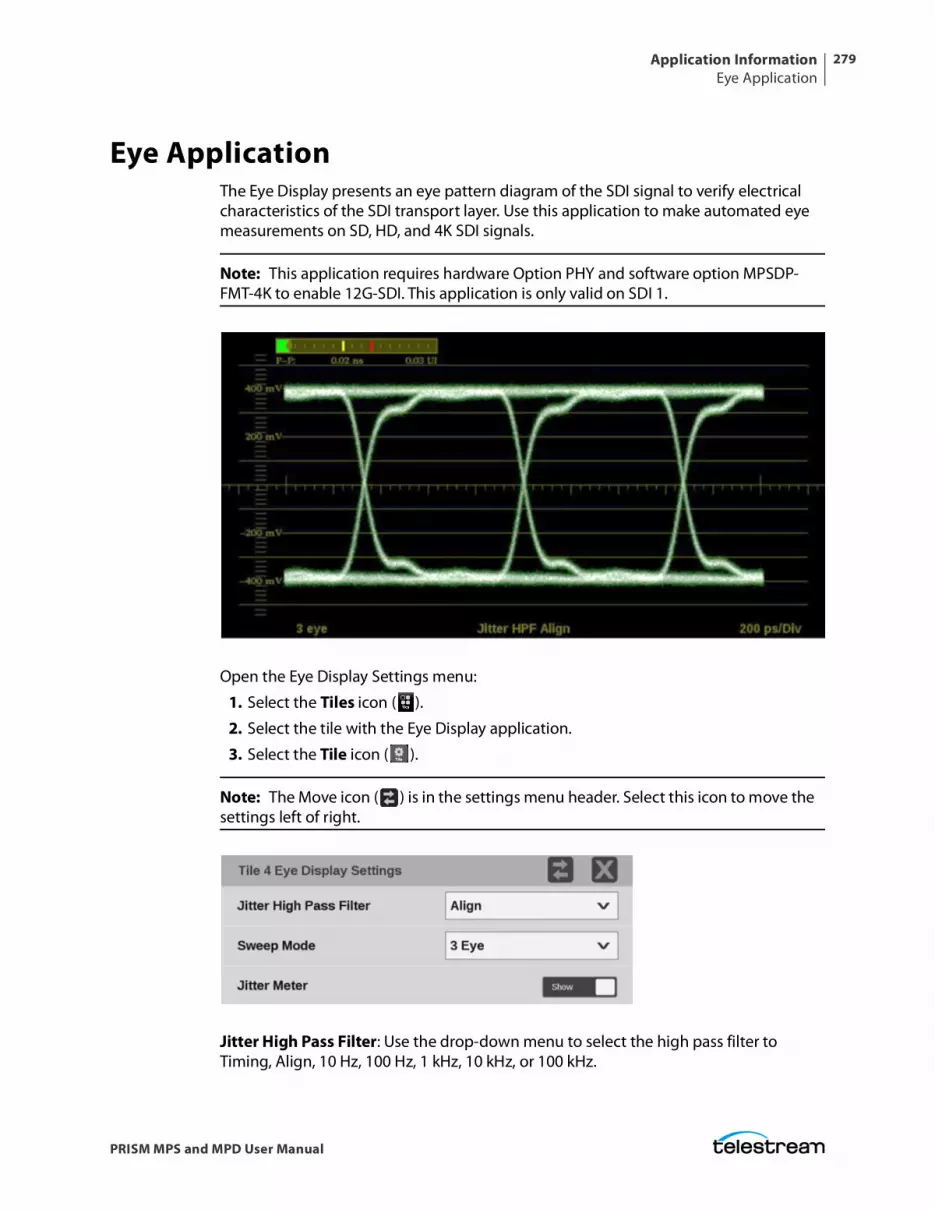
Application InformationEye Application
279
PRISM MPS and MPD User Manual
Eye ApplicationThe Eye Display presents an eye pattern diagram of the SDI signal to verify electrical characteristics of the SDI transport layer. Use this application to make automated eye measurements on SD, HD, and 4K SDI signals.
Note: This application requires hardware Option PHY and software option MPSDP-FMT-4K to enable 12G-SDI. This application is only valid on SDI 1.
Open the Eye Display Settings menu:
1. Select the Tiles icon ( ).
2. Select the tile with the Eye Display application.
3. Select the Tile icon ( ).
Note: The Move icon ( ) is in the settings menu header. Select this icon to move the settings left of right.
Jitter High Pass Filter: Use the drop-down menu to select the high pass filter to Timing, Align, 10 Hz, 100 Hz, 1 kHz, 10 kHz, or 100 kHz.
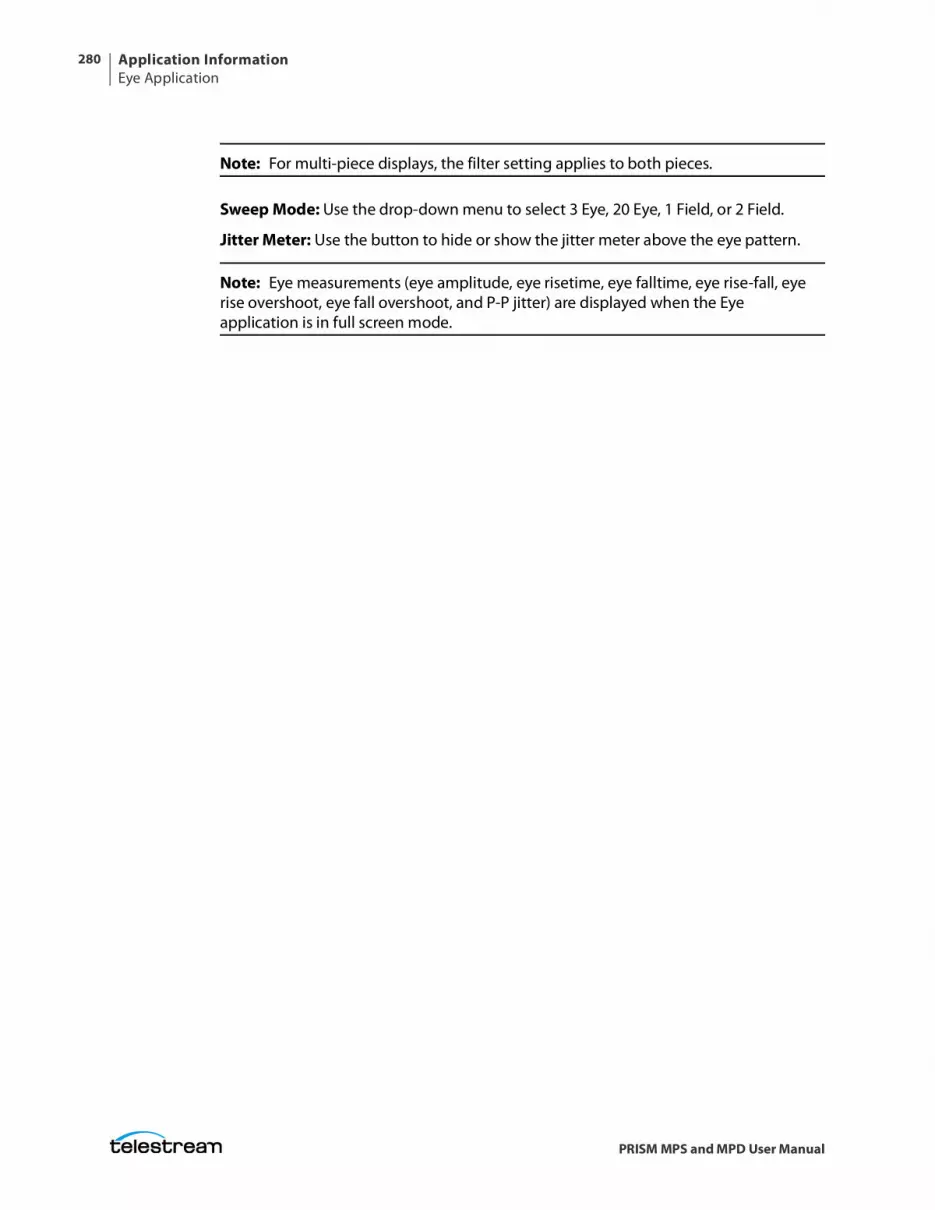
Application InformationEye Application
280
PRISM MPS and MPD User Manual
Note: For multi-piece displays, the filter setting applies to both pieces.
Sweep Mode: Use the drop-down menu to select 3 Eye, 20 Eye, 1 Field, or 2 Field.
Jitter Meter: Use the button to hide or show the jitter meter above the eye pattern.
Note: Eye measurements (eye amplitude, eye risetime, eye falltime, eye rise-fall, eye rise overshoot, eye fall overshoot, and P-P jitter) are displayed when the Eye application is in full screen mode.
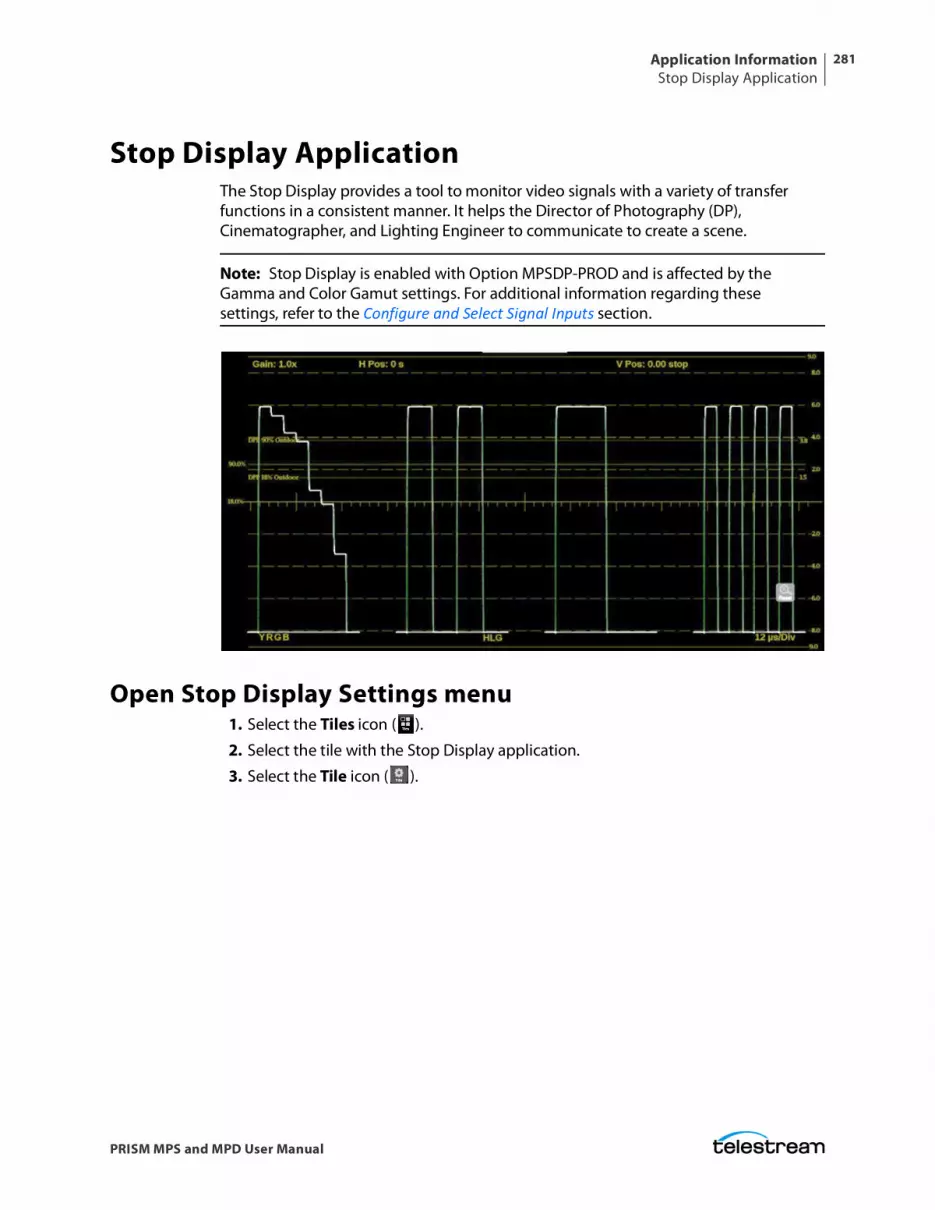
Application InformationStop Display Application
281
PRISM MPS and MPD User Manual
Stop Display ApplicationThe Stop Display provides a tool to monitor video signals with a variety of transfer functions in a consistent manner. It helps the Director of Photography (DP), Cinematographer, and Lighting Engineer to communicate to create a scene.
Note: Stop Display is enabled with Option MPSDP-PROD and is affected by the Gamma and Color Gamut settings. For additional information regarding these settings, refer to the Configure and Select Signal Inputs section.
Open Stop Display Settings menu1. Select the Tiles icon ( ).
2. Select the tile with the Stop Display application.
3. Select the Tile icon ( ).
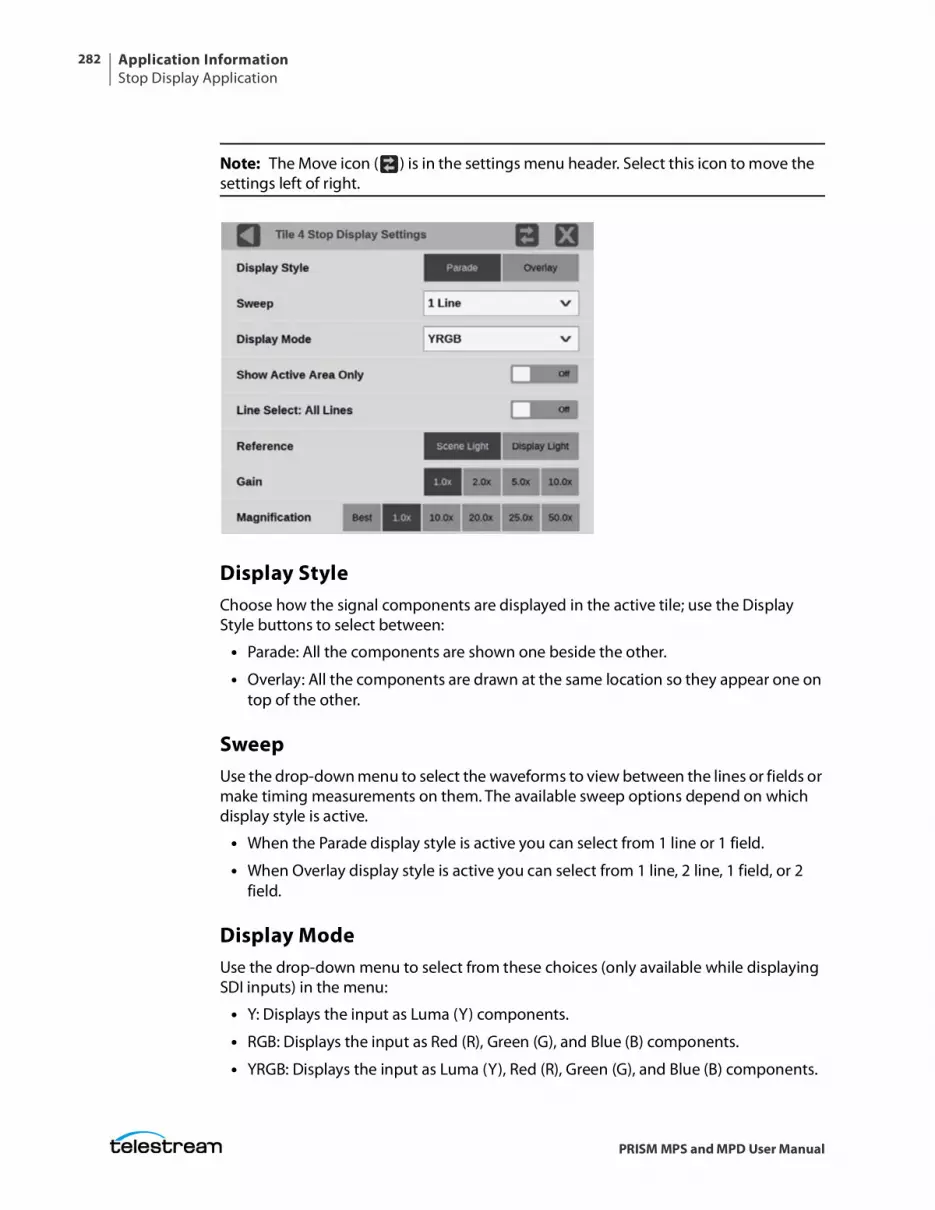
Application InformationStop Display Application
282
PRISM MPS and MPD User Manual
Note: The Move icon ( ) is in the settings menu header. Select this icon to move the settings left of right.
Display StyleChoose how the signal components are displayed in the active tile; use the Display Style buttons to select between:
• Parade: All the components are shown one beside the other.
• Overlay: All the components are drawn at the same location so they appear one on top of the other.
SweepUse the drop-down menu to select the waveforms to view between the lines or fields or make timing measurements on them. The available sweep options depend on which display style is active.
• When the Parade display style is active you can select from 1 line or 1 field.
• When Overlay display style is active you can select from 1 line, 2 line, 1 field, or 2 field.
Display ModeUse the drop-down menu to select from these choices (only available while displaying SDI inputs) in the menu:
• Y: Displays the input as Luma (Y) components.
• RGB: Displays the input as Red (R), Green (G), and Blue (B) components.
• YRGB: Displays the input as Luma (Y), Red (R), Green (G), and Blue (B) components.
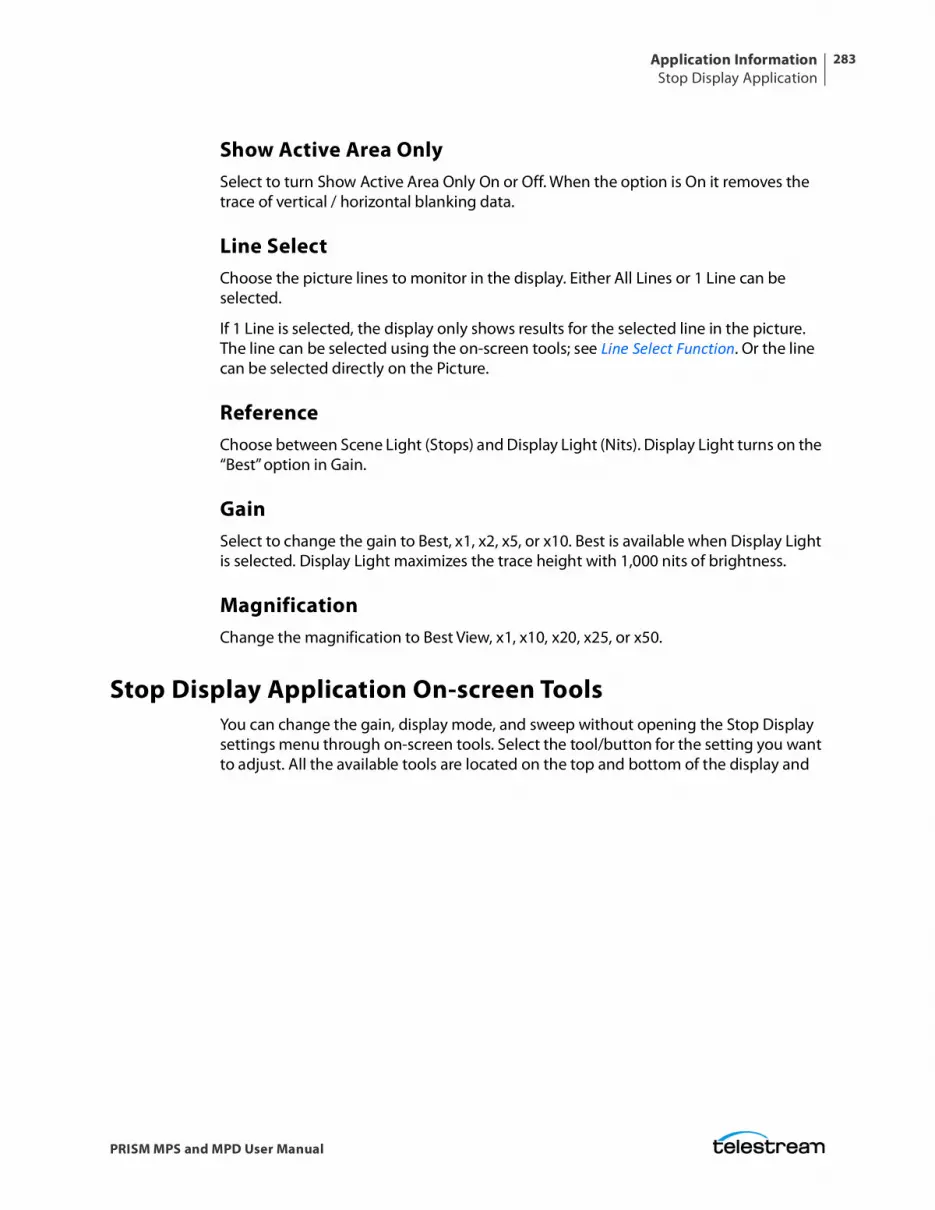
Application InformationStop Display Application
283
PRISM MPS and MPD User Manual
Show Active Area OnlySelect to turn Show Active Area Only On or Off. When the option is On it removes the trace of vertical / horizontal blanking data.
Line SelectChoose the picture lines to monitor in the display. Either All Lines or 1 Line can be selected.
If 1 Line is selected, the display only shows results for the selected line in the picture. The line can be selected using the on-screen tools; see Line Select Function. Or the line can be selected directly on the Picture.
ReferenceChoose between Scene Light (Stops) and Display Light (Nits). Display Light turns on the “Best” option in Gain.
GainSelect to change the gain to Best, x1, x2, x5, or x10. Best is available when Display Light is selected. Display Light maximizes the trace height with 1,000 nits of brightness.
MagnificationChange the magnification to Best View, x1, x10, x20, x25, or x50.
Stop Display Application On-screen ToolsYou can change the gain, display mode, and sweep without opening the Stop Display settings menu through on-screen tools. Select the tool/button for the setting you want to adjust. All the available tools are located on the top and bottom of the display and
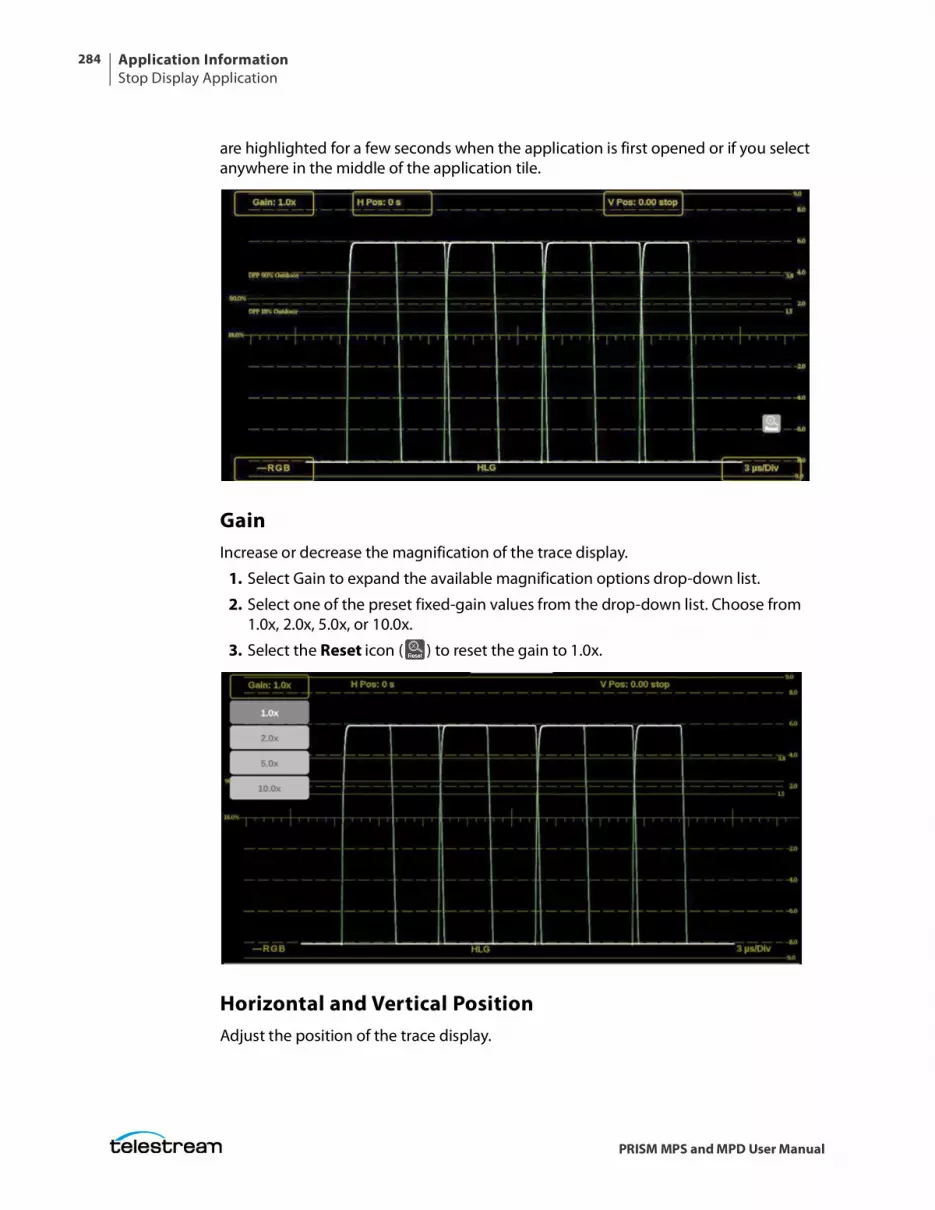
Application InformationStop Display Application
284
PRISM MPS and MPD User Manual
are highlighted for a few seconds when the application is first opened or if you select anywhere in the middle of the application tile.
GainIncrease or decrease the magnification of the trace display.
1. Select Gain to expand the available magnification options drop-down list.
2. Select one of the preset fixed-gain values from the drop-down list. Choose from 1.0x, 2.0x, 5.0x, or 10.0x.
3. Select the Reset icon ( ) to reset the gain to 1.0x.
Horizontal and Vertical PositionAdjust the position of the trace display.
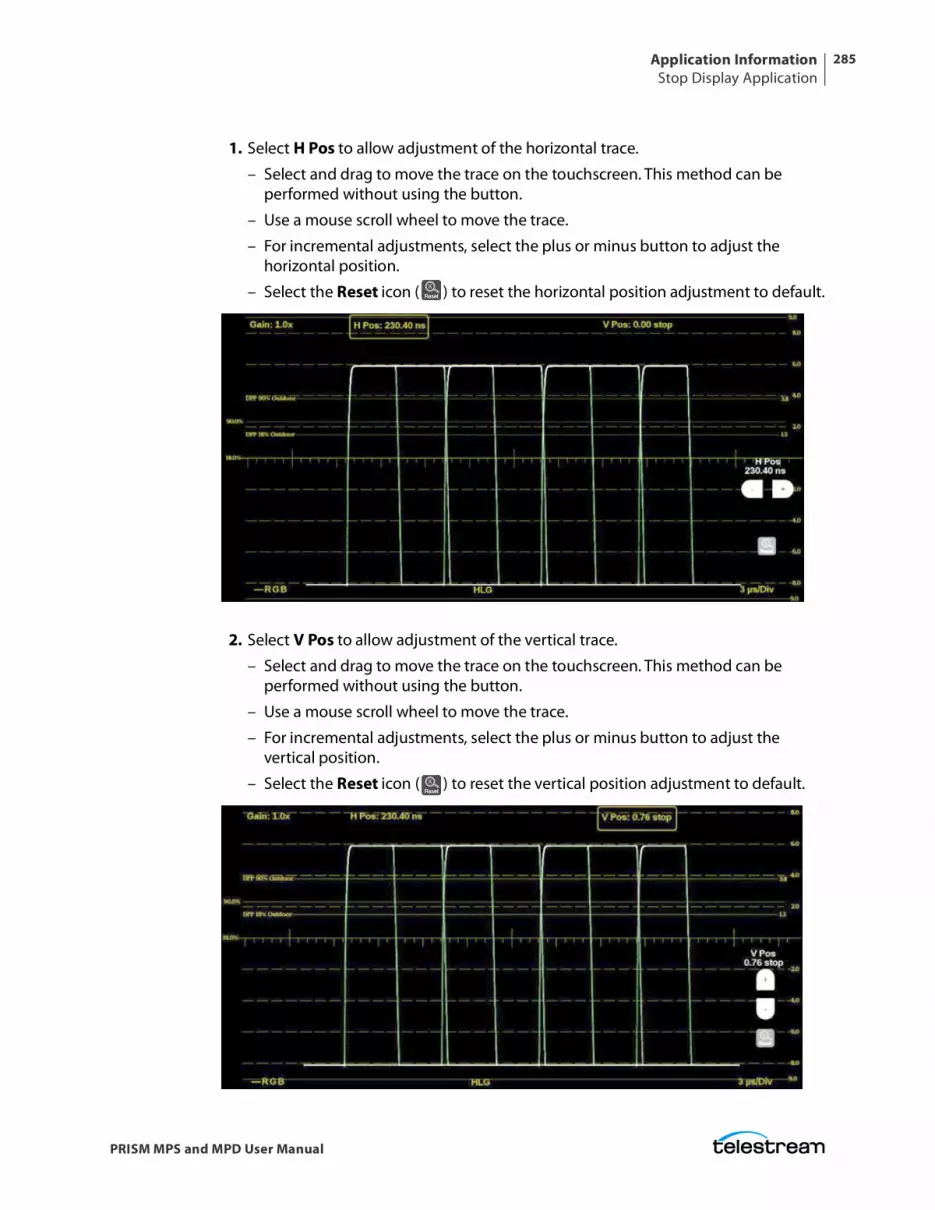
Application InformationStop Display Application
285
PRISM MPS and MPD User Manual
1. Select H Pos to allow adjustment of the horizontal trace.
– Select and drag to move the trace on the touchscreen. This method can be performed without using the button.
– Use a mouse scroll wheel to move the trace.
– For incremental adjustments, select the plus or minus button to adjust the horizontal position.
– Select the Reset icon ( ) to reset the horizontal position adjustment to default.
2. Select V Pos to allow adjustment of the vertical trace.
– Select and drag to move the trace on the touchscreen. This method can be performed without using the button.
– Use a mouse scroll wheel to move the trace.
– For incremental adjustments, select the plus or minus button to adjust the vertical position.
– Select the Reset icon ( ) to reset the vertical position adjustment to default.
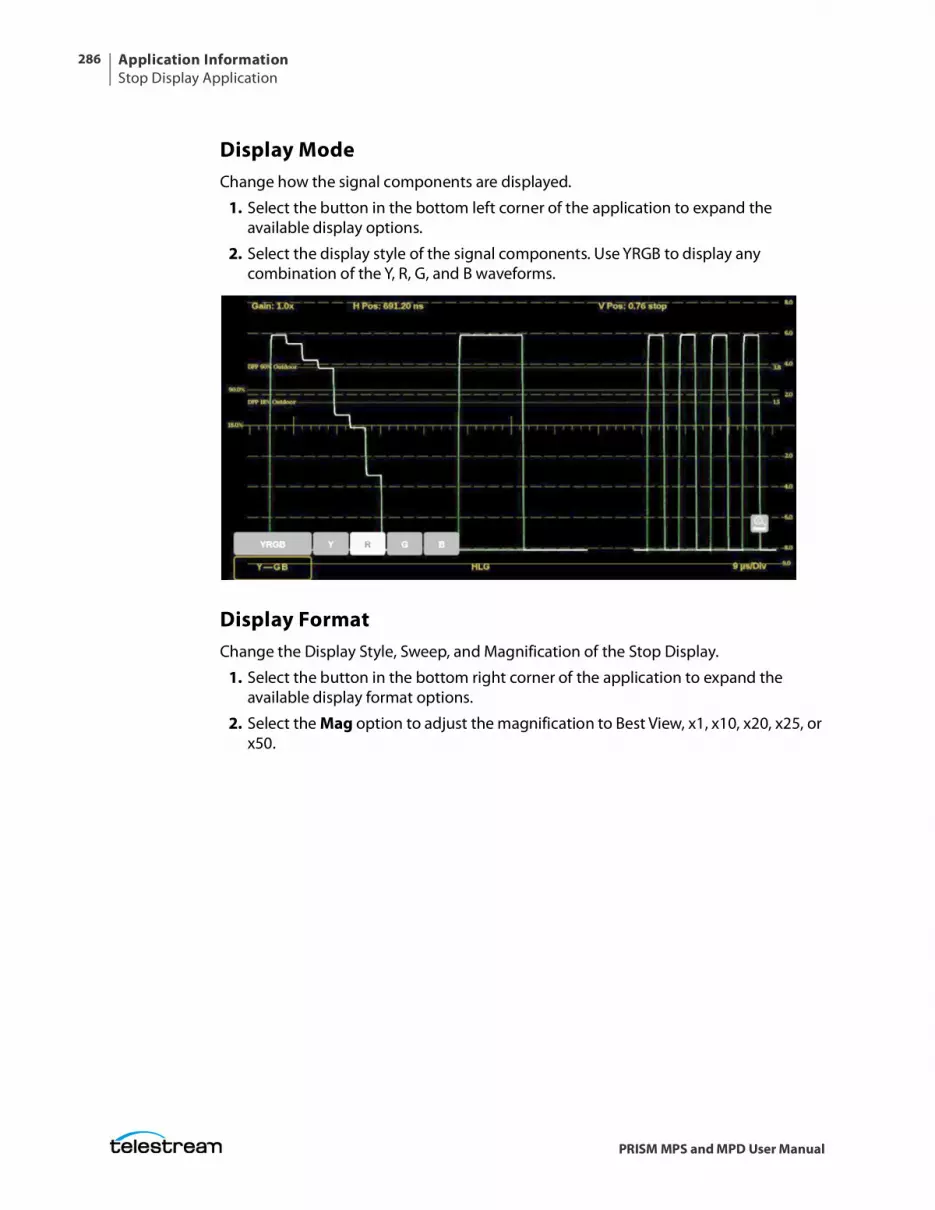
Application InformationStop Display Application
286
PRISM MPS and MPD User Manual
Display ModeChange how the signal components are displayed.
1. Select the button in the bottom left corner of the application to expand the available display options.
2. Select the display style of the signal components. Use YRGB to display any combination of the Y, R, G, and B waveforms.
Display FormatChange the Display Style, Sweep, and Magnification of the Stop Display.
1. Select the button in the bottom right corner of the application to expand the available display format options.
2. Select the Mag option to adjust the magnification to Best View, x1, x10, x20, x25, or x50.
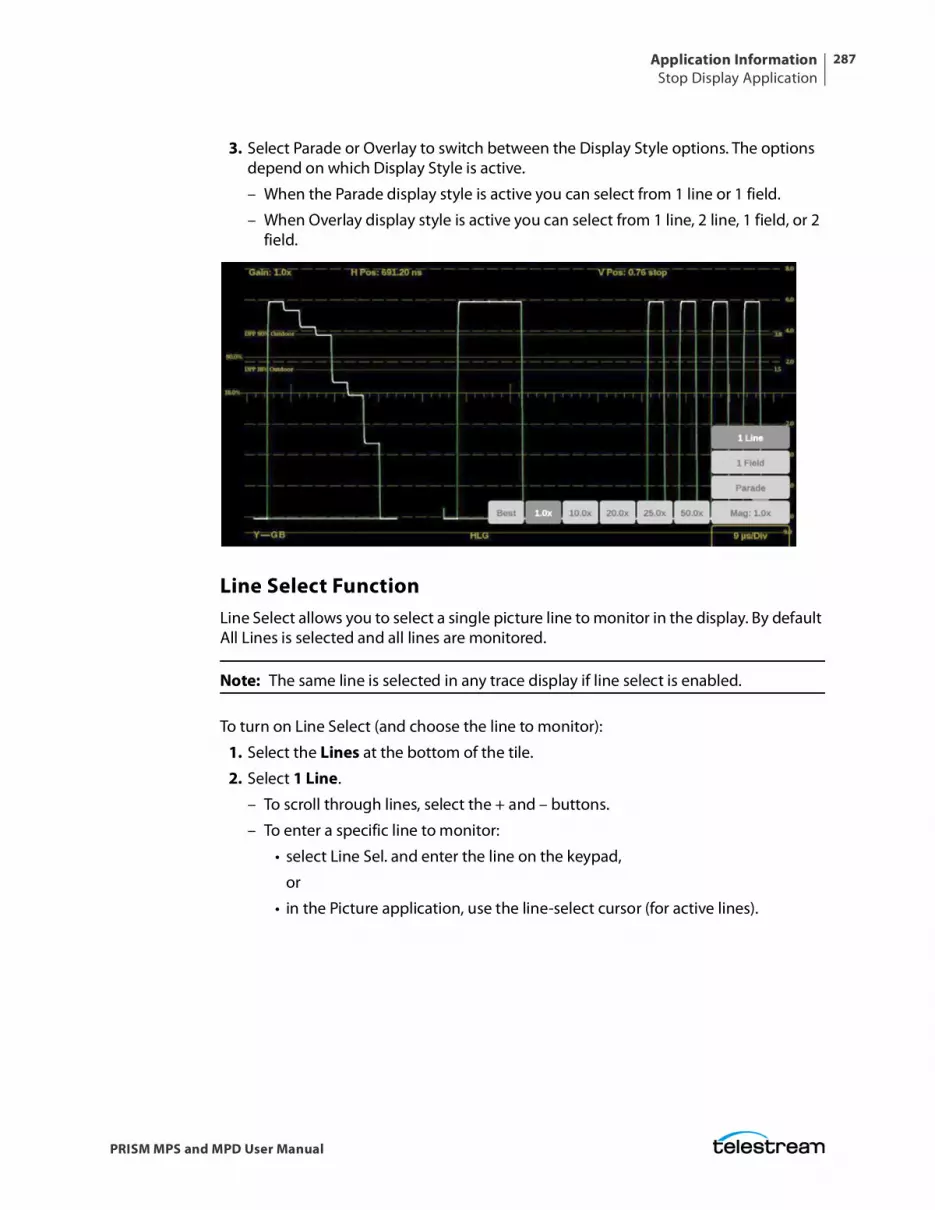
Application InformationStop Display Application
287
PRISM MPS and MPD User Manual
3. Select Parade or Overlay to switch between the Display Style options. The options depend on which Display Style is active.
– When the Parade display style is active you can select from 1 line or 1 field.
– When Overlay display style is active you can select from 1 line, 2 line, 1 field, or 2 field.
Line Select FunctionLine Select allows you to select a single picture line to monitor in the display. By default All Lines is selected and all lines are monitored.
Note: The same line is selected in any trace display if line select is enabled.
To turn on Line Select (and choose the line to monitor):
1. Select the Lines at the bottom of the tile.
2. Select 1 Line.
– To scroll through lines, select the + and – buttons.
– To enter a specific line to monitor:
• select Line Sel. and enter the line on the keypad,
or
• in the Picture application, use the line-select cursor (for active lines).
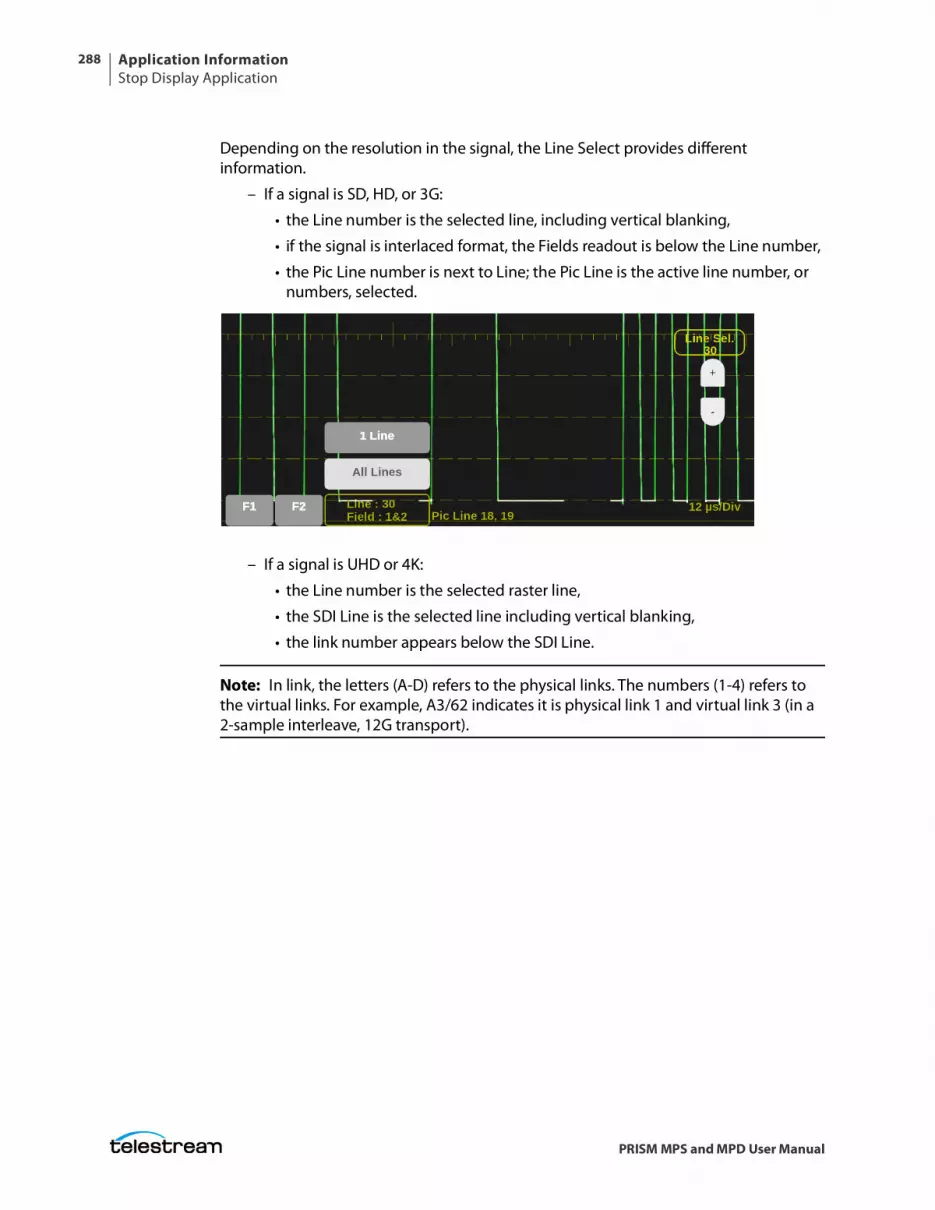
Application InformationStop Display Application
288
PRISM MPS and MPD User Manual
Depending on the resolution in the signal, the Line Select provides different information.
– If a signal is SD, HD, or 3G:
• the Line number is the selected line, including vertical blanking,
• if the signal is interlaced format, the Fields readout is below the Line number,
• the Pic Line number is next to Line; the Pic Line is the active line number, or numbers, selected.
– If a signal is UHD or 4K:
• the Line number is the selected raster line,
• the SDI Line is the selected line including vertical blanking,
• the link number appears below the SDI Line.
Note: In link, the letters (A-D) refers to the physical links. The numbers (1-4) refers to the virtual links. For example, A3/62 indicates it is physical link 1 and virtual link 3 (in a 2-sample interleave, 12G transport).
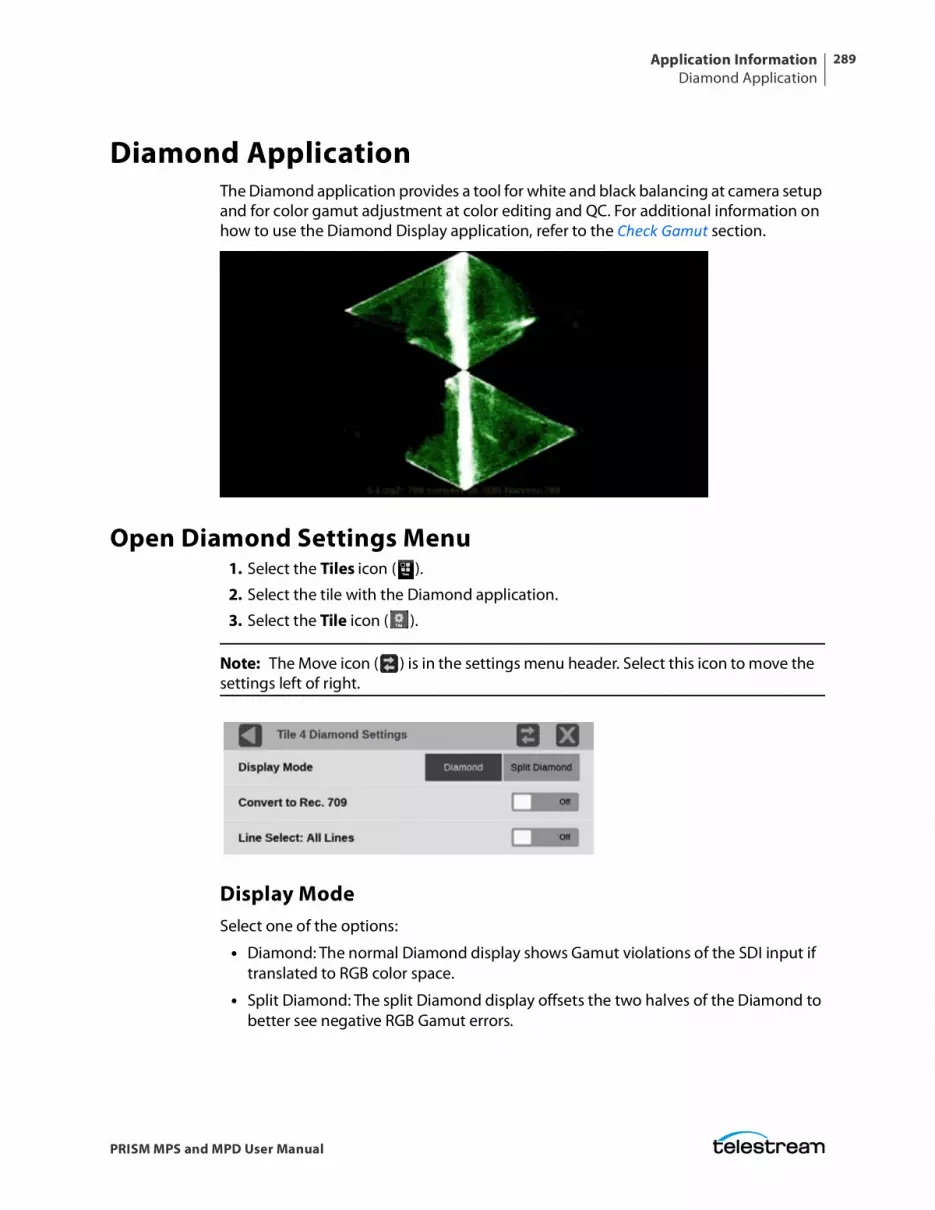
Application InformationDiamond Application
289
PRISM MPS and MPD User Manual
Diamond ApplicationThe Diamond application provides a tool for white and black balancing at camera setup and for color gamut adjustment at color editing and QC. For additional information on how to use the Diamond Display application, refer to the Check Gamut section.
Open Diamond Settings Menu1. Select the Tiles icon ( ).
2. Select the tile with the Diamond application.
3. Select the Tile icon ( ).
Note: The Move icon ( ) is in the settings menu header. Select this icon to move the settings left of right.
Display ModeSelect one of the options:
• Diamond: The normal Diamond display shows Gamut violations of the SDI input if translated to RGB color space.
• Split Diamond: The split Diamond display offsets the two halves of the Diamond to better see negative RGB Gamut errors.
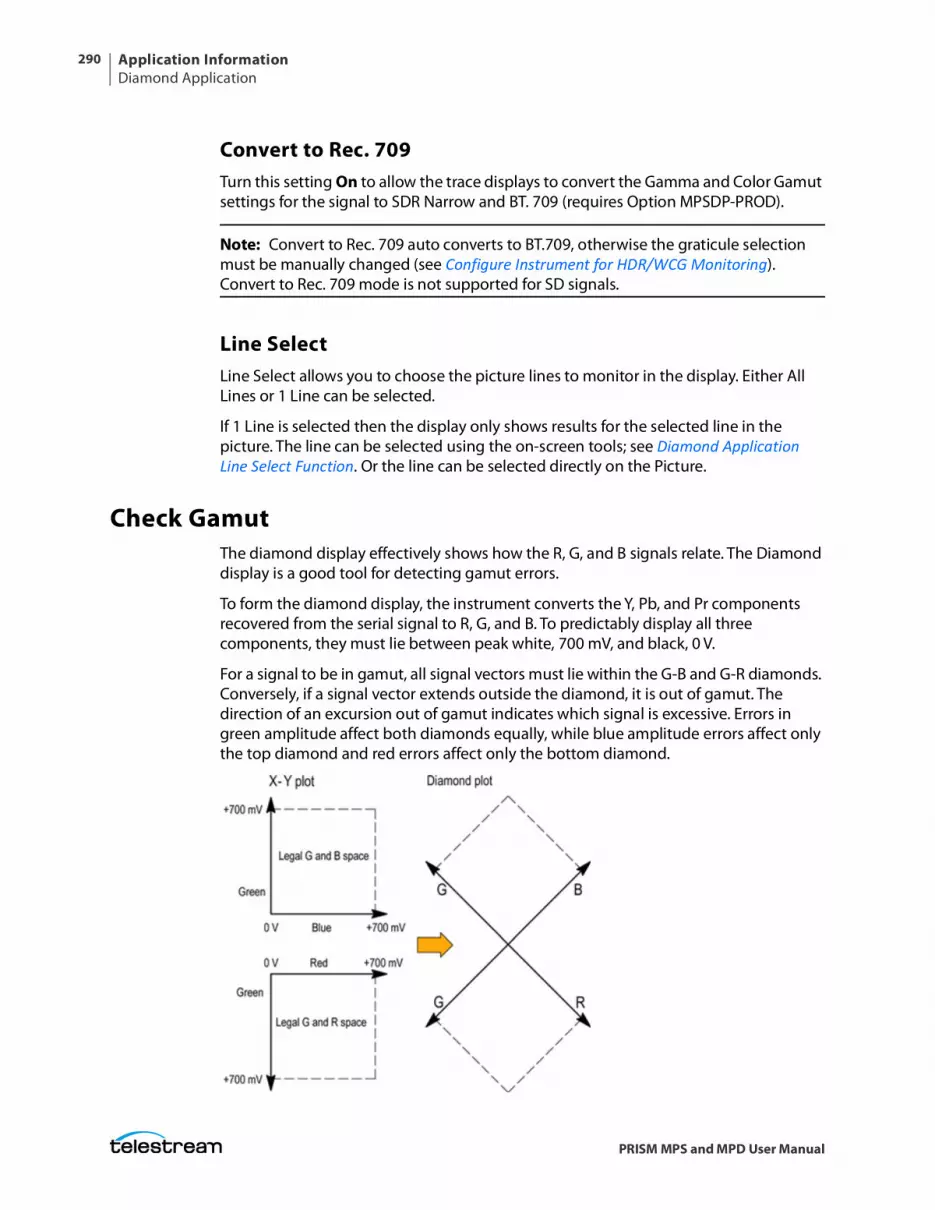
Application InformationDiamond Application
290
PRISM MPS and MPD User Manual
Convert to Rec. 709Turn this setting On to allow the trace displays to convert the Gamma and Color Gamut settings for the signal to SDR Narrow and BT. 709 (requires Option MPSDP-PROD).
Note: Convert to Rec. 709 auto converts to BT.709, otherwise the graticule selection must be manually changed (see Configure Instrument for HDR/WCG Monitoring). Convert to Rec. 709 mode is not supported for SD signals.
Line SelectLine Select allows you to choose the picture lines to monitor in the display. Either All Lines or 1 Line can be selected.
If 1 Line is selected then the display only shows results for the selected line in the picture. The line can be selected using the on-screen tools; see Diamond Application Line Select Function. Or the line can be selected directly on the Picture.
Check GamutThe diamond display effectively shows how the R, G, and B signals relate. The Diamond display is a good tool for detecting gamut errors.
To form the diamond display, the instrument converts the Y, Pb, and Pr components recovered from the serial signal to R, G, and B. To predictably display all three components, they must lie between peak white, 700 mV, and black, 0 V.
For a signal to be in gamut, all signal vectors must lie within the G-B and G-R diamonds. Conversely, if a signal vector extends outside the diamond, it is out of gamut. The direction of an excursion out of gamut indicates which signal is excessive. Errors in green amplitude affect both diamonds equally, while blue amplitude errors affect only the top diamond and red errors affect only the bottom diamond.
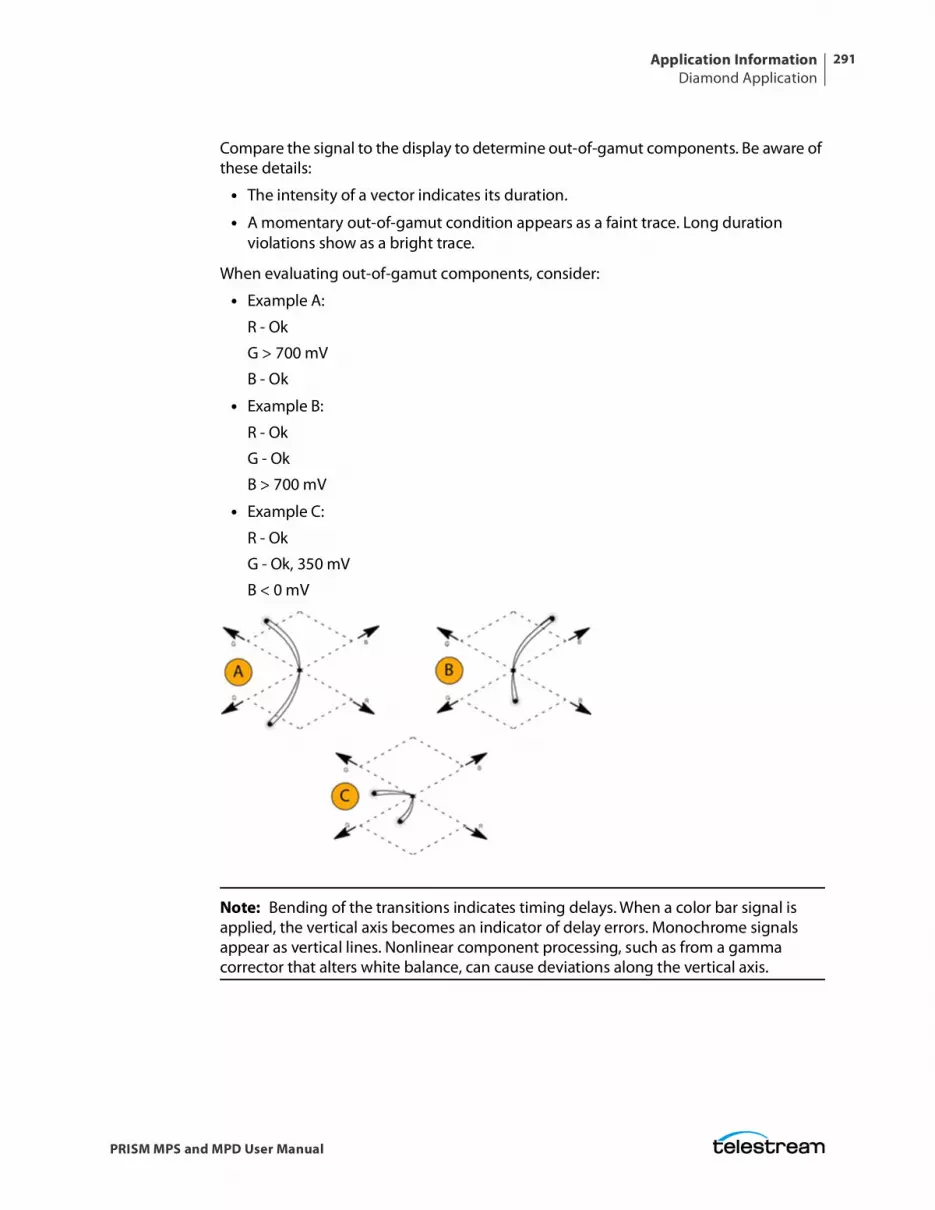
Application InformationDiamond Application
291
PRISM MPS and MPD User Manual
Compare the signal to the display to determine out-of-gamut components. Be aware of these details:
• The intensity of a vector indicates its duration.
• A momentary out-of-gamut condition appears as a faint trace. Long duration violations show as a bright trace.
When evaluating out-of-gamut components, consider:
• Example A:
R - Ok
G > 700 mV
B - Ok
• Example B:
R - Ok
G - Ok
B > 700 mV
• Example C:
R - Ok
G - Ok, 350 mV
B < 0 mV
Note: Bending of the transitions indicates timing delays. When a color bar signal is applied, the vertical axis becomes an indicator of delay errors. Monochrome signals appear as vertical lines. Nonlinear component processing, such as from a gamma corrector that alters white balance, can cause deviations along the vertical axis.
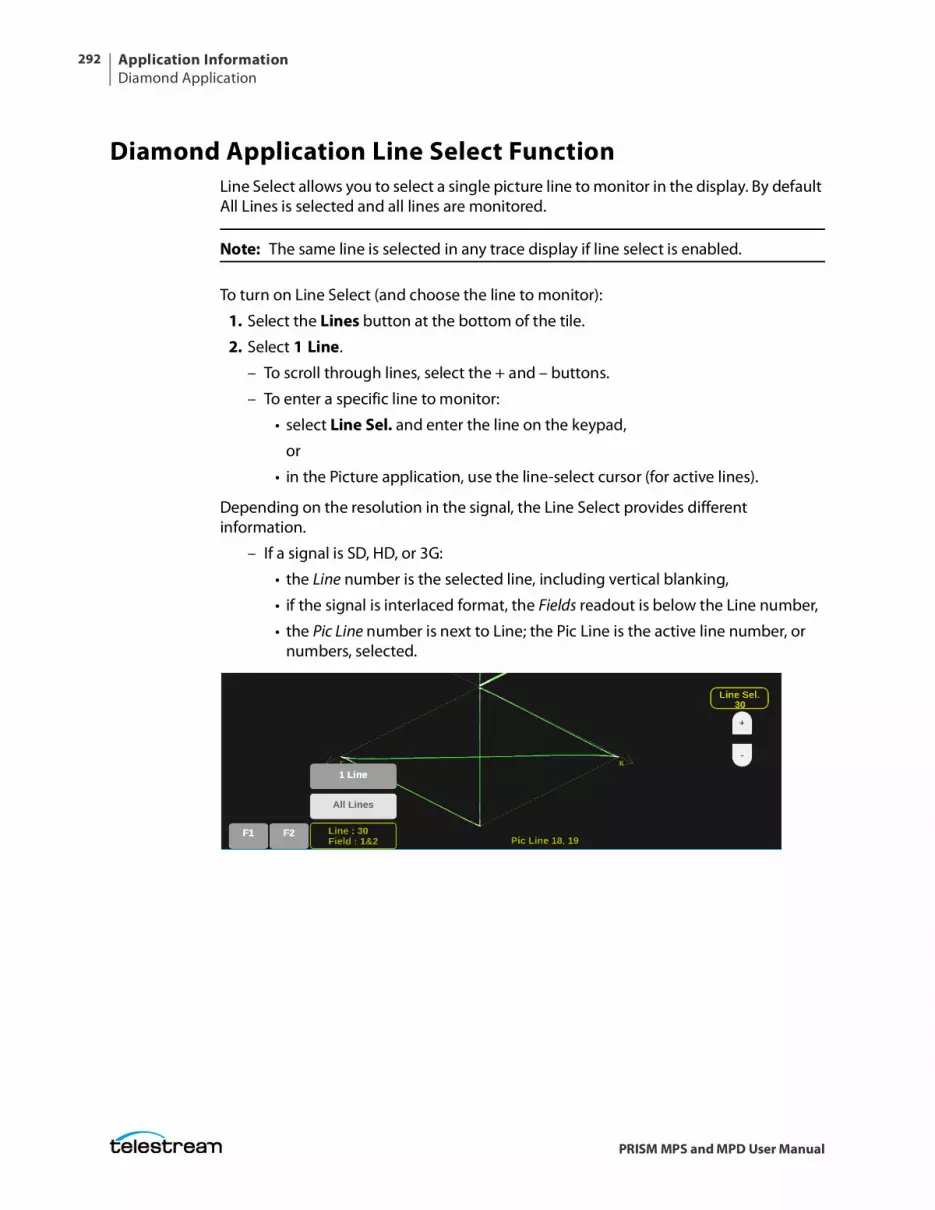
Application InformationDiamond Application
292
PRISM MPS and MPD User Manual
Diamond Application Line Select FunctionLine Select allows you to select a single picture line to monitor in the display. By default All Lines is selected and all lines are monitored.
Note: The same line is selected in any trace display if line select is enabled.
To turn on Line Select (and choose the line to monitor):
1. Select the Lines button at the bottom of the tile.
2. Select 1 Line.
– To scroll through lines, select the + and – buttons.
– To enter a specific line to monitor:
• select Line Sel. and enter the line on the keypad,
or
• in the Picture application, use the line-select cursor (for active lines).
Depending on the resolution in the signal, the Line Select provides different information.
– If a signal is SD, HD, or 3G:
• the Line number is the selected line, including vertical blanking,
• if the signal is interlaced format, the Fields readout is below the Line number,
• the Pic Line number is next to Line; the Pic Line is the active line number, or numbers, selected.
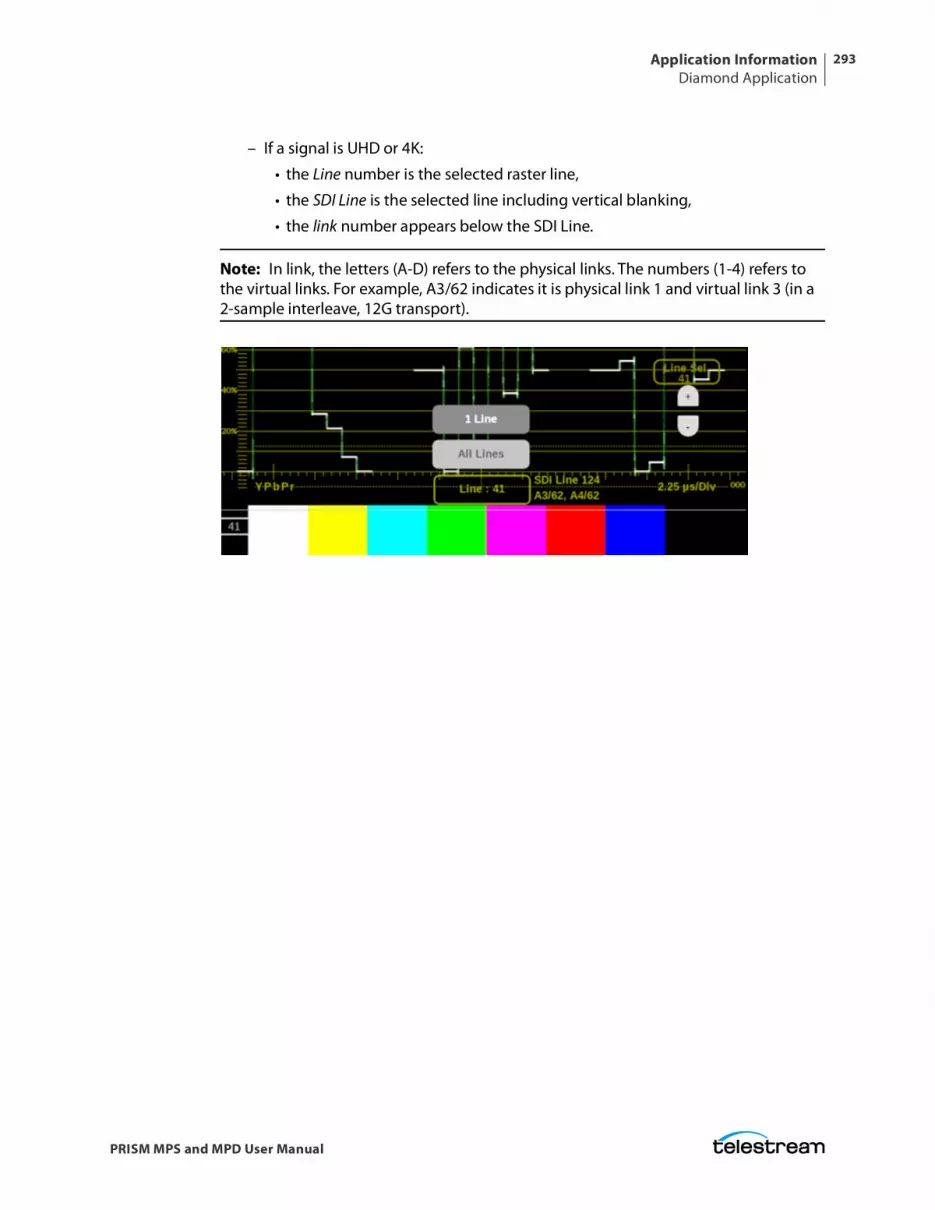
Application InformationDiamond Application
293
PRISM MPS and MPD User Manual
– If a signal is UHD or 4K:
• the Line number is the selected raster line,
• the SDI Line is the selected line including vertical blanking,
• the link number appears below the SDI Line.
Note: In link, the letters (A-D) refers to the physical links. The numbers (1-4) refers to the virtual links. For example, A3/62 indicates it is physical link 1 and virtual link 3 (in a 2-sample interleave, 12G transport).
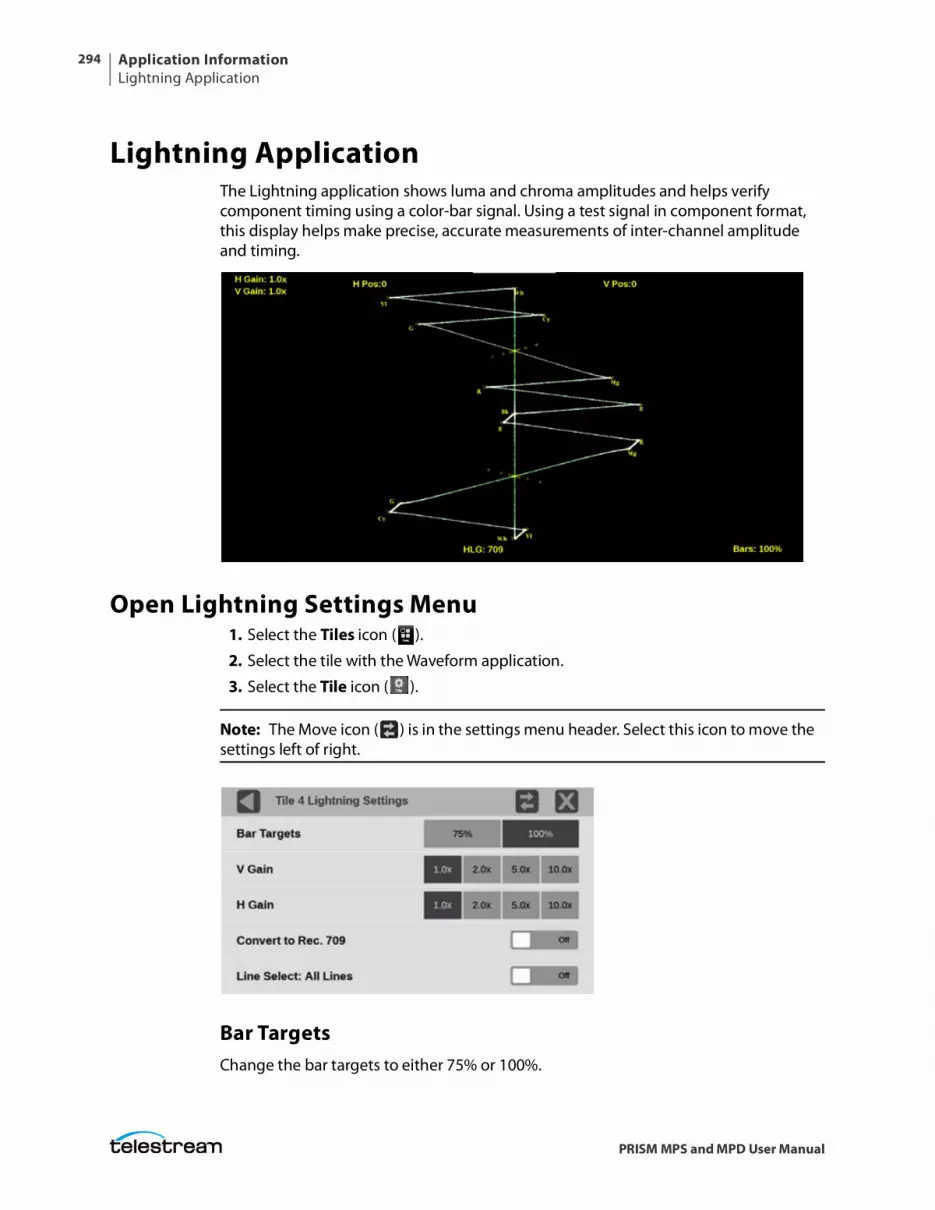
Application InformationLightning Application
294
PRISM MPS and MPD User Manual
Lightning ApplicationThe Lightning application shows luma and chroma amplitudes and helps verify component timing using a color-bar signal. Using a test signal in component format, this display helps make precise, accurate measurements of inter-channel amplitude and timing.
Open Lightning Settings Menu1. Select the Tiles icon ( ).
2. Select the tile with the Waveform application.
3. Select the Tile icon ( ).
Note: The Move icon ( ) is in the settings menu header. Select this icon to move the settings left of right.
Bar TargetsChange the bar targets to either 75% or 100%.
Application InformationLightning Application
295
PRISM MPS and MPD User Manual
V GainChange the vertical gain by x1, x2, x5, or x10 magnification.
H GainChange the horizontal gain by x1, x2, x5, or x10 magnification.
Convert to Rec. 709Turn this setting On to allow the trace displays to convert the Gamma and Color Gamut settings for the signal to SDR Narrow and BT. 709 (requires Option MPSDP-PROD).
Note: Convert to Rec. 709 auto converts to BT.709, otherwise the graticule selection must be manually changed. See Configure Instrument for HDR/WCG Monitoring. Convert to Rec. 709 mode is not supported for SD signals.
Line SelectLine Select allows you to choose the picture lines to monitor in the display. Either All Lines or 1 Line can be selected.
If 1 Line is selected, the display only shows results for the selected line in the picture. The line can be selected using the on-screen tools; see Line Select Function. Or the line can be selected directly on the Picture.
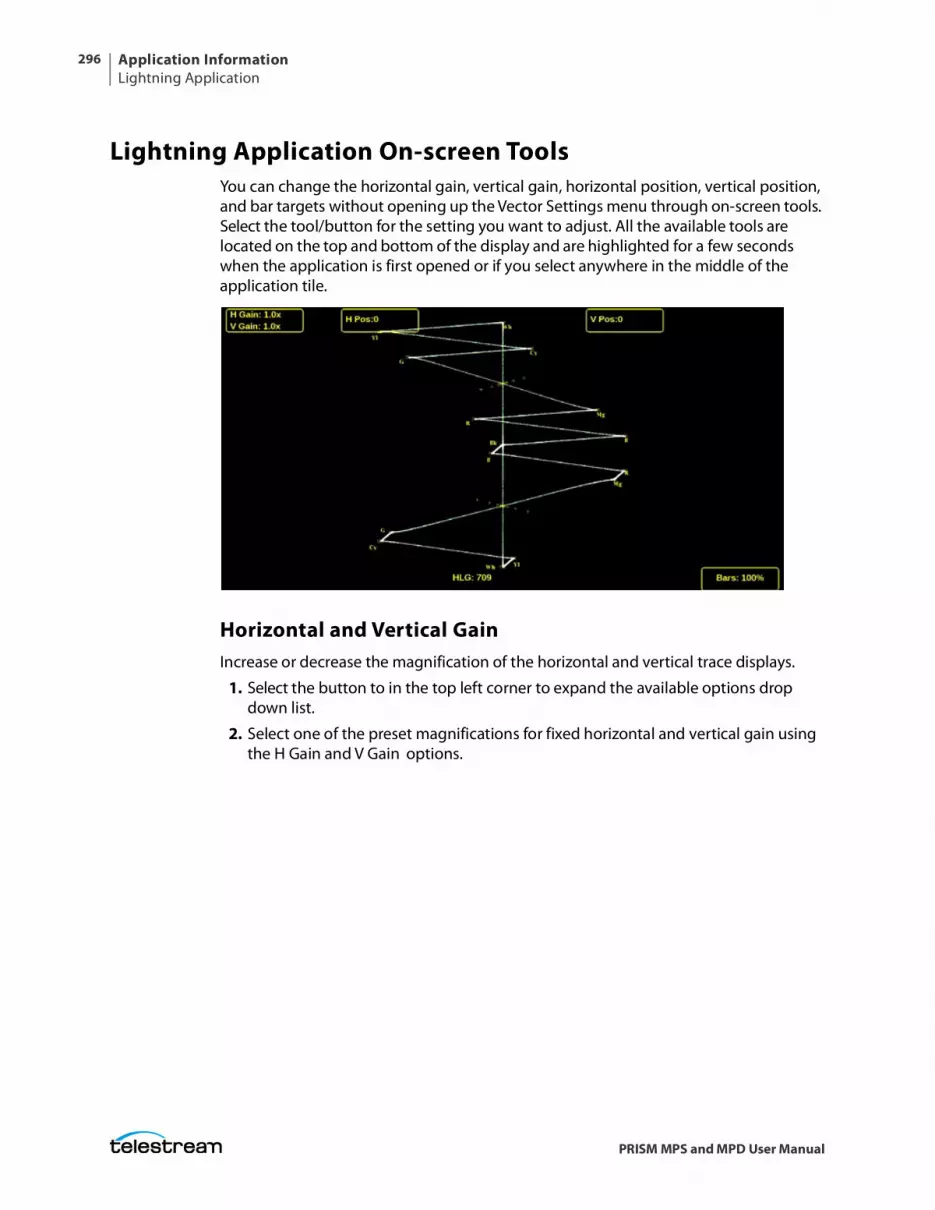
Application InformationLightning Application
296
PRISM MPS and MPD User Manual
Lightning Application On-screen ToolsYou can change the horizontal gain, vertical gain, horizontal position, vertical position, and bar targets without opening up the Vector Settings menu through on-screen tools. Select the tool/button for the setting you want to adjust. All the available tools are located on the top and bottom of the display and are highlighted for a few seconds when the application is first opened or if you select anywhere in the middle of the application tile.
Horizontal and Vertical GainIncrease or decrease the magnification of the horizontal and vertical trace displays.
1. Select the button to in the top left corner to expand the available options drop down list.
2. Select one of the preset magnifications for fixed horizontal and vertical gain using the H Gain and V Gain options.
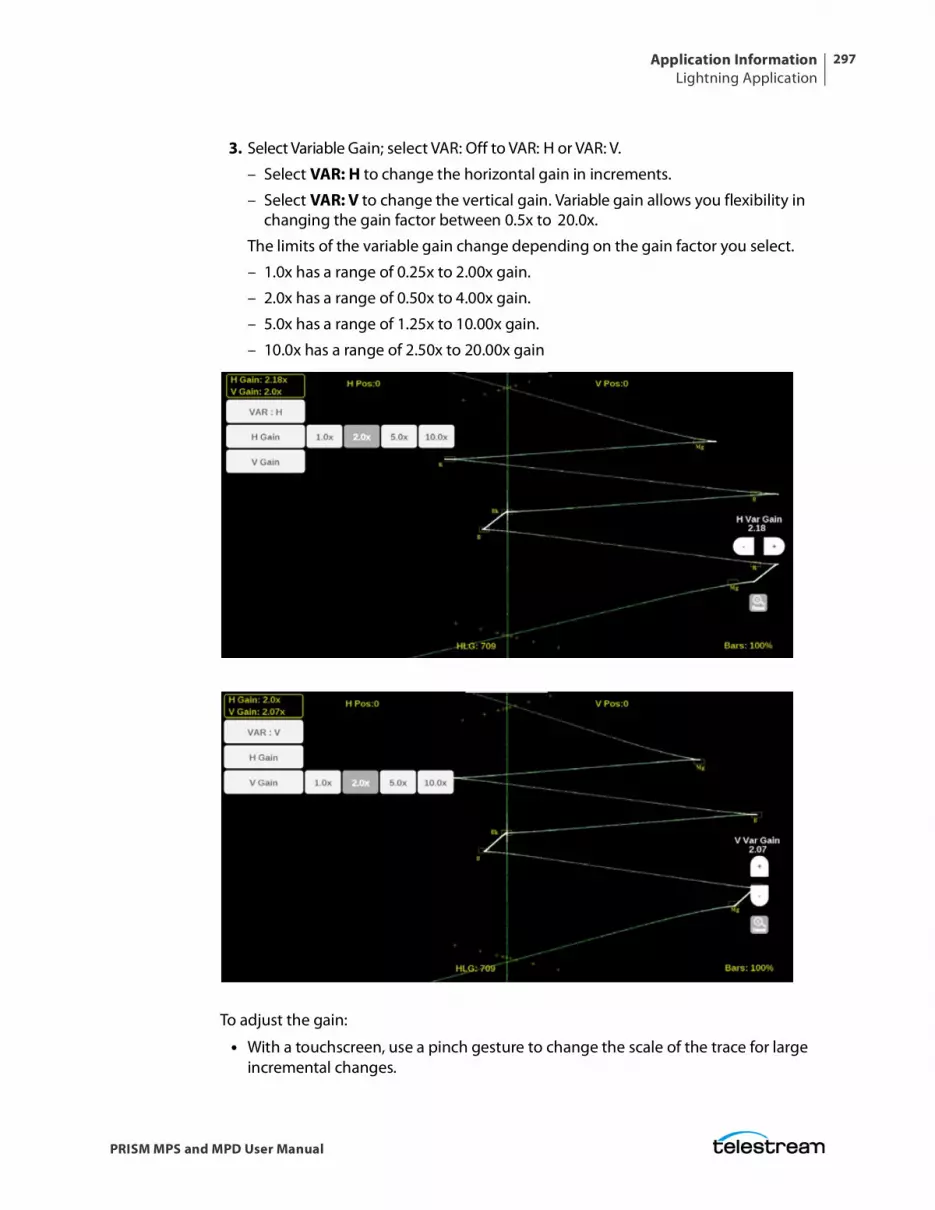
Application InformationLightning Application
297
PRISM MPS and MPD User Manual
3. Select Variable Gain; select VAR: Off to VAR: H or VAR: V.
– Select VAR: H to change the horizontal gain in increments.
– Select VAR: V to change the vertical gain. Variable gain allows you flexibility in changing the gain factor between 0.5x to 20.0x.
The limits of the variable gain change depending on the gain factor you select.
– 1.0x has a range of 0.25x to 2.00x gain.
– 2.0x has a range of 0.50x to 4.00x gain.
– 5.0x has a range of 1.25x to 10.00x gain.
– 10.0x has a range of 2.50x to 20.00x gain
To adjust the gain:
• With a touchscreen, use a pinch gesture to change the scale of the trace for large incremental changes.
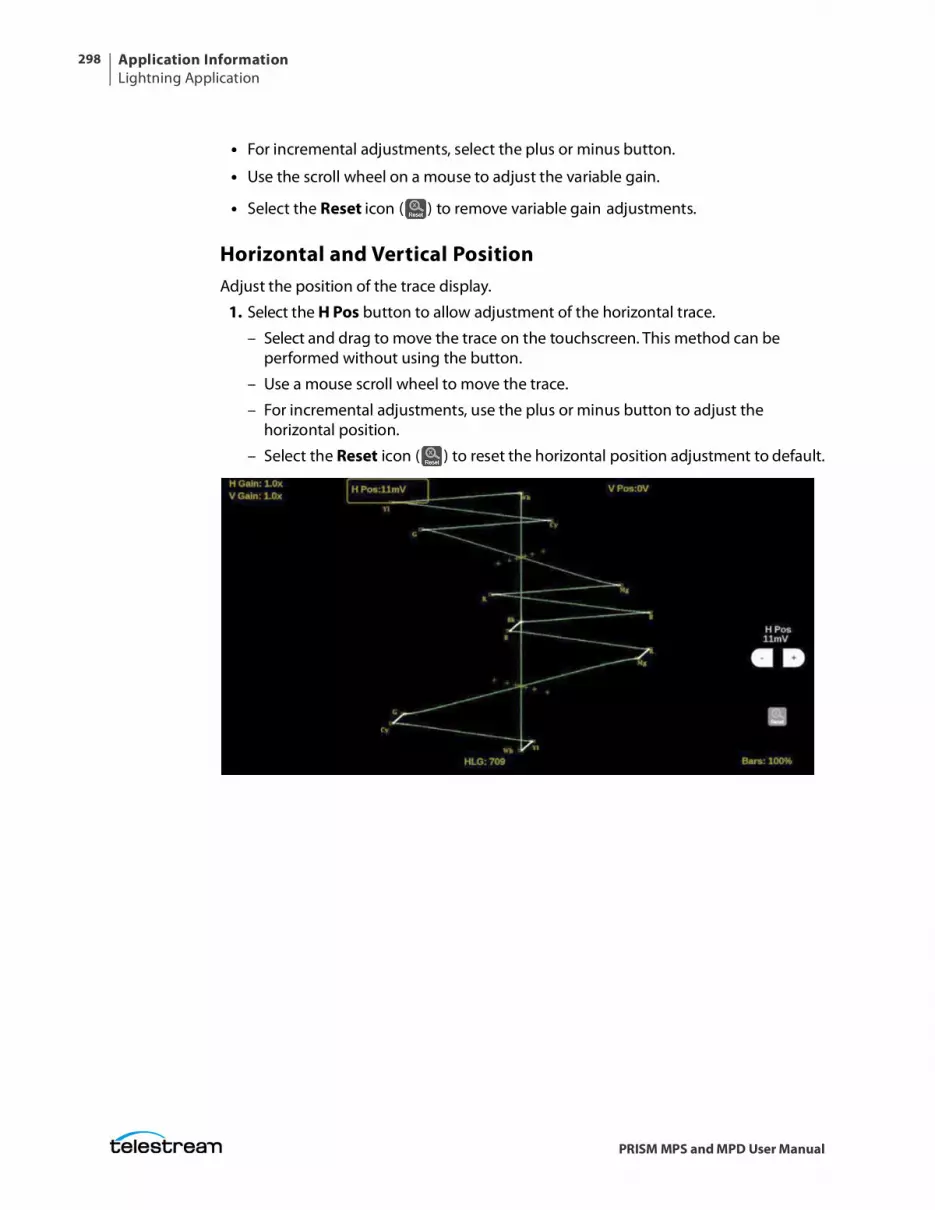
Application InformationLightning Application
298
PRISM MPS and MPD User Manual
• For incremental adjustments, select the plus or minus button.
• Use the scroll wheel on a mouse to adjust the variable gain.
• Select the Reset icon ( ) to remove variable gain adjustments.
Horizontal and Vertical PositionAdjust the position of the trace display.
1. Select the H Pos button to allow adjustment of the horizontal trace.
– Select and drag to move the trace on the touchscreen. This method can be performed without using the button.
– Use a mouse scroll wheel to move the trace.
– For incremental adjustments, use the plus or minus button to adjust the horizontal position.
– Select the Reset icon ( ) to reset the horizontal position adjustment to default.
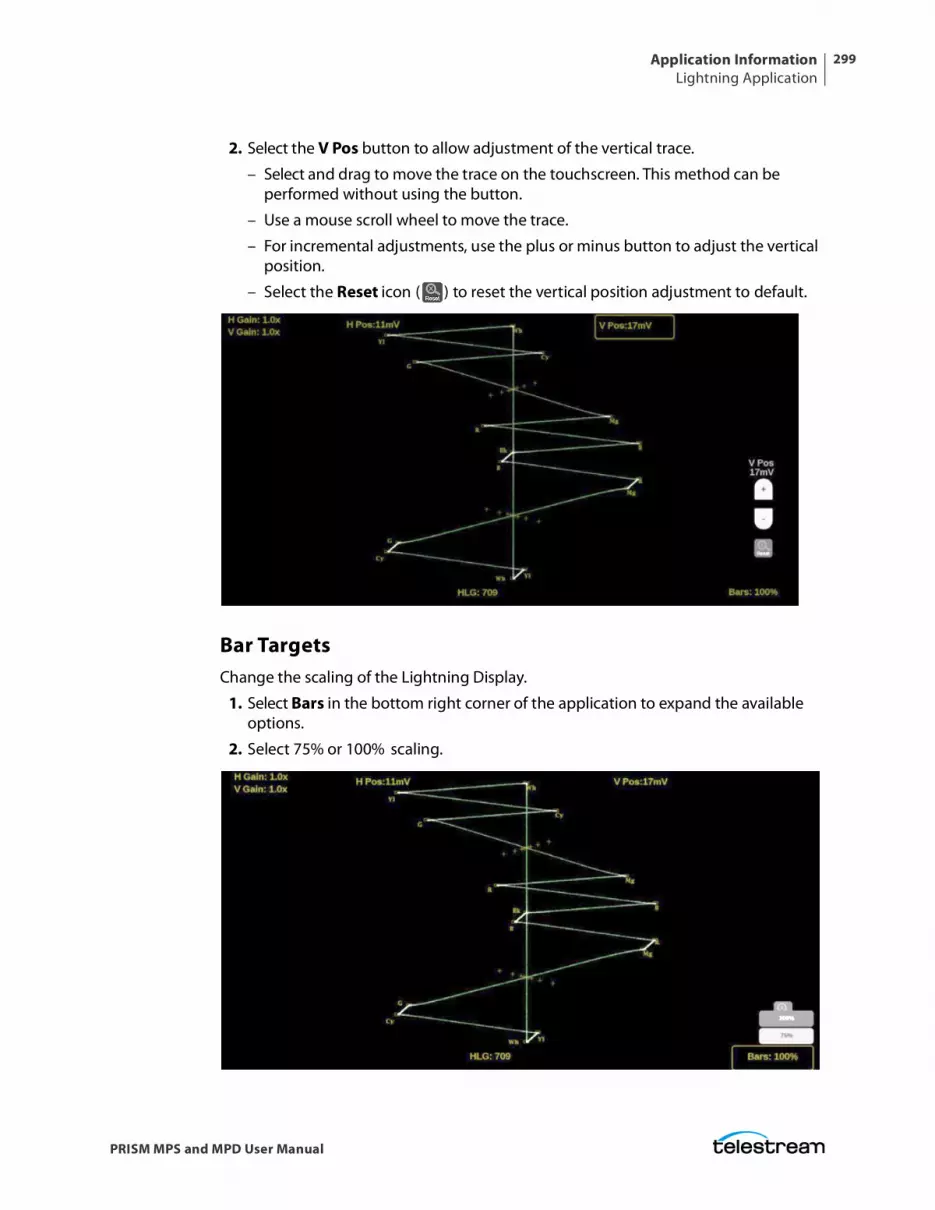
Application InformationLightning Application
299
PRISM MPS and MPD User Manual
2. Select the V Pos button to allow adjustment of the vertical trace.
– Select and drag to move the trace on the touchscreen. This method can be performed without using the button.
– Use a mouse scroll wheel to move the trace.
– For incremental adjustments, use the plus or minus button to adjust the vertical position.
– Select the Reset icon ( ) to reset the vertical position adjustment to default.
Bar TargetsChange the scaling of the Lightning Display.
1. Select Bars in the bottom right corner of the application to expand the available options.
2. Select 75% or 100% scaling.
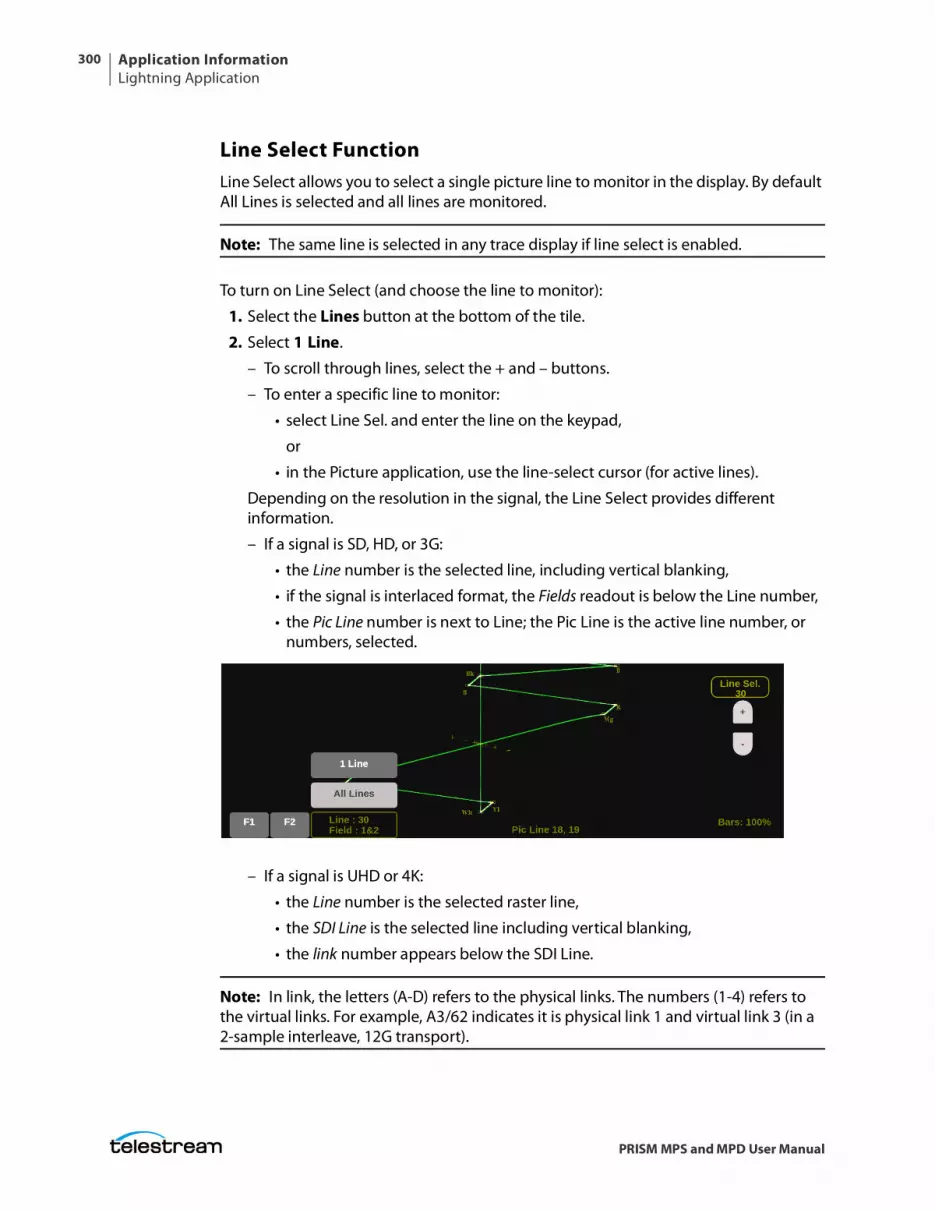
Application InformationLightning Application
300
PRISM MPS and MPD User Manual
Line Select FunctionLine Select allows you to select a single picture line to monitor in the display. By default All Lines is selected and all lines are monitored.
Note: The same line is selected in any trace display if line select is enabled.
To turn on Line Select (and choose the line to monitor):
1. Select the Lines button at the bottom of the tile.
2. Select 1 Line.
– To scroll through lines, select the + and – buttons.
– To enter a specific line to monitor:
• select Line Sel. and enter the line on the keypad,
or
• in the Picture application, use the line-select cursor (for active lines).
Depending on the resolution in the signal, the Line Select provides different information.
– If a signal is SD, HD, or 3G:
• the Line number is the selected line, including vertical blanking,
• if the signal is interlaced format, the Fields readout is below the Line number,
• the Pic Line number is next to Line; the Pic Line is the active line number, or numbers, selected.
– If a signal is UHD or 4K:
• the Line number is the selected raster line,
• the SDI Line is the selected line including vertical blanking,
• the link number appears below the SDI Line.
Note: In link, the letters (A-D) refers to the physical links. The numbers (1-4) refers to the virtual links. For example, A3/62 indicates it is physical link 1 and virtual link 3 (in a 2-sample interleave, 12G transport).
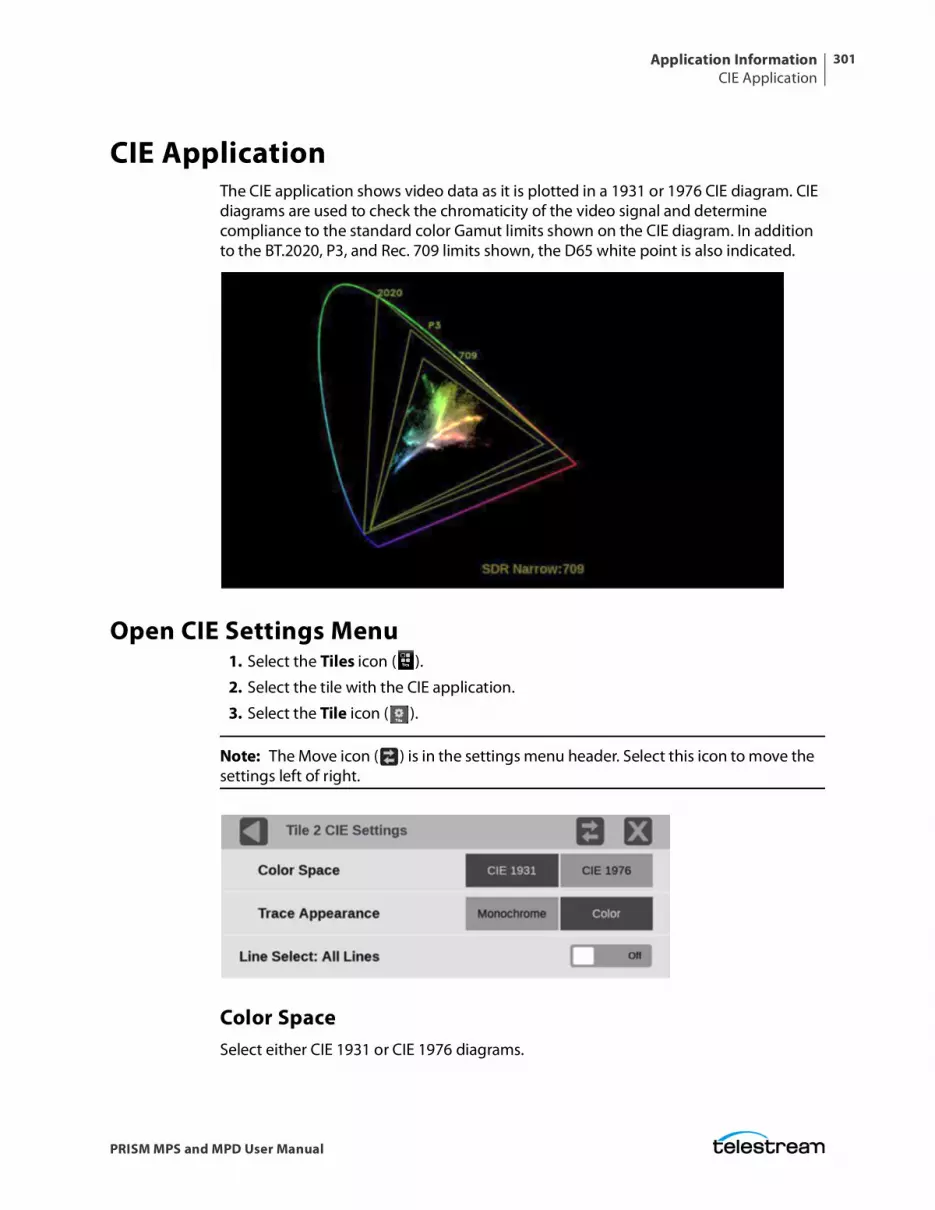
Application InformationCIE Application
301
PRISM MPS and MPD User Manual
CIE ApplicationThe CIE application shows video data as it is plotted in a 1931 or 1976 CIE diagram. CIE diagrams are used to check the chromaticity of the video signal and determine compliance to the standard color Gamut limits shown on the CIE diagram. In addition to the BT.2020, P3, and Rec. 709 limits shown, the D65 white point is also indicated.
Open CIE Settings Menu 1. Select the Tiles icon ( ).
2. Select the tile with the CIE application.
3. Select the Tile icon ( ).
Note: The Move icon ( ) is in the settings menu header. Select this icon to move the settings left of right.
Color SpaceSelect either CIE 1931 or CIE 1976 diagrams.
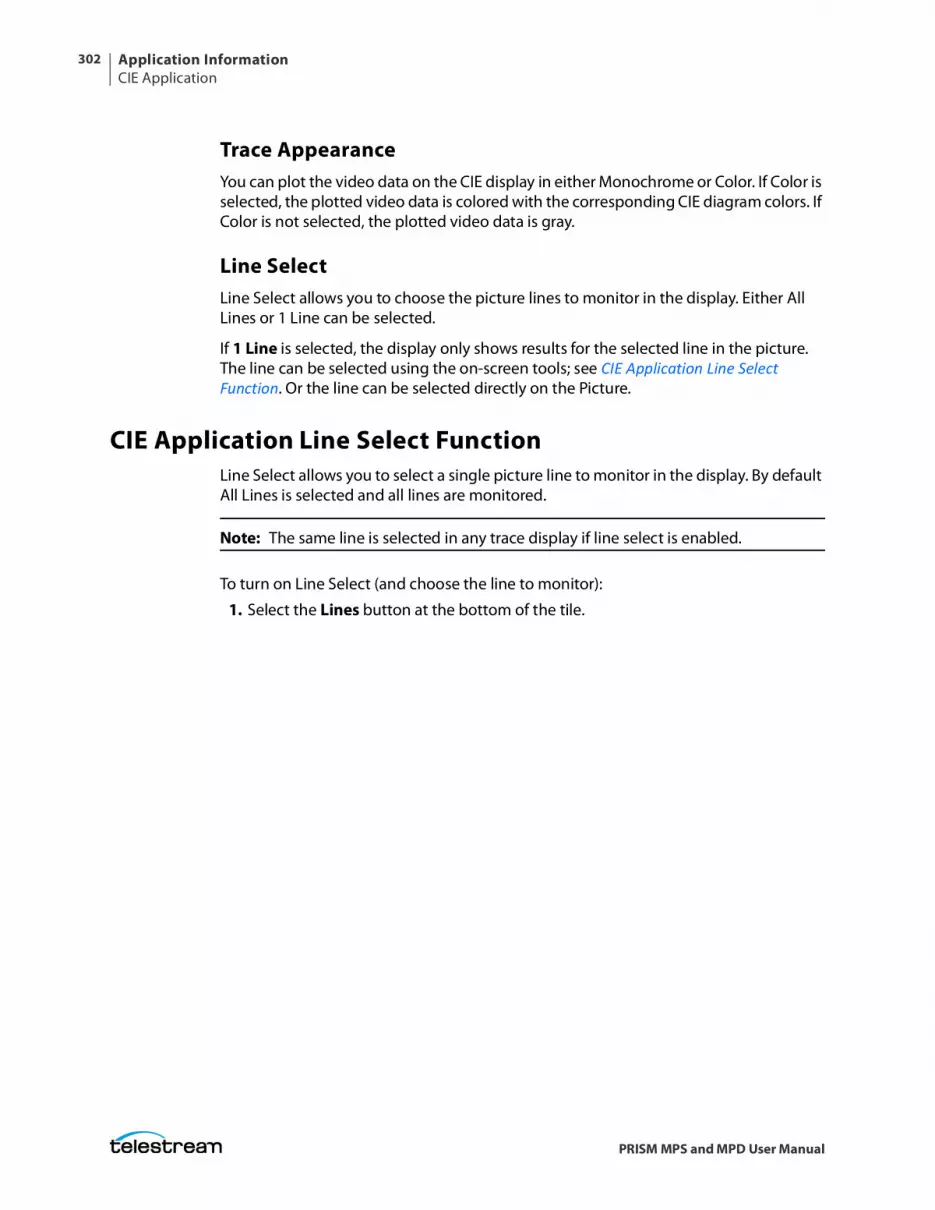
Application InformationCIE Application
302
PRISM MPS and MPD User Manual
Trace AppearanceYou can plot the video data on the CIE display in either Monochrome or Color. If Color is selected, the plotted video data is colored with the corresponding CIE diagram colors. If Color is not selected, the plotted video data is gray.
Line SelectLine Select allows you to choose the picture lines to monitor in the display. Either All Lines or 1 Line can be selected.
If 1 Line is selected, the display only shows results for the selected line in the picture. The line can be selected using the on-screen tools; see CIE Application Line Select Function. Or the line can be selected directly on the Picture.
CIE Application Line Select FunctionLine Select allows you to select a single picture line to monitor in the display. By default All Lines is selected and all lines are monitored.
Note: The same line is selected in any trace display if line select is enabled.
To turn on Line Select (and choose the line to monitor):
1. Select the Lines button at the bottom of the tile.
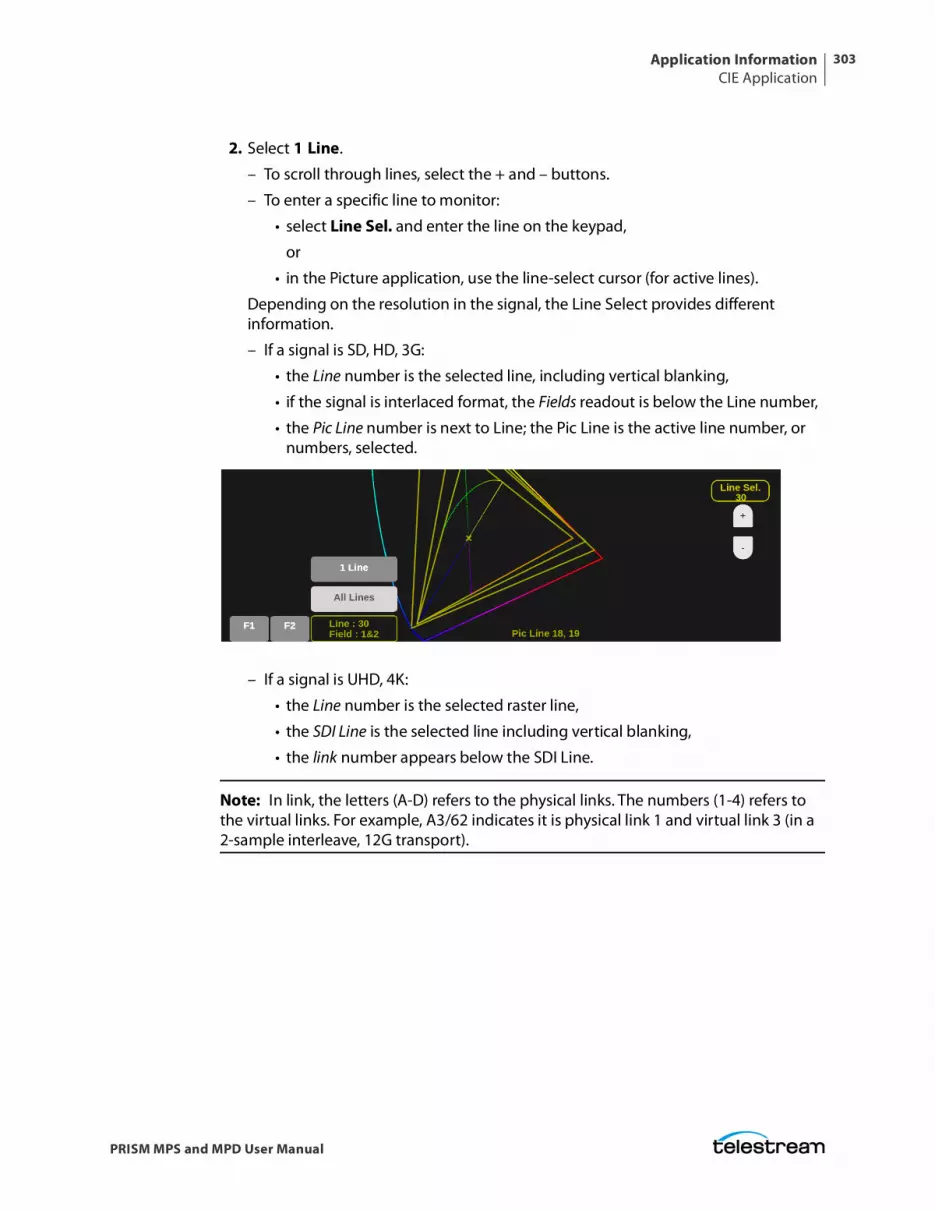
Application InformationCIE Application
303
PRISM MPS and MPD User Manual
2. Select 1 Line.
– To scroll through lines, select the + and – buttons.
– To enter a specific line to monitor:
• select Line Sel. and enter the line on the keypad,
or
• in the Picture application, use the line-select cursor (for active lines).
Depending on the resolution in the signal, the Line Select provides different information.
– If a signal is SD, HD, 3G:
• the Line number is the selected line, including vertical blanking,
• if the signal is interlaced format, the Fields readout is below the Line number,
• the Pic Line number is next to Line; the Pic Line is the active line number, or numbers, selected.
– If a signal is UHD, 4K:
• the Line number is the selected raster line,
• the SDI Line is the selected line including vertical blanking,
• the link number appears below the SDI Line.
Note: In link, the letters (A-D) refers to the physical links. The numbers (1-4) refers to the virtual links. For example, A3/62 indicates it is physical link 1 and virtual link 3 (in a 2-sample interleave, 12G transport).
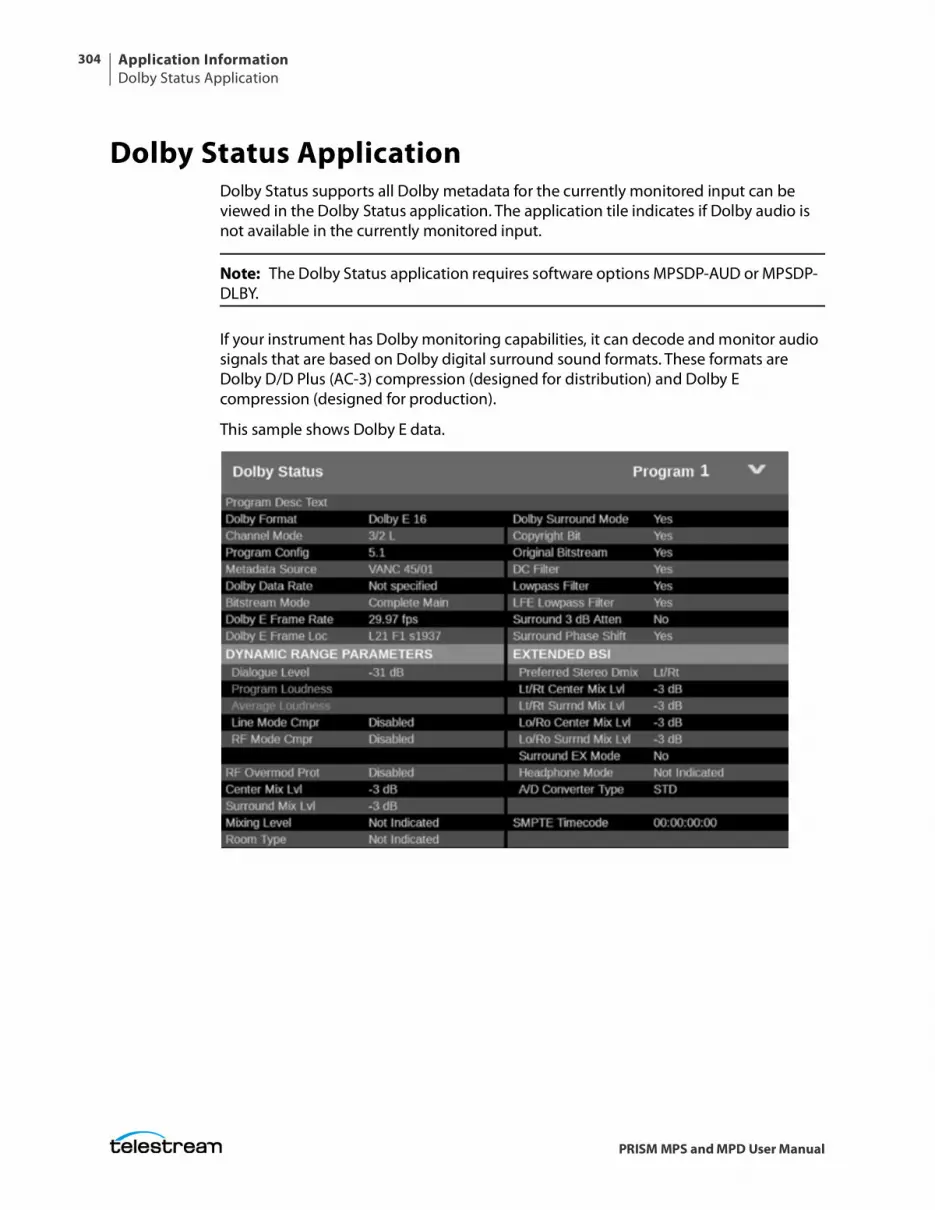
Application InformationDolby Status Application
304
PRISM MPS and MPD User Manual
Dolby Status ApplicationDolby Status supports all Dolby metadata for the currently monitored input can be viewed in the Dolby Status application. The application tile indicates if Dolby audio is not available in the currently monitored input.
Note: The Dolby Status application requires software options MPSDP-AUD or MPSDP-DLBY.
If your instrument has Dolby monitoring capabilities, it can decode and monitor audio signals that are based on Dolby digital surround sound formats. These formats are Dolby D/D Plus (AC-3) compression (designed for distribution) and Dolby E compression (designed for production).
This sample shows Dolby E data.
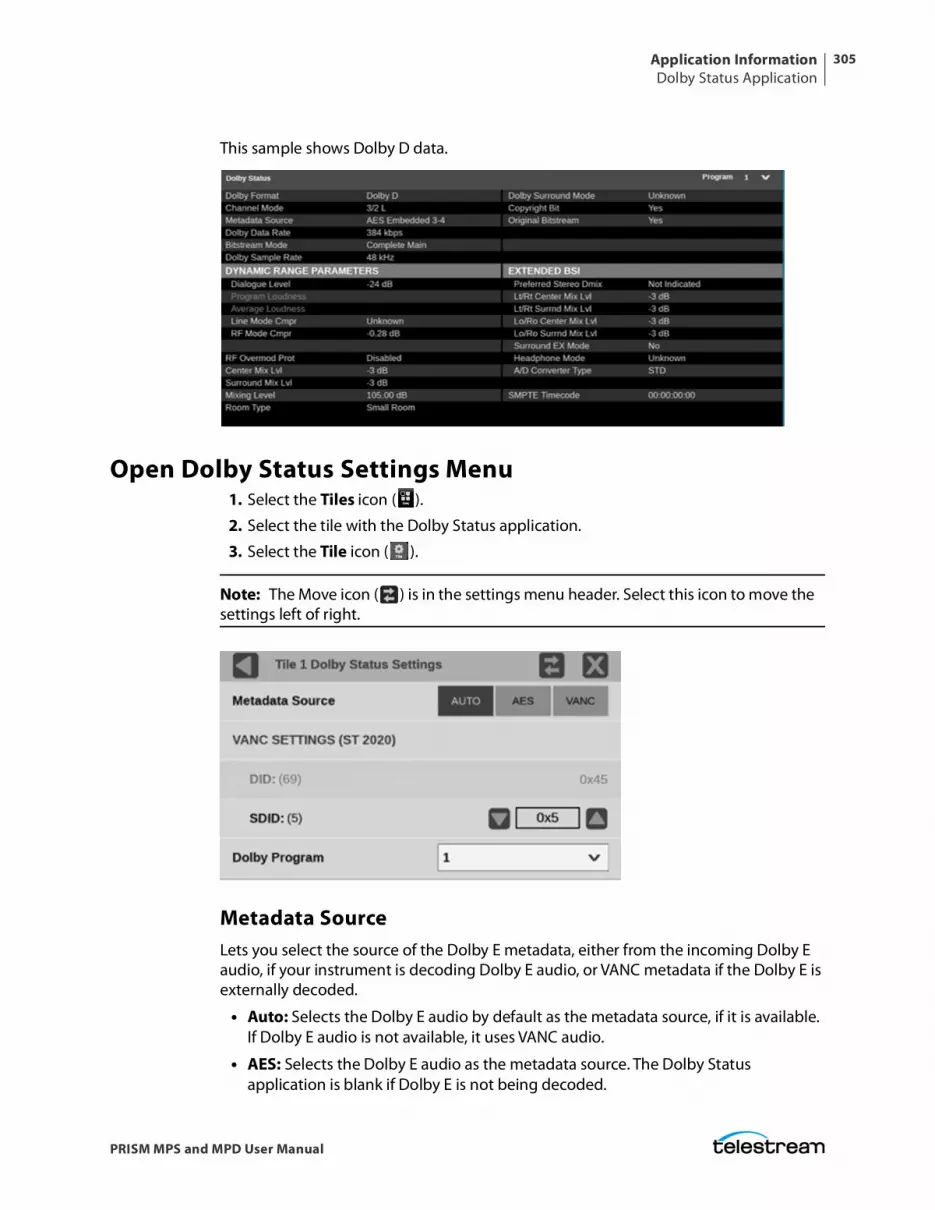
Application InformationDolby Status Application
305
PRISM MPS and MPD User Manual
This sample shows Dolby D data.
Open Dolby Status Settings Menu1. Select the Tiles icon ( ).
2. Select the tile with the Dolby Status application.
3. Select the Tile icon ( ).
Note: The Move icon ( ) is in the settings menu header. Select this icon to move the settings left of right.
Metadata Source Lets you select the source of the Dolby E metadata, either from the incoming Dolby E audio, if your instrument is decoding Dolby E audio, or VANC metadata if the Dolby E is externally decoded.
• Auto: Selects the Dolby E audio by default as the metadata source, if it is available. If Dolby E audio is not available, it uses VANC audio.
• AES: Selects the Dolby E audio as the metadata source. The Dolby Status application is blank if Dolby E is not being decoded.
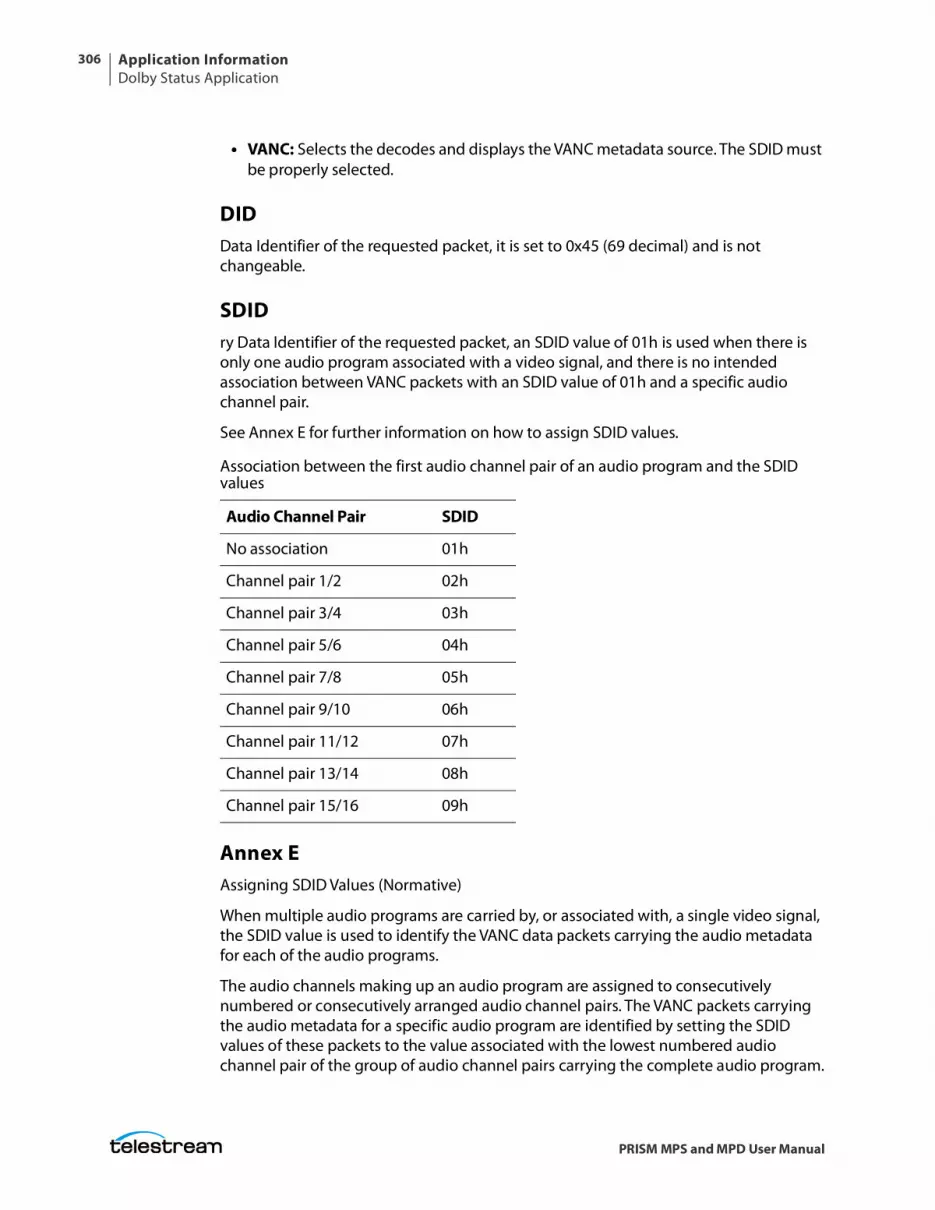
Application InformationDolby Status Application
306
PRISM MPS and MPD User Manual
• VANC: Selects the decodes and displays the VANC metadata source. The SDID must be properly selected.
DIDData Identifier of the requested packet, it is set to 0x45 (69 decimal) and is not changeable.
SDIDry Data Identifier of the requested packet, an SDID value of 01h is used when there is only one audio program associated with a video signal, and there is no intended association between VANC packets with an SDID value of 01h and a specific audio channel pair.
See Annex E for further information on how to assign SDID values.
Annex EAssigning SDID Values (Normative)
When multiple audio programs are carried by, or associated with, a single video signal, the SDID value is used to identify the VANC data packets carrying the audio metadata for each of the audio programs.
The audio channels making up an audio program are assigned to consecutively numbered or consecutively arranged audio channel pairs. The VANC packets carrying the audio metadata for a specific audio program are identified by setting the SDID values of these packets to the value associated with the lowest numbered audio channel pair of the group of audio channel pairs carrying the complete audio program.
Association between the first audio channel pair of an audio program and the SDID values
Audio Channel Pair SDID
No association 01h
Channel pair 1/2 02h
Channel pair 3/4 03h
Channel pair 5/6 04h
Channel pair 7/8 05h
Channel pair 9/10 06h
Channel pair 11/12 07h
Channel pair 13/14 08h
Channel pair 15/16 09h
Application InformationDolby Status Application
307
PRISM MPS and MPD User Manual
For example, if there is a six-channel program carried in the first three audio channel pairs and a stereo program carried by the fourth audio channel pair, then the VANC packets carrying the metadata for the six-channel program would have their SDID value set to 02h because the program starts in audio channel pair 1/2. The VANC packets carrying the metadata for the stereo program would have their SDID value set to 05h because the stereo program starts in audio channel pair 7/8.
Dolby ProgramUse the drop-down menu to select the Dolby program number to monitor.
The Program number in the top right of the Dolby Status app border is the same as the Dolby Program number in the Dolby Status Settings. Select the arrow and select the number of the program to monitor.
Elements of the Dolby Status DisplayThis is a list of some of the elements in the Dolby Status application. For a complete list of the elements that might appear, see the Dolby Metadata Guide available at www.dolby.com.
Program Description TextA 32-character ASCII text field used by the program author to describe the audio program; for example, the name of the program (Movie Channel Promo), the program source (Football Main Feed), or the program language (Danish).
Dolby FormatIndicates the Dolby Format. This indicator is also tied to the Dolby Format Error/Alarm: if the Alarm is asserted, the Dolby Format is displayed in red.
Channel Mode (or Audio Coding Mode)Indicates the active channels within the encoded bit stream, representing it in a ratio, X/Y, where X is the number of front channels (Left, Center, Right) and Y is the number of rear (Surround) channels. If the LFE Channel is present, an L is appended at the end of the channel mode.
Program ConfigurationDetermines how the audio channels are grouped within a Dolby E bitstream. Up to eight channels can be grouped together in individual programs, where each program contains its own metadata.
Metadata SourceIndicates the input from which the Dolby Content is sourced.
Application InformationDolby Status Application
308
PRISM MPS and MPD User Manual
Dolby Data RateFor Dolby E it indicates the data rate that would be used to encode a Dolby Digital bitstream.
Bitstream ModeDescribes the audio service contained within the Dolby Digital bitstream. A complete audio program may consist of a main audio service (a complete mix of all the program audio), an associated audio service comprising a complete mix, or a main service combined with an associated service. For more information about possible values, see the instrument online help; when the Dolby Status display is active in a tile, select the HELP button.
Dolby E Frame RateIndicates the Dolby E frame rate. If Dolby Frame Rate is not the same as the video Frame Rate, the rate value is displayed in red.
Dolby E Frame LocDisplays the location (line number and sample number) of the SMPTE337 preamble.
Dialogue LevelRepresents the long-term, A-weighted average level of dialog within a presentation, Leq(A).
PTP Operational OverviewPTP Introduction
309
PRISM MPS and MPD User Manual
PTP Operational Overview
This section provides an overview of PTP network operation. Not all of the functionality described is currently available in the PRISM monitor.
PTP Introduction
PTP Master SelectionIn a PTP network, all the masters on the network are evaluated by the Best Master Clock Algorithm (BMCA). The BMCA runs on all devices, and chooses a master based on several parameters. Some of the parameters relate to clock quality; conversely the Priority 1 and Priority 2 parameters are set by the user to influence the choice of a master:
Note: The PRISM monitor has no role in setting the priority parameters or in providing information to the BMCA.
• Priority 1: This parameter defines which clocks are allowed to be considered as masters. To be considered as a master, the value should be set to 128 or less. Priority 1 is the first criteria in the BMCA, so if Priority 1 is set to a lower value than other devices on the system, then it is chosen even if the clock quality is poor. Typically, all the masters in a domain should have the same value for the Priority 1 parameter.
• Priority 2: This parameter is used to break the tie between masters that have the same clock quality. Several values may be used to define a hierarchy of devices. Most profiles use 128 as a default, so a value of 127 or lower would indicate a preferred master.
• The final tie-breaker in the BMCA is the clock ID. This is usually the MAC address so it provides a unique value by which the BMCA can choose.
Network TopologyIn a typical IEEE1588 PTP network, many devices may be either masters or slaves. If the current master stops working, all the devices that are capable of being a master broadcast their clock quality and a new master is selected.
For video networks it may make sense to depart from the telecom-style PTP topology and dedicate devices to be only masters or slaves. This is the approach supported by the PRISM monitor, which allows for a more traditional primary and backup master
PTP Operational OverviewFive Basic PTP Timing Messages
310
PRISM MPS and MPD User Manual
structure controlling a range of slave devices. The BMCA is still used to select the active master and the network still takes the place of the ECO in the legacy Black-burst/Tri-level network. The PRISM monitor is a slave-only device.
Five Basic PTP Timing MessagesThis section describes the five basic timing messages in a PTP system. Other messages are present in some instances. For example, grant requests and responses appear in unicast systems, and Type Length Value (TLV) management messages appear in SMPTE ST2059 profile systems.
Announce MessageThe Announce message is sent by the master to advertise its capability. This message contains the clock quality and priority settings needed for the BMCA to evaluate which device is the best master.
Sync MessageThe Sync message is sent by the master and is used to measure the propagation delay from the master to slave. The sync message may contain the timestamp indicating when it was sent, or that time may be in the Follow-up message. The receiver must timestamp the sync message upon receipt. These two time stamps are usually called t1 and t2 and provide the first delay measurement.
Follow-up MessageThe Follow-up message is sent only in cases where the PTP network hardware is not capable of inserting the timestamp or corrections into the Sync message. (See One-step and Two-step Operation.)
Delay Request MessageThe Delay request is sent by the slave. The time it is sent is noted by the slave but is not included in the message. This time is usually called t3. When the delay request is received by the master, the master time stamps the receive time. This timestamp is usually called t4.
Delay Response MessageThe Delay response is sent from the master to the slave. The response contains the t4 time stamp from when the master received the delay request. After the slave receives the delay response, it has the second pair of time stamps needed to calculate the second delay measurement of the slave to master delay.
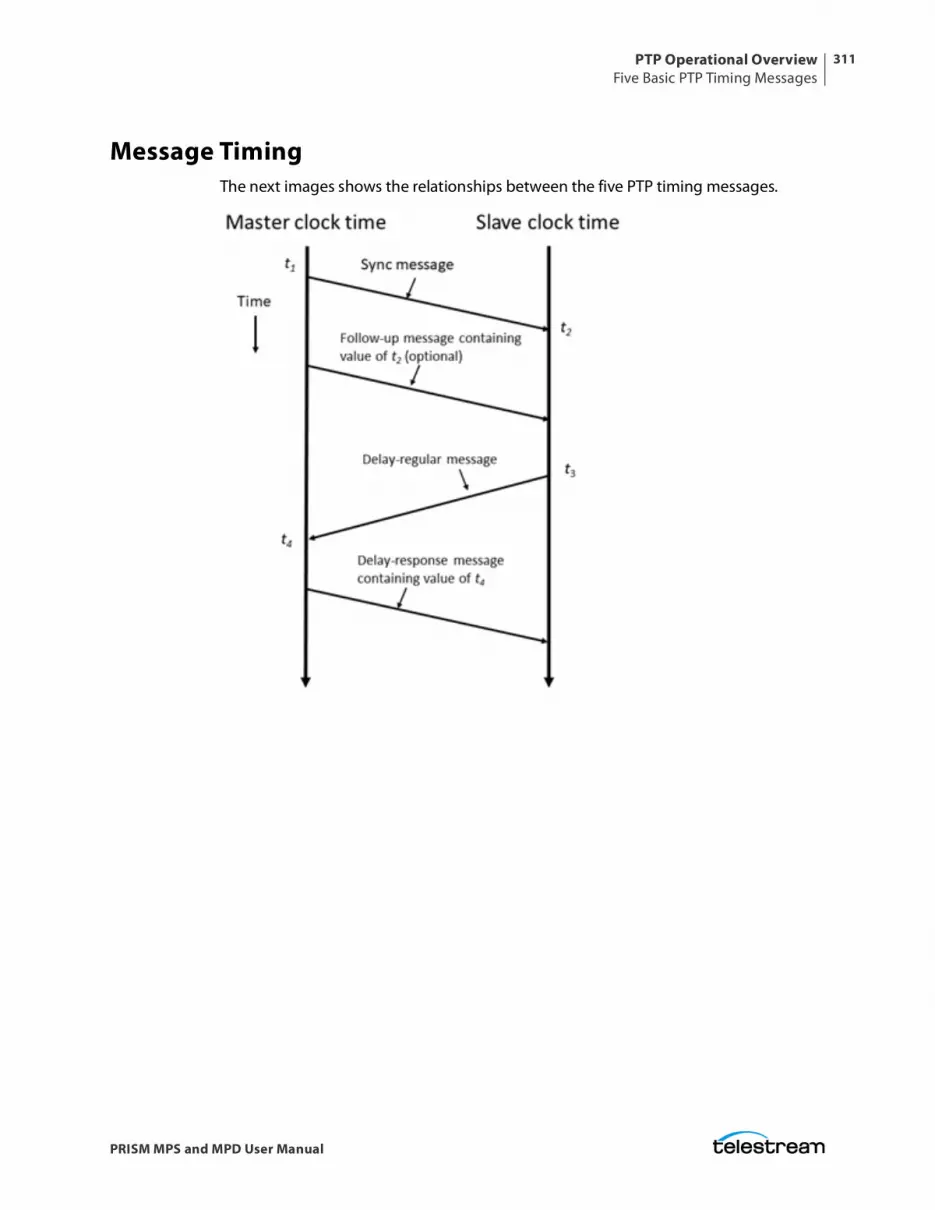
PTP Operational OverviewFive Basic PTP Timing Messages
311
PRISM MPS and MPD User Manual
Message TimingThe next images shows the relationships between the five PTP timing messages.
PTP Operational OverviewProfiles and Domains
312
PRISM MPS and MPD User Manual
Profiles and DomainsMultiple domains and profiles can coexist on the same network.
ProfilesThe IEEE1588 standard defines multiple parameters, such as the rates for Sync and Announce messages, and optional functions such as grandmaster clusters. Specific industries wanting to use PTP are encouraged to define their own “profile,” which allows the PTP standard to be tuned for specific applications. The profile defines the default and range of each parameter, and defines with options are required, allowed, or prohibited.
In the Prism monitor, the user should select the PTP profile (General, ST2059, or AES67). The user can then modify the profile parameters and save as part of an instrument preset. The allowed range of the parameters is restricted to that which is allowed for the selected profile type.
DomainsThe IEEE1588 standard defines “domains,” which allow multiple PTP services to coexist simultaneously on one physical Ethernet connection. For example, on a given network one master and several slaves can be using domain 0 while a second master and other slaves are using domain 1. These two PTP services are independent. One use for this is to have masters on different domains provide PTP on different profiles. For example, domain 0 might be an AES67 profile, domain 1 could be a master using the AVB (802.1AS) profile, and domain 127 could be a master on the SMPTE ST2059 profile.
PTP Operational OverviewOne-step and Two-step Operation
313
PRISM MPS and MPD User Manual
One-step and Two-step OperationSome PTP messages have a time stamp associated with them. This time stamp indicates the time of the local clock when the message was sent or received. In some cases, the hardware is capable of embedding the time stamp in the message as it is sent. This is known as “one-step” mode because the message and its associated time are sent together.
In other cases, the hardware is not capable of inserting the time into the message, so instead it is sent in a second follow-up message. This is called “two-step” mode because there are two messages.
It is interesting to note that in End-to-End mode, only the Sync message is affected by the one-step and two-step setting since it is the only message that needs the transmit time stamp inserted. In a similar fashion, Peer-to-Peer mode has some messages that may require follow-up support.
The IEEE1588 standard specifies that all slaves are required to operate with either one-step or two-step message types. One type of device which often requires two-step operation is a Transparent Clock, since it has to calculate the residence time of a message and insert that time into the message or the follow-up message.
PTP Operational OverviewMulticast, Unicast, and Mixed Communication Modes
314
PRISM MPS and MPD User Manual
Multicast, Unicast, and Mixed Communication Modes
There are three basic message modes for PTP: Multicast, Unicast, and mixed Multicast and Unicast. For full Multicast or Unicast modes, all of the PTP messages are sent in the selected mode type.
For some profiles, such as some telecom profiles and the SMPTE ST2059 profile, a mixture of Multicast and Unicast are allowed. On the SMPTE profile unique mixed mode, the Announce and Sync messages are sent as multicast. However, the Delay Request and Delay Response messages are sent as Unicast.
Some points to understand about communication modes:
• Whatever mode is chosen, the master and slave must match or be compatible.
• Multicast and Mixed mode may need IGMP joins and leaves.
• Full Unicast must have the master address in all slave AMTs.
• Unicast without negotiation does not allow master to regulate load.
• Two masters can be used on different domains to serve slaves on different communication modes.
All of the master and slave devices on a given domain must use compatible communication modes. For most profiles, this means the master and slave communication modes need to match exactly. On the SMPTE profile, the Multicast and Mixed modes are compatible, so a master in any of these modes should work with a slave in any of those modes.
Multicast System MessagesMulticast messages are broadcast and so they can be received without knowing the address of the sender. This allows a slave to hook up to the network, receive the announce messages and discover the identity of the master. Multicast in some networks requires the devices to use IGMP to join and leave the multicast group.
In Multicast PTP systems, the master sets the rate of the announce and sync messages. The master also sends the maximum allowed delay request rate in the delay response message. Ideally, the slave uses that value to set the delay request rate although some slaves set this rate independently. The delay request rate is typically the same as the sync rate but may be higher or lower.
Unicast System MessagesUnicast messages require the address of the master be entered into the Acceptable Master Table (AMT) in each slave. If there are multiple masters, the IP address for each master must be entered in the AMTs of all the slaves.
In Unicast PTP systems, the slave must have the address of the master in its acceptable master table because the slave initiates the communication with the master. The slave
PTP Operational OverviewMulticast, Unicast, and Mixed Communication Modes
315
PRISM MPS and MPD User Manual
sends several grant requests to the master requesting specific rates for each message type. If the master accepts the grant requests, it sends grant acknowledges. If the master denies the grant, the slave may send a new grant request at a lower rate. This process may continue for several iterations until the master and slave agree on a rate. The master and slave then start exchanging the PTP messages. If the master cannot support any of the rates requested by the slave, then the slave cannot lock to the master.
Mixed Mode System MessagesIn Mixed Mode systems, some messages are Multicast and some are Unicast. For the SMPTE ST2059 profile, the Announce and Sync messages are sent as Multicast. This allows devices to discover the active master. The Delay Request messages are configured as Unicast, in some case with negotiation, and in other cases without negotiation.
SMPTE Profile System MessagesFor SMPTE profile systems, a given domain must use one type of message for all Announce, Sync, and Follow-up messages. Therefore, all masters and slaves on that domain must be configured for either Multicast or they all must be configured for Unicast.
For SMPTE mixed mode, the Announce, Sync, and Follow up messages are configured as Multicast, whereas the delay requests can be Multicast, Unicast, or Unicast without negotiation. To use this combination with an SPG8000A master clock generator, set the master and slave to any of the modes: Multicast, Mixed, or Mixed without negotiation. The masters support all of the slave modes simultaneously.
PTP Operational OverviewBMCA Operation
316
PRISM MPS and MPD User Manual
BMCA OperationThe Best Master Clock Algorithm (BMCA) is used to choose the active master on the domain. This is partially explained in the introduction to this document. The BMCA operation varies somewhat as function of communication mode.
Multicast ModeIn Multicast mode, the active master sends announce messages which all other masters and slaves can receive. So all devices can evaluate the BMCA and decide on the best master. If any device detects that its BMCA rating is better than the current master, it sends an announcement and takes over as the active master.
Unicast ModeIn Unicast mode, slaves only get Announce messages if they establish a grant from the master. Therefore, each slave must set up a grant with every device in its AMT. Since the masters do not set up grants from other masters, they do not have the information to evaluate the BMCA and know if they are the active master. It is up to the slaves to evaluate the BMCA based on the announce message they get from each master in their AMT. Each slave then decides which master is the best and then set up grants for the other message types. If slaves on a given network have a different list of masters in their AMT, then they may choose a different master.
Mixed ModeIn a SMPTE ST2059 mixed environment, the announce message is Multicast. Therefore, the BMCA can follow the Multicast conventions.

PTP Operational OverviewCompensating for Causes of Asymmetric Delay
317
PRISM MPS and MPD User Manual
Compensating for Causes of Asymmetric DelaySeveral factors can cause the PTP message delay to be different for the messages sent from the master to slave as opposed to the messages the other direction from the slave to master. Unless corrected, this propagation delay asymmetry causes an offset in the clock phase equal to ½ the difference in the two path delays. There are several main causes of asymmetric delay:
• Rate mismatch in the ports on a switch
• Traffic mismatch on the two paths
• Message type mismatch
• Cable delay variation
This section contains suggestions on how to design the system to minimize the delay asymmetry. Alternatively, some slaves provide a way to manually enter a correction value to cancel the delay error.
Rate MismatchRate mismatch in a switch causes a delay asymmetry because the switch performs a “store and forward” action on messages. This means the entire message must be stored in the buffer before it starts to be “forwarded” or sent out. For example, for a 100 Mb input and 1 Gb output, the switch must wait for the entire message to clock in at the slow rate before it can start outputting the message at the high rate. Conversely for a 1 Gb/s input and 100 Mb/s output, the entire packet is quickly read in at the faster rate, so then the output can start sooner but at a lower rate.
While the total time is the same for both directions, the delay on the fast-in, slow-out direction is shorter on the packets which contain the PTP time stamps. This effect is significant on a 100 Mb/1 Gb rate mismatch, but much less significant on a 1 G/10 G switch since the message time at 1 Gb/s is quite short. If the switch supports Transparent Clock (TC) mode, then this rate mismatch delay effect is corrected by the TC delay correction.
Traffic MismatchAnother cause of asymmetric delay is traffic mismatch on the two paths. If there is a high percentage of traffic utilization on the master to slave path, then most of the PTP messages may be delayed significantly. If the traffic on the other direction is significantly different, then the messages on the path may not suffer the same delay.
This effect can be quite large depending on the traffic, the quality of the switch, and the number of switches in the network. To reduce this effect, a user should avoid large loading on the PTP network, use high-quality switches that avoid this delay variance, or use PTP Transparent mode switches which insert residence time information to allow the slave to correct for this delay.
PTP Operational OverviewCompensating for Causes of Asymmetric Delay
318
PRISM MPS and MPD User Manual
Setting the Diff Serve QoS on the switch and configuring the PTP messages with an appropriate DSCP can also mitigate the effects of traffic delay.
Message Type MismatchAnother cause of delay asymmetry is message type mismatch. For example, if the sync message is Multicast and the delay request is Unicast, then some switches may process the messages differently and cause a differential delay. Since the SMPTE profile allows a mixed mode operation, switches should be evaluated to ensure they do not have this effect. If transparent mode switches are used, then this effect should be corrected by the slave.
Cable Delay VariationThe actual propagation delay through Cat 5 cable can be significantly different in one direction versus the other direction. This can be due to the twist rate on the pairs, routing inside the sheath, material differences, etc. The PTP system is incapable of removing this effect, so the best way to prevent this is to use high-quality cable with a minimum variation in the physical propagation delay.
NMOS SpecificationsCompensating for Causes of Asymmetric Delay
319
PRISM MPS and MPD User Manual
NMOS Specifications
This section details the changes in the NMOS Discovery version 1.3.
• Added additional network data for nodes as required by IS-06.
• Deprecated mDNS announcements for nodes in registered mode.
• Replaced DNS-SD service type for registration API.
• Permit deprecated node API connection management is not implemented.
• Added explicit requirements for 501 responses when features are not implemented.
• Added support for future device and transport types.
• Permitted a sender's 'manifest_href' to be null when the transport type does not require a transport file.
• Added 409 response code for registries with conflicting resources.
• Added support for signaling authorization requirements.
• Indicated the potential for source/flow attributes and caps will be defined externally in the future.
• Revised the discovery process to ignore mDNS records when unicast records are available.


