Atmospheric dispersion modeling for an accidental release from the Pakistan Research Reactor-1 (PARR-1) S. Shoaib Raza * , M. Iqbal Nuclear Engineering Division, Pakistan Institute of Nuclear Science and Technology, P.O. Nilore, Islamabad, Pakistan Received 23 February 2005; accepted 22 March 2005 Available online 23 May 2005 Abstract Atmospheric dispersion modeling and radiation dose calculations have been performed for a postulated accidental airborne radionuclide release from the Pakistan Research Reactor-1 (PARR-1) appropriate to a power upgrade to 10 MW. Estimates of releases for various radio- nuclide groups are based upon US-NRC regulatory guide 1.183. Committed Effective Doses (CEDs) to the public at various downwind distances were calculated using a health physics computer code ‘‘HotSpot’’ developed at the Lawrence Livermore National Laboratory, Uni- versity of California, USA. The doses were calculated for various atmospheric stability classes, viz., Pasquill categories A–F with site-specific averaged meteorological conditions. The mete- orological data on atmospheric stability conditions, mean wind speed and the frequency dis- tribution of wind direction based on data collected near the reactor site have also been analyzed and are presented here. The results indicate that a person located within a downwind distance of about 500 m from the reactor would receive more than the permissible CED under the analyzed severe accident scenario. Analysis of one typical year of wind data indicates that the predominant wind direc- tion is East–North East (ENE), which occurs at the site for more than 15% of the time. Ó 2005 Elsevier Ltd. All rights reserved. 0306-4549/$ - see front matter Ó 2005 Elsevier Ltd. All rights reserved. doi:10.1016/j.anucene.2005.03.008 * Corresponding author. Tel.: +92 51 9290231/3354; fax: +92 51 9290275. E-mail addresses: [email protected]; [email protected] (S.S. Raza). Annals of Nuclear Energy 32 (2005) 1157–1166 www.elsevier.com/locate/anucene annals of NUCLEAR ENERGY
Transcript
annals of
Annals of Nuclear Energy 32 (2005) 1157–1166
www.elsevier.com/locate/anucene
NUCLEAR ENERGY
Atmospheric dispersion modeling foran accidental release from the Pakistan
Research Reactor-1 (PARR-1)
S. Shoaib Raza *, M. Iqbal
Nuclear Engineering Division, Pakistan Institute of Nuclear Science and Technology,
P.O. Nilore, Islamabad, Pakistan
Received 23 February 2005; accepted 22 March 2005
Available online 23 May 2005
Abstract
Atmospheric dispersion modeling and radiation dose calculations have been performed for
a postulated accidental airborne radionuclide release from the Pakistan Research Reactor-1
(PARR-1) appropriate to a power upgrade to 10 MW. Estimates of releases for various radio-
nuclide groups are based upon US-NRC regulatory guide 1.183. Committed Effective Doses
(CEDs) to the public at various downwind distances were calculated using a health physics
computer code ‘‘HotSpot’’ developed at the Lawrence Livermore National Laboratory, Uni-
versity of California, USA. The doses were calculated for various atmospheric stability classes,
viz., Pasquill categories A–F with site-specific averaged meteorological conditions. The mete-
orological data on atmospheric stability conditions, mean wind speed and the frequency dis-
tribution of wind direction based on data collected near the reactor site have also been
analyzed and are presented here.
The results indicate that a person located within a downwind distance of about 500 m from
the reactor would receive more than the permissible CED under the analyzed severe accident
scenario. Analysis of one typical year of wind data indicates that the predominant wind direc-
tion is East–North East (ENE), which occurs at the site for more than 15% of the time.
� 2005 Elsevier Ltd. All rights reserved.
0306-4549/$ - see front matter � 2005 Elsevier Ltd. All rights reserved.
1158 S.S. Raza, M. Iqbal / Annals of Nuclear Energy 32 (2005) 1157–1166
1. Introduction
Atmospheric dispersion and radiation dose calculations for accidental releases of
radioactive gases and volatiles are an important contribution to licensing require-
ments for the selection of site for a nuclear reactor. The reactor-operating licenseis obtained from local regulatory authorities in accordance with internationally
adopted criteria (IAEA, 1979).
Under normal operating conditions, nuclear reactors, especially research reactors,
do not release any significant quantity of radioactive material to the atmosphere.
However, under accident conditions with severe core damage, a significant fraction
of the radionuclide inventory in the core may be released to the atmosphere. An ear-
lier document, WASH-1400 (NRC, 1975) used release fractions of 0.9, 0.7, 0.4, 0.4
and 0.05 for noble gases, halogens, alkali metals, tellurium and the Ba–Sr group,respectively. An IAEA document on research reactors used 100%, 50% and 1% re-
lease fractions for noble gases, halogens and particulates, respectively (IAEA,
1992). These release fractions were used in the previous radiological consequences
analysis for PARR-1 (FSAR, 2001). The exclusion area boundary for PARR-1
was calculated to be 750 m, based upon a 3 Sv criterion of 2-h thyroid-dose from
iodine isotopes.
In this work, we have performed the updated radiation dose calculations for
accessing any increased radiological consequences of the postulated severe accidentat PARR-1 after its power upgrade to 10 MW. An alternate source term (NRC,
2000) with release fractions based upon NUREG-1150 (NRC, 1989) was used.
The use of this new source term criterion is required by 10 CFR 50.67, on a volun-
tarily basis. This criterion assumes release fractions of 1, 0.4, 0.3, 0.05 and 0.02 for
noble gases, halogens, alkali metals, the tellurium group and the Ba–Sr group,
respectively (NRC, 2000), to determine the exclusion area from a limit on committed
effective dose (CED) of 0.25 Sv. We have used the dose conversion factors based
upon most recent recommendations of ICRP (ICRP 72, 1996; IAEA SS-115,1996). A health physics computer code ‘‘Hotspot’’, which employs a Gaussian plume
model (GPM) was used in this work.
In the following section, site-specific meteorological conditions (that were used in
the GPM) are presented. The source term released to the atmosphere is presented in
Section 3. The postulated severe accident conditions and the modeling assumptions
are presented in Section 4. Calculations of CED results are presented and discussed
in Section 5. Section 6 presents our conclusions.
2. Meteorology at the PARR-1 site
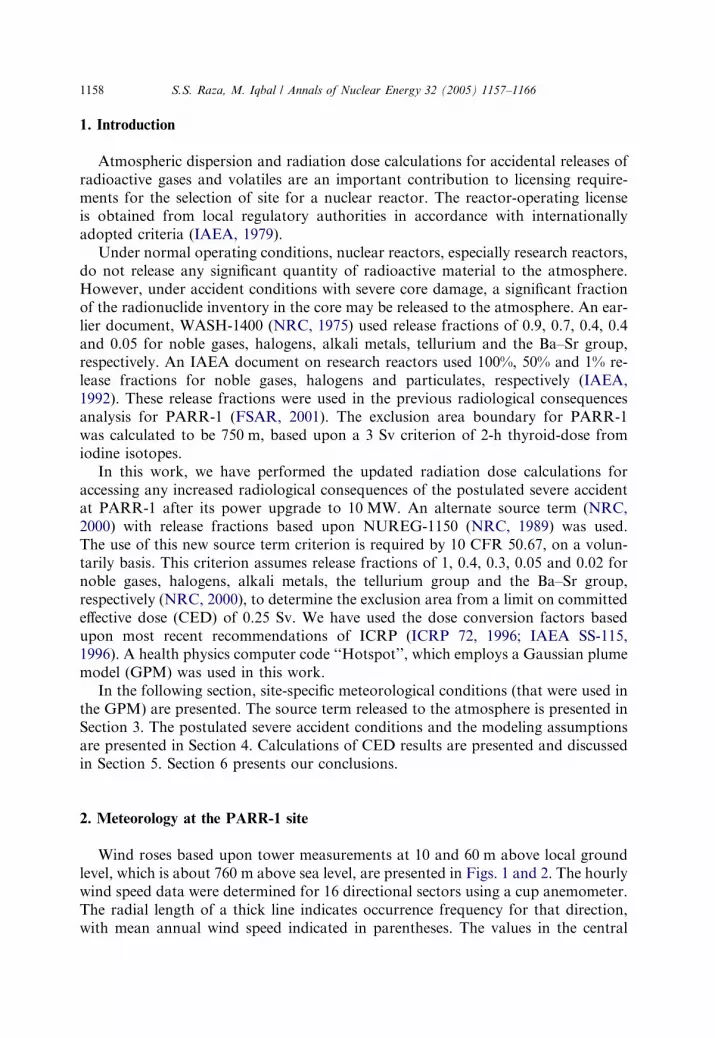
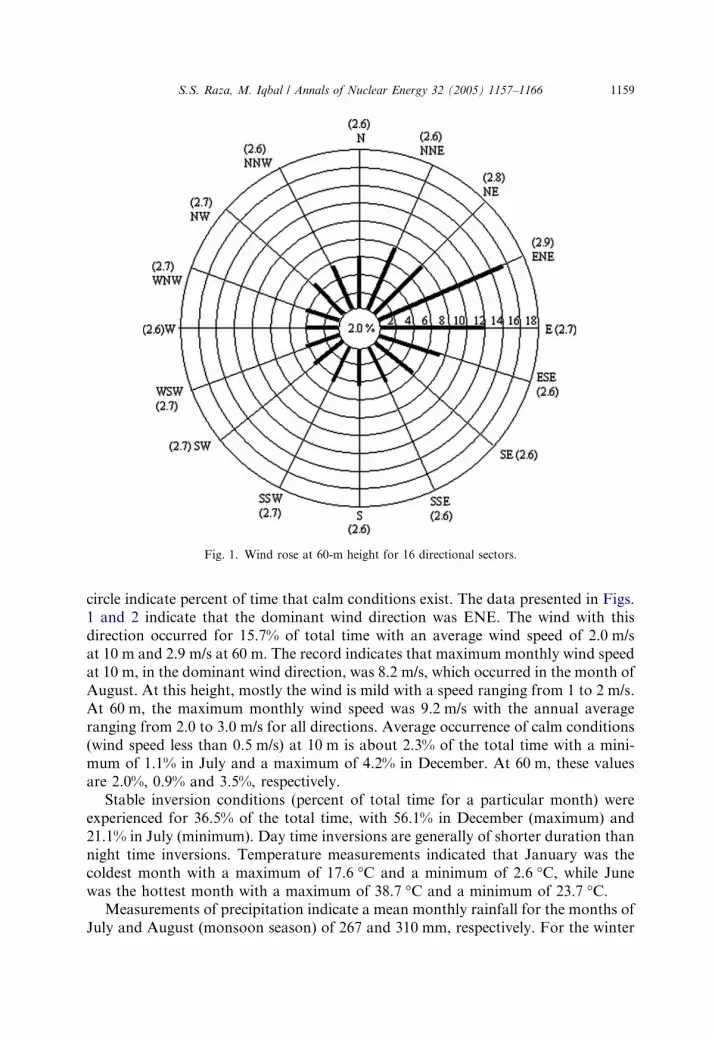
Wind roses based upon tower measurements at 10 and 60 m above local ground
level, which is about 760 m above sea level, are presented in Figs. 1 and 2. The hourly
wind speed data were determined for 16 directional sectors using a cup anemometer.
The radial length of a thick line indicates occurrence frequency for that direction,
with mean annual wind speed indicated in parentheses. The values in the central
Fig. 1. Wind rose at 60-m height for 16 directional sectors.
S.S. Raza, M. Iqbal / Annals of Nuclear Energy 32 (2005) 1157–1166 1159
circle indicate percent of time that calm conditions exist. The data presented in Figs.1 and 2 indicate that the dominant wind direction was ENE. The wind with this
direction occurred for 15.7% of total time with an average wind speed of 2.0 m/s
at 10 m and 2.9 m/s at 60 m. The record indicates that maximum monthly wind speed
at 10 m, in the dominant wind direction, was 8.2 m/s, which occurred in the month of
August. At this height, mostly the wind is mild with a speed ranging from 1 to 2 m/s.
At 60 m, the maximum monthly wind speed was 9.2 m/s with the annual average
ranging from 2.0 to 3.0 m/s for all directions. Average occurrence of calm conditions
(wind speed less than 0.5 m/s) at 10 m is about 2.3% of the total time with a mini-mum of 1.1% in July and a maximum of 4.2% in December. At 60 m, these values
are 2.0%, 0.9% and 3.5%, respectively.
Stable inversion conditions (percent of total time for a particular month) were
experienced for 36.5% of the total time, with 56.1% in December (maximum) and
21.1% in July (minimum). Day time inversions are generally of shorter duration than
night time inversions. Temperature measurements indicated that January was the
coldest month with a maximum of 17.6 �C and a minimum of 2.6 �C, while June
was the hottest month with a maximum of 38.7 �C and a minimum of 23.7 �C.Measurements of precipitation indicate a mean monthly rainfall for the months of
July and August (monsoon season) of 267 and 310 mm, respectively. For the winter
Fig. 2. Wind rose at 10-m height for 16 directional sectors.
1160 S.S. Raza, M. Iqbal / Annals of Nuclear Energy 32 (2005) 1157–1166
rainy season (December–March) the rainfall varies from 37 to 90 mm/month. During
the rest of the months of the year mostly the weather is dry.
3. Source term and accident scenarios
The source term for the fission product inventory in the reactor core for an aver-
age burn-up of about 21% (initial 235U content) was calculated using the computercode ORIGIN. The release fractions applied to the calculated core activity were ta-
ken from US-NRC regulatory guide 1.183 (NRC, 2000) having values of 1, 0.4, 0.3,
0.05 and 0.02 for noble gases, halogens, alkali metals, the tellurium group and the
Ba–Sr group, respectively. It may be mentioned here that the earlier calculations
used release fractions of 1.0, 0.5 and 0.1 for noble gases, halogens and particulates,
respectively (FSAR, 2001).
For core inventory calculations, it was assumed that the reactor had been oper-
ated on continuous basis at its full power of 10 MW to achieve an average burn-up of 21%, at the time of accident. This assumption led to maximum possible fission
products inventory in the core, which was 3.17 · 1017 Bq. Table 1 shows the activity
Table 1
Radionuclide inventory in the core, release fraction and isotopic activity released to the atmosphere
Nuclide Group Core inventory Release fraction Activity released
Kr-83 m Noble gas 5.38E + 14 1 5.38E + 14
Kr-85 m Noble gas 3.72E + 15 1 3.72E + 15
Kr-87 Noble gas 7.36E + 15 1 7.36E + 15
Kr-88 Noble gas 1.02E + 16 1 1.02E + 16
Kr-89 Noble gas 1.39E + 16 1 1.39E + 16
Xe-131 m Noble gas 2.92E + 15 1 2.92E + 15
Xe-133 Noble gas 1.00E + 16 1 1.00E + 16
Xe-135 m Noble gas 5.76E + 15 1 5.76E + 15
Xe-135 Noble gas 1.88E + 16 1 1.88E + 16
Xe-137 Noble gas 1.76E + 16 1 1.76E + 16
Xe-138 Noble gas 1.79E + 16 1 1.79E + 16
I-131 Halogen 3.55E + 15 0.4 1.78E + 15
I-132 Halogen 1.24E + 16 0.4 4.96E + 15
I-133 Halogen 1.93E + 16 0.4 7.72E + 15
I-134 Halogen 2.24E + 16 0.4 8.96E + 15
I-135 Halogen 1.81E + 16 0.4 7.24E + 15
Sr-89 Br–Sr group 3.83E + 16 0.02 7.66E + 14
Sr-90 Br–Sr group 1.77E + 14 0.02 3.54E + 12
Y-91 Lanthanide 4.65E + 15 0.0002 9.30E + 11
Zr-95 Lanthanide 5.08E + 15 0.0002 1.02E + 12
Zr-97 Lanthanide 1.69E + 16 0.0002 3.38E + 12
Nb-95 Lanthanide 5.41E + 15 0.0002 1.08E + 12
Ba-140 Br–Sr group 6.51E + 15 0.02 1.30E + 14
Ce-141 Cerium group 4.86E + 15 0.0005 2.43E + 12
Ce-143 Cerium group 1.58E + 16 0.0005 7.90E + 12
Ce-144 Cerium group 4.47E + 15 0.0005 8.94E + 11
Pr-143 Lanthanide 6.05E + 15 0.0002 1.21E + 12
Nd-147 Lanthanide 2.47E + 15 0.0002 6.18E + 12
Ru-103 Noble metal 2.45E + 15 0.0025 6.13E + 12
Rh-105 Noble metal 2.34E + 15 0.0025 5.85E + 12
Ru-106 Noble metal 2.77E + 14 0.0025 6.93E + 11
Te-127 m Tellurium group 1.88E + 14 0.05 9.40E + 12
Te-129 m Tellurium group 8.35E + 14 0.05 4.18E + 13
Te-131 m Tellurium group 7.89E + 15 0.05 3.95E + 14
Te-132 Tellurium group 8.22E + 15 0.05 4.11E + 14
Cs-137 Alkali metal 1.63E + 14 0.3 4.89E + 13
Total 3.17E + 17 4.45E � 01 1.41E + 17
S.S. Raza, M. Iqbal / Annals of Nuclear Energy 32 (2005) 1157–1166 1161
inventories of important radionuclides in the reactor core at the time of accident,
along with their release fractions and the activity released to the atmosphere.
Two release scenarios were considered. In the first scenario, all releases were as-
sumed to occur at a stack height of 61 m. The radionuclides released from the core
were assumed to be mixed within the containment free volume and escaped from the
building through the ventilation system at an air exhaust rate of 25,000 m3/h. A pre-
vious analysis indicated that, at this exhaust rate, a significant reduction in radionu-
clide release rate occurred with time due to high early containment cleaning byventing (Raza et al., 2004). In the second scenario, the containment exhaust system
1162 S.S. Raza, M. Iqbal / Annals of Nuclear Energy 32 (2005) 1157–1166
was closed, the building became pressurized and the radionuclides were released at
ground level through cracks and penetrations in the structure.
The radionuclide activity released to the atmosphere was immediately picked up
by the wind and transported downwind according to the site meteorology. It was as-
sumed that the wind was blowing with a mean speed of 2.9 m/s at 61 m and 2.0 m/snear ground surface, in the predominant direction (see Section 2). Slightly unstable
(Pasquill�s category C) atmospheric conditions, as observed frequently at the site,
were assumed for dispersion calculations. However, other stability classes, Pasquill�sA–F were also considered for comparison purposes.
4. Radiation dose calculations
The computer code ‘‘Hotspot’’ was used to calculate 50 years committed effective
dose (CED). The radiation dose has been calculated taking into account the contri-
bution from 36 radionuclides, which were considered important for plume dose cal-
culations (FSAR, 2001). Atmospheric dispersion and airborne radionuclide
concentrations were calculated in the code using the Gaussian plume model
(GPM). Details on the GPM are given elsewhere (IAEA, 1982; Turner, 1994; Raza
and Avila, 2002). Time-integrated dose, D, to a receptor at ground level is calculated
by multiplying the time integrated radionuclide concentration, v, with appropriatedose conversion factor (DCF), and breathing rate (BR). A summation is provided
over all the radionuclides:
Dðx; y; zÞ ¼XN
i¼1
viðx; y; xÞ �DCFi � BR. ð1Þ
Complete radiological data on the dose conversion factors and other related param-
eters are given elsewhere (ICRP 72, 1996; IAEA, 1996; ICRP 60, 1991). The breath-
ing rate is taken to be 3.33 · 10�4 m3/s for an average human being under conditionsof light exercise (ICRP 66, 1994).
5. Results and discussion
Radiation dose calculations were performed using the site-specific meteorological
conditions with a wind speed of 2 m/s at ground level and 2.9 m/s at the stack/release
height of 61 m (buoyancy and exit momentum effects were neglected). Under the se-vere accident conditions assumed, about 45% of the total core activity of the volatile
radionuclides was released to the atmosphere (Table 1).
Scenario 1. In the first scenario, the released activity was assumed to be mixed in
the containment free volume (15,000 m3 ) and was released to the atmosphere
through the normal ventilation/exhaust system at a stack height of 61 m. Fig. 3
shows the calculated results for the CED as a function of downwind distance for
all atmospheric stability classes (Pasquill A–F). These doses would be received by
Fig. 3. Committed effective dose (CED) as a function of downwind distance for Pasquill stability classes
A–F with a release height of 61 m.
S.S. Raza, M. Iqbal / Annals of Nuclear Energy 32 (2005) 1157–1166 1163
a person at ground level who remained within the plume for the entire duration of
cloud passage. As the release occurred at 61 m stack height, the doses first increase
with distance, reach a maximum value and then decrease. The location of the max-
imum dose gives the plume-touch down distance, which was about 0.25 km for sta-
bility class C with a maximum CED of 0.25 Sv. It can be observed that between
0.15–0.50 km from the release point the assessed CED values were greater than
0.1 Sv. It can also be observed that the plume touchdown distance (point of maxi-
mum dose) increases with increasing stability, however the maximum dose valuereduces with increasing stability.
Scenario 2. In the second scenario, the activity was released at ground level. Fig. 4
shows the calculated results for CED as a function of downwind distance for all
atmospheric stability classes (Pasquill A–F). As the release occurred at ground level,
Fig. 4. Committed effective dose (CED) as a function of downwind distance for Pasquill stability classes
A–F for ground level release.
Table 2
Committed effective dose (CED) and thyroid (organ) dose as a function of downwind distance for a
ground level release in stability category C conditions
Distance (km) CED (Sv) Thyroid dose (Sv) Arrival time (h:min)
0.100 6.5E + 00 2.3E + 02 00:01
0.200 1.6E + 00 5.5E + 01 00:02
0.300 7.0E � 01 2.3E + 01 00:03
0.400 3.9E � 01 1.3E + 01 00:04
0.500 2.5E � 01 7.9E + 00 00:05
0.600 1.7E � 01 5.3E + 00 00:06
0.700 1.2E � 01 3.7E + 00 00:08
0.800 9.3E � 02 2.8E + 00 00:09
0.900 7.2E � 02 2.1E + 00 00:10
1.000 5.8E � 02 1.7E + 00 00:11
1.200 3.9E � 02 1.1E + 00 00:13
1.450 2.6E � 02 6.7E � 01 00:16
1.500 2.5E � 02 6.2E � 01 00:17
2.000 1.3E � 02 2.9E � 01 00:23
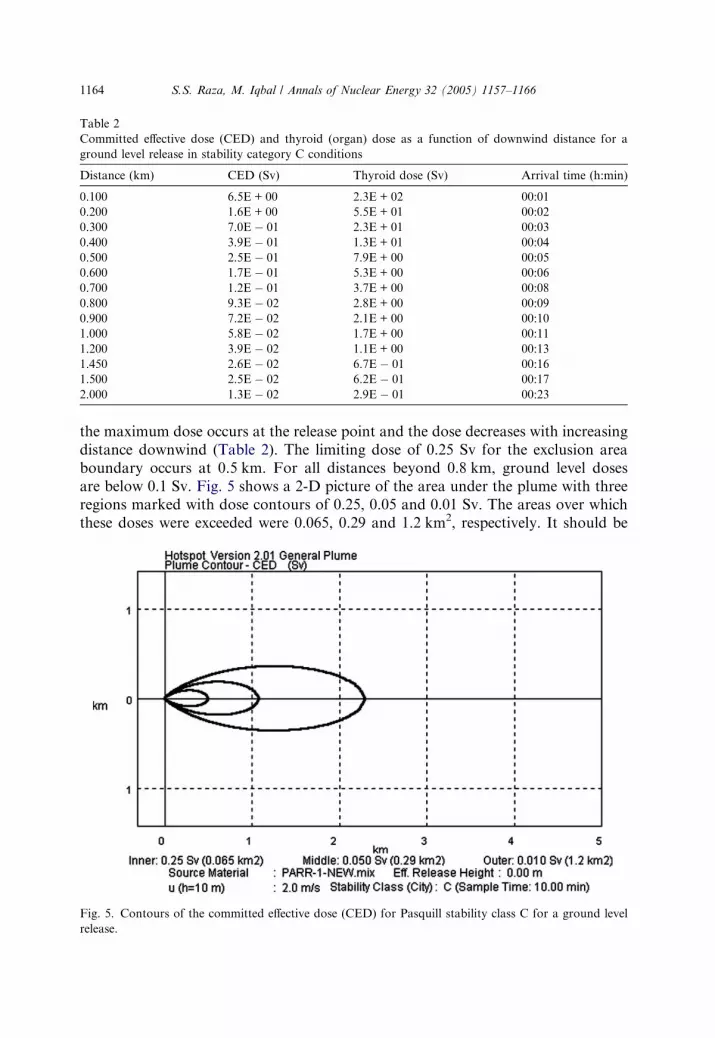
1164 S.S. Raza, M. Iqbal / Annals of Nuclear Energy 32 (2005) 1157–1166
the maximum dose occurs at the release point and the dose decreases with increasing
distance downwind (Table 2). The limiting dose of 0.25 Sv for the exclusion area
boundary occurs at 0.5 km. For all distances beyond 0.8 km, ground level doses
are below 0.1 Sv. Fig. 5 shows a 2-D picture of the area under the plume with three
regions marked with dose contours of 0.25, 0.05 and 0.01 Sv. The areas over which
these doses were exceeded were 0.065, 0.29 and 1.2 km2, respectively. It should be
Fig. 5. Contours of the committed effective dose (CED) for Pasquill stability class C for a ground level
release.
S.S. Raza, M. Iqbal / Annals of Nuclear Energy 32 (2005) 1157–1166 1165
noted that the staff residential colony does not fall within this area, whatever the
wind direction. Radiation protection measures like sheltering and use of prophylac-
tic iodine tablets may be required in the area immediately surrounding the exclusion
zone, as determined by actual dose measurements during a severe accident situation.
6. Conclusions
It was concluded from this study that with PARR-1 power upgrade to 10 MW,
and with the use of the alternate source term criterion, there is no increase in the po-
tential radiological impact on the public. There was no increase in the exclusion area
boundary. In fact the area within 1–2 km around PARR-1 is already under admin-
istrative control of the licensee with total control on entrance and exit. There are nomembers of the public residing within this area, except a small residential colony for
essential/emergency staff at the site located at a distance of about 1 km towards the
north-east. The personnel living in this area (who are radiation workers and their
families) can be evacuated (if necessary) using institute-owned transport (buses
and wagons), although there would be no need to evacuate them for the severe acci-
dent scenario considered in this work. No modifications in the existing site emer-
gency plans are required. According to the new CED criterion, the exclusion area
boundary comes out to be 500 m, which is within the already adopted distance of750 m based on thyroid dose criterion.
Acknowledgements
The authors thank Mr. Showket Pervez, Head NED, PINSTECH for his interest
in this work. The authors are also thankful to the reviewers specially Dr. Michael
Charles Thorne, Director, Mike Thorne and Associates Limited, for the technicalcomments and suggestions to improve the manuscript.
References
FSAR, 2001. Final Safety Analysis Report, Pakistan Research Reactor-1.
International Atomic Energy Agency, 1979. Information to be Submitted in Support of Licensing
Application for Nuclear Power Plants, A Safety Guide, Technical Report Series No. 50-SG-G2,
Vienna.
International Atomic Energy Agency, 1982. Generic Models and Parameters for Assessing the
Environmental Transfer of Radionuclides from Routine Releases, Procedures and Data, IAEA-SS-
57, Vienna.
International Atomic Energy Agency, 1992. Research Reactor Core Conversion Guide Book, IAEA-
TECDOC-643, Vienna.
International Atomic Energy Agency, 1996. International Basic Safety Standards for Protection against
Ionizing Radiation and for the Safety of Radiation Sources, IAEA-SS-115.
International Commission on Radiological Protection, 1991. 1990 Recommendations of the
International Commission on Radiological Protection, ICRP 60, Annals of ICRP, vol. 21, pp.
1–3.
1166 S.S. Raza, M. Iqbal / Annals of Nuclear Energy 32 (2005) 1157–1166
International Commission on Radiological Protection, 1994. Human respiratory Tract Model for
Radiological Protection, ICRP 66, Annals of ICRP, vol. 24, pp. 1–3.
International Commission on Radiological Protection, 1996. Age Dependent Doses to the Members of the
Public from Intake of Radionuclides, ICRP 72, Annals of ICRP, vol. 26, p. 1.
Nuclear Regulatory Commission, 1975. Reactor Safety Study: An Assessment of Accident Risk in US
Commercial Nuclear Power Plants, WASH-1400, NUREG-75/014.
Nuclear Regulatory Commission, 1989. Severe Accident Risks: An Assessment for Five US Nuclear
Power Plants, Summary Report and Appendices, Second Draft for Peer Review, NUREG-1150, vols. 1
and 2.
Nuclear Regulatory Commission, 2000. Alternative Radiological Source Terms for Evaluating Design
Basis Accidents at Nuclear Power Reactors, Regulatory Guide 1.183.
Raza, S., Avila, R., 2002. A comparison of direct gamma dose rates from a stationary Gaussian plume
using different models. Nucl. Technol. 138, 211–216.
Raza, S., Iqbal, M., Salahuddin, A., Avila, R., Pervez, S., 2004. Time integrated thyroid dose for
accidental releases from Pakistan Research Reactor-1. J. Radiol. Prot. 24, 307–314.
Turner, D.B., 1994. Workbook on Atmospheric Dispersion Estimates: An Introduction to Dispersion