Ž . Comparative Biochemistry and Physiology Part C 128 2001 299310 Tissue metallothionein, apoptosis and cell proliferation ž / responses in Atlantic salmon Salmo salar L. parr fed elevated dietary cadmium Marc H.G. Berntssen a, , Ole Ø. Aspholm b , Ketil Hylland b , Sjoerd E. Wendelaar Bonga c , Anne-Katrine Lundebye a a Institute of Nutrition, Directorate of Fisheries, P.O. Box 185, N-5804, Bergen, Norway b Norwegian Institute for Water Research, P.O. Box 173 Kjelsas, 0411 Oslo, Norway ˚ c Department of Animal Physiology, Faculty of Science, Uni ersity of Nijmegen, Toernooi eld, 6525 ED Nijmegen, The Netherlands Received 28 June 2000; received in revised form 21 November 2000; accepted 4 December 2000 Abstract Ž . Atlantic salmon parr were reared for 4 months on experimental diets supplemented with 0 control , 0.5, 5, 25, 125, or 250 mg Cd kg 1 feed to establish a threshold concentration for dietary cadmium exposure by assessing early adaptive cellular responses. At the end of the experiment, the lowest dietary Cd concentration that caused significant accumulation in the gut, kidney and muscle was 5 mg Cd kg 1 compared to the control group. Over time, dietary Cd Ž . Ž . Ž . accumulated first in the gut after 1 month , followed by the kidney 2 months , and later by muscle 4 months . Highest Ž . Cd accumulation 100-fold was found in the gut. A significant increase in regulated cell death and proliferation in salmon fed 125 mg Cd kg 1 compared to control fish appeared efficient in preventing gross histopathological damage in Ž . the intestine. The highest increase in metallothionein levels was found in the kidney, and metallothionein MT levels increased disproportionally to Cd accumulation at increased exposure concentrations. It was concluded that MT was not directly associated with long-term Cd accumulation. Atlantic salmon showed increased metallothionein levels in the Ž kidney at a median effective concentration concentration of dietary Cd giving 50% of the maximum increase in . 1 metallothionein, EC of 7 mg Cd kg , indicating toxic exposure at this concentration. 2001 Elsevier Science Inc. 50 All rights reserved. Keywords: Metallothionein; Apoptosis; Cell proliferation; Dietary cadmium; Food safety; Salmon Corresponding author. Tel.: 47-55238138; fax: 47-55238095. Ž . E-mail address: spor mb@nutr.fiskeridir.no M.H. Berntssen . 1532-045601$ - see front matter 2001 Elsevier Science Inc. All rights reserved. Ž . PII: S 1 5 3 2 - 0 4 5 6 00 00204-0
Transcript
Ž .Comparative Biochemistry and Physiology Part C 128 2001 299]310
Tissue metallothionein, apoptosis and cell proliferationž /responses in Atlantic salmon Salmo salar L. parr fed
elevated dietary cadmium
Marc H.G. Berntssena,U, Ole Ø. Aspholmb, Ketil Hyllandb,Sjoerd E. Wendelaar Bongac, Anne-Katrine Lundebyea
aInstitute of Nutrition, Directorate of Fisheries, P.O. Box 185, N-5804, Bergen, NorwaybNorwegian Institute for Water Research, P.O. Box 173 Kjelsas, 0411 Oslo, Norway˚
cDepartment of Animal Physiology, Faculty of Science, Uni ersity of Nijmegen, Toernooi eld, 6525 ED Nijmegen,
The Netherlands
Received 28 June 2000; received in revised form 21 November 2000; accepted 4 December 2000
Abstract
Ž .Atlantic salmon parr were reared for 4 months on experimental diets supplemented with 0 control , 0.5, 5, 25, 125, or250 mg Cd kgy1 feed to establish a threshold concentration for dietary cadmium exposure by assessing early adaptivecellular responses. At the end of the experiment, the lowest dietary Cd concentration that caused significantaccumulation in the gut, kidney and muscle was 5 mg Cd kgy1 compared to the control group. Over time, dietary Cd
Ž . Ž . Ž .accumulated first in the gut after 1 month , followed by the kidney 2 months , and later by muscle 4 months . HighestŽ .Cd accumulation 100-fold was found in the gut. A significant increase in regulated cell death and proliferation in
salmon fed 125 mg Cd kgy1 compared to control fish appeared efficient in preventing gross histopathological damage inŽ .the intestine. The highest increase in metallothionein levels was found in the kidney, and metallothionein MT levels
increased disproportionally to Cd accumulation at increased exposure concentrations. It was concluded that MT was notdirectly associated with long-term Cd accumulation. Atlantic salmon showed increased metallothionein levels in the
Žkidney at a median effective concentration concentration of dietary Cd giving 50% of the maximum increase in. y1metallothionein, EC of 7 mg Cd kg , indicating toxic exposure at this concentration. Q 2001 Elsevier Science Inc.50
1532-0456r01r$ - see front matter Q 2001 Elsevier Science Inc. All rights reserved.Ž .PII: S 1 5 3 2 - 0 4 5 6 0 0 0 0 2 0 4 - 0
( )M.H. Berntssen et al. r Comparati e Biochemistry and Physiology Part C 128 2001 299]310300
1. Introduction
Whereas toxic responses in fish exposed toelevated waterborne cadmium are well docu-
Ž .mented Heath, 1995 , studies on oral exposuresŽ .are sparse Handy, 1996 , despite food being a
significant route of Cd contamination in fish un-Ž .der natural Dallinger and Kautzky, 1985 and
Žexperimental conditions Haesloop and Schirmer,1985; Harrison and Klaverkamp, 1989; Kraal et
.al., 1995 . Studies on dietary Cd exposure in fishshow highest accumulation in the intestine, kid-
Žney and liver Haesloop and Schirmer, 1985; Har-.rison and Klaverkamp, 1989; Handy, 1992 . Con-
sequently, few studies have focused on the con-tamination of muscle. Cadmium contamination ofmuscle may be important in aquaculture fish,
Ž .such as Atlantic salmon Salmo salar , in terms ofhuman safety. Depending on concentration andexposure duration, contamination of muscle hasbeen observed in dietary Cd-fed rainbow troutŽ . ŽOncorhynchus mykiss Kumada et al., 1980;
. Ž .Handy, 1993 and sea bass Dicentrarchus labraxŽ .Odzak and Zvonaric, 1995 .
Most studies on dietary Cd-exposed fish havefocused on organ Cd distribution in order toassess the kinetics of dietary Cd accumulationŽ .Harrison and Klaverkamp, 1989 and target or-
Ž .gan contamination Handy, 1993 . However, accu-mulation assays cannot always predict the toxiceffects of dietary Cd exposure. In this context,biomarkers are indicated to assess the biological
Žconsequences of exposure to toxic metals Adams.et al., 1989; Peakall, 1992 . The induction of the
Ž .metal-binding protein, metallothionein MT , isoften advocated as a sensitive and specific indica-
Žtor of metal exposure in aquatic animals Roch et.al., 1986; Chan et al., 1989; Benson et al., 1990 .
Metallothionein is a small, cysteine-rich intracel-Žlular protein that avidly binds metals Olsson,
.1993 , and has been suggested to have a pivotalŽrole in protection against Cd toxicity Klaassen et
.al., 1999 . Metallothionein is also frequently sug-gested to be involved in sequestration, and therebythe accumulation of Cd in different target organsŽ .Cinier et al., 1999 . In mammals, the high accu-mulation of Cd in the kidney has often beenassociated with high MT concentrations found in
Ž .this organ Webb, 1986 . Although several studieshave reported a relatively fast induction of renalMT in Cd-injected and waterborne Cd-challenged
Ž .fish George et al., 1996; Olsson and Haux, 1996 ,
little information exits on the target organ of MTinduction in dietary metal-exposed fish.
More recently, proposed cellular biomarkers ofcadmium exposure in aquatic organisms are regu-
Ž . Žlated cell death apoptosis Wagner et al., 1998;.Piechotta et al., 1999; Sweet et al., 1999 and cell
Ž .proliferation Ortego et al., 1995 . Apoptosis hasbeen suggested as a sensitive and early indicatorof chronic chemical stress, loss of cellular func-
Žtion and structure, and organism health Sweet et.al., 1999 . In mammals, under normal intestinal
kinetics, a close balance between cell prolifera-tion and regulated cell death maintains tissue
Ž .integrity Potten and Booth, 1997 . Apoptosis ac-counts for the bulk of cell loss in the gut and is acentral feature of the regulation of intestinal cell
Ž .number Hall et al., 1994 . Under toxic exposure,apoptosis is suggested to remove critically da-maged cells followed by compensatory cell regen-eration to maintain tissue structure and functionŽ .Habeebu et al., 1998 . Little is known about therole of intestinal apoptosis and cell proliferationin preserving tissue integrity in dietary metal-challenged fish.
The main objective of this study was to es-tablish a threshold level for toxic exposure of
Ž .dietary Cd in Atlantic salmon Salmo salar L.using Cd distribution among organs, and
Ž .biochemical MT and immunocytochemicalŽ .apoptosis and cell proliferation responses asbiomarkers. A second objective was to investigatethe role of metallothionein induction in the tis-sue-specific accumulation of dietary Cd. The thirdobjective was to investigate the role of regulated
Ž .cell death apoptosis and cell proliferation inpreserving intestinal tissue integrity in dietary
Ž .Cd-challenged Atlantic salmon S. salar L. .
2. Material and methods
2.1. Experimental conditions and sampling
The experiment was performed at Matre Aqua-culture Research Station, Institute of Marine Re-search, Matredal, Western Norway. Atlantic sal-
Ž .mon Salmo salar parr bred locally at this stationwere used. At the beginning of the experiment,
Ž .weight, length fork-tail and condition factor ofŽ .the fish were mean"S.D. , 12.8"0.7 g, 26.5"
y3 Ž .3.9 cm and 1.3"0.1 g cm , respectively ns72 .ŽA total of 18 separate Fiberglas tanks 1.5=1.5
( )M.H. Berntssen et al. r Comparati e Biochemistry and Physiology Part C 128 2001 299]310 301
3.=0.5 m were each stocked with 100 parr. Ini-tially, all fish were fed on a control diet withoutCd supplementation for 2 weeks to acclimatethem to experimental conditions. Thereafter, eachof the six experimental diets was fed to fish intriplicate tanks for 4 months. Fish were rearedunder constant light during the exposure period
Žand fed by automatic feeders for 5 s every 7 min,y1 .24 h day according to the standardised growth
Ž .tables for salmonids Austreng et al., 1987 . After0, 1, 2 and 4 months, the fish were bulk-weighed,and the amount of feed given was adjusted inaccordance with the biomass. Fish were routinelymonitored for nutritional performance through-out the experiment and appetite was monitoredregularly by hand feeding. Water temperaturewas measured daily and decreased from 13.0 to78C during the experimental period.
Ž .Routine water samples 50 ml were taken fromŽeach tank and acidified with nitric acid 65%
.HNO , Suprapur, Merck, Germany in a final3
Žconcentration of 5.2% 2 ml of HNO added to3
.25 ml of sample for Cd analysis. A flow-throughsystem was used, in which the soft, acidic freshwa-ter was buffered by adding 0.5% seawater, whichresulted in the following water quality: pH 6.5"
0.8, Ca 11.4"7.5 mg ly1 , and Cd 0.2"0.1 mg ly1
Ž .mean"S.D. . The water flow to the tanks was 14l miny1 , and oxygen concentrations in the outletwater were measured weekly and were neverbelow 8 mg ly1 .
After 0, 1, 2 and 4 months of exposure, six fishwere sampled from each tank. The fish wereanaesthetised in metomidate and killed by a blowto the head. They were weighed and their forklength was measured. Liver, kidney and intestinewere dissected out and weighed. To prevent con-tamination between samples, the dissecting trayand tools were rinsed in 0.1 M nitric acid andsubsequently rinsed with nano-pure water beforedissecting each fish. The intestine samples con-sisted of the intestinal tissue from behind thepylorus, to approximately 3 mm before the anus.Fat and veins were removed from the intestineand each segment was washed out three times
Žwith an ice-cold saline solution 0.9% NaCl,.Merck, in nano-pure water , to remove food rem-
nants. Intestine, liver and kidney were immedi-ately frozen in liquid nitrogen and later stored aty808C until analysed. Fish remains were kept on
Ž .ice 8 h and stored at y208C. Muscle sampleswere obtained by removing the skin of the fish
remains with a filleting knife; afterwards the mus-cle was homogenised. Before analyses, the liverand kidney were roughly homogenised and theintestine was cut lengthwise. Half of the tissuewas used for MT determination and the otherhalf for Cd determination. To obtain sufficientmaterial for MT analyses, organ samples of two
Žfish from each tank were pooled hence ns3 per.tank . The material for Cd analysis was pooled
Žlikewise, freeze-dried until successive daily.weighings were unchanged , homogenised and
stored dry until analysis. Liver, kidney, gill andintestine samples for Cd analysis were weighedbefore and after freeze-drying to measure watercontent.
2.2. Diet formulation
To cover nutrient requirements, diets were pre-Žpared according to the following formulation in g
y1 . Ž .kg ; fishmeal Norse, Norway 580, Capelin oilŽ .Norsamoil, SSF, Norway 119, wheat mealŽ .CODRICO LTD., Netherlands 160, and mineraland vitamin premix 20. The formulations for themineral and vitamin mix are given elsewhereŽ .Lundebye et al., 1999 . In addition, gelatinŽ . Ž y1 .TORO ArS, Norway was added 28 g kg as a
Ž y1 .binder and ground squid 95 g kg was added toenhance the palatability. The diet was supple-mented with 0, 0.5, 5, 25, 125 or 250 mg Cd kgy1.
Ž .Cadmium 8CdSO ?3H O was dissolved in 5004 2
ml of acidified water and mixed well with theother feed ingredients. The mixture was cold-pel-leted after adding 12% water in a food extruderŽ .2.5-mm extrusion plate . The pellets were heat-dried at 508C for 24 h and stored at y208C untilthey were fed to the fish. Final Cd concentrationswere: 0.2"0.001, 0.8"0.003, 6.7"0.1, 21.6"6.4,112.2"5.8, and 204.1"24.0 mg Cd kgy1 dry wt.,
Ž .by analysis mean"S.D., ns6 .
2.3. Analysis
Samples for Cd analysis were heat- and pres-Ž .sure-destructed in a HNO 65%, Suprapur and3
Ž .as described by Berntssen et al. 1999 . Cadmiumconcentrations were analysed by electrothermalatomic absorption on a Perkin-Elmer 4110ZL in-
Ž y1 .strument detection limit 0.037 mg l using aŽ .0.3% NH HPO and 0.01% Mg matrix modi-4 2 4
Ž .fier after Maage et al. 1991 . Water samples were
( )M.H. Berntssen et al. r Comparati e Biochemistry and Physiology Part C 128 2001 299]310302
analysed for total Cd by inductively coupledŽplasma mass spectrometry Perkin-Elmer Elan
.5000, USA . Accuracy and precision of the ele-ment analyses was controlled with each set ofsamples by analyses of dogfish muscle tissue
Ž .DORM-1 NRCC, Canada . The methods werefound satisfactory when analysis of the referencematerial was within the 95% confidence limit.
The preparation of tissue samples for metal-lothionein analysis is described by Berntssen et al.Ž .1999 . Briefly, 0.8 g of tissue was homogenised in
Žan ice-cold buffer 100 mM Tris]HCl, pH 8.1, 5mM 2-mercaptoethanol and one tablet of ‘Com-
.plete’ protease inhibitor per 500 ml and cen-trifuged at 10 000=g for 30 min at 48C. The
Ž .supernatant was heat-treated 958C for 5 minand centrifuged again at 10 000=g for 30 min.Metallothionein in the resulting supernatant wasdetermined by differential pulse polarographyŽ .Olafson and Sim, 1979 , modified according to
Ž . Ž .Olsson et al. 1987 . Rabbit liver MT Sigma wasŽ y1used as a standard in the assay 28 mg l , 6500
.Da . The standard MT gives a linear signalbetween 1 and 8 mg MT in the analysis electrolyteŽ .20.4 ml . When analysing samples, a knownvolume of the sample is manually spiked into theelectrolyte. The volume can be varied from 50 to1000 ml to always keep the MT concentrationwithin the linear area. Total protein content was
Ž .analysed according to Lowry et al. 1951 usingŽ .bovine gamma globulin Sigma as a standard.
For immunocytochemical analysis, 1 cm of theintestine, behind the last pylorus sac, was sampledand divided into two parts. One part of the sam-ple was fixed in Bouin’s fixative, processed,
Ž .paraffin-embedded, and cut 4-mm cross-sectionsfor light microscopy according to Berntssen et al.Ž .1997 . To quantify cell proliferation, the sectionswere stained immunohistochemically with a
Žmonoclonal antibody 19F4, Boehringer, Ger-.many raised against proliferating cell nuclear
Ž .antigen PCNA using the procedure of Ortego etŽ .al. 1994 . Afterwards, the sections were counter-
stained with haemalum and eosin. PCNA-positiveintestinal crypt cells were identified as described
Ž .by Ortego et al. 1994 . The number of PCNA-positive crypt cells was quantified as described by
Ž .Berntssen et al. 1999 . The intestinal cell prolif-Ž .eration, or mitotic rate Alison, 1995 , was ex-
pressed as number of PCNA-positiverPCNA-negative crypt cells.
The second part of the intestinal sample wasŽprepared for TUNEL Tdt-mediated dUTP nick-
Ž .tissue according to Bury et al. 1998 . Intestinaltissue was fixated in 4% paraformaldehyde in a
Žfree phosphate-buffered saline PBS, in mM; 2.6. .KCl, 1.5 KH PO , 137 NaCl, 8 Na HPO for 242 4 2 4
h at room temperature. After, fixation the sam-ples were washed in PBS and stored in 70%ethanol for 3 months. The tissues were dehy-
Ždrated, paraffin-embedded, cut 5-mm cross-sec-.tions , mounted, dewaxed and rehydrated for mi-
Žcroscopy by standard procedures Berntssen et.al., 1997 . Before TUNEL co-labelling, the
Žmounted tissues were washed 3=5 min at room.temperature in a PBS buffer and made perme-
Ž .able by microwave heating 5 min, 750 W, 808CŽ .in 0.1% vrv TritonrPBS. After this period, the
Ž .tissue was washed again PBS and incubated for1 h at 378C in darkness with TUNEL enzyme and
Ž .label solution Boehringer Mannheim, Germany .The tissue was washed with PBS and antifade
Ž .solution glycerolrPBS, 9:1 was added for fluor-escence microscopy. A confocal laser scanning
Ž .microscope MRC-600 BioRad was used to iden-tify apoptotic enterocytes. Random images of sixintestinal villi of six fish from the control, 5- and125-mg Cd kgy1 groups were collected on anIBM-compatible computer and the percentage ofapoptotic intestinal cells was determined. Sincethe TUNEL-positive intestinal cells were limitedto the apex of the intestinal villi, the apoptoticindex was expressed as the number of TUNEL-positiverTUNEL-negative cells within 6 mm ofthe tip of the intestinal villi downwards.
2.4. Statistics
All statistics were performed using the programTM Ž .STATISTICA Statsoft Inc., USA, 1993 . To ac-
count for the variance among experimental tankswithin one dietary treatment, differences in tissueCd concentration, MT levels, and intestinal PCNAwere assessed using two-way analysis of varianceŽ . Ž . Ž .nested ANOVA Zar, 1984 with the randomexperimental tanks nested in their dietary expo-
Žsure group. Where the null hypothesis H : no0
difference between treatments or within treat-.ment at different time intervals was rejected, the
position of significant differences was tested using
( )M.H. Berntssen et al. r Comparati e Biochemistry and Physiology Part C 128 2001 299]310 303
Ž . ŽTukey’s HSD test P-0.01 and -0.05 Sokal.and Rohlf, 1981 . A Kolmogrov]Smirnov test was
used to assess the normality of distribution ofŽ .each treatment Zar, 1984 . Data that were not
found to be normally distributed were trans-formed. Dependent variables were checked forhomogeneity of variance by a Levene F-test and
Ž .transformed when necessary Zar, 1984 .A logarithmic concentration]response regres-
sion model was used to estimate the ‘effectiveŽconcentration’ for metallothionein responses the
concentration corresponding to 50% induction,. Ž .EC Hill, 1994 , as described by Haanstra and50
Ž .Doelman 1991 . The relationship is expressed as:
pqqys a xybŽ .1qe
where y is the observed content matallothioneinof the logarithm of cadmium supplementation x,p is the calculated minimum level of the re-sponse, and q is the calculated difference betweenthe minimum and maximum level of response.The parameters p and q are determined by thevalues of the control sample and of the highestsample values. The parameter a is the slope ofreduction and b is the logarithm of the concen-tration at which the total estimated energy is half
Ž .the maximum level bs0.5pqq . The EC is50
calculated from the parameter b by taking itsinverse logarithm.
3. Results
3.1. Water chemistry
No significant differences were observed inwaterborne Cd concentrations in the experimen-tal tanks. Concentrations of Cd in the water were0.12"0.08, 0.10"0.07, 0.09"0.04, 0.11"0.06,
y1 Ž .0.16"0.06, and 0.15"0.03 mg l ns4 for thecontrol, 0.5, 5, 25, 125 and 250 groups, respec-tively. The pH and Ca concentrations of the waterin the different experimental tanks did not differcompared to the control tanks. No mortalitieswere observed in any of the dietary groups, andswimming performance and appetite did not ap-pear to be affected.
3.2. Accumulation of cadmium
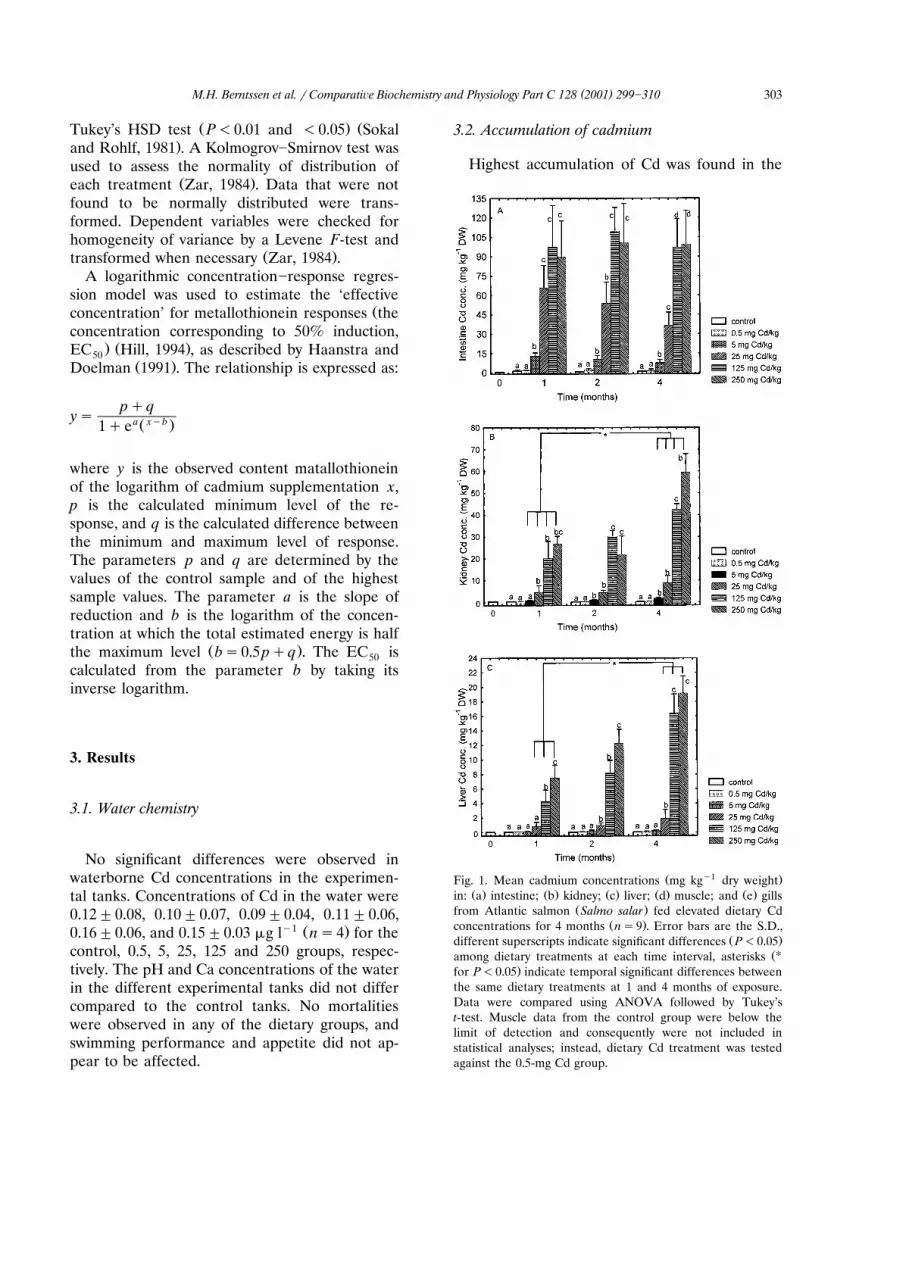
Highest accumulation of Cd was found in the
Ž y1 .Fig. 1. Mean cadmium concentrations mg kg dry weightŽ . Ž . Ž . Ž . Ž .in: a intestine; b kidney; c liver; d muscle; and e gills
Ž .from Atlantic salmon Salmo salar fed elevated dietary CdŽ .concentrations for 4 months ns9 . Error bars are the S.D.,
Ž .different superscripts indicate significant differences P-0.05ŽUamong dietary treatments at each time interval, asterisks
.for P-0.05 indicate temporal significant differences betweenthe same dietary treatments at 1 and 4 months of exposure.Data were compared using ANOVA followed by Tukey’st-test. Muscle data from the control group were below thelimit of detection and consequently were not included instatistical analyses; instead, dietary Cd treatment was testedagainst the 0.5-mg Cd group.
( )M.H. Berntssen et al. r Comparati e Biochemistry and Physiology Part C 128 2001 299]310304
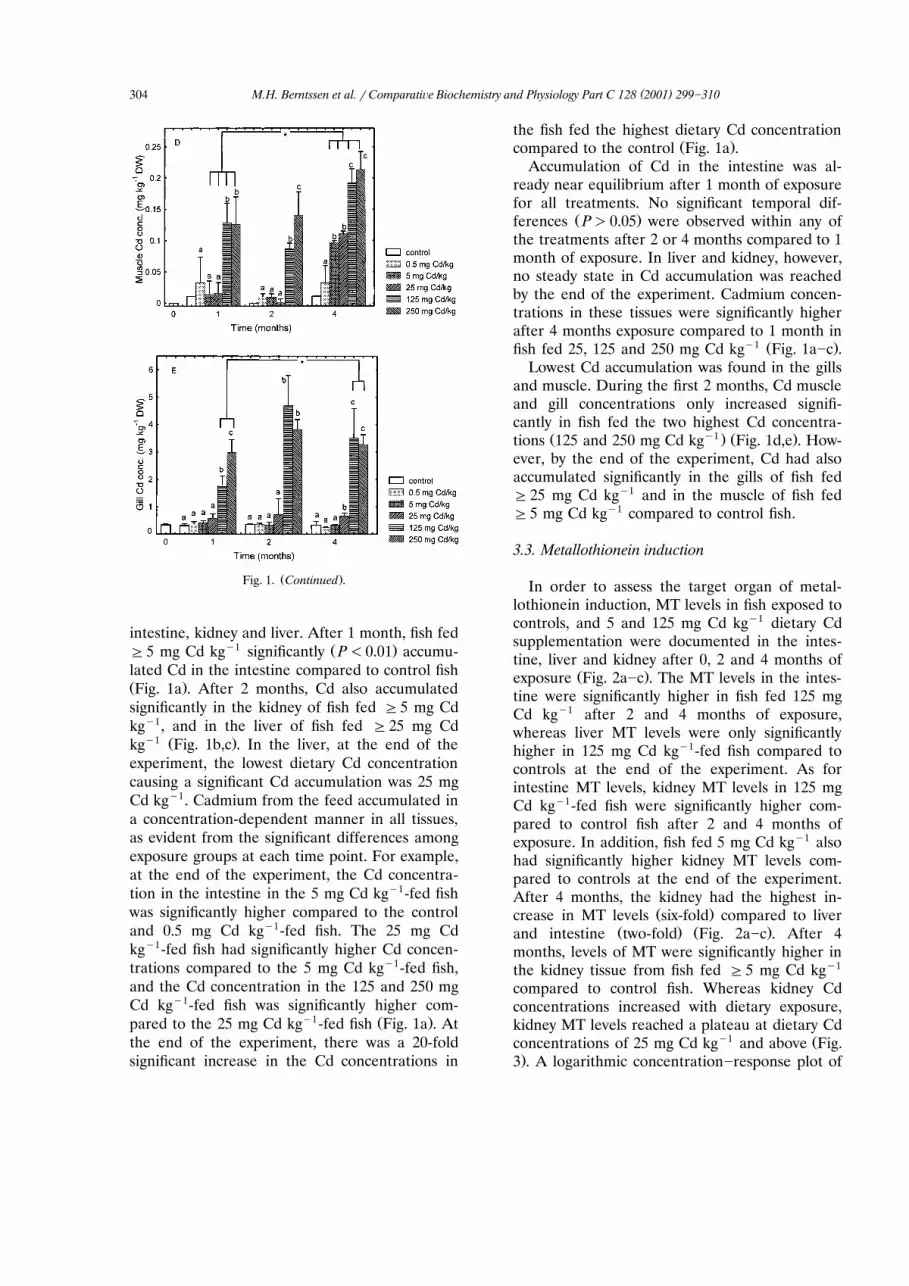
Ž .Fig. 1. Continued .
intestine, kidney and liver. After 1 month, fish fedy1 Ž .G5 mg Cd kg significantly P-0.01 accumu-
lated Cd in the intestine compared to control fishŽ .Fig. 1a . After 2 months, Cd also accumulatedsignificantly in the kidney of fish fed G5 mg Cdkgy1, and in the liver of fish fed G25 mg Cd
y1 Ž .kg Fig. 1b,c . In the liver, at the end of theexperiment, the lowest dietary Cd concentrationcausing a significant Cd accumulation was 25 mgCd kgy1. Cadmium from the feed accumulated ina concentration-dependent manner in all tissues,as evident from the significant differences amongexposure groups at each time point. For example,at the end of the experiment, the Cd concentra-tion in the intestine in the 5 mg Cd kgy1-fed fishwas significantly higher compared to the controland 0.5 mg Cd kgy1-fed fish. The 25 mg Cdkgy1-fed fish had significantly higher Cd concen-trations compared to the 5 mg Cd kgy1-fed fish,and the Cd concentration in the 125 and 250 mgCd kgy1-fed fish was significantly higher com-
y1 Ž .pared to the 25 mg Cd kg -fed fish Fig. 1a . Atthe end of the experiment, there was a 20-foldsignificant increase in the Cd concentrations in
the fish fed the highest dietary Cd concentrationŽ .compared to the control Fig. 1a .
Accumulation of Cd in the intestine was al-ready near equilibrium after 1 month of exposurefor all treatments. No significant temporal dif-
Ž .ferences P)0.05 were observed within any ofthe treatments after 2 or 4 months compared to 1month of exposure. In liver and kidney, however,no steady state in Cd accumulation was reachedby the end of the experiment. Cadmium concen-trations in these tissues were significantly higherafter 4 months exposure compared to 1 month in
y1 Ž .fish fed 25, 125 and 250 mg Cd kg Fig. 1a]c .Lowest Cd accumulation was found in the gills
and muscle. During the first 2 months, Cd muscleand gill concentrations only increased signifi-cantly in fish fed the two highest Cd concentra-
Ž y1 . Ž .tions 125 and 250 mg Cd kg Fig. 1d,e . How-ever, by the end of the experiment, Cd had alsoaccumulated significantly in the gills of fish fedG25 mg Cd kgy1 and in the muscle of fish fedG5 mg Cd kgy1 compared to control fish.
3.3. Metallothionein induction
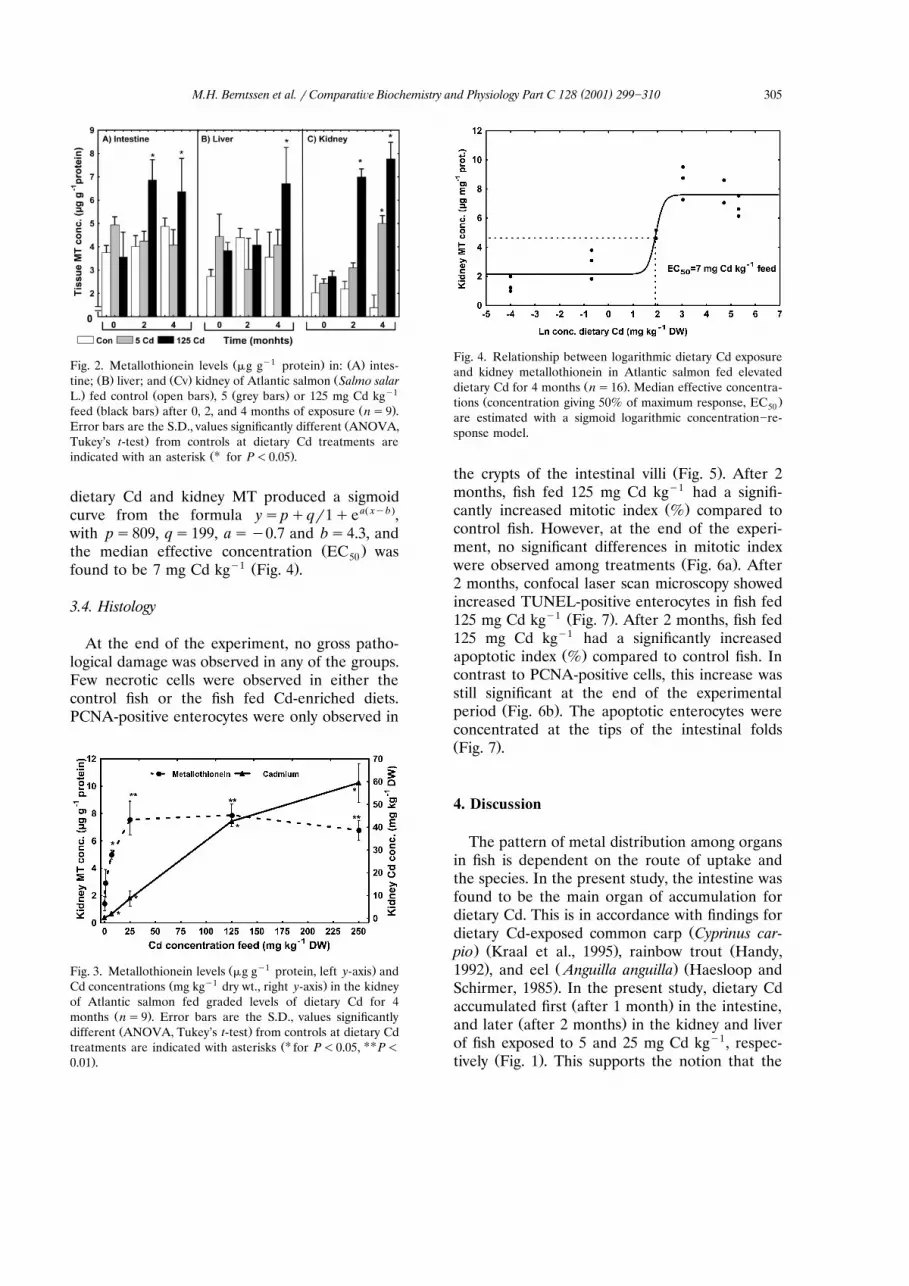
In order to assess the target organ of metal-lothionein induction, MT levels in fish exposed tocontrols, and 5 and 125 mg Cd kgy1 dietary Cdsupplementation were documented in the intes-tine, liver and kidney after 0, 2 and 4 months of
Ž .exposure Fig. 2a]c . The MT levels in the intes-tine were significantly higher in fish fed 125 mgCd kgy1 after 2 and 4 months of exposure,whereas liver MT levels were only significantlyhigher in 125 mg Cd kgy1-fed fish compared tocontrols at the end of the experiment. As forintestine MT levels, kidney MT levels in 125 mgCd kgy1-fed fish were significantly higher com-pared to control fish after 2 and 4 months ofexposure. In addition, fish fed 5 mg Cd kgy1 alsohad significantly higher kidney MT levels com-pared to controls at the end of the experiment.After 4 months, the kidney had the highest in-
Ž .crease in MT levels six-fold compared to liverŽ . Ž .and intestine two-fold Fig. 2a]c . After 4
months, levels of MT were significantly higher inthe kidney tissue from fish fed G5 mg Cd kgy1
compared to control fish. Whereas kidney Cdconcentrations increased with dietary exposure,kidney MT levels reached a plateau at dietary Cd
y1 Žconcentrations of 25 mg Cd kg and above Fig..3 . A logarithmic concentration]response plot of
( )M.H. Berntssen et al. r Comparati e Biochemistry and Physiology Part C 128 2001 299]310 305
Ž y1 . Ž .Fig. 2. Metallothionein levels mg g protein in: A intes-Ž . Ž . Žtine; B liver; and Cv kidney of Atlantic salmon Salmo salar
. Ž . Ž . y1L. fed control open bars , 5 grey bars or 125 mg Cd kgŽ . Ž .feed black bars after 0, 2, and 4 months of exposure ns9 .
ŽError bars are the S.D., values significantly different ANOVA,.Tukey’s t-test from controls at dietary Cd treatments are
ŽU .indicated with an asterisk for P-0.05 .
dietary Cd and kidney MT produced a sigmoidcurve from the formula yspqqr1qeaŽ xyb.,with ps809, qs199, asy0.7 and bs4.3, and
Ž .the median effective concentration EC was50y1 Ž .found to be 7 mg Cd kg Fig. 4 .
3.4. Histology
At the end of the experiment, no gross patho-logical damage was observed in any of the groups.Few necrotic cells were observed in either thecontrol fish or the fish fed Cd-enriched diets.PCNA-positive enterocytes were only observed in
Ž y1 .Fig. 3. Metallothionein levels mg g protein, left y-axis andŽ y1 .Cd concentrations mg kg dry wt., right y-axis in the kidney
of Atlantic salmon fed graded levels of dietary Cd for 4Ž .months ns9 . Error bars are the S.D., values significantlyŽ .different ANOVA, Tukey’s t-test from controls at dietary Cd
ŽU UUtreatments are indicated with asterisks for P-0.05, P-
.0.01 .
Fig. 4. Relationship between logarithmic dietary Cd exposureand kidney metallothionein in Atlantic salmon fed elevated
Ž .dietary Cd for 4 months ns16 . Median effective concentra-Ž .tions concentration giving 50% of maximum response, EC50
are estimated with a sigmoid logarithmic concentration]re-sponse model.
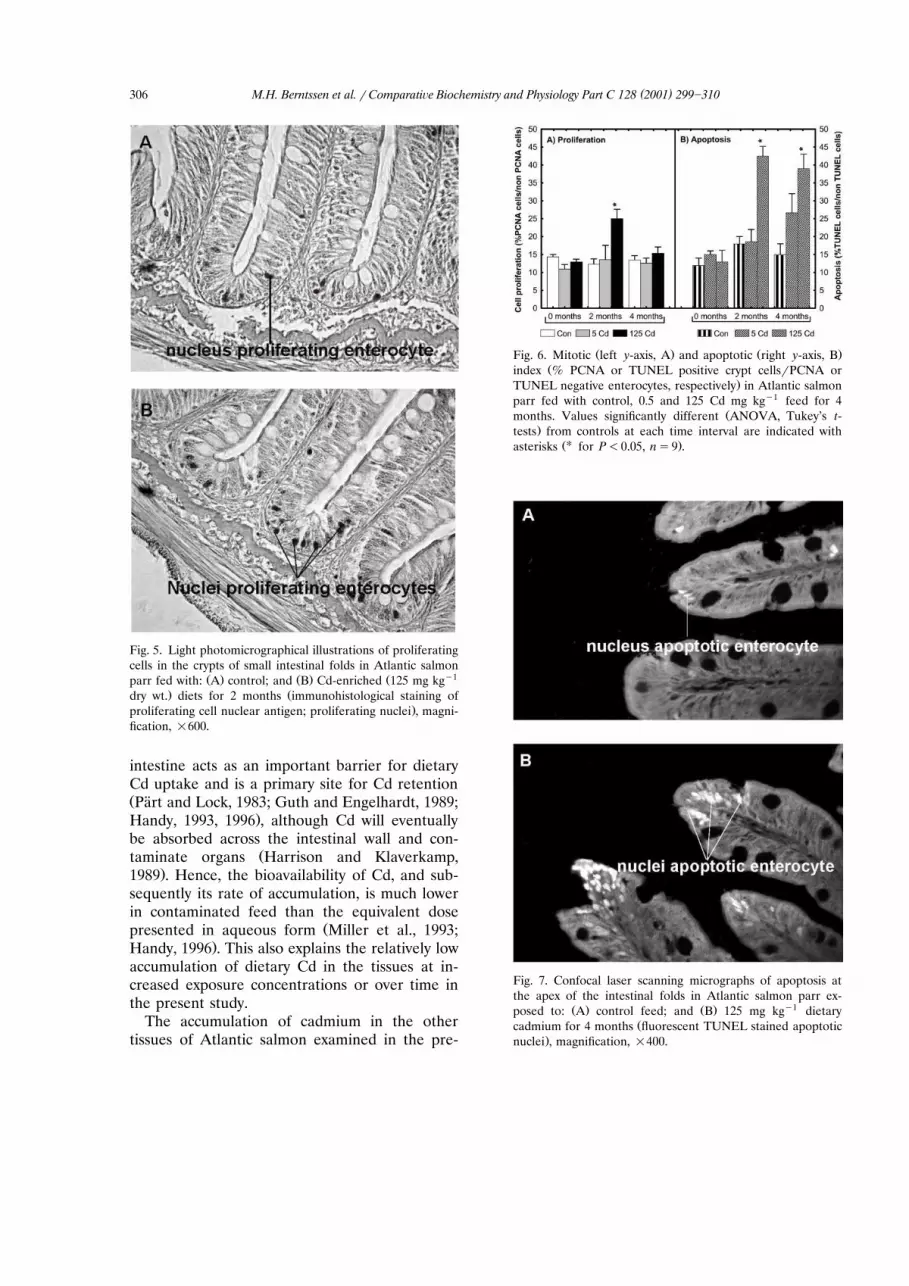
Ž .the crypts of the intestinal villi Fig. 5 . After 2months, fish fed 125 mg Cd kgy1 had a signifi-
Ž .cantly increased mitotic index % compared tocontrol fish. However, at the end of the experi-ment, no significant differences in mitotic index
Ž .were observed among treatments Fig. 6a . After2 months, confocal laser scan microscopy showedincreased TUNEL-positive enterocytes in fish fed
y1 Ž .125 mg Cd kg Fig. 7 . After 2 months, fish fed125 mg Cd kgy1 had a significantly increased
Ž .apoptotic index % compared to control fish. Incontrast to PCNA-positive cells, this increase wasstill significant at the end of the experimental
Ž .period Fig. 6b . The apoptotic enterocytes wereconcentrated at the tips of the intestinal foldsŽ .Fig. 7 .
4. Discussion
The pattern of metal distribution among organsin fish is dependent on the route of uptake andthe species. In the present study, the intestine wasfound to be the main organ of accumulation fordietary Cd. This is in accordance with findings for
Ždietary Cd-exposed common carp Cyprinus car-. Ž . Žpio Kraal et al., 1995 , rainbow trout Handy,. Ž . Ž1992 , and eel Anguilla anguilla Haesloop and
.Schirmer, 1985 . In the present study, dietary CdŽ .accumulated first after 1 month in the intestine,
Ž .and later after 2 months in the kidney and liverof fish exposed to 5 and 25 mg Cd kgy1, respec-
Ž .tively Fig. 1 . This supports the notion that the
( )M.H. Berntssen et al. r Comparati e Biochemistry and Physiology Part C 128 2001 299]310306
Fig. 5. Light photomicrographical illustrations of proliferatingcells in the crypts of small intestinal folds in Atlantic salmon
Ž . Ž . Ž y1parr fed with: A control; and B Cd-enriched 125 mg kg. Ždry wt. diets for 2 months immunohistological staining of
intestine acts as an important barrier for dietaryCd uptake and is a primary site for Cd retentionŽPart and Lock, 1983; Guth and Engelhardt, 1989;¨
.Handy, 1993, 1996 , although Cd will eventuallybe absorbed across the intestinal wall and con-
Žtaminate organs Harrison and Klaverkamp,.1989 . Hence, the bioavailability of Cd, and sub-
sequently its rate of accumulation, is much lowerin contaminated feed than the equivalent dose
Žpresented in aqueous form Miller et al., 1993;.Handy, 1996 . This also explains the relatively low
accumulation of dietary Cd in the tissues at in-creased exposure concentrations or over time inthe present study.
The accumulation of cadmium in the othertissues of Atlantic salmon examined in the pre-
Ž . Ž .Fig. 6. Mitotic left y-axis, A and apoptotic right y-axis, BŽindex % PCNA or TUNEL positive crypt cellsrPCNA or
.TUNEL negative enterocytes, respectively in Atlantic salmonparr fed with control, 0.5 and 125 Cd mg kgy1 feed for 4
Žmonths. Values significantly different ANOVA, Tukey’s t-.tests from controls at each time interval are indicated with
ŽU .asterisks for P-0.05, ns9 .
Fig. 7. Confocal laser scanning micrographs of apoptosis atthe apex of the intestinal folds in Atlantic salmon parr ex-
Ž . Ž . y1posed to: A control feed; and B 125 mg kg dietaryŽcadmium for 4 months fluorescent TUNEL stained apoptotic
.nuclei , magnification, =400.
( )M.H. Berntssen et al. r Comparati e Biochemistry and Physiology Part C 128 2001 299]310 307
sent study was, in decreasing order, kidney) liver)gill)muscle, which is in accordance with the
Ž .findings of Kraal et al. 1995 for common carp.Another study on dietary Cd-exposed fish alsoshowed that more Cd accumulated in the kidney
Ž .than in the other internal organs Handy, 1992 .In mammals, Cd is considered a potent nephro-toxin, and the kidney is one of the main target
Ž .organs for cadmium toxicity Foulkes, 1986 . Infish, Cd has been shown to cause renal damageŽ .Koyama and Itazawa, 1977; Romeo et al., 2000 .There is little evidence in the literature of liverdamage in fish associated with dietary cadmiumexposure. A histopathological study by Koyama
Ž .and Itazawa 1977 showed that fish orally ex-posed to Cd had granular deposits in the liver.However, this may represent detoxification, asopposed to structural damage. This would supportthe claim of several authors that the liver is one
Žof the main sites of metal detoxification Wick-.lund et al., 1990; Suresh et al., 1993 . Dietary Cd
exposure in fish can also exert its toxic action byŽaffecting the gills. Tilapia Oreochromis mossam-
.bicus exposed to dietary Cd showed increasedturnover of chloride cells in the gills, which wasassociated with a decrease in osmoregulatory ca-
Ž .pacity Pratap and Wendelaar Bonga, 1993 . Inthe present study, significant Cd accumulation inthe gills occurred long after kidney contamina-tion. Thus, in Atlantic salmon, the kidney is morelikely to be the main target organ for sub-lethaldietary Cd toxicity than the gills or liver.
Cadmium accumulation in muscle tissue wasonly significant at the highest dietary concentra-
Ž y1 .tions 125 mg Cd kg and above after 1 monthof exposure. Only after 4 months of exposure wasthere significant accumulation in muscle tissue offish exposed to 5 mg Cd kgy1. Similarly, sea bassexposed to 39 mg Cd kgy1 showed increasingmuscle Cd contamination after 2 months of expo-
Ž .sure Odzak and Zvonaric, 1995 . In contrast,rainbow trout fed 150 and common carp fed 260
y1 Ž .mg Cd kg Kraal et al., 1995 showed no sig-nificant muscle contamination; however, the du-ration of these studies was only 1 month. Thus, itappears that contamination of the muscle takes aconsiderable time in comparison to the othertarget organs.
Metallothionein is frequently suggested to beinvolved in sequestration, and thereby in accumu-lation of cadmium in kidney, liver and the intes-
Žtine of fish in response to both waterborne Cinier
. Žet al., 1999 and dietary exposure Harrison and.Klaverkamp, 1989 . However, in the present study,
Cd accumulated disproportionately to the MTŽ .levels in the kidney Fig. 3 . In addition, MT only
accounted for the binding of 8% of the accumu-lated Cd in the kidney, assuming 6500 Da for MT
Žand a binding coefficient of 1:8 with Cd Elsen-. Ž .hans et al., 1994 . Similarly, Cattani et al. 1996
found that MT was induced in the liver of water-borne Cd-exposed sea bass, but failed to bind allthe cytosolic Cd. Thus, in the present study, in-creased tissue MT levels do not seem to be di-rectly associated with long-term Cd sequesteringin the target tissues. In mammals, Cd]MT com-plexes formed in the liver and intestine are pref-erentially transferred to the kidney, where they
Ž .accumulate Elsenhans et al., 1994 . In the kid-ney, the Cd]MT complex is filtered and reabsor-bed in the proximal tubules without substantial
Ž .degradation Webb, 1986 . Redistribution of in-testinal and hepatic Cd]MT complexes to thekidney, together with limited excretion and degra-dation, may partially explain the high accumula-tion of Cd and MT found in this organ in thepresent study.
MT levels in the kidney appeared to be asensitive indicator of moderate Cd exposure. BothMT concentrations and Cd accumulation in-creased significantly at feed concentrations of 5mg Cd kgy1 and above. The median effective
Ž .concentration EC for increased MT levels was50
estimated as 7 mg Cd kgy1. The elevated kidneyMT concentrations indicate the onset of biologi-cal mechanisms to cope with metal exposure,emphasising the central role of MT in Cd detoxi-
Žfication Thomas et al., 1985; Klaassen et al.,. Ž1999 . At higher feed concentrations above 25
y1 .mg Cd kg , MT levels did not reflect the Cdfeed concentration and kidney Cd accumulationŽ .Fig. 3 . This may be due to reduced MT synthesisas a result of cytotoxicity associated with high
Ž .tissue-Cd concentrations George et al., 1996 .In the present study, despite high Cd accumula-
tion, no histopathological damage was observedin the intestine. The most marked immunocy-tochemical response was the increase in apoptoticand mitotic enterocyte density in fish fed 125 mgCd kgy1 and above. Increased indices of apop-totic chloride cells have been reported earlier in
Žthe gills of dietary Cd-exposed tilapia Pratap and.Wendelaar Bonga, 1993 . In the present study,
the mitotic cells were positioned in the crypts of
( )M.H. Berntssen et al. r Comparati e Biochemistry and Physiology Part C 128 2001 299]310308
the intestinal villi, which is in accordance withearlier reports on PCNA-positive cells in the in-
Ž . Žtestine of the guppy Poecilia reticulata Ortego.et al., 1994 . Apoptotic cells were positioned at
the distal end of the known cellular migrationroutes in the intestine; the villi tip. Intestinal cells
Žmigrate from the crypts towards the tips Hall et.al., 1994 , and the increased density of apoptotic
cells in the villi tips in the present study indicateacceleration of ageing and loss. This increasedloss of intestinal cells is compensated by in-creased cell proliferation in the crypts. However,at the end of the experiment, no significant dif-ference was observed in cell proliferation amongdietary treatments, whereas increased apoptoticdensity was still observed in fish fed 125 mg Cdkgy1. This indicates an exhaustion of the capacityto compensate the apoptotic loss of intestinalcells.
Apoptosis precedes necrosis and is one of themain mechanisms of elimination of critically da-
Žmaged cells in element-induced toxicity Habeebu.et al., 1998 . In the present study, regulated cell
death appeared efficient in preventing grosshistopathological damage in the intestine of di-etary Cd-challenged salmon. The density of apop-totic and proliferating cells started to increased ata dietary Cd concentration of 125 mg Cd kgy1,whereas the increase in kidney MT levels reacheda plateau at this exposure concentration. Regu-lated removal of critically damaged intestinal cellsseemed to follow maximum MT induction, therebyresisting toxic dietary Cd exposure and preservingtissue integrity.
In summary, the intestine was found to be theinitial site for dietary Cd accumulation in Atlanticsalmon, followed by the kidney and liver, andsubsequently the gills. Muscle contamination waslow and occurred only at highest dietary concen-tration after 1 month of exposure; however, after4 months, fish exposed to dietary Cd concentra-tions of 5 mg Cd kgy1 also had elevated muscle-Cdlevels. These results show that fillet contamina-tion by Cd occurs at relatively low feed concen-
Žtrations 10-fold the current maximum limit iny1 .fish feed of 0.5 mg Cd kg . However, Norwe-
gian commercial fish feeds contain, on average,0.14"0.07 mg Cd kgy1. Growth responses areinsensitive and require long-term exposure stud-ies. In contrast, the biomarkers used in the pre-sent study have potential as early, sensitive indi-
Ž .cators of dietary Cd exposure metallothioneins
Žand toxic effects regulated cell death and prolif-.eration . Based on the biomarker of exposure
Ž .MT , tolerable levels of Cd in fish feeds could bey1 Žset at 7 mg Cd kg median effective concentra-
.tion, EC . In addition, no significant increase of50
Žtoxic effects in biomarkers cell proliferation or.apoptosis was observed in fish exposed to 5 mg
Cd kgy1. Since cadmium concentrations in Nor-wegian commercial feeds normally vary from 0.06
y1 Žto 0.32 mg kg unpublished data from 55 Nor-.wegian commercial feed samples in 1999 , it is
unlikely that cultured fish are exposed to toxicdietary Cd concentrations. In natural, contami-nated environments, invertebrates with Cd con-centrations of 55 mg kgy1 have been reportedŽ .Mount et al., 1994 , thus exceeding the presentthreshold concentration of toxic dietary Cd expo-
Ž y1 .sures 7 mg kg .
References
Adams, S.M., Shepard, K.L., Greeley, M.S. et al., 1989.The use of bioindicators for assessing the effects ofpollutant stressing fish. Mar. Environ. Res. 28,459]464.
S., 1998. Cortisol protects against copper-inducednecrosis and promotes apoptosis in fish gill chloridecells in vitro. Aquat. Toxicol. 40, 193]202.
Cattani, O., Serra, R., Isani, G., Raggi, G., Cortesi, P.,Carpene, E., 1996. Correlation between metal-lothionein and energy metabolism in sea bass, Di-centrarchus labrax, exposed to cadmium. Comp.Biochem. Physiol. 113C, 193]199.
( )M.H. Berntssen et al. r Comparati e Biochemistry and Physiology Part C 128 2001 299]310 309
Chan, K.M., Davidson, W.S., Fletcher, G.L., 1989. Met-allothionein messenger RNA: potential molecularindicator of metal exposure. In: Nriagu, J.O., Lak-
Ž .shminarayana, J.S.S. Eds. , Aquatic Toxicology andWater Quality Management. John Wiley and SonsLtd, New York, pp. 89]109.
Cinier, C.D., Petit-Ramel, M., Faure, R., Garin, D.,Bouvet, Y., 1999. Kinetics of cadmium accumulationand elimination in carp Cyprinus carpio tissues.Comp. Biochem. Physiol. 122C, 345]352.
Dallinger, R., Kautzky, H., 1985. The importance ofcontaminated food for the uptake of heavy metals by
Ž .rainbow trout Salmo gairdneri : a field study. Oe-cologia 67, 82]89.
Elsenhans, B., Schuller, N., Schumann, K., Forth, W.,¨ ¨1994. Oral and subcutaneous administration ofcadmium chloride and the distribution of metal-lothionein and cadmium along the villus]crypt axisin rat jejunum. Biol. Trace Element Res. 42, 179]190.
Foulkes, E.C., 1986. Absorption of Cadmium. SpringerVerlag, Berlin, p. 1986.
George, S.G., Todd, K., Wright, J., 1996. Regulation ofmetallothionein in teleosts: Induction of MTmRNAand protein by cadmium in hepatic and extrahepatic
Žtissues of a marine flatfish, the turbot Scophthalmus.maximus . Comp. Biochem. Physiol. 113C, 109]115.
Guth, D., Engelhardt, W.V., 1989. Is gastrointestinalmucus an ion-selective barrier? In: Chantler, E.,
Ž .Ratcliffe, N.A. Eds. , Mucus and Related Topics.The Company of Biologists, Cambridge, pp. 117]122.
Haesloop, U., Schirmer, M., 1985. Accumulation ofŽorally administered cadmium by the eel Anguilla
.anguilla . Chemosphere 10, 1627]1634.
Hall, P.A., Coates, P.J., Ansari, B., Hopwood, D., 1994.Regulation of cell number in the mammalian gas-trointestinal tract } the importance of apoptosis. J.Cell Sci. 107, 3569]3577.
Handy, R.D., 1992. The assessment of episodic metalpollution. II. The effects of cadmium and copperenriched diets on tissue contamination analysis in
Handy, R.D., 1993. The effect of acute-exposure todietary Cd and Cu on organ toxicant concentrationsin rainbow trout, Oncorhynchus mykiss. Aquat. Toxi-col. 27, 1]14.
Handy, R.D., 1996. Dietary exposure to toxic metals inŽ .fish. In: Taylor, E.W. Ed. , Toxicology of Aquatic
Pollution Physiology, Cellular and Molecular Ap-proaches. Cambridge University Press, Cambridge,pp. 29]61.
Harrison, S.E., Klaverkamp, J.F., 1989. Uptake, elimi-nation and tissue distribution of dietary and aqueous
Žcadmium by rainbow trout Salmo gairdneri Richard-. Žson and lake whitefish Coregonus clupeaformis
.Mitchell . Environ. Toxicol. Chem. 8, 87]97.
Heath, A.G., 1995. Water pollution and fish physiology.Ž .In: Heath, A.C. Ed. , Uptake, Accumulation, Bio-
transformation, and Excretion of Xenobiotics. LewisCRC, New York, pp. 96]97.
Hill, E.F., 1994. Acute and subacute toxicology in eval-uation of pesticide hazard to avian wildlife. In:
Ž .Kendall, R.J., Lacker, T.E. Eds. , Wildlife Toxi-cology and Population Modeling: Integrated Studiesof Agroecosystems. CRC, Boca Raton, Florida, pp.207]224.
Haanstra, L., Doelman, P., 1991. An ecologicaldose]response model approach to short- and long-term effects of heavy metals on arylsulphate in soil.Biol. Fertil. Soils 11, 18]23.
Klaassen, C.D., Liu, J., Choudhuri, S., 1999. Metal-lothionein: an intracellular protein to protect againstcadmium toxicity. Annu. Rev. Pharmacol. Toxicol.39, 267]294.
Koyama, J., Itazawa, Y., 1977. Effects of oral adminis-tration of cadmium on fish } II. Results of morpho-logical examination. Bull. Jpn. Soc. Sci. Fish 43,523]526.
Kraal, M.H., Kraak, M.H., deGroot, C.J., Davids, C.,1995. Uptake and tissue distribution of dietary and
Kumada, H., Kimura, S., Yokote, M., 1980. Accumula-tion and biological effects of cadmium in rainbowtrout. Bull. Jpn. Soc. Sci. Fish 46, 97]103.
Lowry, O.H., Rosebrough, N.J., Farr, A.L., Randall,R.J., 1951. Protein measurement with Folin phenolreagent. J. Biol. Chem. 193, 265]275.
Lundebye, A.K., Berntssen, M.H.G., Wendelaar Bonga,S.E., Maage, A., 1999. Biochemical and physiological
Ž .parameters in Atlantic salmon Salmo salar fol-lowing dietary exposure to copper and cadmium.Mar. Pollut. Bull. 39, 137]144.
Miller, P.A., Lanno, R.P., McMaster, M.E., Dixon, D.G.,1993. Relative contributions of dietary and water-borne copper to tissue copper burdens and water-
Žborne-copper tolerance in rainbow trout Oncor-.hynchus mykiss . Can. J. Fish. Aquat. Sci. 50,
1683]1689.
Mount, D.R., Barth, A.K., Garrison, T.D., 1994. Di-etary and waterborne exposure of rainbow troutŽ .Oncohynchus mykiss to copper, cadmium, lead, andzinc using live diet. Environ. Toxicol. Chem. 13,2031]2041.
Maage, A., Julshamn, K., Andersen, K.-J., 1991. De-termination of selenium in acid digested marinesamples by electrothermal atomic-absorption spec-trometry with continuum source background correc-
( )M.H. Berntssen et al. r Comparati e Biochemistry and Physiology Part C 128 2001 299]310310
tion and nickel as a chemical modifier. J. Anal. At.Spectrom. 6, 277]281.
Odzak, N., Zvonaric, T., 1995. Cadmium and lead up-take from food by the fish Dicentrarchus labrax.Water Sci. Technol. 32, 49]55.
Olafson, R.W., Sim, R.G., 1979. An electrothermalapproach to quantification and characterisation ofmetallothionein. Anal. Biochem. 100, 343]351.
Ž .Mommsen, T.P. Eds. , Biochemistry and MolecularBiology of Fishes. Elsevier, Amsterdam, pp. 259]278.
Olsson, P.E., Haux, C., Foerlin, L., 1987. Variation inhepatic metallothionein, zinc and copper levels dur-ing an annual reproduction cycle in rainbow trout,Salmo gairdneri. Fish Physiol. Biochem. 3, 39]47.
Olsson, P.E., Haux, C., 1996. Influence of seasonalchanges in water temperature on cadmium inducibil-ity of hepatic and renal metallothionein in rainbowtrout. Comp. Biochem. Physiol. 42, 41]44.
Ortego, L.S., Hawkins, W.E., Walker, W.W., Krol, R.M.,Benson, W.H., 1994. Detection of proliferating cellnuclear antigen in tissue of three small fish species.Biotechnol. Histochem. 69, 317]323.
Ž .tion of proliferating cell nuclear antigen PCNA intissues of aquatic animals utilized in toxicity bioas-says. Mar. Environ. Res. 39, 271]273.
Peakall, D., 1992. Animal Biomarkers as Pollution In-dicators. Chapman and Hall, London.
Piechotta, G., Lacorn, M., Lang, T. et al., 1999. Apop-Ž .tosis in dab Limanda limanda as possible new
biomarker for anthropogenic stress. Ecotoxicol. Env-iron. Saf. 42, 50]56.
Potten, C.S., Booth, C., 1997. The role of radiation-in-duced and spontaneous apoptosis in the homeostasisof the gastrointestinal epithelium: a brief review.Comp. Biochem. Physiol. 118B, 473]478.
Pratap, H.B., Wendelaar Bonga, S.E., 1993. Effect ofambient and dietary cadmium on pavement cells,chloride cells, and NaqrKq-ATPase activity in thegills of the freshwater teleost Oreochromis mossam-bicus at normal and high calcium levels in the am-bient water. Aquat. Toxicol. 26, 133]150.
Part, P., Lock, R.A.C., 1983. Diffusion of calcium,¨cadmium and mercury in a mucous solution fromrainbow trout. Comp. Biochem. Physiol. 76C,259]263.
Roch, M., Noonan, P., McCarter, J.A., 1986. Determi-
nation of no-effect levels of heavy metals for rain-
bow trout using hepatic metallothionein. Water Res.6, 771]774.
Romeo, M., Bennani, N., GnassiaBarelli, M., Lafaurie,
M., Girard, J., 2000. Cadmium and copper display
different responses towards oxidative stress in the
kidney of the sea bass Dicentrarchus labrax. Aquat.Toxicol. 48, 185]194.