Effects of Testosterone on Gonadotropins, Testes,and Plasma 17a,20b-dihydroxy-4-pregnene-3-oneLevels in Postbreeding Mature Atlantic Salmon,Salmo salar, Male Parr
EFTHIMIA ANTONOPOULOU,1* IAN MAYER,1 BERTIL BORG,1PENNY SWANSON,2 IRENE MURZA,3 AND OLEG CHRISTOFOROV3
1Department of Zoology, University of Stockholm, S-106 91 Stockholm,Sweden
2Northwest Fisheries Science Center, National Marine Fisheries Service,Seattle, Washington 98112
3Department of Evolutional Physiology, St. Petersburg State University,St. Petersburg, 199034 Russia
In salmonid males, plasma levels of testoster-one (T) and 11-ketotestosterone (11-KT) peak inthe beginning of the spawning season and are thedominant gonadal hormones during spermatogen-esis, whereas 17α,20β-dihydroxy-4-pregnene-3-one(17,20β-P) peaks later during spermiation (e.g.,Bayes and Scott, ’85; Mayer et al., ’90b). Two go-nadotropic hormones (GTHs), GTH I and GTH IIare present in salmonids (Suzuki et al., ’88;Swanson, ’91). GTH I and GTH II can be regardedas homologous with FSH and LH, respectively(Quérat, ’95), although for GTH I-FSH this is stillcontroversial (Hassin et al., ’95). The GTHs dis-play a similar seasonal shift as the steroid hor-mones, with plasma GTH I levels peaking earlierthan GTH II levels in salmonids, including Atlan-tic salmon mature male parr (Borg et al., ’98). Both
gonadotropins stimulate testicular production of11-KT and 17,20β-P in vitro in coho salmon(Oncorhynchus kisutch), but GTH II was more ef-fective than GTH I in stimulating 17,20β-P pro-duction at the late stages of spermatogenesis andspermiation (Planas et al., ’93; Planas and Swan-son, ’95). The onset of GTH II secretion may beinitiated by a positive feedback with T stimulat-ing GTH II production (Crim and Evans, ’79;Swanson and Dickhoff, ’88; Borg et al, ’98).
Grant sponsors: Swedish Natural Research Council, Swedish For-estry and Agricultural Research Council, and Stockholm UniversityEast Europe Exchange Program; Grant sponsor: U.S. Department ofAgriculture; Grant number: 93-37203-9409.
*Correspondence to: Efthimia Antonopoulou, Equipe d’Endocrinol-ogie Moleculaire de la Reproduction, UPRES-A CNRS 6026, Universitéde Rennes 1, Campus de Beaulieu, 35042 Rennes Cedex, France.E-mail: [email protected]
Received 16 December 1998; Accepted 6 January 1999.
426 E. ANTONOPOULOU ET AL.
At the end of the spawning season, the levels of17,20β-P decrease. However, the mechanism be-hind this is not known. One possibility is that con-tinued 17,20β-P-secretion requires the continuedpositive feedback of T on GTH II secretion,whereas a decline in T would result in a cessa-tion of the positive feedback and, thus, a decreasein GTH II and consequently in 17,20β-P. In orderto study whether the postspawning decline in17,20β-P levels could be related to declining T lev-els, mature running male parr were treated withSilastic implants containing T in the breeding sea-son or at its end and the effects on pituitary andplasma gonadotropin levels, relative gonadalweight, testes histology, presence of milt andplasma levels of 11-KT and 17,20β-P in the post-breeding period were studied.
MATERIALS AND METHODSExperimental protocol
Two-summer-old mature male salmon parr,reared at the Älvkarleby salmon hatchery in Swe-den (60°N, 17°E), were used in this study. Thefish had matured sexually for the first time, andall had running milt at the start of the experi-ments. The fish were randomly divided into therespective experimental groups and implantedwith either empty Silastic (Dow Corning, Midland,MI) capsules (outer diameter 2.4 mm, length 10mm) sealed with silicone glue, or capsules filledwith T (Sigma Chemical Co., St. Louis, MO) intothe abdominal cavity through a c. 2 mm long in-cision, under c. 0.1% 2-phenoxyethanol (FlukaChemie AG, Buchs, Switzerland) anaesthesia. Inaddition, the fish were also implanted with a pas-sive integrated transponder (PIT) tag (Destron,Boulder, CO) for identification (Prentice et al., ’90).Three experiments were carried out. In experi-ment one and two, the fish were implanted withT capsules in two different sizes (1.2 mm diam-eter, 3 mm long, referred to as T3, or 2.4 mm × 10mm, referred to as T10), whereas in experimentthree, only T10 capsules were used.
In experiment one, fish were implanted on 8November 1993. Half of the fish were dissectedon 21 January 1994, and the others on 3 March1994. Initial controls were sampled at the timeof implantation.
In the second experiment, the fish were im-planted on 8 November 1995, and dissected on 23April 1996. At the time of implantation, initialcontrols were also sampled.
After the operation, the fish in experiments one
and two were transferred to a 2 m3 tank suppliedwith through-flowing river water and kept under asimulated natural photoperiod. At the start of theexperiments the water temperature was 2°C anddeclined to 0°C by the end of November where itremained for the rest of the experimental period.The fish were fed to satiation with commercialsalmon food (Ewos Ltd., Westfield, Scotland), usingan automatic feeder.
In experiment three, the fish had been trans-ported from the hatchery to the University ofStockholm and transferred to an aquarium con-taining 700 liters of tap water. The fish were im-planted on 20 December 1997. The water wasconstantly aerated and filtered and partial waterchanges were carried out frequently. The fish werekept under a simulated natural photoperiod,which was adjusted weekly. Temperature waskept at 7–8°C during the experimental period.The fish were fed daily with chopped fish. Theexperiment was terminated on 21 April 1998.
At the time of sampling the fish were anaesthe-tized, the length and weight were recorded for eachfish, and the presence of running milt was checked.The volume of milt that could be manually strippedat the end of experiment two was also measured,using graded collecting tubes. Care was taken thaturine did not contaminate these samples. In thisexperiment, sperm motility was also assessed andclassified according to Kazakov (’81). One drop ofice-cold river water was put on a slide under themicroscope. A minute sample of milt was broughtinto this water with a needle follow by rapid mix-ing. Sperm motility was immediately classified intothe closest of the following five categories: (1) allspermatozoa immobile, (2) 70–75% immobile, no orfew with translational motion, (3) 30–40% with onlyoscillatory movements, the rest with translationalmotions, (4) most spermatozoa move translationally,10–15% oscillatory, and (5) all spermatozoa fullymotile. Spermatocrit/sperm concentrations were notdetermined. Blood samples were taken by severingthe caudal peduncle. The blood was collected in he-parinized tubes, which were kept on ice (max. 10min) until centrifugation, after which the plasmawas drawn off, frozen on dry ice and stored at–70°C. Testes were excised and weighed to deter-mine the gonadosomatic index [GSI = (gonadweight/total weight) × 100]. In experiments two andthree, pituitaries were collected, frozen on dry ice,and stored at –70°C.
HistologyThe mid-portion of one gonad from each fish from
experiments one and two was fixed in Bouin’s solu-
TESTOSTERONE EFFECTS IN POSTBREEDING SALMON MALES 427
tion. The tissues were dehydrated in ethanol,cleared in xylene and embedded in Histosec (MerckKGaA, Darmstadt, Germany). Transverse sections(5 µm) were cut and stained with Heidenhain’shaematoxylin. Quantitative testes histology wasstudied according to Murza and Christoforov (’93).The height of 20 Sertoli cells in each fish were mea-sured using an ocular micrometer at a final magni-fication of 945×. The mean height was used. Themaximal (D) and minimal diameters (d) of 50 Ser-toli cells in each fish were similarly measured, andnuclear volumes were calculated according to theformula: v = π/6 × (D × d)1.5. The proportion of sec-tions occupied by spermatozoa was estimated bycounting the occupancy of squares in an ocular grid.Phagocytotic activity of Sertoli cells was assessedas: absent, weak, intermediate, high, and completedphagocytosis.
Gonadotropic hormone measurementsPituitary and plasma gonadotropin levels were
measured by heterologous radioimmunoassays(RIA) for Coho salmon gonadotropins using themethod of Swanson et al. (’89). The GTH I RIAhas a cross-reactivity of 6.6% with Coho salmonGTH II, whereas the GTH II RIA does not cross-react with GTH I (<0.1%). Neither RIA cross-re-acts with growth hormone, somatolactin, prolactinor thyroid-stimulating hormone. Each pituitarywas sonicated in 0.3 ml 0.075 M sodium barbital,10 mM ethylenediaminetetraacetic acid (EDTA),1.0 mM phenylmethylsulfonyl fluoride (PMSF),pH 8.6, and centrifuged at 10,000g. The superna-tant was assayed for both GTH I and GTH II.Serial dilutions of Atlantic salmon pituitary ex-tracts showed displacement curves parallel to di-lution curves obtained with purified Coho salmonGTH I and GTH II, respectively, in the RIAs (datanot shown). Parallelism was also found both forserial dilutions of pituitary and plasma samplesfrom Atlantic salmon using the same RIA in an-other study (Oppen-Berntsen et al., ’94). The de-tection limit for plasma GTH I levels was 0.4 ng/ml; for GTH II levels, it was 0.09 ng/ml. Due tosmall plasma volumes all hormones could not bemeasured in the same samples. Plasma gonado-tropins were measured in experiment three alone.
Steroid hormone measurementsSteroid levels were measured by RIA. Prior to
RIA, individual plasma samples (c. 100–200 µL)were mixed with Milli-Q water (containing 0.05%NaN3) in the ratio 1:2, and heat-treated for 1 h at
80°C. After centrifugation the supernatant wasdrawn off and kept cold during the period of ste-roid determination. Plasma levels of T and 11-KTwere measured using specific RIAs as describedby Schulz (’85) and for 17,20β-P according toMayer et al. (’90a). The cross-reactivities of thedifferent steroid antisera are given in Schulz (’85),the exception being 11-KT which cross-reacts asfollows: 3.0% for T and <1.0% for 17,20β-P. Theintra- and inter-assay coefficients of variation for5 ng/ml samples in the Stockholm laboratory are2.4 and 6.4% respectively for T, 3.6 and 7.5% for11-KT, and 3.8 and 8.6% for 17,20β-P; the coeffi-cients for T and 11-KT are similar to those ob-tained by Schulz (’85). All samples from eachexperiment were measured in one assay. Measure-ment of all three steroids in all samples was notpossible due to small plasma volumes. In experi-ment two and three, 11-KT was not measured asit was considered of least interest because it wasvery low in all samples in experiment one (exceptinitial controls). 17,20β-P and T were measuredin all the samples in experiments one and two,whereas in experiment three plasma was suffi-cient for measurement of 17,20β-P and T only insome samples.
RESULTSSize and growth
The initial controls in experiment one werelarger than the other groups (Table 1). Apart fromthis, there were no significant differences in lengthand weight between groups. In experiment two,length and weight were measured individuallyboth at the onset and the termination. Averageweight declined c. 8 g in all groups in this experi-ment, whereas average lengths increased 6 ± 1mm in controls, 3 ± 1 mm in T3 fish and 4 ± 1 inT10 fish. The increase was lower in T-treatedgroups than in the controls (P < 0.01 in both com-parisons, Mann-Whitney U-test).
Gonadal weight and milt productionThe initial fish were mature with running milt
and had relatively high GSIs (Table 1). In experi-ment one, GSIs remained high over the entire ex-perimental period, and there were no significantdifferences between groups (ANOVA). In experi-ment two, on the other hand, there was a differ-ence in GSIs between groups over the entireexperimental period (df = 3.87, F = 16.92, P <0.001, ANOVA). Compared to the initial controls,GSIs decreased in all treatments (P < 0.001 for
428 E. ANTONOPOULOU ET AL.
controls, P < 0.01 for T3, Mann-Whitney U-test).Among the final control fish in experiment two,the GSIs were higher in males with running milt(2.81 ± 0.27, n = 6) than in non-running males(1.69 ± 0.18, n = 23, P < 0.05, Mann-Whitney U-test). The GSIs of both T-treated groups werehigher than controls in experiment two (P < 0.01against T3, P < 0.001 against T10, Mann-WhitneyU-test), but the T-treated groups were not differ-ent from each other. Also in experiment three, T10treated fish had higher GSIs than the controlmales (P < 0.002, Mann-Whitney U-test).
All fish were spermiating at the onset of theexperiments. In experiment one, all T-treated fishproduced milt at the time of sampling. This wasnot the case for the controls. At the first and sec-ond sampling, 5 out of 12 fish and 1 out of 12fish, respectively, were non-running. The differ-ence in frequency of fish with running milt be-tween control and T10-treated fish at the firstsampling was significant (P < 0.05, Yates’ chi-square). At the termination of experiment two,23 out of 29 control fish no longer displayed run-ning milt, whereas only 2 out of 24 and 1 out of26 were non-running in T3- and T10-treatedgroups respectively. The difference in proportionof running fish between the control and each ofthe T groups in experiment two was significant
(P < 0.001 for both comparisons, Yates’ chi-square). In experiment two, the volume of miltthat could be stripped was much smaller in therunning controls (0.13 ± 0.07 mL, non-runningfish excluded from calculation) than in T3 (1.01± 0.22 mL, P < 0.001 towards running controls,Mann-Whitney U-test) and T10 (1.09 ± 0.13 mL,P < 0.001, Mann-Whitney U-test) treated fish.Sperm motility was studied in the final groupsin experiment two. In all 6 of the running malesin the control group, sperm was non-motile. Mostmales in the T-treated groups displayed motilesperm (Table 2), although also in these groupsmotility levels were often low. There was no dif-ference in the sperm motility between the T3- andT10-treated fish. At the termination of experimentthree, 12 out of 14 control fish no longer displayedrunning milt, whereas only 1 out of 13 T10-treated males was non-running. The differencein proportion of running fish between the controland the T10-group in experiment three was sig-nificant (P < 0.001, Yates’ chi-square).
Histology of testesSpermatocytes could be found in 4 out of 10
males in the initial controls in experiment one,occupying about 1% of the total area of the tu-bule lumina, except in one specimen, where a few
TABLE 1. Mean length, mass, and gonadosomatic index (GSI) of salmon parr implanted with 3- or 10-mmlong capsules filled with testosterone (T3 and T10) or empty capsules1
1Means ± SEMs shown. Different from initials; a = P < 0.001 and b = P < 0.01; different from controls; ** = P < 0.01, *** = P < 0.001, Mann-Whitney U-test.
TESTOSTERONE EFFECTS IN POSTBREEDING SALMON MALES 429
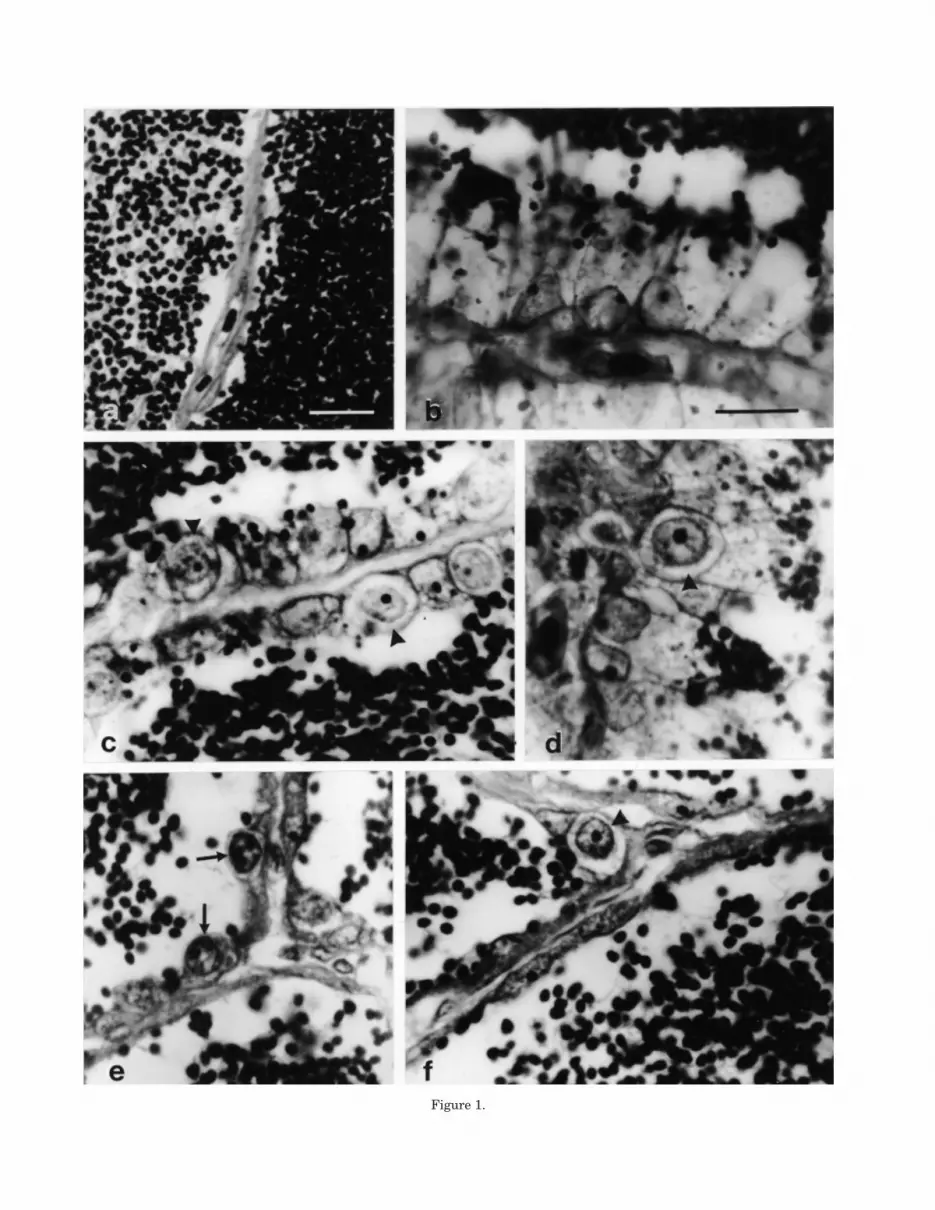
percent were occupied. Spermatocytes werefound in no other fish. Spermatids were ob-served in 7 out of 10 initial controls, usuallyoccupying 5% of the total area. Furthermore,spermatozoa still present within cysts were ob-served in all fish in this group. On average17.5% of the tubule lumina were occupied withcysts containing spermatozoa and sometimesalso spermatocytes and spermatids. A few cystswith spermatids-spermatozoa were found in onecontrol fish at the first sampling in experimentone. Apart from that, excepting the initial con-trols, the only germ cells present in experimentsone and two were type A spermatogonia (Fig.1e and f), which were found in all groups, andfree spermatozoa (Fig. 1). The mean area occu-pied by spermatozoa was 77–91% for all groups,with no significant group effect (ANOVA) in ex-periment one. In experiment two, the area oc-cupied by spermatozoa was lower in the controls(45 ± 6%) than in the T3-treated group (66 ±5%, P < 0.01, Mann-Whitney U-test, overallgroup effect P < 0.05 ANOVA). The T10 treatedgroup (55 ± 6%) was not significantly differentfrom the other groups. In 4 out of 29 controlmales in experiment two, spermatozoa had com-pletely disappeared from the testes.
There was an overall difference (P < 0.001,ANOVA in both experiments) among the groupsin both Sertoli cell nuclear volumes and Sertolicell heights (Table 3). In experiment one, bothnuclear volumes and cell heights increased overthe course of the experiments in controls (Fig. 1a–d) and T3-treated fish (for significance levels, seeTable 3), but not in T10-treated fish (Fig. 1e andf). There was no significant difference betweentreatments at the first sampling in experimentone; at the final sampling, both measures werelower in the T10 group than in the controls orthe T3 treatment (P < 0.001 in all four compari-sons, Mann-Whitney U-test). In experiment two,Sertoli cell nuclear volumes and heights werehigher in controls than in both the T3 and T10groups (P < 0.001 in all four comparisons, Mann-
Whitney U-test), but not different between the T3and T10 groups. At the end of the experiments,the Sertoli cells displayed high phagocytotic ac-tivity in most control fish (Table 4). The phagocy-totic activities were lower in the T3-treated groupsthan in the controls (experiment one, P < 0.01 atboth samplings; experiment two, P < 0.001) andT10 (P < 0.001 in all three comparisons); at thesecond sampling in experiment one the phagocy-totic activity was lower in T3 than in T10.
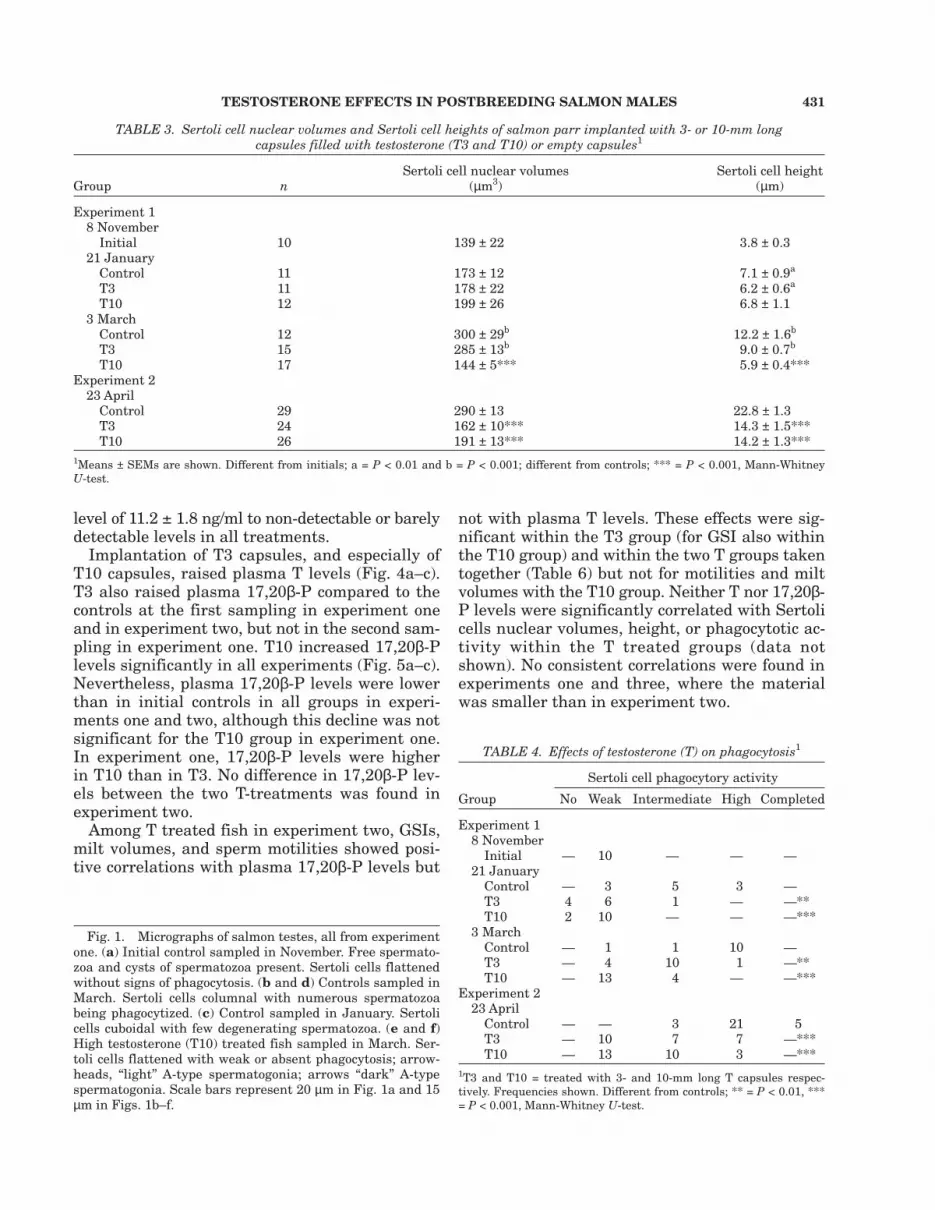
Gonadotropic hormonesPituitary GTH I content was not different be-
tween controls and T-treated groups at the end ofthe experiment two and three, whereas it washigher in the T3 than in the T10 group in experi-ment two (Fig. 2a,b). T10 fish had lower plasmaGTH I levels than the control in experiment three(Fig. 2b).
GTH II pituitary content was higher in the ini-tial than in the final controls in experiment two(Fig. 3a). At the end of this experiment, the pitu-itary GTH II contents were higher in the T3 andT10 fish than in the controls (Fig. 3a). Further,T10 treatment resulted in higher GTH II pitu-itary contents (Fig. 3b) than in the controls in ex-periment three. In this experiment, plasma GTHII levels were non-detectable in all control fish,whereas they were above the detection thresholdin all T10 fish (Table 5).
Pituitary GTH I and GTH II contents per grambody weight were also calculated (data not shown).The results were similar to the absolute pituitarycontents except that T10 treated fish had higherrelative pituitary GTH II levels than the T3treated fish in experiment two (P < 0.05, Mann-Whitney U-test).
Plasma levels of 17,20b-P, 11-KT and TIn experiments one and two, plasma levels of T
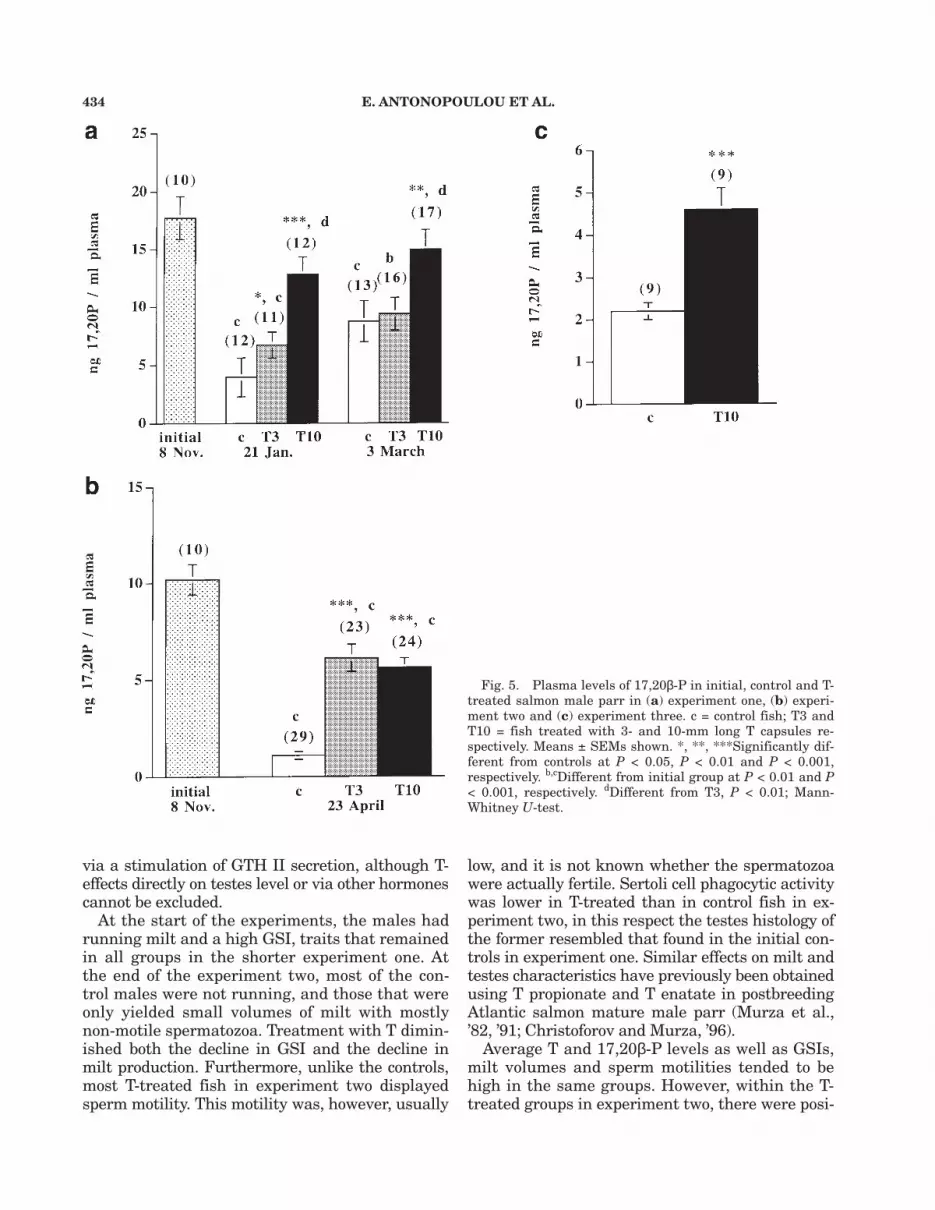
(Fig. 4a and b) and 17,20β-P declined (Fig. 5a andb) over the experimental period.
Plasma levels of 11-KT, which were only mea-sured in experiment one, declined from an initial
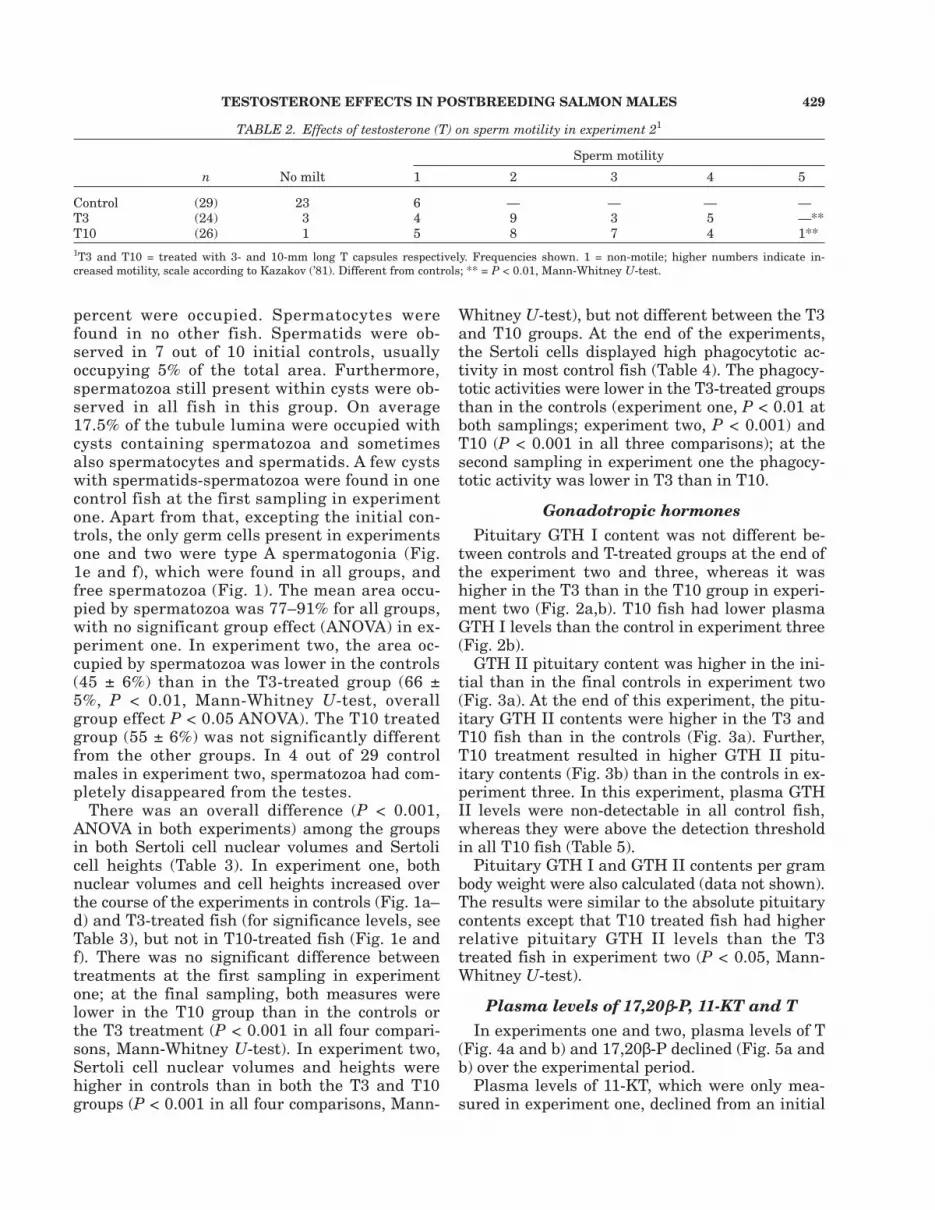
TABLE 2. Effects of testosterone (T) on sperm motility in experiment 21
Sperm motilityn No milt 1 2 3 4 5
Control (29) 23 6 — — — —T3 (24) 3 4 9 3 5 —**T10 (26) 1 5 8 7 4 1**1T3 and T10 = treated with 3- and 10-mm long T capsules respectively. Frequencies shown. 1 = non-motile; higher numbers indicate in-creased motility, scale according to Kazakov (’81). Different from controls; ** = P < 0.01, Mann-Whitney U-test.
430 E. ANTONOPOULOU ET AL.
Figure 1.
TESTOSTERONE EFFECTS IN POSTBREEDING SALMON MALES 431
level of 11.2 ± 1.8 ng/ml to non-detectable or barelydetectable levels in all treatments.
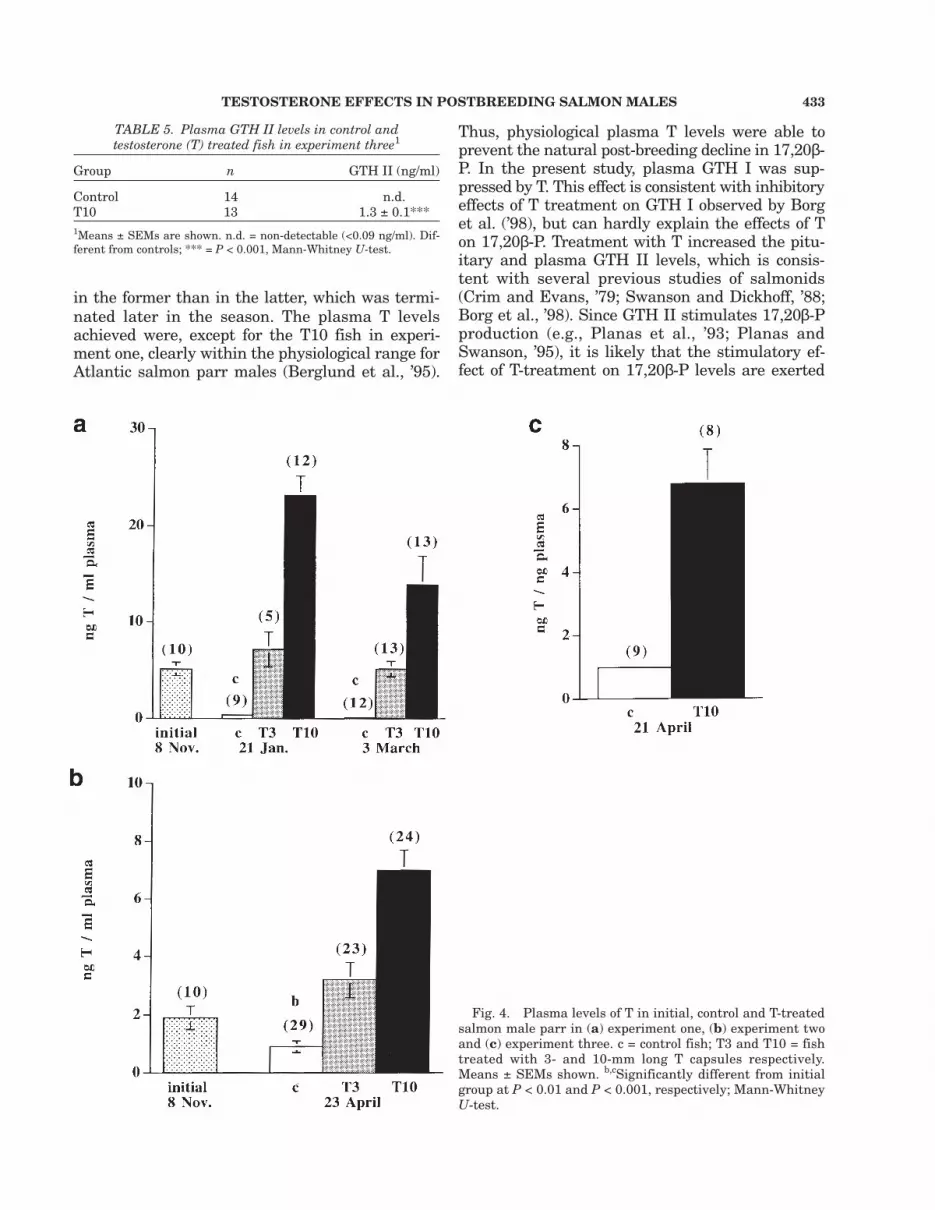
Implantation of T3 capsules, and especially ofT10 capsules, raised plasma T levels (Fig. 4a–c).T3 also raised plasma 17,20β-P compared to thecontrols at the first sampling in experiment oneand in experiment two, but not in the second sam-pling in experiment one. T10 increased 17,20β-Plevels significantly in all experiments (Fig. 5a–c).Nevertheless, plasma 17,20β-P levels were lowerthan in initial controls in all groups in experi-ments one and two, although this decline was notsignificant for the T10 group in experiment one.In experiment one, 17,20β-P levels were higherin T10 than in T3. No difference in 17,20β-P lev-els between the two T-treatments was found inexperiment two.
Among T treated fish in experiment two, GSIs,milt volumes, and sperm motilities showed posi-tive correlations with plasma 17,20β-P levels but
not with plasma T levels. These effects were sig-nificant within the T3 group (for GSI also withinthe T10 group) and within the two T groups takentogether (Table 6) but not for motilities and miltvolumes with the T10 group. Neither T nor 17,20β-P levels were significantly correlated with Sertolicells nuclear volumes, height, or phagocytotic ac-tivity within the T treated groups (data notshown). No consistent correlations were found inexperiments one and three, where the materialwas smaller than in experiment two.
TABLE 3. Sertoli cell nuclear volumes and Sertoli cell heights of salmon parr implanted with 3- or 10-mm longcapsules filled with testosterone (T3 and T10) or empty capsules1
Sertoli cell nuclear volumes Sertoli cell heightGroup n (µm3) (µm)
1T3 and T10 = treated with 3- and 10-mm long T capsules respec-tively. Frequencies shown. Different from controls; ** = P < 0.01, ***= P < 0.001, Mann-Whitney U-test.
Fig. 1. Micrographs of salmon testes, all from experimentone. (a) Initial control sampled in November. Free spermato-zoa and cysts of spermatozoa present. Sertoli cells flattenedwithout signs of phagocytosis. (b and d) Controls sampled inMarch. Sertoli cells columnal with numerous spermatozoabeing phagocytized. (c) Control sampled in January. Sertolicells cuboidal with few degenerating spermatozoa. (e and f)High testosterone (T10) treated fish sampled in March. Ser-toli cells flattened with weak or absent phagocytosis; arrow-heads, “light” A-type spermatogonia; arrows “dark” A-typespermatogonia. Scale bars represent 20 µm in Fig. 1a and 15µm in Figs. 1b–f.
432 E. ANTONOPOULOU ET AL.
Fig. 2. Pituitary levels of GTH I in initial, control and Ttreated salmon male parr in (a) experiment two and pitu-itary and plasma GTH I levels in control and T treated salmonmale parr in (b) experiment three. T3 and T10 = fish treated
with 3- and 10-mm long T capsules respectively. Means ±SEMs shown. *Significantly different from controls, P < 0.05;aSignificantly different from T10, P < 0.05; Mann-WhitneyU-test.
Fig. 3. Pituitary levels of GTH II in initial, control and Ttreated salmon male parr in (a) experiment two and (b) ex-periment three. T3 and T10 = fish treated with 3- and 10-mm long T capsules respectively. Means ± SEMs shown.
***Significantly different from controls, P < 0.001; b,cDifferentfrom initial group, at P < 0.01 and P < 0.001, respectively;Mann-Whitney U-test.
DISCUSSIONIn the control fish, plasma levels of T and 17,20β-
P declined over the experimental periods, which isin general agreement with Mayer et al. (’90b). Apartfrom the T3 fish at the second sampling in experi-
ment one, fish treated with T capsules had signifi-cantly higher 17,20β-P levels than control fish. It isprobable that the more limited effect of T3 in ex-periment one than in experiment two is due to thefact that 17,20β-P levels in the controls were higher
TESTOSTERONE EFFECTS IN POSTBREEDING SALMON MALES 433
TABLE 5. Plasma GTH II levels in control andtestosterone (T) treated fish in experiment three1
Group n GTH II (ng/ml)
Control 14 n.d.T10 13 1.3 ± 0.1***1Means ± SEMs are shown. n.d. = non-detectable (<0.09 ng/ml). Dif-ferent from controls; *** = P < 0.001, Mann-Whitney U-test.
Fig. 4. Plasma levels of T in initial, control and T-treatedsalmon male parr in (a) experiment one, (b) experiment twoand (c) experiment three. c = control fish; T3 and T10 = fishtreated with 3- and 10-mm long T capsules respectively.Means ± SEMs shown. b,cSignificantly different from initialgroup at P < 0.01 and P < 0.001, respectively; Mann-WhitneyU-test.
in the former than in the latter, which was termi-nated later in the season. The plasma T levelsachieved were, except for the T10 fish in experi-ment one, clearly within the physiological range forAtlantic salmon parr males (Berglund et al., ’95).
Thus, physiological plasma T levels were able toprevent the natural post-breeding decline in 17,20β-P. In the present study, plasma GTH I was sup-pressed by T. This effect is consistent with inhibitoryeffects of T treatment on GTH I observed by Borget al. (’98), but can hardly explain the effects of Ton 17,20β-P. Treatment with T increased the pitu-itary and plasma GTH II levels, which is consis-tent with several previous studies of salmonids(Crim and Evans, ’79; Swanson and Dickhoff, ’88;Borg et al., ’98). Since GTH II stimulates 17,20β-Pproduction (e.g., Planas et al., ’93; Planas andSwanson, ’95), it is likely that the stimulatory ef-fect of T-treatment on 17,20β-P levels are exerted
434 E. ANTONOPOULOU ET AL.
Fig. 5. Plasma levels of 17,20β-P in initial, control and T-treated salmon male parr in (a) experiment one, (b) experi-ment two and (c) experiment three. c = control fish; T3 andT10 = fish treated with 3- and 10-mm long T capsules re-spectively. Means ± SEMs shown. *, **, ***Significantly dif-ferent from controls at P < 0.05, P < 0.01 and P < 0.001,respectively. b,cDifferent from initial group at P < 0.01 and P< 0.001, respectively. dDifferent from T3, P < 0.01; Mann-Whitney U-test.
via a stimulation of GTH II secretion, although T-effects directly on testes level or via other hormonescannot be excluded.
At the start of the experiments, the males hadrunning milt and a high GSI, traits that remainedin all groups in the shorter experiment one. Atthe end of the experiment two, most of the con-trol males were not running, and those that wereonly yielded small volumes of milt with mostlynon-motile spermatozoa. Treatment with T dimin-ished both the decline in GSI and the decline inmilt production. Furthermore, unlike the controls,most T-treated fish in experiment two displayedsperm motility. This motility was, however, usually
low, and it is not known whether the spermatozoawere actually fertile. Sertoli cell phagocytic activitywas lower in T-treated than in control fish in ex-periment two, in this respect the testes histology ofthe former resembled that found in the initial con-trols in experiment one. Similar effects on milt andtestes characteristics have previously been obtainedusing T propionate and T enatate in postbreedingAtlantic salmon mature male parr (Murza et al.,’82, ’91; Christoforov and Murza, ’96).
Average T and 17,20β-P levels as well as GSIs,milt volumes and sperm motilities tended to behigh in the same groups. However, within the T-treated groups in experiment two, there were posi-
TESTOSTERONE EFFECTS IN POSTBREEDING SALMON MALES 435
TABLE 6. Correlations between testosterone (T) and17a,20b-dihydroxy-4-pregnene-3-one (17,20P) levels,gonadosomatic index (testes mass/body mass ´ 100),
milt volumes and sperm motility inT-treated fish in experiment two1
1Spearman rank correlation coefficients shown: * = P < 0.05, ** = P <0.01, ns = nonsignificant.2Classified according to Kazakov (’81). See Materials and Methods.
tive correlations between individual GSI, milt vol-ume and sperm motility values and 17,20β-P lev-els, but not between these parameters and Tlevels. Thus, although direct effects of T on miltproduction, GSI and sperm motility cannot be ex-cluded, an indirect stimulation via 17,20β-P ap-pears more likely. The latter possibility is alsomore consistent with previous studies on salmo-nids which have shown a closer natural correla-tion between spermiation and 17,20β-P levels thanwith androgen levels (Baynes and Scott, ’85) anda higher effectiveness of 17,20β-P than of T or 11-KT in inducing spermiation in short-term experi-ments (Ueda et al., ’85). The different measureson Sertoli cells, on the other hand, did not corre-late with either T or 17,20β-P within the T-treatedgroups. Thus, the mechanism by which T-treat-ment influences Sertoli cells might be differentthan that controlling milt production.
The following model is proposed for the termi-nation of the natural breeding season in itero-parous salmonids: plasma levels of GTH I declinein autumn (Prat et al., ’96; Borg et al., ’98). Thisdecline is not due to gonadal feedbacks, sinceplasma GTH I also declines in castrated fish inautumn (Borg et al., ’98). Lowered GTH I levelsmay in turn lead to a decline in androgen levels.Plasma levels of GTH II and 17,20β-P, on the otherhand, rise in late autumn (Mayer et al., ’90b; Borget al., ’98). This rise in GTH II levels is likely tobe dependent on a positive feedback of T from thetestes, as it does not occur in long-term castratedmales (Borg et al., ’98). At the end of the breeding
season, levels of GTH II and 17,20β-P as well astestes function decline. The observations in thepresent study that these declines could be pre-vented, or at least diminished, with T treatmentsuggests that these declines are a consequence oflowered T levels. With declining T levels, the posi-tive feedback on GTH II ceases and GTH II levelsdecline. In consequence, since 17,20β-P productionis GTH II dependent (Planas et al., ’93; Planas andSwanson, ’95), plasma 17,20β-P levels and male re-productive characters dependent on 17,20β-P willalso decline.
ACKNOWLEDGMENTSSupported by the Swedish Natural Science Re-
search Council (to B.B.), the Swedish Forestry andAgricultural Research Council (to I.M.), the U.S.Department of Agriculture (93-37203-9409, to PS)and by the Stockholm University East Europe Ex-change Program. We thank the staff at the Fish-eries Research Station at Älvkarleby for supplyingand taking care of fish. Thanks are also due toDr. Rüdiger W. Schulz, Utrecht, for providing ste-roid antisera.
LITERATURE CITEDBaynes SM, Scott AP. 1985. Seasonal variations in param-
eters of milt production and in plasma concentration of sexsteroids of male rainbow trout Salmo gairdneri. Gen CompEndocrinol 57:150–160.
Berglund I, Antonopoulou E, Mayer I, Borg B. 1995. Stimu-latory and inhibitory effects of testosterone on testes in At-lantic salmon male parr. J Fish Biol 47:586–598.
Borg B, Antonopoulou E, Mayer I, Andersson E, Berglund I,Swanson P. 1998. Effects of gonadectomy and androgentreatments on pituitary and plasma levels of gonadotropinsin mature male Atlantic salmon, Salmo salar, parr: posi-tive feedback control of both gonadotropins. Biol Reprod58:814–820.
Christoforov OL, Murza IG. 1996. Effects of the androgenpreparation “Testoenatum” on reproductive function inmales of Atlantic salmon and several species of whitefish.Aquat Liv Res 9:31–41.
Crim LW, Evans DM. 1979. Stimulation of pituitary gonado-tropin by testosterone in juvenile rainbow trout (Salmogairdneri). Gen Comp Endocrinol 37:192–196.
Hassin S, Elizur A, Zohar Y. 1995. Molecular cloning and se-quence analysis of striped bass (Morone saxatilis) gonado-trophin-I and -II subunits. Mol Endocrinol 15:23–35.
Kazakov RV. 1981. Methods of studying sexual products offish males. In: Zajanchkauskas PA, Volskis RS, BarsukovVV, Kudersky LA, Petrauskas VV, Sventizkene VS, Shatu-novsky MI, editors. Standard methods for research on theproductivity of fish species within their areas. Part IV.Leningrad: Gos NIORCh. p 108–118 (in Russian).
Mayer I, Berglund I, Rydevik M, Borg B, Schulz R. 1990a.Plasma levels of five androgens and 17α-hydroxy-20β-dihydroprogesterone in immature and mature maleBaltic salmon (Salmo salar) parr, and the effects of cas-
436 E. ANTONOPOULOU ET AL.
tration and androgen replacement in mature parr. CanJ Zool 68:263–267.
Mayer I, Lundqvist H, Berglund I, Schmitz M, Schulz R, BorgB. 1990b. Seasonal endocrine changes in Baltic salmon(Salmo salar) immature parr and mature male parr: I.Plasma levels of five androgens and 17α-hydroxy-20β-dihydroprogesterone, and 17β-estradiol. Can J Zool 68:1360–1365.
Murza IG, Kazakov RV, Christoforov OL. 1982. Influence ofsex steroids on the dwarf males of Atlantic salmon, Salmosalar L. In: Kazakov RV, editor. Proceedings of the StateResearch Institute on Lake and River Fisheries (Gos-NIORCh). GosNIORCh Leningrad 183:90–106 (in Russianwith English summary).
Murza IG, Christoforov OL, Feldkoren BI, Osipova EI. 1991.Sex steroids binding by the cytosols of some target-tissuesof Atlantic salmon, Salmo salar L: II. Analysis of testoster-one specific binding in the cytosols of gonads and brain ofAtlantic salmon in connection with the formation of twotypes of dwarf males. In: Kazakov RV, editor. Proceedingsof the State Research Institute on Lake and River Fisher-ies (GosNIORCh). GosNIORCh Leningrad 307:69–85(in Russian).
Murza IG, Christoforov OL. 1993. Estimation of degree ofmaturity of gonads and prediction of age of attainmentof sexual maturity in Atlantic salmon and sea trout(methodological instructions). Can Transl Fish Aquat Sci5599:106.
Oppen-Berntsen DO, Olsen SO, Rong CJ, Taranger GL,Swanson P, Walther BT. 1994. Plasma levels of eggshell Zr-proteins, estradiol-17β and gonadotropins during an annualreproductive cycle of Atlantic salmon (Salmo salar). J ExpZool 268:59–70.
Planas JV, Swanson P. 1995. Maturation-associated changesin the response of the salmon testis to the steroidogenicactions of gonadotropins (GTH I and GTH II) in vitro. BiolReprod 52:697–704.
Planas JV, Swanson P, Dickhoff WW. 1993. Regulation of tes-ticular steroid production in vitro by gonadotropins (GTH I
and GTH II) and cyclic AMP in Coho salmon (Oncorhynchuskisutch). Gen Comp Endocrinol 91:8–24.
Prat F, Sumpter JP, Tyler CR. 1996. Validation of radioim-munoassays for two salmon gonadotropins (GTH I and GTHII) and their plasma concentrations throughout the repro-ductive cycle in male and female rainbow trout (Oncorhyn-chus mykiss). Biol Reprod 54:1375–1382.
Prentice EF, Flagg TA, McCutcheon CS, Brastow DF, Mc-Cutcheon CA. 1990. Equipment, methods, and automateddata-entry for PIT-tagging. Amer Fish Soc Symp 7:335–340.
Quérat B. 1995. Structural relationships between “fish” andtetrapod gonadotropins. In: Goetz FW, Thomas P, editors.Proceedings of the Fifth International Symposium on theReproductive Physiology of Fish. University of Texas atAustin, Austin, Texas, USA, 2–8 July 1995. Fish Symp ’95,Austin. p 7–9.
Schulz R. 1985. Measurement of five androgens in the bloodof immature and mature male rainbow trout, Salmogairdneri (Richardson). Steroids 46:717–726.
Suzuki K, Kawauchi H, Nagahama Y. 1988. Isolation andcharacterization of two distinct gonadotropins from chumsalmon pituitary. Gen Comp Endocrinol 71:292–301.
Swanson P. 1991. Salmon gonadotropins: reconciling old andnew ideas. In: Scott AP, Sumpter JP, Kime DE, Rolfe MS,editors. Proceedings of the Fourth International Symposiumon Reproductive Physiology of Fish, University of EastAnglia, Norwich, UK, 7–12 July 1991. Fish Symp ’91,Sheffield. p 2–7.
Swanson P, Bernard M, Nozaki M, Kawauchi H, Dickhoff WW.1989.Gonadotropins I and II in juvenile Coho salmon. FishPhysiol Biochem 7:169–176.
Swanson P, Dickhoff WW. 1988. Effects of exogenous gonadalsteroids on gonadotropin I and II in juvenile Coho salmon.Am Zool 28:55A.
Ueda H, Kambegawa A, Nagahama Y. 1985. Involvement ofgonadotropin and steroid hormones in spermiation theamago salmon, Oncorhynchus rhodurus, and goldfish,Carassius auratus. Gen Comp Endocrinol 59:24–30.


![Discovery of (2,4-Dihydroxy-5-isopropylphenyl)-[5-(4-methylpiperazin-1-ylmethyl)-1,3-dihydroisoindol-2-yl]methanone (AT13387), a Novel Inhibitor of the Molecular Chaperone Hsp90 by](https://static.documents.page/doc/80x56/634e6be0798215c3b209431c/discovery-of-24-dihydroxy-5-isopropylphenyl-5-4-methylpiperazin-1-ylmethyl-13-dihydroisoindol-2-ylmethanone.jpg)

