Environmental Engineering and Management Journal November 2015, Vol.14, No. 11, 2653-2660 http://omicron.ch.tuiasi.ro/EEMJ/ “Gheorghe Asachi” Technical University of Iasi, Romania USING GIS AS A SUPPORT TOOL FOR ASSESSING THE REMEDIATION METHODS APPLIED IN ACCIDENTAL OIL SPILLS Delia Popescu, Giuliano Tevi, Mihaela Vasilescu , Florian Grigore Rădulescu Ecological University of Bucharest, Faculty of Ecology and Environmental Protection, 1G Vasile Milea, Sector 6, 061341 Bucharest, Romania Abstract Accidental oil spills represent one of the environmental threats affecting the surface water in Romania, where their number has an increasing trend during the last decade, this type of events being registered mostly on the inner rivers, and not on the Black Sea. Because the inland rivers are used as drinking water sources for populated areas and raw water for industry, the response to accidental oil spills has to be rapid and tailored to their particular dynamic conditions. The contingency plan for such an accidental release needs an analysis of all variables involved, the geographic disposal of the information being of significant importance for protecting the areas at risk, and for choosing the right response measure. The paper presents an analysis model of the data necessary for the decision making process, the results being obtained in a study carried out on Prahova and Ialomiţa rivers along their total length of 300 km. The geographical information system (GIS) was used as an integrating assessment tool of parameters of a critical importance for all adequate clean-up techniques, taking into consideration the particularities of the spill into aquatic environment and the socio-economic context. The results of the study can be used as a technical support for the decisions in real-time, concerning accidental oil spills occurred on inland rivers, and for developing the contingency plan. Key words: contingency plan, GIS, oil spill, remediation method Received: January, 2015; Revised final: October, 2015; Accepted: November, 2015 Author to whom all correspondence should be addressed: e-mail: [email protected]; Phone:+40 723 607 500 1. Introduction Contingency plans used for removal/remediation of accidental oil spills on surface water aim to mitigate the harmful effects on the environment and human health. Chemical compounds contained in the spilled oils are toxic for living organisms and the oil itself can coat the fur and feather of animals and birds. The effects on human health due to exposure at spilled oil can be acute (skin and mucous irritations) or psychological. Genotoxic damage and endocrine alterations still need biomonitoring of human populations (Aguilera et al., 2010). The frequency of accidental oil (and petroleum products) spills during the last decade is of a growing concern in Romania, most of the accidents being registered on rivers. They occurred mainly in the areas of important retailers, being caused either by intentional breakages or by the damages of the pipes (Torretta et al., 2014). The Romanian’s hydrographic network (Fig. 1), includes Ialomiţa watershed with the main river Ialomiţa a tributary of Danube, having 410 km in length. This river basin is one of the most spectacular because its greatest variability of geographical forms (2505m in the Bucegi mountains at the river source, down to 8m its lowest elevation at the confluence with Danube River). Ialomiţa basin’s importance is also given by the protected area “Natura 2000 site, ROSCI0290, Ialomiţa’s Corridor”, the most important ecological corridor crossing Baragan Plain and expanding from west to east, linking the Sub
Transcript
Environmental Engineering and Management Journal November 2015, Vol.14, No. 11, 2653-2660
http://omicron.ch.tuiasi.ro/EEMJ/
“Gheorghe Asachi” Technical University of Iasi, Romania
USING GIS AS A SUPPORT TOOL FOR ASSESSING THE
REMEDIATION METHODS APPLIED IN ACCIDENTAL OIL SPILLS
Ecological University of Bucharest, Faculty of Ecology and Environmental Protection,
1G Vasile Milea, Sector 6, 061341 Bucharest, Romania
Abstract Accidental oil spills represent one of the environmental threats affecting the surface water in Romania, where their number has an increasing trend during the last decade, this type of events being registered mostly on the inner rivers, and not on the Black Sea. Because the inland rivers are used as drinking water sources for populated areas and raw water for industry, the response to accidental oil spills has to be rapid and tailored to their particular dynamic conditions. The contingency plan for such an accidental release needs an analysis of all variables involved, the geographic disposal of the information being of significant importance for protecting the areas at risk, and for choosing the right response measure. The paper presents an analysis model of the data necessary for the decision making process, the results being obtained in a study carried out on Prahova and Ialomiţa rivers along their total length of 300 km. The geographical information system (GIS) was used as an integrating assessment tool of parameters of a critical importance for all adequate clean-up techniques, taking into consideration the particularities of the spill into aquatic environment and the socio-economic context. The results of the study can be used as a technical support for the decisions in real-time, concerning accidental oil spills occurred on inland rivers, and for developing the contingency plan. Key words: contingency plan, GIS, oil spill, remediation method Received: January, 2015; Revised final: October, 2015; Accepted: November, 2015
Author to whom all correspondence should be addressed: e-mail: [email protected]; Phone:+40 723 607 500
1. Introduction Contingency plans used for
removal/remediation of accidental oil spills on surface water aim to mitigate the harmful effects on the environment and human health. Chemical compounds contained in the spilled oils are toxic for living organisms and the oil itself can coat the fur and feather of animals and birds. The effects on human health due to exposure at spilled oil can be acute (skin and mucous irritations) or psychological. Genotoxic damage and endocrine alterations still need biomonitoring of human populations (Aguilera et al., 2010).
The frequency of accidental oil (and petroleum products) spills during the last decade is of a growing concern in Romania, most of the accidents
being registered on rivers. They occurred mainly in the areas of important retailers, being caused either by intentional breakages or by the damages of the pipes (Torretta et al., 2014).
The Romanian’s hydrographic network (Fig. 1), includes Ialomiţa watershed with the main river Ialomiţa a tributary of Danube, having 410 km in length. This river basin is one of the most spectacular because its greatest variability of geographical forms (2505m in the Bucegi mountains at the river source, down to 8m its lowest elevation at the confluence with Danube River). Ialomiţa basin’s importance is also given by the protected area “Natura 2000 site, ROSCI0290, Ialomiţa’s Corridor”, the most important ecological corridor crossing Baragan Plain and expanding from west to east, linking the Sub
Popescu et al./Environmental Engineering and Management Journal 14 (2015), 11, 2653-2660
2654
Carpathians and Ploieşti’s plain with Danube (Natura 2000, 2011).
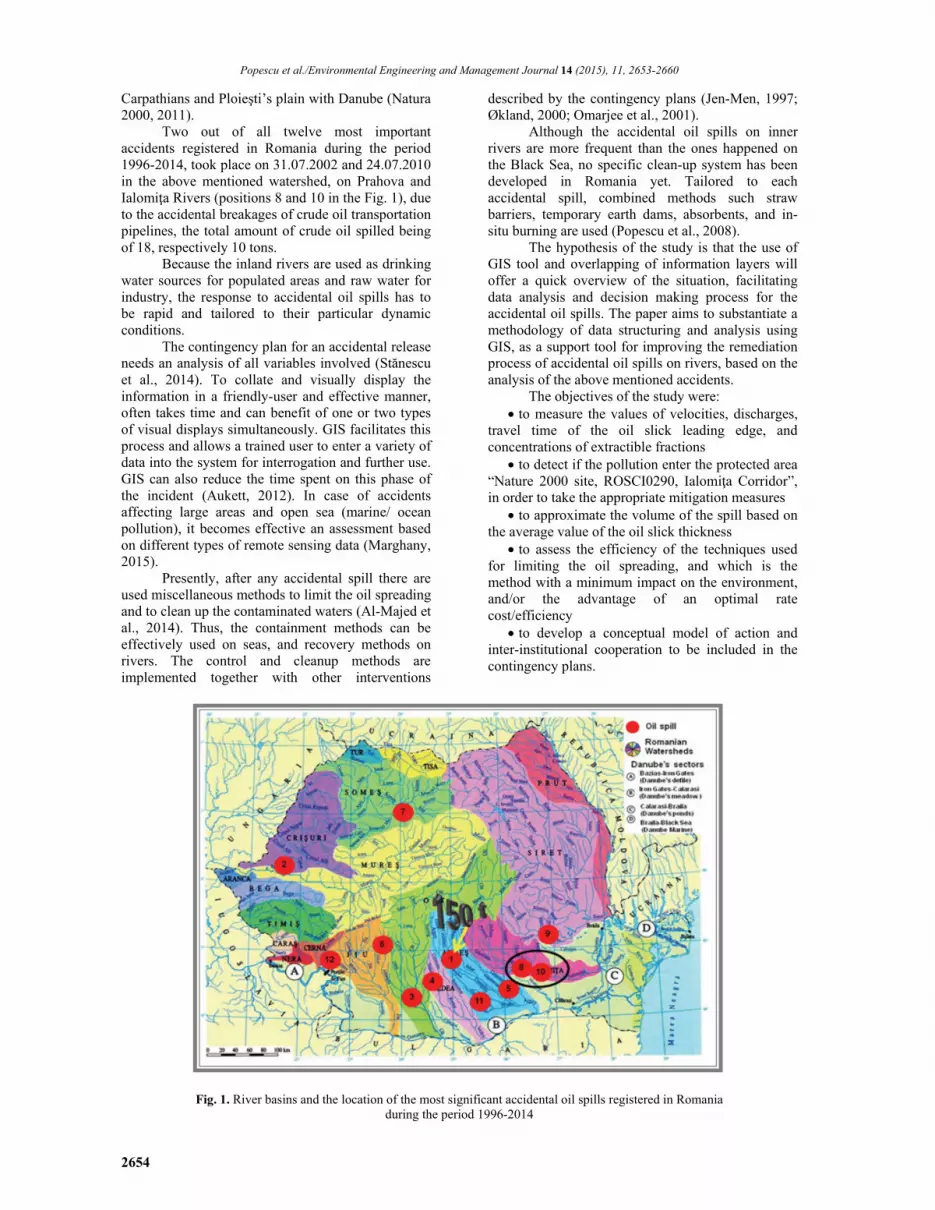
Two out of all twelve most important accidents registered in Romania during the period 1996-2014, took place on 31.07.2002 and 24.07.2010 in the above mentioned watershed, on Prahova and Ialomiţa Rivers (positions 8 and 10 in the Fig. 1), due to the accidental breakages of crude oil transportation pipelines, the total amount of crude oil spilled being of 18, respectively 10 tons.
Because the inland rivers are used as drinking water sources for populated areas and raw water for industry, the response to accidental oil spills has to be rapid and tailored to their particular dynamic conditions.
The contingency plan for an accidental release needs an analysis of all variables involved (Stănescu et al., 2014). To collate and visually display the information in a friendly-user and effective manner, often takes time and can benefit of one or two types of visual displays simultaneously. GIS facilitates this process and allows a trained user to enter a variety of data into the system for interrogation and further use. GIS can also reduce the time spent on this phase of the incident (Aukett, 2012). In case of accidents affecting large areas and open sea (marine/ ocean pollution), it becomes effective an assessment based on different types of remote sensing data (Marghany, 2015).
Presently, after any accidental spill there are used miscellaneous methods to limit the oil spreading and to clean up the contaminated waters (Al-Majed et al., 2014). Thus, the containment methods can be effectively used on seas, and recovery methods on rivers. The control and cleanup methods are implemented together with other interventions
described by the contingency plans (Jen-Men, 1997; Økland, 2000; Omarjee et al., 2001).
Although the accidental oil spills on inner rivers are more frequent than the ones happened on the Black Sea, no specific clean-up system has been developed in Romania yet. Tailored to each accidental spill, combined methods such straw barriers, temporary earth dams, absorbents, and in-situ burning are used (Popescu et al., 2008).
The hypothesis of the study is that the use of GIS tool and overlapping of information layers will offer a quick overview of the situation, facilitating data analysis and decision making process for the accidental oil spills. The paper aims to substantiate a methodology of data structuring and analysis using GIS, as a support tool for improving the remediation process of accidental oil spills on rivers, based on the analysis of the above mentioned accidents.
The objectives of the study were: to measure the values of velocities, discharges,
travel time of the oil slick leading edge, and concentrations of extractible fractions
to detect if the pollution enter the protected area “Nature 2000 site, ROSCI0290, Ialomiţa Corridor”, in order to take the appropriate mitigation measures
to approximate the volume of the spill based on the average value of the oil slick thickness
to assess the efficiency of the techniques used for limiting the oil spreading, and which is the method with a minimum impact on the environment, and/or the advantage of an optimal rate cost/efficiency
to develop a conceptual model of action and inter-institutional cooperation to be included in the contingency plans.
Fig. 1. River basins and the location of the most significant accidental oil spills registered in Romania during the period 1996-2014
Using GIS as a support tool for assessing the remediation methods applied in accidental oil spills
2655
2. Material and methods
For the analysis and characterization of the
pollution episode and also for the impact assessment and estimation of the remediation methods’ efficiency, the elements that characterize the geographical area, river basin and oil spill were structured in a GIS database. The choice to use a GIS tool to store and integrate the information was for speeding the analysis and decision making process, thus facilitating the optimization of oil spill remediation more accurately and in real-time (IPIECA, 2012).
The GIS database that was built up has the following structure:
Spatial data: support map (base map) terrain map 1:25,000; Numeric Model of Land (DTM) - spatial resolution 20 m; Tri-Decadal Global Landsat Orthorectified MSS, TM, ETM 15 m spatial resolution; data resulting from the mapping in the field (position of the evaluated cross sections profiles);
Attribute data: hydrological data (flow rates, water surface elevations, and velocities), pollutant’s concentrations, parameters of the intervention means (straw barriers, natural absorbent Peat Sorb).
Based on data processing, the following maps for support of the analysis process were elaborated: the map of the position of the studied area in relation to the topographic distribution of the entire region, the map of the affected hydrographic network sectors and their location towards the borders of protected area Nature 2000 site - ROSCI0290 “Ialomiţa’s Corridor”, including the impact size and the location of gauging stations, the map of water quality monitoring points during the pollution episode, with the marked position for the intervention points established in order to reduce the damaging effect, according to the selected method. For mapping/ construction of the necessary thematic maps and spatial data management, the ArcGIS 10 software package was used. GIS database contains the following layers of information with corresponding attribute data (Table 1).
The monitoring network consists of 13 points: Fânari, Potigrafu, Tinosu, Brazii, Ciochina, Urziceni, Stănceşti, Buieşti, Cosambeşti, Coşereni, Gherghiţa, Oboieşti and Stejaru. Theses are the sampling points for the measurement of hydrometric and water quality characterization parameters. The monitoring of hydrometric and water quality parameters during the accidental oil spill took into account the normal and particular flow regimes. Hydrometric data were recorded twice a day in a natural flow regime, and six times a day as average in a flood flow regime (caused by heavy rainfall). In order to analyze the extractible fractions, water samples were taken manually at the surface of water in areas with floating film, and from water table in sections where the pollutant couldn't be seen visually. To estimate the volume of oil spilled, it was assessed both visually two-dimensional extent
and thickness of the film in the first monitoring sections. All the data obtained were recorded in an operational database.
As a result of the correlation of theses data with climatic, geologic, pedologic and infrastructure data, a characterization of the zones at risk is obtained, together with possible scenarios for the evolution of the pollution front, and optimal methods and routes of early interventions. High concentrations of pollutants associated with low flows of rivers, low precipitation or their lack thereof, causes episodes of major risk due to ineffective natural attenuation through the mechanism dilution/dispersion. The increased risk is also determined by geological and soil characteristics of certain sectors, resulting in a higher vulnerability to the pollutants' penetration in the geological environment. Data processing and substantiation of decision is made by the competent authorities Inspectorate for Emergency Situations together with the Environmental Guard, the Environmental Protection Agency and Local authorities from the affected areas.
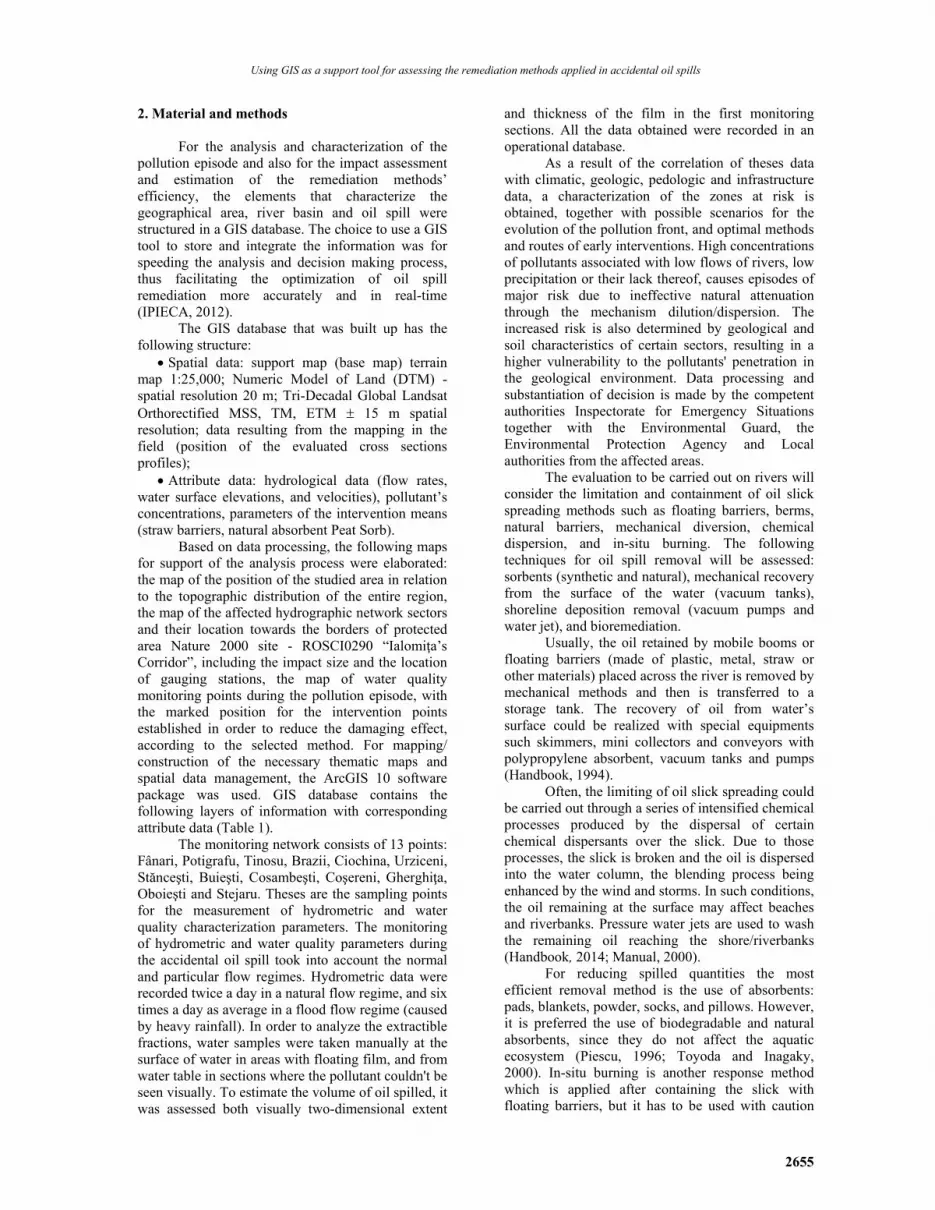
The evaluation to be carried out on rivers will consider the limitation and containment of oil slick spreading methods such as floating barriers, berms, natural barriers, mechanical diversion, chemical dispersion, and in-situ burning. The following techniques for oil spill removal will be assessed: sorbents (synthetic and natural), mechanical recovery from the surface of the water (vacuum tanks), shoreline deposition removal (vacuum pumps and water jet), and bioremediation.
Usually, the oil retained by mobile booms or floating barriers (made of plastic, metal, straw or other materials) placed across the river is removed by mechanical methods and then is transferred to a storage tank. The recovery of oil from water’s surface could be realized with special equipments such skimmers, mini collectors and conveyors with polypropylene absorbent, vacuum tanks and pumps (Handbook, 1994).
Often, the limiting of oil slick spreading could be carried out through a series of intensified chemical processes produced by the dispersal of certain chemical dispersants over the slick. Due to those processes, the slick is broken and the oil is dispersed into the water column, the blending process being enhanced by the wind and storms. In such conditions, the oil remaining at the surface may affect beaches and riverbanks. Pressure water jets are used to wash the remaining oil reaching the shore/riverbanks (Handbook, 2014; Manual, 2000).
For reducing spilled quantities the most efficient removal method is the use of absorbents: pads, blankets, powder, socks, and pillows. However, it is preferred the use of biodegradable and natural absorbents, since they do not affect the aquatic ecosystem (Piescu, 1996; Toyoda and Inagaky, 2000). In-situ burning is another response method which is applied after containing the slick with floating barriers, but it has to be used with caution
Popescu et al./Environmental Engineering and Management Journal 14 (2015), 11, 2653-2660
2656
because of the transfer of pollution from water to air. Thus, it is preferably to apply this method only for the situations where the oil slick is thick enough for a complete burn of the oil (Nordvik et al., 2002).
Natural methods such bioremediation and natural cleanup are based on microbiological biodegradation of oil, being methods „applied by the nature” when meteorological conditions (storms, strong currents, waves, wind) are favorable to pollutant’s dispersion (Abu and Ogiji, 1996; Oh et al., 2000; Handbook, 2014). The efficiency of remediation methods applied in an accidental oil spill on surface waters depends on the characteristics of the aquatic environment and the physico-chemical processes associated to the oil slick evolution, and the type of the petroleum product (Helton and Penn, 1999).
The chosen techniques will be assessed on the base of using/application time, the oil slick
limitation, respectively its removal degree, the impact on the environment and the estimative costs. For each criterion, the efficiency will be appreciated in a semi quantitative manner using the „minimum”, „medium” and „maximum” ratings (Fig. 2).
3. Case study
The study presents an accident that took place
in July 2002 on two Romanian rivers, Prahova and Ialomiţa, during a flood event. The pollution was caused by the breaking of an under passing oil pipeline from Brătăşanca when a considerable amount of oil was spilled into the river. The pollutant plume was extended during the next four days on a 300 km distance downstream on Ialomiţa River, up to Slobozia and finally Hagieni. Several straw barriers were placed across the river to hold the oil slick and facilitate its removal (Popescu et al., 2008).
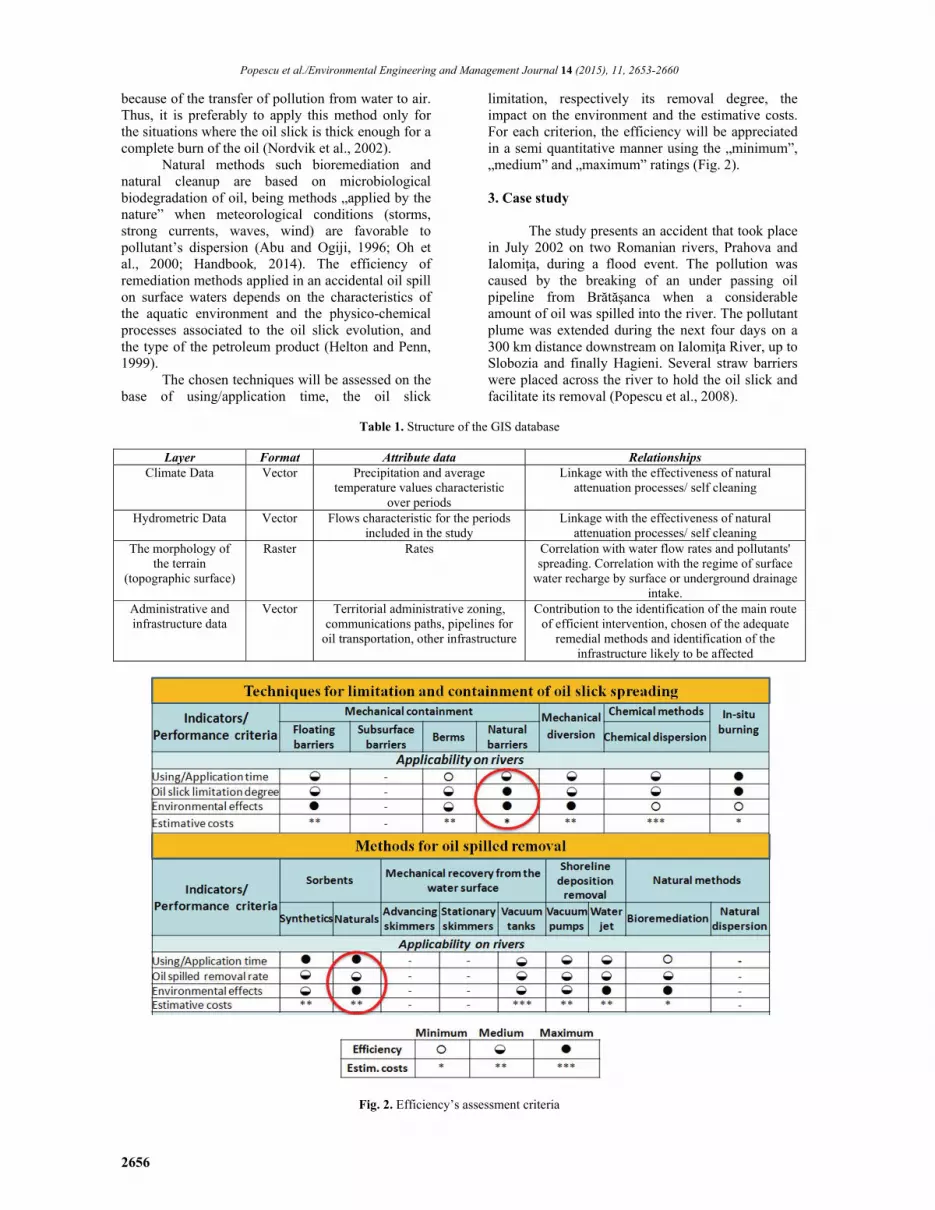
Table 1. Structure of the GIS database
Layer Format Attribute data Relationships
Climate Data Vector Precipitation and average temperature values characteristic
over periods
Linkage with the effectiveness of natural attenuation processes/ self cleaning
Hydrometric Data Vector Flows characteristic for the periods included in the study
Linkage with the effectiveness of natural attenuation processes/ self cleaning
The morphology of the terrain
(topographic surface)
Raster Rates Correlation with water flow rates and pollutants' spreading. Correlation with the regime of surface
water recharge by surface or underground drainage intake.
Administrative and infrastructure data
Vector Territorial administrative zoning, communications paths, pipelines for
oil transportation, other infrastructure
Contribution to the identification of the main route of efficient intervention, chosen of the adequate
remedial methods and identification of the infrastructure likely to be affected
Fig. 2. Efficiency’s assessment criteria
Using GIS as a support tool for assessing the remediation methods applied in accidental oil spills
2657
4. Results and discussion
During four days, the values of velocities,
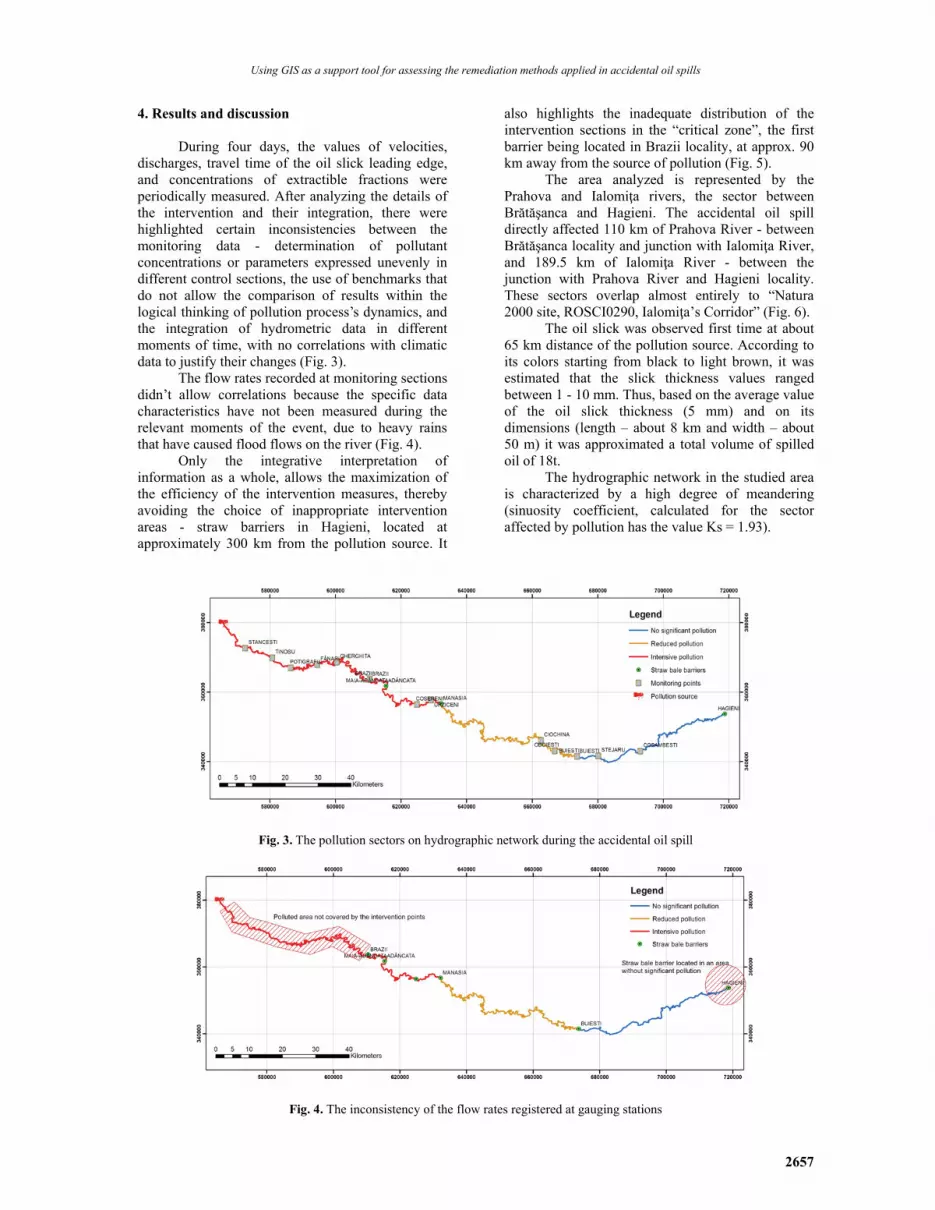
discharges, travel time of the oil slick leading edge, and concentrations of extractible fractions were periodically measured. After analyzing the details of the intervention and their integration, there were highlighted certain inconsistencies between the monitoring data - determination of pollutant concentrations or parameters expressed unevenly in different control sections, the use of benchmarks that do not allow the comparison of results within the logical thinking of pollution process’s dynamics, and the integration of hydrometric data in different moments of time, with no correlations with climatic data to justify their changes (Fig. 3).
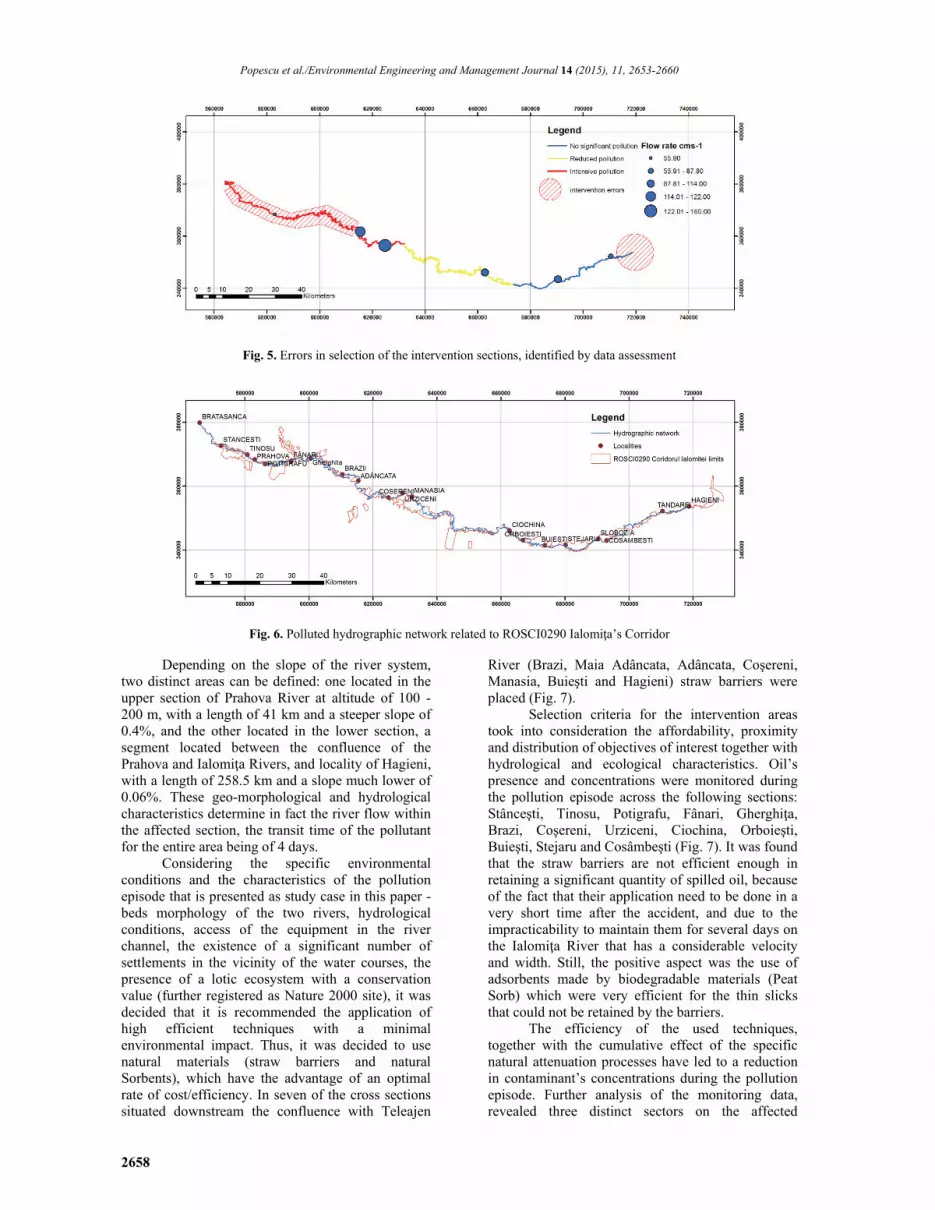
The flow rates recorded at monitoring sections didn’t allow correlations because the specific data characteristics have not been measured during the relevant moments of the event, due to heavy rains that have caused flood flows on the river (Fig. 4).
Only the integrative interpretation of information as a whole, allows the maximization of the efficiency of the intervention measures, thereby avoiding the choice of inappropriate intervention areas - straw barriers in Hagieni, located at approximately 300 km from the pollution source. It
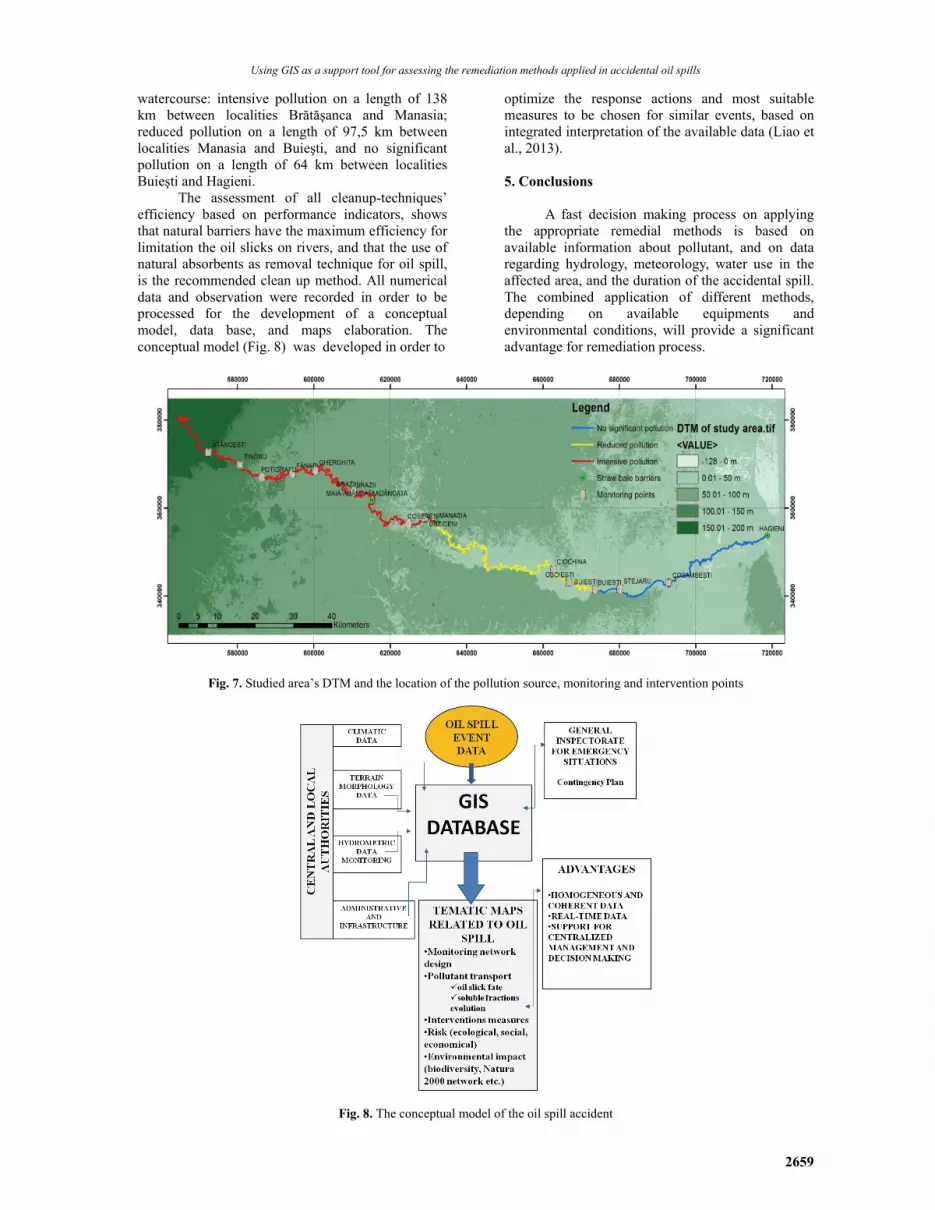
also highlights the inadequate distribution of the intervention sections in the “critical zone”, the first barrier being located in Brazii locality, at approx. 90 km away from the source of pollution (Fig. 5).
The area analyzed is represented by the Prahova and Ialomiţa rivers, the sector between Brătăşanca and Hagieni. The accidental oil spill directly affected 110 km of Prahova River - between Brătăşanca locality and junction with Ialomiţa River, and 189.5 km of Ialomiţa River - between the junction with Prahova River and Hagieni locality. These sectors overlap almost entirely to “Natura 2000 site, ROSCI0290, Ialomiţa’s Corridor” (Fig. 6).
The oil slick was observed first time at about 65 km distance of the pollution source. According to its colors starting from black to light brown, it was estimated that the slick thickness values ranged between 1 - 10 mm. Thus, based on the average value of the oil slick thickness (5 mm) and on its dimensions (length – about 8 km and width – about 50 m) it was approximated a total volume of spilled oil of 18t.
The hydrographic network in the studied area is characterized by a high degree of meandering (sinuosity coefficient, calculated for the sector affected by pollution has the value Ks = 1.93).
Fig. 3. The pollution sectors on hydrographic network during the accidental oil spill
Fig. 4. The inconsistency of the flow rates registered at gauging stations
Popescu et al./Environmental Engineering and Management Journal 14 (2015), 11, 2653-2660
2658
Fig. 5. Errors in selection of the intervention sections, identified by data assessment
Fig. 6. Polluted hydrographic network related to ROSCI0290 Ialomiţa’s Corridor
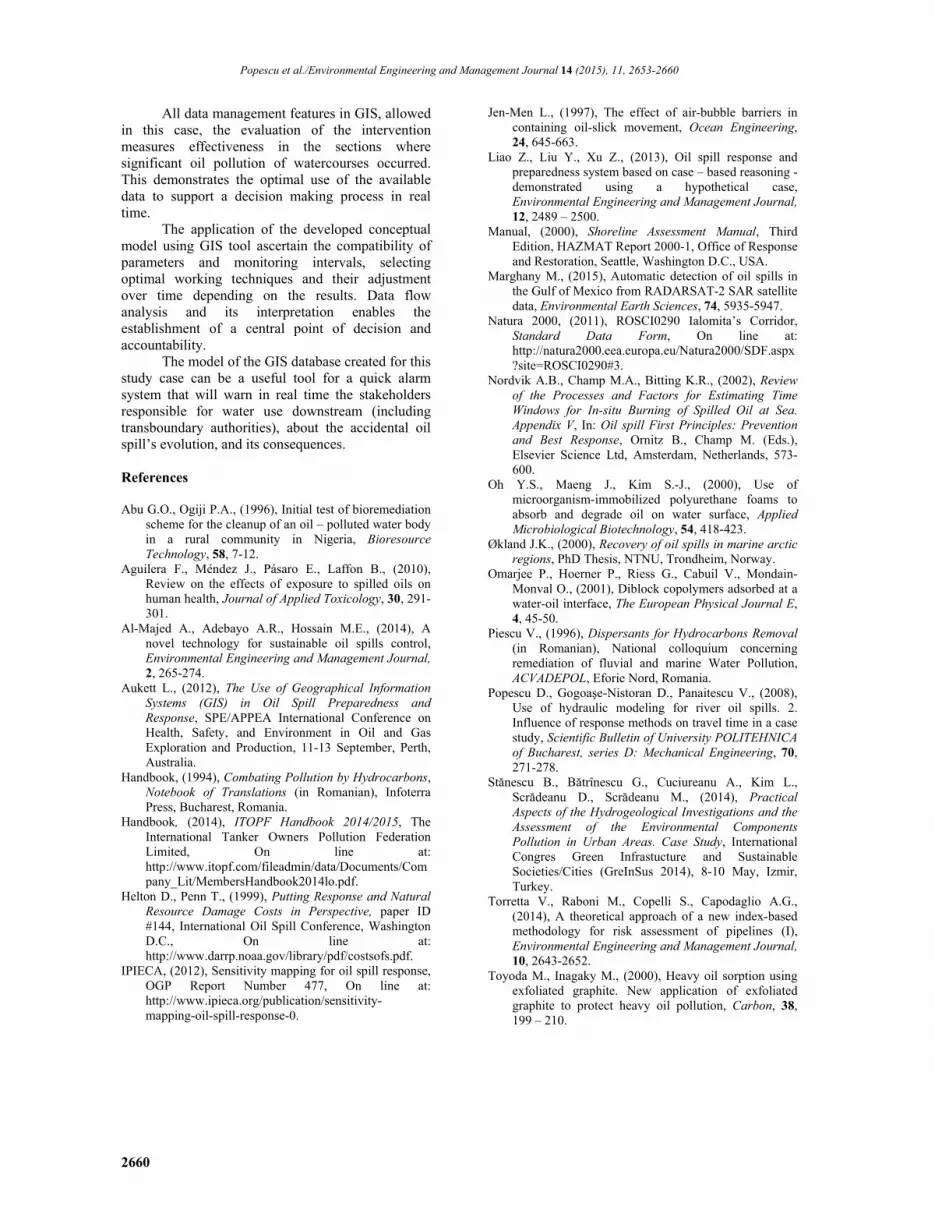
Depending on the slope of the river system, two distinct areas can be defined: one located in the upper section of Prahova River at altitude of 100 - 200 m, with a length of 41 km and a steeper slope of 0.4%, and the other located in the lower section, a segment located between the confluence of the Prahova and Ialomiţa Rivers, and locality of Hagieni, with a length of 258.5 km and a slope much lower of 0.06%. These geo-morphological and hydrological characteristics determine in fact the river flow within the affected section, the transit time of the pollutant for the entire area being of 4 days.
Considering the specific environmental conditions and the characteristics of the pollution episode that is presented as study case in this paper - beds morphology of the two rivers, hydrological conditions, access of the equipment in the river channel, the existence of a significant number of settlements in the vicinity of the water courses, the presence of a lotic ecosystem with a conservation value (further registered as Nature 2000 site), it was decided that it is recommended the application of high efficient techniques with a minimal environmental impact. Thus, it was decided to use natural materials (straw barriers and natural Sorbents), which have the advantage of an optimal rate of cost/efficiency. In seven of the cross sections situated downstream the confluence with Teleajen
River (Brazi, Maia Adâncata, Adâncata, Coşereni, Manasia, Buieşti and Hagieni) straw barriers were placed (Fig. 7).
Selection criteria for the intervention areas took into consideration the affordability, proximity and distribution of objectives of interest together with hydrological and ecological characteristics. Oil’s presence and concentrations were monitored during the pollution episode across the following sections: Stânceşti, Tinosu, Potigrafu, Fânari, Gherghiţa, Brazi, Coşereni, Urziceni, Ciochina, Orboieşti, Buieşti, Stejaru and Cosâmbeşti (Fig. 7). It was found that the straw barriers are not efficient enough in retaining a significant quantity of spilled oil, because of the fact that their application need to be done in a very short time after the accident, and due to the impracticability to maintain them for several days on the Ialomiţa River that has a considerable velocity and width. Still, the positive aspect was the use of adsorbents made by biodegradable materials (Peat Sorb) which were very efficient for the thin slicks that could not be retained by the barriers.
The efficiency of the used techniques, together with the cumulative effect of the specific natural attenuation processes have led to a reduction in contaminant’s concentrations during the pollution episode. Further analysis of the monitoring data, revealed three distinct sectors on the affected
Using GIS as a support tool for assessing the remediation methods applied in accidental oil spills
2659
watercourse: intensive pollution on a length of 138 km between localities Brătăşanca and Manasia; reduced pollution on a length of 97,5 km between localities Manasia and Buieşti, and no significant pollution on a length of 64 km between localities Buieşti and Hagieni.
The assessment of all cleanup-techniques’ efficiency based on performance indicators, shows that natural barriers have the maximum efficiency for limitation the oil slicks on rivers, and that the use of natural absorbents as removal technique for oil spill, is the recommended clean up method. All numerical data and observation were recorded in order to be processed for the development of a conceptual model, data base, and maps elaboration. The conceptual model (Fig. 8) was developed in order to
optimize the response actions and most suitable measures to be chosen for similar events, based on integrated interpretation of the available data (Liao et al., 2013).
5. Conclusions
A fast decision making process on applying
the appropriate remedial methods is based on available information about pollutant, and on data regarding hydrology, meteorology, water use in the affected area, and the duration of the accidental spill. The combined application of different methods, depending on available equipments and environmental conditions, will provide a significant advantage for remediation process.
Fig. 7. Studied area’s DTM and the location of the pollution source, monitoring and intervention points
Fig. 8. The conceptual model of the oil spill accident
Popescu et al./Environmental Engineering and Management Journal 14 (2015), 11, 2653-2660
2660
All data management features in GIS, allowed
in this case, the evaluation of the intervention measures effectiveness in the sections where significant oil pollution of watercourses occurred. This demonstrates the optimal use of the available data to support a decision making process in real time.
The application of the developed conceptual model using GIS tool ascertain the compatibility of parameters and monitoring intervals, selecting optimal working techniques and their adjustment over time depending on the results. Data flow analysis and its interpretation enables the establishment of a central point of decision and accountability.
The model of the GIS database created for this study case can be a useful tool for a quick alarm system that will warn in real time the stakeholders responsible for water use downstream (including transboundary authorities), about the accidental oil spill’s evolution, and its consequences. References Abu G.O., Ogiji P.A., (1996), Initial test of bioremediation
scheme for the cleanup of an oil – polluted water body in a rural community in Nigeria, Bioresource Technology, 58, 7-12.
Aguilera F., Méndez J., Pásaro E., Laffon B., (2010), Review on the effects of exposure to spilled oils on human health, Journal of Applied Toxicology, 30, 291-301.
Al-Majed A., Adebayo A.R., Hossain M.E., (2014), A novel technology for sustainable oil spills control, Environmental Engineering and Management Journal, 2, 265-274.
Aukett L., (2012), The Use of Geographical Information Systems (GIS) in Oil Spill Preparedness and Response, SPE/APPEA International Conference on Health, Safety, and Environment in Oil and Gas Exploration and Production, 11-13 September, Perth, Australia.
Handbook, (1994), Combating Pollution by Hydrocarbons, Notebook of Translations (in Romanian), Infoterra Press, Bucharest, Romania.
Handbook, (2014), ITOPF Handbook 2014/2015, The International Tanker Owners Pollution Federation Limited, On line at: http://www.itopf.com/fileadmin/data/Documents/Company_Lit/MembersHandbook2014lo.pdf.
Helton D., Penn T., (1999), Putting Response and Natural Resource Damage Costs in Perspective, paper ID #144, International Oil Spill Conference, Washington D.C., On line at: http://www.darrp.noaa.gov/library/pdf/costsofs.pdf.
IPIECA, (2012), Sensitivity mapping for oil spill response, OGP Report Number 477, On line at: http://www.ipieca.org/publication/sensitivity-mapping-oil-spill-response-0.
Jen-Men L., (1997), The effect of air-bubble barriers in containing oil-slick movement, Ocean Engineering, 24, 645-663.
Liao Z., Liu Y., Xu Z., (2013), Oil spill response and preparedness system based on case – based reasoning - demonstrated using a hypothetical case, Environmental Engineering and Management Journal, 12, 2489 – 2500.
Manual, (2000), Shoreline Assessment Manual, Third Edition, HAZMAT Report 2000-1, Office of Response and Restoration, Seattle, Washington D.C., USA.
Marghany M., (2015), Automatic detection of oil spills in the Gulf of Mexico from RADARSAT-2 SAR satellite data, Environmental Earth Sciences, 74, 5935-5947.
Natura 2000, (2011), ROSCI0290 Ialomita’s Corridor, Standard Data Form, On line at: http://natura2000.eea.europa.eu/Natura2000/SDF.aspx?site=ROSCI0290#3.
Nordvik A.B., Champ M.A., Bitting K.R., (2002), Review of the Processes and Factors for Estimating Time Windows for In-situ Burning of Spilled Oil at Sea. Appendix V, In: Oil spill First Principles: Prevention and Best Response, Ornitz B., Champ M. (Eds.), Elsevier Science Ltd, Amsterdam, Netherlands, 573-600.
Oh Y.S., Maeng J., Kim S.-J., (2000), Use of microorganism-immobilized polyurethane foams to absorb and degrade oil on water surface, Applied Microbiological Biotechnology, 54, 418-423.
Økland J.K., (2000), Recovery of oil spills in marine arctic regions, PhD Thesis, NTNU, Trondheim, Norway.
Omarjee P., Hoerner P., Riess G., Cabuil V., Mondain-Monval O., (2001), Diblock copolymers adsorbed at a water-oil interface, The European Physical Journal E, 4, 45-50.
Piescu V., (1996), Dispersants for Hydrocarbons Removal (in Romanian), National colloquium concerning remediation of fluvial and marine Water Pollution, ACVADEPOL, Eforie Nord, Romania.
Popescu D., Gogoaşe-Nistoran D., Panaitescu V., (2008), Use of hydraulic modeling for river oil spills. 2. Influence of response methods on travel time in a case study, Scientific Bulletin of University POLITEHNICA of Bucharest, series D: Mechanical Engineering, 70, 271-278.
Stănescu B., Bătrînescu G., Cuciureanu A., Kim L., Scrădeanu D., Scrădeanu M., (2014), Practical Aspects of the Hydrogeological Investigations and the Assessment of the Environmental Components Pollution in Urban Areas. Case Study, International Congres Green Infrastucture and Sustainable Societies/Cities (GreInSus 2014), 8-10 May, Izmir, Turkey.
Torretta V., Raboni M., Copelli S., Capodaglio A.G., (2014), A theoretical approach of a new index-based methodology for risk assessment of pipelines (I), Environmental Engineering and Management Journal, 10, 2643-2652.
Toyoda M., Inagaky M., (2000), Heavy oil sorption using exfoliated graphite. New application of exfoliated graphite to protect heavy oil pollution, Carbon, 38, 199 – 210.