185 Bulletin of the Seismological Society of America, Vol. 95, No. 1, pp. 185–196, February 2005, doi: 10.1785/0120030075 Automatic Classification of Seismic Signals at Mt. Vesuvius Volcano, Italy, Using Neural Networks by S. Scarpetta, F. Giudicepietro, E. C. Ezin, S. Petrosino, E. Del Pezzo, M. Martini, and M. Marinaro Abstract We present a new strategy for reliable automatic classification of local seismic signals and volcano-tectonic earthquakes (VT). The method is based on a supervised neural network in which a new approach for feature extraction from short period seismic signals is applied. To reduce the number of records required for the analysis we set up a specialized neural classifier, able to distinguish two classes of signals, for each of the selected stations. The neural network architecture is a multi- layer perceptron (MLP) with a single hidden layer. Spectral features of the signals and the parameterized attributes of their waveform have been used as input for this network. Feature extraction is done by using both the linear predictor coding tech- nique for computing the spectrograms, and a function of the amplitude for charac- terizing waveforms. Compared to strategies that use only spectral signatures, the inclusion of properly normalized amplitude features improves the performance of the classifiers, and allows the network to better generalize. To train the MLP network we compared the performance of the quasi-Newton algorithm with the scaled con- jugate gradient method. We found that the scaled conjugate gradient approach is the faster of the two, with quite equally good performance. Our method was tested on a dataset recorded by four selected stations of the Mt. Vesuvius monitoring network, for the discrimination of low magnitude VT events and transient signals caused by either artificial (quarry blasts, underwater explosions) and natural (thunder) sources. In this test application we obtained 100% correct classification for one of the possible pairs of signal types (VT versus quarry blasts). Because this method was developed independently of this particular discrimination task, it can be applied to a broad range of other applications. Introduction Automatic or quasi-automatic techniques able to rec- ognize different classes of seismic signals are used primarily for discrimination between earthquakes and signals caused by artificial explosions. Among the many applications of these techniques, underground nuclear test monitoring, per- formed in the context of the Comprehensive Test Ban Treaty (CTBT) (Hoffmann et al., 1999), is one of the most impor- tant. On a local scale, automatic classification may be ap- plied to discriminate between earthquakes and quarry blasts or other kind of local man-made explosions. The classification problem has been approached using different methods, including statistical analysis (Kushnir et al., 1990; Wu ¨ster, 1993; Shumway, 1996; Kushnir et al., 1999), cross-correlation techniques (Joswig, 1990), and Wavelet Bayesian classification (Gendron et al., 2000). Most of these methods are based on attributes of specific seismic phases, which are generally easily observed in records of regional and teleseismic earthquakes, but difficult to detect in records of local earthquakes, including volcanic quakes. Other methods that use attributes of the whole seismogram are more effective for solving classification problems related to local and volcano seismicity. Among these, neural- network-based methods have been successfully applied (Fal- saperla et al., 1996; Musil and Plesinger 1996; Fedorenko et al., 1999; Tarvainen, 1999; Ursino et al., 2001; Del Pezzo et al., 2003). The reliability of classification techniques is critical for applications devoted to volcano monitoring. The need, in a crisis mode, is to make fast decisions that can affect the public safety. Because of the multitude of different signals generated by volcanoes (e.g., volcanic long-period (LP), hy- brid, volcano-tectonic (VT), tremor), robust automatic clas- sification on an ongoing basis is crucial. A robust automatic classification algorithm is especially important when the sig- nals are recorded by local networks with a limited number of sensors. In this case, low energy signals recorded by sin-
Transcript
185
Bulletin of the Seismological Society of America, Vol. 95, No. 1, pp. 185–196, February 2005, doi: 10.1785/0120030075
Automatic Classification of Seismic Signals at Mt. Vesuvius Volcano, Italy,
Using Neural Networks
by S. Scarpetta, F. Giudicepietro, E. C. Ezin, S. Petrosino, E. Del Pezzo,M. Martini, and M. Marinaro
Abstract We present a new strategy for reliable automatic classification of localseismic signals and volcano-tectonic earthquakes (VT). The method is based on asupervised neural network in which a new approach for feature extraction from shortperiod seismic signals is applied. To reduce the number of records required for theanalysis we set up a specialized neural classifier, able to distinguish two classes ofsignals, for each of the selected stations. The neural network architecture is a multi-layer perceptron (MLP) with a single hidden layer. Spectral features of the signalsand the parameterized attributes of their waveform have been used as input for thisnetwork. Feature extraction is done by using both the linear predictor coding tech-nique for computing the spectrograms, and a function of the amplitude for charac-terizing waveforms. Compared to strategies that use only spectral signatures, theinclusion of properly normalized amplitude features improves the performance ofthe classifiers, and allows the network to better generalize. To train the MLP networkwe compared the performance of the quasi-Newton algorithm with the scaled con-jugate gradient method. We found that the scaled conjugate gradient approach is thefaster of the two, with quite equally good performance. Our method was tested on adataset recorded by four selected stations of the Mt. Vesuvius monitoring network,for the discrimination of low magnitude VT events and transient signals caused byeither artificial (quarry blasts, underwater explosions) and natural (thunder) sources.In this test application we obtained 100% correct classification for one of the possiblepairs of signal types (VT versus quarry blasts). Because this method was developedindependently of this particular discrimination task, it can be applied to a broad rangeof other applications.
Introduction
Automatic or quasi-automatic techniques able to rec-ognize different classes of seismic signals are used primarilyfor discrimination between earthquakes and signals causedby artificial explosions. Among the many applications ofthese techniques, underground nuclear test monitoring, per-formed in the context of the Comprehensive Test Ban Treaty(CTBT) (Hoffmann et al., 1999), is one of the most impor-tant. On a local scale, automatic classification may be ap-plied to discriminate between earthquakes and quarry blastsor other kind of local man-made explosions.
The classification problem has been approached usingdifferent methods, including statistical analysis (Kushnir etal., 1990; Wuster, 1993; Shumway, 1996; Kushnir et al.,1999), cross-correlation techniques (Joswig, 1990), andWavelet Bayesian classification (Gendron et al., 2000). Mostof these methods are based on attributes of specific seismicphases, which are generally easily observed in records ofregional and teleseismic earthquakes, but difficult to detect
in records of local earthquakes, including volcanic quakes.Other methods that use attributes of the whole seismogramare more effective for solving classification problems relatedto local and volcano seismicity. Among these, neural-network-based methods have been successfully applied (Fal-saperla et al., 1996; Musil and Plesinger 1996; Fedorenkoet al., 1999; Tarvainen, 1999; Ursino et al., 2001; Del Pezzoet al., 2003).
The reliability of classification techniques is critical forapplications devoted to volcano monitoring. The need, in acrisis mode, is to make fast decisions that can affect thepublic safety. Because of the multitude of different signalsgenerated by volcanoes (e.g., volcanic long-period (LP), hy-brid, volcano-tectonic (VT), tremor), robust automatic clas-sification on an ongoing basis is crucial. A robust automaticclassification algorithm is especially important when the sig-nals are recorded by local networks with a limited numberof sensors. In this case, low energy signals recorded by sin-
186 S. Scarpetta, F. Giudicepietro, E. C. Ezin, S. Petrosino, E. Del Pezzo, M. Martini, and M. Marinaro
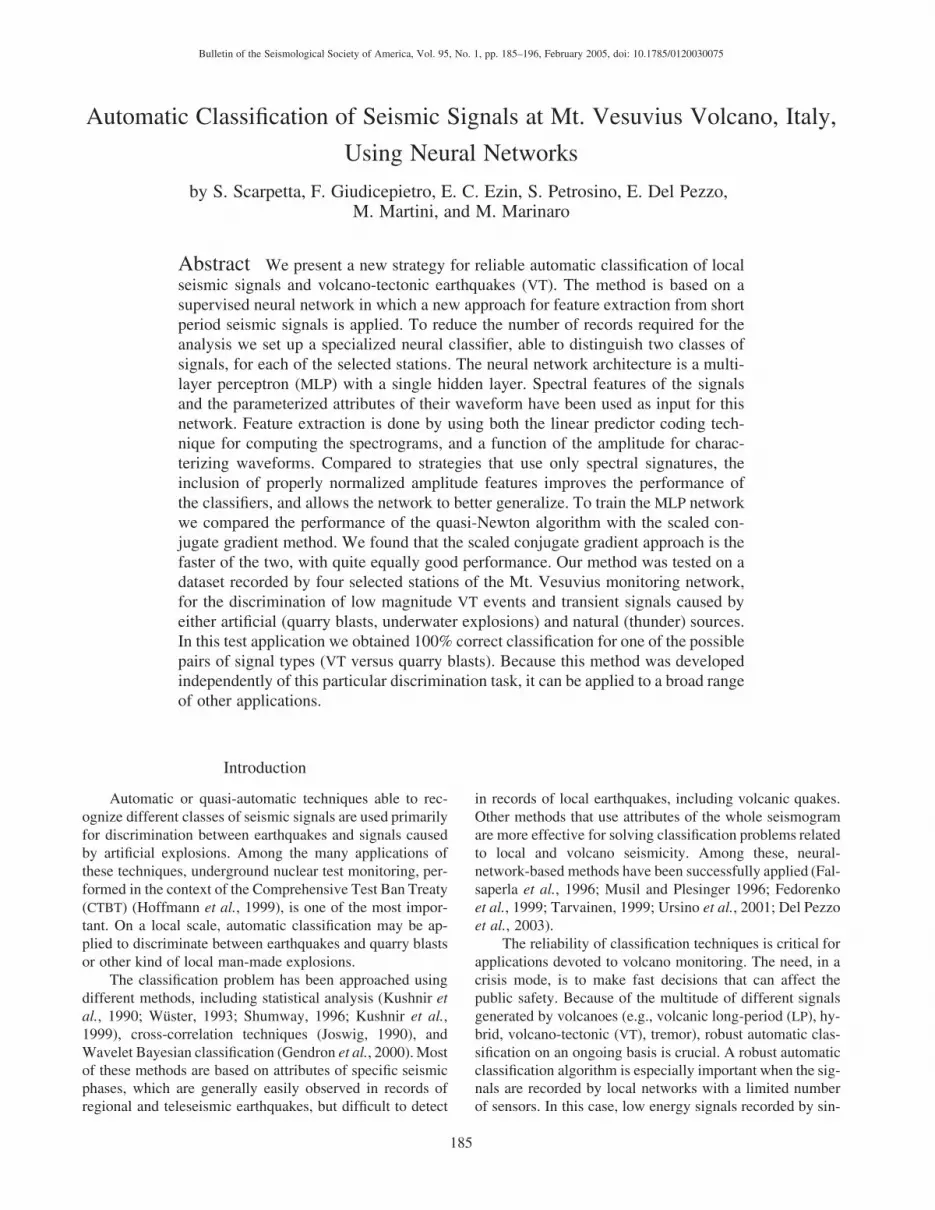
Figure 1. Map of Mt. Vesuvius zone. Elevationcontour spacing is 100 m. The heavier black line isthe coastline. Slashed zones indicate the highestpopulation density in the urban areas. Dots indicateshort-period stations with vertical sensors. Trianglesare short-period stations with 3-component sensors;rhomboids are broadband, 3-component stations.
gle stations may be important manifestations of the ongoingvolcanic process, and their classification on the sole basis ofthe seismogram appearance may be the unique way to dis-criminate between an internal volcanic and an external ornon-natural signal. In synthesis, a robust automatic discrim-ination algorithm reduces the analyst workload without com-promising accuracy of results, allowing the analyst to focusonly on the more problematic signals and spend the work-time on high-level analysis and interpretation.
The main goal of our work is to develop a high-performance strategy for discriminating local and volcanicearthquakes from other transient signals. Such a strategycould drastically reduce the workload of the community in-volved in seismological monitoring, and may allow the pro-duction of automatic bulletins, with minimal or no reviewby a seismic analyst. The test area considered for this studyis Mt. Vesuvius, a high-risk volcano close to the city ofNaples (about 2 million people), in southern Italy (Fig. 1).In this area, VT earthquakes and transient signals due to ex-ternal sources (man-made underwater explosions, quarryblasts, and thunder) are currently recorded. Our approach indiscriminating among these signals follows that of a previ-ous study, in which neural networks were applied to dis-criminate between VT earthquakes occurring at the Phle-graean Fields caldera (southern Italy) and local man-madeunderwater explosions (Del Pezzo et al., 2003). In this study,our strategy was improved by using both spectral and wave-form features as input for the neural network.
This article is organized into six sections. The first pro-vides an overview of the volcanological setting and the char-acteristics of the activity of Mt. Vesuvius, with emphasis onseismological features. The second section reports infor-mation about the seismic network configuration and presentsa description of the stations and the data set used for theanalysis. The third section focuses on the preprocessingstage, devoted to feature extraction. The fourth and fifth sec-tions explain the neural network architecture, the discrimi-nation strategy, and the performance evaluation of themethod. Finally, we discuss the results and conclusions.
Mt. Vesuvius
Mt. Vesuvius is a volcanic complex on the west coastof Italy, composed of an older strato-volcano, namedSomma, with a summit caldera and a more recent cone (GranCono), which has grown inside the caldera. Its eruptive his-tory began more than 25,000 years ago and has been char-acterized by large plinian eruptions, the most famous ofwhich destroyed the Roman towns of Pompeii and Hercu-laneum in ad 79. Since that time, the largest eruption oc-curred in 1631 and was followed by semi-permanent activitythat included several medium-sized eruptions over a periodof about 300 years. This period ended with the eruption on18 March 1944, the last eruption of Mt. Vesuvius. Currentactivity is characterized by a fumarolic field inside the crater,and by moderate seismicity, consisting of a few hundred low
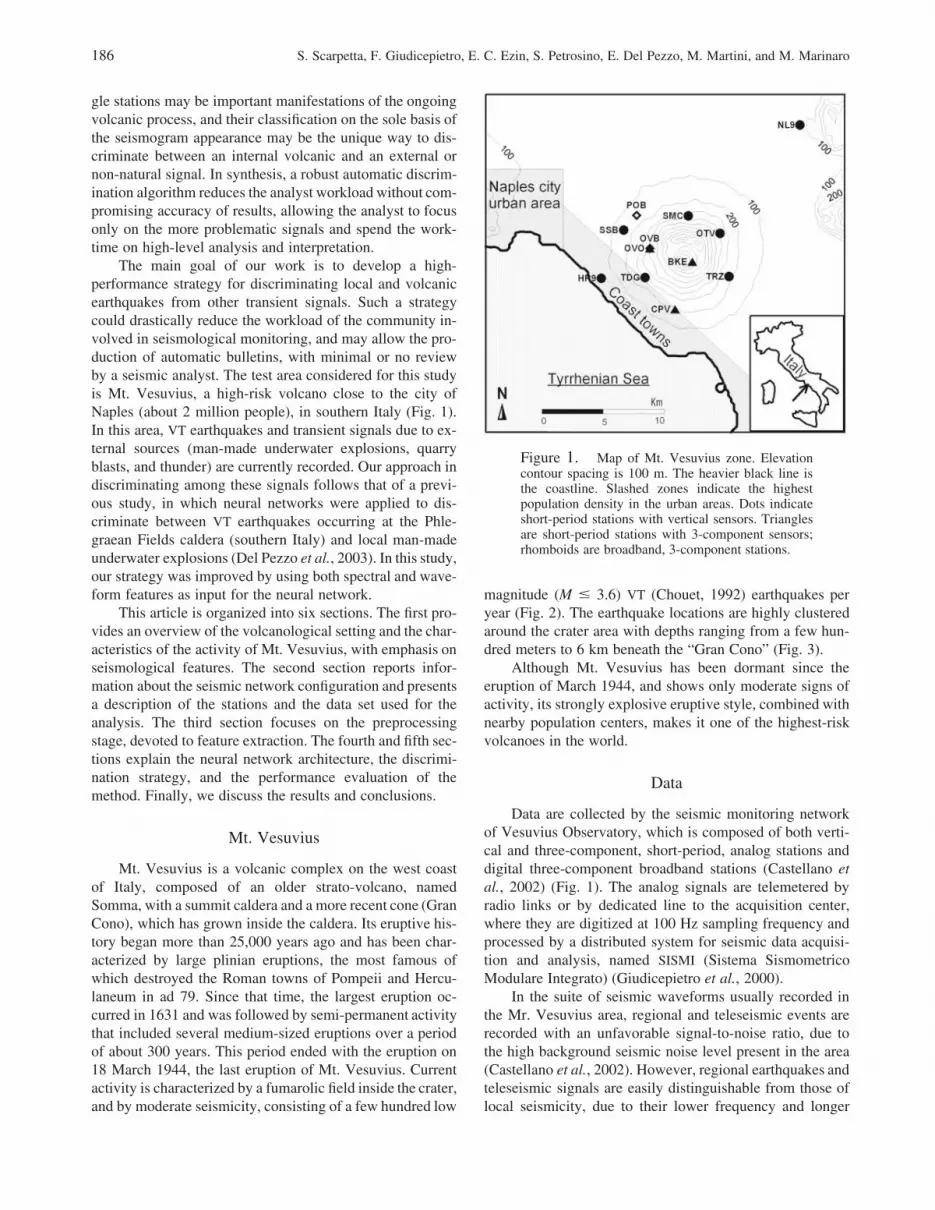
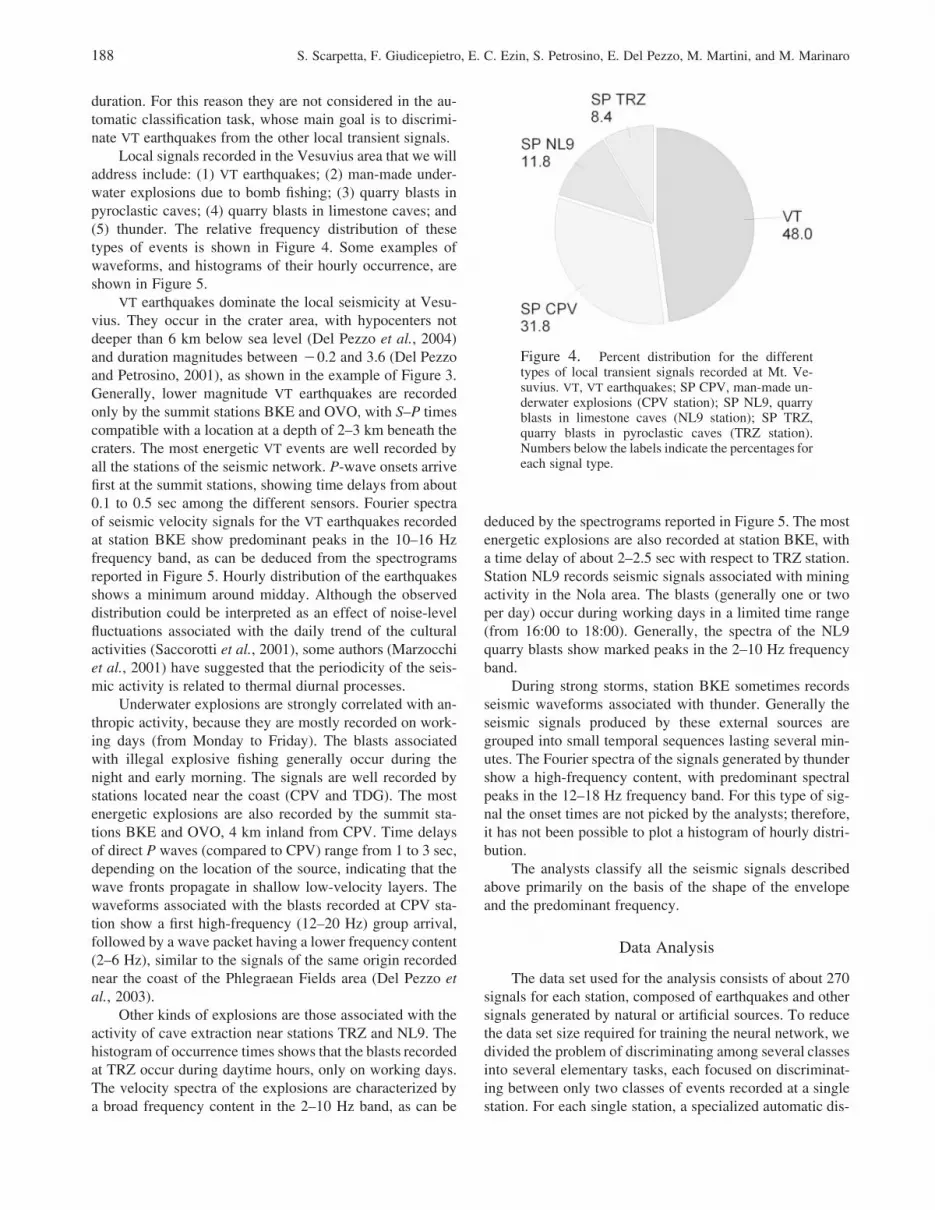
magnitude (M � 3.6) VT (Chouet, 1992) earthquakes peryear (Fig. 2). The earthquake locations are highly clusteredaround the crater area with depths ranging from a few hun-dred meters to 6 km beneath the “Gran Cono” (Fig. 3).
Although Mt. Vesuvius has been dormant since theeruption of March 1944, and shows only moderate signs ofactivity, its strongly explosive eruptive style, combined withnearby population centers, makes it one of the highest-riskvolcanoes in the world.
Data
Data are collected by the seismic monitoring networkof Vesuvius Observatory, which is composed of both verti-cal and three-component, short-period, analog stations anddigital three-component broadband stations (Castellano etal., 2002) (Fig. 1). The analog signals are telemetered byradio links or by dedicated line to the acquisition center,where they are digitized at 100 Hz sampling frequency andprocessed by a distributed system for seismic data acquisi-tion and analysis, named SISMI (Sistema SismometricoModulare Integrato) (Giudicepietro et al., 2000).
In the suite of seismic waveforms usually recorded inthe Mr. Vesuvius area, regional and teleseismic events arerecorded with an unfavorable signal-to-noise ratio, due tothe high background seismic noise level present in the area(Castellano et al., 2002). However, regional earthquakes andteleseismic signals are easily distinguishable from those oflocal seismicity, due to their lower frequency and longer
Automatic Classification of Seismic Signals at Mt. Vesuvius Volcano, Italy, Using Neural Networks 187
Figure 2. Histogram of the annual numbersof VT events at Mt. Vesuvius since 1981.
Figure 3. Locations (circles) of the VT earthquakes occurring at Mt. Vesuvius fromJanuary to July, 2002. Triangles indicate locations of seismic stations whose names arereported in Fig. 1. The upper-right and lower-left panels are, respectively, the N–S andW–E sections. The lower-right panel represents the distribution of the event depths.Circle size is proportional to magnitude, within the range 1.0–3.0.
188 S. Scarpetta, F. Giudicepietro, E. C. Ezin, S. Petrosino, E. Del Pezzo, M. Martini, and M. Marinaro
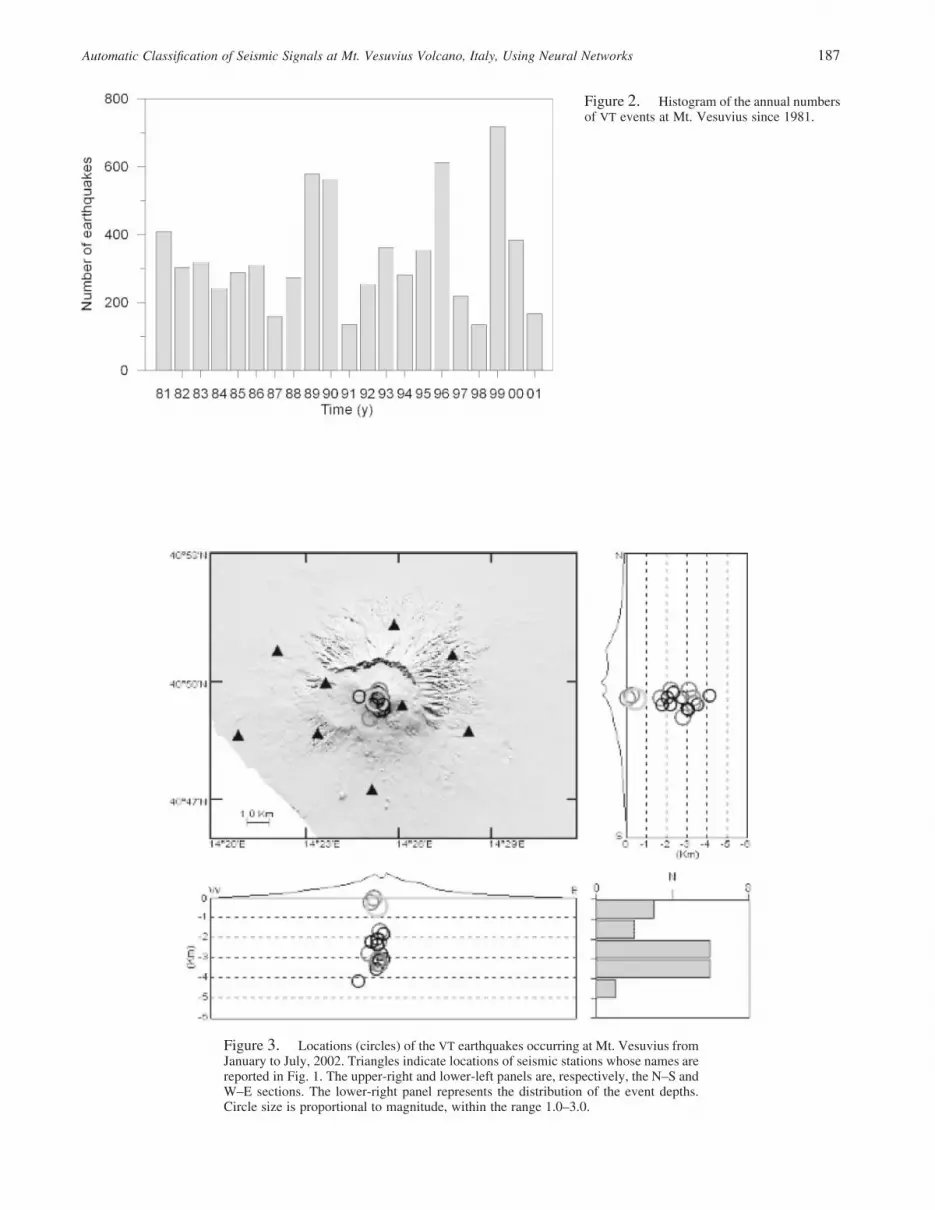
Figure 4. Percent distribution for the differenttypes of local transient signals recorded at Mt. Ve-suvius. VT, VT earthquakes; SP CPV, man-made un-derwater explosions (CPV station); SP NL9, quarryblasts in limestone caves (NL9 station); SP TRZ,quarry blasts in pyroclastic caves (TRZ station).Numbers below the labels indicate the percentages foreach signal type.
duration. For this reason they are not considered in the au-tomatic classification task, whose main goal is to discrimi-nate VT earthquakes from the other local transient signals.
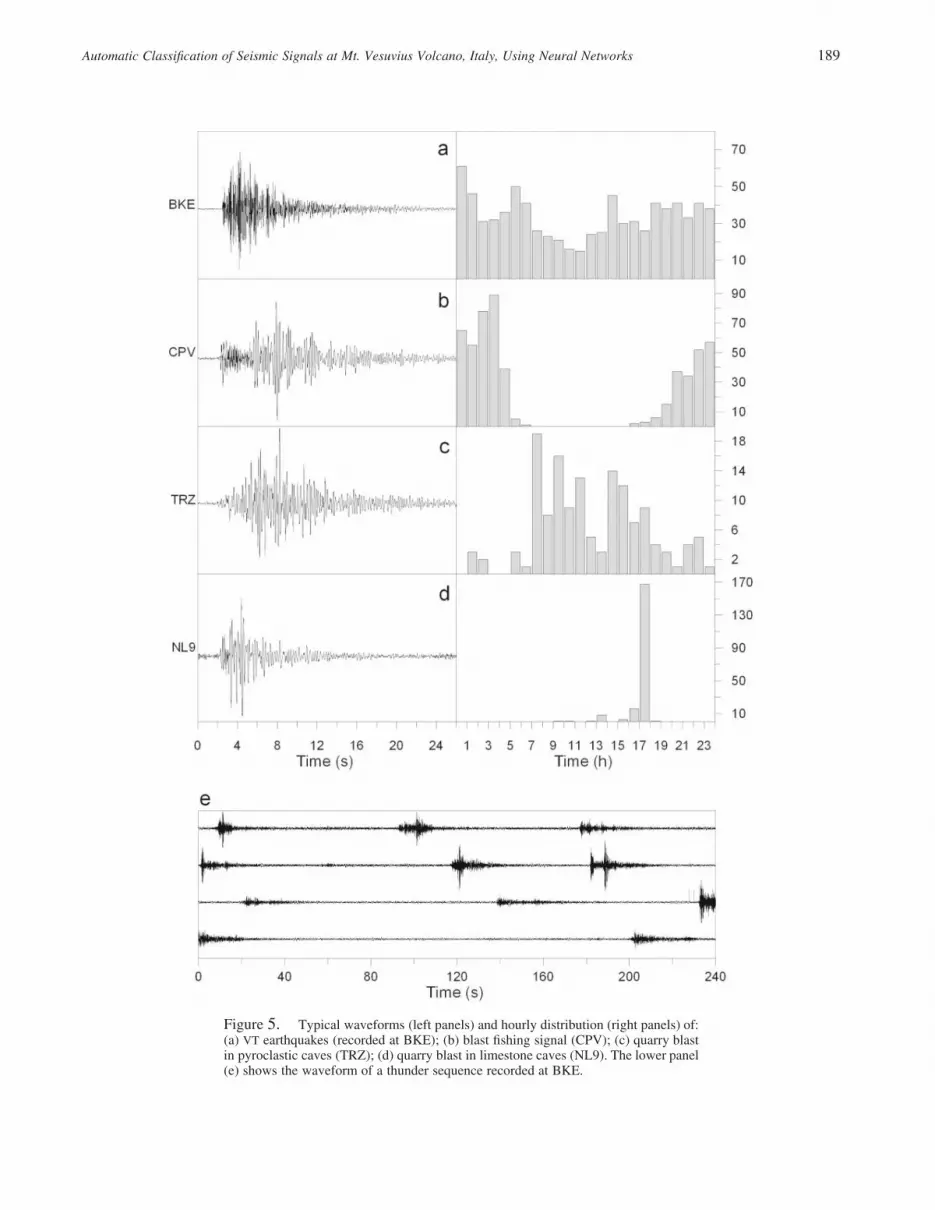
Local signals recorded in the Vesuvius area that we willaddress include: (1) VT earthquakes; (2) man-made under-water explosions due to bomb fishing; (3) quarry blasts inpyroclastic caves; (4) quarry blasts in limestone caves; and(5) thunder. The relative frequency distribution of thesetypes of events is shown in Figure 4. Some examples ofwaveforms, and histograms of their hourly occurrence, areshown in Figure 5.
VT earthquakes dominate the local seismicity at Vesu-vius. They occur in the crater area, with hypocenters notdeeper than 6 km below sea level (Del Pezzo et al., 2004)and duration magnitudes between �0.2 and 3.6 (Del Pezzoand Petrosino, 2001), as shown in the example of Figure 3.Generally, lower magnitude VT earthquakes are recordedonly by the summit stations BKE and OVO, with S–P timescompatible with a location at a depth of 2–3 km beneath thecraters. The most energetic VT events are well recorded byall the stations of the seismic network. P-wave onsets arrivefirst at the summit stations, showing time delays from about0.1 to 0.5 sec among the different sensors. Fourier spectraof seismic velocity signals for the VT earthquakes recordedat station BKE show predominant peaks in the 10–16 Hzfrequency band, as can be deduced from the spectrogramsreported in Figure 5. Hourly distribution of the earthquakesshows a minimum around midday. Although the observeddistribution could be interpreted as an effect of noise-levelfluctuations associated with the daily trend of the culturalactivities (Saccorotti et al., 2001), some authors (Marzocchiet al., 2001) have suggested that the periodicity of the seis-mic activity is related to thermal diurnal processes.
Underwater explosions are strongly correlated with an-thropic activity, because they are mostly recorded on work-ing days (from Monday to Friday). The blasts associatedwith illegal explosive fishing generally occur during thenight and early morning. The signals are well recorded bystations located near the coast (CPV and TDG). The mostenergetic explosions are also recorded by the summit sta-tions BKE and OVO, 4 km inland from CPV. Time delaysof direct P waves (compared to CPV) range from 1 to 3 sec,depending on the location of the source, indicating that thewave fronts propagate in shallow low-velocity layers. Thewaveforms associated with the blasts recorded at CPV sta-tion show a first high-frequency (12–20 Hz) group arrival,followed by a wave packet having a lower frequency content(2–6 Hz), similar to the signals of the same origin recordednear the coast of the Phlegraean Fields area (Del Pezzo etal., 2003).
Other kinds of explosions are those associated with theactivity of cave extraction near stations TRZ and NL9. Thehistogram of occurrence times shows that the blasts recordedat TRZ occur during daytime hours, only on working days.The velocity spectra of the explosions are characterized bya broad frequency content in the 2–10 Hz band, as can be
deduced by the spectrograms reported in Figure 5. The mostenergetic explosions are also recorded at station BKE, witha time delay of about 2–2.5 sec with respect to TRZ station.Station NL9 records seismic signals associated with miningactivity in the Nola area. The blasts (generally one or twoper day) occur during working days in a limited time range(from 16:00 to 18:00). Generally, the spectra of the NL9quarry blasts show marked peaks in the 2–10 Hz frequencyband.
During strong storms, station BKE sometimes recordsseismic waveforms associated with thunder. Generally theseismic signals produced by these external sources aregrouped into small temporal sequences lasting several min-utes. The Fourier spectra of the signals generated by thundershow a high-frequency content, with predominant spectralpeaks in the 12–18 Hz frequency band. For this type of sig-nal the onset times are not picked by the analysts; therefore,it has not been possible to plot a histogram of hourly distri-bution.
The analysts classify all the seismic signals describedabove primarily on the basis of the shape of the envelopeand the predominant frequency.
Data Analysis
The data set used for the analysis consists of about 270signals for each station, composed of earthquakes and othersignals generated by natural or artificial sources. To reducethe data set size required for training the neural network, wedivided the problem of discriminating among several classesinto several elementary tasks, each focused on discriminat-ing between only two classes of events recorded at a singlestation. For each single station, a specialized automatic dis-
Automatic Classification of Seismic Signals at Mt. Vesuvius Volcano, Italy, Using Neural Networks 189
Figure 5. Typical waveforms (left panels) and hourly distribution (right panels) of:(a) VT earthquakes (recorded at BKE); (b) blast fishing signal (CPV); (c) quarry blastin pyroclastic caves (TRZ); (d) quarry blast in limestone caves (NL9). The lower panel(e) shows the waveform of a thunder sequence recorded at BKE.
190 S. Scarpetta, F. Giudicepietro, E. C. Ezin, S. Petrosino, E. Del Pezzo, M. Martini, and M. Marinaro
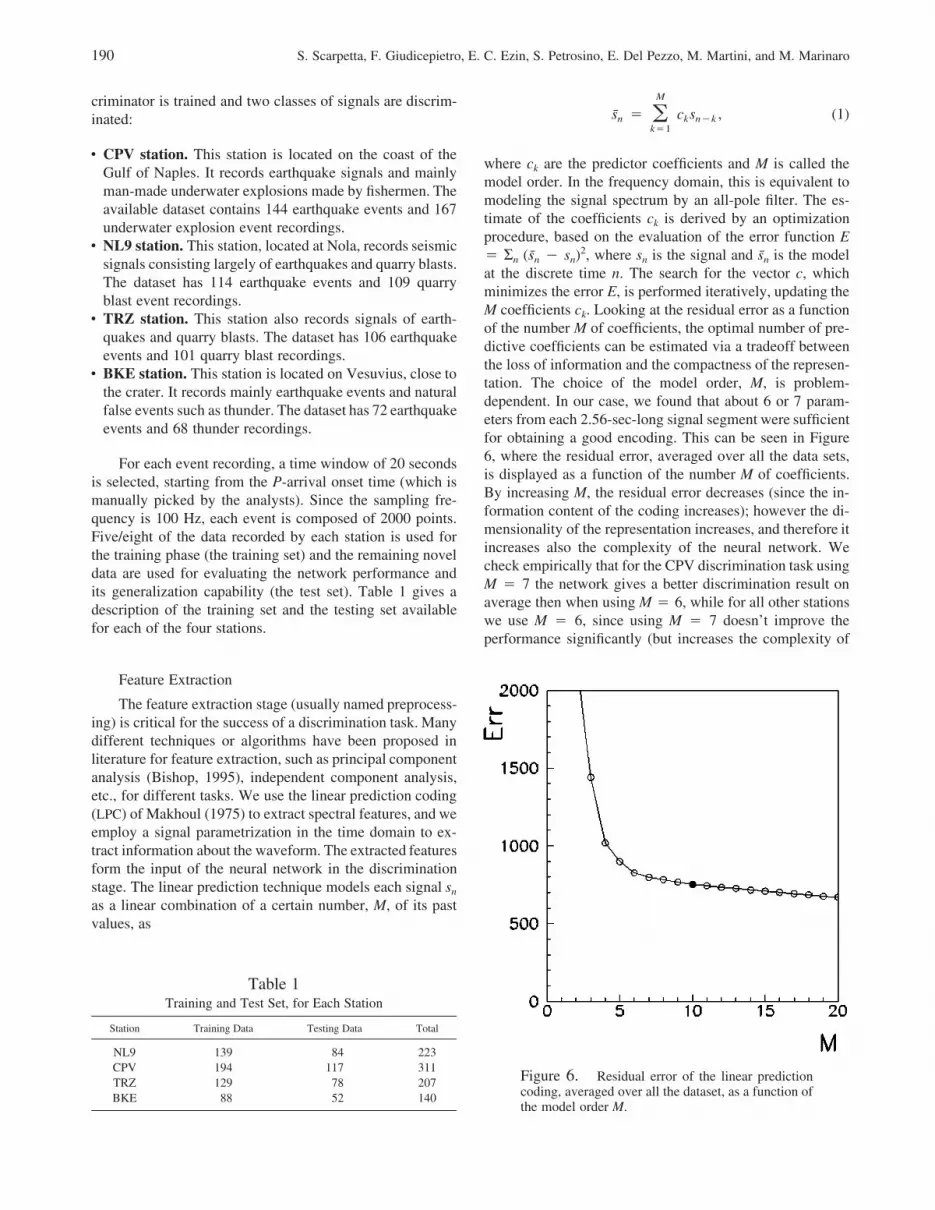
Figure 6. Residual error of the linear predictioncoding, averaged over all the dataset, as a function ofthe model order M.
criminator is trained and two classes of signals are discrim-inated:
• CPV station. This station is located on the coast of theGulf of Naples. It records earthquake signals and mainlyman-made underwater explosions made by fishermen. Theavailable dataset contains 144 earthquake events and 167underwater explosion event recordings.
• NL9 station. This station, located at Nola, records seismicsignals consisting largely of earthquakes and quarry blasts.The dataset has 114 earthquake events and 109 quarryblast event recordings.
• TRZ station. This station also records signals of earth-quakes and quarry blasts. The dataset has 106 earthquakeevents and 101 quarry blast recordings.
• BKE station. This station is located on Vesuvius, close tothe crater. It records mainly earthquake events and naturalfalse events such as thunder. The dataset has 72 earthquakeevents and 68 thunder recordings.
For each event recording, a time window of 20 secondsis selected, starting from the P-arrival onset time (which ismanually picked by the analysts). Since the sampling fre-quency is 100 Hz, each event is composed of 2000 points.Five/eight of the data recorded by each station is used forthe training phase (the training set) and the remaining noveldata are used for evaluating the network performance andits generalization capability (the test set). Table 1 gives adescription of the training set and the testing set availablefor each of the four stations.
Feature Extraction
The feature extraction stage (usually named preprocess-ing) is critical for the success of a discrimination task. Manydifferent techniques or algorithms have been proposed inliterature for feature extraction, such as principal componentanalysis (Bishop, 1995), independent component analysis,etc., for different tasks. We use the linear prediction coding(LPC) of Makhoul (1975) to extract spectral features, and weemploy a signal parametrization in the time domain to ex-tract information about the waveform. The extracted featuresform the input of the neural network in the discriminationstage. The linear prediction technique models each signal sn
as a linear combination of a certain number, M, of its pastvalues, as
M
s � c s , (1)n � k n�kk�1
where ck are the predictor coefficients and M is called themodel order. In the frequency domain, this is equivalent tomodeling the signal spectrum by an all-pole filter. The es-timate of the coefficients ck is derived by an optimizationprocedure, based on the evaluation of the error function E� Rn (sn � sn)
2, where sn is the signal and sn is the modelat the discrete time n. The search for the vector c, whichminimizes the error E, is performed iteratively, updating theM coefficients ck. Looking at the residual error as a functionof the number M of coefficients, the optimal number of pre-dictive coefficients can be estimated via a tradeoff betweenthe loss of information and the compactness of the represen-tation. The choice of the model order, M, is problem-dependent. In our case, we found that about 6 or 7 param-eters from each 2.56-sec-long signal segment were sufficientfor obtaining a good encoding. This can be seen in Figure6, where the residual error, averaged over all the data sets,is displayed as a function of the number M of coefficients.By increasing M, the residual error decreases (since the in-formation content of the coding increases); however the di-mensionality of the representation increases, and therefore itincreases also the complexity of the neural network. Wecheck empirically that for the CPV discrimination task usingM � 7 the network gives a better discrimination result onaverage then when using M � 6, while for all other stationswe use M � 6, since using M � 7 doesn’t improve theperformance significantly (but increases the complexity of
Automatic Classification of Seismic Signals at Mt. Vesuvius Volcano, Italy, Using Neural Networks 191
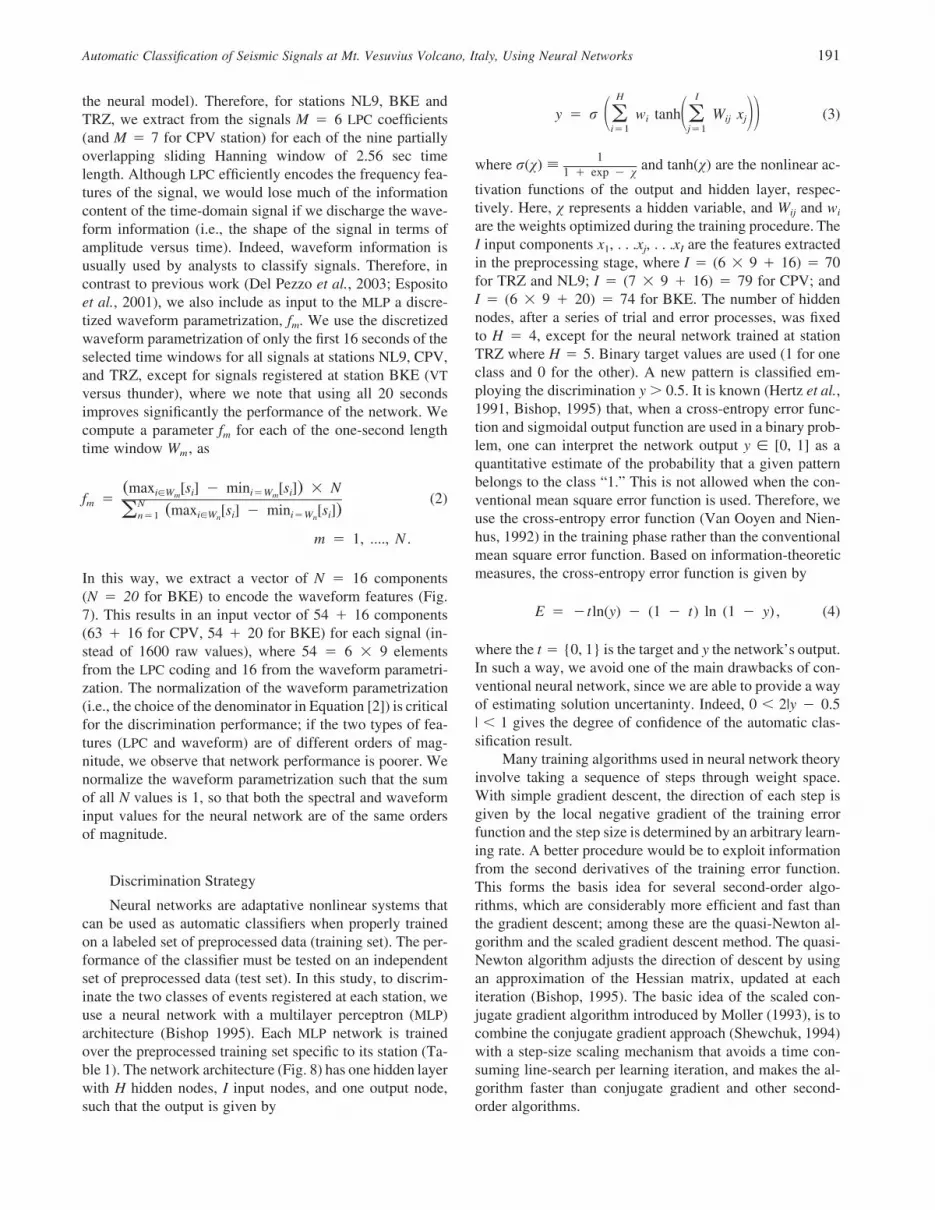
the neural model). Therefore, for stations NL9, BKE andTRZ, we extract from the signals M � 6 LPC coefficients(and M � 7 for CPV station) for each of the nine partiallyoverlapping sliding Hanning window of 2.56 sec timelength. Although LPC efficiently encodes the frequency fea-tures of the signal, we would lose much of the informationcontent of the time-domain signal if we discharge the wave-form information (i.e., the shape of the signal in terms ofamplitude versus time). Indeed, waveform information isusually used by analysts to classify signals. Therefore, incontrast to previous work (Del Pezzo et al., 2003; Espositoet al., 2001), we also include as input to the MLP a discre-tized waveform parametrization, fm. We use the discretizedwaveform parametrization of only the first 16 seconds of theselected time windows for all signals at stations NL9, CPV,and TRZ, except for signals registered at station BKE (VTversus thunder), where we note that using all 20 secondsimproves significantly the performance of the network. Wecompute a parameter fm for each of the one-second lengthtime window Wm, as
(max [s ] � min [s ]) � Ni�W i i�W im mf � (2)m N (max [s ] � min [s ])� i�W i i�W in�1 n n
m � 1, ...., N .
In this way, we extract a vector of N � 16 components(N � 20 for BKE) to encode the waveform features (Fig.7). This results in an input vector of 54 � 16 components(63 � 16 for CPV, 54 � 20 for BKE) for each signal (in-stead of 1600 raw values), where 54 � 6 � 9 elementsfrom the LPC coding and 16 from the waveform parametri-zation. The normalization of the waveform parametrization(i.e., the choice of the denominator in Equation [2]) is criticalfor the discrimination performance; if the two types of fea-tures (LPC and waveform) are of different orders of mag-nitude, we observe that network performance is poorer. Wenormalize the waveform parametrization such that the sumof all N values is 1, so that both the spectral and waveforminput values for the neural network are of the same ordersof magnitude.
Discrimination Strategy
Neural networks are adaptative nonlinear systems thatcan be used as automatic classifiers when properly trainedon a labeled set of preprocessed data (training set). The per-formance of the classifier must be tested on an independentset of preprocessed data (test set). In this study, to discrim-inate the two classes of events registered at each station, weuse a neural network with a multilayer perceptron (MLP)architecture (Bishop 1995). Each MLP network is trainedover the preprocessed training set specific to its station (Ta-ble 1). The network architecture (Fig. 8) has one hidden layerwith H hidden nodes, I input nodes, and one output node,such that the output is given by
H I
y � r w tanh W x (3)� i � ij j� � ��i�1 j�1
where r(v) � and tanh(v) are the nonlinear ac-1
1 � exp � v
tivation functions of the output and hidden layer, respec-tively. Here, v represents a hidden variable, and Wij and wi
are the weights optimized during the training procedure. TheI input components x1, . . .xj, . . .xI are the features extractedin the preprocessing stage, where I � (6 � 9 � 16) � 70for TRZ and NL9; I � (7 � 9 � 16) � 79 for CPV; andI � (6 � 9 � 20) � 74 for BKE. The number of hiddennodes, after a series of trial and error processes, was fixedto H � 4, except for the neural network trained at stationTRZ where H � 5. Binary target values are used (1 for oneclass and 0 for the other). A new pattern is classified em-ploying the discrimination y � 0.5. It is known (Hertz et al.,1991, Bishop, 1995) that, when a cross-entropy error func-tion and sigmoidal output function are used in a binary prob-lem, one can interpret the network output y � [0, 1] as aquantitative estimate of the probability that a given patternbelongs to the class “1.” This is not allowed when the con-ventional mean square error function is used. Therefore, weuse the cross-entropy error function (Van Ooyen and Nien-hus, 1992) in the training phase rather than the conventionalmean square error function. Based on information-theoreticmeasures, the cross-entropy error function is given by
E � �tln(y) � (1 � t) ln (1 � y) , (4)
where the t � {0, 1} is the target and y the network’s output.In such a way, we avoid one of the main drawbacks of con-ventional neural network, since we are able to provide a wayof estimating solution uncertaninty. Indeed, 0 � 2|y � 0.5| � 1 gives the degree of confidence of the automatic clas-sification result.
Many training algorithms used in neural network theoryinvolve taking a sequence of steps through weight space.With simple gradient descent, the direction of each step isgiven by the local negative gradient of the training errorfunction and the step size is determined by an arbitrary learn-ing rate. A better procedure would be to exploit informationfrom the second derivatives of the training error function.This forms the basis idea for several second-order algo-rithms, which are considerably more efficient and fast thanthe gradient descent; among these are the quasi-Newton al-gorithm and the scaled gradient descent method. The quasi-Newton algorithm adjusts the direction of descent by usingan approximation of the Hessian matrix, updated at eachiteration (Bishop, 1995). The basic idea of the scaled con-jugate gradient algorithm introduced by Moller (1993), is tocombine the conjugate gradient approach (Shewchuk, 1994)with a step-size scaling mechanism that avoids a time con-suming line-search per learning iteration, and makes the al-gorithm faster than conjugate gradient and other second-order algorithms.
192 S. Scarpetta, F. Giudicepietro, E. C. Ezin, S. Petrosino, E. Del Pezzo, M. Martini, and M. Marinaro
Figure 7. Figure represents the features extracted from (a) VT earthquake at BKE,(b) thunder at BKE, (c) underwater explosion at CPV, and (d) quarry blast in a lime-stone cave at NL9. In each panel, the upper plot represents the trace; the middle plotis the spectrogram (LPC); and in the lower plot the fm parameter of equation (2) isplotted as a function of the lapse time.
Results
We trained the MLP network using input features de-scribed in the third section, using both algorithms describedin the previous section, and we evaluated the percentage ofcorrect classification on the test set. The best performanceobtained on the test set, after training, is shown in Table 2for each of the four MLP networks (NL9, BKE, CPV, TRZ).As shown in Table 2, the computational time required forthe scaled conjugate gradient algorithm is less than that re-quired for the quasi-Newton method, while both algorithmsgive similar good performance.
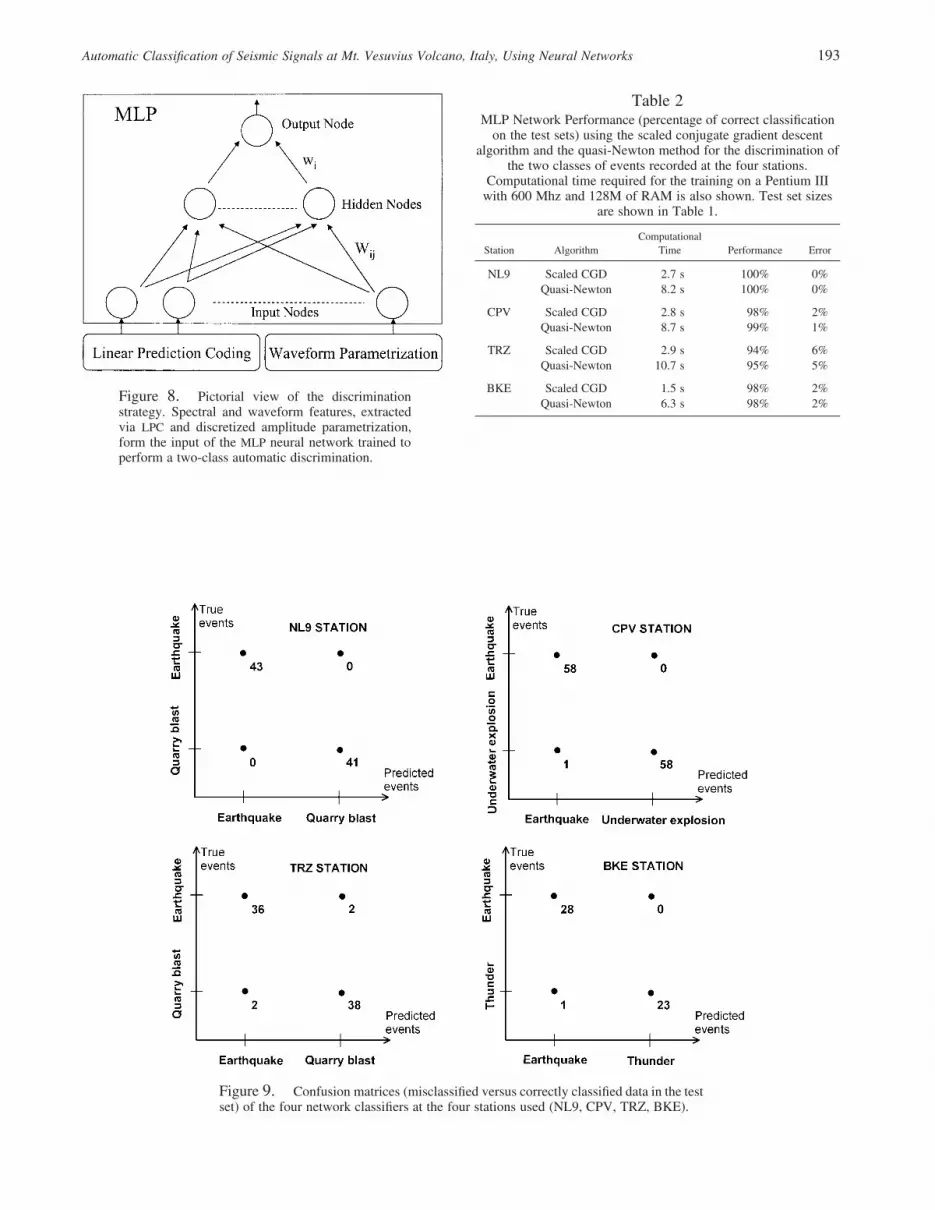
Confusion matrices (of the networks trained usingquasi-Newton algorithm) indicating how many test data ofclass 0 or 1 have been misclassified, and how many havebeen classified correctly, are shown in Figure 9.
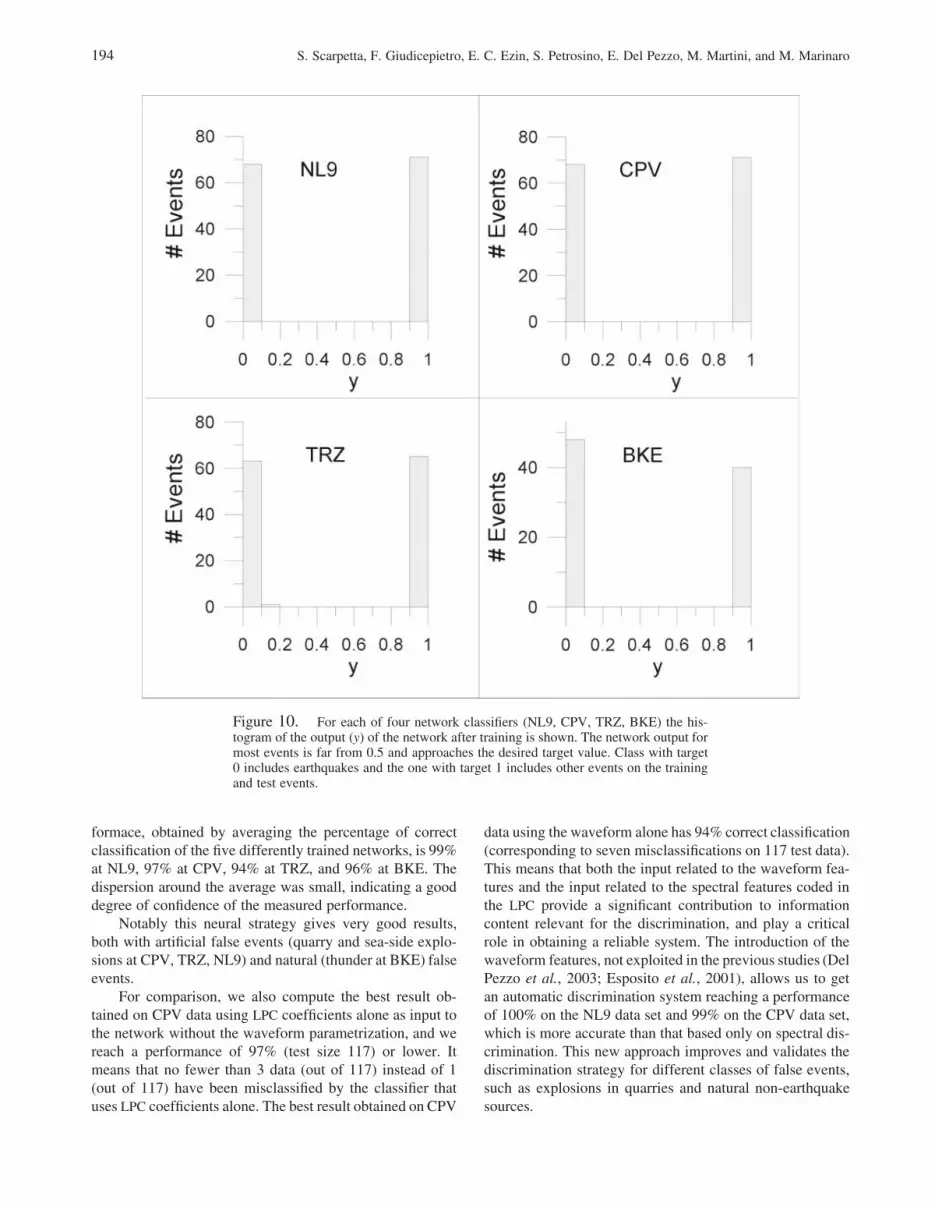
We also show the corresponding distribution of the net-work outputs y for the two classes of events. In Figure 10,
histograms of the value of y are shown both for the trainingevents and the test events, for each of the four networks.Notably, the network output for most of the events ap-proaches the desired target values (1 for one class and 0 forthe other) and is far from the value 0.5 that correspond touncertainty. This supports the reliability of the method. FromFigure 10 we see that most of the patterns are classified bythe network with a high degree of confidence 0 � 2|y � 0.5|� 1.
To further assess the network generalization capabili-ties, five different data sets, each composed of a training anda test set, were obtained through a permutation of all theavailable data, and the network was separately trained andtested on each of them. The percentage of correct classifi-cation given for each of the five test sets (that are data newto the network, since they have not been used for training)are very similar to one another. The average network per-
Automatic Classification of Seismic Signals at Mt. Vesuvius Volcano, Italy, Using Neural Networks 193
Figure 8. Pictorial view of the discriminationstrategy. Spectral and waveform features, extractedvia LPC and discretized amplitude parametrization,form the input of the MLP neural network trained toperform a two-class automatic discrimination.
Table 2MLP Network Performance (percentage of correct classification
on the test sets) using the scaled conjugate gradient descentalgorithm and the quasi-Newton method for the discrimination of
the two classes of events recorded at the four stations.Computational time required for the training on a Pentium III
with 600 Mhz and 128M of RAM is also shown. Test set sizesare shown in Table 1.
Station AlgorithmComputational
Time Performance Error
NL9 Scaled CGD 2.7 s 100% 0%Quasi-Newton 8.2 s 100% 0%
CPV Scaled CGD 2.8 s 98% 2%Quasi-Newton 8.7 s 99% 1%
TRZ Scaled CGD 2.9 s 94% 6%Quasi-Newton 10.7 s 95% 5%
BKE Scaled CGD 1.5 s 98% 2%Quasi-Newton 6.3 s 98% 2%
Figure 9. Confusion matrices (misclassified versus correctly classified data in the testset) of the four network classifiers at the four stations used (NL9, CPV, TRZ, BKE).
194 S. Scarpetta, F. Giudicepietro, E. C. Ezin, S. Petrosino, E. Del Pezzo, M. Martini, and M. Marinaro
formace, obtained by averaging the percentage of correctclassification of the five differently trained networks, is 99%at NL9, 97% at CPV, 94% at TRZ, and 96% at BKE. Thedispersion around the average was small, indicating a gooddegree of confidence of the measured performance.
Notably this neural strategy gives very good results,both with artificial false events (quarry and sea-side explo-sions at CPV, TRZ, NL9) and natural (thunder at BKE) falseevents.
For comparison, we also compute the best result ob-tained on CPV data using LPC coefficients alone as input tothe network without the waveform parametrization, and wereach a performance of 97% (test size 117) or lower. Itmeans that no fewer than 3 data (out of 117) instead of 1(out of 117) have been misclassified by the classifier thatuses LPC coefficients alone. The best result obtained on CPV
data using the waveform alone has 94% correct classification(corresponding to seven misclassifications on 117 test data).This means that both the input related to the waveform fea-tures and the input related to the spectral features coded inthe LPC provide a significant contribution to informationcontent relevant for the discrimination, and play a criticalrole in obtaining a reliable system. The introduction of thewaveform features, not exploited in the previous studies (DelPezzo et al., 2003; Esposito et al., 2001), allows us to getan automatic discrimination system reaching a performanceof 100% on the NL9 data set and 99% on the CPV data set,which is more accurate than that based only on spectral dis-crimination. This new approach improves and validates thediscrimination strategy for different classes of false events,such as explosions in quarries and natural non-earthquakesources.
Figure 10. For each of four network classifiers (NL9, CPV, TRZ, BKE) the his-togram of the output (y) of the network after training is shown. The network output formost events is far from 0.5 and approaches the desired target value. Class with target0 includes earthquakes and the one with target 1 includes other events on the trainingand test events.
Automatic Classification of Seismic Signals at Mt. Vesuvius Volcano, Italy, Using Neural Networks 195
Discussion and Conclusions
We have developed and tested a successful strategy forclassifying different types of seismic signals recorded by themonitoring network at Mt. Vesuvius. Following our previ-ous study, using data from the Phlegraean Fields (Del Pezzoet al., 2003), we have approached this problem using neuralnetworks. One of the advantages of this approach is that itcan use the whole seismogram, instead of attributes of par-ticular phases, which usually cannot be detected in the re-cords of local earthquakes.
A new method for feature extraction has been intro-duced. It is based on the combination of a waveform pa-rameterization in the time domain, and LPC algorithm thatprovides compressed and robust data representation in thefrequency domain. Automatic classification has been per-formed using a multilayer perceptron trained with the quasi-Newton algorithm and the scaled conjugate gradient descent,which has been found to be a fast algorithm. This strategygives very good results, achieving performance ranging from95% to 100% correct classification (on the test set) for dif-ferent stations.
The data sets used for the present study were recordedat Mt. Vesuvius over the last three years and include VTearthquakes and transient signals due to other sources suchas underwater explosions, quarry blasts, and thunder. To re-duce the data set size required for training the network, wedivided the problem of discriminating among several classesinto elementary tasks focused on discriminating between twoclasses of events recorded at single stations. For each singlestation, a dicotomic specialized automatic discriminator istrained. This not only reduces the number of records requiredfor the analysis, but also in some cases can allow us to ad-dress the trade-off between source and path effects that affectthe shape of the waveform. Local signals can be stronglyaffected by path effects, and can show different features inseismograms recorded at different stations. For example, thisis the case of the underwater explosions caused by blast fish-ing in the Gulf of Naples, discussed in Del Pezzo et al.(2003). These explosions appear very similar to earthquakesat some stations, whereas they show a characteristic signa-ture, with a low-frequency wave packet, at other stations.
By adopting the station-specialized neural discrimina-tors trained for distinguishing two different types of signals,it is possible to discriminate among several kinds of signals.The set of the outputs from the different discriminators maybe viewed as an information vector on which a second sim-ple neural network might be trained to get a single classifi-cation output. In the future, we will focus on this aspect todefine an appropriate technique for discriminating amongdifferent combinations of the results from our automaticclassifiers. Our goal is to integrate these methods into themonitoring system of the high risk volcanoes of Mt. Vesu-vius and Phlegraean Fields. Moreover, the implementationof such a method not only can reduce the routine and repet-itive work required for analyzing data, but also can be used
to establish standalone monitoring systems. Such systemsmight be able to collect, classify, and process data withouthuman analyst review in regions with unfavorable naturalconditions, such as many active volcanoes in the world. Fi-nally, our results suggest that this strategy may be able todiscriminate among other different types of seismic signalsrelated to volcanic activity. We hope to test this hypothesisusing data recorded during a volcanic unrest.
Acknowledgments
Charlotte Rowe is gratefully acknowledged for the critical revision ofthe manuscript and for many helpful suggestions. We also thank the anon-ymous reviewers for the usefull comments and suggestions.
This manuscript was prepared with AGU’s LATEX macros v5, withthe extension package ‘AGU��’ by P. W. Daly, version 1.6b from 1999/08/19.
References
Bishop, C. (1995). Neural networks For Pattern Recognition, Oxford Univ.Press.
Castellano, M., C. Buonocunto, M. Capello, and M. La Rocca (2002). Seis-mic surveillance of active volcanoes: the Osservatorio VesuvianoSeismic Network (OVSN Southern Italy), Seism. Res. Lett. 73, 177–184.
Chouet, B. A. (1992). A seismic model for the source of long-period eventsand harmonic tremor, in Volcanic Seismology, P. Gasparini, R.Scarpa, and K. Aki (Editors), IAVCEI Proceedings in Volcanology,Vol. 3, Springer-Verlag, Berlin, 23 pp.
Del Pezzo, E., and S. Petrosino (2001). A local-magnitude scale for Mt.Vesuvius from synthetic Wood-Anderson seismograms, J. Seism. 5,207–215.
Del Pezzo, E., F. Bianco, and G. Saccorotti (2004). Seismic source dynam-ics at Mt. Vesuvius volcano, Italy. J. Volcanol. Geoth. Res. 133,23–39.
Del Pezzo, E., A. Esposito, F. Giudicepietro, M. Marinaro, M. Martini, andS. Scarpetta (2003). Discrimination of earthquakes and underwaterexplosions using neural networks, Bull. Seism. Soc. Am. 93, 215–223.
Esposito, A., M. Falanga, M. Funaro, M. Marinaro, and S. Scarpetta (2001).Signal Classification using Neural Networks, in Proceedings of WIRN’01 (Workshop Italiano Reti Neurali) 17–19 May 2001, Vietri, pp.187–1192.
Falsaperla, S., S. Graziani, G. Nunnari, and S. Spampinato (1996). Auto-matic classification of volcanic earthquakes by using multi-layeredneural networks, Natural Hazards 13, 205–228.
Fedorenko, Y., E. S. Husebye, and B. O. Ruud (1999). Explosion site rec-ognition: neural net discriminator using single three-component sta-tions, Phys. Earth Planet. Interiors 113, 131–142.
Gendron, P., J. Ebel, and D. Manolakis (2000). Rapid joint detection andclassification with wavelet bases via bayes Theorem, Bull. Seism. Soc.Am. 90, 764–774.
Giudicepietro, F., W. De Cesare, M. Martini, and V. Meglio, (2000). IlSistema Sismometrico Modulare Integrato (SISMI). Open-File ReportOsservatorio Vesuviano INGV, no. 6, 2000 (in Italian).
Hertz, J., A. Krogh, and G. Richard (1991). Introduction to the Theory ofNeural Computation, Addison-Wesley, Redwood City.
Hoffmann, W., R. Kebeasy, and P. Firbas (1999). Introduction to the ver-ification regime of the Comprehensive Nuclear-Test-Ban Treaty,Phys. Earth Planet. Int. 113, 5–9.
Joswig, M. (1990). Pattern recognition for earthquake detection, Bull.Seism. Soc. Am. 80, 170–186.
196 S. Scarpetta, F. Giudicepietro, E. C. Ezin, S. Petrosino, E. Del Pezzo, M. Martini, and M. Marinaro
Kushnir, A. F., V. M. Lapshin, V. I. Pinsky, and J. Fyen (1990). Statisticallyoptimal event detection using small array data, Bull. Seism. Soc. Am.80, 1934–1950.
Kushnir, A. F., E. V. Troitsky, L. M. Haikin, and A. Dainty (1999). Statis-tical classification approach to discrimination between weak earth-quakes and quarry blasts recorded by the Israel Seismic Network,Phys. Earth Planet. Int. 113, 161–182.
Makhoul, J. (1975). Linear Prediction: A Tutorial Review, in Proceedingsof the IEEE 63.
Marzocchi, W., G. Vilardo, D. P. Hill, G. P. Ricciardi, and C. Ricco (2001).Common features and peculiarity of the seismic activity at PhlegraeanFields, Long Valley, and Vesuvius. Bull. Seism. Soc. Am. 91, 191–205.
Moller, M. (1993). A scaled conjugate gradient algorithm for fast super-vised learning, Neural Networks 6, 525–533.
Musil, M., and A. Plesinger (1996). Discrimination between local micro-earthquakes and quarry blasts by multi-layer perceptrons and kohonenmaps, Bull. Seism. Soc. Am. 86, 1077–1090.
Saccorotti, G., R. Maresca, and E. Del Pezzo (2001). Array analyses ofseismic noise at Mt. Vesuvius volcano, Italy, J. Volcanol. Geotherm.Res. 110, 79–100.
Shewchuk, J. R. (1994). An Introduction to the Conjugate Gradient MethodWithout the Agonizing Pain, Technical Report CMU-CS-94-125,Carnegie Mellon University, Pittsburgh.
Shumway, R.H. (1996). Statistical Approaches to Seismic Discrimination,in Monitoring a Comprehensive Test Ban Treaty, E. S. Husebye andA. M. Dainty (Editors), NATO Advanced Science Institute Series,Kluwer Academic Publishers, Boston, 791–803.
Tarvainen, M. (1999). Recognizing explosion sites with a self-organizingnetwork for unsupervised learning, Phys. Earth Planet. Int. 113, 143–154.
Ursino, A., H. Langer, L. Scarfı, G. Di Grazia, and S. Gresta (2001). Dis-crimination of quarry blasts from tectonic microearthquakes in theHyblean Plateau (Southeastern Sicily), Annali di Geofisica 44, 703–722.
Van Ooyen, A., and B. Nienhuis (1992). Improving the convergence of thebackpropagation algorithm, Neural Networks 5, 465–471.
Wuster, J. (1993). Discrimination of chemical explosions and earthquakesin central europe—a case study, Bull. Seism. Soc. Am. 83, 1184–1212.
INFM & Dipartimento di Fisica “E. R. Caianiello”Universita di SalernoBaronissi (SA) Italy
(S.S., M.M.)
International Institute for Advanced Scientific StudiesVia G. Pellegrino 1984019 Vietri Sul Mare (SA) Italy
(E.C.E, M.M.)
Institut de Mathematiques et de Sciences PhysiquesBP 613 Porto-Novo, Benin