Earth and Planetary Science Letters 290 (2010) 403ndash414
Contents lists available at ScienceDirect
Earth and Planetary Science Letters
j ourna l homepage wwwe lsev ie rcom locate eps l
Stress magnitude and its temporal variation at Mt Asama Volcano Japan fromseismic anisotropy and GPS
Martha K Savage a Takao Ohminato b Yosuke Aoki b Hiroshi Tsuji b Sonja M Greve a
a Institute of Geophysics Victoria Univ of Wellington Box 600 Wellington 6041 New Zealandb Earthquake Research Institute University of Tokyo Tokyo Japan
Corresponding author Tel +64 44635961 fax +E-mail address MarthaSavagevuwacnz (MK Sav
0012-821X$ ndash see front matter copy 2009 Elsevier BV Adoi101016jepsl200912037
a b s t r a c t
a r t i c l e i n f o
Article historyReceived 9 August 2009Received in revised form 12 December 2009Accepted 22 December 2009Available online 18 January 2010
The Earths stress regime is fundamental to its physical processes yet few methods can determine absolutestress and measurements of temporal variations in stress are controversial The Global Positioning System(GPS) is used to measure stress-related deformation from magma movement and stress causes alignedcracks whose orientations may be measured by seismic anisotropy Here we show that changes inearthquake activity and ground surface deformation preceding and accompanying the eruption ofMt Asama Japan in 2004 correlate well with changes in the orientation and strength of seismic anisotropyThis correlation confirms the validity of anisotropy as a stress monitoring tool It can be used to determinethe crack aspect ratio (26times10minus5) and provides a new method of constraining the difference between themagnitudes of the two horizontal stresses ΔSH which is only about 10 of the vertical stress at Asama
64 44635186age)
ll rights reserved
copy 2009 Elsevier BV All rights reserved
1 Introduction
Stress drives all tectonic processes but at present the only way tomeasure the absolute stress amplitude in the Earth involves drillingboreholes which are expensive intrusive and technologically difficult(eg Townend 2006) Other techniques can provide some of thestress elements geodetic methods such as GPS and InSAR determinestrain changes which are interpreted as changes in stress (Dzurisin2003) Earthquake records can be used to determine the change instress after earthquakes (stress drops) Absolute stress tensororientations and a single ratio involving stress amplitudes can bemeasured at the earthquake source by inversions of fault orientationdata (focal mechanisms) (eg Arnold et al 2005) Stress orientationscan also be measured along the path between the earthquake andrecorder by measuring seismic anisotropy which is caused in theupper crust by aligned cracks that open and close in response tochanging stress conditions (eg Nur and Simmons 1969 Crampin1994 Boness and Zoback 2006)
Monitoring of stress changes to predict earthquakes and volcaniceruptions has long been a goal of seismologists However claims ofpredictive capability are often disputed and quantitative relationsbetween observed stress indicators are lacking Here we show that
average seismic anisotropy delay time variations correlate well withstrain changesmeasured fromGPS andwe combine the two techniquesto determine crack aspect ratios and to show that the differencebetween the magnitude of the two horizontal stresses ΔSH at Asamavolcano Japan is small (on the order of 10 of the vertical stress)
11 Anisotropy
Anisotropy causes two perpendicular components of shear wavesto travel with different speeds an effect called shear wave splitting orbirefringence the first arriving wave has a polarisation (ϕ) parallel tothe fast orientation of the anisotropic material and the delay time (dt)between the two waves depends upon the integrated effect ofanisotropy along the travel path Aligned cracks cause hexagonalanisotropy with a slow axis of symmetry that is perpendicular to thecrack plane orientations so the fast orientation is parallel to the cracks(eg Nur and Simmons 1969) Thus ϕ yields the average crackorientation inferred to be parallel to the maximum horizontal stress(SHmax) and dt is proportional to the path length and to crack density(eg Hudson 1981) Studies claiming variations in shear wavesplitting delay times as earthquake precursors are controversialbecause of concerns that spatial changes in earthquake sourceswere being misinterpreted as temporal changes in path properties(eg Peacock et al 1988 Aster et al 1990 Liu et al 2004) Howeverchanges in delay times in the damage zones after large earthquakesare clearly significant (eg Saiga et al 2003)
404 MK Savage et al Earth and Planetary Science Letters 290 (2010) 403ndash414
The larger stress changes associated with deformation beforevolcanic eruptions provide an easier target for precursory studies andshear wave splitting has recently been proposed as a method tomonitor stress on volcanoes (Miller and Savage 2001 Gerst andSavage 2004 Bianco et al 2006 Bianco and Zaccarelli 2009) In NewZealand and Italy changes in ϕ on the order of 90deg were observed nearvolcanoes associated with eruptive activity The most likely causeswere dyke intrusions that reversed local stress orientations (Gerst andSavage 2004)
2 Data and setting
Mt Asama is an active andesitic volcano located in central HonshuJapan An eruption that began 1 Sept 2004 was preceded by a dyke
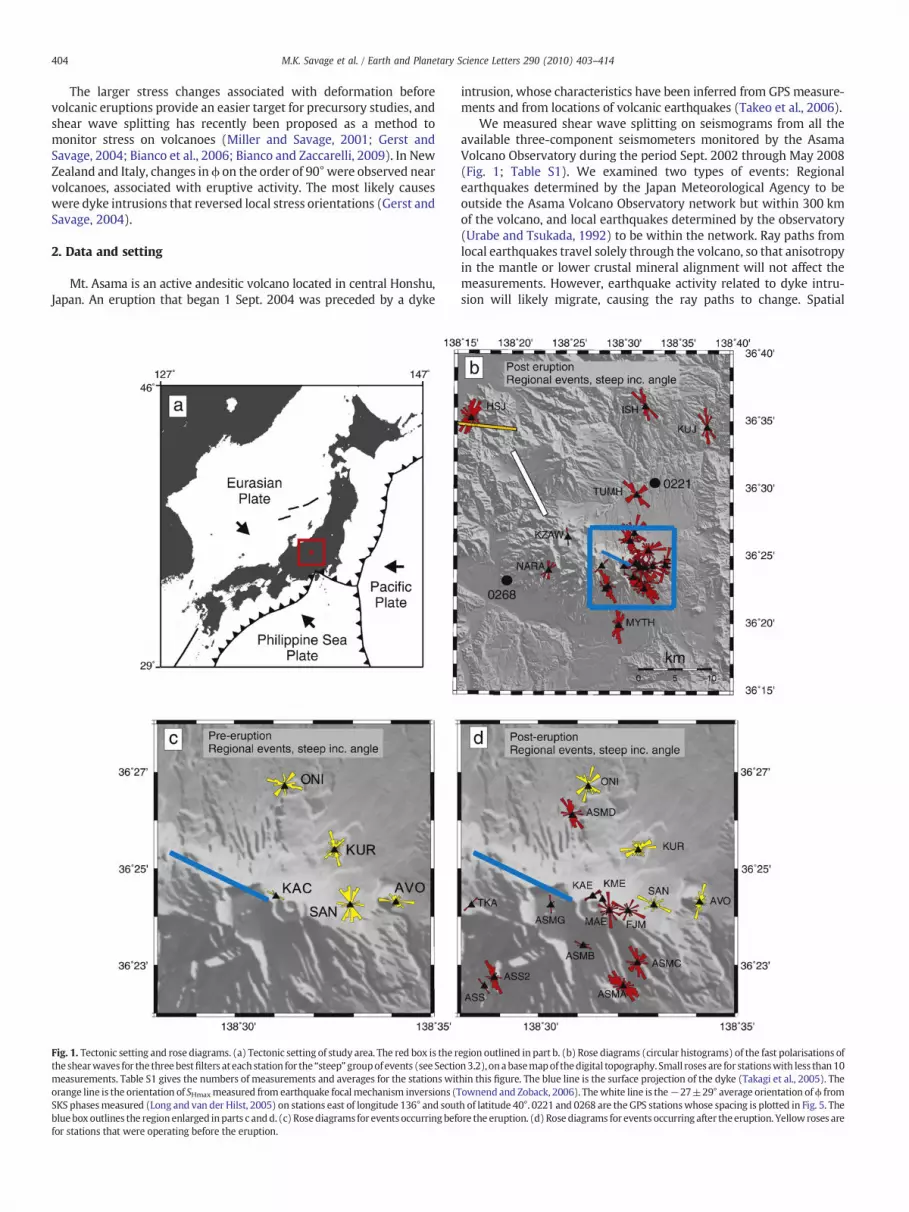
Fig 1 Tectonic setting and rose diagrams (a) Tectonic setting of study area The red box is the rthe shearwaves for the three bestfilters at eachstation for the ldquosteeprdquogroupof events (see Sectiomeasurements Table S1 gives the numbers of measurements and averages for the stations witorange line is the orientation of SHmaxmeasured from earthquake focalmechanism inversions (TSKS phasesmeasured (Long and van der Hilst 2005) on stations east of longitude 136deg and soutbluebox outlines the regionenlarged inparts c andd (c) Rosediagrams for events occurringbeffor stations that were operating before the eruption
intrusion whose characteristics have been inferred from GPS measure-ments and from locations of volcanic earthquakes (Takeo et al 2006)
We measured shear wave splitting on seismograms from all theavailable three-component seismometers monitored by the AsamaVolcano Observatory during the period Sept 2002 through May 2008(Fig 1 Table S1) We examined two types of events Regionalearthquakes determined by the Japan Meteorological Agency to beoutside the Asama Volcano Observatory network but within 300 kmof the volcano and local earthquakes determined by the observatory(Urabe and Tsukada 1992) to be within the network Ray paths fromlocal earthquakes travel solely through the volcano so that anisotropyin the mantle or lower crustal mineral alignment will not affect themeasurements However earthquake activity related to dyke intru-sion will likely migrate causing the ray paths to change Spatial
egion outlined in part b (b) Rose diagrams (circular histograms) of the fast polarisations ofn32) onabasemapof thedigital topography Small roses are for stationswith less than10hin this figure The blue line is the surface projection of the dyke (Takagi et al 2005) Theownend and Zoback 2006) Thewhite line is theminus27plusmn29deg average orientation ofϕ fromh of latitude 40deg 0221 and 0268 are the GPS stationswhose spacing is plotted in Fig 5 Theore the eruption (d)Rosediagrams for events occurring after the eruption Yellow roses are
405MK Savage et al Earth and Planetary Science Letters 290 (2010) 403ndash414
changes are thus difficult to disentangle from temporal changesRegional earthquakes occur mostly in the subducted Philippine andPacific plates and their paths are affected by mantle and lower crustalmineral anisotropy as well as by crustal stress They are also affectedby laterally varying properties but earthquakes far removed from thevolcano should not have systematic variations in location that arecorrelated with magma movement Therefore changes in measure-ments from regional events that correlate withmagmamovement canbe interpreted as temporal rather than spatial variations
For the local events we examined all a-type (tectonic) earth-quakes located via the standard processing procedure (Urabe andTsukada 1992) This includes stations run by Asama VolcanoObservatory the Japan Meteorological Association and Hi-netnetworks
For the regional earthquakes we searched the JapanMeteorologicalAgency (JMA) catalogue for all events over magnitude 20 within theinterval bounded by longitudes 1405deg and 1365deg and latitudes 385deg to345deg and examined all events that had triggered the recording systemwithin 30 s of the earthquake origin times
3 Methods
31 Shear wave splitting calculations
We use the Teanby et al (2004) shear wave splitting code withmodifications to allow automatic quality classification The Teanbycode uses at its base the Silver and Chan (1991) (SC) shear wavesplitting analysis technique The SC analysis is carried out on multiplemeasurement windows and cluster analysis determines the bestwindow The cluster that has the minimum variance is chosen as thebest cluster and a final SC measurement is made based on the bestwindowwithin the cluster The only manual step is to pick the S wavearrival The results are free from operator bias and large numbers ofwaveforms can be processed so that patterns can emerge from noisydata
Local events are routinely checked by hand before cataloguing andwe used these catalogued S arrival times For the regional events weused the TauP code (Crotwell et al 1999) to determine the P and Sarrival times expected for the event location and the IASPEI 91 arrivaltime model (Kennett and Engdahl 1991) The waveforms wereexamined by eye and S wave arrival times were determined bycomparing the expected arrival times with the waveforms payingcareful attention to changes in frequency content over time in thewaveforms and the relative arrival times of S and P waves becauseboth P and S waves usually arrived later than predicted
We use computer scripts developed by Wessel (2008) toautomatically process data using the Teanby et al (2004) clusteranalysis splitting codes The main advance in the scripts is in usingmultiple filters (Table S2) to find the frequency bands with the bestsignal-to-noise ratios and choosing the length of the measurementwindows based on the period of the waveform The measurementwindow has a minimum length of the dominant period and amaximum length of 25 times the dominant period
We make a small modification to the Teanby code to grade themeasurements to minimize effects of cycle skipping in which thesplitting program may mismatch waveforms by an integer number ofhalf cycles If it is mismatched by one half cycle then the fast and slowwaves may be interchanged and dt differs by one half period(Matcham et al 2000) If it is mismatched by two half cycles thenϕ remains the same but dt differs by a whole period All clusters withnumbers above a minimum threshold (set as 5 in the analysis here)are compared to the chosen ldquobest clusterrdquo The measurementspresented here fit the following criteria If the average fast polarisa-tion of any cluster of more than 5 windows is more than π8 radiansfrom that of the best cluster or if the average delay time differs fromthe best cluster delay time by more than 18 of the maximum allowed
splitting time then the measurement is rejected as possibly affectedby cycle skipping (Figs S1 and S2) We ran the analysis for the threebest filters for each eventndashstation pair Waveforms that give goodresults for several filters will therefore be weightedmore heavily thanwaveforms that give good results for only a single filter (Gerst andSavage 2004)
Further grading of measurements passing the cycle skipping test isbased on the formal errors of the final best splitting measurement(errors in ϕ must be less than 25deg) the signal-to-noise ratio (it mustbe greater than 3) and two additional criteria to determine if themeasurement could be ldquonullrdquowhich occurs when there is no splittingSuch null measurements occur when either there is no anisotropy orif the initial polarisation is parallel or perpendicular to the fastorientation We use the criterion suggested previously (Savage et al1996 Peng and Ben-Zion 2004) If ϕ is between 0deg and 20deg orbetween 70deg and 90deg of themeasured incoming polarisation directionit is considered a null measurement Furthermore measurementswith dt larger than a maximum value (10 s for regional events and04 s for local events) are likely to be nulls and are removed The localevents and regional events used the same codes and filters except forthe difference in maximum allowed dt
32 Event groupings
For angles of incidence at the surface of greater than 35deg convertedphases can interfere with shear wave splitting measurements (Nuttli1961 Booth and Crampin 1985) However low velocities at thesurface result in near-vertical arrivals for many events To account forthis many people consider only events within this ldquoshear wavewindowrdquo of 45deg based on straight-line ray paths (ie assuminghomogeneous velocity eg Peacock et al 1988) However using onlysuch straight-line ray path restrictions can unnecessarily delete toomany events from analysis We divided our results into several setsdepending on the angle of incidence and earthquake depth
For regional events one group (ldquosteeprdquo for steep incidence angles)was made up of events with straight-line angles of incidence less than45deg following previous conventions However these events actuallyhad angles of incidence between 0deg and 17deg from the verticalcalculated using the 20 kms shear wave velocity in the top layer ofthe standard velocity model used to calculate hypocentres All theseearthquakes were deeper than 40 km Events with larger incidenceangles were broken into two groups based on whether their depthswere shallower (ldquoshallrdquo) or deeper (ldquodeeprdquo) than 40 km
All the ldquosteeprdquo events were within the so-called ldquoBand-2rdquoincidence of within 15deg from the crack plane in which the delaytimes are sensitive to crack density (Peacock et al 1988 Crampin1999) (Fig 2) Paths within the shear wave window but outsideldquoBand-2rdquo are in ldquoBand-1rdquo (Crampin 1999) Although previous papersdo not usually remark upon these properties in ldquoBand-2rdquo delay timesand polarisations are relatively insensitive to angle of incidence and inldquoBand-1rdquo delay times and polarisations are a strong function of backazimuth and angle of incidence The negative delay times in ldquoBand-1rdquo(Fig 2) arise because the delay times are calculated as a differencebetween two absolute directions one of which is fast for verticalincidence angles As the angle between the propagation direction andthe crack plane continues to increase the delay times decrease untilthey reach zero (the two waves arrive at the same time) and then forfurther increases in angles the fast and slow components switchpolarity The former fast direction becomes slow and vice-versa evenfor paths within the shear wave window
Events in the ldquoshallrdquo and ldquodeeprdquo groups were measured at thestations closest to the summit that operated both before and after theeruption for times up through the end of 2006 These paths hadangles of incidence of 14deg to 21deg from the vertical (Calculated with asurface velocity of 20 kms) which makes them within ldquoBand-2rdquo iftheir back azimuth is within 15deg of the crack plane strike Otherwise
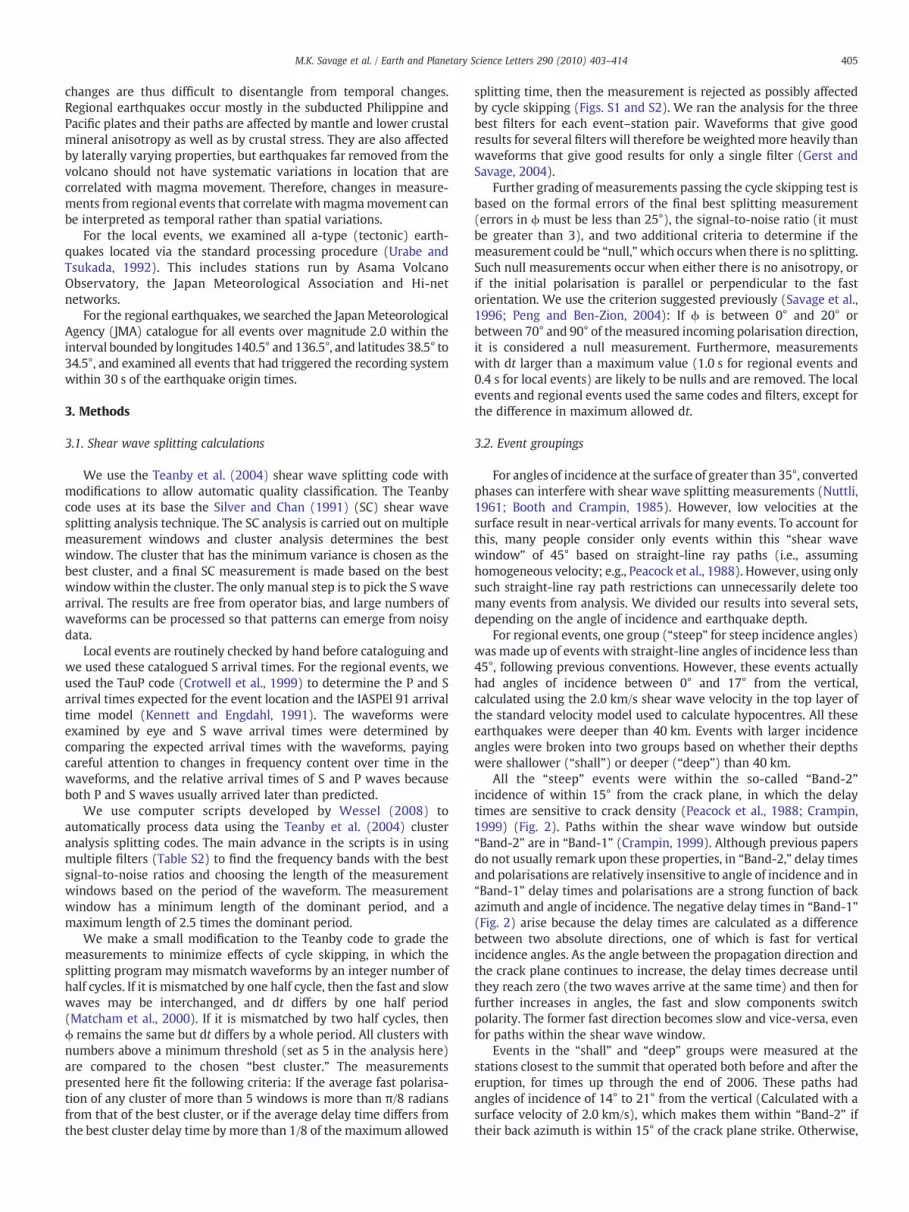
Fig 2 Stereographic projection of shear wave splitting ϕ and dt expected for parallelvertical cracks oriented in the EndashWplane The bold circle is the ldquoshear wave windowrdquo of45deg used by Peacock et al (1988) the thin circle is a window of 35deg and the dotted circleis a window of 15deg The top diagram shows the fast directions and the bottom diagramshows contours of dt ldquoBand-1rdquo is shaded and ldquoBand-2rdquo is unshaded The graph at theleft shows a cross section of dt through the centre of the figure Note that there is achange of 90deg in ϕ even for waves that arrive within the shear wave window These areshown by negative dt and changes in ϕModified from Peacock et al (1988)
406 MK Savage et al Earth and Planetary Science Letters 290 (2010) 403ndash414
the paths are in ldquoBand-1rdquo or ldquoBand-2rdquo depending on the angle ofincidence as well as the angle between the back azimuth and the crackplane (Crampin 1999)
33 Statistical analysis
To calculate average parameters we use Gaussian statistics for thedelay times and the Von Mises criterion (Mardia and Jupp 2000) acircular analogue to the normal distribution for the fast polarisationsTable S1 includes information on the statistics Error bars presentedare twice the standard error However many of the distributions arebimodal and thus are not well described by normal distributions sowe recommend caution in interpreting the averages and standarderrors (Fig 1)
34 Stress modelling
We use program Coulomb 31 (Lin and Stein 2004 Toda et al2005) to calculate the maximum horizontal stress (Lund andTownend 2007) at different depths and positions based on a modelincluding a dyke (Takeo et al 2006) and two point (Mogi) sources(Takagi et al 2005) The dyke extends between 3 and 51 km depthand has 08 m of opening The small and large Mogi sources are at025 km and 31 km depth and correspond to 6400 m3 and
200000 m3 of volume expansion respectively Youngs modulus is8times105 The regional stress is assumed to have its intermediate stressσ2 as vertical (strike-slip stress regime) and is given by the weight ofthe rock above it yielding a gradient of 21 MPakm Other stressregimes were examined but the maximum horizontal stresswas independent of the type of stress regime and depended onlyon the difference between the two horizontal stresses Theorientation of σ1 is minus64deg parallel to the dyke and the magnitudesof σ1 and σ3 vary in each case For the near-isotropic horizontalstress case we used σ1=2105 MPakm and σ3=2095 MPakmFor the case with horizontal stress as 10 of vertical we useσ1=22 MPakm and σ3=20 MPakm For Byerlee frictionσ1=260 MPakm and σ3=160 MPakm The calculation of themisfit θ uses circular statistics (Mardia and Jupp 2000) and is givenby θ=cosminus1(fminus1sumi=1
N (f(cos(αciminusαmi))N))] This equation where αci
and αmi are the calculated (SHmax) and measured (ϕ) anglesrespectively for each event i and f(x) is either the absolute value (L1norm) or the square (L2 norm) Misfits for all models considered are inTable S3
4 Results
In all there were 32 permanent seismic stations recording dataduring the study period and 30 gave reliable measurements (Fig 1Table S1) The other two were too noisy or had frequent powerfailures and so did not record much data Examples of waveformquality can be viewed in themeasurement examples (Figs S1 and S2)
41 Local events
Two hundred and fifty-five high quality measurements werereturned from 97 events at 17 stations (Table S1) The frequency bandwith the largest numbers of high quality measurements (106) had highpass of 3 Hz but frequencies up to 10 Hzweremeasured (Table S2) Thedepths of the events yielding high qualities ranged from 300 m abovesea level to 22 kmbelow sea level (Takeo et al 2006) The path lengthsrange from 06 to 52 km with a median of 35 km The angles ofincidence of these local events ranged from 2deg to 75deg using the velocityof 20 kms that is used to locate the earthquakes However actualvelocities near the surface are likely to be still smaller because the nearsurface has low velocities (P wave velocities of less than about 25 kmsat most locations (Aoki et al 2009) which translates to an S velocity of14 kms if a typicalVpVs ratio of near-surface volcanic material of 17 isused (Rowlands et al 2005)) We include only the events within therestricted angle of incidence of 45deg in Fig 3 and in the comparison of ϕwith Coulomb stress (Table S3) We show the whole set in the rosediagrams of Fig 4 Summaries from both sets are available in Table S1
42 Regional events and time variation
There were 3644 events in the JMA catalogue fitting the ldquosteeprdquocriterion (Section 32) of which 525 events triggered the seismicnetwork Using the three best filters 1305 high quality measurementswere obtained from 276 events at 27 stations The depths ranged from61 to 366 km but all except eight events had depths greater than100 km Station summary statistics are available in Table S1
There were 273 measurements in the ldquoshallrdquo group In the ldquodeeprdquogroup (Section 32) there were 1183 measurements from eventsbetween 40 and 156 km (Table S1) The majority of the filters thatprovided the best signal-to-noise ratio for the regional eventsincluding ldquosteeprdquo ldquodeeprdquo and ldquoshallrdquo were low frequency with 3 Hzas the maximum frequency filter for over 80 of the measurements
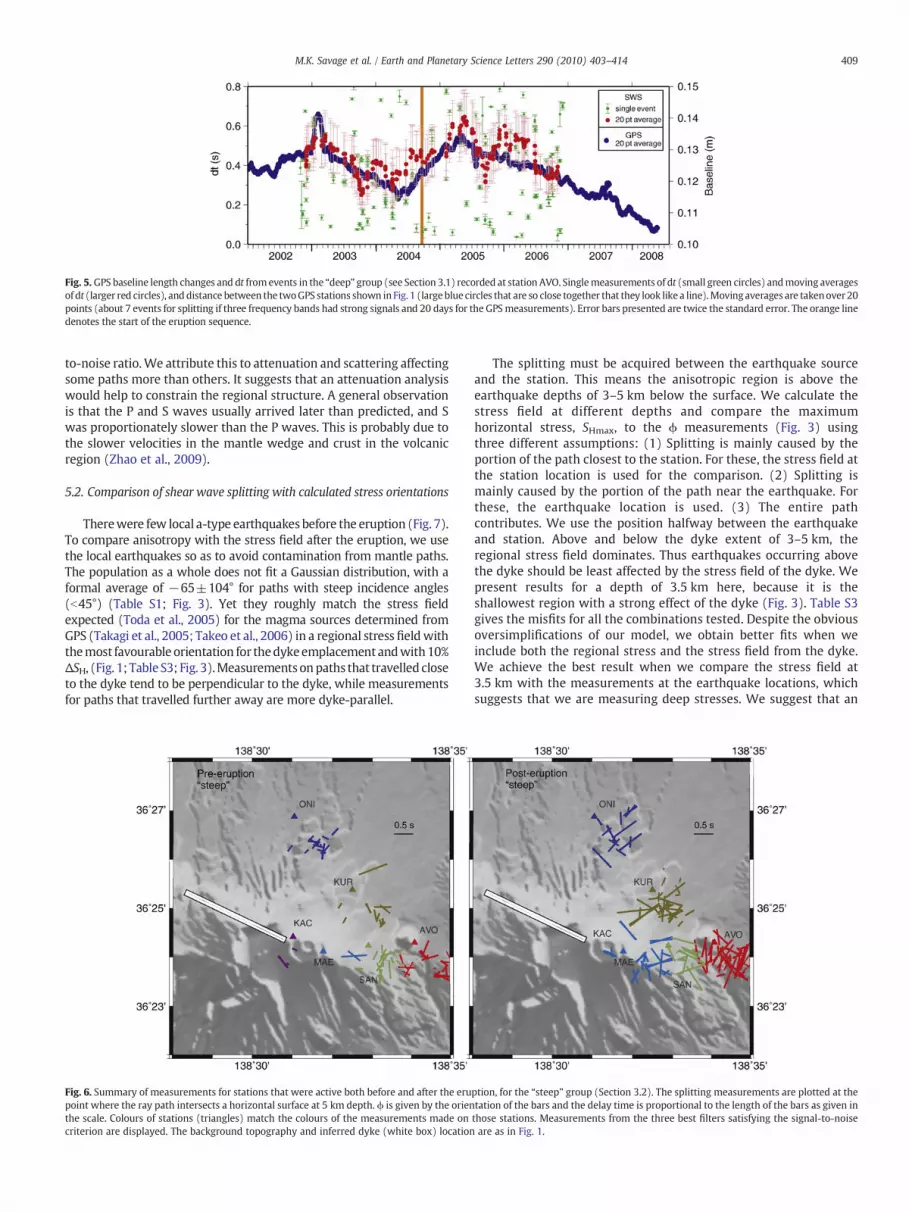
At the longest running station AVO measurements of dt from deepregional earthquakes yield systematic changes with time whichcorrelate with GPS baseline length change between two stationssituated on opposite sides of the inferred dyke (Takeo et al 2006)
407MK Savage et al Earth and Planetary Science Letters 290 (2010) 403ndash414
(Fig 5)Moving averages reveal a strong correlationbetweendt changesand GPS baseline length changes However statistical comparisons ofmoving averages are difficult due to the correlated errors The relationbetweenGPSanddtwhichweremadeatdifferent timeswasquantifiedby threedifferent tests For one testwefit a 10-degreepolynomial to the
GPS baseline length measurements Then we compared the actual dtmeasurements (not averaged) with the expected value of baselinelength change from the polynomial fit This yielded a correlationcoefficient of 02 and a p-value of 00011 (the p-value is the probabilitythat two variables with Gaussian distributions would yield such acorrelationby chance) In another testwedetermined25 timewindowsof approximately 10 points for each dt measurement varying thenumbers of points slightly so that measurements from the same eventwould remain in the same bin The time windows varied in lengthbetween 21 and 118 days with a mean of 58 days Then we calculatedthe average dt and GPS baseline length in the same time windows andcompared them to each other We obtained a correlation coefficient of06 and a p-value of 0003 Finally we calculated the averages of bothGPS anddelay timebased onnon-overlapping timewindows of 60 daysEach time period has a variable number of points The relation betweenthe two sets of averages calculated in this way gives a correlationcoefficient of 045 and a p-value of 002 Therefore the two time seriesare unlikely to be related by chance
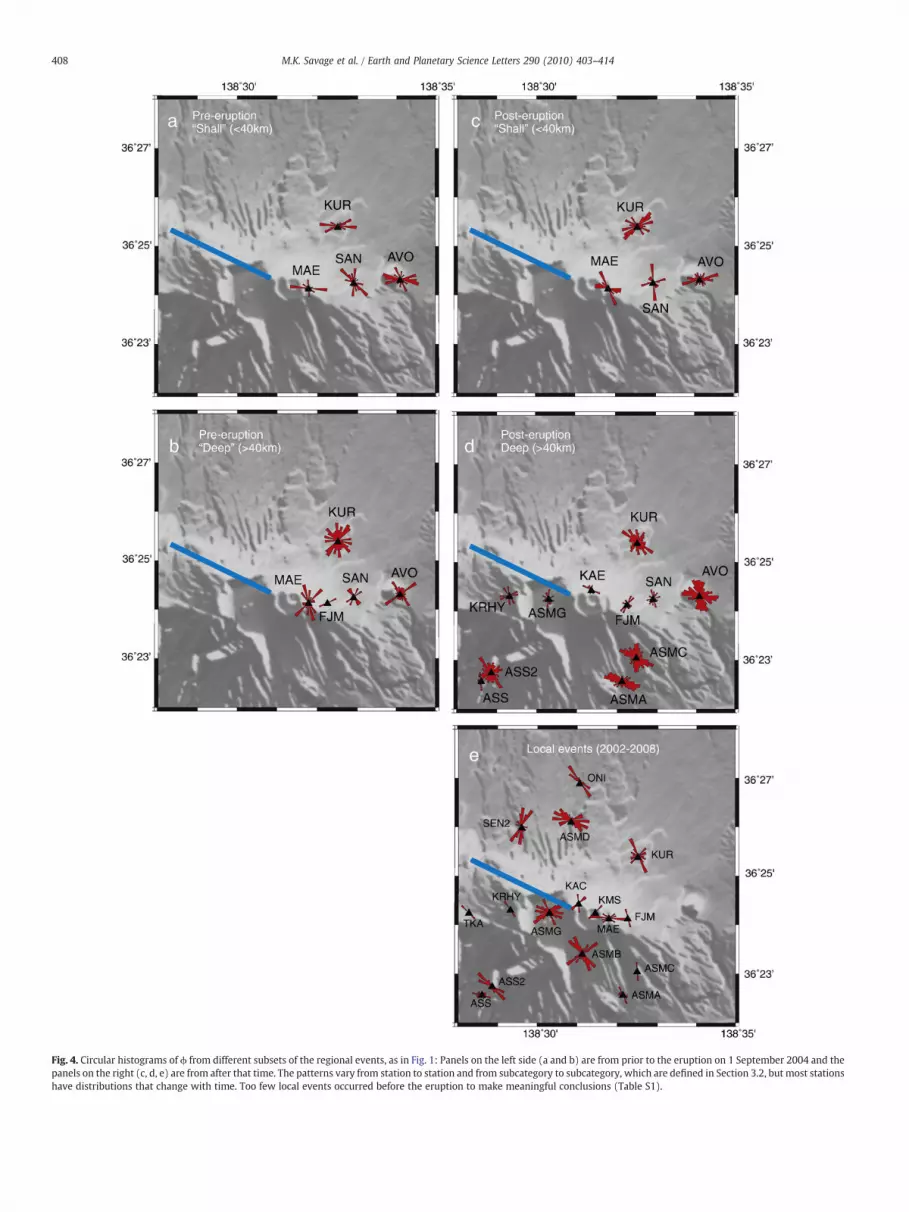
The distribution of ϕ for stations near the volcano changeddramatically after the eruption changing by nearly 90deg at most of thecommon stations (Fig 1) Earthquakes with similar paths to thestations yield differing fast orientations before and after the eruption(Fig 6) so the variations are not likely to be caused by varying pathsStations close to the volcano that returned good measurements onregional earthquakes both before and after the eruption have averageϕ that changewith time but they vary in detail for different categoriesof events (Figs 1 and 4 Table S1)
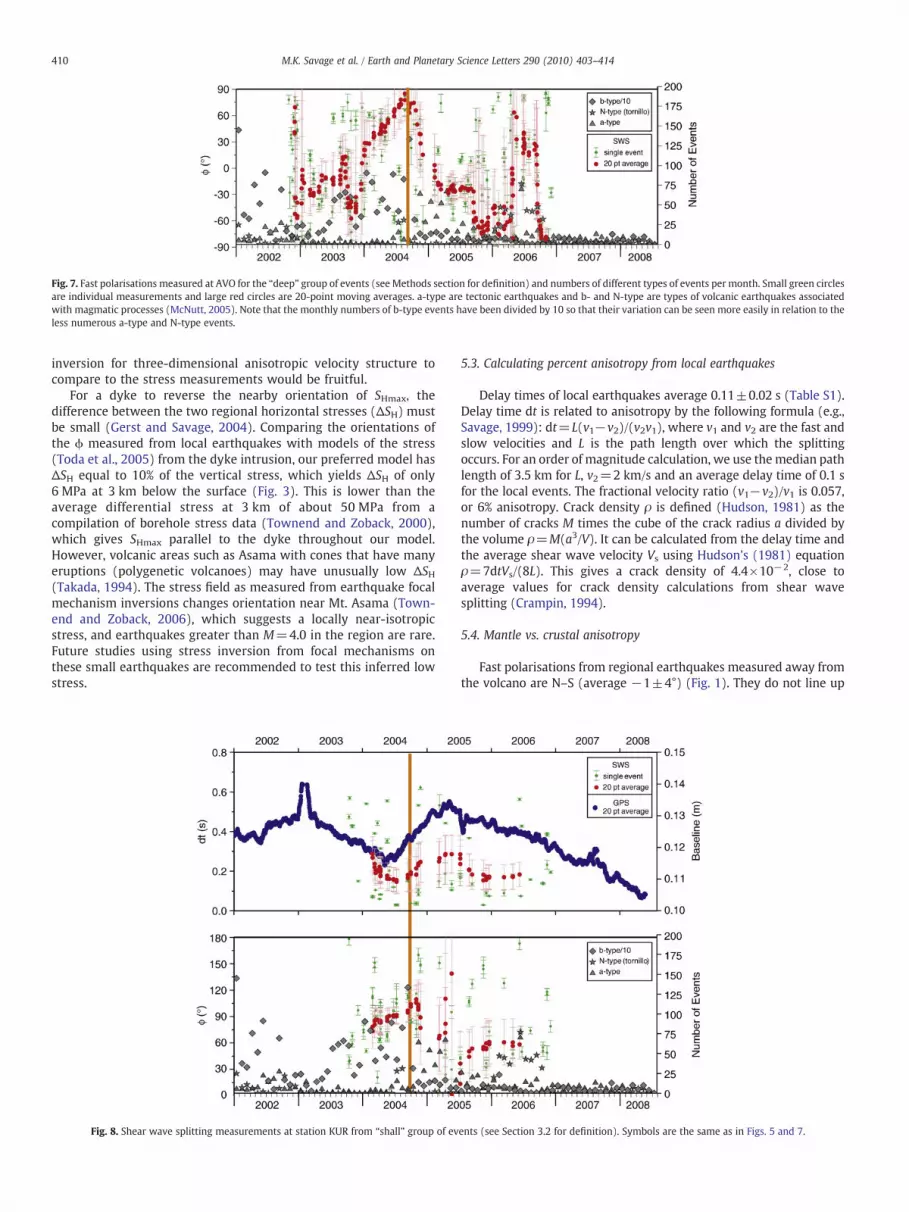
Average ϕ at station AVO rotates from about minus30deg in mid 2002 toabout 70deg just before the eruption on 1 Sept 2004 (Fig 7) The rotationappears to correlate with the occurrence of b-type (volcanic)earthquakes and precedes the eruption After the main eruption ϕreturns to its original value over a six month period Average ϕchanges again in 2006 when the number of N-type (another type ofvolcanic earthquake called ldquotornillordquo in some studies) eventsincreases Station KUR was operating for less time than AVO butmore time than most other stations It shows a similar but smallervariation in dt for events in the ldquoshallrdquo group (Fig 8)
5 Discussion
51 Quality of shear wave arrivals
Stations on the highest topography tend to have the smallestnumber of measurements and yield the most scattered results (Figs 1and 4) The S waves on these stations were difficult to pick probablydue to scattering attenuation and topographic effects Many S waveshad poor signal-to-noise ratio and it was difficult to decide where theS wave arrived But most stations had some events with good signal-
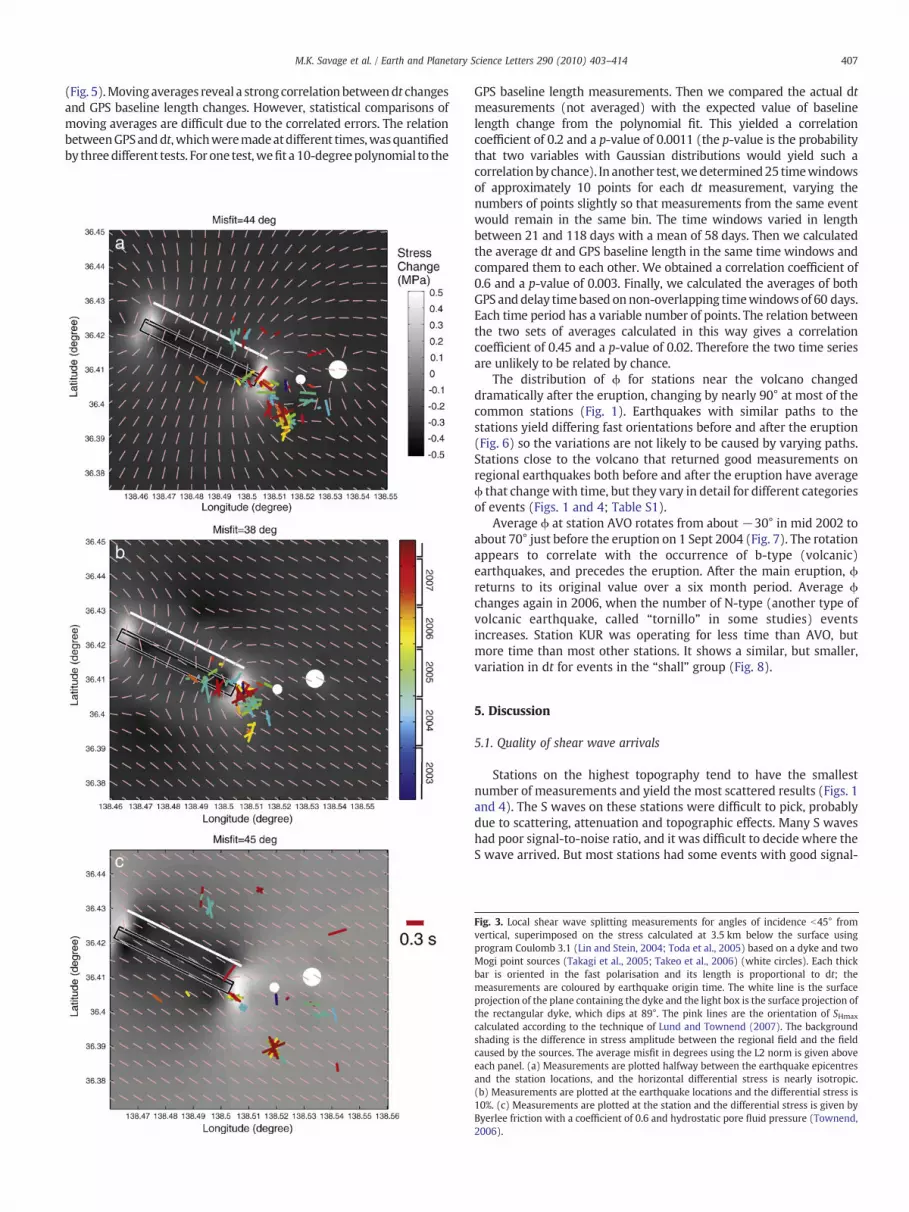
Fig 3 Local shear wave splitting measurements for angles of incidence b45deg fromvertical superimposed on the stress calculated at 35 km below the surface usingprogram Coulomb 31 (Lin and Stein 2004 Toda et al 2005) based on a dyke and twoMogi point sources (Takagi et al 2005 Takeo et al 2006) (white circles) Each thickbar is oriented in the fast polarisation and its length is proportional to dt themeasurements are coloured by earthquake origin time The white line is the surfaceprojection of the plane containing the dyke and the light box is the surface projection ofthe rectangular dyke which dips at 89deg The pink lines are the orientation of SHmax
calculated according to the technique of Lund and Townend (2007) The backgroundshading is the difference in stress amplitude between the regional field and the fieldcaused by the sources The average misfit in degrees using the L2 norm is given aboveeach panel (a) Measurements are plotted halfway between the earthquake epicentresand the station locations and the horizontal differential stress is nearly isotropic(b) Measurements are plotted at the earthquake locations and the differential stress is10 (c) Measurements are plotted at the station and the differential stress is given byByerlee friction with a coefficient of 06 and hydrostatic pore fluid pressure (Townend2006)
Fig 4 Circular histograms of ϕ from different subsets of the regional events as in Fig 1 Panels on the left side (a and b) are from prior to the eruption on 1 September 2004 and thepanels on the right (c d e) are from after that time The patterns vary from station to station and from subcategory to subcategory which are defined in Section 32 but most stationshave distributions that change with time Too few local events occurred before the eruption to make meaningful conclusions (Table S1)
408 MK Savage et al Earth and Planetary Science Letters 290 (2010) 403ndash414
Fig 5 GPS baseline length changes and dt fromevents in the ldquodeeprdquo group (see Section 31) recorded at station AVO Singlemeasurements of dt (small green circles) andmoving averagesof dt (larger red circles) anddistance between the twoGPS stations shown inFig 1 (largeblue circles that are so close together that they look like a line)Movingaverages are takenover20points (about 7 events for splitting if three frequency bands had strong signals and 20 days for the GPSmeasurements) Error bars presented are twice the standard error The orange linedenotes the start of the eruption sequence
409MK Savage et al Earth and Planetary Science Letters 290 (2010) 403ndash414
to-noise ratioWe attribute this to attenuation and scattering affectingsome paths more than others It suggests that an attenuation analysiswould help to constrain the regional structure A general observationis that the P and S waves usually arrived later than predicted and Swas proportionately slower than the P waves This is probably due tothe slower velocities in the mantle wedge and crust in the volcanicregion (Zhao et al 2009)
52 Comparison of shear wave splitting with calculated stress orientations
Therewere few local a-type earthquakes before the eruption (Fig 7)To compare anisotropy with the stress field after the eruption we usethe local earthquakes so as to avoid contamination from mantle pathsThe population as a whole does not fit a Gaussian distribution with aformal average of minus65plusmn104deg for paths with steep incidence angles(b45deg) (Table S1 Fig 3) Yet they roughly match the stress fieldexpected (Toda et al 2005) for the magma sources determined fromGPS (Takagi et al 2005 Takeo et al 2006) in a regional stress fieldwiththemost favourable orientation for thedykeemplacement andwith10ΔSH (Fig 1 Table S3 Fig 3)Measurementsonpaths that travelled closeto the dyke tend to be perpendicular to the dyke while measurementsfor paths that travelled further away are more dyke-parallel
Fig 6 Summary of measurements for stations that were active both before and after the erupoint where the ray path intersects a horizontal surface at 5 km depth ϕ is given by the orienthe scale Colours of stations (triangles) match the colours of the measurements made oncriterion are displayed The background topography and inferred dyke (white box) location
The splitting must be acquired between the earthquake sourceand the station This means the anisotropic region is above theearthquake depths of 3ndash5 km below the surface We calculate thestress field at different depths and compare the maximumhorizontal stress SHmax to the ϕ measurements (Fig 3) usingthree different assumptions (1) Splitting is mainly caused by theportion of the path closest to the station For these the stress field atthe station location is used for the comparison (2) Splitting ismainly caused by the portion of the path near the earthquake Forthese the earthquake location is used (3) The entire pathcontributes We use the position halfway between the earthquakeand station Above and below the dyke extent of 3ndash5 km theregional stress field dominates Thus earthquakes occurring abovethe dyke should be least affected by the stress field of the dyke Wepresent results for a depth of 35 km here because it is theshallowest region with a strong effect of the dyke (Fig 3) Table S3gives the misfits for all the combinations tested Despite the obviousoversimplifications of our model we obtain better fits when weinclude both the regional stress and the stress field from the dykeWe achieve the best result when we compare the stress field at35 km with the measurements at the earthquake locations whichsuggests that we are measuring deep stresses We suggest that an
ption for the ldquosteeprdquo group (Section 32) The splitting measurements are plotted at thetation of the bars and the delay time is proportional to the length of the bars as given inthose stations Measurements from the three best filters satisfying the signal-to-noiseare as in Fig 1
Fig 7 Fast polarisations measured at AVO for the ldquodeeprdquo group of events (see Methods section for definition) and numbers of different types of events per month Small green circlesare individual measurements and large red circles are 20-point moving averages a-type are tectonic earthquakes and b- and N-type are types of volcanic earthquakes associatedwith magmatic processes (McNutt 2005) Note that the monthly numbers of b-type events have been divided by 10 so that their variation can be seen more easily in relation to theless numerous a-type and N-type events
410 MK Savage et al Earth and Planetary Science Letters 290 (2010) 403ndash414
inversion for three-dimensional anisotropic velocity structure tocompare to the stress measurements would be fruitful
For a dyke to reverse the nearby orientation of SHmax thedifference between the two regional horizontal stresses (ΔSH) mustbe small (Gerst and Savage 2004) Comparing the orientations ofthe ϕ measured from local earthquakes with models of the stress(Toda et al 2005) from the dyke intrusion our preferred model hasΔSH equal to 10 of the vertical stress which yields ΔSH of only6 MPa at 3 km below the surface (Fig 3) This is lower than theaverage differential stress at 3 km of about 50 MPa from acompilation of borehole stress data (Townend and Zoback 2000)which gives SHmax parallel to the dyke throughout our modelHowever volcanic areas such as Asama with cones that have manyeruptions (polygenetic volcanoes) may have unusually low ΔSH(Takada 1994) The stress field as measured from earthquake focalmechanism inversions changes orientation near Mt Asama (Town-end and Zoback 2006) which suggests a locally near-isotropicstress and earthquakes greater than M=40 in the region are rareFuture studies using stress inversion from focal mechanisms onthese small earthquakes are recommended to test this inferred lowstress
Fig 8 Shear wave splitting measurements at station KUR from ldquoshallrdquo group of ev
53 Calculating percent anisotropy from local earthquakes
Delay times of local earthquakes average 011plusmn002 s (Table S1)Delay time dt is related to anisotropy by the following formula (egSavage 1999) dt=L(v1minusv2)(v2v1) where v1 and v2 are the fast andslow velocities and L is the path length over which the splittingoccurs For an order of magnitude calculation we use the median pathlength of 35 km for L v2=2 kms and an average delay time of 01 sfor the local events The fractional velocity ratio (v1minusv2)v1 is 0057or 6 anisotropy Crack density ρ is defined (Hudson 1981) as thenumber of cracks M times the cube of the crack radius a divided bythe volume ρ=M(a3V) It can be calculated from the delay time andthe average shear wave velocity Vs using Hudsons (1981) equationρ=7dtVs(8L) This gives a crack density of 44times10minus2 close toaverage values for crack density calculations from shear wavesplitting (Crampin 1994)
54 Mantle vs crustal anisotropy
Fast polarisations from regional earthquakes measured away fromthe volcano are NndashS (average minus1plusmn4deg) (Fig 1) They do not line up
ents (see Section 32 for definition) Symbols are the same as in Figs 5 and 7
411MK Savage et al Earth and Planetary Science Letters 290 (2010) 403ndash414
well with the regional stress orientations (Townend and Zoback2006) but are on average parallel to the fast orientations determinedfrom SKS measurements in the region (Long and van der Hilst 2005)(minus27plusmn29deg) Therefore they are probably affected strongly by themantle anisotropy However within the immediate vicinity of thevolcano there is a general tendency for stations close to the modelleddyke to exhibit ϕ perpendicular to the dyke while stations furtheraway have more dyke-parallel ϕ (Fig 1) We infer that themeasurements made on the volcano have been affected both by themantle and by the local stress field
As we have previously found at Mt Ruapehu volcano (Gerst andSavage 2004) different ϕ are obtained for the ldquodeeprdquo and ldquoshallowrdquo
group (Table S1 Fig 4) whichmay be caused by the greater influenceof mantle anisotropy on the deep group
For regional earthquakes dt values average 03 to 04 s (Table S1) Ifanisotropy is constant with depth then the path length for theanisotropic region is 12 to 16 km which is an average value for thedepth belowwhich cracks are assumed to be closed (Crampin 1994) Ifthe cracks progressively closewith depth then the anisotropy is presentthroughout a larger region Fast polarisations caused by olivineorientation in the mantle may have been reoriented by the crustalstress field The waveforms split by the lower layer may resplit in anupper layer or if ϕ rotates slowly enough dt can remain large while ϕrotates to the stress orientation at the surface (Ruumlmpker and Silver1998 Saltzer et al 2000)We think that the waves have been resplit inthe crust based on the average incoming polarisation Φ determinedfrom the shear wave splitting code (Silver and Chan 1991) In anisotropic earth shear wave polarisations depend upon the focalmechanisms but if there are two or more layers of anisotropy thewaveswill be reoriented as they pass through each layer (eg Silver andSavage 1994) The splitting code returns the fast orientation of the lastlayer ϕ and also Φ which is the orientation of the wave just before itarrived at the last layer ThisΦwill be the fast orientation of the secondto last anisotropic layer if more than one anisotropic layer exists Theevents deeper than 40 km yieldΦ ofminus31plusmn7deg for 2488measurementsThis is within the 95 confidence interval of theminus27plusmn29deg average ofϕfrom 11 nearby SKS measurements which are phases that travelthrough the entire mantle and which were interpreted as caused byolivine orientation in the mantle above the subducted slab (Long and
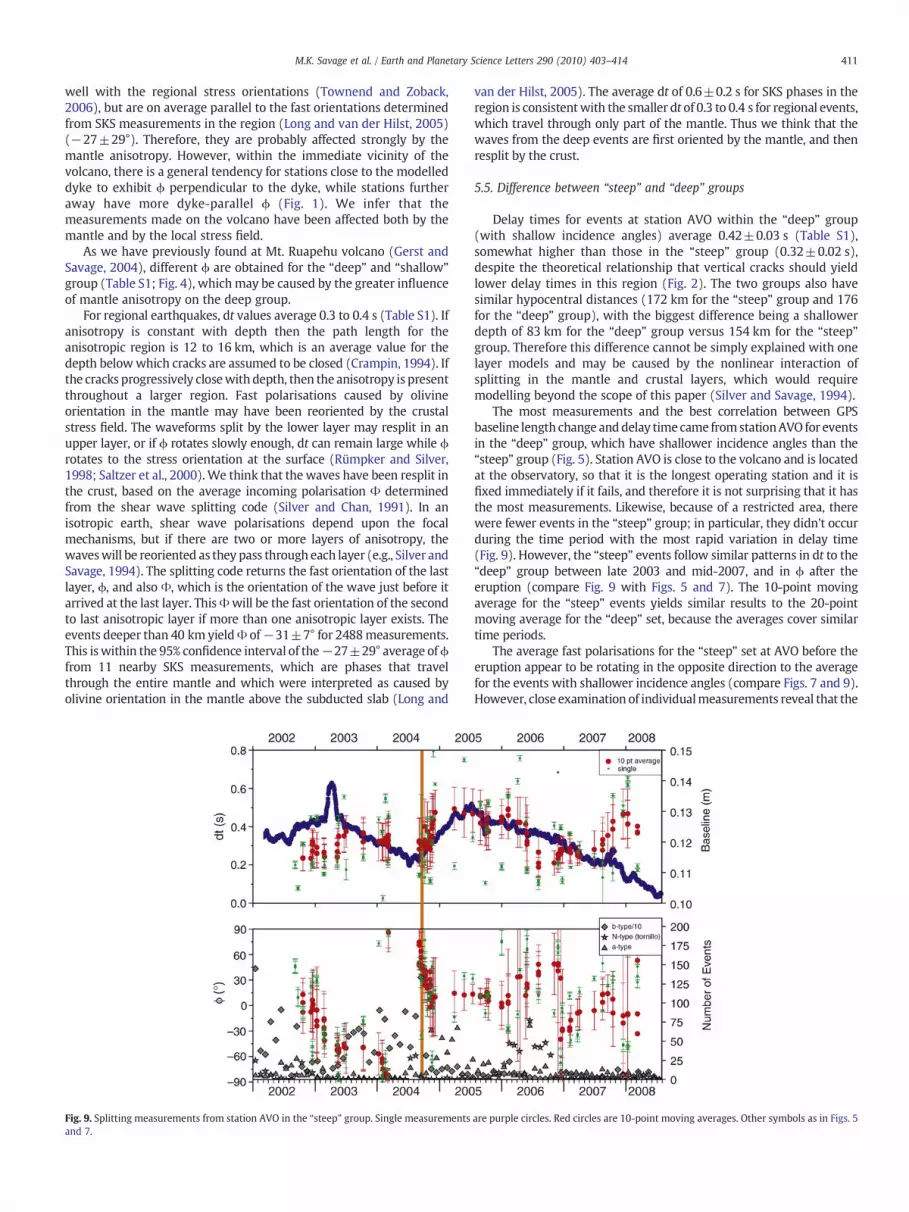
Fig 9 Splitting measurements from station AVO in the ldquosteeprdquo group Single measurementsand 7
van der Hilst 2005) The average dt of 06plusmn02 s for SKS phases in theregion is consistentwith the smaller dt of 03 to 04 s for regional eventswhich travel through only part of the mantle Thus we think that thewaves from the deep events are first oriented by the mantle and thenresplit by the crust
55 Difference between ldquosteeprdquo and ldquodeeprdquo groups
Delay times for events at station AVO within the ldquodeeprdquo group(with shallow incidence angles) average 042plusmn003 s (Table S1)somewhat higher than those in the ldquosteeprdquo group (032plusmn002 s)despite the theoretical relationship that vertical cracks should yieldlower delay times in this region (Fig 2) The two groups also havesimilar hypocentral distances (172 km for the ldquosteeprdquo group and 176for the ldquodeeprdquo group) with the biggest difference being a shallowerdepth of 83 km for the ldquodeeprdquo group versus 154 km for the ldquosteeprdquogroup Therefore this difference cannot be simply explained with onelayer models and may be caused by the nonlinear interaction ofsplitting in the mantle and crustal layers which would requiremodelling beyond the scope of this paper (Silver and Savage 1994)
The most measurements and the best correlation between GPSbaseline length change anddelay time came fromstationAVO for eventsin the ldquodeeprdquo group which have shallower incidence angles than theldquosteeprdquo group (Fig 5) Station AVO is close to the volcano and is locatedat the observatory so that it is the longest operating station and it isfixed immediately if it fails and therefore it is not surprising that it hasthe most measurements Likewise because of a restricted area therewere fewer events in the ldquosteeprdquo group in particular they didnt occurduring the time period with the most rapid variation in delay time(Fig 9) However the ldquosteeprdquo events follow similar patterns in dt to theldquodeeprdquo group between late 2003 and mid-2007 and in ϕ after theeruption (compare Fig 9 with Figs 5 and 7) The 10-point movingaverage for the ldquosteeprdquo events yields similar results to the 20-pointmoving average for the ldquodeeprdquo set because the averages cover similartime periods
The average fast polarisations for the ldquosteeprdquo set at AVO before theeruption appear to be rotating in the opposite direction to the averagefor the events with shallower incidence angles (compare Figs 7 and 9)However close examination of individualmeasurements reveal that the
are purple circles Red circles are 10-point moving averages Other symbols as in Figs 5
412 MK Savage et al Earth and Planetary Science Letters 290 (2010) 403ndash414
difference in rotation is an artefact due to having fewer events in theldquosteeprdquo group combined with rapid rotation of the stress field
56 Effect of angle of incidence and ldquoBand-1 and 2rdquo
In cracked media theoretical delay times vary for paths coming inat different angles to the crack plane even for constant crack density(Fig 2) Therefore changes in crack plane orientation could causechanges in splitting delay times As explained in Section 31 ldquoEventGroupingsrdquo ldquoBand-2rdquo is a region of propagation angles that arrivewithin 15deg of the crack plane (Peacock et al 1988) Within this bandthe delay times vary slightly but not greatly with propagationdirection Outside this region ldquoBand-1rdquo the delay times change
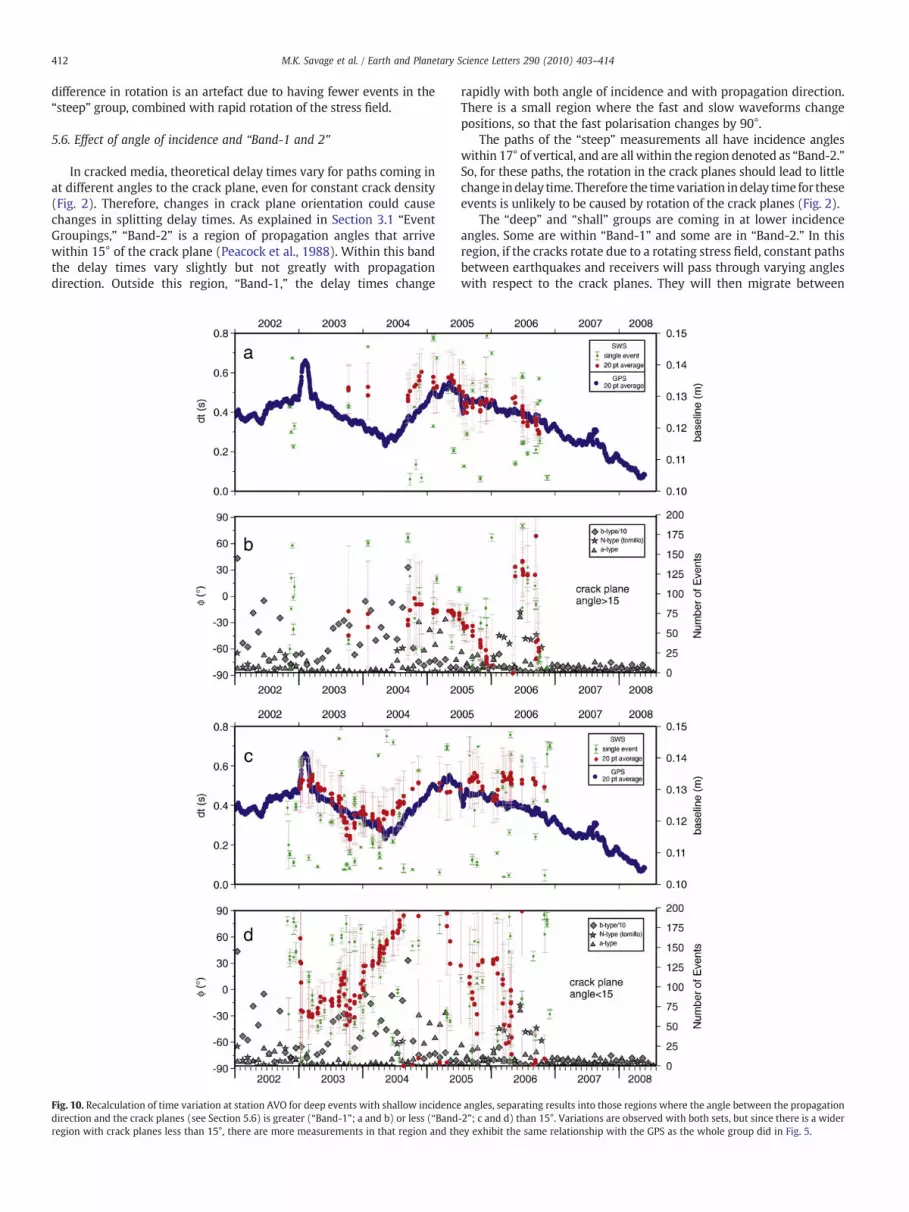
Fig 10 Recalculation of time variation at station AVO for deep events with shallow incidencedirection and the crack planes (see Section 56) is greater (ldquoBand-1rdquo a and b) or less (ldquoBandregion with crack planes less than 15deg there are more measurements in that region and th
rapidly with both angle of incidence and with propagation directionThere is a small region where the fast and slow waveforms changepositions so that the fast polarisation changes by 90deg
The paths of the ldquosteeprdquo measurements all have incidence angleswithin 17deg of vertical and are all within the region denoted as ldquoBand-2rdquoSo for these paths the rotation in the crack planes should lead to littlechange indelay time Therefore the timevariation indelay time for theseevents is unlikely to be caused by rotation of the crack planes (Fig 2)
The ldquodeeprdquo and ldquoshallrdquo groups are coming in at lower incidenceangles Some are within ldquoBand-1rdquo and some are in ldquoBand-2rdquo In thisregion if the cracks rotate due to a rotating stress field constant pathsbetween earthquakes and receivers will pass through varying angleswith respect to the crack planes They will then migrate between
angles separating results into those regions where the angle between the propagation-2rdquo c and d) than 15deg Variations are observed with both sets but since there is a widerey exhibit the same relationship with the GPS as the whole group did in Fig 5
413MK Savage et al Earth and Planetary Science Letters 290 (2010) 403ndash414
ldquoBand-1rdquo and ldquoBand-2rdquo Therefore we test the hypothesis that thechanging delay times (Fig 5) as well as changes of 90deg in fastpolarisation (Figs 1 4 6 and 7) may both be caused by the rotation ofthe crack orientations due to the stress field changing direction Asdiscussed in Section 54 the shallow and deep events exhibit differentbehaviour (Fig 4) so here we concentrate only on the deep eventsWe separate the set of events defined as ldquodeeprdquo into measurementswhose paths went through the two bands We divide our time periodsinto intervals over which the fast polarisations of the ldquosteeprdquo eventshave relatively constant values and we use the average ϕ from theldquosteeprdquo events to determine a crack plane orientation We use thesecrack planes to determine whether events are inside or outside the15deg ldquoBand-2rdquo region (Fig 10) Variations in delay time and thecorrelation with GPS path length changes are maintained in bothgroups Therefore we conclude that the variation in delay time is notcontrolled by changing crack orientations
57 Time variations and crack aspect ratios
Travel pathsnear the surface affect the splittingmeasurementsmorethan distant sections of the path (Ruumlmpker and Silver 1998 Saltzeret al 2000) so that time-varying effects aremost likely caused by near-surface stress changes which can occur in seconds tominutes (Zatsepinand Crampin 1997) rather than changes in mineral orientation atdepth which should occur over periods of thousands of years (Ribe andYu 1991) If we take the simplest interpretation that the changes in dtare all caused by the changing widths of thin coin-shaped cracks(Hudson 1981) and that the GPS baseline changes are also caused byopening and closing of these cracks then we can relate the twomeasurements to give the aspect ratio α defined as the ratio of crackwidth to radius as follows (Hatchell and Bourne 2005) α=(4ερπ2)where ε is the strain change If we assume the strain occurs over thesame 35 km path length for the GPS baseline change as for the shearwave splitting change then ε=002 m35 km=57times10minus06 Thisyields α=26times10minus05 It is independent of path length if the samelength is used to calculate ε and ρ The small crack aspect ratio is indeedconsistent with the assumptions of the model that the cracks are thin
58 Comparison of delay time variations and polarisation variations
Surprisingly neither the GPS baseline changes nor the delay timechanges at station AVO have as strong a relation to themain eruption orto the numbers of b-type and a-type events as doesϕ (Figs 5 and 7)ϕ isa proxy for stress orientation while GPS and delay time measurementsdepend on the crack density and aspect ratios and so are less directlyrelated to the stress One explanation is that as the stress orientationchanges it closes cracks of one orientation while opening those inanother orientation In this way the numbers of cracks could remainconstant even as the orientation changed Perhaps the changing stressorientation occurred as the magma conduit geometry changed whichallowed an easier path for the magma to reach the surface
6 Conclusions
Geodesy and seismic anisotropy can be combined to derive newinformation about volcanic regions such as the horizontal differentialstress and the crack aspect ratios Correlations of ϕ and dt withvolcanic activity furthermore suggest that magmatic intrusionsdisrupt the local stress field Monitoring of this stress field bymeasuring anisotropy variations through shear wave splitting andpossibly other techniques such as surface wave noise analysis(Brenguier et al 2008) could be used in areas where geodeticinformation is unavailable or where the changes are taking place toodeeply to be observed by surface geodetic stations
Acknowledgements
We thank A Wessel and N Teanby for use of the shear wavesplitting analysis codes S Toda R Stein J Lin and V Sevilgen for useof the Coulomb stress modelling software and J Townend E SmithR Arnold and J Johnson for helpful discussions and editorialsuggestions Some figures used the GMT mapping codes (Wesseland Smith 1991) The regional earthquake locations used in thisstudy are produced by the Japan Meteorological Agency incooperation with the Ministry of Education Culture Sports Scienceand Technology The catalogue locations are based on seismic dataprovided by the National Research Institute for Earth Science andDisaster Prevention the Japan Meteorological Agency HokkaidoUniversity Hirosaki University Tohoku University the University ofTokyo Nagoya University Kyoto University Kochi UniversityKyushu University Kagoshima University the National Institute ofAdvanced Industrial Science and Technology the GeographicalSurvey Institute Tokyo Metropolis Shizuoka Prefecture Hot SpringsResearch Institute of Kanagawa Prefecture Yokohama City and JapanAgency for Marine-Earth Science and Technology This work wassupported by the University of Tokyo Earthquake Research InstituteInternational Programme the Japan Society for the Promotion ofScience and the New Zealand Marsden Fund and used analysis codesdeveloped with funding from the New Zealand Earthquake Commis-sion M Savage conducted much of this work while on research leavefrom Victoria University
Appendix A Supplementary data
Supplementary data associated with this article can be found inthe online version at doi101016jepsl200912037
References
Aoki Y et al 2009 P-wave velocity structure beneath Asama Volcano Japan inferredfrom active source seismic experiment J Volcanol Geotherm Res 187 272ndash277
Arnold A Townend J Vignaux T 2005 Mapping tectonic stress using earthquakesIn Knuth KH Abbas AE Morris RD Castle JP (Eds) Bayesian Inference andMaximum Entropy Methods in Science and Engineering American Institute ofPhysics San Joseacute CA
Aster RC Shearer PM Berger J 1990 Quantitative measurements of shear wavepolarizations at the Anza seismic network southern California implications forshear wave splitting and earthquake prediction J Geophys Res 95 (B8)12449ndash12473
Bianco F Zaccarelli L 2009 A reappraisal of shear wave splitting parameters fromItalian active volcanic areas through a semiautomatic algorithm J Seismol 13253ndash266
Bianco F Scarfi L Pezzo ED Patane D 2006 Shear wave splitting changesassociated with the 2001 volcanic eruption on Mt Etna Geophys J Int 167 (2)959ndash967 doi101111j1365-246X200603152x
Boness NL Zoback MD 2006 A multiscale study of the mechanisms controllingshear velocity anisotropy in the San Andreas Fault Observatory at DepthGeophysics 71 (5) F131ndashF146
Booth D Crampin S 1985 Shear-wave polarizations on a curved wavefront at anisotropic free-surface Geophpys J R Astron Soc 83 31ndash45
Brenguier F et al 2008 Towards forecasting volcanic eruptions using seismic noiseNat Geosci 1 126ndash130
Crampin S 1994 The fracture criticality of crustal rocks Geophys J Int 118 428ndash438Crampin S 1999 Calculable fluidndashrock interactions J Geol Soc 156 501ndash514Crotwell HP Owens TJ Ritsema J 1999 The TauP Toolkit flexible seismic travel-
time and ray-path utilities Seism Res Lett 70 154ndash160Dzurisin D 2003 A comprehensive approach to monitoring volcano deformation as a
window on the eruption cycle Rev Geophys 41 (1) 1ndash29Gerst A Savage MK 2004 Seismic anisotropy beneath Ruapehu Volcano a possible
eruption forecasting tool Science 306 1543ndash1547Hatchell P Bourne S 2005 Rocks under strain strain-induced time-lapse time shifts
are observed for depleting reservoirs Leading Edge 1222ndash1225Hudson JA 1981Wave speeds and attenuation of elastic waves inmaterial containing
cracks Geophysical J R Aston Soc 64 133ndash150Kennett BLN Engdahl ER 1991 Travel times for global earthquake location and
phase identification Geophys J Int 105 429ndash465Lin J Stein RS 2004 Stress triggering in thrust and subduction earthquakes and
stress interaction between the southern San Andreas and nearby thrust and strike-slip faults J Geophys Res 109 B02303
Liu Y Teng T-L Ben-Zion Y 2004 Systematic analysis of shear-wave splitting in theaftershock zone of the 1999 Chi-Chi Taiwan earthquake shallow crustal
414 MK Savage et al Earth and Planetary Science Letters 290 (2010) 403ndash414
anisotropy and lack of precursory variations Bull Seismol Soc Am 94 (6)2330ndash2347
Long MD van der Hilst RD 2005 Upper mantle anisotropy beneath Japan from shearwave splitting Phys Earth Planet Inter 151 206ndash222
Lund B Townend J 2007 Calculating horizontal stress orientations with full or partialknowledge of the tectonic stress tensor Geophys J Int 170 (3) 1328ndash1335
Mardia KV Jupp PE 2000 Directional Statistics JohnWiley amp Sons Ltd West Sussex429 pp
Matcham I Savage MK Gledhill KR 2000 Distribution of seismic anisotropy in thesubduction zone beneath the Wellington region New Zealand Geophys J Int 1401ndash10
McNutt SR 2005 Volcanic seismology Annu Rev Earth Planet Sci 32 461ndash491Miller VL Savage MK 2001 Changes in seismic anisotropy after a volcanic eruption
evidence from Mount Ruapehu Science 293 2231ndash2233Nur A Simmons G 1969 Stress-induced velocity anisotropy in rock an experimental
study J Geophys Res 74 6667ndash6674Nuttli OW 1961 The effect of the Earths surface on the S wave particle motion Bull
Seismol Soc Am 51 237ndash246Peacock S Crampin S Booth D Fletcher JB 1988 Shear wave splitting in the Anza
seismic gap southern California temporal variations as possible precursorsJ Geophys Res 93 (B4) 3339ndash3356
Peng Z Ben-Zion Y 2004 Systematic analysis of crustal anisotropy along theKaradere-Duzce branch of the North Anatolian fault Geophys J Int 159 (1)253ndash274
Ribe NM Yu Y 1991 A theory for plastic deformation and textural evolution ofolivine polycrystals J Geophys Res 96 8325ndash8335
Rowlands DP White RS Haines J 2005 Seismic tomography of the TongariroVolcanic Centre New Zealand Geophys J Int 163 (3) 1180ndash1194
Ruumlmpker G Silver PG 1998 Apparent shear-wave splitting parameters in thepresence of vertically varying anisotropy Geophys J Int 135 790ndash800
Saiga A Hiramatsu Y Ooida T Yamaoka K 2003 Spatial variation in the crustalanisotropy and its temporal variation associated with a moderate-sized earthquakein the Tokai region central Japan Geophys J Int 154 695ndash705
Saltzer RL Gaherty JB Jordan TH 2000 How are vertical shear wave splittingmeasurements affected by variations in the orientation of azimuthal anisotropywith depth Geophys J Int 142 (2) 374ndash390
Savage MK 1999 Seismic anisotropy and mantle deformation what have we learnedfrom shear wave splitting Rev Geophys 37 (1) 65ndash106
Savage MK Sheehan AF Lerner-Lam A 1996 Shear-wave splitting across the RockyMountain Front Geophys Res Lett 23 (17) 2267ndash2270
Silver PG Chan WW 1991 Shear wave splitting and subcontinental mantledeformation J Geophys Res 96 16429ndash16454
Silver PG Savage MK 1994 The interpretation of shear-wave splitting parameters inthe presence of two anisotropic layers Geophys J Int 119 (3) 949ndash963
Takada A 1994 The influence of regional stress and magmatic input on styles ofmonogenetic and polygenetic volcanism J Geophys Res 99 13563ndash13573
Takagi A et al 2005 Magma supply system of the 2004 eruption at Asama Volcanoestimated by crustal deformation data Kazan 50 (5) 363ndash375
Takeo M Aoki Y Ohminato T Yamamoto M 2006 Magma supply path beneath MtAsama volcano Japan Geoph Res Lett 33 L15310
Teanby N Kendall J-M van der Baan M 2004 Automation of shear-wave splittingmeasurements using cluster analysis Bull Seismol Soc Am 94 453ndash463
Toda S Stein R Richards-Dinger K Bozkurt S 2005 Forecasting the evolution ofseismicity in southern California animations built on earthquake stress transferJ Geophys Res 110 B05S16
Townend J 2006 What do faults feel Observational constraints on the stresses actingon seismogenic faults Earthquakes Radiated Energy and the Physics of FaultingGeophysical Monograph Series American Geophysical Union pp 313ndash327
Townend J Zoback MD 2000 How faulting keeps the crust strong Geology 28 (5)399ndash402
Townend J Zoback MD 2006 Stress strain and mountain building in central JapanJ Geophys Res 111 B03411
Urabe T Tsukada S 1992 WIN mdash A Workstation Program for Processing WaveformData from Microearthquake Networks Seismological Society of Japan Fall MeetingAbstracts p 41 (in Japanese)
Wessel A 2008 Automatic Shear Wave Splitting Measurements at Mt RuapehuVolcano New Zealand MSc Thesis Victoria Univ Wellington Wellington 206 pp
Wessel P Smith WHF 1991 Free software helps map and display data Eos TransAGU 72 441
Zatsepin SV Crampin S 1997 Modelling the compliance of crustal rock Imdash responseof shear-wave splitting to differential stress Geophys J Int 129 (3) 477ndash494
Zhao D Wang Z Uminoa N Hasegawa A 2009 Mapping the mantle wedge andinterplate thrust zone of the northeast Japan arc Tectonophysics 467 (1ndash4)89ndash106
404 MK Savage et al Earth and Planetary Science Letters 290 (2010) 403ndash414
The larger stress changes associated with deformation beforevolcanic eruptions provide an easier target for precursory studies andshear wave splitting has recently been proposed as a method tomonitor stress on volcanoes (Miller and Savage 2001 Gerst andSavage 2004 Bianco et al 2006 Bianco and Zaccarelli 2009) In NewZealand and Italy changes in ϕ on the order of 90deg were observed nearvolcanoes associated with eruptive activity The most likely causeswere dyke intrusions that reversed local stress orientations (Gerst andSavage 2004)
2 Data and setting
Mt Asama is an active andesitic volcano located in central HonshuJapan An eruption that began 1 Sept 2004 was preceded by a dyke
Fig 1 Tectonic setting and rose diagrams (a) Tectonic setting of study area The red box is the rthe shearwaves for the three bestfilters at eachstation for the ldquosteeprdquogroupof events (see Sectiomeasurements Table S1 gives the numbers of measurements and averages for the stations witorange line is the orientation of SHmaxmeasured from earthquake focalmechanism inversions (TSKS phasesmeasured (Long and van der Hilst 2005) on stations east of longitude 136deg and soutbluebox outlines the regionenlarged inparts c andd (c) Rosediagrams for events occurringbeffor stations that were operating before the eruption
intrusion whose characteristics have been inferred from GPS measure-ments and from locations of volcanic earthquakes (Takeo et al 2006)
We measured shear wave splitting on seismograms from all theavailable three-component seismometers monitored by the AsamaVolcano Observatory during the period Sept 2002 through May 2008(Fig 1 Table S1) We examined two types of events Regionalearthquakes determined by the Japan Meteorological Agency to beoutside the Asama Volcano Observatory network but within 300 kmof the volcano and local earthquakes determined by the observatory(Urabe and Tsukada 1992) to be within the network Ray paths fromlocal earthquakes travel solely through the volcano so that anisotropyin the mantle or lower crustal mineral alignment will not affect themeasurements However earthquake activity related to dyke intru-sion will likely migrate causing the ray paths to change Spatial
egion outlined in part b (b) Rose diagrams (circular histograms) of the fast polarisations ofn32) onabasemapof thedigital topography Small roses are for stationswith less than10hin this figure The blue line is the surface projection of the dyke (Takagi et al 2005) Theownend and Zoback 2006) Thewhite line is theminus27plusmn29deg average orientation ofϕ fromh of latitude 40deg 0221 and 0268 are the GPS stationswhose spacing is plotted in Fig 5 Theore the eruption (d)Rosediagrams for events occurring after the eruption Yellow roses are
405MK Savage et al Earth and Planetary Science Letters 290 (2010) 403ndash414
changes are thus difficult to disentangle from temporal changesRegional earthquakes occur mostly in the subducted Philippine andPacific plates and their paths are affected by mantle and lower crustalmineral anisotropy as well as by crustal stress They are also affectedby laterally varying properties but earthquakes far removed from thevolcano should not have systematic variations in location that arecorrelated with magma movement Therefore changes in measure-ments from regional events that correlate withmagmamovement canbe interpreted as temporal rather than spatial variations
For the local events we examined all a-type (tectonic) earth-quakes located via the standard processing procedure (Urabe andTsukada 1992) This includes stations run by Asama VolcanoObservatory the Japan Meteorological Association and Hi-netnetworks
For the regional earthquakes we searched the JapanMeteorologicalAgency (JMA) catalogue for all events over magnitude 20 within theinterval bounded by longitudes 1405deg and 1365deg and latitudes 385deg to345deg and examined all events that had triggered the recording systemwithin 30 s of the earthquake origin times
3 Methods
31 Shear wave splitting calculations
We use the Teanby et al (2004) shear wave splitting code withmodifications to allow automatic quality classification The Teanbycode uses at its base the Silver and Chan (1991) (SC) shear wavesplitting analysis technique The SC analysis is carried out on multiplemeasurement windows and cluster analysis determines the bestwindow The cluster that has the minimum variance is chosen as thebest cluster and a final SC measurement is made based on the bestwindowwithin the cluster The only manual step is to pick the S wavearrival The results are free from operator bias and large numbers ofwaveforms can be processed so that patterns can emerge from noisydata
Local events are routinely checked by hand before cataloguing andwe used these catalogued S arrival times For the regional events weused the TauP code (Crotwell et al 1999) to determine the P and Sarrival times expected for the event location and the IASPEI 91 arrivaltime model (Kennett and Engdahl 1991) The waveforms wereexamined by eye and S wave arrival times were determined bycomparing the expected arrival times with the waveforms payingcareful attention to changes in frequency content over time in thewaveforms and the relative arrival times of S and P waves becauseboth P and S waves usually arrived later than predicted
We use computer scripts developed by Wessel (2008) toautomatically process data using the Teanby et al (2004) clusteranalysis splitting codes The main advance in the scripts is in usingmultiple filters (Table S2) to find the frequency bands with the bestsignal-to-noise ratios and choosing the length of the measurementwindows based on the period of the waveform The measurementwindow has a minimum length of the dominant period and amaximum length of 25 times the dominant period
We make a small modification to the Teanby code to grade themeasurements to minimize effects of cycle skipping in which thesplitting program may mismatch waveforms by an integer number ofhalf cycles If it is mismatched by one half cycle then the fast and slowwaves may be interchanged and dt differs by one half period(Matcham et al 2000) If it is mismatched by two half cycles thenϕ remains the same but dt differs by a whole period All clusters withnumbers above a minimum threshold (set as 5 in the analysis here)are compared to the chosen ldquobest clusterrdquo The measurementspresented here fit the following criteria If the average fast polarisa-tion of any cluster of more than 5 windows is more than π8 radiansfrom that of the best cluster or if the average delay time differs fromthe best cluster delay time by more than 18 of the maximum allowed
splitting time then the measurement is rejected as possibly affectedby cycle skipping (Figs S1 and S2) We ran the analysis for the threebest filters for each eventndashstation pair Waveforms that give goodresults for several filters will therefore be weightedmore heavily thanwaveforms that give good results for only a single filter (Gerst andSavage 2004)
Further grading of measurements passing the cycle skipping test isbased on the formal errors of the final best splitting measurement(errors in ϕ must be less than 25deg) the signal-to-noise ratio (it mustbe greater than 3) and two additional criteria to determine if themeasurement could be ldquonullrdquowhich occurs when there is no splittingSuch null measurements occur when either there is no anisotropy orif the initial polarisation is parallel or perpendicular to the fastorientation We use the criterion suggested previously (Savage et al1996 Peng and Ben-Zion 2004) If ϕ is between 0deg and 20deg orbetween 70deg and 90deg of themeasured incoming polarisation directionit is considered a null measurement Furthermore measurementswith dt larger than a maximum value (10 s for regional events and04 s for local events) are likely to be nulls and are removed The localevents and regional events used the same codes and filters except forthe difference in maximum allowed dt
32 Event groupings
For angles of incidence at the surface of greater than 35deg convertedphases can interfere with shear wave splitting measurements (Nuttli1961 Booth and Crampin 1985) However low velocities at thesurface result in near-vertical arrivals for many events To account forthis many people consider only events within this ldquoshear wavewindowrdquo of 45deg based on straight-line ray paths (ie assuminghomogeneous velocity eg Peacock et al 1988) However using onlysuch straight-line ray path restrictions can unnecessarily delete toomany events from analysis We divided our results into several setsdepending on the angle of incidence and earthquake depth
For regional events one group (ldquosteeprdquo for steep incidence angles)was made up of events with straight-line angles of incidence less than45deg following previous conventions However these events actuallyhad angles of incidence between 0deg and 17deg from the verticalcalculated using the 20 kms shear wave velocity in the top layer ofthe standard velocity model used to calculate hypocentres All theseearthquakes were deeper than 40 km Events with larger incidenceangles were broken into two groups based on whether their depthswere shallower (ldquoshallrdquo) or deeper (ldquodeeprdquo) than 40 km
All the ldquosteeprdquo events were within the so-called ldquoBand-2rdquoincidence of within 15deg from the crack plane in which the delaytimes are sensitive to crack density (Peacock et al 1988 Crampin1999) (Fig 2) Paths within the shear wave window but outsideldquoBand-2rdquo are in ldquoBand-1rdquo (Crampin 1999) Although previous papersdo not usually remark upon these properties in ldquoBand-2rdquo delay timesand polarisations are relatively insensitive to angle of incidence and inldquoBand-1rdquo delay times and polarisations are a strong function of backazimuth and angle of incidence The negative delay times in ldquoBand-1rdquo(Fig 2) arise because the delay times are calculated as a differencebetween two absolute directions one of which is fast for verticalincidence angles As the angle between the propagation direction andthe crack plane continues to increase the delay times decrease untilthey reach zero (the two waves arrive at the same time) and then forfurther increases in angles the fast and slow components switchpolarity The former fast direction becomes slow and vice-versa evenfor paths within the shear wave window
Events in the ldquoshallrdquo and ldquodeeprdquo groups were measured at thestations closest to the summit that operated both before and after theeruption for times up through the end of 2006 These paths hadangles of incidence of 14deg to 21deg from the vertical (Calculated with asurface velocity of 20 kms) which makes them within ldquoBand-2rdquo iftheir back azimuth is within 15deg of the crack plane strike Otherwise
Fig 2 Stereographic projection of shear wave splitting ϕ and dt expected for parallelvertical cracks oriented in the EndashWplane The bold circle is the ldquoshear wave windowrdquo of45deg used by Peacock et al (1988) the thin circle is a window of 35deg and the dotted circleis a window of 15deg The top diagram shows the fast directions and the bottom diagramshows contours of dt ldquoBand-1rdquo is shaded and ldquoBand-2rdquo is unshaded The graph at theleft shows a cross section of dt through the centre of the figure Note that there is achange of 90deg in ϕ even for waves that arrive within the shear wave window These areshown by negative dt and changes in ϕModified from Peacock et al (1988)
406 MK Savage et al Earth and Planetary Science Letters 290 (2010) 403ndash414
the paths are in ldquoBand-1rdquo or ldquoBand-2rdquo depending on the angle ofincidence as well as the angle between the back azimuth and the crackplane (Crampin 1999)
33 Statistical analysis
To calculate average parameters we use Gaussian statistics for thedelay times and the Von Mises criterion (Mardia and Jupp 2000) acircular analogue to the normal distribution for the fast polarisationsTable S1 includes information on the statistics Error bars presentedare twice the standard error However many of the distributions arebimodal and thus are not well described by normal distributions sowe recommend caution in interpreting the averages and standarderrors (Fig 1)
34 Stress modelling
We use program Coulomb 31 (Lin and Stein 2004 Toda et al2005) to calculate the maximum horizontal stress (Lund andTownend 2007) at different depths and positions based on a modelincluding a dyke (Takeo et al 2006) and two point (Mogi) sources(Takagi et al 2005) The dyke extends between 3 and 51 km depthand has 08 m of opening The small and large Mogi sources are at025 km and 31 km depth and correspond to 6400 m3 and
200000 m3 of volume expansion respectively Youngs modulus is8times105 The regional stress is assumed to have its intermediate stressσ2 as vertical (strike-slip stress regime) and is given by the weight ofthe rock above it yielding a gradient of 21 MPakm Other stressregimes were examined but the maximum horizontal stresswas independent of the type of stress regime and depended onlyon the difference between the two horizontal stresses Theorientation of σ1 is minus64deg parallel to the dyke and the magnitudesof σ1 and σ3 vary in each case For the near-isotropic horizontalstress case we used σ1=2105 MPakm and σ3=2095 MPakmFor the case with horizontal stress as 10 of vertical we useσ1=22 MPakm and σ3=20 MPakm For Byerlee frictionσ1=260 MPakm and σ3=160 MPakm The calculation of themisfit θ uses circular statistics (Mardia and Jupp 2000) and is givenby θ=cosminus1(fminus1sumi=1
N (f(cos(αciminusαmi))N))] This equation where αci
and αmi are the calculated (SHmax) and measured (ϕ) anglesrespectively for each event i and f(x) is either the absolute value (L1norm) or the square (L2 norm) Misfits for all models considered are inTable S3
4 Results
In all there were 32 permanent seismic stations recording dataduring the study period and 30 gave reliable measurements (Fig 1Table S1) The other two were too noisy or had frequent powerfailures and so did not record much data Examples of waveformquality can be viewed in themeasurement examples (Figs S1 and S2)
41 Local events
Two hundred and fifty-five high quality measurements werereturned from 97 events at 17 stations (Table S1) The frequency bandwith the largest numbers of high quality measurements (106) had highpass of 3 Hz but frequencies up to 10 Hzweremeasured (Table S2) Thedepths of the events yielding high qualities ranged from 300 m abovesea level to 22 kmbelow sea level (Takeo et al 2006) The path lengthsrange from 06 to 52 km with a median of 35 km The angles ofincidence of these local events ranged from 2deg to 75deg using the velocityof 20 kms that is used to locate the earthquakes However actualvelocities near the surface are likely to be still smaller because the nearsurface has low velocities (P wave velocities of less than about 25 kmsat most locations (Aoki et al 2009) which translates to an S velocity of14 kms if a typicalVpVs ratio of near-surface volcanic material of 17 isused (Rowlands et al 2005)) We include only the events within therestricted angle of incidence of 45deg in Fig 3 and in the comparison of ϕwith Coulomb stress (Table S3) We show the whole set in the rosediagrams of Fig 4 Summaries from both sets are available in Table S1
42 Regional events and time variation
There were 3644 events in the JMA catalogue fitting the ldquosteeprdquocriterion (Section 32) of which 525 events triggered the seismicnetwork Using the three best filters 1305 high quality measurementswere obtained from 276 events at 27 stations The depths ranged from61 to 366 km but all except eight events had depths greater than100 km Station summary statistics are available in Table S1
There were 273 measurements in the ldquoshallrdquo group In the ldquodeeprdquogroup (Section 32) there were 1183 measurements from eventsbetween 40 and 156 km (Table S1) The majority of the filters thatprovided the best signal-to-noise ratio for the regional eventsincluding ldquosteeprdquo ldquodeeprdquo and ldquoshallrdquo were low frequency with 3 Hzas the maximum frequency filter for over 80 of the measurements
At the longest running station AVO measurements of dt from deepregional earthquakes yield systematic changes with time whichcorrelate with GPS baseline length change between two stationssituated on opposite sides of the inferred dyke (Takeo et al 2006)
407MK Savage et al Earth and Planetary Science Letters 290 (2010) 403ndash414
(Fig 5)Moving averages reveal a strong correlationbetweendt changesand GPS baseline length changes However statistical comparisons ofmoving averages are difficult due to the correlated errors The relationbetweenGPSanddtwhichweremadeatdifferent timeswasquantifiedby threedifferent tests For one testwefit a 10-degreepolynomial to the
GPS baseline length measurements Then we compared the actual dtmeasurements (not averaged) with the expected value of baselinelength change from the polynomial fit This yielded a correlationcoefficient of 02 and a p-value of 00011 (the p-value is the probabilitythat two variables with Gaussian distributions would yield such acorrelationby chance) In another testwedetermined25 timewindowsof approximately 10 points for each dt measurement varying thenumbers of points slightly so that measurements from the same eventwould remain in the same bin The time windows varied in lengthbetween 21 and 118 days with a mean of 58 days Then we calculatedthe average dt and GPS baseline length in the same time windows andcompared them to each other We obtained a correlation coefficient of06 and a p-value of 0003 Finally we calculated the averages of bothGPS anddelay timebased onnon-overlapping timewindows of 60 daysEach time period has a variable number of points The relation betweenthe two sets of averages calculated in this way gives a correlationcoefficient of 045 and a p-value of 002 Therefore the two time seriesare unlikely to be related by chance
The distribution of ϕ for stations near the volcano changeddramatically after the eruption changing by nearly 90deg at most of thecommon stations (Fig 1) Earthquakes with similar paths to thestations yield differing fast orientations before and after the eruption(Fig 6) so the variations are not likely to be caused by varying pathsStations close to the volcano that returned good measurements onregional earthquakes both before and after the eruption have averageϕ that changewith time but they vary in detail for different categoriesof events (Figs 1 and 4 Table S1)
Average ϕ at station AVO rotates from about minus30deg in mid 2002 toabout 70deg just before the eruption on 1 Sept 2004 (Fig 7) The rotationappears to correlate with the occurrence of b-type (volcanic)earthquakes and precedes the eruption After the main eruption ϕreturns to its original value over a six month period Average ϕchanges again in 2006 when the number of N-type (another type ofvolcanic earthquake called ldquotornillordquo in some studies) eventsincreases Station KUR was operating for less time than AVO butmore time than most other stations It shows a similar but smallervariation in dt for events in the ldquoshallrdquo group (Fig 8)
5 Discussion
51 Quality of shear wave arrivals
Stations on the highest topography tend to have the smallestnumber of measurements and yield the most scattered results (Figs 1and 4) The S waves on these stations were difficult to pick probablydue to scattering attenuation and topographic effects Many S waveshad poor signal-to-noise ratio and it was difficult to decide where theS wave arrived But most stations had some events with good signal-
Fig 3 Local shear wave splitting measurements for angles of incidence b45deg fromvertical superimposed on the stress calculated at 35 km below the surface usingprogram Coulomb 31 (Lin and Stein 2004 Toda et al 2005) based on a dyke and twoMogi point sources (Takagi et al 2005 Takeo et al 2006) (white circles) Each thickbar is oriented in the fast polarisation and its length is proportional to dt themeasurements are coloured by earthquake origin time The white line is the surfaceprojection of the plane containing the dyke and the light box is the surface projection ofthe rectangular dyke which dips at 89deg The pink lines are the orientation of SHmax
calculated according to the technique of Lund and Townend (2007) The backgroundshading is the difference in stress amplitude between the regional field and the fieldcaused by the sources The average misfit in degrees using the L2 norm is given aboveeach panel (a) Measurements are plotted halfway between the earthquake epicentresand the station locations and the horizontal differential stress is nearly isotropic(b) Measurements are plotted at the earthquake locations and the differential stress is10 (c) Measurements are plotted at the station and the differential stress is given byByerlee friction with a coefficient of 06 and hydrostatic pore fluid pressure (Townend2006)
Fig 4 Circular histograms of ϕ from different subsets of the regional events as in Fig 1 Panels on the left side (a and b) are from prior to the eruption on 1 September 2004 and thepanels on the right (c d e) are from after that time The patterns vary from station to station and from subcategory to subcategory which are defined in Section 32 but most stationshave distributions that change with time Too few local events occurred before the eruption to make meaningful conclusions (Table S1)
408 MK Savage et al Earth and Planetary Science Letters 290 (2010) 403ndash414
Fig 5 GPS baseline length changes and dt fromevents in the ldquodeeprdquo group (see Section 31) recorded at station AVO Singlemeasurements of dt (small green circles) andmoving averagesof dt (larger red circles) anddistance between the twoGPS stations shown inFig 1 (largeblue circles that are so close together that they look like a line)Movingaverages are takenover20points (about 7 events for splitting if three frequency bands had strong signals and 20 days for the GPSmeasurements) Error bars presented are twice the standard error The orange linedenotes the start of the eruption sequence
409MK Savage et al Earth and Planetary Science Letters 290 (2010) 403ndash414
to-noise ratioWe attribute this to attenuation and scattering affectingsome paths more than others It suggests that an attenuation analysiswould help to constrain the regional structure A general observationis that the P and S waves usually arrived later than predicted and Swas proportionately slower than the P waves This is probably due tothe slower velocities in the mantle wedge and crust in the volcanicregion (Zhao et al 2009)
52 Comparison of shear wave splitting with calculated stress orientations
Therewere few local a-type earthquakes before the eruption (Fig 7)To compare anisotropy with the stress field after the eruption we usethe local earthquakes so as to avoid contamination from mantle pathsThe population as a whole does not fit a Gaussian distribution with aformal average of minus65plusmn104deg for paths with steep incidence angles(b45deg) (Table S1 Fig 3) Yet they roughly match the stress fieldexpected (Toda et al 2005) for the magma sources determined fromGPS (Takagi et al 2005 Takeo et al 2006) in a regional stress fieldwiththemost favourable orientation for thedykeemplacement andwith10ΔSH (Fig 1 Table S3 Fig 3)Measurementsonpaths that travelled closeto the dyke tend to be perpendicular to the dyke while measurementsfor paths that travelled further away are more dyke-parallel
Fig 6 Summary of measurements for stations that were active both before and after the erupoint where the ray path intersects a horizontal surface at 5 km depth ϕ is given by the orienthe scale Colours of stations (triangles) match the colours of the measurements made oncriterion are displayed The background topography and inferred dyke (white box) location
The splitting must be acquired between the earthquake sourceand the station This means the anisotropic region is above theearthquake depths of 3ndash5 km below the surface We calculate thestress field at different depths and compare the maximumhorizontal stress SHmax to the ϕ measurements (Fig 3) usingthree different assumptions (1) Splitting is mainly caused by theportion of the path closest to the station For these the stress field atthe station location is used for the comparison (2) Splitting ismainly caused by the portion of the path near the earthquake Forthese the earthquake location is used (3) The entire pathcontributes We use the position halfway between the earthquakeand station Above and below the dyke extent of 3ndash5 km theregional stress field dominates Thus earthquakes occurring abovethe dyke should be least affected by the stress field of the dyke Wepresent results for a depth of 35 km here because it is theshallowest region with a strong effect of the dyke (Fig 3) Table S3gives the misfits for all the combinations tested Despite the obviousoversimplifications of our model we obtain better fits when weinclude both the regional stress and the stress field from the dykeWe achieve the best result when we compare the stress field at35 km with the measurements at the earthquake locations whichsuggests that we are measuring deep stresses We suggest that an
ption for the ldquosteeprdquo group (Section 32) The splitting measurements are plotted at thetation of the bars and the delay time is proportional to the length of the bars as given inthose stations Measurements from the three best filters satisfying the signal-to-noiseare as in Fig 1
Fig 7 Fast polarisations measured at AVO for the ldquodeeprdquo group of events (see Methods section for definition) and numbers of different types of events per month Small green circlesare individual measurements and large red circles are 20-point moving averages a-type are tectonic earthquakes and b- and N-type are types of volcanic earthquakes associatedwith magmatic processes (McNutt 2005) Note that the monthly numbers of b-type events have been divided by 10 so that their variation can be seen more easily in relation to theless numerous a-type and N-type events
410 MK Savage et al Earth and Planetary Science Letters 290 (2010) 403ndash414
inversion for three-dimensional anisotropic velocity structure tocompare to the stress measurements would be fruitful
For a dyke to reverse the nearby orientation of SHmax thedifference between the two regional horizontal stresses (ΔSH) mustbe small (Gerst and Savage 2004) Comparing the orientations ofthe ϕ measured from local earthquakes with models of the stress(Toda et al 2005) from the dyke intrusion our preferred model hasΔSH equal to 10 of the vertical stress which yields ΔSH of only6 MPa at 3 km below the surface (Fig 3) This is lower than theaverage differential stress at 3 km of about 50 MPa from acompilation of borehole stress data (Townend and Zoback 2000)which gives SHmax parallel to the dyke throughout our modelHowever volcanic areas such as Asama with cones that have manyeruptions (polygenetic volcanoes) may have unusually low ΔSH(Takada 1994) The stress field as measured from earthquake focalmechanism inversions changes orientation near Mt Asama (Town-end and Zoback 2006) which suggests a locally near-isotropicstress and earthquakes greater than M=40 in the region are rareFuture studies using stress inversion from focal mechanisms onthese small earthquakes are recommended to test this inferred lowstress
Fig 8 Shear wave splitting measurements at station KUR from ldquoshallrdquo group of ev
53 Calculating percent anisotropy from local earthquakes
Delay times of local earthquakes average 011plusmn002 s (Table S1)Delay time dt is related to anisotropy by the following formula (egSavage 1999) dt=L(v1minusv2)(v2v1) where v1 and v2 are the fast andslow velocities and L is the path length over which the splittingoccurs For an order of magnitude calculation we use the median pathlength of 35 km for L v2=2 kms and an average delay time of 01 sfor the local events The fractional velocity ratio (v1minusv2)v1 is 0057or 6 anisotropy Crack density ρ is defined (Hudson 1981) as thenumber of cracks M times the cube of the crack radius a divided bythe volume ρ=M(a3V) It can be calculated from the delay time andthe average shear wave velocity Vs using Hudsons (1981) equationρ=7dtVs(8L) This gives a crack density of 44times10minus2 close toaverage values for crack density calculations from shear wavesplitting (Crampin 1994)
54 Mantle vs crustal anisotropy
Fast polarisations from regional earthquakes measured away fromthe volcano are NndashS (average minus1plusmn4deg) (Fig 1) They do not line up
ents (see Section 32 for definition) Symbols are the same as in Figs 5 and 7
411MK Savage et al Earth and Planetary Science Letters 290 (2010) 403ndash414
well with the regional stress orientations (Townend and Zoback2006) but are on average parallel to the fast orientations determinedfrom SKS measurements in the region (Long and van der Hilst 2005)(minus27plusmn29deg) Therefore they are probably affected strongly by themantle anisotropy However within the immediate vicinity of thevolcano there is a general tendency for stations close to the modelleddyke to exhibit ϕ perpendicular to the dyke while stations furtheraway have more dyke-parallel ϕ (Fig 1) We infer that themeasurements made on the volcano have been affected both by themantle and by the local stress field
As we have previously found at Mt Ruapehu volcano (Gerst andSavage 2004) different ϕ are obtained for the ldquodeeprdquo and ldquoshallowrdquo
group (Table S1 Fig 4) whichmay be caused by the greater influenceof mantle anisotropy on the deep group
For regional earthquakes dt values average 03 to 04 s (Table S1) Ifanisotropy is constant with depth then the path length for theanisotropic region is 12 to 16 km which is an average value for thedepth belowwhich cracks are assumed to be closed (Crampin 1994) Ifthe cracks progressively closewith depth then the anisotropy is presentthroughout a larger region Fast polarisations caused by olivineorientation in the mantle may have been reoriented by the crustalstress field The waveforms split by the lower layer may resplit in anupper layer or if ϕ rotates slowly enough dt can remain large while ϕrotates to the stress orientation at the surface (Ruumlmpker and Silver1998 Saltzer et al 2000)We think that the waves have been resplit inthe crust based on the average incoming polarisation Φ determinedfrom the shear wave splitting code (Silver and Chan 1991) In anisotropic earth shear wave polarisations depend upon the focalmechanisms but if there are two or more layers of anisotropy thewaveswill be reoriented as they pass through each layer (eg Silver andSavage 1994) The splitting code returns the fast orientation of the lastlayer ϕ and also Φ which is the orientation of the wave just before itarrived at the last layer ThisΦwill be the fast orientation of the secondto last anisotropic layer if more than one anisotropic layer exists Theevents deeper than 40 km yieldΦ ofminus31plusmn7deg for 2488measurementsThis is within the 95 confidence interval of theminus27plusmn29deg average ofϕfrom 11 nearby SKS measurements which are phases that travelthrough the entire mantle and which were interpreted as caused byolivine orientation in the mantle above the subducted slab (Long and
Fig 9 Splitting measurements from station AVO in the ldquosteeprdquo group Single measurementsand 7
van der Hilst 2005) The average dt of 06plusmn02 s for SKS phases in theregion is consistentwith the smaller dt of 03 to 04 s for regional eventswhich travel through only part of the mantle Thus we think that thewaves from the deep events are first oriented by the mantle and thenresplit by the crust
55 Difference between ldquosteeprdquo and ldquodeeprdquo groups
Delay times for events at station AVO within the ldquodeeprdquo group(with shallow incidence angles) average 042plusmn003 s (Table S1)somewhat higher than those in the ldquosteeprdquo group (032plusmn002 s)despite the theoretical relationship that vertical cracks should yieldlower delay times in this region (Fig 2) The two groups also havesimilar hypocentral distances (172 km for the ldquosteeprdquo group and 176for the ldquodeeprdquo group) with the biggest difference being a shallowerdepth of 83 km for the ldquodeeprdquo group versus 154 km for the ldquosteeprdquogroup Therefore this difference cannot be simply explained with onelayer models and may be caused by the nonlinear interaction ofsplitting in the mantle and crustal layers which would requiremodelling beyond the scope of this paper (Silver and Savage 1994)
The most measurements and the best correlation between GPSbaseline length change anddelay time came fromstationAVO for eventsin the ldquodeeprdquo group which have shallower incidence angles than theldquosteeprdquo group (Fig 5) Station AVO is close to the volcano and is locatedat the observatory so that it is the longest operating station and it isfixed immediately if it fails and therefore it is not surprising that it hasthe most measurements Likewise because of a restricted area therewere fewer events in the ldquosteeprdquo group in particular they didnt occurduring the time period with the most rapid variation in delay time(Fig 9) However the ldquosteeprdquo events follow similar patterns in dt to theldquodeeprdquo group between late 2003 and mid-2007 and in ϕ after theeruption (compare Fig 9 with Figs 5 and 7) The 10-point movingaverage for the ldquosteeprdquo events yields similar results to the 20-pointmoving average for the ldquodeeprdquo set because the averages cover similartime periods
The average fast polarisations for the ldquosteeprdquo set at AVO before theeruption appear to be rotating in the opposite direction to the averagefor the events with shallower incidence angles (compare Figs 7 and 9)However close examination of individualmeasurements reveal that the
are purple circles Red circles are 10-point moving averages Other symbols as in Figs 5
412 MK Savage et al Earth and Planetary Science Letters 290 (2010) 403ndash414
difference in rotation is an artefact due to having fewer events in theldquosteeprdquo group combined with rapid rotation of the stress field
56 Effect of angle of incidence and ldquoBand-1 and 2rdquo
In cracked media theoretical delay times vary for paths coming inat different angles to the crack plane even for constant crack density(Fig 2) Therefore changes in crack plane orientation could causechanges in splitting delay times As explained in Section 31 ldquoEventGroupingsrdquo ldquoBand-2rdquo is a region of propagation angles that arrivewithin 15deg of the crack plane (Peacock et al 1988) Within this bandthe delay times vary slightly but not greatly with propagationdirection Outside this region ldquoBand-1rdquo the delay times change
Fig 10 Recalculation of time variation at station AVO for deep events with shallow incidencedirection and the crack planes (see Section 56) is greater (ldquoBand-1rdquo a and b) or less (ldquoBandregion with crack planes less than 15deg there are more measurements in that region and th
rapidly with both angle of incidence and with propagation directionThere is a small region where the fast and slow waveforms changepositions so that the fast polarisation changes by 90deg
The paths of the ldquosteeprdquo measurements all have incidence angleswithin 17deg of vertical and are all within the region denoted as ldquoBand-2rdquoSo for these paths the rotation in the crack planes should lead to littlechange indelay time Therefore the timevariation indelay time for theseevents is unlikely to be caused by rotation of the crack planes (Fig 2)
The ldquodeeprdquo and ldquoshallrdquo groups are coming in at lower incidenceangles Some are within ldquoBand-1rdquo and some are in ldquoBand-2rdquo In thisregion if the cracks rotate due to a rotating stress field constant pathsbetween earthquakes and receivers will pass through varying angleswith respect to the crack planes They will then migrate between
angles separating results into those regions where the angle between the propagation-2rdquo c and d) than 15deg Variations are observed with both sets but since there is a widerey exhibit the same relationship with the GPS as the whole group did in Fig 5
413MK Savage et al Earth and Planetary Science Letters 290 (2010) 403ndash414
ldquoBand-1rdquo and ldquoBand-2rdquo Therefore we test the hypothesis that thechanging delay times (Fig 5) as well as changes of 90deg in fastpolarisation (Figs 1 4 6 and 7) may both be caused by the rotation ofthe crack orientations due to the stress field changing direction Asdiscussed in Section 54 the shallow and deep events exhibit differentbehaviour (Fig 4) so here we concentrate only on the deep eventsWe separate the set of events defined as ldquodeeprdquo into measurementswhose paths went through the two bands We divide our time periodsinto intervals over which the fast polarisations of the ldquosteeprdquo eventshave relatively constant values and we use the average ϕ from theldquosteeprdquo events to determine a crack plane orientation We use thesecrack planes to determine whether events are inside or outside the15deg ldquoBand-2rdquo region (Fig 10) Variations in delay time and thecorrelation with GPS path length changes are maintained in bothgroups Therefore we conclude that the variation in delay time is notcontrolled by changing crack orientations
57 Time variations and crack aspect ratios
Travel pathsnear the surface affect the splittingmeasurementsmorethan distant sections of the path (Ruumlmpker and Silver 1998 Saltzeret al 2000) so that time-varying effects aremost likely caused by near-surface stress changes which can occur in seconds tominutes (Zatsepinand Crampin 1997) rather than changes in mineral orientation atdepth which should occur over periods of thousands of years (Ribe andYu 1991) If we take the simplest interpretation that the changes in dtare all caused by the changing widths of thin coin-shaped cracks(Hudson 1981) and that the GPS baseline changes are also caused byopening and closing of these cracks then we can relate the twomeasurements to give the aspect ratio α defined as the ratio of crackwidth to radius as follows (Hatchell and Bourne 2005) α=(4ερπ2)where ε is the strain change If we assume the strain occurs over thesame 35 km path length for the GPS baseline change as for the shearwave splitting change then ε=002 m35 km=57times10minus06 Thisyields α=26times10minus05 It is independent of path length if the samelength is used to calculate ε and ρ The small crack aspect ratio is indeedconsistent with the assumptions of the model that the cracks are thin
58 Comparison of delay time variations and polarisation variations
Surprisingly neither the GPS baseline changes nor the delay timechanges at station AVO have as strong a relation to themain eruption orto the numbers of b-type and a-type events as doesϕ (Figs 5 and 7)ϕ isa proxy for stress orientation while GPS and delay time measurementsdepend on the crack density and aspect ratios and so are less directlyrelated to the stress One explanation is that as the stress orientationchanges it closes cracks of one orientation while opening those inanother orientation In this way the numbers of cracks could remainconstant even as the orientation changed Perhaps the changing stressorientation occurred as the magma conduit geometry changed whichallowed an easier path for the magma to reach the surface
6 Conclusions
Geodesy and seismic anisotropy can be combined to derive newinformation about volcanic regions such as the horizontal differentialstress and the crack aspect ratios Correlations of ϕ and dt withvolcanic activity furthermore suggest that magmatic intrusionsdisrupt the local stress field Monitoring of this stress field bymeasuring anisotropy variations through shear wave splitting andpossibly other techniques such as surface wave noise analysis(Brenguier et al 2008) could be used in areas where geodeticinformation is unavailable or where the changes are taking place toodeeply to be observed by surface geodetic stations
Acknowledgements
We thank A Wessel and N Teanby for use of the shear wavesplitting analysis codes S Toda R Stein J Lin and V Sevilgen for useof the Coulomb stress modelling software and J Townend E SmithR Arnold and J Johnson for helpful discussions and editorialsuggestions Some figures used the GMT mapping codes (Wesseland Smith 1991) The regional earthquake locations used in thisstudy are produced by the Japan Meteorological Agency incooperation with the Ministry of Education Culture Sports Scienceand Technology The catalogue locations are based on seismic dataprovided by the National Research Institute for Earth Science andDisaster Prevention the Japan Meteorological Agency HokkaidoUniversity Hirosaki University Tohoku University the University ofTokyo Nagoya University Kyoto University Kochi UniversityKyushu University Kagoshima University the National Institute ofAdvanced Industrial Science and Technology the GeographicalSurvey Institute Tokyo Metropolis Shizuoka Prefecture Hot SpringsResearch Institute of Kanagawa Prefecture Yokohama City and JapanAgency for Marine-Earth Science and Technology This work wassupported by the University of Tokyo Earthquake Research InstituteInternational Programme the Japan Society for the Promotion ofScience and the New Zealand Marsden Fund and used analysis codesdeveloped with funding from the New Zealand Earthquake Commis-sion M Savage conducted much of this work while on research leavefrom Victoria University
Appendix A Supplementary data
Supplementary data associated with this article can be found inthe online version at doi101016jepsl200912037
References
Aoki Y et al 2009 P-wave velocity structure beneath Asama Volcano Japan inferredfrom active source seismic experiment J Volcanol Geotherm Res 187 272ndash277
Arnold A Townend J Vignaux T 2005 Mapping tectonic stress using earthquakesIn Knuth KH Abbas AE Morris RD Castle JP (Eds) Bayesian Inference andMaximum Entropy Methods in Science and Engineering American Institute ofPhysics San Joseacute CA
Aster RC Shearer PM Berger J 1990 Quantitative measurements of shear wavepolarizations at the Anza seismic network southern California implications forshear wave splitting and earthquake prediction J Geophys Res 95 (B8)12449ndash12473
Bianco F Zaccarelli L 2009 A reappraisal of shear wave splitting parameters fromItalian active volcanic areas through a semiautomatic algorithm J Seismol 13253ndash266
Bianco F Scarfi L Pezzo ED Patane D 2006 Shear wave splitting changesassociated with the 2001 volcanic eruption on Mt Etna Geophys J Int 167 (2)959ndash967 doi101111j1365-246X200603152x
Boness NL Zoback MD 2006 A multiscale study of the mechanisms controllingshear velocity anisotropy in the San Andreas Fault Observatory at DepthGeophysics 71 (5) F131ndashF146
Booth D Crampin S 1985 Shear-wave polarizations on a curved wavefront at anisotropic free-surface Geophpys J R Astron Soc 83 31ndash45
Brenguier F et al 2008 Towards forecasting volcanic eruptions using seismic noiseNat Geosci 1 126ndash130
Crampin S 1994 The fracture criticality of crustal rocks Geophys J Int 118 428ndash438Crampin S 1999 Calculable fluidndashrock interactions J Geol Soc 156 501ndash514Crotwell HP Owens TJ Ritsema J 1999 The TauP Toolkit flexible seismic travel-
time and ray-path utilities Seism Res Lett 70 154ndash160Dzurisin D 2003 A comprehensive approach to monitoring volcano deformation as a
window on the eruption cycle Rev Geophys 41 (1) 1ndash29Gerst A Savage MK 2004 Seismic anisotropy beneath Ruapehu Volcano a possible
eruption forecasting tool Science 306 1543ndash1547Hatchell P Bourne S 2005 Rocks under strain strain-induced time-lapse time shifts
are observed for depleting reservoirs Leading Edge 1222ndash1225Hudson JA 1981Wave speeds and attenuation of elastic waves inmaterial containing
cracks Geophysical J R Aston Soc 64 133ndash150Kennett BLN Engdahl ER 1991 Travel times for global earthquake location and
phase identification Geophys J Int 105 429ndash465Lin J Stein RS 2004 Stress triggering in thrust and subduction earthquakes and
stress interaction between the southern San Andreas and nearby thrust and strike-slip faults J Geophys Res 109 B02303
Liu Y Teng T-L Ben-Zion Y 2004 Systematic analysis of shear-wave splitting in theaftershock zone of the 1999 Chi-Chi Taiwan earthquake shallow crustal
414 MK Savage et al Earth and Planetary Science Letters 290 (2010) 403ndash414
anisotropy and lack of precursory variations Bull Seismol Soc Am 94 (6)2330ndash2347
Long MD van der Hilst RD 2005 Upper mantle anisotropy beneath Japan from shearwave splitting Phys Earth Planet Inter 151 206ndash222
Lund B Townend J 2007 Calculating horizontal stress orientations with full or partialknowledge of the tectonic stress tensor Geophys J Int 170 (3) 1328ndash1335
Mardia KV Jupp PE 2000 Directional Statistics JohnWiley amp Sons Ltd West Sussex429 pp
Matcham I Savage MK Gledhill KR 2000 Distribution of seismic anisotropy in thesubduction zone beneath the Wellington region New Zealand Geophys J Int 1401ndash10
McNutt SR 2005 Volcanic seismology Annu Rev Earth Planet Sci 32 461ndash491Miller VL Savage MK 2001 Changes in seismic anisotropy after a volcanic eruption
evidence from Mount Ruapehu Science 293 2231ndash2233Nur A Simmons G 1969 Stress-induced velocity anisotropy in rock an experimental
study J Geophys Res 74 6667ndash6674Nuttli OW 1961 The effect of the Earths surface on the S wave particle motion Bull
Seismol Soc Am 51 237ndash246Peacock S Crampin S Booth D Fletcher JB 1988 Shear wave splitting in the Anza
seismic gap southern California temporal variations as possible precursorsJ Geophys Res 93 (B4) 3339ndash3356
Peng Z Ben-Zion Y 2004 Systematic analysis of crustal anisotropy along theKaradere-Duzce branch of the North Anatolian fault Geophys J Int 159 (1)253ndash274
Ribe NM Yu Y 1991 A theory for plastic deformation and textural evolution ofolivine polycrystals J Geophys Res 96 8325ndash8335
Rowlands DP White RS Haines J 2005 Seismic tomography of the TongariroVolcanic Centre New Zealand Geophys J Int 163 (3) 1180ndash1194
Ruumlmpker G Silver PG 1998 Apparent shear-wave splitting parameters in thepresence of vertically varying anisotropy Geophys J Int 135 790ndash800
Saiga A Hiramatsu Y Ooida T Yamaoka K 2003 Spatial variation in the crustalanisotropy and its temporal variation associated with a moderate-sized earthquakein the Tokai region central Japan Geophys J Int 154 695ndash705
Saltzer RL Gaherty JB Jordan TH 2000 How are vertical shear wave splittingmeasurements affected by variations in the orientation of azimuthal anisotropywith depth Geophys J Int 142 (2) 374ndash390
Savage MK 1999 Seismic anisotropy and mantle deformation what have we learnedfrom shear wave splitting Rev Geophys 37 (1) 65ndash106
Savage MK Sheehan AF Lerner-Lam A 1996 Shear-wave splitting across the RockyMountain Front Geophys Res Lett 23 (17) 2267ndash2270
Silver PG Chan WW 1991 Shear wave splitting and subcontinental mantledeformation J Geophys Res 96 16429ndash16454
Silver PG Savage MK 1994 The interpretation of shear-wave splitting parameters inthe presence of two anisotropic layers Geophys J Int 119 (3) 949ndash963
Takada A 1994 The influence of regional stress and magmatic input on styles ofmonogenetic and polygenetic volcanism J Geophys Res 99 13563ndash13573
Takagi A et al 2005 Magma supply system of the 2004 eruption at Asama Volcanoestimated by crustal deformation data Kazan 50 (5) 363ndash375
Takeo M Aoki Y Ohminato T Yamamoto M 2006 Magma supply path beneath MtAsama volcano Japan Geoph Res Lett 33 L15310
Teanby N Kendall J-M van der Baan M 2004 Automation of shear-wave splittingmeasurements using cluster analysis Bull Seismol Soc Am 94 453ndash463
Toda S Stein R Richards-Dinger K Bozkurt S 2005 Forecasting the evolution ofseismicity in southern California animations built on earthquake stress transferJ Geophys Res 110 B05S16
Townend J 2006 What do faults feel Observational constraints on the stresses actingon seismogenic faults Earthquakes Radiated Energy and the Physics of FaultingGeophysical Monograph Series American Geophysical Union pp 313ndash327
Townend J Zoback MD 2000 How faulting keeps the crust strong Geology 28 (5)399ndash402
Townend J Zoback MD 2006 Stress strain and mountain building in central JapanJ Geophys Res 111 B03411
Urabe T Tsukada S 1992 WIN mdash A Workstation Program for Processing WaveformData from Microearthquake Networks Seismological Society of Japan Fall MeetingAbstracts p 41 (in Japanese)
Wessel A 2008 Automatic Shear Wave Splitting Measurements at Mt RuapehuVolcano New Zealand MSc Thesis Victoria Univ Wellington Wellington 206 pp
Wessel P Smith WHF 1991 Free software helps map and display data Eos TransAGU 72 441
Zatsepin SV Crampin S 1997 Modelling the compliance of crustal rock Imdash responseof shear-wave splitting to differential stress Geophys J Int 129 (3) 477ndash494
Zhao D Wang Z Uminoa N Hasegawa A 2009 Mapping the mantle wedge andinterplate thrust zone of the northeast Japan arc Tectonophysics 467 (1ndash4)89ndash106