1 23 Journal of Seismology ISSN 1383-4649 J Seismol DOI 10.1007/s10950-014-9453-0 A reappraisal of seismic Q evaluated at Mt. Etna volcano. Receipt for the application to risk analysis Edoardo Del Pezzo, Francesca Bianco, Elisabetta Giampiccolo, Giuseppina Tusa & Tiziana Tuvé
Transcript
1 23
Journal of Seismology ISSN 1383-4649 J SeismolDOI 10.1007/s10950-014-9453-0
A reappraisal of seismic Q evaluated at Mt.Etna volcano. Receipt for the application torisk analysis
Edoardo Del Pezzo, Francesca Bianco,Elisabetta Giampiccolo, GiuseppinaTusa & Tiziana Tuvé
1 23
Your article is protected by copyright and all
rights are held exclusively by Springer Science
+Business Media Dordrecht. This e-offprint
is for personal use only and shall not be self-
archived in electronic repositories. If you wish
to self-archive your article, please use the
accepted manuscript version for posting on
your own website. You may further deposit
the accepted manuscript version in any
repository, provided it is only made publicly
available 12 months after official publication
or later and provided acknowledgement is
given to the original source of publication
and a link is inserted to the published article
on Springer's website. The link must be
accompanied by the following text: "The final
publication is available at link.springer.com”.
ORIGINAL ARTICLE
A reappraisal of seismic Q evaluated at Mt. Etna volcano.Receipt for the application to risk analysis
Edoardo Del Pezzo & Francesca Bianco & Elisabetta Giampiccolo &
Giuseppina Tusa & Tiziana Tuvé
Received: 7 April 2014 /Accepted: 4 August 2014# Springer Science+Business Media Dordrecht 2014
Abstract A new approach in dealing with seismic riskin the volcanic areas of Italy, by taking into account thepossible occurrence of damaging pre- or syn-eruptiveseismic events, is exciting the scientific interest and isactually the topic developed in several research projectsfunded by the European Community (e.g., UPStrat-MAFA, www.upstrat-mafa.ov.ingv.it/UPstrat/) and theCivil Defense Department of Italy. To achieve thisgoal, it is necessary to have a detailed knowledge ofthe local attenuation-distance relations. In the presentpaper, we make a survey of the estimates of the seismicquality factor of the medium reported in literature for theEtna area. In the framework of a similar paper publishedfor the Campi Flegrei zone in Southern Italy, we firstreview the results on seismic attenuation already obtain-ed for Etna and then apply a standard technique toseparately measure intrinsic and scattering attenuationcoefficients from passive seismic data recorded by theEtna seismological network. Indications are then givenfor the correct utilization of the attenuation parameters
to obtain the best candidate quality factorQ to be used inthis area for seismic risk purposes.
Keywords Seismic attenuation .MLTWAmethod .
Mt. Etna
1 Introduction
The problem of correctly evaluating risk associated withvolcanic eruptions is currently addressed to also includethe effects produced by earthquakes accompanying theeruption. Moderate earthquakes may occur during erup-tive cycles, producing local but severe damage.
Several moderate earthquakes with epicenter in theEtna area, often producing local damage, have occurredwith moment magnitude in the range of 4.2 to 5.3 (seeAzzaro et al. 2006) in the time period 1865–2002, manyof them accompanying Etna eruptions. This is one of themain reasons why the European Community (projectUPStrat-MAFA, www.upstrat-mafa.ov.ingv.it/UPStrat/)has planned to refine the prevention policies for disasteroccurrence, adding Etna in the zones under attention.
For a complete revision of the seismic risk studies, adetailed knowledge of local (inside the volcanic area)attenuation-distance relationships becomes crucial, asvolcanic areas behave quite differently from the tecton-ically active zones. Similar considerations have beendone for the Campi Flegrei area (near Naples, Italy) byDel Pezzo and Bianco (2013).
For risk purposes, the empirical amplitude (max dis-placement, velocity, or acceleration) decay curve with
J SeismolDOI 10.1007/s10950-014-9453-0
E. Del Pezzo (*) : F. BiancoIstituto Nazionale di Geofisica e Vulcanologia, sezione diNapoli “Osservatorio Vesuviano”,Naples, Italye-mail: [email protected]
E. Giampiccolo :G. Tusa : T. TuvéIstituto Nazionale di Geofisica e Vulcanologia, sezione diCatania “Osservatorio Etneo”,Catania, Italy
E. Del PezzoInstituto Andaluz de Geofisica, Universidad de Granada,Granada, Spain
distance, calculated from experimental data, is common-ly taken as the characteristic attenuation-distance curvein the area under study. In volcanoes, unfortunately,local seismicity is often highly space clustered, so thatthere is sometimes a hypocentral distance interval in thedata available insufficiently small to calculate a stableempirical attenuation-distance curve; in addition, thelocal site effects may be severe in volcanic areas, dueto the high geological heterogeneity, thus affecting thelocal estimates of max displacement (or amplitude oracceleration). To avoid these difficulties, an approachdifferent from the empirical one can be used, based onthe parametric relationship expressed in terms of qualityfactor of the earth medium, that, in turn, should beestimated taking into the necessary account all the pos-sible site effects. Recently, Convertito and Zollo (2011)formulated the seismic hazard in the area of CampiFlegrei using this approach. The purpose of the presentpaper is to contribute to the formulation of the seismichazard in the Etna area, with a new estimate of thequality factor, Q.
From a physical point of view, the energy decay forwave cycle (−ΔE/E) is expressed in terms of the qualityfactor parameter, Q, in turn related to the attenuationcoefficient η through the following equation:
η ¼ 2π fvQ
¼ −f
vΔE=E ð1Þ
where v is the wave speed and f is the frequency ofthe wave motion. It is noteworthy thatQ depends on thewave type (P, S, surface, coda) and from the physicalmechanism of energy dissipation (intrinsic or scattering,see definitions in “Appendix. Methods for the evalua-tion of Q from seismograms”). Since each type of Qassociated describes a different physical process, it isimportant to use the appropriateQ to correctly model theseismic energy attenuation with distance in seismic riskstudies. In the present note, we first review severalestimates of seismic quality factor,Q, already calculated(and reported in literature) for theMt. Etna region. Then,we calculate a separate estimate of S-wave intrinsic andscattering quality factors from seismological data usingthe standard multiple lapse time window analysis(MLTWA) technique (e.g., Sato and Fehler 1998), basedon the so-called coda normalization procedure that elim-inates the site effects (see “Appendix. Methods for theevaluation of Q from seismograms”). When in a givenarea several, and sometimes contrasting, estimates of Q
have been reported in the literature, the problem is whatis the Q parameter to choose for seismic risk applica-tions. A wrong choice of Q may have severe conse-quences on the quality of the peak ground acceleration(PGA) estimate.We therefore calculate the pattern of theS-wave peak acceleration attenuation with distance forthis area for both MLTWA and Spectral ratio estimatesof S-wave total Q, showing how the different values ofQ modify such a pattern.
2 A review of the Q measurements in Etna volcano
In this section, we give a review of the results alreadypublished. For the sake of simplicity, definitions andmethods are described in “Appendix. Methods for theevaluation of Q from seismograms,” where symboldefinitions are also reported. The present review is es-sentially based on four papers: Patané et al. (1994),hereafter cited as PA94; Del Pezzo et al. (1995), hereaf-ter cited as DP95; de Lorenzo et al. (2006), hereaftercited as DL04; and Giampiccolo et al. (2007), hereaftercited as GP07. In Table 1 and Fig. 1, a summary of themain results drawn by the above papers is reported. InFig. 2, we show the source positions of the data used ineach of the above-cited papers.
PA94, using the spectral ratio technique, estimated thequality factors (totalQ) for P- and S-waves and their ratio(Qα, Qβ, Qα/Qβ) in the frequency range between 2 and20Hz. These authors used a dataset composed of 85 localearthquakes with locations inside the Etna complex, witha depth range between the surface and 25 km and withlocal magnitudes between 1.7 and 3. Their results indi-cate a regular increase of Qα and Qβ with frequency;PA94, however, observed that Qα calculated for a subsetof the events with the shallowest hypocenters (depth lessthan 5 km) is smaller than the average Qα, indicating adepth dependence of the P-wave quality factor.
By applying the spectral ratio technique, GP07reestimated the attenuation law for both compressionaland shear waves in the Etna area using local shallowseismicity (depth less than 5 km, magnitudes between2.6 and 4.2). Results indicate strong azimuthal varia-tions in both Qα and Qβ. Marked variations of both Qα
and Qβ with frequency were also measured. Theseresults indicate a high heterogeneity of the shallow crustin Etna volcano.
DP95 used the methodology developed byWennerberg (1993) (see “Appendix. Methods for the
J Seismol
Author's personal copy
evaluation of Q from seismograms” for details) to sep-arately estimate Qi and Qs from direct measurement ofQc (Q-coda) and Qβ. DP95 used the estimate of Qβ
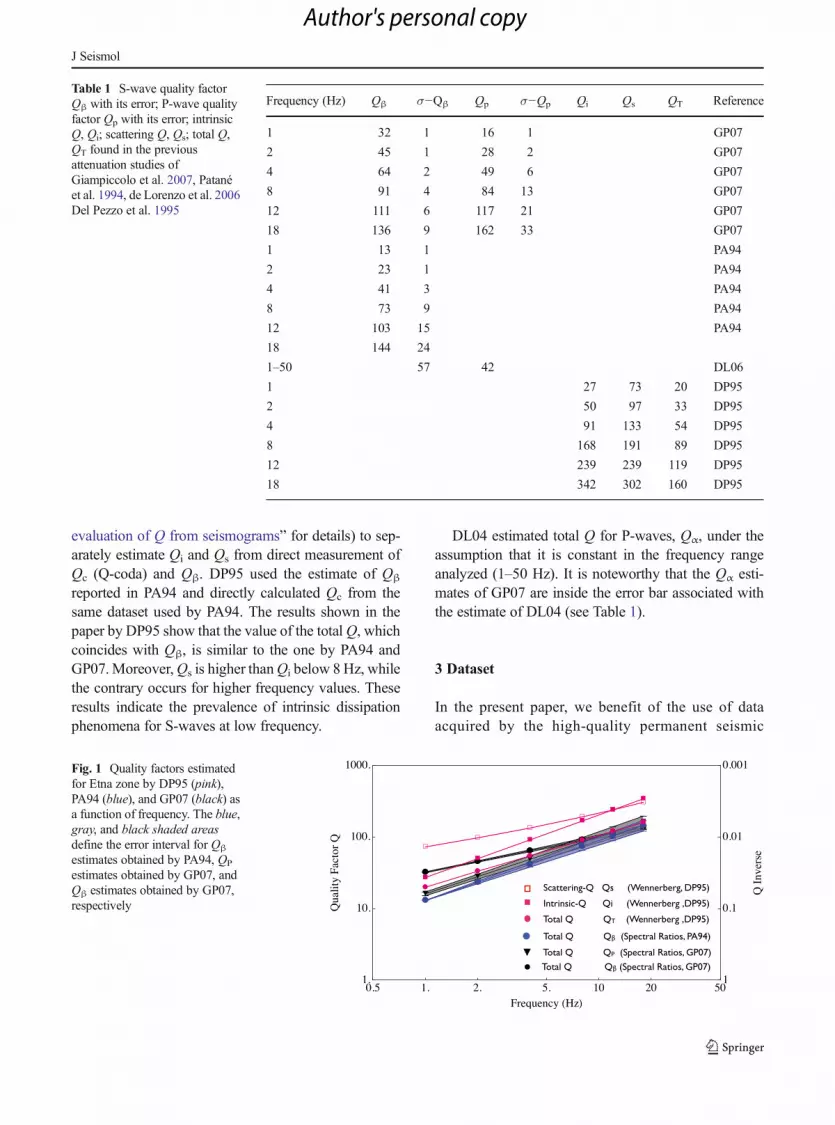
reported in PA94 and directly calculated Qc from thesame dataset used by PA94. The results shown in thepaper by DP95 show that the value of the totalQ, whichcoincides with Qβ, is similar to the one by PA94 andGP07.Moreover,Qs is higher thanQi below 8 Hz, whilethe contrary occurs for higher frequency values. Theseresults indicate the prevalence of intrinsic dissipationphenomena for S-waves at low frequency.
DL04 estimated total Q for P-waves, Qα, under theassumption that it is constant in the frequency rangeanalyzed (1–50 Hz). It is noteworthy that the Qα esti-mates of GP07 are inside the error bar associated withthe estimate of DL04 (see Table 1).
3 Dataset
In the present paper, we benefit of the use of dataacquired by the high-quality permanent seismic
Table 1 S-wave quality factorQβ with its error; P-wave qualityfactor Qp with its error; intrinsicQ, Qi; scattering Q, Qs; total Q,QT found in the previousattenuation studies ofGiampiccolo et al. 2007, Patanéet al. 1994, de Lorenzo et al. 2006Del Pezzo et al. 1995
Frequency (Hz) Qβ σ−Qβ Qp σ−Qp Qi Qs QT Reference
1 32 1 16 1 GP07
2 45 1 28 2 GP07
4 64 2 49 6 GP07
8 91 4 84 13 GP07
12 111 6 117 21 GP07
18 136 9 162 33 GP07
1 13 1 PA94
2 23 1 PA94
4 41 3 PA94
8 73 9 PA94
12 103 15 PA94
18 144 24
1–50 57 42 DL06
1 27 73 20 DP95
2 50 97 33 DP95
4 91 133 54 DP95
8 168 191 89 DP95
12 239 239 119 DP95
18 342 302 160 DP95
Fig. 1 Quality factors estimatedfor Etna zone by DP95 (pink),PA94 (blue), and GP07 (black) asa function of frequency. The blue,gray, and black shaded areasdefine the error interval for Qβ
estimates obtained by PA94, QP
estimates obtained by GP07, andQβ estimates obtained by GP07,respectively
J Seismol
Author's personal copy
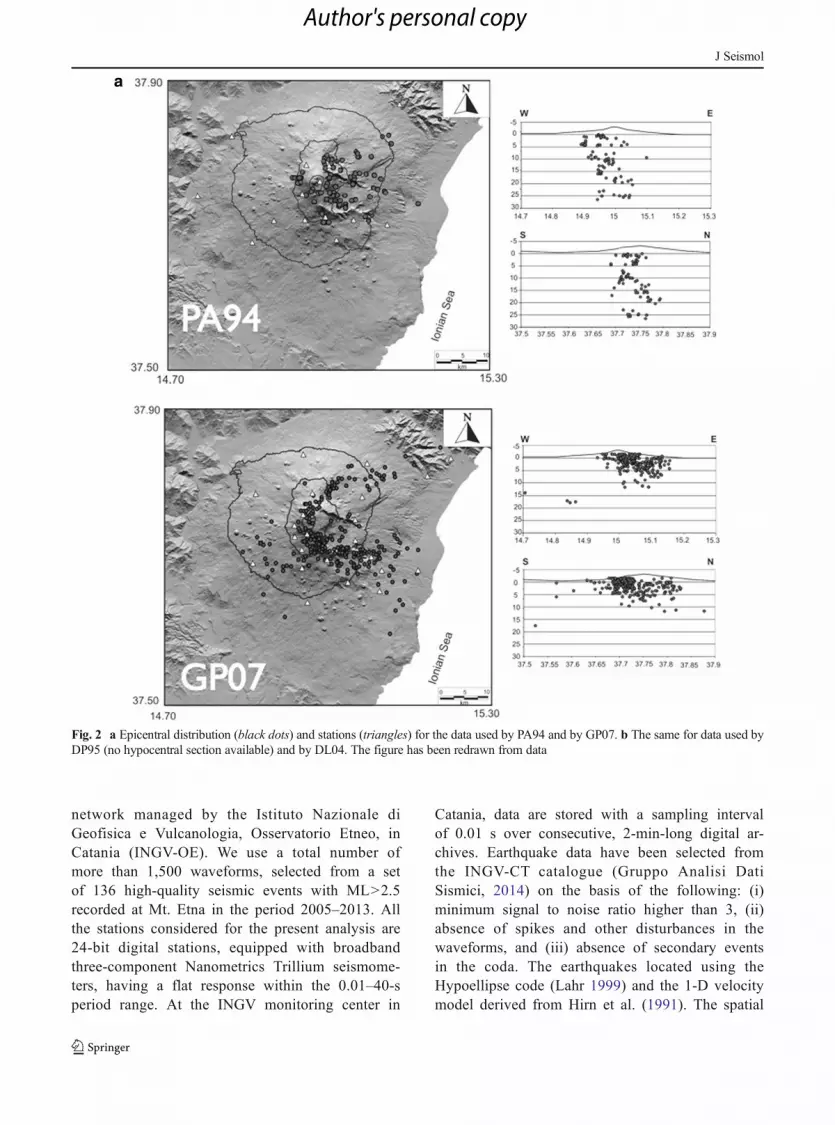
network managed by the Istituto Nazionale diGeofisica e Vulcanologia, Osservatorio Etneo, inCatania (INGV-OE). We use a total number ofmore than 1,500 waveforms, selected from a setof 136 high-quality seismic events with ML>2.5recorded at Mt. Etna in the period 2005–2013. Allthe stations considered for the present analysis are24-bit digital stations, equipped with broadbandthree-component Nanometrics Trillium seismome-ters, having a flat response within the 0.01–40-speriod range. At the INGV monitoring center in
Catania, data are stored with a sampling intervalof 0.01 s over consecutive, 2-min-long digital ar-chives. Earthquake data have been selected fromthe INGV-CT catalogue (Gruppo Analisi DatiSismici, 2014) on the basis of the following: (i)minimum signal to noise ratio higher than 3, (ii)absence of spikes and other disturbances in thewaveforms, and (iii) absence of secondary eventsin the coda. The earthquakes located using theHypoellipse code (Lahr 1999) and the 1-D velocitymodel derived from Hirn et al. (1991). The spatial
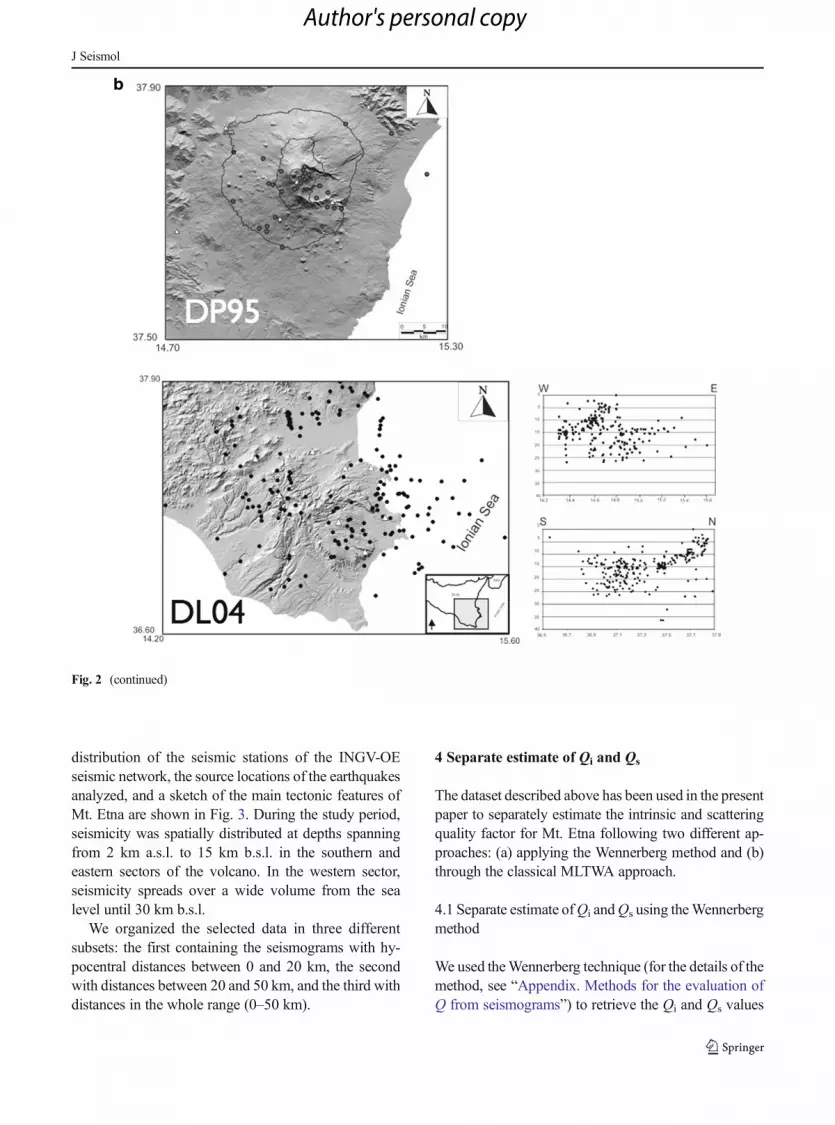
Fig. 2 a Epicentral distribution (black dots) and stations (triangles) for the data used by PA94 and by GP07. b The same for data used byDP95 (no hypocentral section available) and by DL04. The figure has been redrawn from data
J Seismol
Author's personal copy
distribution of the seismic stations of the INGV-OEseismic network, the source locations of the earthquakesanalyzed, and a sketch of the main tectonic features ofMt. Etna are shown in Fig. 3. During the study period,seismicity was spatially distributed at depths spanningfrom 2 km a.s.l. to 15 km b.s.l. in the southern andeastern sectors of the volcano. In the western sector,seismicity spreads over a wide volume from the sealevel until 30 km b.s.l.
We organized the selected data in three differentsubsets: the first containing the seismograms with hy-pocentral distances between 0 and 20 km, the secondwith distances between 20 and 50 km, and the third withdistances in the whole range (0–50 km).
4 Separate estimate of Qi and Qs
The dataset described above has been used in the presentpaper to separately estimate the intrinsic and scatteringquality factor for Mt. Etna following two different ap-proaches: (a) applying the Wennerberg method and (b)through the classical MLTWA approach.
4.1 Separate estimate ofQi andQs using theWennerbergmethod
We used theWennerberg technique (for the details of themethod, see “Appendix. Methods for the evaluation ofQ from seismograms”) to retrieve the Qi and Qs values
Fig. 2 (continued)
J Seismol
Author's personal copy
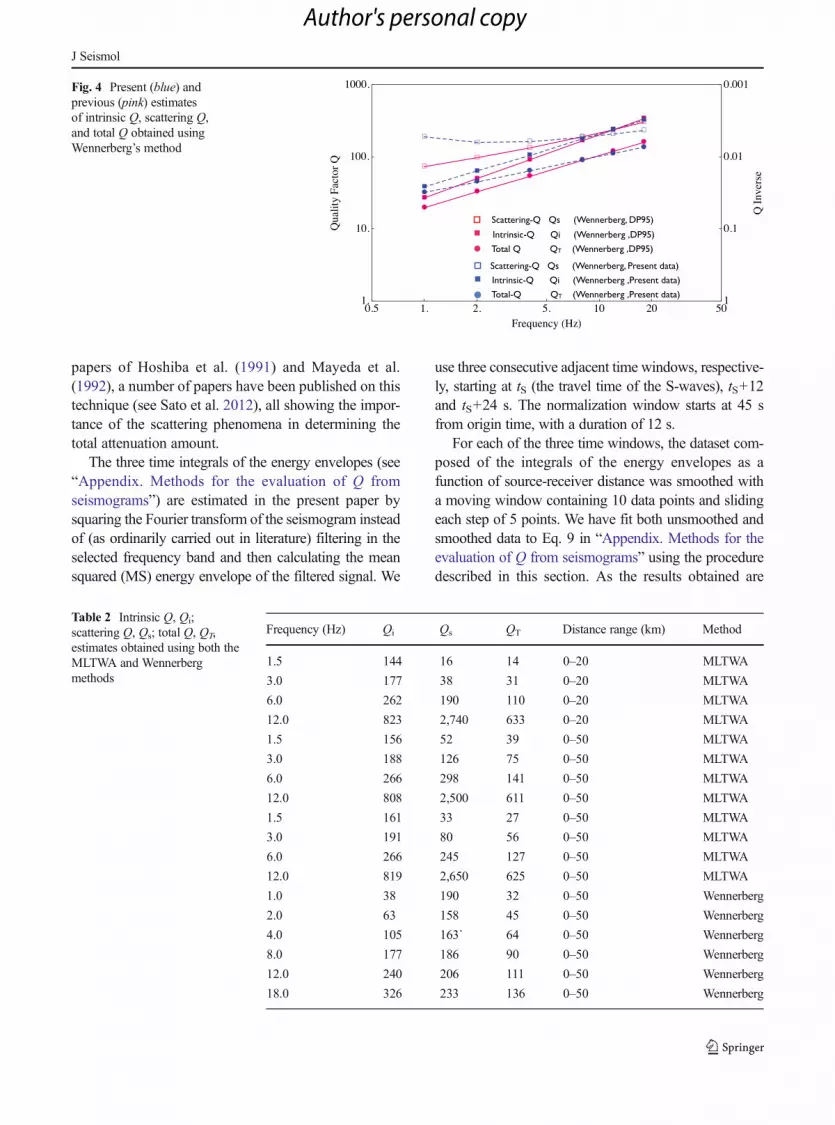
for the new dataset, also with the aim to do a comparisonwith the results obtained by DP95. In order to achievethis goal, we first reevaluated Qc for our data.Introducing the estimate of Qβ obtained by GP07 (al-ready described in the previous section) in Eqs. 7 and 8reported in the “Appendix. Methods for the evaluationofQ from seismograms,” we separately obtained resultsfor Qi and Qs that are consistent with those described inDP95. In Fig. 4, we plot the estimates obtained using theWennerberg method applied to both the present datasetand the old one, while in Table 2, we report only thepresent estimates (the old ones by DP95 are in Table 1).The two estimates (present data and old dataset)
are slightly different. As reported in “Appendix.Methods for the evaluation of Q from seismograms,”this is due to the different (and independent) estimates ofQc and Qβ utilized.
4.2 Separate estimate of Qi and Qs using MLTWAtechnique
Multiple lapse time analysis (see “Appendix. Methodsfor the evaluation ofQ from seismograms” for any detailon the method) is probably the most powerful, stable,and robust technique to calculate Qi and Qs from theseismogram energy envelopes. Since the pioneering
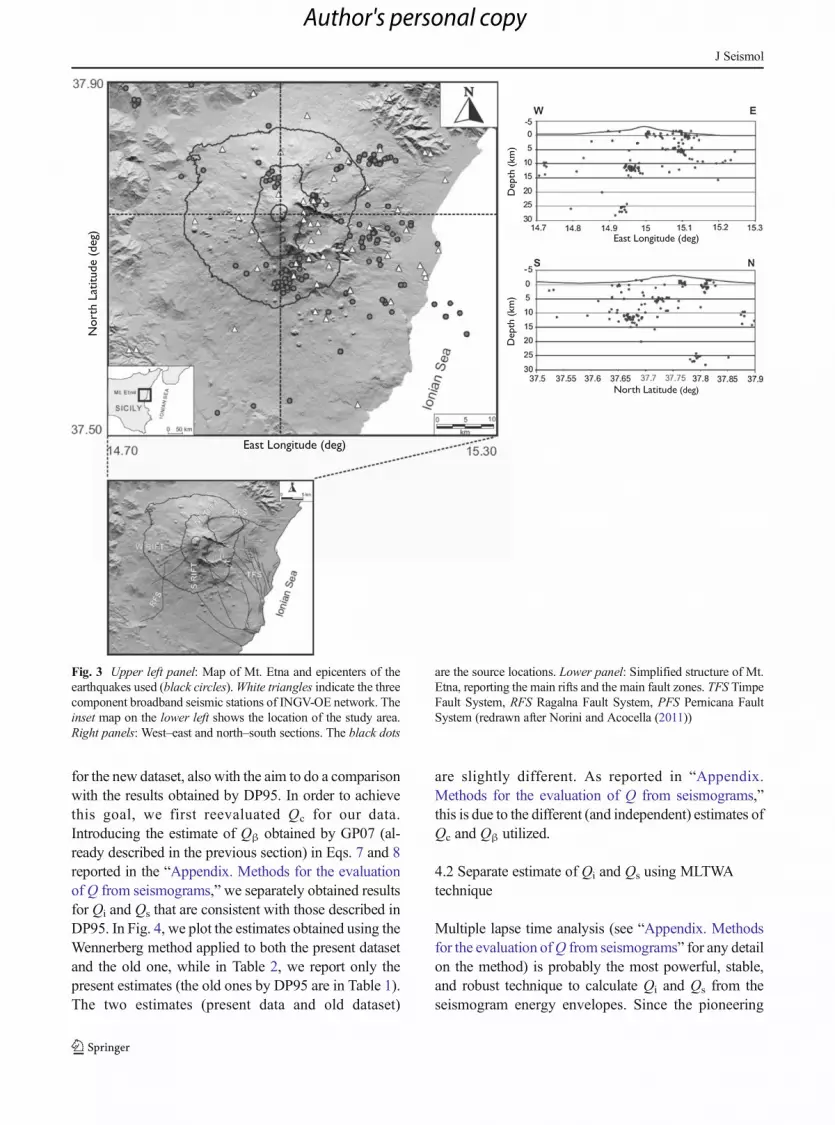
Fig. 3 Upper left panel: Map of Mt. Etna and epicenters of theearthquakes used (black circles).White triangles indicate the threecomponent broadband seismic stations of INGV-OE network. Theinset map on the lower left shows the location of the study area.Right panels: West–east and north–south sections. The black dots
are the source locations. Lower panel: Simplified structure of Mt.Etna, reporting the main rifts and the main fault zones. TFS TimpeFault System, RFS Ragalna Fault System, PFS Pernicana FaultSystem (redrawn after Norini and Acocella (2011))
J Seismol
Author's personal copy
papers of Hoshiba et al. (1991) and Mayeda et al.(1992), a number of papers have been published on thistechnique (see Sato et al. 2012), all showing the impor-tance of the scattering phenomena in determining thetotal attenuation amount.
The three time integrals of the energy envelopes (see“Appendix. Methods for the evaluation of Q fromseismograms”) are estimated in the present paper bysquaring the Fourier transform of the seismogram insteadof (as ordinarily carried out in literature) filtering in theselected frequency band and then calculating the meansquared (MS) energy envelope of the filtered signal. We
use three consecutive adjacent time windows, respective-ly, starting at tS (the travel time of the S-waves), tS+12and tS+24 s. The normalization window starts at 45 sfrom origin time, with a duration of 12 s.
For each of the three time windows, the dataset com-posed of the integrals of the energy envelopes as afunction of source-receiver distance was smoothed witha moving window containing 10 data points and slidingeach step of 5 points. We have fit both unsmoothed andsmoothed data to Eq. 9 in “Appendix. Methods for theevaluation of Q from seismograms” using the proceduredescribed in this section. As the results obtained are
Table 2 Intrinsic Q, Qi;scattering Q, Qs; total Q, QT,estimates obtained using both theMLTWA and Wennerbergmethods
Frequency (Hz) Qi Qs QT Distance range (km) Method
1.5 144 16 14 0–20 MLTWA
3.0 177 38 31 0–20 MLTWA
6.0 262 190 110 0–20 MLTWA
12.0 823 2,740 633 0–20 MLTWA
1.5 156 52 39 0–50 MLTWA
3.0 188 126 75 0–50 MLTWA
6.0 266 298 141 0–50 MLTWA
12.0 808 2,500 611 0–50 MLTWA
1.5 161 33 27 0–50 MLTWA
3.0 191 80 56 0–50 MLTWA
6.0 266 245 127 0–50 MLTWA
12.0 819 2,650 625 0–50 MLTWA
1.0 38 190 32 0–50 Wennerberg
2.0 63 158 45 0–50 Wennerberg
4.0 105 163` 64 0–50 Wennerberg
8.0 177 186 90 0–50 Wennerberg
12.0 240 206 111 0–50 Wennerberg
18.0 326 233 136 0–50 Wennerberg
Fig. 4 Present (blue) andprevious (pink) estimatesof intrinsic Q, scattering Q,and total Q obtained usingWennerberg’s method
J Seismol
Author's personal copy
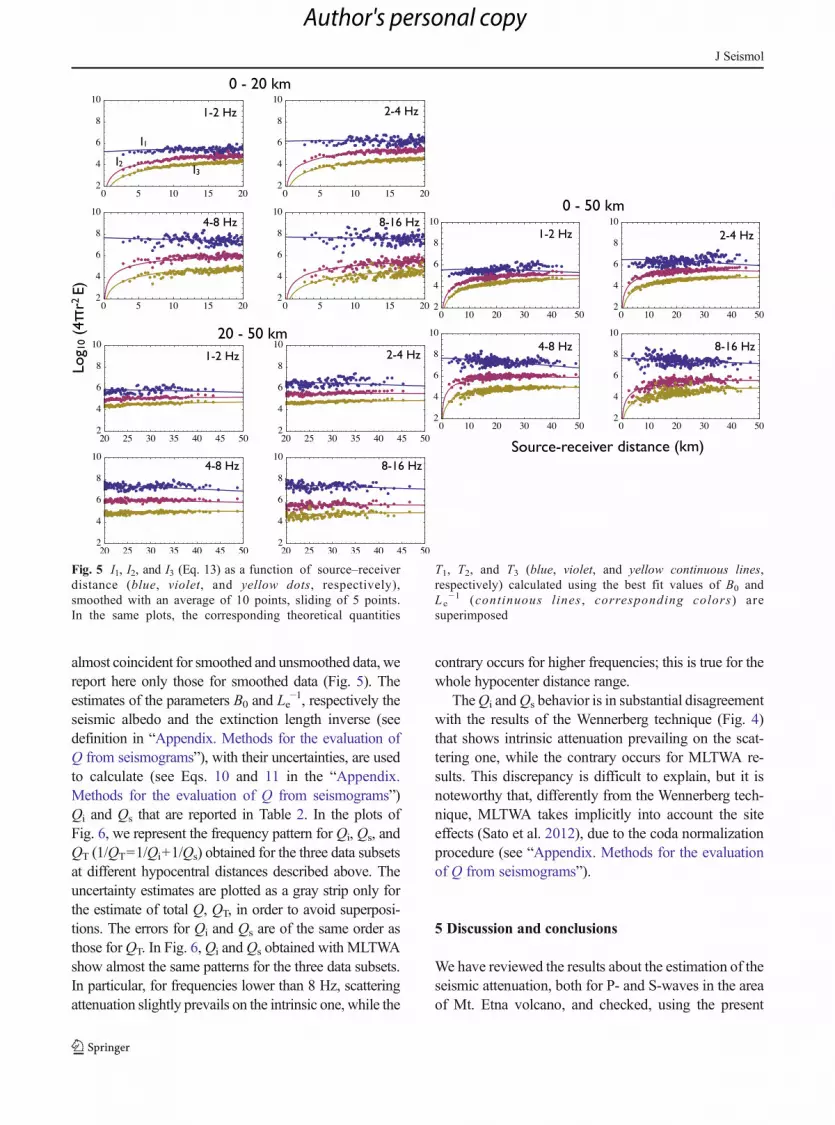
almost coincident for smoothed and unsmoothed data, wereport here only those for smoothed data (Fig. 5). Theestimates of the parameters B0 and Le
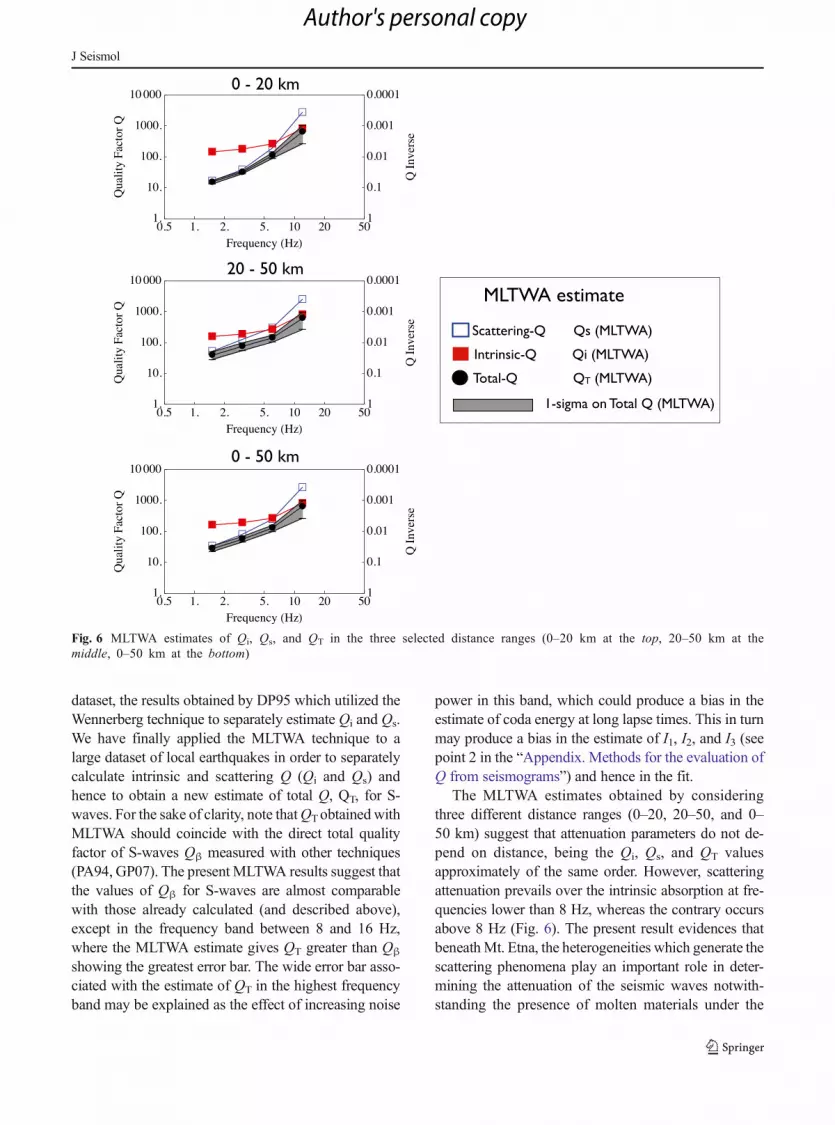
−1, respectively theseismic albedo and the extinction length inverse (seedefinition in “Appendix. Methods for the evaluation ofQ from seismograms”), with their uncertainties, are usedto calculate (see Eqs. 10 and 11 in the “Appendix.Methods for the evaluation of Q from seismograms”)Qi and Qs that are reported in Table 2. In the plots ofFig. 6, we represent the frequency pattern for Qi, Qs, andQT (1/QT=1/Qi+1/Qs) obtained for the three data subsetsat different hypocentral distances described above. Theuncertainty estimates are plotted as a gray strip only forthe estimate of total Q, QT, in order to avoid superposi-tions. The errors for Qi and Qs are of the same order asthose forQT. In Fig. 6,Qi andQs obtained with MLTWAshow almost the same patterns for the three data subsets.In particular, for frequencies lower than 8 Hz, scatteringattenuation slightly prevails on the intrinsic one, while the
contrary occurs for higher frequencies; this is true for thewhole hypocenter distance range.
TheQi andQs behavior is in substantial disagreementwith the results of the Wennerberg technique (Fig. 4)that shows intrinsic attenuation prevailing on the scat-tering one, while the contrary occurs for MLTWA re-sults. This discrepancy is difficult to explain, but it isnoteworthy that, differently from the Wennerberg tech-nique, MLTWA takes implicitly into account the siteeffects (Sato et al. 2012), due to the coda normalizationprocedure (see “Appendix. Methods for the evaluationof Q from seismograms”).
5 Discussion and conclusions
We have reviewed the results about the estimation of theseismic attenuation, both for P- and S-waves in the areaof Mt. Etna volcano, and checked, using the present
Fig. 5 I1, I2, and I3 (Eq. 13) as a function of source–receiverdistance (blue, violet, and yellow dots, respectively),smoothed with an average of 10 points, sliding of 5 points.In the same plots, the corresponding theoretical quantities
T1, T2, and T3 (blue, violet, and yellow continuous lines,respectively) calculated using the best fit values of B0 andLe
dataset, the results obtained by DP95 which utilized theWennerberg technique to separately estimate Qi and Qs.We have finally applied the MLTWA technique to alarge dataset of local earthquakes in order to separatelycalculate intrinsic and scattering Q (Qi and Qs) andhence to obtain a new estimate of total Q, QT, for S-waves. For the sake of clarity, note thatQTobtained withMLTWA should coincide with the direct total qualityfactor of S-waves Qβ measured with other techniques(PA94, GP07). The present MLTWA results suggest thatthe values of Qβ for S-waves are almost comparablewith those already calculated (and described above),except in the frequency band between 8 and 16 Hz,where the MLTWA estimate gives QT greater than Qβ
showing the greatest error bar. The wide error bar asso-ciated with the estimate of QT in the highest frequencyband may be explained as the effect of increasing noise
power in this band, which could produce a bias in theestimate of coda energy at long lapse times. This in turnmay produce a bias in the estimate of I1, I2, and I3 (seepoint 2 in the “Appendix. Methods for the evaluation ofQ from seismograms”) and hence in the fit.
The MLTWA estimates obtained by consideringthree different distance ranges (0–20, 20–50, and 0–50 km) suggest that attenuation parameters do not de-pend on distance, being the Qi, Qs, and QT valuesapproximately of the same order. However, scatteringattenuation prevails over the intrinsic absorption at fre-quencies lower than 8 Hz, whereas the contrary occursabove 8 Hz (Fig. 6). The present result evidences thatbeneathMt. Etna, the heterogeneities which generate thescattering phenomena play an important role in deter-mining the attenuation of the seismic waves notwith-standing the presence of molten materials under the
Fig. 6 MLTWA estimates of Qi, Qs, and QT in the three selected distance ranges (0–20 km at the top, 20–50 km at themiddle, 0–50 km at the bottom)
J Seismol
Author's personal copy
volcanic complex. The obtained result is in agreementwith the findings retrieved on other volcanoes such asMt. Merapi (Wegler and Luhr 2001) and Mt. Vesuvius(Bianco et al. 1999; Del Pezzo et al. 2006).
Applying the Wennerberg (1993) method, we foundthat Qs dominates over Qi (i.e., intrinsic attenuationdominating over scattering attenuation) below 8 Hz(Fig. 4). For frequencies larger than 8 Hz, scatteringattenuation slightly prevails over intrinsic attenuation.A similar result has previously been obtained at Mt.Etna by DP95 and by Del Pezzo et al. (1996) thatalready attempted to separate Qi and Qs by applyingthe Wennerberg method.
The values and the frequency pattern for Qi and Qs
obtained using MLTWA approach are thus in disagree-ment with the results obtained through the Wennerbergmethod. Correctly addressing the source of the observeddiscrepancy is not a simple task; however, theWennerberg method has been applied using Qβ and Qc
values that were separately and independently obtained.In particular, Qβ is that obtained by GP07 for a datasetcharacterized by sources embedded in the first5 km of the crust, while Qc is that calculated forthe new dataset with sources deeper than those ofGP07. Consequently, the adopted values of Qβ andQc are not strictly characteristic of the same earthvolume, and this may result in a bias for theresults obtained following the Wennerberg ap-proach. A second important bias in the estimatesdone with the Wennerberg method may come frompossible site effects affecting the estimate of Qβ.Conversely, the MLTWA method uses a homoge-neous dataset providing self-consistent estimates. Weare therefore confident that the MLTWA estimates of
Qi, Qs, and hence QT are less biased than those from theWennerberg method.
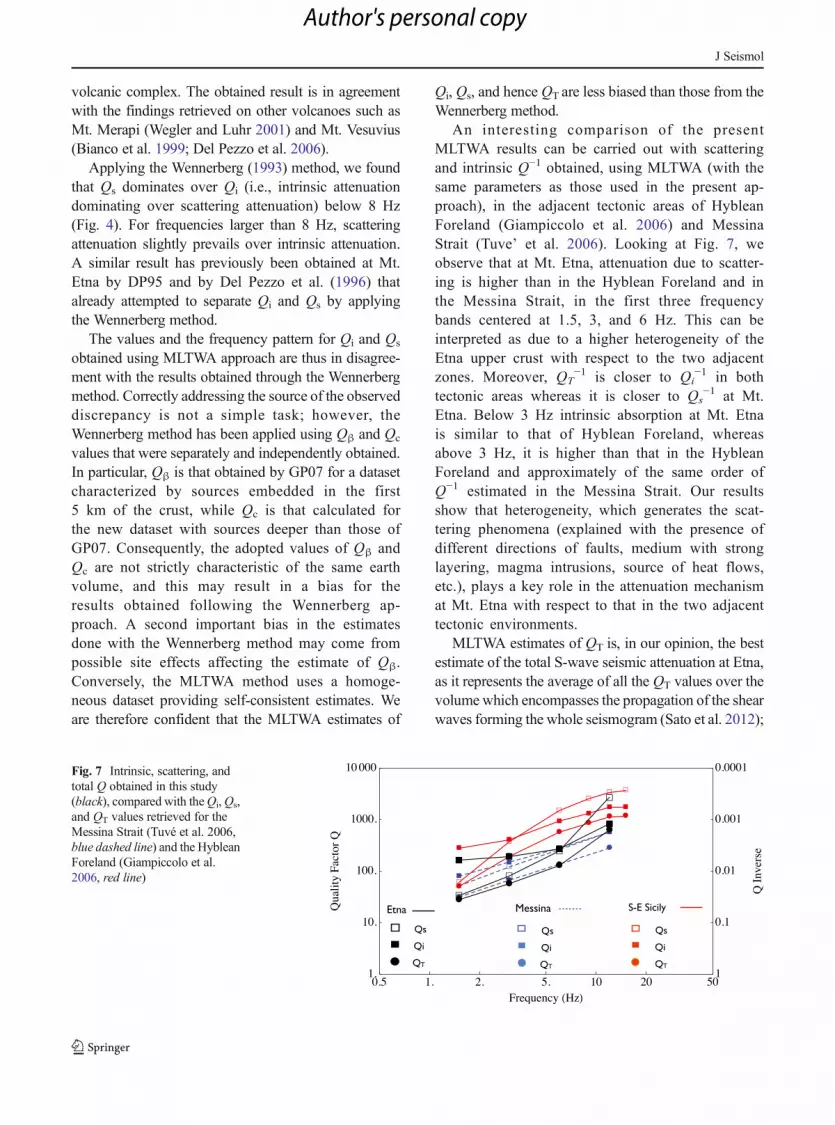
An interesting comparison of the presentMLTWA results can be carried out with scatteringand intrinsic Q−1 obtained, using MLTWA (with thesame parameters as those used in the present ap-proach), in the adjacent tectonic areas of HybleanForeland (Giampiccolo et al. 2006) and MessinaStrait (Tuve’ et al. 2006). Looking at Fig. 7, weobserve that at Mt. Etna, attenuation due to scatter-ing is higher than in the Hyblean Foreland and inthe Messina Strait, in the first three frequencybands centered at 1.5, 3, and 6 Hz. This can beinterpreted as due to a higher heterogeneity of theEtna upper crust with respect to the two adjacentzones. Moreover, QT
−1 is closer to Qi−1 in both
tectonic areas whereas it is closer to Qs−1 at Mt.
Etna. Below 3 Hz intrinsic absorption at Mt. Etnais similar to that of Hyblean Foreland, whereasabove 3 Hz, it is higher than that in the HybleanForeland and approximately of the same order ofQ−1 estimated in the Messina Strait. Our resultsshow that heterogeneity, which generates the scat-tering phenomena (explained with the presence ofdifferent directions of faults, medium with stronglayering, magma intrusions, source of heat flows,etc.), plays a key role in the attenuation mechanismat Mt. Etna with respect to that in the two adjacenttectonic environments.
MLTWA estimates of QT is, in our opinion, the bestestimate of the total S-wave seismic attenuation at Etna,as it represents the average of all the QT values over thevolume which encompasses the propagation of the shearwaves forming the whole seismogram (Sato et al. 2012);
Fig. 7 Intrinsic, scattering, andtotal Q obtained in this study(black), compared with theQi,Qs,and QT values retrieved for theMessina Strait (Tuvé et al. 2006,blue dashed line) and the HybleanForeland (Giampiccolo et al.2006, red line)
J Seismol
Author's personal copy
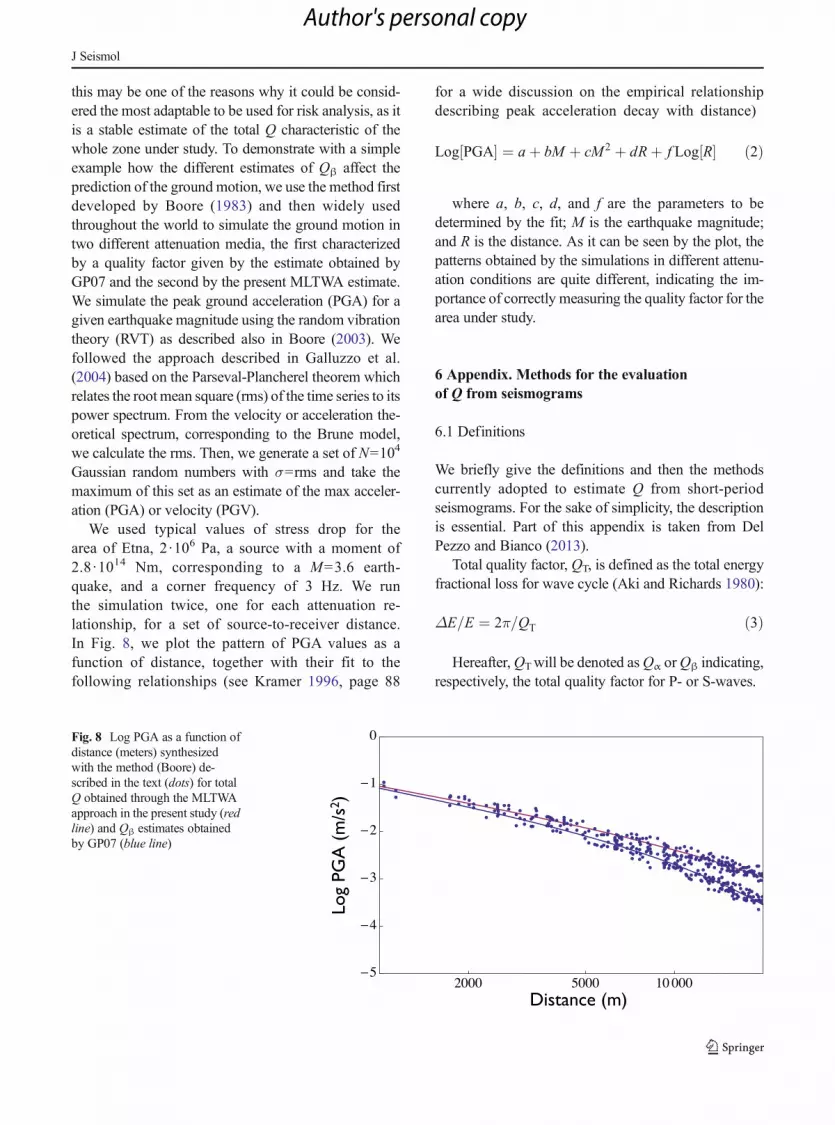
this may be one of the reasons why it could be consid-ered the most adaptable to be used for risk analysis, as itis a stable estimate of the total Q characteristic of thewhole zone under study. To demonstrate with a simpleexample how the different estimates of Qβ affect theprediction of the ground motion, we use the method firstdeveloped by Boore (1983) and then widely usedthroughout the world to simulate the ground motion intwo different attenuation media, the first characterizedby a quality factor given by the estimate obtained byGP07 and the second by the present MLTWA estimate.We simulate the peak ground acceleration (PGA) for agiven earthquake magnitude using the random vibrationtheory (RVT) as described also in Boore (2003). Wefollowed the approach described in Galluzzo et al.(2004) based on the Parseval-Plancherel theorem whichrelates the root mean square (rms) of the time series to itspower spectrum. From the velocity or acceleration the-oretical spectrum, corresponding to the Brune model,we calculate the rms. Then, we generate a set of N=104
Gaussian random numbers with σ=rms and take themaximum of this set as an estimate of the max acceler-ation (PGA) or velocity (PGV).
We used typical values of stress drop for thearea of Etna, 2·106 Pa, a source with a moment of2.8 ·1014 Nm, corresponding to a M=3.6 earth-quake, and a corner frequency of 3 Hz. We runthe simulation twice, one for each attenuation re-lationship, for a set of source-to-receiver distance.In Fig. 8, we plot the pattern of PGA values as afunction of distance, together with their fit to thefollowing relationships (see Kramer 1996, page 88
for a wide discussion on the empirical relationshipdescribing peak acceleration decay with distance)
Log PGA½ � ¼ aþ bM þ cM 2 þ dRþ f Log R½ � ð2Þ
where a, b, c, d, and f are the parameters to bedetermined by the fit; M is the earthquake magnitude;and R is the distance. As it can be seen by the plot, thepatterns obtained by the simulations in different attenu-ation conditions are quite different, indicating the im-portance of correctly measuring the quality factor for thearea under study.
6 Appendix. Methods for the evaluationof Q from seismograms
6.1 Definitions
We briefly give the definitions and then the methodscurrently adopted to estimate Q from short-periodseismograms. For the sake of simplicity, the descriptionis essential. Part of this appendix is taken from DelPezzo and Bianco (2013).
Total quality factor, QT, is defined as the total energyfractional loss for wave cycle (Aki and Richards 1980):
ΔE=E ¼ 2π=QT ð3Þ
Hereafter,QTwill be denoted asQα orQβ indicating,respectively, the total quality factor for P- or S-waves.
Fig. 8 Log PGA as a function ofdistance (meters) synthesizedwith the method (Boore) de-scribed in the text (dots) for totalQ obtained through the MLTWAapproach in the present study (redline) and Qβ estimates obtainedby GP07 (blue line)
J Seismol
Author's personal copy
The energy losses are due to many factors, mainlyscattering and intrinsic dissipation, both (in differentcombinations) contributing to the decrease of the energyas a function of distance. To account for these twofactors, Eq. 3 can be explicitly written as
ΔE=E ¼ 2π1
Qiþ 1
Qs
� �ð4Þ
where Qi is the intrinsic and Qs is the scatteringquality factor. To correctly take into account all theenergy losses associated with the direct phases, Qα orQβ needs to be calculated.
The time envelope of the S-coda filtered at a givenfrequency band centered in f is characterized by thefollowing exponential decaying shape:
A t∣ fð Þ∝ 1
tnexp −π f tQc
−1 f½ ���
whereQc is the coda quality factor, f is the frequency,t is the lapse time (from the origin time), and n is equal to(i) 0.5 (in case of predominance of surface waves), (ii)0.75 (in case of predominance of diffusive waves), or(iii) 1 (in case of predominance of body waves).
6.2 Methods
In the present paper, we review results obtained with the“spectral ratio” method (PA94 and GP07), theWennerberg method (Wennerberg 1993), and pulsebroadening or “rise time” (Gladwin and Stacey 1974;Kjartansson 1979). A more complete survey of methodsand techniques is reported in the Appendix of Del Pezzoand Bianco (2013).
6.3 Spectral ratio
Taking the ratio between the amplitude spectrum at ithstation and the amplitude spectrum at a rth (reference)station, after correcting for instrument and site and calcu-lating the logarithms, it results, for the jth earthquake, that
Ln Rir½ � j ¼ Lnrr jri j
−π f ti j−tr j� �
=Q f½ � ð5Þ
where Rir represents the spectral ratio between re-ceivers r and i, tij is the travel time measured at stationi for event j, and trj is the travel timemeasure at referencestation r for event j. Measuring the spectral ratios at anumber of stations and averaging in successive
frequency bands centered at f, one can invert for thetotal attenuation Q−1 for each frequency band.
6.4 Wennerberg method
Wennerberg (1993) compared the time pattern of codaamplitude, AZ, predicted by the multiple scatteringmodel(Zeng 1991) with that of the coda amplitude, AAC,predicted by the single scattering model of Aki andChouet (1975). This author found that the ratio betweenthe coda amplitude decay curves, AAC/AZ, plotted as afunction of τ can be best fit to a straight line in a widerange of τ values. Here, τ indicates the mean free time(τ=ωt/Qs, where t is the lapse time measured from theorigin of the earthquake). Wennerberg (1993) thusestablished a mathematical relationship between AAC/AZ and τ, valid in a wide interval of mean free times,from which he derived the following formula linking theobserved value ofQc associated with the single scatteringmodel, to the intrinsic and scattering Q, Qi and Qs, de-scribing the coda pattern in the multiple scattering model:
1
Qc¼ 1
Qiþ 1−2δ τ½ �
Qsð6Þ
where 1−2δ(τ)=−1/(4.44+0.738τ) and ω is the an-gular frequency. As 1/Qβ=1/Qi+1/Qs, as already writ-ten in Eq. 4, from Eq. 6, it can be easily derived that
1
Qs¼ 1
2δ τ½ �1
Qβ−
1
Qc τ½ �
!ð7Þ
1
Qi¼ 1
2δ τ½ �1
Qc τ½ � þ2δ τ½ �−1Qβ
!ð8Þ
In order to obtain separate estimates of Qi and Qs,independent estimates ofQc andQβ, both measured as afunction of frequency, f, are necessary. It is noteworthythat in this method, the correct estimate of Qc and Qβ iscritical: Both parameters should be estimated for thesame earth volumes (Wennerberg 1993).
6.5 Multiple lapse time windows analysis
The multiple scattering process may be formally de-scribed through the radiative transfer or transport equa-tion (hereafter TE) that is an integral equation whoseanalytical solution in three dimensions is not already
J Seismol
Author's personal copy
known (Sato et al. 2012). An approximate analyt-ical solution in 3-D was found by Paasschens(1997) in case of uniform half space with constant
velocity. It describes the pattern of the seismogramenergy envelope, Eij [r, t], as a function of lapse time,t, and distance, r, as
Eij r; t½ � ≈ W 0exp −Le−1vt½ �4πr2v
δ t−r
v
h iþ
W 0H t−rijv
h i⋅
1−r2ijv2t2
� �1=84πvt
3B0Le−1
� �3=2 exp −Le−1vt�
F vtB0Le−1 1−
r2ijv2t2
!3=424
35
ð9Þ
where F x½ � ¼ exffiffiffiffiffiffiffiffiffiffiffiffiffiffiffiffiffiffiffiffiffiffiffiffi1þ 2:026=x
p;W0 is the energy at
source, v is the wave speed in the half space, H is theHeaviside function, δ is the Dirac delta. ηin and B0 andLe
−1 represent, respectively, the seismic albedo and theextinction length inverse, expressed in terms of Q by
B0 ¼ Qr=Qs ð10Þand
Le−1 ¼ 2πfv
1
QSþ 1
Qi
� �ð11Þ
The MLTWA method consists in the followingoperations:
1. Selection of three consecutive time windows in theseismogram. The three windows span, respectively,the intervals [tS, tS+Δt], [tS, tS+2Δt], and [tS, tS+3Δt], where tS is the onset time of the S-waves.
2. Selection of the coda normalization time interval:[tc, tc+Δt] where tc is the coda reference time (thestart time with respect to origin time). In the presentanalysis, Δt=12 s is chosen, also for point 1.
3. Evaluation of the seismogram energy envelope in-tegrals in the four above-mentioned time windows,as a function of frequency and source-station dis-tance. Differently from the common use (see DelPezzo and Bianco, 2010a, as an example), we esti-mate such integrals Fourier transforming the seis-mogram portion contained in each time intervals,taking the module and squaring the result, thusobtaining an energy spectrum. Finally, we take theenergy spectrum averaged over the two horizontalcomponents and over frequency in the followingfrequency bands: 1–2, 2–4, 4–8, and 8–16 Hz,hence obtaining I1, I2, and I3, i.e., the energy
integrals in the three successive windows (seepoints 3 and 1).
4. Normalization of the energy spectra in the first threetime windows by the fourth (coda) window. This iscommonly named “coda normalization.”
5. The logarithm of the three normalized energy inte-grals, corrected for geometrical spreading factor(4πr2), is plotted as a function of source-receiverdistance and fit to the corresponding theoreticalvalues for each of the frequency bands describedin point 2 above. The theoretical values are calcu-lated integrating Eij [r, t] defined in Eq. 9 in thesame time windows defined in point 1, normalizingfor the integral of Eij [r, t] in the coda window,multiplying for 4πr2, and taking logarithms. In DelPezzo and Bianco (2010a, b) and references therein,a complete discussion of this method is reported,together with the corresponding Mathematica-7code. The unique difference with the present paperis point 2.
The best fit values are obtained minimizing the misfitfunction
M B0;Le1
� � ¼Xi¼1
Ndati�I1 ri B0;Le
�� 1� �
−T1
�I1 ri B0Le−1
����� �2
þ�I2�r1jB0;Le
−1�−T 2 rijB0;Le
−1� ��
2
þ I3 ri B0;Le−1�−T 3
�r
���iB0;Le
−1� �
−T3 ri B0j Le−1� �� �2
ð12Þ
where I1, I2, and I3 are the quantities calculated asdescribed in point 2 and T1, T2, and T3 are the corre-sponding theoretical values (point 4). In the presentpaper, the couple of B0 and Le
−1 corresponding to the
J Seismol
Author's personal copy
minimum of the misfit function is estimated usingMathematica-9 routine “FindMinimum” which utilizesthe conjugate gradient method. Errors on B0 and Le
−1 areestimated grid searching the B0 and Le
−1 intervals forwhich the values of the misfit function are statisticallyequal at a given confidence (see Del Pezzo and Bianco2010a, b for details).
Acknowledgments This work has been partially supported bythe following projects: V2-Precursori di Eruzioni in VulcaniQuiescenti: Campi Flegrei e Vulcano-Convenzione INGV-DPC(2012–2013); EPHESTOS CGL2011-2949-C02-01 (Universityof Granada, Instituto Andaluz de Geofisica); MEDiterraneanSUper-site Volcanoes (MED-SUV) FP7 ENV.2012.6.4-2 grantagreement no. 308665 (European Community); and UrbanDisaster Prevention Strategies Using MAcroseimic Fields andFault Sources (UPStrat-MAFA), http://upstratmafa.ov.ingv.it/UPStrat/ (European Community). Jens Havskov is gratefullyacknowledged for his helpful revision.
References
Aki K, Chouet B (1975) Origin of codawaves: source, attenuation,and scattering effects. J Geophys Res 80(23):3322–3342
Aki K, Richards P (1980) Quantitative seismology—theory andmethods. W. H. Freeman and Company, San Francisco
Azzaro R, Barbano S, D’Amico S, Tuv T (2006) The attenuationof seismic intensity in the Etna region and comparison withother Italian volcanic districts. Ann Geophys 49(4/5):1003–1020
Bianco F., Castellano M., Del Pezzo E., Ibanez J.M. (1999).Attenuation of short period seismic waves at Mt. Vesuvius,Italy. Geophys Jour Int 138 (1): 67–76
Boore D (1983) Stochastic simulation of high frequency groundmotions based on seismological models of the radiated spec-tra. Bull Seismol Soc Am 73(6):1865–1894
Boore D (2003) Simulation of the ground motion using the sto-chastic method. Pure Appl Geophys 160:635–676
Convertito V, Zollo A (2011) Assessment of pre-crisis andsyn-crisis seismic hazard at Campi Flegrei and Mt.Vesuvius volcanoes, Campania, southern Italy. BullVolcanol 73:767–783
de Lorenzo S. Filippucci M., Giampiccolo E., Patané D.(2006). Intrinsic Qp at Mt. Etna from the inversion ofrise times of 2002 microearthquake sequence. AnnGeophys 49 (6):1215–1234
Del Pezzo E, Bianco F (2010a) MathLTWA: multiple lapse timewindow analysis using Wolfram Mathematica 7. ComputGeosci 36:1388–1392
Del Pezzo E., Bianco F. (2010b). Two-layer earth model correctionsto the MLTWA estimates of intrinsic- and scattering-attenuation obtained in a uniform half-space. Geophys J Int182(2):949–955
Del Pezzo E., Bianco F. (2013) A reappraisal of seismic Q eval-uated in Campi Flegrei caldera. Receipt for the application to
risk analysis. J Seismol 17:829–837 DOI 10.1007/s10950-012-9349-9
Del Pezzo E, Ibanez J, Morales J, Akinci A, Maresca R (1995)Measurements of intrinsic and scattering seismic attenuationin the crust. Bull Seismol Soc Am 85:1373–1380
Del Pezzo E, Simini M, Ibanez J (1996) Separation ofintrinsic and scattering Q for volcanic areas: a compar-ison between Etna and Campi Flegrei. J Volcanol GeothermRes 70:213–219
Del Pezzo E, Bianco F, Zaccarelli L (2006) Separation of Qi andQs from passive data at Mt Vesuvius: a reappraisal of theseismic attenuation estimates. Phys Earth Planet Inter 159:202–212
Galluzzo D, Del Pezzo E, La Rocca M, Petrosino S (2004) Peakground acceleration produced by local earthquakes in volca-nic areas of Campi Flegrei and Mt Vesuvius. VesuviusAnnals of Geophysics 47:1377–1389
Giampiccolo E, Tuve’ T, Gresta S, Patané D (2006) S-wavesattenuation and separation of scattering and intrinsic absorp-tion of seismic energy in southeastern Sicily (Italy). GeophysJ Int 165:211–222
Giampiccolo E, D’Amico S, Patané D, Gresta S (2007)Attenuation and source parameters of shallow microearth-quakes at Mt. Etna volcano, Italy. Bull Seismol Soc Am97(1B):184–197. doi:10.1785/0120050252
Gladwin MT, Stacey FD (1974) Anelastic degradation of acousticpulses in rock. Phys Earth Planet Inter 8:332–336
Gruppo analisi dati sismici (2014). Catalogo dei terremoti dellaSicilia Orientale e CalabriaMeridionale, (1999–2013) INGV,Catania, http://www.ct.ingv.it/ufs/analisti/catalogolist.phpAccessed 15 Aug 2014
Hirn, A., A. Nercessian, M. Sapin, F. Ferrucci, and G. Wittlinger(1991). Seismic heterogeneity of Mt. Etna: structure andactivity. Geophys J Int 105:139–153
Hoshiba M, Sato H, Fehler M (1991) Numerical basis of theseparation of scattering and intrinsic absorption from fullseismogram envelope: a Monte-Carlo simulation of multipleisotropic scattering. Pap Meteorol Geophys 42(2):65–91
Kjartansson E (1979) Constant Q wave propagation and attenua-tion. J Geophys Res 84:4737–4748
Kramer, S. (1996). Geotechnical earthquake engineering. PrenticeHall
Lahr, J. C. (1999). Hypoellipse: a computer program for determin-ing local earthquake hypocentral parameters, magnitude, andfirst motion pattern (Y2K compliant), US Geol Surv OpenFile Rep., 99–23
Mayeda K, Koyanagi S, Hoshiba M, Aki K, Zeng YH(1992) A comparative-study of scattering, intrinsic,and coda Q(−1) for Hawaii, Long Valley, and centralCalifornia between 1.5-Hz and 15.0-Hz. J Geophys Res SolidEarth 97:6643–6659
Norini G, Acocella V (2011) Analogue modeling of flankinstability at Mount Etna: understanding the drivingfactors. J Geophys Res 116, B07206. doi:10.1029/2011JB008216
Paasschens JCL (1997) Solution of the time-dependent Boltzmannequation. Phys Rev 56(1):1135–1141
Patané G, Ferrucci F, Gresta S (1994) Spectral features of micro-earthquakes in volcanic areas: attenuation in the crust andamplitude response of the site at Mt. Etna, Italy. Etna BullSeismol Soc Am 84(6):1842–1860
Sato H, Fehler MC (1998) Seismic wave propagation and scatteringin the heterogeneous earth. Springer and Verlag, New York
Sato H, Fehler MC, Maeda T (2012) Seismic wave propagationand scattering in the heterogeneous earth, 2nd edn. Springerand Verlag, New York
Tuvé T, Bianco F, Ibanez J, Patané D, Del Pezzo E, Bottari A(2006) Attenuation study in the straits of Messina area(southern Italy). Tectonophysics 421:173–185
Wegler U, Luhr BG (2001) Scattering behaviour at Merapi volca-no (Java) revealed from an active seismic experiment.Geophys J Int 145:579–592
Wennerberg, L. (1993). Multiple-scattering interpretation of coda-q measurements. Bulletin of the Seismological Society ofAmerica 83, 279–290. Zeng, Y (1991) Compact solutionfor multiple scattered wave energy in time domain. BullSeismol Soc Am 81:1022–1029