This article was originally published in a journal published by Elsevier, and the attached copy is provided by Elsevier for the author’s benefit and for the benefit of the author’s institution, for non-commercial research and educational use including without limitation use in instruction at your institution, sending it to specific colleagues that you know, and providing a copy to your institution’s administrator. All other uses, reproduction and distribution, including without limitation commercial reprints, selling or licensing copies or access, or posting on open internet sites, your personal or institution’s website or repository, are prohibited. For exceptions, permission may be sought for such use through Elsevier’s permissions site at: http://www.elsevier.com/locate/permissionusematerial
Transcript
This article was originally published in a journal published byElsevier, and the attached copy is provided by Elsevier for the
author’s benefit and for the benefit of the author’s institution, fornon-commercial research and educational use including without
limitation use in instruction at your institution, sending it to specificcolleagues that you know, and providing a copy to your institution’s
administrator.
All other uses, reproduction and distribution, including withoutlimitation commercial reprints, selling or licensing copies or access,
or posting on open internet sites, your personal or institution’swebsite or repository, are prohibited. For exceptions, permission
may be sought for such use through Elsevier’s permissions site at:
Physics of the Earth and Planetary Interiors 159 (2006) 202–212
Separation of Qi and Qs from passive data at Mt. Vesuvius:A reappraisal of the seismic attenuation estimates
Edoardo Del Pezzo ∗, Francesca Bianco, Lucia ZaccarelliIstituto Nazionale di Geofisica e Vulcanologia, Osservatorio Vesuviano, Via Diocleziano 328, 80124 Napoli, Italy
Received 25 January 2006; received in revised form 8 June 2006; accepted 5 July 2006
Abstract
Seismic attenuation in the area of Mt. Vesuvius is reappraised by studying more than 400 S-coda envelopes of small local VTearthquakes recorded at Mt. Vesuvius from 1996 to 2002 at the three-component stations of OVO and BKE. The purpose is toobtain a stable separate estimate of intrinsic and scattering quality factors for shear waves. We investigate in the present paper fourfrequency bands, centered respectively at fc = 3, 6, 12 and 18 Hz with a bandwidth of 0.6fc. Stacked coda envelopes are fit to themultiple scattering model according to the Zeng approximation in the hypothesis of constant velocity half space. Results show thatthe diffusion regime is a good approximation as the scattering attenuation (proportional to Q−1
S , the inverse scattering-quality factor)is much stronger than the intrinsic dissipation (proportional to Q−1
I ). Q−1S decreases with frequency while intrinsic attenuation is
For a synthetic reconstruction of the whole seismo-gram in a realistic earth (Sato and Fehler, 1998) a detailedknowledge of both the three-dimensional velocity model
and of the dissipative structure of the earth mediumis in principle necessary. The problem may be com-pletely addressed by solving the wave equation usingfinite differences or finite elements method. With therapid computational power actually achievable, this is inprinciple possible even though it is a so long and expen-sive task that makes this approach often unpractical. Thesynthesis of the full seismogram energy envelope is onthe other hand much more easy to calculate. The seis-
E. Del Pezzo et al. / Physics of the Earth and Planetary Interiors 159 (2006) 202–212 203
mogram envelope is well described by transport theory,also known as radiative transfer theory, well known sincemany years in many fields of physics like acoustics oroptics. This theory, firstly developed on a phenomeno-logical basis, has been demonstrated to be an exactasymptotic approximation of the classical wave equa-tion (Ryzhik et al., 1996). Wu (1985) used the transporttheory to explain the formation of seismic coda energyenvelopes of local earthquakes. Fitting this model withexperimental data, this author obtained a separate esti-mate of intrinsic and scattering attenuation coefficient.A good approximation of the analytical solution of theradiative transfer model was later obtained by Hoshibaet al. (1991) with a Monte Carlo approach. Hoshiba et al.(1991) applied the so called multiple lapse time analysis(MLTWA) to the experimental data assuming a constantvelocity half space and a uniform distribution of scat-terers. These authors were able to invert for separateQ−1
I and Q−1S (intrinsic and scattering inverse-quality
factors) in areas with different tectonic properties. Fornon-uniform earth media (i.e. positive velocity gradientsand/or non-uniform distribution of scatterers) Hoshibaet al. (1991), Margerin et al. (1998) and Bianco et al.(2002), using Monte Carlo simulations, discussed thelimits of the uniform medium assumption in the applica-tion of MLTWA method and obtained separate estimatesof intrinsic and scattering attenuation coefficients, in theassumption of depth dependent velocity and scattering,in seismic areas with different tectonics. These resultsalso demonstrate that the earth heterogeneity plays a dra-matic role in the formation of seismogram coda in thehigh frequency range (1–20 Hz). Typical values of themean free paths (l = Q/k, where k is the wave number)are of the order of 100 km, but can be three orders of mag-nitude smaller (100 m) in the shallow crust of volcanicareas (Wegler, 2004). Q−1
I results to be very low in sta-ble tectonic zones. In tectonically active zones the totalattenuation is instead significantly controlled by the scat-tering processes, that become predominant for stronglyheterogeneous structures, like volcanoes (Wegler, 2004).
In the present work we perform a detailed study of theseismic propagation in the zone of Mt. Vesuvius, one ofthe potentially most dangerous volcanoes in the world,actually in a dormant state. We base our study on theresults of an earlier work [Bianco et al. (1999)—hereafterreferred as B99], in which the site-corrected total attenu-ation was estimated from the analysis of direct S-waves.Throughout the present paper we will denote the intrinsicand scattering inverse quality factors, respectively withQ−1
I and Q−1S , inverse Q-coda will be indicated by Q−1
Cand total Q-inverse will be denoted as Q−1
T . B99 esti-mated Q−1
C as a function of frequency and lapse time for
a suite of stations with high dynamic range and signal-to-noise ratio, making a first attempt to separate intrinsicfrom scattering Q by using the simplified method devel-oped by Wennerberg (1993), who assumes that Q−1
C is agood estimate of Q−1
I and deduces Q−1S by the formula:
Q−1I + Q−1
S = Q−1T .
The precise estimate of Q−1I and Q−1
S is needed atMt. Vesuvius. This for both improving the knowledgeof the earth medium properties in volcanoes, and for thepractical purpose of answering to the recent request ofThe Civil protection of Italy to evaluate the maximumacceleration expected in the area for a local seismic input.In the present paper we invert for Q−1
I and Q−1S using
transport theory and check our results in the single scat-tering and in the diffusion limits for a uniform medium,finding that seismic coda energy envelope at Mt. Vesu-vius can be well interpreted as generated by a diffusionprocess. Finally, we fit the average coda envelopes with anon-uniform analytical diffusion model where a scatter-ing layer overlies a transparent half space. Results showthat scattering is the predominant mechanism of energydissipation at Mt. Vesuvius, confirming the preliminaryconclusions of B99.
2. Data and seismological background
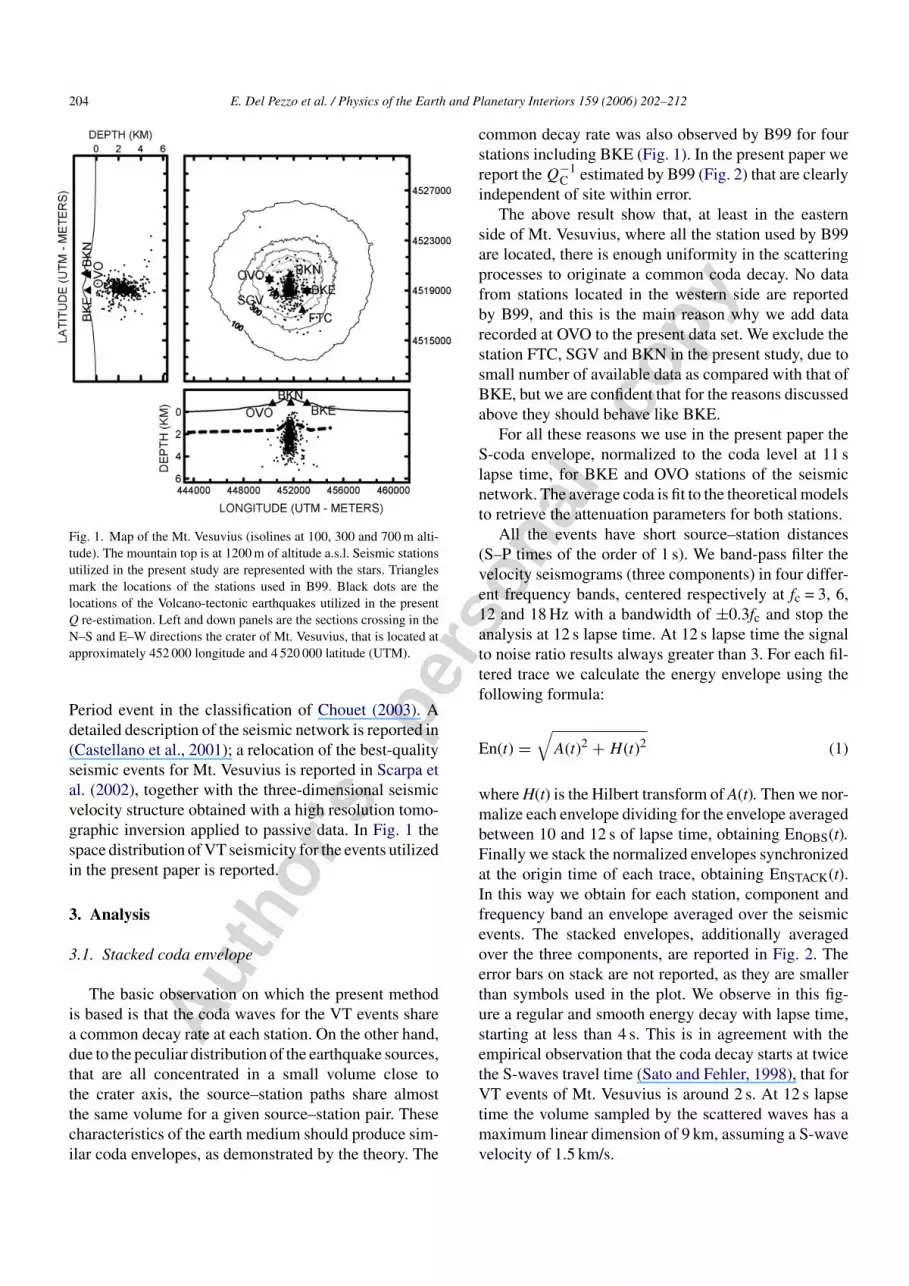
We use in the present paper the data set alreadydescribed in B99, improved with a new set of data rela-tive to OVO station. The data were recorded by the 1 Hz,three-component stations of BKE and OVO in the timeinterval between 1996 and 2000 (Fig. 1). These stationshave the longest catalog of well recorded events. OVOis an analog station (60 dB dynamic range) in opera-tion since 1970 whereas BKE is a gain ranging, 120-dBdynamic range, digital station. We relocated the sourcesusing the P and S phase time picking measured at thestations of the seismic network operating in Vesuviusarea (Castellano et al., 2001) using a grid-search method[NonLinLoc method, discussed in Lomax et al. (2000)]based on the seismic velocity model obtained by pas-sive tomography (Scarpa et al., 2002). Seismicity of Mt.Vesuvius show a hypocentral location concentrated ina small volume beneath the crater, between 0—the sealevel, and 4 km of depth, with a lateral extent of 2–3 km.All the earthquakes analyzed in the present study areVT events with a magnitude ranging from about 1 to 3.The maximum magnitude ever recorded since the endof the last eruption (1944) is 3.6 (9 October 1999), anduntil now only one non-VT event [with an equivalentmagnitude 2] has been discriminated in the backgroundseismicity (Bianco et al., 2005) and interpreted as a Long
204 E. Del Pezzo et al. / Physics of the Earth and Planetary Interiors 159 (2006) 202–212
Fig. 1. Map of the Mt. Vesuvius (isolines at 100, 300 and 700 m alti-tude). The mountain top is at 1200 m of altitude a.s.l. Seismic stationsutilized in the present study are represented with the stars. Trianglesmark the locations of the stations used in B99. Black dots are thelocations of the Volcano-tectonic earthquakes utilized in the presentQ re-estimation. Left and down panels are the sections crossing in theN–S and E–W directions the crater of Mt. Vesuvius, that is located atapproximately 452 000 longitude and 4 520 000 latitude (UTM).
Period event in the classification of Chouet (2003). Adetailed description of the seismic network is reported in(Castellano et al., 2001); a relocation of the best-qualityseismic events for Mt. Vesuvius is reported in Scarpa etal. (2002), together with the three-dimensional seismicvelocity structure obtained with a high resolution tomo-graphic inversion applied to passive data. In Fig. 1 thespace distribution of VT seismicity for the events utilizedin the present paper is reported.
3. Analysis
3.1. Stacked coda envelope
The basic observation on which the present methodis based is that the coda waves for the VT events sharea common decay rate at each station. On the other hand,due to the peculiar distribution of the earthquake sources,that are all concentrated in a small volume close tothe crater axis, the source–station paths share almostthe same volume for a given source–station pair. Thesecharacteristics of the earth medium should produce sim-ilar coda envelopes, as demonstrated by the theory. The
common decay rate was also observed by B99 for fourstations including BKE (Fig. 1). In the present paper wereport the Q−1
C estimated by B99 (Fig. 2) that are clearlyindependent of site within error.
The above result show that, at least in the easternside of Mt. Vesuvius, where all the station used by B99are located, there is enough uniformity in the scatteringprocesses to originate a common coda decay. No datafrom stations located in the western side are reportedby B99, and this is the main reason why we add datarecorded at OVO to the present data set. We exclude thestation FTC, SGV and BKN in the present study, due tosmall number of available data as compared with that ofBKE, but we are confident that for the reasons discussedabove they should behave like BKE.
For all these reasons we use in the present paper theS-coda envelope, normalized to the coda level at 11 slapse time, for BKE and OVO stations of the seismicnetwork. The average coda is fit to the theoretical modelsto retrieve the attenuation parameters for both stations.
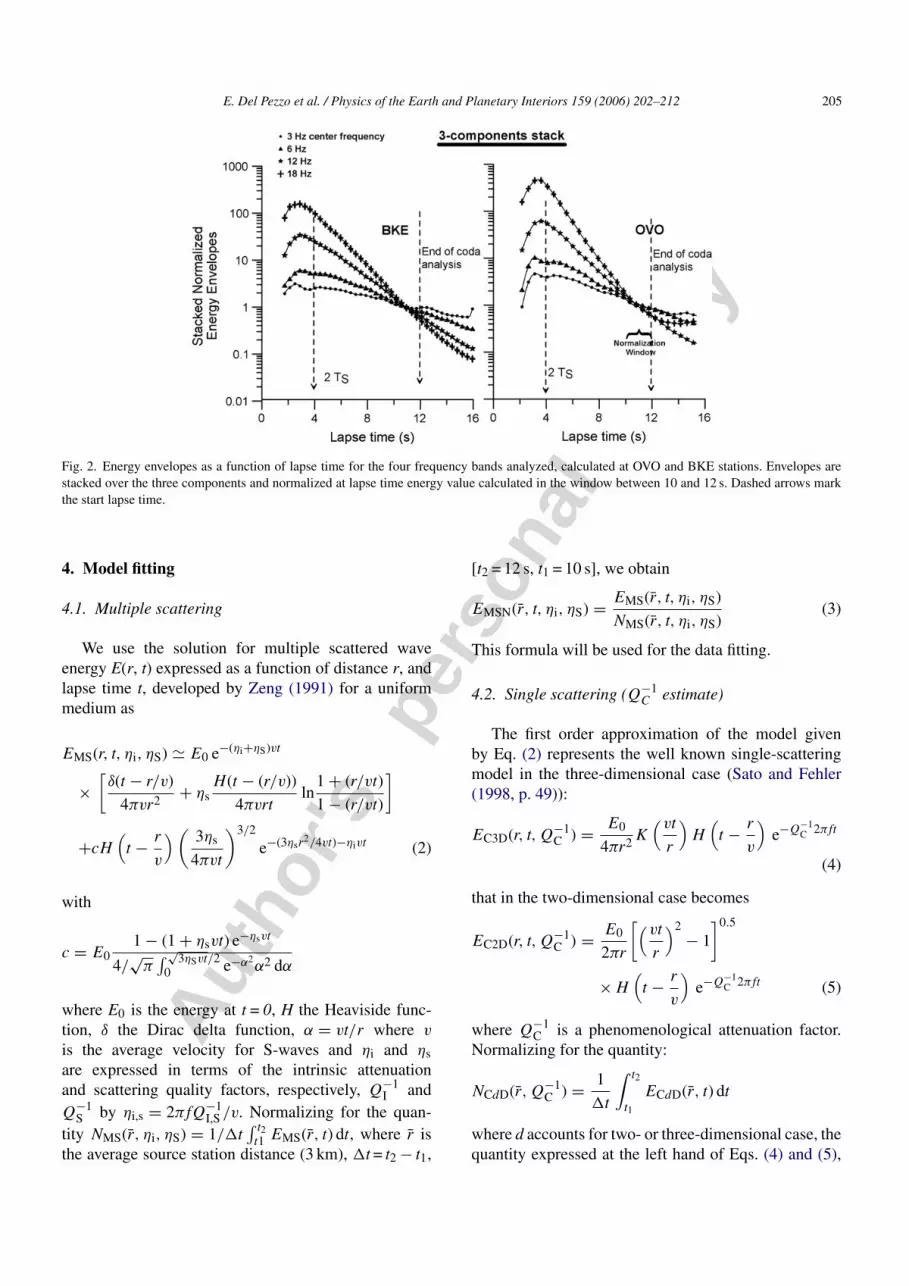
All the events have short source–station distances(S–P times of the order of 1 s). We band-pass filter thevelocity seismograms (three components) in four differ-ent frequency bands, centered respectively at fc = 3, 6,12 and 18 Hz with a bandwidth of ±0.3fc and stop theanalysis at 12 s lapse time. At 12 s lapse time the signalto noise ratio results always greater than 3. For each fil-tered trace we calculate the energy envelope using thefollowing formula:
En(t) =√
A(t)2 + H(t)2 (1)
where H(t) is the Hilbert transform of A(t). Then we nor-malize each envelope dividing for the envelope averagedbetween 10 and 12 s of lapse time, obtaining EnOBS(t).Finally we stack the normalized envelopes synchronizedat the origin time of each trace, obtaining EnSTACK(t).In this way we obtain for each station, component andfrequency band an envelope averaged over the seismicevents. The stacked envelopes, additionally averagedover the three components, are reported in Fig. 2. Theerror bars on stack are not reported, as they are smallerthan symbols used in the plot. We observe in this fig-ure a regular and smooth energy decay with lapse time,starting at less than 4 s. This is in agreement with theempirical observation that the coda decay starts at twicethe S-waves travel time (Sato and Fehler, 1998), that forVT events of Mt. Vesuvius is around 2 s. At 12 s lapsetime the volume sampled by the scattered waves has amaximum linear dimension of 9 km, assuming a S-wavevelocity of 1.5 km/s.
E. Del Pezzo et al. / Physics of the Earth and Planetary Interiors 159 (2006) 202–212 205
Fig. 2. Energy envelopes as a function of lapse time for the four frequency bands analyzed, calculated at OVO and BKE stations. Envelopes arestacked over the three components and normalized at lapse time energy value calculated in the window between 10 and 12 s. Dashed arrows markthe start lapse time.
4. Model fitting
4.1. Multiple scattering
We use the solution for multiple scattered waveenergy E(r, t) expressed as a function of distance r, andlapse time t, developed by Zeng (1991) for a uniformmedium as
EMS(r, t, ηi, ηS) � E0 e−(ηi+ηS)vt
×[δ(t − r/v)
4πvr2 + ηsH(t − (r/v))
4πvrtln
1 + (r/vt)
1 − (r/vt)
]
+cH(t − r
v
)( 3ηs
4πvt
)3/2
e−(3ηsr2/4vt)−ηivt (2)
with
c = E01 − (1 + ηsvt) e−ηsvt
4/√
π∫ √
3ηSvt/20 e−α2
α2 dα
where E0 is the energy at t = 0, H the Heaviside func-tion, δ the Dirac delta function, α = vt/r where v
is the average velocity for S-waves and ηi and ηsare expressed in terms of the intrinsic attenuationand scattering quality factors, respectively, Q−1
I andQ−1
S by ηi,s = 2πfQ−1I,S /v. Normalizing for the quan-
tity NMS(r̄, ηi, ηS) = 1/�t∫ t2t1 EMS(r̄, t) dt, where r̄ is
the average source station distance (3 km), �t = t2 − t1,
[t2 = 12 s, t1 = 10 s], we obtain
EMSN(r̄, t, ηi, ηS) = EMS(r̄, t, ηi, ηS)
NMS(r̄, t, ηi, ηS)(3)
This formula will be used for the data fitting.
4.2. Single scattering (Q−1C estimate)
The first order approximation of the model givenby Eq. (2) represents the well known single-scatteringmodel in the three-dimensional case (Sato and Fehler(1998, p. 49)):
EC3D(r, t, Q−1C ) = E0
4πr2 K(vt
r
)H(t − r
v
)e−Q−1
C 2πft
(4)
that in the two-dimensional case becomes
EC2D(r, t, Q−1C ) = E0
2πr
[(vt
r
)2− 1
]0.5
× H(t − r
v
)e−Q−1
C 2πft (5)
where Q−1C is a phenomenological attenuation factor.
Normalizing for the quantity:
NCdD(r̄, Q−1C ) = 1
�t
∫ t2
t1
ECdD(r̄, t) dt
where d accounts for two- or three-dimensional case, thequantity expressed at the left hand of Eqs. (4) and (5),
Autho
r's
pers
onal
co
py
206 E. Del Pezzo et al. / Physics of the Earth and Planetary Interiors 159 (2006) 202–212
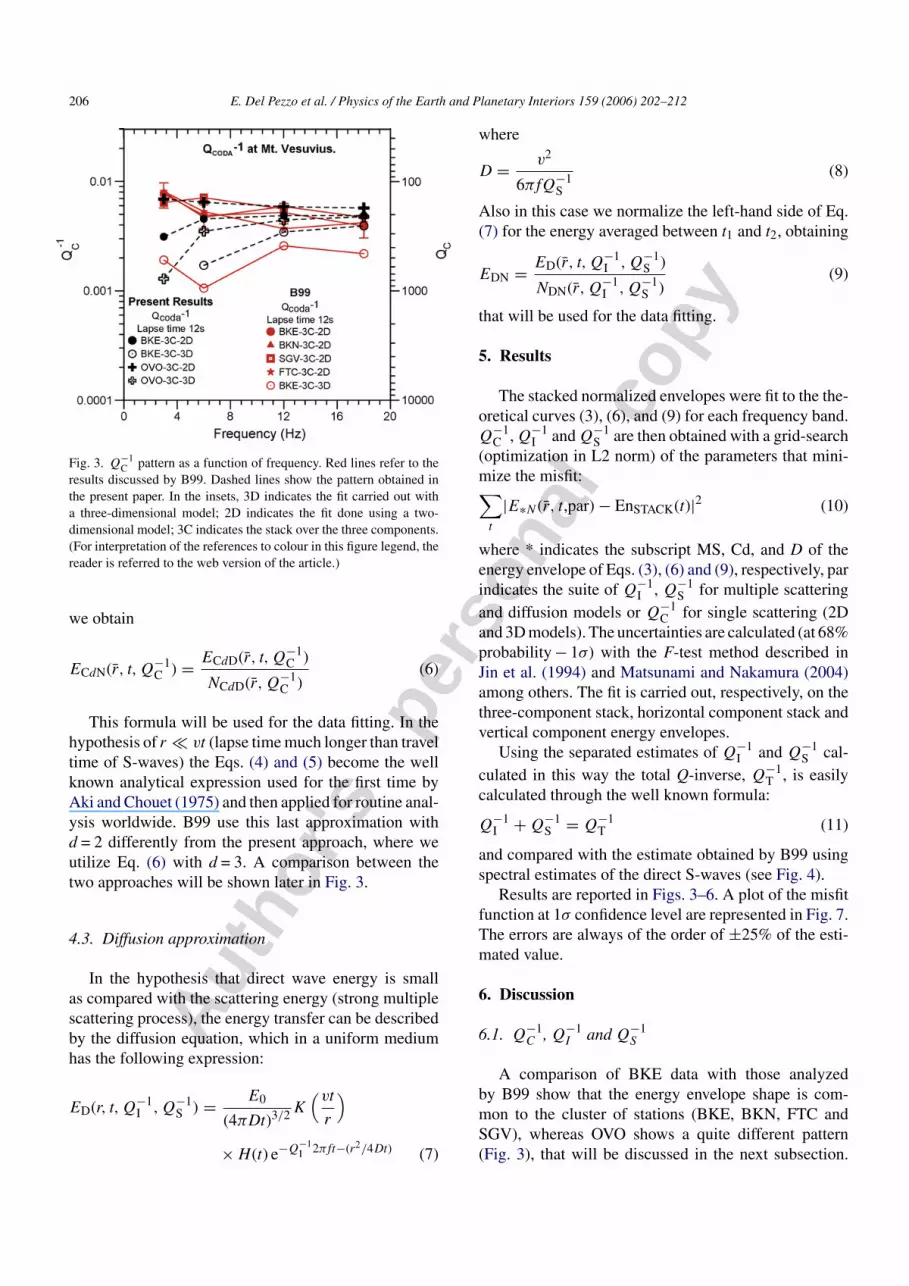
Fig. 3. Q−1C pattern as a function of frequency. Red lines refer to the
results discussed by B99. Dashed lines show the pattern obtained inthe present paper. In the insets, 3D indicates the fit carried out witha three-dimensional model; 2D indicates the fit done using a two-dimensional model; 3C indicates the stack over the three components.(For interpretation of the references to colour in this figure legend, thereader is referred to the web version of the article.)
we obtain
ECdN(r̄, t, Q−1C ) = ECdD(r̄, t, Q−1
C )
NCdD(r̄, Q−1C )
(6)
This formula will be used for the data fitting. In thehypothesis of r � vt (lapse time much longer than traveltime of S-waves) the Eqs. (4) and (5) become the wellknown analytical expression used for the first time byAki and Chouet (1975) and then applied for routine anal-ysis worldwide. B99 use this last approximation withd = 2 differently from the present approach, where weutilize Eq. (6) with d = 3. A comparison between thetwo approaches will be shown later in Fig. 3.
4.3. Diffusion approximation
In the hypothesis that direct wave energy is smallas compared with the scattering energy (strong multiplescattering process), the energy transfer can be describedby the diffusion equation, which in a uniform mediumhas the following expression:
ED(r, t, Q−1I , Q−1
S ) = E0
(4πDt)3/2 K(vt
r
)
× H(t) e−Q−1I 2πft−(r2/4Dt) (7)
where
D = v2
6πfQ−1S
(8)
Also in this case we normalize the left-hand side of Eq.(7) for the energy averaged between t1 and t2, obtaining
EDN = ED(r̄, t, Q−1I , Q−1
S )
NDN(r̄, Q−1I , Q−1
S )(9)
that will be used for the data fitting.
5. Results
The stacked normalized envelopes were fit to the the-oretical curves (3), (6), and (9) for each frequency band.Q−1
C , Q−1I and Q−1
S are then obtained with a grid-search(optimization in L2 norm) of the parameters that mini-mize the misfit:∑
t
|E∗N (r̄, t,par) − EnSTACK(t)|2 (10)
where * indicates the subscript MS, Cd, and D of theenergy envelope of Eqs. (3), (6) and (9), respectively, parindicates the suite of Q−1
I , Q−1S for multiple scattering
and diffusion models or Q−1C for single scattering (2D
and 3D models). The uncertainties are calculated (at 68%probability − 1σ) with the F-test method described inJin et al. (1994) and Matsunami and Nakamura (2004)among others. The fit is carried out, respectively, on thethree-component stack, horizontal component stack andvertical component energy envelopes.
Using the separated estimates of Q−1I and Q−1
S cal-culated in this way the total Q-inverse, Q−1
T , is easilycalculated through the well known formula:
Q−1I + Q−1
S = Q−1T (11)
and compared with the estimate obtained by B99 usingspectral estimates of the direct S-waves (see Fig. 4).
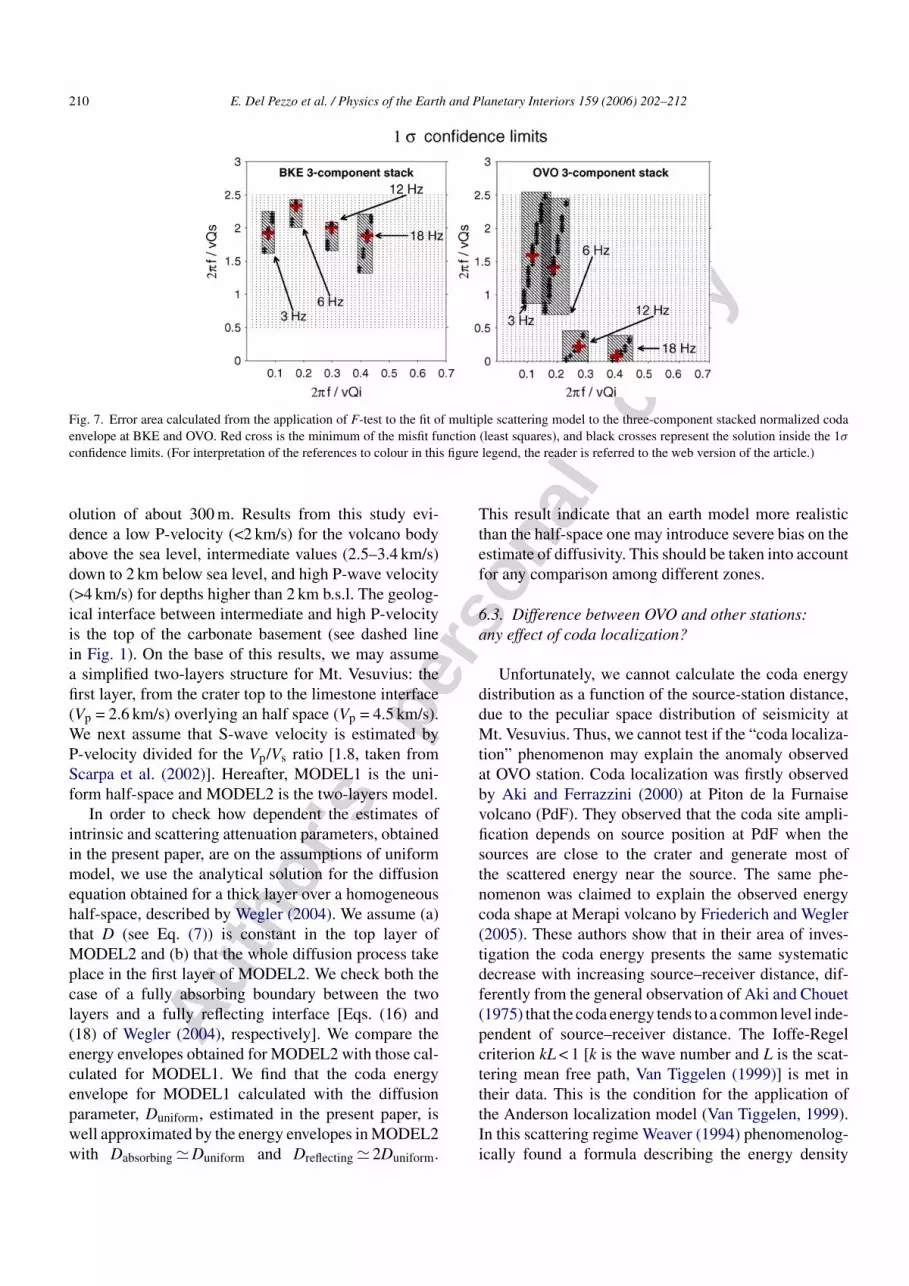
Results are reported in Figs. 3–6. A plot of the misfitfunction at 1σ confidence level are represented in Fig. 7.The errors are always of the order of ±25% of the esti-mated value.
6. Discussion
6.1. Q−1C , Q−1
I and Q−1S
A comparison of BKE data with those analyzedby B99 show that the energy envelope shape is com-mon to the cluster of stations (BKE, BKN, FTC andSGV), whereas OVO shows a quite different pattern(Fig. 3), that will be discussed in the next subsection.
E. Del Pezzo et al. / Physics of the Earth and Planetary Interiors 159 (2006) 202–212 207
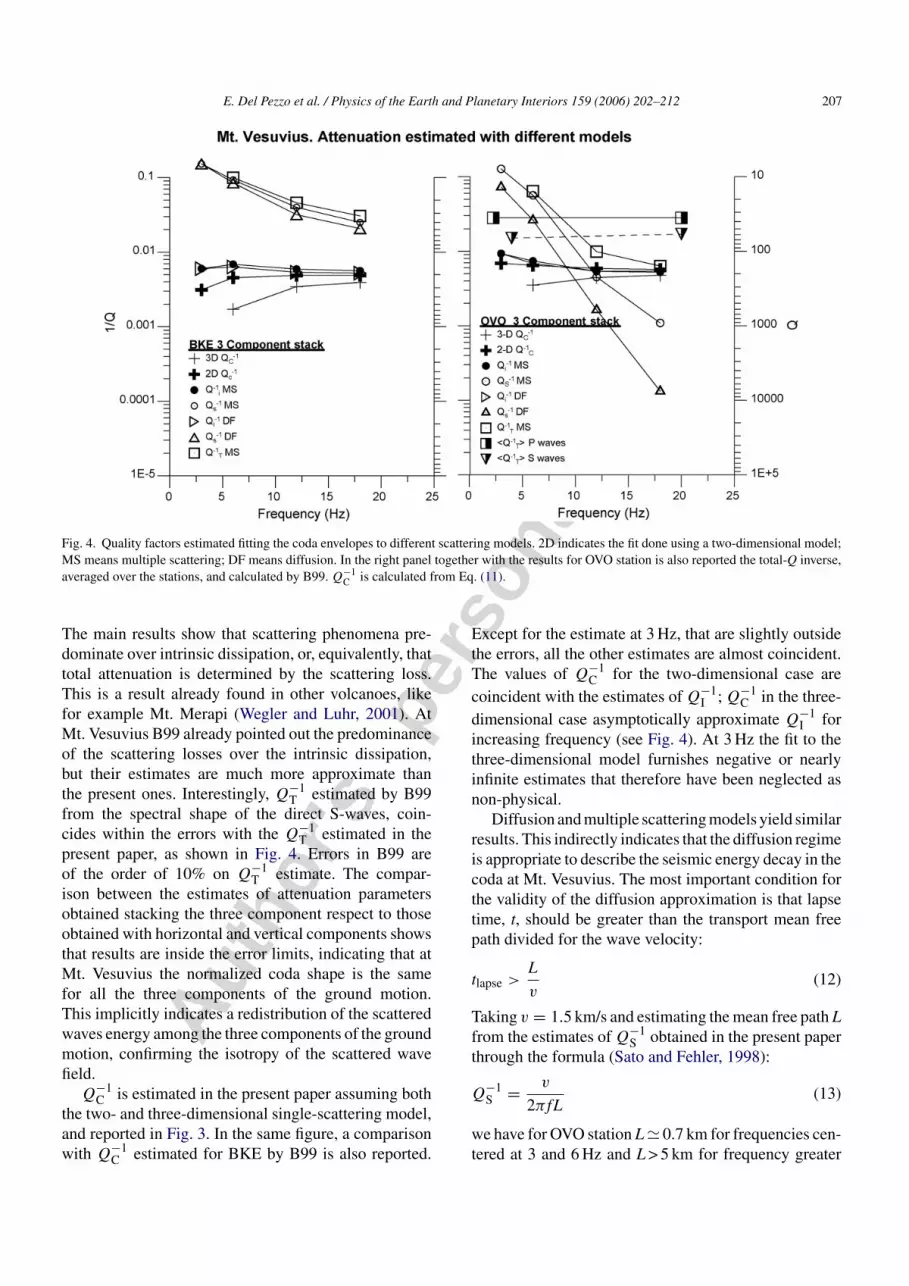
Fig. 4. Quality factors estimated fitting the coda envelopes to different scattering models. 2D indicates the fit done using a two-dimensional model;MS means multiple scattering; DF means diffusion. In the right panel together with the results for OVO station is also reported the total-Q inverse,averaged over the stations, and calculated by B99. Q−1
C is calculated from Eq. (11).
The main results show that scattering phenomena pre-dominate over intrinsic dissipation, or, equivalently, thattotal attenuation is determined by the scattering loss.This is a result already found in other volcanoes, likefor example Mt. Merapi (Wegler and Luhr, 2001). AtMt. Vesuvius B99 already pointed out the predominanceof the scattering losses over the intrinsic dissipation,but their estimates are much more approximate thanthe present ones. Interestingly, Q−1
T estimated by B99from the spectral shape of the direct S-waves, coin-cides within the errors with the Q−1
T estimated in thepresent paper, as shown in Fig. 4. Errors in B99 areof the order of 10% on Q−1
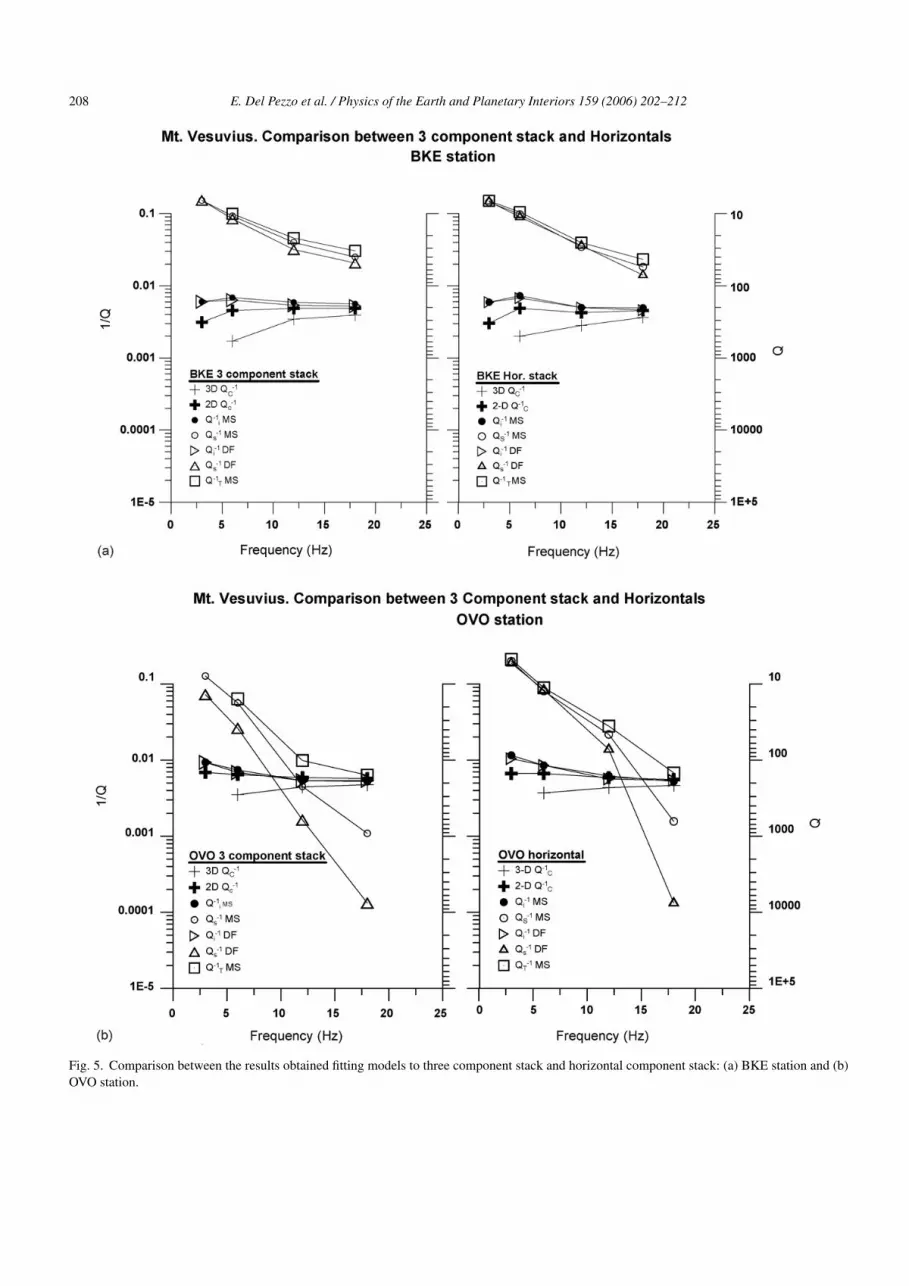
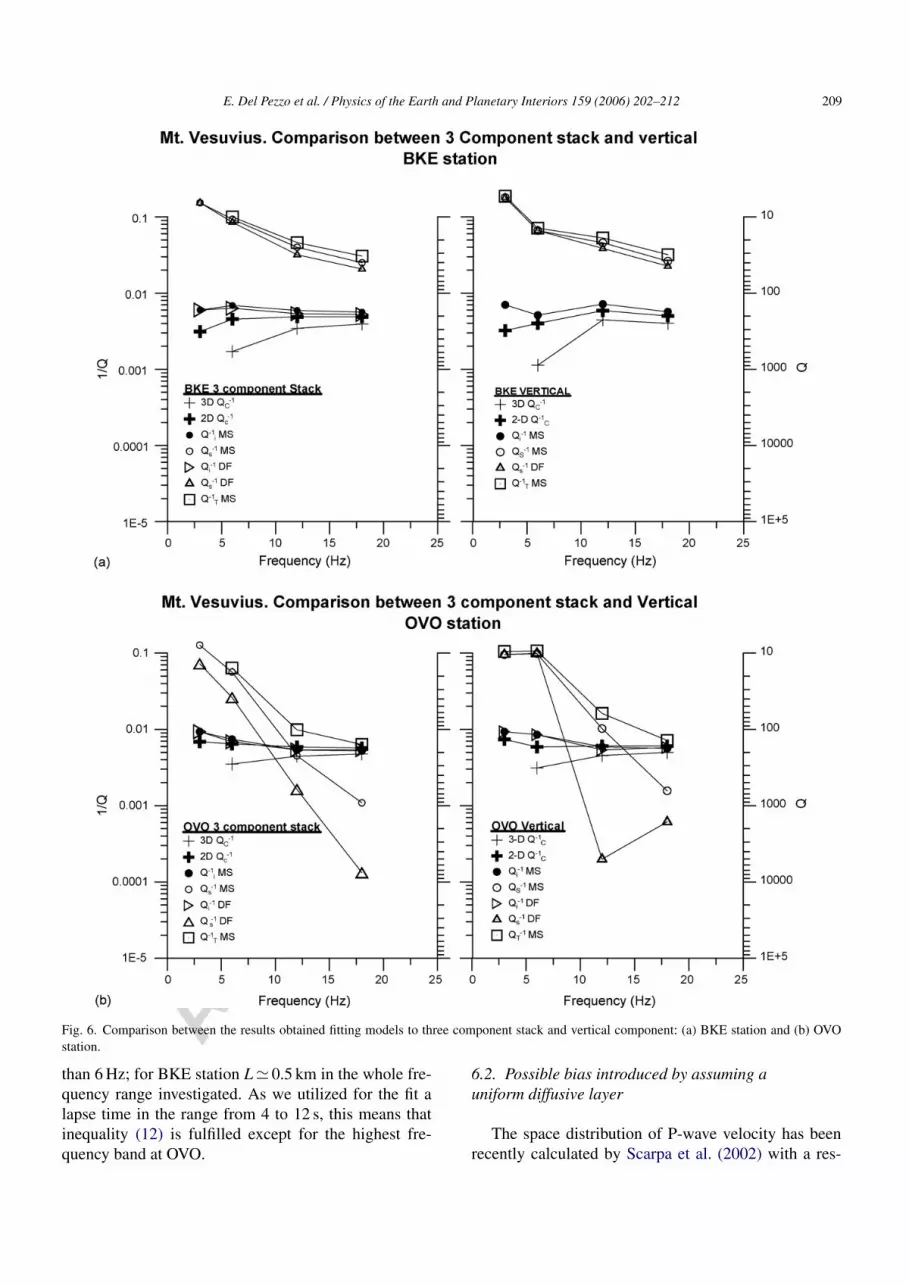
T estimate. The compar-ison between the estimates of attenuation parametersobtained stacking the three component respect to thoseobtained with horizontal and vertical components showsthat results are inside the error limits, indicating that atMt. Vesuvius the normalized coda shape is the samefor all the three components of the ground motion.This implicitly indicates a redistribution of the scatteredwaves energy among the three components of the groundmotion, confirming the isotropy of the scattered wavefield.
Q−1C is estimated in the present paper assuming both
the two- and three-dimensional single-scattering model,and reported in Fig. 3. In the same figure, a comparisonwith Q−1
C estimated for BKE by B99 is also reported.
Except for the estimate at 3 Hz, that are slightly outsidethe errors, all the other estimates are almost coincident.The values of Q−1
C for the two-dimensional case arecoincident with the estimates of Q−1
I ; Q−1C in the three-
dimensional case asymptotically approximate Q−1I for
increasing frequency (see Fig. 4). At 3 Hz the fit to thethree-dimensional model furnishes negative or nearlyinfinite estimates that therefore have been neglected asnon-physical.
Diffusion and multiple scattering models yield similarresults. This indirectly indicates that the diffusion regimeis appropriate to describe the seismic energy decay in thecoda at Mt. Vesuvius. The most important condition forthe validity of the diffusion approximation is that lapsetime, t, should be greater than the transport mean freepath divided for the wave velocity:
tlapse >L
v(12)
Taking v = 1.5 km/s and estimating the mean free path Lfrom the estimates of Q−1
S obtained in the present paperthrough the formula (Sato and Fehler, 1998):
Q−1S = v
2πfL(13)
we have for OVO station L � 0.7 km for frequencies cen-tered at 3 and 6 Hz and L > 5 km for frequency greater
Autho
r's
pers
onal
co
py
208 E. Del Pezzo et al. / Physics of the Earth and Planetary Interiors 159 (2006) 202–212
Fig. 5. Comparison between the results obtained fitting models to three component stack and horizontal component stack: (a) BKE station and (b)OVO station.
Autho
r's
pers
onal
co
py
E. Del Pezzo et al. / Physics of the Earth and Planetary Interiors 159 (2006) 202–212 209
Fig. 6. Comparison between the results obtained fitting models to three component stack and vertical component: (a) BKE station and (b) OVOstation.
than 6 Hz; for BKE station L � 0.5 km in the whole fre-quency range investigated. As we utilized for the fit alapse time in the range from 4 to 12 s, this means thatinequality (12) is fulfilled except for the highest fre-quency band at OVO.
6.2. Possible bias introduced by assuming auniform diffusive layer
The space distribution of P-wave velocity has beenrecently calculated by Scarpa et al. (2002) with a res-
Autho
r's
pers
onal
co
py
210 E. Del Pezzo et al. / Physics of the Earth and Planetary Interiors 159 (2006) 202–212
Fig. 7. Error area calculated from the application of F-test to the fit of multiple scattering model to the three-component stacked normalized codaenvelope at BKE and OVO. Red cross is the minimum of the misfit function (least squares), and black crosses represent the solution inside the 1σ
confidence limits. (For interpretation of the references to colour in this figure legend, the reader is referred to the web version of the article.)
olution of about 300 m. Results from this study evi-dence a low P-velocity (<2 km/s) for the volcano bodyabove the sea level, intermediate values (2.5–3.4 km/s)down to 2 km below sea level, and high P-wave velocity(>4 km/s) for depths higher than 2 km b.s.l. The geolog-ical interface between intermediate and high P-velocityis the top of the carbonate basement (see dashed linein Fig. 1). On the base of this results, we may assumea simplified two-layers structure for Mt. Vesuvius: thefirst layer, from the crater top to the limestone interface(Vp = 2.6 km/s) overlying an half space (Vp = 4.5 km/s).We next assume that S-wave velocity is estimated byP-velocity divided for the Vp/Vs ratio [1.8, taken fromScarpa et al. (2002)]. Hereafter, MODEL1 is the uni-form half-space and MODEL2 is the two-layers model.
In order to check how dependent the estimates ofintrinsic and scattering attenuation parameters, obtainedin the present paper, are on the assumptions of uniformmodel, we use the analytical solution for the diffusionequation obtained for a thick layer over a homogeneoushalf-space, described by Wegler (2004). We assume (a)that D (see Eq. (7)) is constant in the top layer ofMODEL2 and (b) that the whole diffusion process takeplace in the first layer of MODEL2. We check both thecase of a fully absorbing boundary between the twolayers and a fully reflecting interface [Eqs. (16) and(18) of Wegler (2004), respectively]. We compare theenergy envelopes obtained for MODEL2 with those cal-culated for MODEL1. We find that the coda energyenvelope for MODEL1 calculated with the diffusionparameter, Duniform, estimated in the present paper, iswell approximated by the energy envelopes in MODEL2with Dabsorbing � Duniform and Dreflecting � 2Duniform.
This result indicate that an earth model more realisticthan the half-space one may introduce severe bias on theestimate of diffusivity. This should be taken into accountfor any comparison among different zones.
6.3. Difference between OVO and other stations:any effect of coda localization?
Unfortunately, we cannot calculate the coda energydistribution as a function of the source-station distance,due to the peculiar space distribution of seismicity atMt. Vesuvius. Thus, we cannot test if the “coda localiza-tion” phenomenon may explain the anomaly observedat OVO station. Coda localization was firstly observedby Aki and Ferrazzini (2000) at Piton de la Furnaisevolcano (PdF). They observed that the coda site ampli-fication depends on source position at PdF when thesources are close to the crater and generate most ofthe scattered energy near the source. The same phe-nomenon was claimed to explain the observed energycoda shape at Merapi volcano by Friederich and Wegler(2005). These authors show that in their area of inves-tigation the coda energy presents the same systematicdecrease with increasing source–receiver distance, dif-ferently from the general observation of Aki and Chouet(1975) that the coda energy tends to a common level inde-pendent of source–receiver distance. The Ioffe-Regelcriterion kL < 1 [k is the wave number and L is the scat-tering mean free path, Van Tiggelen (1999)] is met intheir data. This is the condition for the application ofthe Anderson localization model (Van Tiggelen, 1999).In this scattering regime Weaver (1994) phenomenolog-ically found a formula describing the energy density
Autho
r's
pers
onal
co
py
E. Del Pezzo et al. / Physics of the Earth and Planetary Interiors 159 (2006) 202–212 211
decay E as a function of distance r and time t, whichincludes the intrinsic dissipation:
E(r, t) = E0 exp
(− r
ξ−(
r2+n
4Drestξn
)p
− bAt
)(14)
where n and p are empirically determined constants(assumed to be respectively equal to 0.46 and 0.76), ξ
is the localization length, Dres the residual diffusivityand bA the intrinsic dissipation coefficient. Friederichand Wegler (2005) compared the Anderson localizationmodel with the half space diffusion model fitting to theirdata both formula (14) and Eq. (7). They found that atMerapi the energy envelopes as a function of distanceand lapse time fit well both formulae (14) and (7) in thefrequency band between 1 and 3 Hz with Dres � D = 0.1;b = 2πf/Q−1
I � 0.5bA; ξ = 1.7. ξ > 1 indicates that thecoda localization regime is present in their data at lowfrequency.
For Mt. Vesuvius the Ioffe-Regel criterion is not metin the frequency bands investigated. Taking v = 1.5 km/sand estimating the mean free path L from the estimatesof Q−1
S obtained in the present paper through formula(13) we have for OVO station 13 < kL < 7 × 10³ and forBKE station 6 < kL < 48, well outside the limits givenby kL < 1. In conclusion, the difference at OVO shouldbe not a distance effect, as OVO and BKE are almostequally distant from the location centroid of VT earth-quakes. The different energy envelope shape betweenOVO and BKE may be interpreted as due to differentscattering conditions between the N-western part of Mt.Vesuvius, where OVO is set up, and the eastern part ofthe volcano, where most of the other seismic station arelocated.
6.4. Comparison with other results obtained for Mt.Vesuvius
Wegler (2004) used the diffusion model to fit thecoda envelopes of seismograms from shots fired atground surface for TOMOVES active seismic experi-ment (Gasparini and TOMOVES Working Group, 1998).Wegler (2004) finds D = 0.1 km2 s−1 for all frequen-cies and all the stations of several profiles used for theexperiment (see Fig. 3). In the present paper we findestimates of D for MODEL1 that range from twice tothree times the estimate of Wegler (2004), except forthe highest frequencies of OVO station. For MODEL2the estimates differ of a factor ranging from 4 to 6.This discrepancy is possibly due to the different dataset analyzed. In the present paper we use natural seis-micity, with an average depth of 3 km. The scattered
waves sample in the present case a earth volume dif-ferent from that sampled for the shots of TOMOVESexperiment, travelling with higher velocity. So, differentcombination of Qs and velocity for the different volumessampled by the coda for the shots in TOMOVES and forthe VT quakes used in the present study, could explainthe observed discrepancy. In other words, the source ofthe earthquakes is closer to the limestone interface thanthe artificial shots (fired at the surface), and the seis-mograms from natural earthquakes contain much moreshear wave energy than the seismograms from artificialshots.
7. Concluding remarks
In the present paper we analyzed the VT seismicityoccurred at Mt. Vesuvius in order to properly separate theintrinsic from scattering attenuation, revising a previouspaper on the same subject – B99 – where a more simpleapproach [the Wennerberg method, Wennerberg (1993)]was utilized. We in synthesis found that the scatteringattenuation strongly prevails over intrinsic attenuationin the whole frequency band analyzed, except at highfrequency for OVO station. OVO is located eastwardrespect to the crater. Among the five station analyzed,only OVO show the peculiar pattern that the decay rateof the coda envelope as a function of lapse time is higherthan at the other stations. This evidence, in our opinioncannot be explained as the effect of a coda localizationphenomenon in the area surrounding OVO station, asthe Ioffe-Reigel criterion is not satisfied. We favor thehypothesis of a site effect generated by more intensescattering phenomena close to the station. This strongscattering could modify the redistribution of the seismicenergy into the coda at short lapse times, producing atOVO a different pattern of coda decay respect to the otherstations.
Acknowledgements
This work is financed by INGV-DPC projects V3 4and V4, and MIUR-FIRB project entitled “Analisidel campo d’onda associato al vulcanismo attivo”.George Helffrich and an anonimous reviewer aregreatly acknowledged for improving the quality of themanuscript.
References
Aki, K., Chouet, B., 1975. Origin of coda waves: source, attenuationand scattering effects. J. Geophys. Res. 80, 3322–3342.
Autho
r's
pers
onal
co
py
212 E. Del Pezzo et al. / Physics of the Earth and Planetary Interiors 159 (2006) 202–212
Aki, K., Ferrazzini, V., 2000. Seismic monitoring and modeling ofan active volcano for prediction. J. Geophys. Res. 105 (B7),16617–16640.
Bianco, F., Del Pezzo, E., Castellano, M., Ibanez, J.M., Di Luccio, F.,2002. Separation of intrinsic and scattering seismic attenuation inthe southern Apennine zone, Italy. Geophys. J. Int. 150, 10–22.
Bianco, F., Castellano, M., Del Pezzo, E., Ibanez, J., 1999. Attenuationof the short period seismic waves at Mt. Vesuvius, Italy. Geophys.J. Int. 138 (1), 67–76.
Bianco, F., Cusano, P., Petrosino, S., Castellano, M., Buonocunto, C.,Capello, M., Del Pezzo, E., 2005. Small-aperture array for seismicmonitoring of Mt. Vesuvius. Seismol. Res. Lett. 76 (3), 344–355.
Castellano, M., Buonocunto, C., Capello, M., La Rocca, M., 2001.Seismic surveillance of active volcanoes: the osservatorio Vesu-viano Seismic Network (OVSN-Southern Italy). Seim. Res. Lett.73 (2).
Chouet, B., 2003. Volcano seismology. Pure Appl. Geophys. 160,739–788.
Friederich, C., Wegler, U., 2005. Localization of the seismic coda atMerapi volcano (Indonesia). Geophys. Res. Lett., doi:10.1029.
Gasparini, P., TOMOVES Working Group, 1998. Looking inside Mt.Vesuvius. EOS 79 (19), 229–232.
Hoshiba, M., Sato, H., Fehler, M., 1991. Numerical basis of the sepa-ration of scattering and intrinsic absorption from full seismogramenvelope—a Monte Carlo simulation of multiple isotropic scatter-ing. Pap. Meteorol. Geophys. 42 (2), 65–91.
Jin, A., Mayeda, K., Adams, D., Aki, K., 1994. Separation of intrinsicand scattering attenuation in Southern California using TERRAs-cope data. J. Geophys. Res. 99, 17835–17848.
Lomax, A., Virieux, J., Volant, P., Berge, C., 2000. Introduction of aMetropolis–Gibbs method and comparison with linear locations.In: Thurber, C., Kissling, E., Rabinowitz, N. (Eds.), Advances inSeismic Event Location. Kluwer, Amsterdam.
Margerin, L., Campillo, M., Bart van Tiggelen, 1998. Radiative transferand diffusion of waves in a layered medium: new insight into codaQ. Geophys. J. Int. 134, 596–612.
Matsunami, K., Nakamura, M., 2004. Seismic attenuation in a nonvolcanic swarm region beneath Wakayama, southwest Japan. J.Geophys. Res. 109, B09302, doi:10.1029/2003JB002758.
Ryzhik, L.V., Papanicolaou, G.C., Keller, J.B., 1996. Transport equa-tion for elastic and other waves in random media. Wave Motion24, 327–370.
Sato, H., Fehler, M.C., 1998. Seismic Wave Propagation and Scatteringin the Heterogeneous Earth. Springer-Verlag, New York.
Scarpa, R., Tronca, F., Bianco, F., Del Pezzo, E., 2002. High resolu-tion velocity structure beneath Mount Vesuvius from seismic array.Geophys. Re. Lett. 29 (21), 2040.
Van Tiggelen, B.A., 1999. Localization of waves. In: Fouque, J.P. (Ed.),Diffuse Waves in Complex Media. Kluwer Academic Publisher,Dortrecht, The Netherlands, pp. 1–60.
Weaver, R.L., 1994. Anderson localization in time domain: numericalstudies of waves in two dimensional disordered media. Phys. Rev.B 49 (9), 5881–5895.
Wegler, U., Luhr, B.G., 2001. Scattering behaviour at Merapi Volcano,Java revealed from an active seismic experiment. Geophys. J. Int.145, 579–592.
Wegler, U., 2004. Diffusion of seismic waves in a thick layer: the-ory and application to Vesuvius volcano. J. Geophys. Res. 109,B07303, doi:10.1029/2004JB003048.
Wu, R.S., 1985. Multiple scattering and energy transfer of seismicwaves—separation of scattering effects from intrinsic attenuation.I. Theoretical modeling. Geophys. J. R. Astron. Soc. 82, 57–80.
Zeng, Y., 1991. Compact solutions for multiple scattered wave energyin time domain. Bull. Seimol. Soc. Am. 81, 1022–1029.

![Mng301e q 26a[1]](https://static.documents.page/doc/80x56/6358e704abb9a6c9b80a6edb/mng301e-q-26a1.jpg)


