Page 1
M o u s s a l l a m e t a l . H 2 e m i s s i o n f r o m E r e b u s v o l c a n o P a g e | 1
Hydrogen emission from Erebus volcano, Antarctica 1
2
Yves Moussallam1, Clive Oppenheimer
1–3, Alessandro Aiuppa
4,5, Gaetano Giudice
5, Manuel 3
Moussallam6, Philip Kyle
7 4
5 1 Department of Geography, University of Cambridge, Downing Place, Cambridge, CB2 3EN, UK 6
2 Le Studium, Institute for Advanced Studies, Orléans and Tours, France Email: [email protected] , Tel.: +44 7
1223 333386; Fax: +44 1223 333392 8
3 L’Institut des Sciences de la Terre d'Orléans, l’Université d’Orléans, 1a rue de la Férollerie, 45071 Orléans, 9
Cedex 2, France 10
4 Dipartimento DiSTeM, Università di Palermo, Via archirafi 36, 90146, Palermo, Italy 11
5 Istituto Nazionale di Geofisica e Vulcanologia, Sezione di Palermo Via La Malfa, 153, 90146 Palermo, Italy 12
6 Institut Telecom - Telecom ParisTech - CNRS/LTCI, 37 rue Dareau, 75014 Paris, France
13
7 Department of Earth and Environmental Science, New Mexico Institute of Mining and Technology, 801 Leroy 14
Place, Socorro, NM 87801, USA 15
16
Corresponding author: Yves Moussallam; [email protected] ; Tel: 01223 – 333399; Fax: 01223 – 333392 17
18
Abstract 19
The continuous measurement of molecular hydrogen (H2) emissions from passively degassing 20
volcanoes has recently been made possible using a new generation of low-cost 21
electrochemical sensors. We have used such sensors to measure H2, along with SO2, H2O, and 22
CO2, in the gas and aerosol plume emitted from the phonolite lava lake at Erebus volcano, 23
Antarctica. The measurements were made at the crater rim between December 2010 and 24
January 2011. Combined with measurements of the long-term SO2 emission rate for Erebus, 25
they indicate a characteristic H2 flux of 0.03 kg s-1
(2.8 Mg day-1
). The observed H2 content in 26
Page 2
M o u s s a l l a m e t a l . H 2 e m i s s i o n f r o m E r e b u s v o l c a n o P a g e | 2
the plume is consistent with previous estimates of redox conditions in the lava lake inferred 27
from mineral compositions and the observed CO2/CO ratio in the gas plume (~0.9 log units 28
below the quartz-fayalaite-magnetite buffer). These measurements suggest that H2 does not 29
combust at the surface of the lake, and that H2 is kinetically inert in the gas/aerosol plume, 30
retaining the signature of the high-temperature chemical equilibrium reached in the lava lake. 31
We also observe a cyclical variation in the H2/SO2 ratio with a period of ~10 min. These 32
cycles correspond to oscillatory patterns of surface motion of the lava lake that have been 33
interpreted as signs of a pulsatory magma supply at the top of the magmatic conduit. 34
35
Keywords: Mount Erebus, hydrogen, magma redox conditions, lava lake, volcanic degassing. 36
37
38
Introduction 39
Hydrogen is one of the most abundant trace species in volcanic emissions (e.g. Giggenbach et 40
al. 1987; Oppenheimer et al. in press) and is an essential participant in key redox reactions 41
that take place in magmatic gases, e.g.: 42
H2 + ½O2 = H2O (1) 43
and 44
H2S + 2H2O = SO2 + 3H2 (2) 45
At Erebus volcano, Antarctica, emissions to the atmosphere result from the sustained supply 46
of gas via the persistently active lava lake and surrounding fumaroles. The gas composition of 47
the plume provides valuable insights into redox conditions of the lava lake, assuming 48
thermodynamic equilibrium is achieved between the gas phase and the melt. At Mount Erebus 49
the volcanic plume is mainly the result of passive diffused degassing of the magma within the 50
Page 3
M o u s s a l l a m e t a l . H 2 e m i s s i o n f r o m E r e b u s v o l c a n o P a g e | 3
lava lake and assuming chemical equilibrium is therefore justified. Contrary to the 51
conventional consideration that the redox state of a magma is buffered during decompression, 52
recent chemical modelling of the gas phase in ascending magmas (Burgisser and Scaillet 53
2007; Burgisser et al., 2008) has suggested an evolution of the magma redox state during 54
ascent, partly reflecting initial volatile contents. Measurement of redox-sensitive magmatic 55
gas species such as molecular hydrogen will enable such models to provide better constrained 56
“inversions” of surface geochemical signatures. 57
58
The recent development of highly portable and readily deployed multi-species gas sensing 59
systems (Shinohara 2005; Aiuppa et al. 2005; Aiuppa et al. 2006; De Vito et al. 2007) has 60
enabled measurements of volcanic gas ratios for extended periods and in some cases 61
operationally (Aiuppa, et al. 2010a; 2010b). Such multi-species approaches complement 62
ultraviolet and infrared spectroscopic applications (Oppenheimer 2010) to enable 63
measurement of abundances and fluxes of a range of gas species. Until very recently, there 64
has not been a practical means for extended surveillance of H2 abundance in dilute volcanic 65
plumes (Aiuppa et al., 2011; Shinohara et al., 2011). Here we use a “Multi-Gas” instrument 66
incorporating a sensor to measure H2 in the plume emitted from the lava lake of Erebus 67
volcano. Erebus is of particular interest because of the emerging evidence for redox change 68
associated with magma ascent with the most reducing conditions found in the lava lake itself 69
(Oppenheimer et al., 2011). Despite challenging conditions at summit crater, measurements 70
were possible for several hours per day spanning a week. Our initial aims were to assess 71
implications of the measurements for lava lake redox conditions, and to identify any rapid 72
variability in gas composition of the plume that would corroborate previous observation of 73
cyclical behavior of the lava lake (Oppenheimer et al., 2009). 74
75
Page 4
M o u s s a l l a m e t a l . H 2 e m i s s i o n f r o m E r e b u s v o l c a n o P a g e | 4
Methodology 76
The measurements were made between 6 December 2010 and 3 January 2011 using a 77
purpose-built “Multi-Gas” instrument and a LI-COR®
LI-840 CO2 and H2O infrared analyser. 78
The “Multi-Gas” instrument incorporated H2 H2S and SO2 electrochemical sensors, a 79
nondispersive infrared (NDIR) sensor for CO2, and a sensor for temperature and humidity 80
measurements. The sampled gas is circulated via a miniature 12 V rotary pump through the 81
sensors (Aiuppa et al. 2011). The H2, H2S and SO2 sensors produce an electrical current in 82
response to the target gas entering the electrolyte and oxidizing or reducing the electrode. This 83
current is proportional to the concentration of the target gas in the total gas volume. The 84
electrochemical sensor for SO2 (City Technology, sensor type 3ST/F) has a calibration range 85
of 0–30 ppmv, an accuracy of ±2%, a repeatability of 1% and a resolution of 0.5 ppmv. The 86
electrochemical sensor for H2 (City Technology, sensor type 3HYT) has a calibration range of 87
0–500 ppmv, an accuracy of ±5% a repeatability of 2% and a resolution of 2 ppmv. The 88
NDIR CO2 sensor (model Gascard II) is calibrated for 0–3000 ppmv and has an accuracy ±2% 89
and a resolution of 0.8 ppmv. In addition to the gas sensors, temperature and relative humidity 90
(RH) sensors (Galltec) are mounted in the instrument, providing a measuring range of 0–100 91
% RH and an accuracy of ±2%. All sensors were housed inside a weatherproof box, with the 92
ambient air sampled via Teflon tubing connected to a HEPA filter fed through an opening in 93
the box. The sampled gas was ejected via an outlet likewise fed through a hole in the case. 94
The sampled gas was heated to ~30°C on its way through the first hose to prevent freezing 95
and other problems related to the low ambient temperatures (below –25°C). 96
97
An on-board data-logger card in the “Multi-Gas” instrument captured measurements at a rate 98
of 0.5 Hz while the LI 840 output was logged at 1 Hz via a netbook PC. Both instruments 99
were always started simultaneously. The “Multi-Gas” instrument was recalibrated using 100
Page 5
M o u s s a l l a m e t a l . H 2 e m i s s i o n f r o m E r e b u s v o l c a n o P a g e | 5
standard gas mixtures in the laboratory (accurately measured by gas chromatography) before 101
and after the campaign and showed very little drift (<5%). 102
103
The LI-COR®
LI-840 instrument was operated for intercomparison with the Gascard II and 104
humidity sensors in the “Multi-Gas” unit. The LI-840 is a non-dispersive infrared gas 105
analyzer equipped with a dual wavelength, infrared detection system allowing measurements 106
of CO2 and H2O in the gas phase in the range of 0–3000 ppmv and 0–80 pptv (parts per 107
thousand), respectively. The accuracy was better than 1.5% for both species and cross 108
sensitivity is < 0.1 ppmv CO2/pptv H2O for H2O and <0.0001 pptv H2O/ppmv CO2 for CO2. 109
110
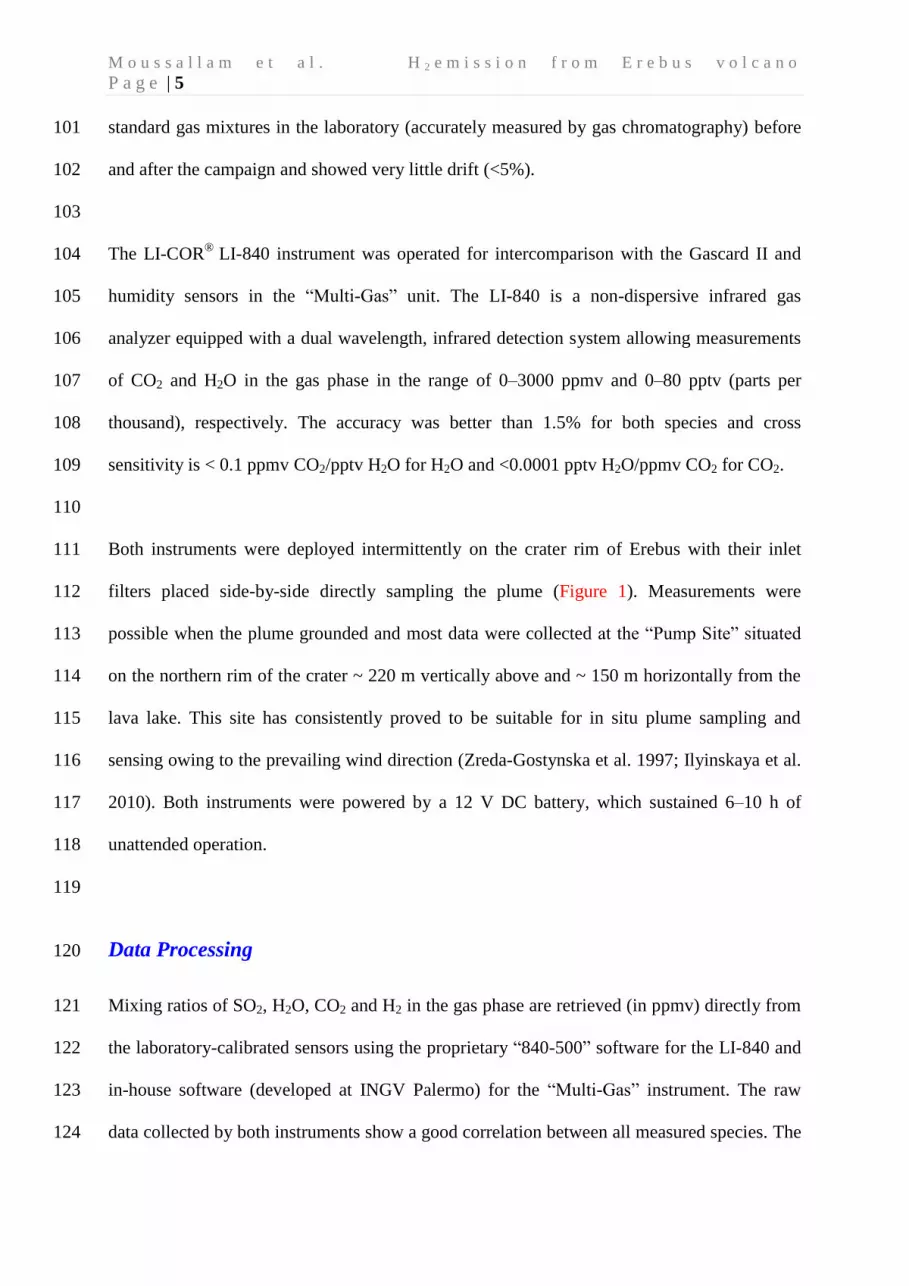
Both instruments were deployed intermittently on the crater rim of Erebus with their inlet 111
filters placed side-by-side directly sampling the plume (Figure 1). Measurements were 112
possible when the plume grounded and most data were collected at the “Pump Site” situated 113
on the northern rim of the crater ~ 220 m vertically above and ~ 150 m horizontally from the 114
lava lake. This site has consistently proved to be suitable for in situ plume sampling and 115
sensing owing to the prevailing wind direction (Zreda-Gostynska et al. 1997; Ilyinskaya et al. 116
2010). Both instruments were powered by a 12 V DC battery, which sustained 6–10 h of 117
unattended operation. 118
119
Data Processing 120
Mixing ratios of SO2, H2O, CO2 and H2 in the gas phase are retrieved (in ppmv) directly from 121
the laboratory-calibrated sensors using the proprietary “840-500” software for the LI-840 and 122
in-house software (developed at INGV Palermo) for the “Multi-Gas” instrument. The raw 123
data collected by both instruments show a good correlation between all measured species. The 124
Page 6
M o u s s a l l a m e t a l . H 2 e m i s s i o n f r o m E r e b u s v o l c a n o P a g e | 6
good agreement between the CO2 measurements obtained by the “Multi-Gas” instrument and 125
those obtained by the LI-840 provides a validation of the performance of the Gascard II 126
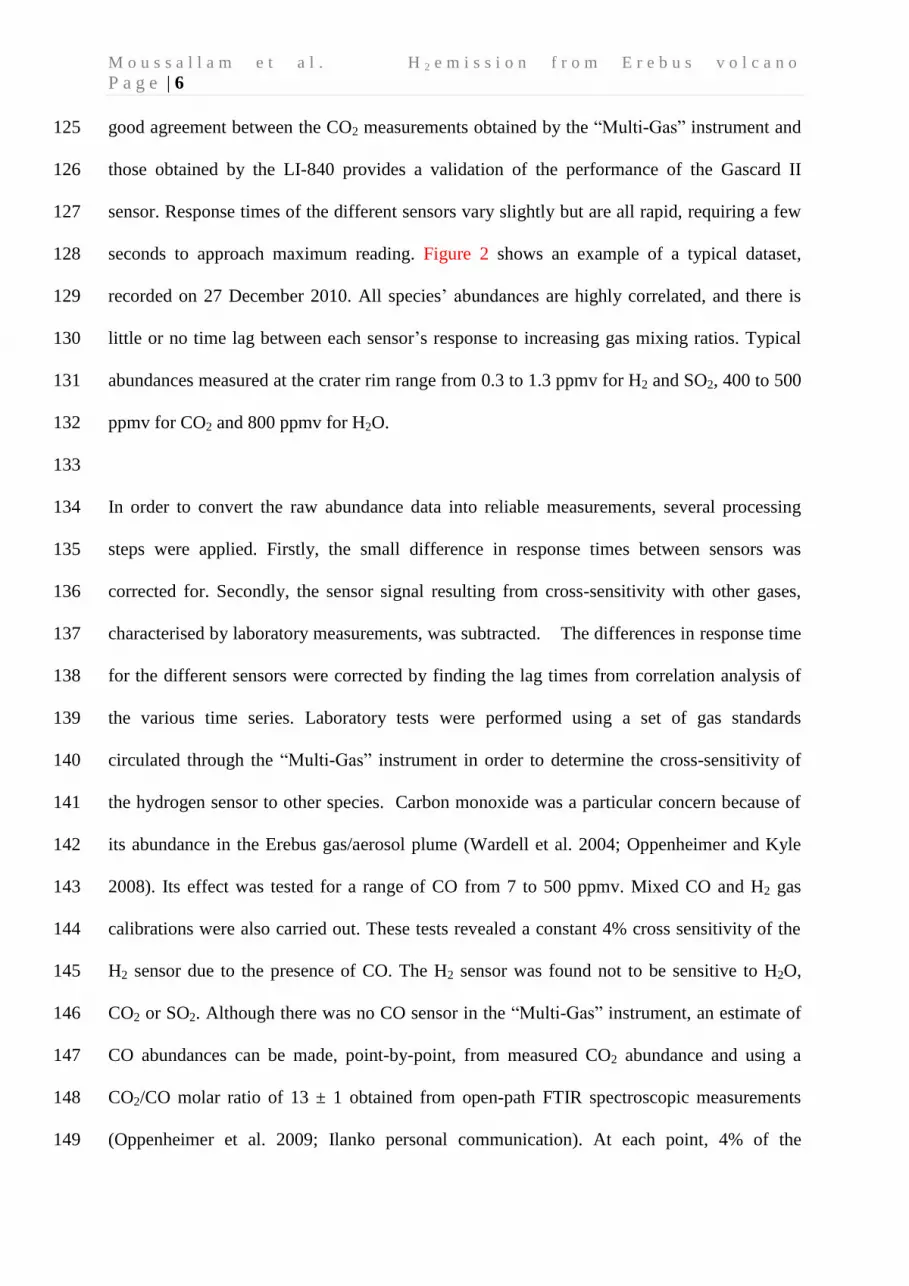
sensor. Response times of the different sensors vary slightly but are all rapid, requiring a few 127
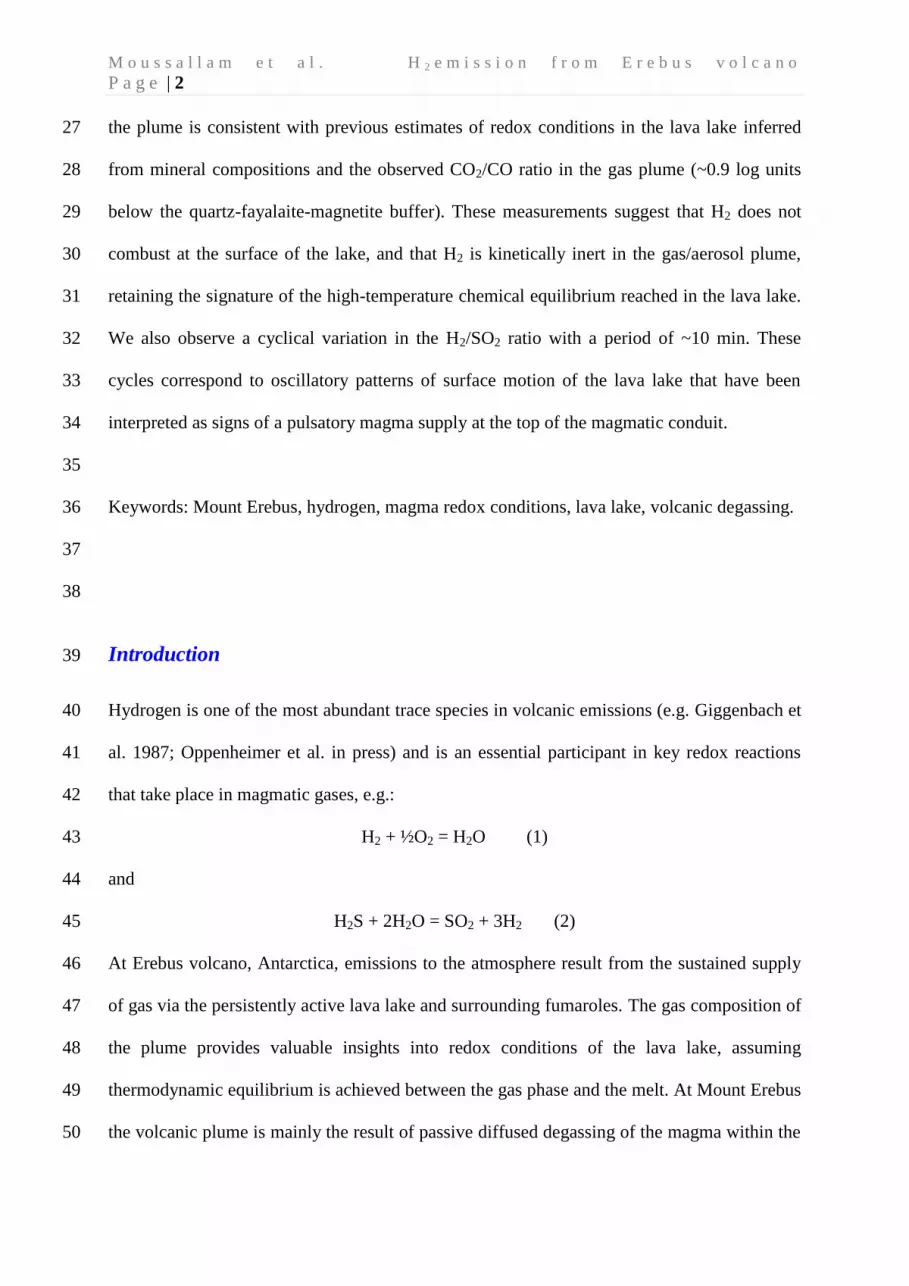
seconds to approach maximum reading. Figure 2 shows an example of a typical dataset, 128
recorded on 27 December 2010. All species’ abundances are highly correlated, and there is 129
little or no time lag between each sensor’s response to increasing gas mixing ratios. Typical 130
abundances measured at the crater rim range from 0.3 to 1.3 ppmv for H2 and SO2, 400 to 500 131
ppmv for CO2 and 800 ppmv for H2O. 132
133
In order to convert the raw abundance data into reliable measurements, several processing 134
steps were applied. Firstly, the small difference in response times between sensors was 135
corrected for. Secondly, the sensor signal resulting from cross-sensitivity with other gases, 136
characterised by laboratory measurements, was subtracted. The differences in response time 137
for the different sensors were corrected by finding the lag times from correlation analysis of 138
the various time series. Laboratory tests were performed using a set of gas standards 139
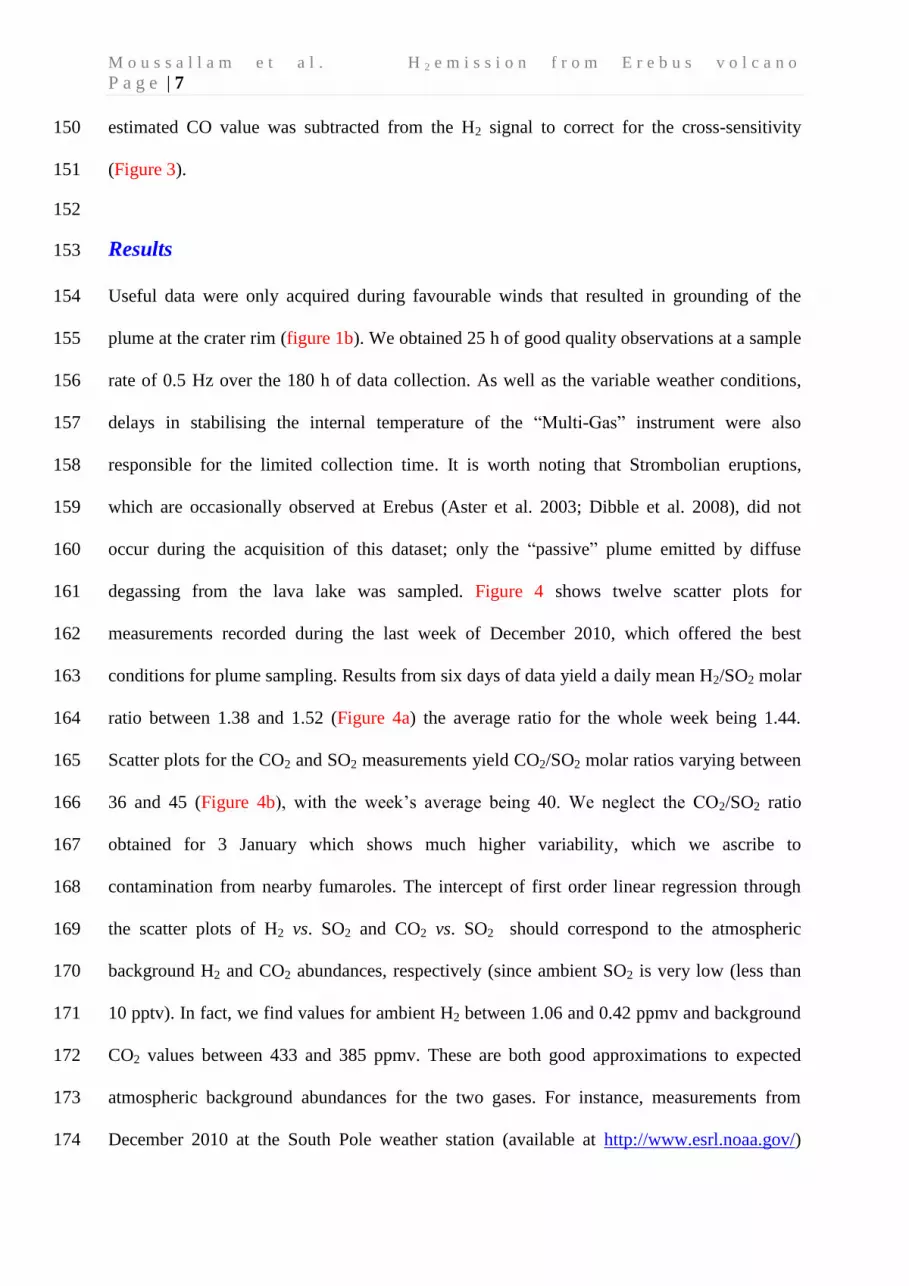
circulated through the “Multi-Gas” instrument in order to determine the cross-sensitivity of 140
the hydrogen sensor to other species. Carbon monoxide was a particular concern because of 141
its abundance in the Erebus gas/aerosol plume (Wardell et al. 2004; Oppenheimer and Kyle 142
2008). Its effect was tested for a range of CO from 7 to 500 ppmv. Mixed CO and H2 gas 143
calibrations were also carried out. These tests revealed a constant 4% cross sensitivity of the 144
H2 sensor due to the presence of CO. The H2 sensor was found not to be sensitive to H2O, 145
CO2 or SO2. Although there was no CO sensor in the “Multi-Gas” instrument, an estimate of 146
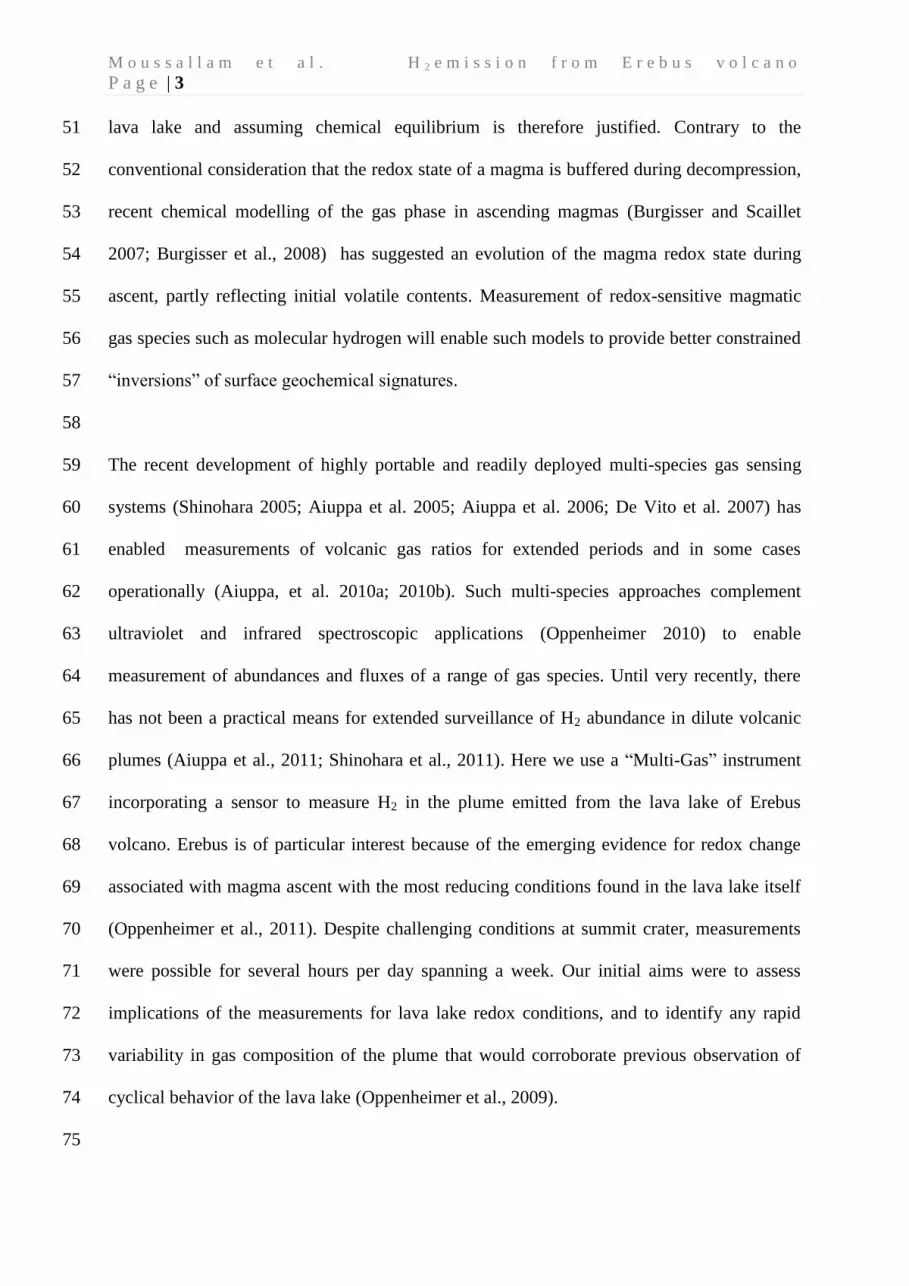
CO abundances can be made, point-by-point, from measured CO2 abundance and using a 147
CO2/CO molar ratio of 13 ± 1 obtained from open-path FTIR spectroscopic measurements 148
(Oppenheimer et al. 2009; Ilanko personal communication). At each point, 4% of the 149
Page 7
M o u s s a l l a m e t a l . H 2 e m i s s i o n f r o m E r e b u s v o l c a n o P a g e | 7
estimated CO value was subtracted from the H2 signal to correct for the cross-sensitivity 150
(Figure 3). 151
152
Results 153
Useful data were only acquired during favourable winds that resulted in grounding of the 154
plume at the crater rim (figure 1b). We obtained 25 h of good quality observations at a sample 155
rate of 0.5 Hz over the 180 h of data collection. As well as the variable weather conditions, 156
delays in stabilising the internal temperature of the “Multi-Gas” instrument were also 157
responsible for the limited collection time. It is worth noting that Strombolian eruptions, 158
which are occasionally observed at Erebus (Aster et al. 2003; Dibble et al. 2008), did not 159
occur during the acquisition of this dataset; only the “passive” plume emitted by diffuse 160
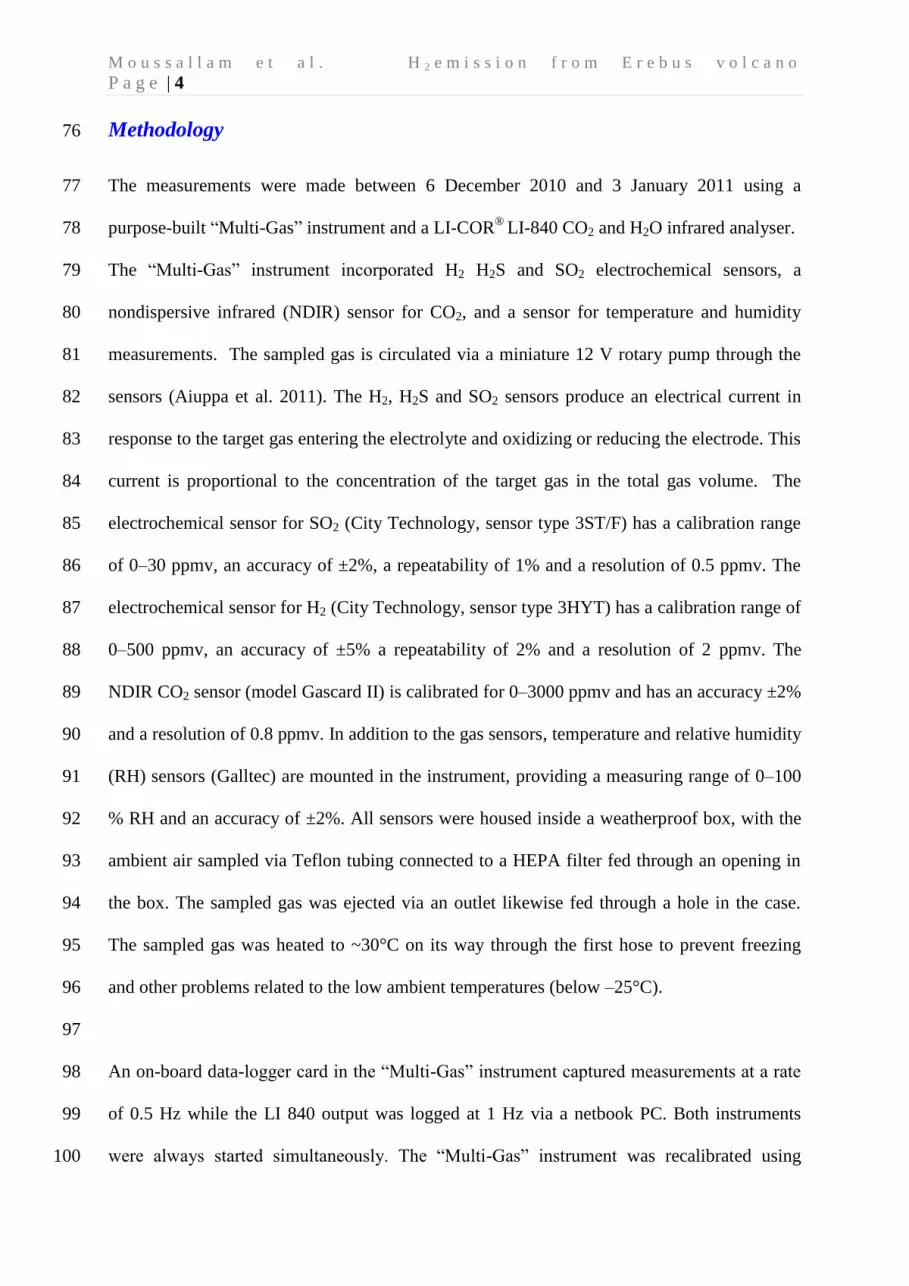
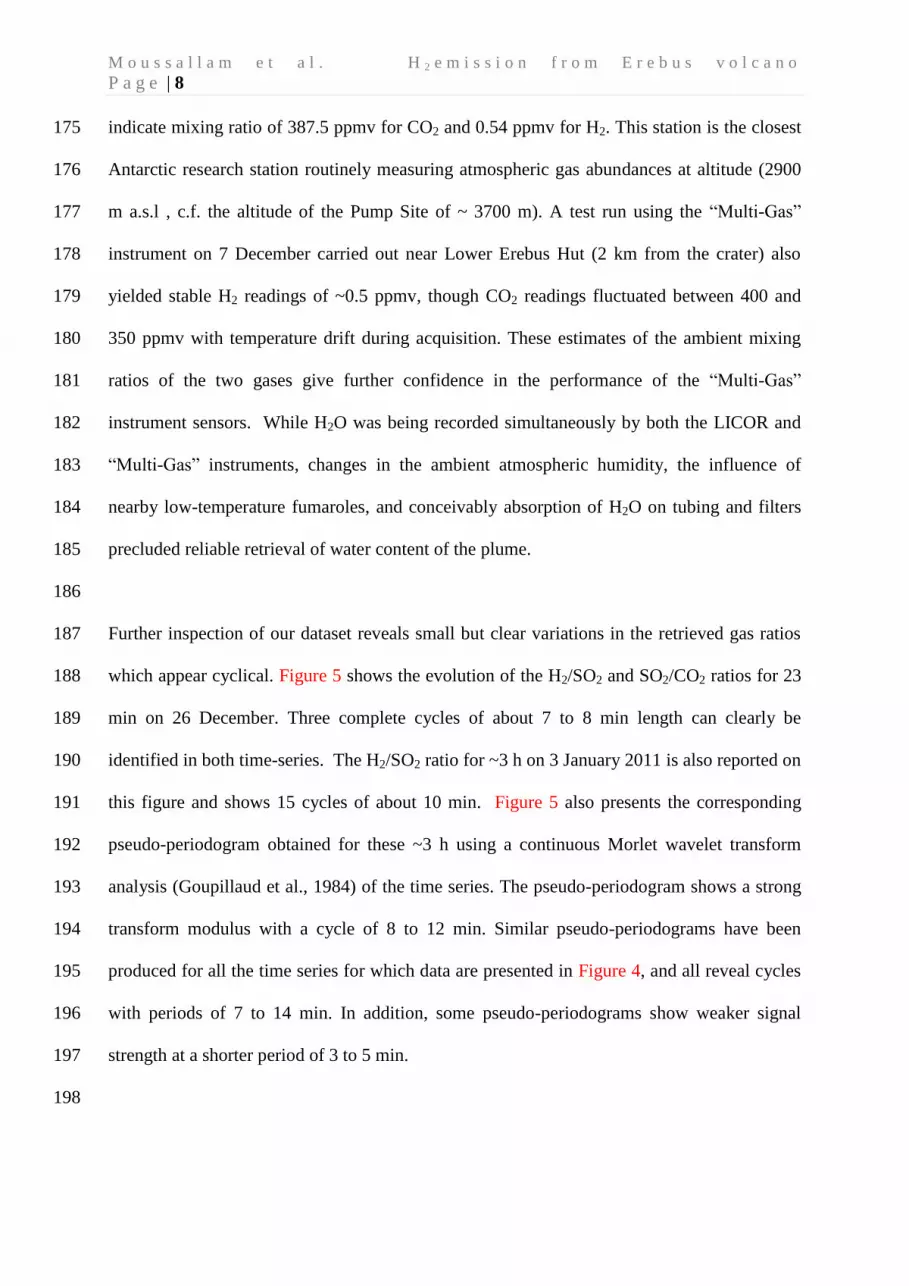
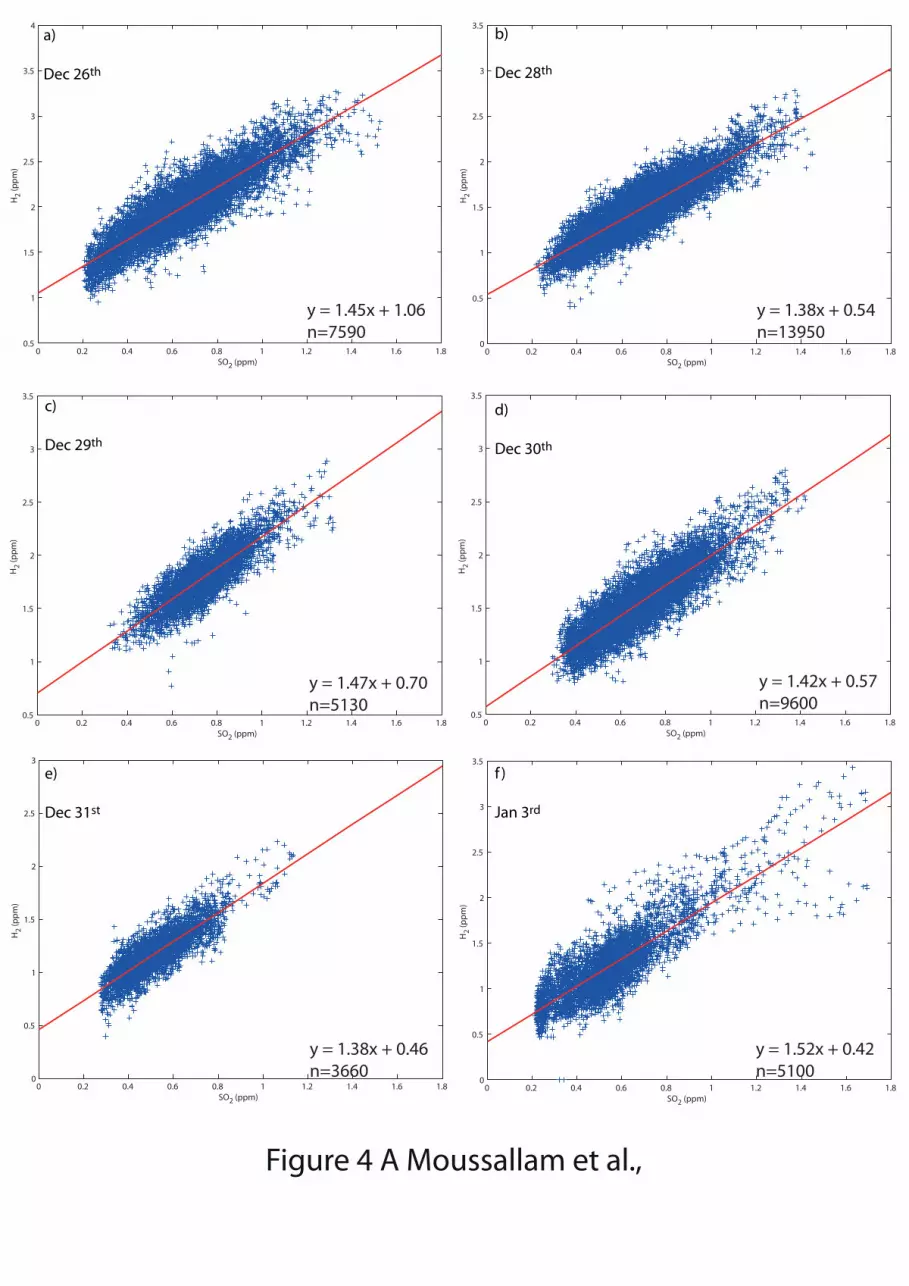
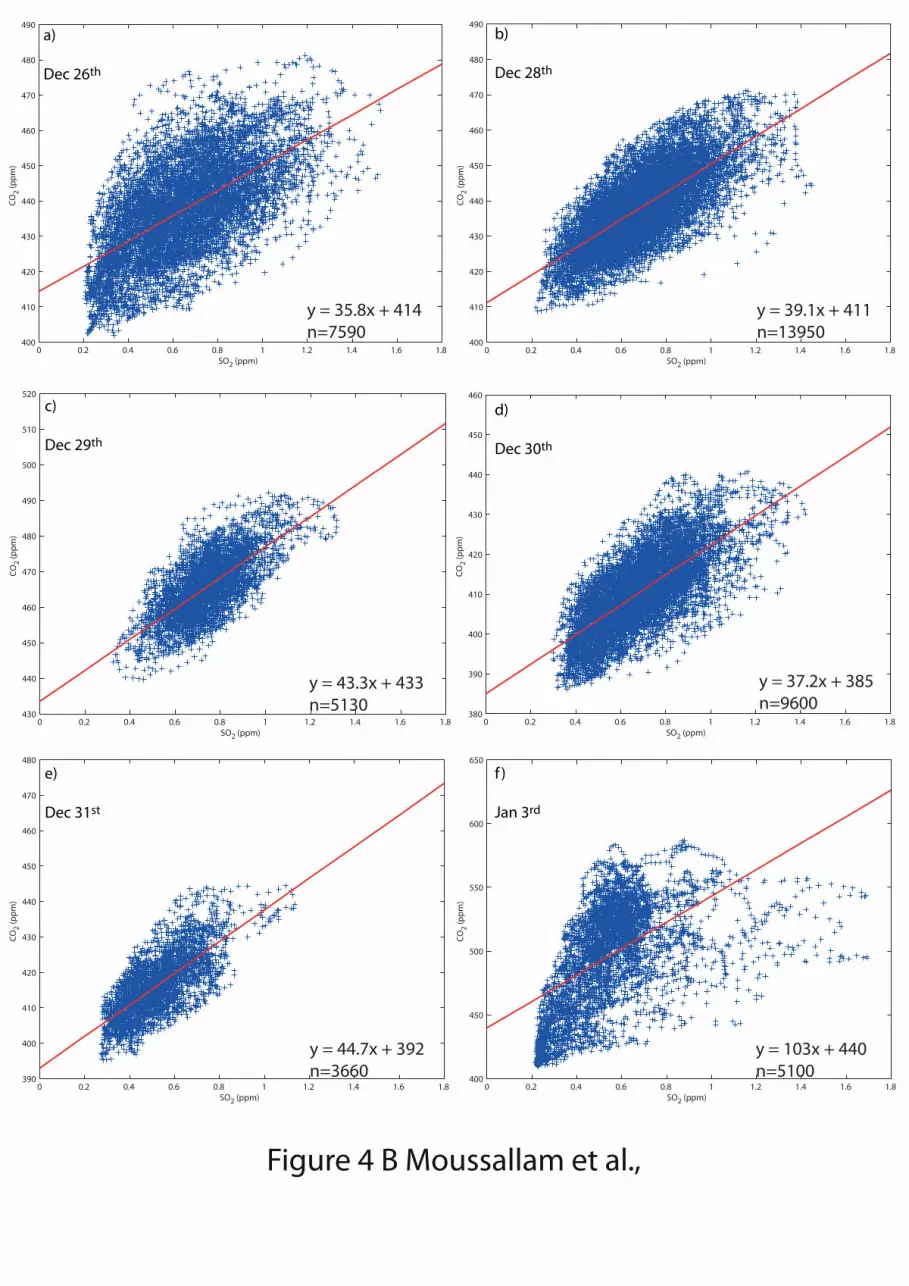
degassing from the lava lake was sampled. Figure 4 shows twelve scatter plots for 161
measurements recorded during the last week of December 2010, which offered the best 162
conditions for plume sampling. Results from six days of data yield a daily mean H2/SO2 molar 163
ratio between 1.38 and 1.52 (Figure 4a) the average ratio for the whole week being 1.44. 164
Scatter plots for the CO2 and SO2 measurements yield CO2/SO2 molar ratios varying between 165
36 and 45 (Figure 4b), with the week’s average being 40. We neglect the CO2/SO2 ratio 166
obtained for 3 January which shows much higher variability, which we ascribe to 167
contamination from nearby fumaroles. The intercept of first order linear regression through 168
the scatter plots of H2 vs. SO2 and CO2 vs. SO2 should correspond to the atmospheric 169
background H2 and CO2 abundances, respectively (since ambient SO2 is very low (less than 170
10 pptv). In fact, we find values for ambient H2 between 1.06 and 0.42 ppmv and background 171
CO2 values between 433 and 385 ppmv. These are both good approximations to expected 172
atmospheric background abundances for the two gases. For instance, measurements from 173
December 2010 at the South Pole weather station (available at http://www.esrl.noaa.gov/) 174
Page 8
M o u s s a l l a m e t a l . H 2 e m i s s i o n f r o m E r e b u s v o l c a n o P a g e | 8
indicate mixing ratio of 387.5 ppmv for CO2 and 0.54 ppmv for H2. This station is the closest 175
Antarctic research station routinely measuring atmospheric gas abundances at altitude (2900 176
m a.s.l , c.f. the altitude of the Pump Site of ~ 3700 m). A test run using the “Multi-Gas” 177
instrument on 7 December carried out near Lower Erebus Hut (2 km from the crater) also 178
yielded stable H2 readings of ~0.5 ppmv, though CO2 readings fluctuated between 400 and 179
350 ppmv with temperature drift during acquisition. These estimates of the ambient mixing 180
ratios of the two gases give further confidence in the performance of the “Multi-Gas” 181
instrument sensors. While H2O was being recorded simultaneously by both the LICOR and 182
“Multi-Gas” instruments, changes in the ambient atmospheric humidity, the influence of 183
nearby low-temperature fumaroles, and conceivably absorption of H2O on tubing and filters 184
precluded reliable retrieval of water content of the plume. 185
186
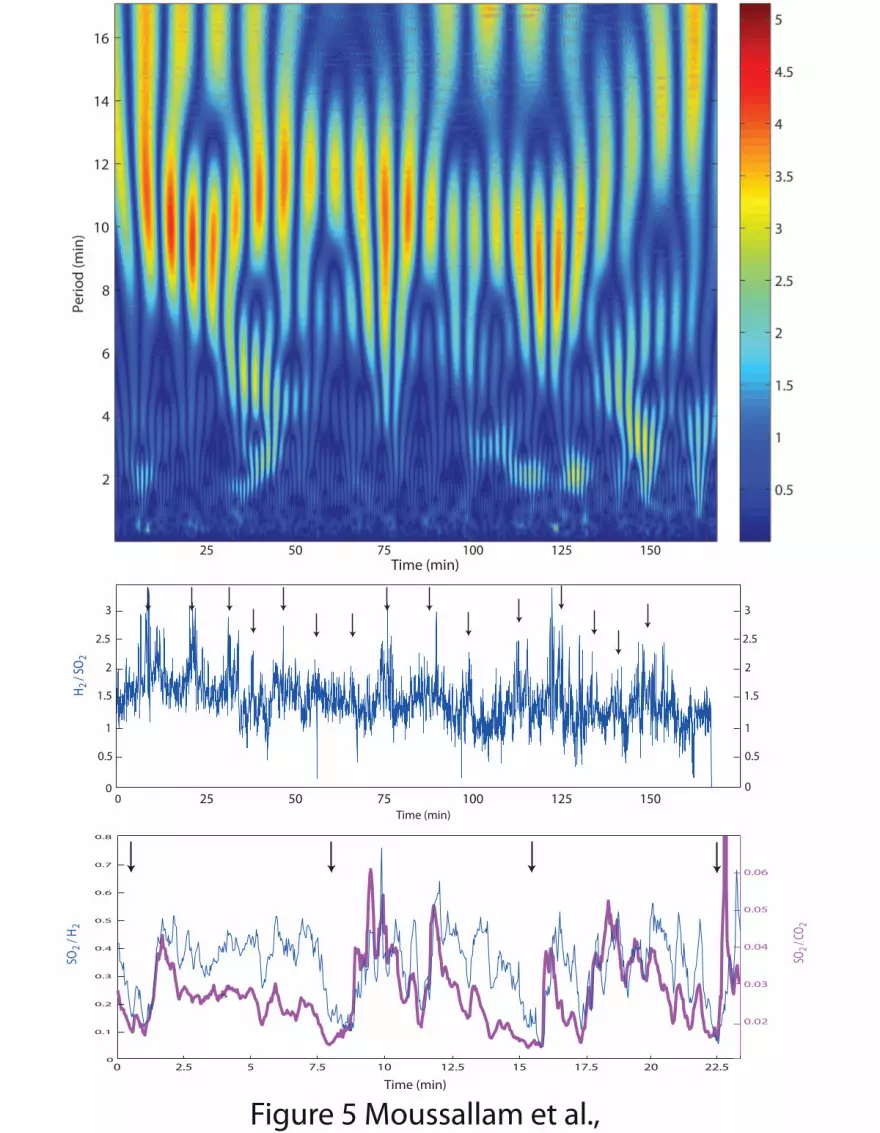
Further inspection of our dataset reveals small but clear variations in the retrieved gas ratios 187
which appear cyclical. Figure 5 shows the evolution of the H2/SO2 and SO2/CO2 ratios for 23 188
min on 26 December. Three complete cycles of about 7 to 8 min length can clearly be 189
identified in both time-series. The H2/SO2 ratio for ~3 h on 3 January 2011 is also reported on 190
this figure and shows 15 cycles of about 10 min. Figure 5 also presents the corresponding 191
pseudo-periodogram obtained for these ~3 h using a continuous Morlet wavelet transform 192
analysis (Goupillaud et al., 1984) of the time series. The pseudo-periodogram shows a strong 193
transform modulus with a cycle of 8 to 12 min. Similar pseudo-periodograms have been 194
produced for all the time series for which data are presented in Figure 4, and all reveal cycles 195
with periods of 7 to 14 min. In addition, some pseudo-periodograms show weaker signal 196
strength at a shorter period of 3 to 5 min. 197
198
Page 9
M o u s s a l l a m e t a l . H 2 e m i s s i o n f r o m E r e b u s v o l c a n o P a g e | 9
Pseudo-periodograms were produced for the CO2/SO2 and CO2/H2 ratio time-series and reveal 199
similar periodicities. The CO2/H2 ratios vary mostly between 20 and 35. Lower and upper 200
extremes are approximately 15 and 50, respectively. The periodicity is noteworthy since it 201
suggests preservation of a source signature despite the passage of the plume within the crater 202
(and the possibility for mixing and homogenization of the time-varying signal), from the lava 203
lake to the Pump Site. Time series of the SO2/H2 and SO2/CO2 ratios were constructed using 204
background H2 and CO2 atmospheric values determined by the intersection of the linear 205
regression with the H2 or CO2-axis for each day (Figure 4) except when that intercept was 206
higher than the lowest measured H2 or CO2 value, in which case this lowest H2 or CO2 value 207
was used as the background. 208
209
Discussion 210
H2 contribution to the Antarctic atmosphere from Erebus 211
We have estimated the H2 flux from Erebus volcano using the time-averaged (over 212
approximately a decade of observations) SO2 flux of 0.71 ± 0.3 kg s-1
(Sweeney et al. 2008) 213
and the measured H2/SO2 ratio. Using our mean H2/SO2 molar ratio of 1.44 (equivalent to a 214
H2/SO2 mass ratio of 0.045) we estimate the mean H2 flux at Erebus volcano as 0.03 kg s-1
215
(2.8 Mg day-1
). Note, however, that the SO2 emission rate itself fluctuates cyclically (from 216
0.17 to 0.89 ± 0.20 kg s-1
in December 2005; Boichu et al., 2010). This estimated H2 flux 217
from Erebus is the largest recorded point source of H2 to the Antarctic atmosphere. The 218
Erebus source amounts to ~1 Gg a-1
of H2 corresponding to 0.004 to 0.02 % of the total global 219
anthropogenic emission (the global anthropogenic emission of H2 from the use of fossil fuels 220
is estimated at 5 to 25 Tg a-1
(Novelli et al. 1999). For comparison the hydrogen flux at Mt 221
Etna has been estimated at ~0.00065 Tg a-1
(Aiuppa et al. 2011). 222
Page 10
M o u s s a l l a m e t a l . H 2 e m i s s i o n f r o m E r e b u s v o l c a n o P a g e | 10
Oxidation state of the Erebus lava lake 223
Based on a mean bulk plume SO2/H2O molar ratio of 0.023 obtained by FTIR spectroscopy 224
(Oppenheimer et al. 2009), we can convert the mean “Multi-Gas”-measured H2/SO2 ratio to 225
an H2/H2O molar ratio of 0.033. From this ratio we can calculate the corresponding oxygen 226
fugacity based on the redox reaction in Equation [1]. 227
K=
(3) 228
229
230
and where fi is the fugacity of the ith
species, γi the fugacity coefficient of the ith
species, Pi is 231
the partial pressure of the ith
species, xi the mole fraction of the ith
species and P is the total 232
gas pressure. 233
This yields: 234
(4) 235
And therefore 236
(5) 237
238
At atmospheric pressure, the fugacity of a gas is equal to its partial pressure (assuming ideal 239
behaviour) therefore γH2O/γH2 = 1. The equilibrium constant was calculated using Maier-Kelly 240
coefficients specific for each species and obtained here from the Supcrt92 software (Johnson 241
et al. 1992). At T = 1273K (the most widely accepted temperature of the lava lake), K= 3.72 x 242
10-8
, the logfO2 is equivalent to ΔQFM = –0.92 (using a H2/SO2 ratio of 1.44, where QFM 243
refers to the quartz-fayalite-magnetite buffer, and where ΔQFM = logfO2 - logfO2 of QFM). 244
Page 11
M o u s s a l l a m e t a l . H 2 e m i s s i o n f r o m E r e b u s v o l c a n o P a g e | 11
Using the obtained oxygen fugacity and prior measurements (Oppenheimer et al. 2009), we 245
can recalculate the composition of the Erebus plume to include H2 and the expected 246
abundance of H2S (Table 1, first column). Note that, in the Table, H2S is estimated based on 247
the gas redox properties calculated using the “Dcompress” software from Burgisser et al. 248
(2008) though it has not been detected at Erebus despite multiple attempts (Oppenheimer and 249
Kyle 2008). 250
The oxidation state of the phonolite magma in the persistent lava lake of Erebus volcano has 251
been estimated by several techniques. Kelly et al. (2008) used mineral chemistry to estimate 252
an oxidation state of ΔQFM = –0.9 using the QUILF program (Andersen et al. 1993) and a 253
temperature of 1000°C. Oppenheimer & Kyle (2008) and Oppenheimer et al. (2011) used the 254
CO2/CO ratio obtained using FTIR spectroscopy (and the same temperature) to estimate the 255
oxidation state at ΔQFM = –0.9 to –0.88. Both of these estimates are essentially identical to 256
our mean ΔQFM = –0.92. It should be noted however that our new estimate of the oxidation 257
state is not entirely independent as we used the SO2/H2O ratio previously measured by FTIR 258
spectroscopy in our calculation. 259
260
The presence of H2 in the volcanic plume suggests that H2 is not burning at the interface 261
between the lava lake and the atmosphere as has been observed, for instance, at Kīlauea’s lava 262
lake (Cruikshank et al. 1973). The correspondence of computed redox conditions for the lava 263
lake also indicates that the H2 abundance at the crater rim corresponds to the high-temperature 264
equilibrium with the lava lake as hypothesized by Martin et al. (2009), and experimentally 265
verified at Etna by Aiuppa et al. (2011). If any H2 is oxidizing in the plume (e.g., to form 266
HOx radicals) it is only in minor amounts. 267
Page 12
M o u s s a l l a m e t a l . H 2 e m i s s i o n f r o m E r e b u s v o l c a n o P a g e | 12
Periodicity and magma supply to the lake 268
From the time-series, the H2/SO2 molar ratio varies mostly between 1 and 2 for all six days 269
while the CO2/SO2 molar ratio varies mostly between 25 and 50. These upper and lower 270
values can be attributed to two end-member compositions associated with a cyclic dynamic 271
behavior of the lake (Table 1). This quasi-periodic behavior has been recognised in the 272
velocity field of the lava lake surface motion, the heat loss of the lava lake, the SO2/CO2 and 273
HCl/CO gas ratios (Oppenheimer et al. 2009), the SO2 flux (Boichu et al. 2010) and lidar 274
observation of the rising and falling lava lake surface (Jones et al. 2010; 2011). All these 275
observations reveal cycles of between roughly 8 and 18 min. These have been interpreted as 276
consequences of an episodic arrival of magma into the lava lake, which exsolves a water-rich 277
end-member gas composition (Oppenheimer et al. 2009; Boichu et al. 2010). 278
279
The terms “top” and “bottom” of the cycle are adopted here to echo the previous literature 280
(Oppenheimer et al. 2009); the “top” of cycle” refers to high SO2/CO2 ratio, faster lake 281
motion and higher lake level, and, as shown in Figure 5, corresponds to high SO2/H2. This 282
composition is calculated using an H2/SO2 molar ratio of 1 and SO2/H2O molar ratio of 283
0.0242 from the “mixed plume” composition of Oppenheimer et al. (2009), which 284
corresponds to measurements during vigorous convection of the lava lake, while the “bottom 285
of cycle” composition is calculated using an H2/SO2 ratio of 2 and SO2/H2O gas ratios of 286
0.0218 from the “conduit gas” composition of Oppenheimer et al. (2009). The difference 287
between the two end-member compositions is quite significant in terms of redox state, 288
representing ΔQFM = -0.65 at the “top of the cycle” and ΔQFM = -1.16 at the “bottom of the 289
cycle”, assuming no change in temperature. 290
Considering that the “tops” of the cycles are marked by increases in lake level, surface motion 291
and SO2 flux, Oppenheimer et al. (2009) and Boichu et al. (2010) suggested that they are 292
Page 13
M o u s s a l l a m e t a l . H 2 e m i s s i o n f r o m E r e b u s v o l c a n o P a g e | 13
associated with the arrival of foaming magma batches in the lava lake (still exsolving water at 293
near atmospheric pressure). We now observe that the “tops” of the cycle are consistently 294
associated with significantly more oxidized conditions (ΔQFM = –0.65) than the “bottoms” of 295
the cycles (ΔQFM = –1.16). This differential pattern in oxidation state is also apparent in 296
subtle cyclic variations in CO2/CO ratio reported in Burgisser et al (2012). If the “top” of the 297
cycles is indeed associated with the influx of rising magma batches, then these batches appear 298
to be releasing gas whose composition is a relic of chemical equilibrium acquired at some 299
depth. This signature may be preserved as a result of rapid ascent of the magma batch (i.e., 300
fast with respect to the kinetics of redox reactions such as [1] and [2]). The dichotomy we 301
identify between the oxidized “top” and reduced “bottom” of the cycles therefore provides 302
further empirical evidence for redox stratification in the Erebus plumbing system as discussed 303
in Oppenheimer et al. (2011) and Burgisser et al. (2012), and as hypothesized from a more 304
general standpoint by Burgisser and Scaillet (2007). 305
306
Conclusion 307
In-situ measurements of the gas plume emitted from the lava lake of Erebus volcano by means 308
of a “Multi-Gas” sensing instrument indicate that the hydrogen abundance in the magmatic 309
gas phase is around 1.6 mol%. These measurements constrain the oxidation state of the lava 310
lake to ΔQFM = –0.9 log units, consistent with previous estimates; provide strong evidence 311
that hydrogen burning is not prevalent at the surface of the lake; and that hydrogen is at least 312
largely kinetically inert in the gas/aerosol plume rising in the crater. The hydrogen flux to the 313
atmosphere from the summit of Erebus is estimated at 2.8 Mg d-1
. A strong ~10 min cyclicity 314
in the proportions of H2 and other species in the plume infers corresponding redox state 315
variations, and points to a pulsatory supply of magma to the the lava lake. The more oxidized 316
Page 14
M o u s s a l l a m e t a l . H 2 e m i s s i o n f r o m E r e b u s v o l c a n o P a g e | 14
signature of the magma episodically entering the lake provides strong empirical evidence of a 317
redox stratification in the shallow plumbing system, as has been hypothesized by previous 318
numerical models. 319
320
Acknowledgments 321
This research was supported by grant ANT-0838817 from the Office of Polar Programs 322
(National Science Foundation), and grant 202844 (“DEMONS”) from the European Research 323
Council (FP7). YM was additionally supported by the University of Cambridge Home and EU 324
Scholarship Scheme, and CO acknowledges funding from the National Centre for Earth 325
Observation (Theme 6: “Dynamic Earth and Geohazards”). We are grateful to Hiroshi 326
Shinohara and Eliza Calder for their constructive reviews of the original work. We also thank 327
Tehnuka Ilanko, Bill McIntosh, Nial Peters and Aaron Curtis for assistance on Erebus. 328
References 329
Aiuppa A, Bertagnini A, Métrich N, Moretti R, Di Muro A, Liuzzo M, Tamburello G (2010) 330
A model of degassing for Stromboli volcano. Earth and Planetary Science Letters 331
295:195-204. doi:16/j.epsl.2010.03.040. 332
Aiuppa A, Burton M, Caltabiano T, Giudice G, Guerrieri S, Liuzzo M, Murè F, Salerno G 333
(2010) Unusually large magmatic CO 2 gas emissions prior to a basaltic paroxysm. 334
Geophys Res Lett 37. doi:10.1029/2010GL043837. 335
Aiuppa A, Federico C, Giudice G, Gurrieri S, Valenza M (2006) Hydrothermal buffering of 336
the SO2/H2S ratio in volcanic gases: Evidence from La Fossa Crater fumarolic field, 337
Vulcano Island. Geophys Res Lett 33:5 PP. doi:200610.1029/2006GL027730. 338
Page 15
M o u s s a l l a m e t a l . H 2 e m i s s i o n f r o m E r e b u s v o l c a n o P a g e | 15
Aiuppa A, Federico C, Giudice G, Gurrieri S (2005) Chemical mapping of a fumarolic field: 339
La Fossa Crater, Vulcano Island (Aeolian Islands, Italy). Geophys Res Lett 32:4 PP. 340
doi:200510.1029/2005GL023207. 341
Aiuppa A, Shinohara H, Tamburello G, Giudice G, Liuzzo M, Moretti R (2011) Hydrogen in 342
the gas plume of an open-vent volcano, Mount Etna, Italy. J Geophys Res 116:8 PP. 343
doi:201110.1029/2011JB008461. 344
Andersen, D. J., D. H. Lindsley, Davidson P. M. (1993) QUILF: A pascal program to assess 345
equilibria among Fe-Mg-Mn-Ti oxides, pyroxenes, olivine, and quartz. Computers & 346
Geosciences, 19:1333–1350, doi:10.1016/0098-3004(93)90033-2. 347
Aster R, Mah S, Kyle P, McIntosh W, Dunbar N, Johnson J, Ruiz M, McNamara S (2003) 348
Very long period oscillations of Mount Erebus Volcano. J Geophys Res 108. 349
doi:10.1029/2002JB002101. 350
Boichu M, Oppenheimer C, Tsanev V, Kyle P. (2010) High temporal resolution SO2 flux 351
measurements at Erebus volcano, Antarctica. Journal of Volcanology and Geothermal 352
Research 190:325-336. doi:10.1016/j.jvolgeores.2009.11.020. 353
Burgisser, A., Alletti, M., Oppenheimer, C. (2012) Inverse modelling of gas chemistry 354
measurements, Goldschmidt Conference, Prague, Czech Republic. 355
Burgisser, A., B. Scaillet, B, Harshvardhan (2008) Chemical patterns of erupting silicic 356
magmas and their influence on the amount of degassing during ascent. J. Geophys. 357
Res., 113:14 PP. doi:200810.1029/2008JB005680. 358
Burgisser A, Scaillet B (2007) Redox evolution of a degassing magma rising to the surface. 359
Nature 445:194-197. 360
Page 16
M o u s s a l l a m e t a l . H 2 e m i s s i o n f r o m E r e b u s v o l c a n o P a g e | 16
Cruikshank DP, Morrison D, Lennon K (1973) Volcanic Gases: Hydrogen Burning at Kilauea 361
Volcano, Hawaii. Science 182:277 -279. doi:10.1126/science.182.4109.277. 362
De Vito S, Massera E, Quercia L, Di Francia G (2007) Analysis of volcanic gases by means 363
of electronic nose. Sensors and Actuators B: Chemical 127:36-41. 364
doi:16/j.snb.2007.07.042. 365
Dibble RR, Kyle PR, Rowe CA (2008) Video and seismic observations of Strombolian 366
eruptions at Erebus volcano, Antarctica. Journal of Volcanology and Geothermal 367
Research 177:619-634. 368
Giggenbach, WF (1987) Redox processes governing the chemistry of fumarolic gas 369
discharges from White Island, New Zealand. Applied Geochemistry 2:143–161. 370
doi:10.1016/0883-2927(87)90030-8 371
Goupillaud, P., A. Grossmann, Morlet J (1984) Cycle-octave and related transforms in 372
seismic signal analysis. Geoexploration 23:85–102. doi:10.1016/0016-7142(84)90025-373
5. 374
Ilyinskaya E, Oppenheimer C, Mather TA, Martin RS, Kyle PR (2010) Size-resolved 375
chemical composition of aerosol emitted by Erebus volcano, Antarctica. Geochem 376
Geophys Geosyst 11. doi:10.1029/2009GC002855. 377
Johnson JW, Oelkers EH, Helgeson HC (1992) SUPCRT92: A software package for 378
calculating the standard molal thermodynamic properties of minerals, gases, aqueous 379
species, and reactions from 1 to 5000 bar and 0 to 1000°C. Computers & Geosciences 380
18:899-947. doi:16/0098-3004(92)90029-Q. 381
Page 17
M o u s s a l l a m e t a l . H 2 e m i s s i o n f r o m E r e b u s v o l c a n o P a g e | 17
Jones, L., Frechette, J., Okal, M., Kyle, P., Oppenheimer, C (2010) Terrestrial laser scanning 382
(TLS) observations of the phonolite lava lake at Erebus volcano. Antarctica. Geol. Soc. 383
Amer. Ann. Meeting, Abstract with Program 42:177. 384
Jones, L., Frechette, J., Okal, M., Kyle, P., Oppenheimer, C (2011) Observing the dynamics 385
of Mount Erebus using a terrestrial-based LiDAR (Abstract). Polar Technology 386
Conference, Albuquerque 24 Mar 2011. http://polartechnologyconference. 387
org/2011_pdf/PTC_2011_Jones.pdf 388
Kelly PJ, Kyle PR, Dunbar NW, Sims KWW (2008) Geochemistry and mineralogy of the 389
phonolite lava lake, Erebus volcano, Antarctica: 1972-2004 and comparison with older 390
lavas. Journal of Volcanology and Geothermal Research 177:589-605. 391
Martin RS, Roberts TJ, Mather TA, Pyle DM (2009) The implications of H2S and H2 kinetic 392
stability in high-T mixtures of magmatic and atmospheric gases for the production of 393
oxidized trace species (e.g., BrO and NOx). Chemical Geology 263:143-150. 394
doi:16/j.chemgeo.2008.12.028. 395
Novelli PC, Lang PM, Masarie KA, Hurst DF, Myers R, Elkins JW (1999) Molecular 396
hydrogen in the troposphere: Global distribution and budget. J Geophys Res 104:444. 397
Oppenheimer C (2010) Ultraviolet Sensing of Volcanic Sulfur Emissions. ELEMENTS 6:87-398
92. doi:<p>10.2113/gselements.6.2.87</p>. 399
Oppenheimer C, Kyle PR (2008) Probing the magma plumbing of Erebus volcano, Antarctica, 400
by open-path FTIR spectroscopy of gas emissions. Journal of Volcanology and 401
Geothermal Research 177:743-754. 402
Page 18
M o u s s a l l a m e t a l . H 2 e m i s s i o n f r o m E r e b u s v o l c a n o P a g e | 18
Oppenheimer C, Kyle PR, Tsanev VI, McGonigle AJS, Mather TA, Sweeney D (2005) Mt. 403
Erebus, the largest point source of NO2 in Antarctica. Atmospheric Environment 404
39:6000-6006. doi:16/j.atmosenv.2005.06.036. 405
Oppenheimer C, Lomakina AS, Kyle PR, Kingsbury NG, Boichu M (2009) Pulsatory magma 406
supply to a phonolite lava lake. Earth and Planetary Science Letters 284:392-398. 407
Oppenheimer C, Moretti R, Kyle PR, Eschenbacher A, Lowenstern JB, Hervig RL, Dunbar 408
NW (2011) Mantle to surface degassing of alkalic magmas at Erebus volcano, 409
Antarctica. Earth Planet Sci Lett 306:261-271. doi:10.1016/j.epsl.2011.04.005. 410
Oppenheimer C, Fischer TP, Scaillet B (in press) Volcanic degassing: process and impact. 411
Treatise on Geochemistry. 412
Shinohara H., Matsushima N., Kazahaya K., Ohwada M. (2011) Magma-hydrothermal system 413
interaction inferred from volcanic gas measurements obtained during 2003-2008 at 414
Meakandake volcano, Hokkaido, Japan. Bull. Volcanol. DOI 10.1007/s00445-011-415
0463-2, 73, 409-421. 416
Shinohara H (2005) A new technique to estimate volcanic gas composition: plume 417
measurements with a portable multi-sensor system. Journal of Volcanology and 418
Geothermal Research 143:319-333. doi:16/j.jvolgeores.2004.12.004. 419
Sweeney D, Kyle PR, Oppenheimer C (2008) Sulfur dioxide emissions and degassing 420
behavior of Erebus volcano, Antarctica. Journal of Volcanology and Geothermal 421
Research 177:725-733. doi:16/j.jvolgeores.2008.01.024. 422
Page 19
M o u s s a l l a m e t a l . H 2 e m i s s i o n f r o m E r e b u s v o l c a n o P a g e | 19
Wardell .J, Kyle PR, Chaffin, C (2004) Carbon dioxide and carbon monoxide emission rates 423
from an alkaline intra-plate volcano: Mt. Erebus, Antarctica. Journal of Volcanology 424
and Geothermal Research 131:109-121. doi:10.1016/S0377-0273(03)00320-2 425
Zreda-Gostynska G, Kyle P., Finnegan D, Prestbo K. (1997) Volcanic gas emissions from 426
Mount Erebus and their impact on the Antarctic environment. J Geophys Res 102:055. 427
428
Tables 429
Table 1: Estimated composition of the Erebus plume in mol% and molecular ratios for given 430
species pairs. 431
432
Figures 433
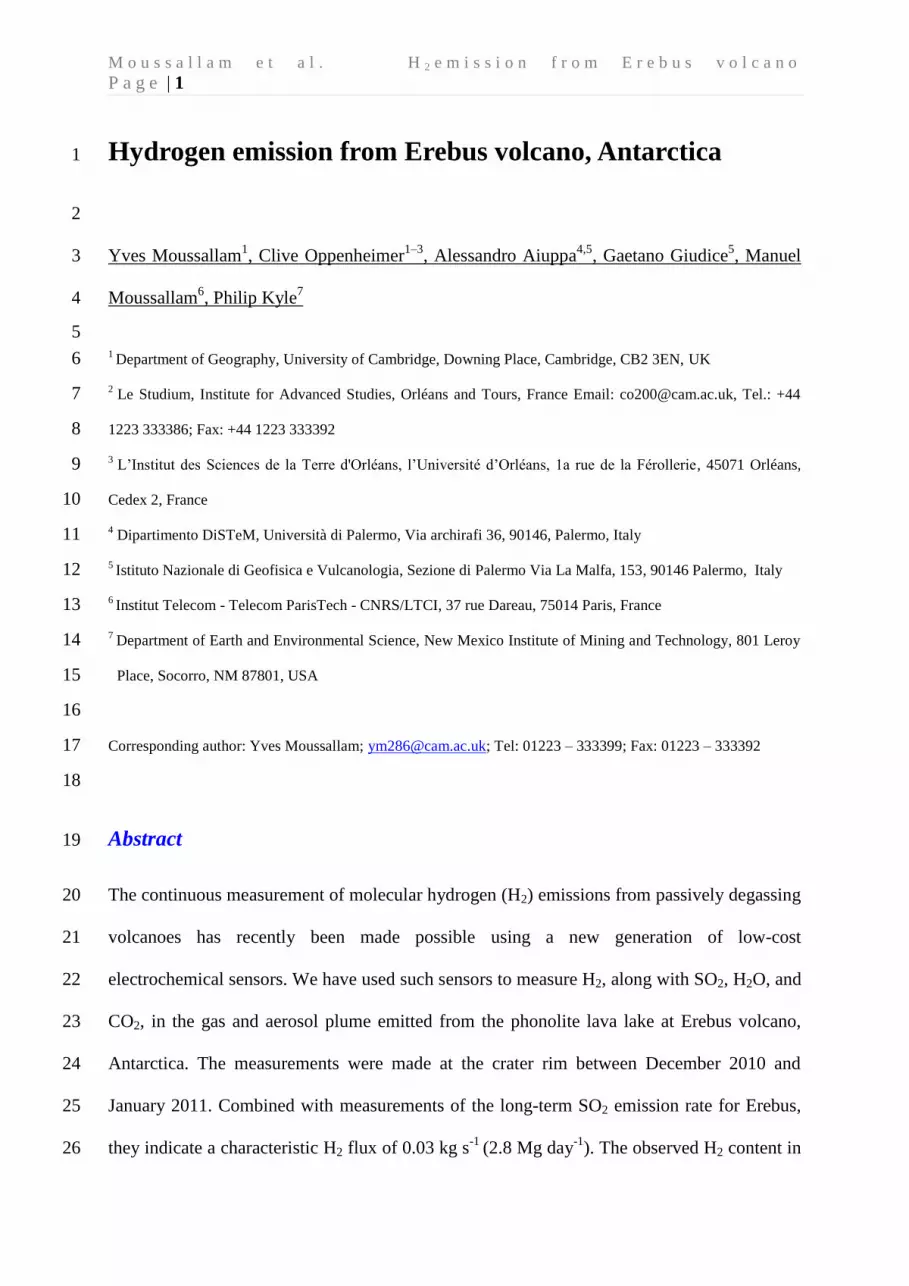
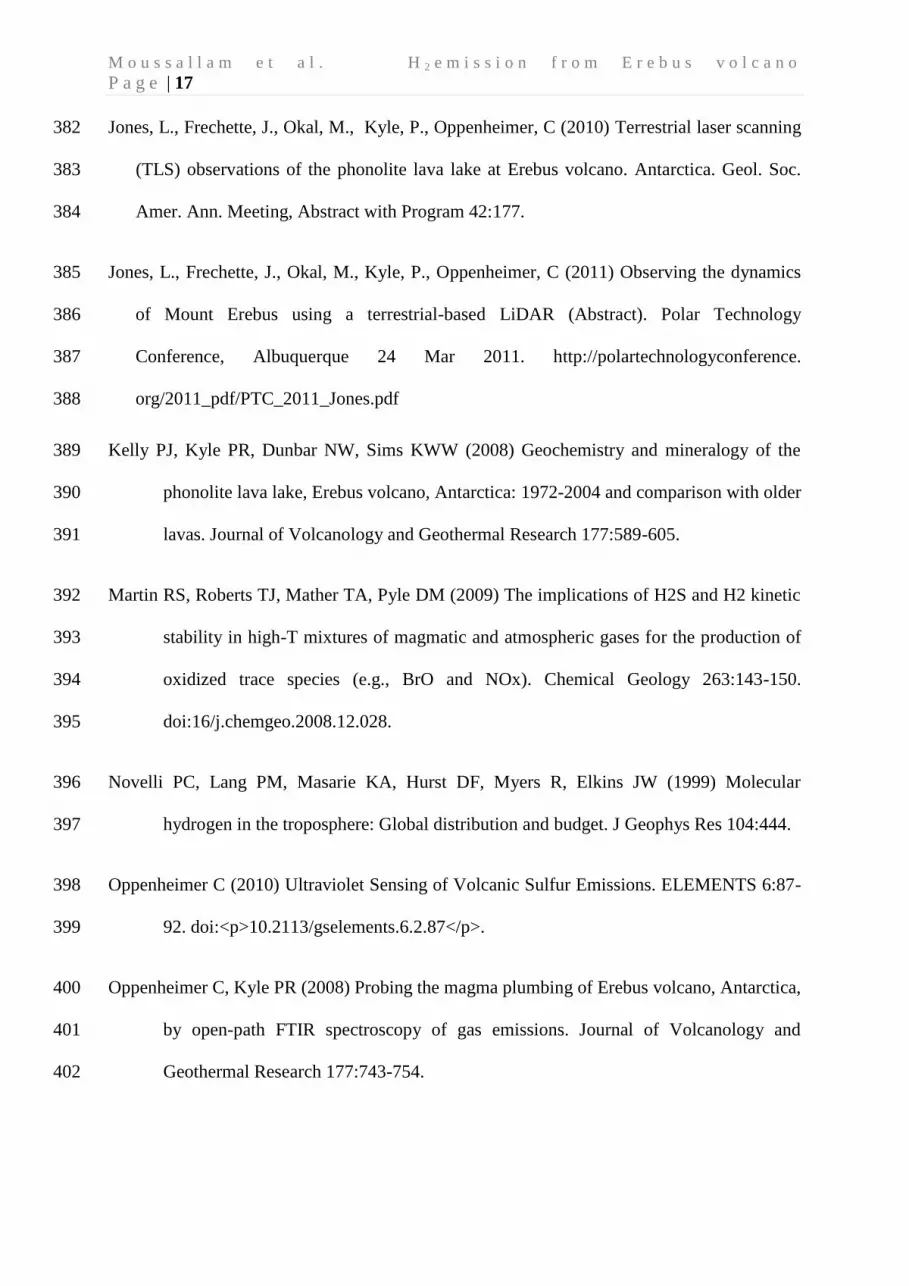
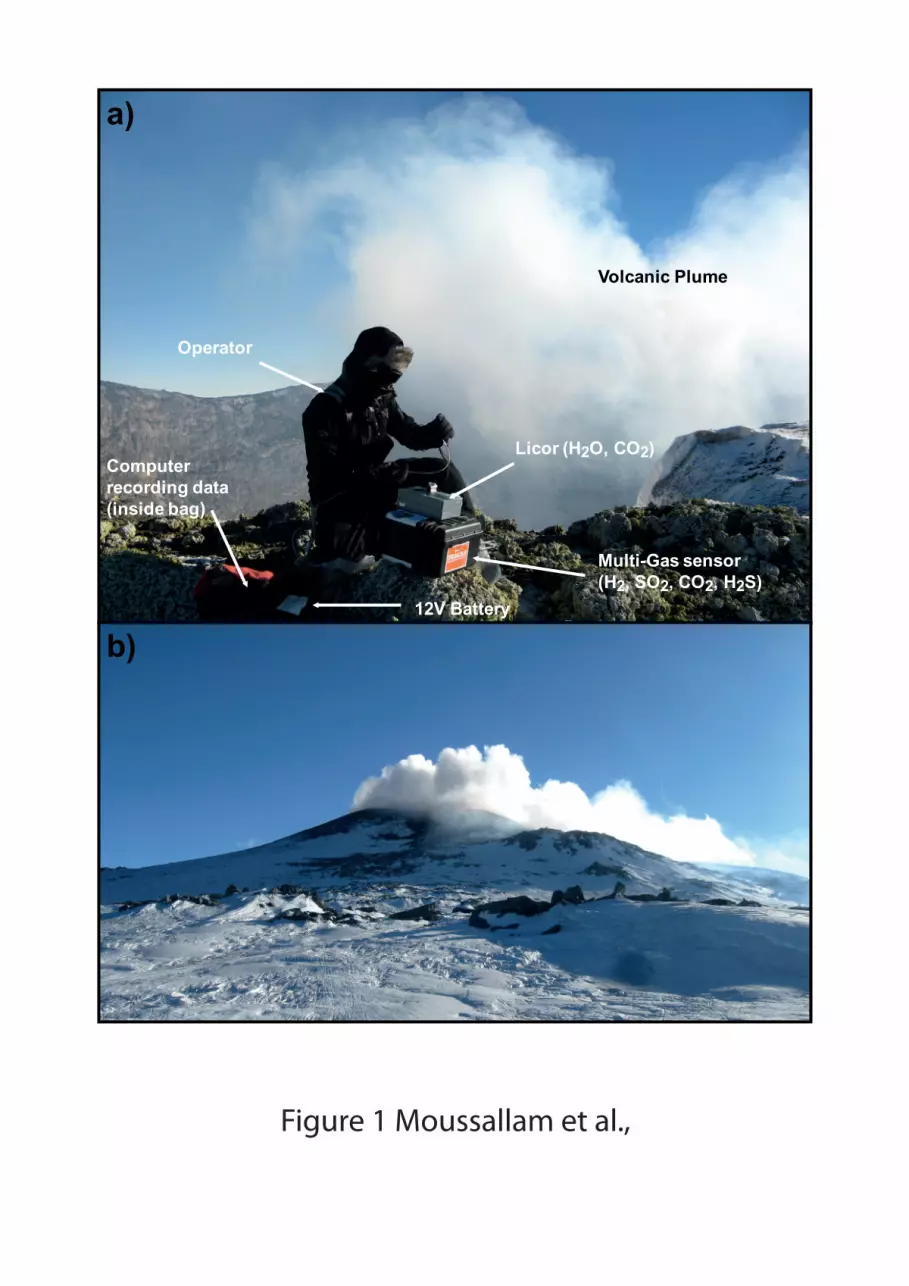
Figure 1: a) Typical field operating conditions during deployment of the LI 840 and “Multi-434
Gas” sensor at the crater rim. Gases are pumped through both instruments via narrow hoses 435
connected to particle filters. b) View of Erebus (looking north) during ideal plume sampling 436
conditions on 26 December 2010. Turbulent airflow resulted in grounding of the plume at the 437
sampling site. 438
439
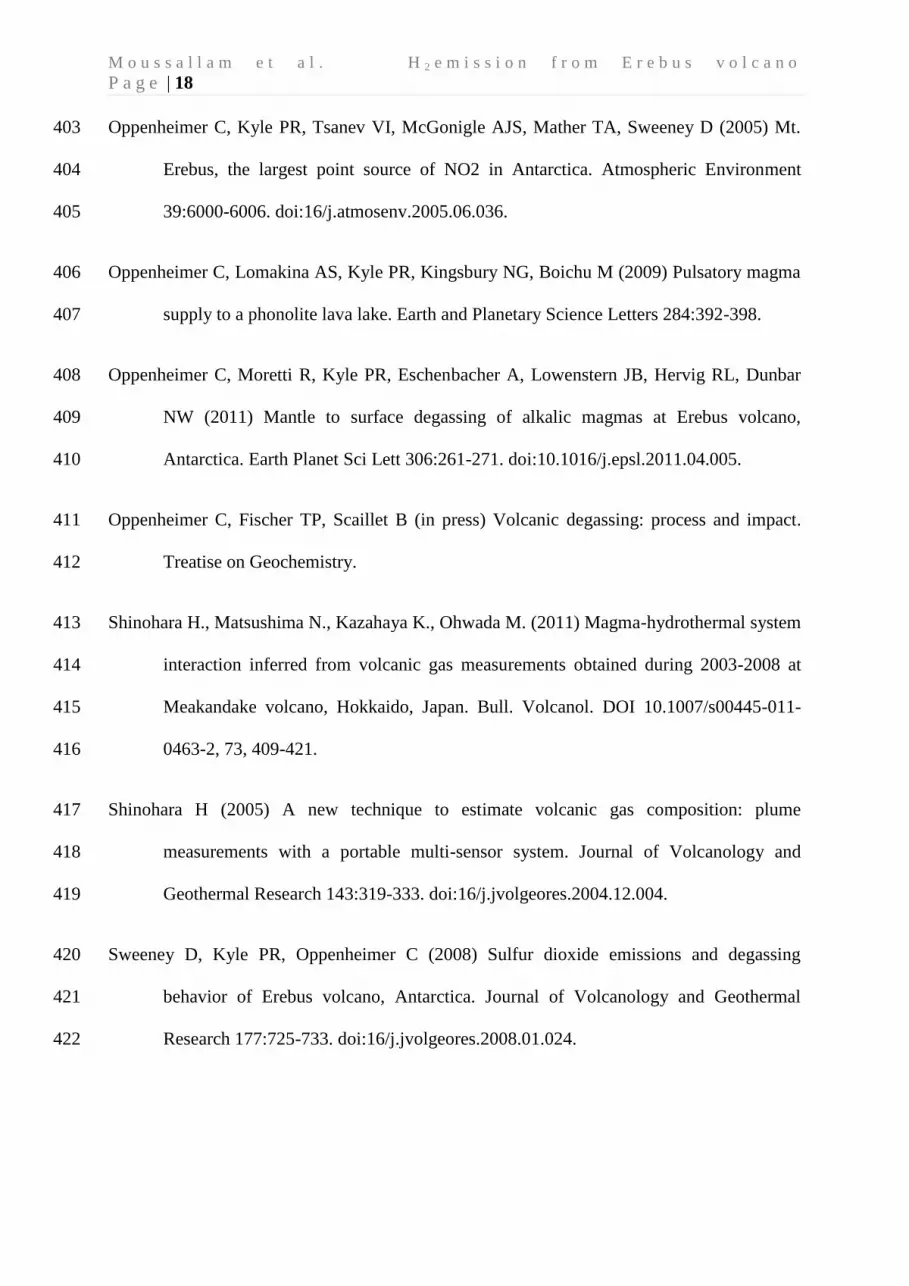
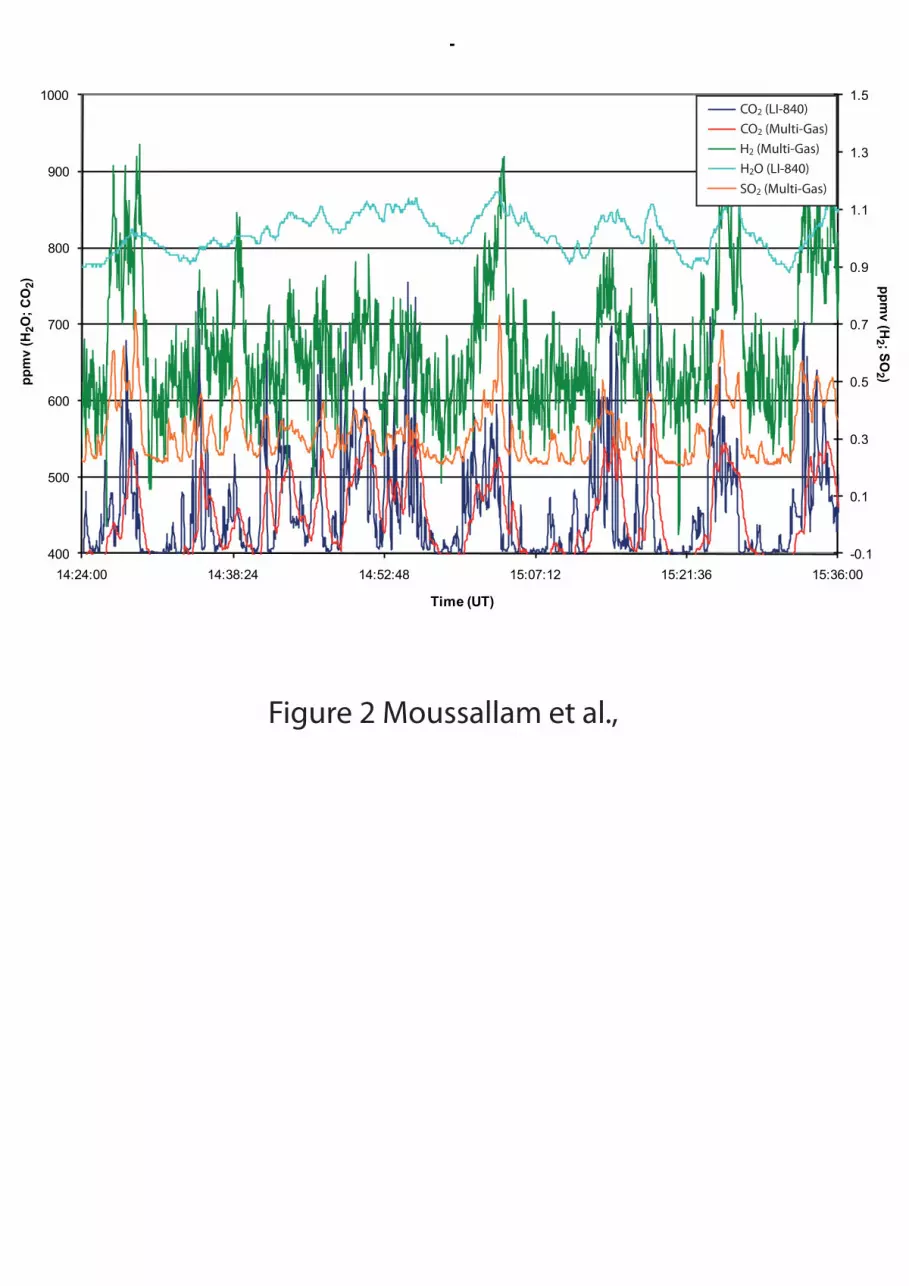
Figure 2: Example of time series for gas mixing ratios obtained from both instruments (the 440
“Multi-Gas” instrument and LI 840). This 1-h-long time series is an extract from a 10-h-long 441
run acquired at the crater rim on 27 December 2010. All gas abundances are reported in 442
ppmv. 443
444
Page 20
M o u s s a l l a m e t a l . H 2 e m i s s i o n f r o m E r e b u s v o l c a n o P a g e | 20
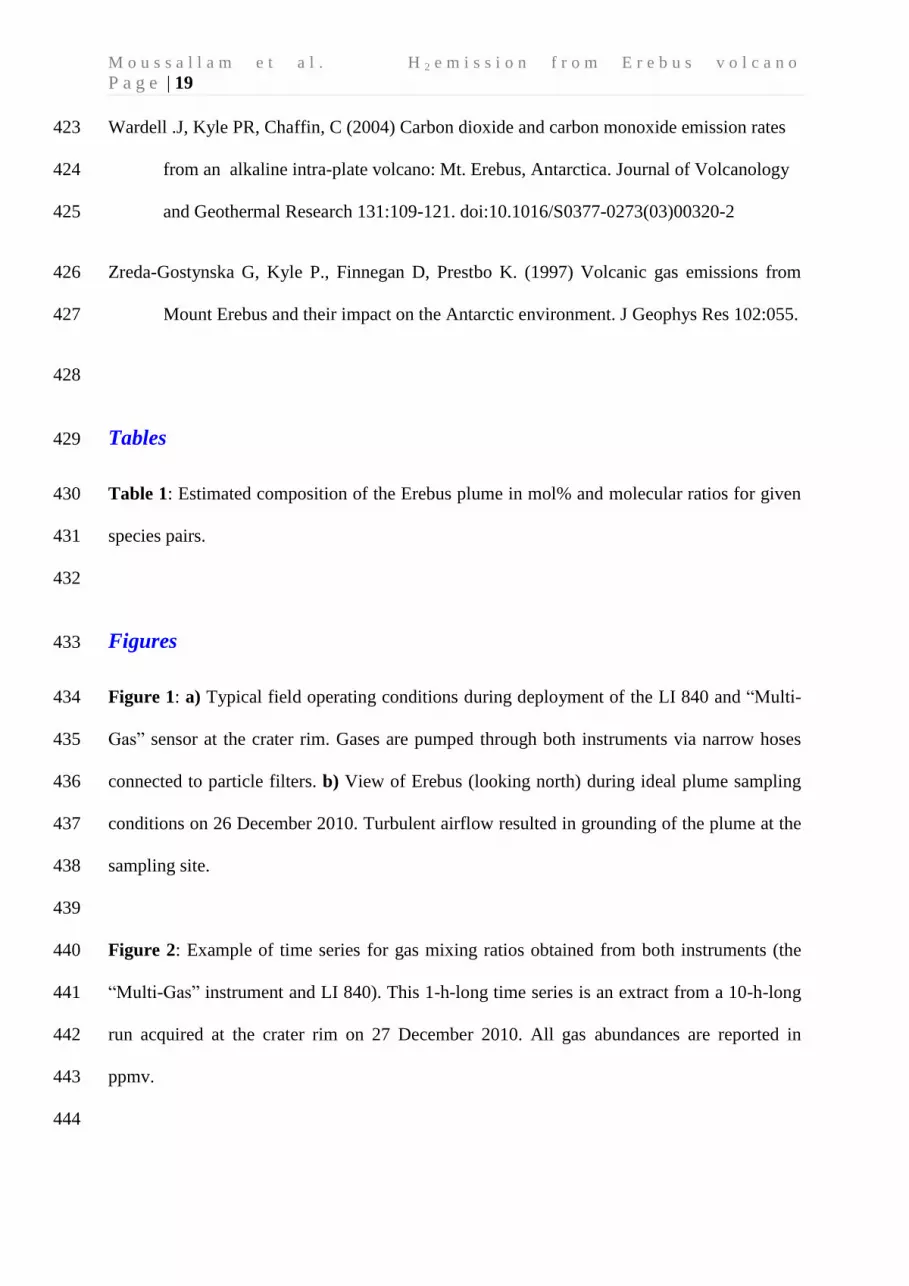
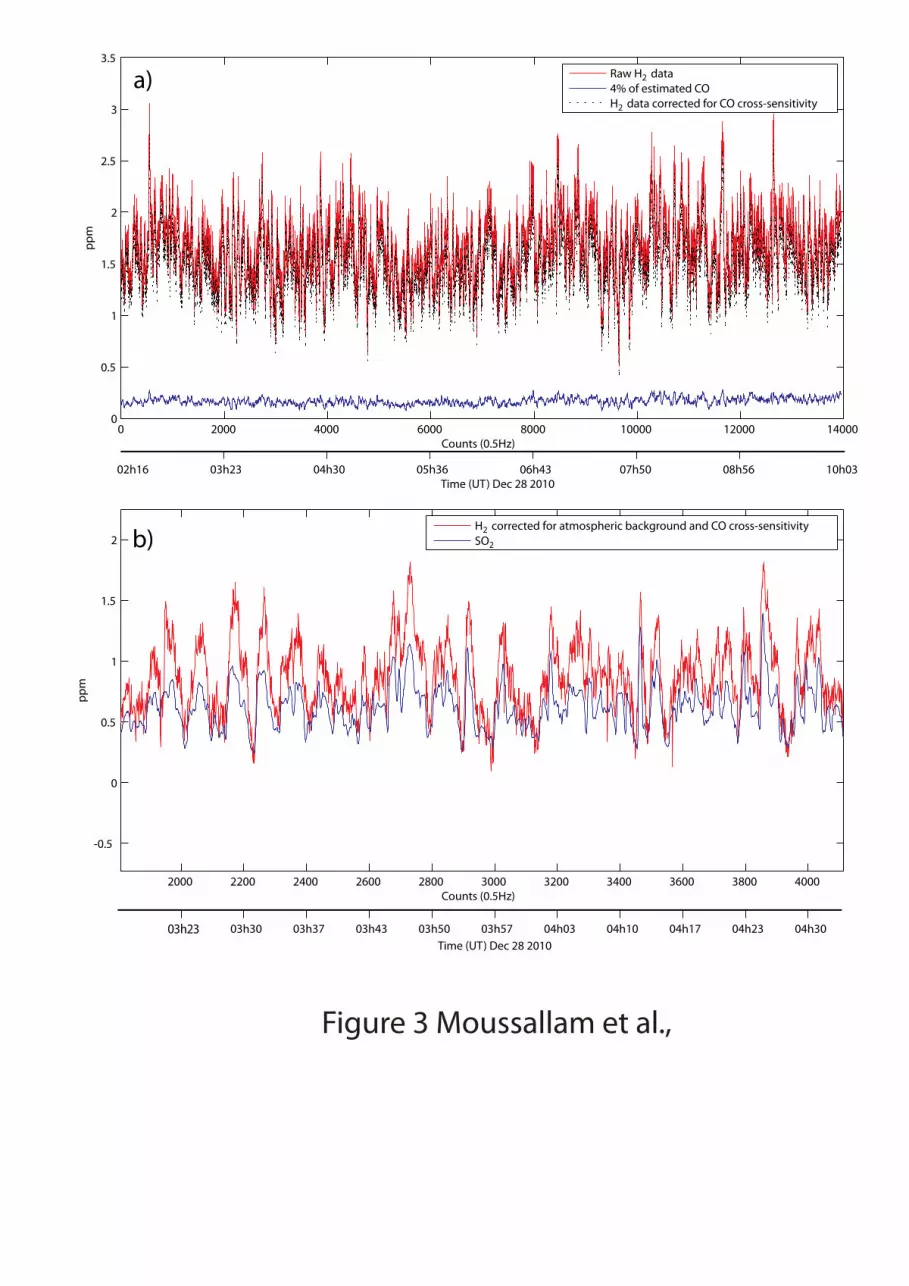
Figure 3: a) Raw (red trace) and corrected (dashed trace) time series for H2. The corrected 445
time-series is obtained by estimating the signal that would be due to presence of CO in the 446
plume (blue trace). The abundance of CO has been estimated from the corresponding 447
Gascard II CO2 time-series, from which a constant background atmospheric value of 387.5 448
ppmv has been subtracted, and a CO2/CO molar ratio of 13 (from Oppenheimer et al. 2009). 449
b) H2 and SO2 time series after correction for atmospheric background H2 and CO cross-450
sensitivity and after alignment of both times series using an offset calculated from the 451
maximum correlation factor between the time series. 452
453
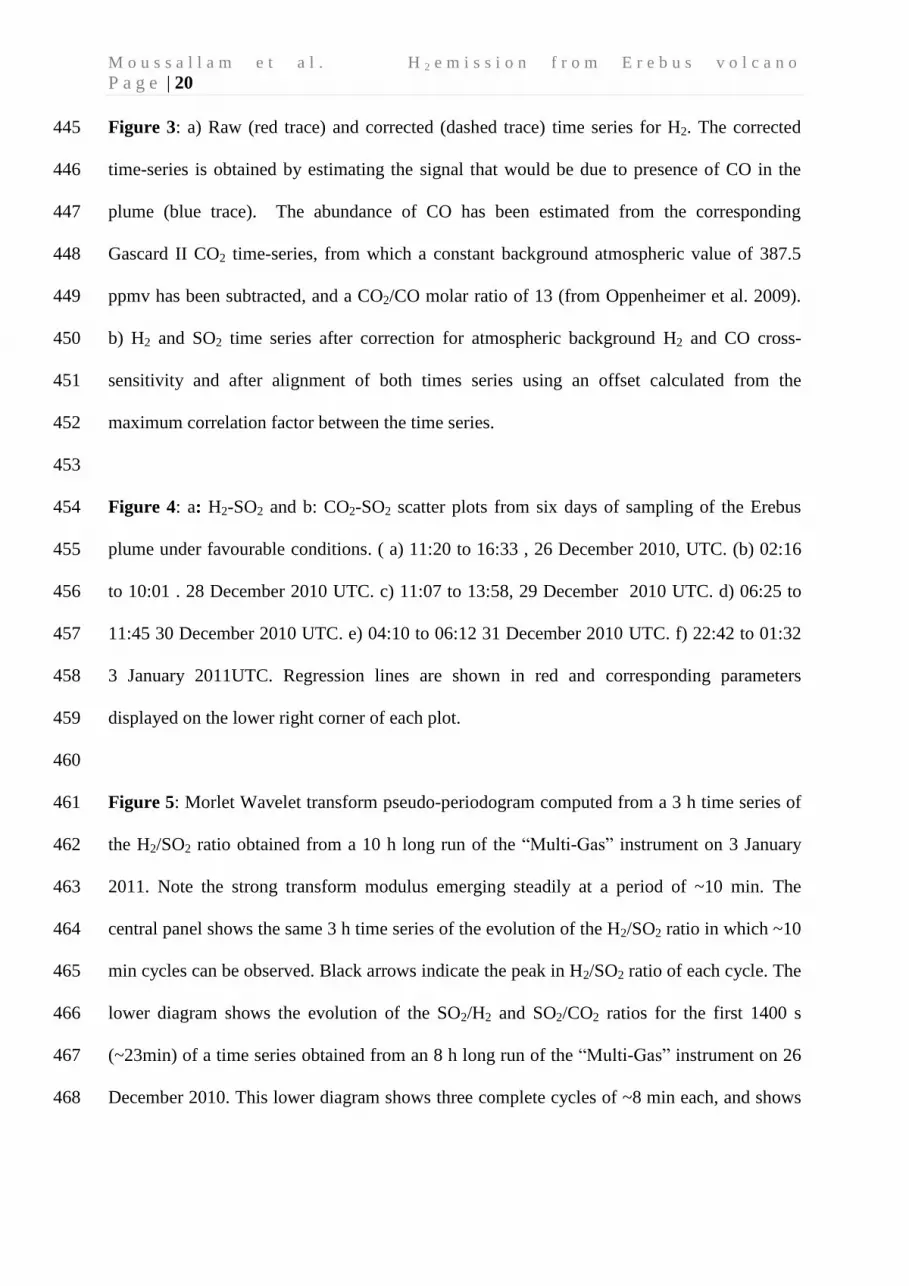
Figure 4: a: H2-SO2 and b: CO2-SO2 scatter plots from six days of sampling of the Erebus 454
plume under favourable conditions. ( a) 11:20 to 16:33 , 26 December 2010, UTC. (b) 02:16 455
to 10:01 . 28 December 2010 UTC. c) 11:07 to 13:58, 29 December 2010 UTC. d) 06:25 to 456
11:45 30 December 2010 UTC. e) 04:10 to 06:12 31 December 2010 UTC. f) 22:42 to 01:32 457
3 January 2011UTC. Regression lines are shown in red and corresponding parameters 458
displayed on the lower right corner of each plot. 459
460
Figure 5: Morlet Wavelet transform pseudo-periodogram computed from a 3 h time series of 461
the H2/SO2 ratio obtained from a 10 h long run of the “Multi-Gas” instrument on 3 January 462
2011. Note the strong transform modulus emerging steadily at a period of ~10 min. The 463
central panel shows the same 3 h time series of the evolution of the H2/SO2 ratio in which ~10 464
min cycles can be observed. Black arrows indicate the peak in H2/SO2 ratio of each cycle. The 465
lower diagram shows the evolution of the SO2/H2 and SO2/CO2 ratios for the first 1400 s 466
(~23min) of a time series obtained from an 8 h long run of the “Multi-Gas” instrument on 26 467
December 2010. This lower diagram shows three complete cycles of ~8 min each, and shows 468
Page 21
M o u s s a l l a m e t a l . H 2 e m i s s i o n f r o m E r e b u s v o l c a n o P a g e | 21
reasonably clearly that SO2/H2 follows SO2/CO2. Black arrows indicate peak in H2/SO2 ratio 469
of each cycle. 470
Page 22
mol%
Mean Top of cycle Bottom of
cycle
CO2 44.00 34.86 47.25
H2O 47.84 57.62 43.37
SO2 1.10 1.39 0.94
CO 3.30 2.61 3.54
HCl 0.46 0.56 0.42
HF 1.16 1.39 1.05
H2 1.58 1.39 1.89
OCS 0.01 0.01 0.01
H2S 0.55 0.16 1.53
mol/mol
CO2/CO 13.33 13.33 13.33
SO2/H2O 0.02 0.02 0.02
H2/SO2 1.44 1.00 2.00
CO2/SO2 40.00 25.00 50.00
SO2/H2S 2.01 8.72 0.62
log(fO2) at 1000°C -11.90 -11.63 -12.14
Delta QFM -0.92 -0.65 -1.16
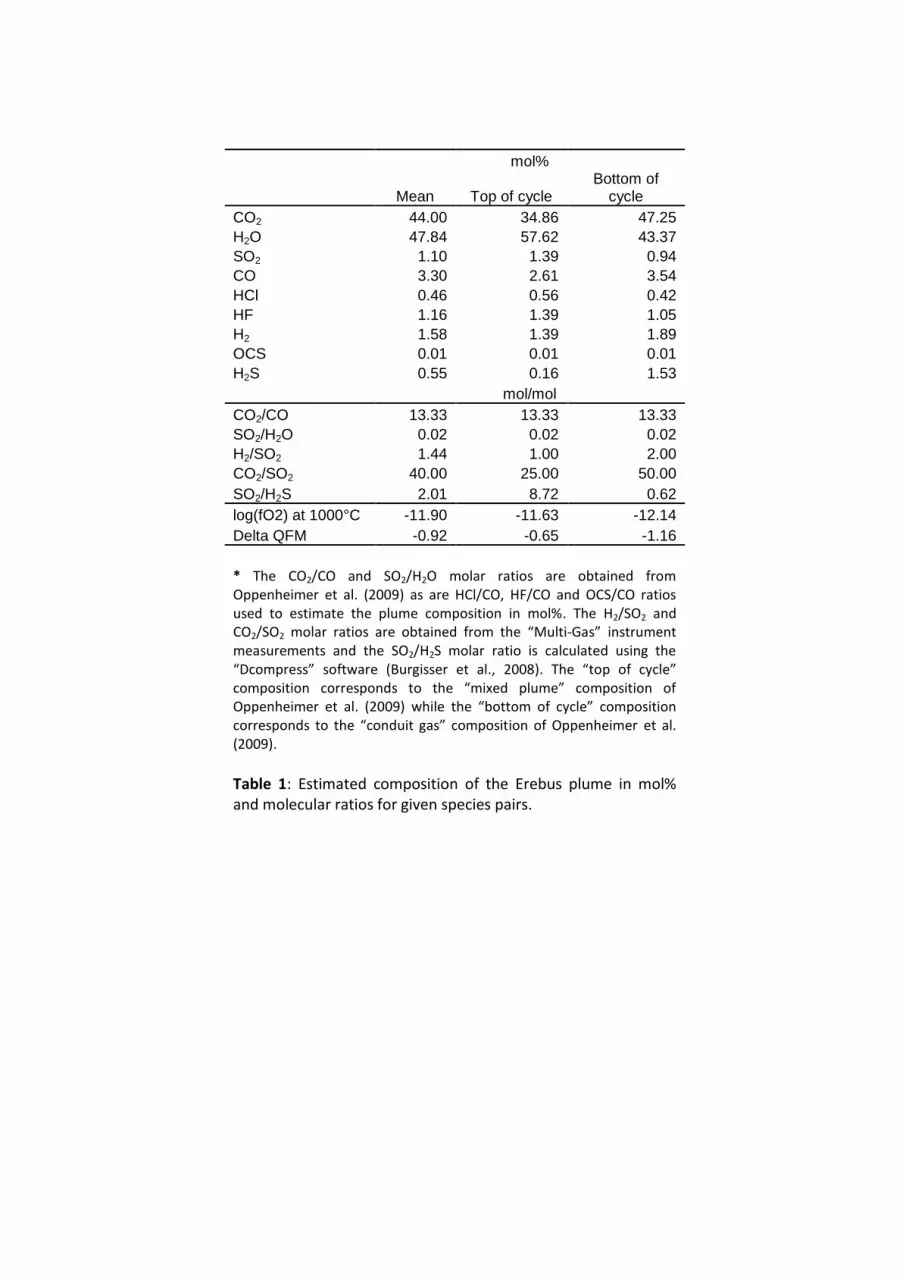
* The CO2/CO and SO2/H2O molar ratios are obtained from Oppenheimer et al. (2009) as are HCl/CO, HF/CO and OCS/CO ratios used to estimate the plume composition in mol%. The H2/SO2 and CO2/SO2 molar ratios are obtained from the “Multi-Gas” instrument measurements and the SO2/H2S molar ratio is calculated using the “Dcompress” software (Burgisser et al., 2008). The “top of cycle” composition corresponds to the “mixed plume” composition of Oppenheimer et al. (2009) while the “bottom of cycle” composition corresponds to the “conduit gas” composition of Oppenheimer et al. (2009).
Table 1: Estimated composition of the Erebus plume in mol% and molecular ratios for given species pairs.
Page 23
12V Battery
Multi-Gas sensor(H2, SO2, CO2, H2S)
Licor (H2O, CO2)Computerrecording data (inside bag)
Operator
Volcanic Plume
a)
b)
Figure 1 Moussallam et al.,
Page 24
Time (UT)
-0.1
0.1
0.3
0.5
0.7
0.9
1.1
1.3
1.5
400
500
600
700
800
900
1000
14:24:00 14:38:24 14:52:48 15:07:12 15:21:36 15:36:00
-
CO2 (LI-840)CO2 (Multi-Gas)H2 (Multi-Gas)H2O (LI-840)SO2 (Multi-Gas)
Figure 2 Moussallam et al.,
ppmv (H
2 ; SO2 )pp
mv
(H2O
; CO
2)
Page 25
2000 2200 2400 2600 2800 3000 3200 3400 3600 3800 4000
-0.5
0
0.5
1
1.5
2
Counts (0.5Hz)
ppm
H2 corrected for atmospheric background and CO cross-sensitivitySO2
Time (UT) Dec 28 201003h23 03h30 03h37 03h43 03h50 03h57 04h03 04h10 04h17 04h23 04h30
0 2000 4000 6000 8000 10000 12000 140000
0.5
1
1.5
2
2.5
3
3.5
Counts (0.5Hz)
ppm
Raw H2 data4% of estimated COH2 data corrected for CO cross-sensitivity
02h16 03h23 04h30 05h36 06h43 07h50 08h56 10h03Time (UT) Dec 28 2010
a)
b)
Figure 3 Moussallam et al.,
Page 26
0 0.2 0.4 0.6 0.8 1 1.2 1.4 1.6 1.80
0.5
1
1.5
2
2.5
3
3.5
SO2 (ppm)
H2 (p
pm)
0 0.2 0.4 0.6 0.8 1 1.2 1.4 1.6 1.80.5
1
1.5
2
2.5
3
3.5
SO2 (ppm)
H2 (p
pm)
0 0.2 0.4 0.6 0.8 1 1.2 1.4 1.6 1.80.5
1
1.5
2
2.5
3
3.5
4
SO2 (ppm)
H2 (p
pm)
0 0.2 0.4 0.6 0.8 1 1.2 1.4 1.6 1.80.5
1
1.5
2
2.5
3
3.5
SO2 (ppm)
H2 (p
pm)
0 0.2 0.4 0.6 0.8 1 1.2 1.4 1.6 1.80
0.5
1
1.5
2
2.5
3
SO2 (ppm)
H2 (p
pm)
0 0.2 0.4 0.6 0.8 1 1.2 1.4 1.6 1.80
0.5
1
1.5
2
2.5
3
3.5
SO2 (ppm)
H2 (p
pm)
a)
Dec 26th
b)
Dec 28th
c)
Dec 29th
d)
Dec 30th
e)
Dec 31st
f )
Jan 3rd
Figure 4 A Moussallam et al.,
y = 1.52x + 0.42n=5100
y = 1.38x + 0.46n=3660
y = 1.42x + 0.57n=9600
y = 1.45x + 1.06n=7590
y = 1.47x + 0.70n=5130
y = 1.38x + 0.54n=13950
Page 27
0 0.2 0.4 0.6 0.8 1 1.2 1.4 1.6 1.8400
410
420
430
440
450
460
470
480
490
SO2 (ppm)
CO2 (p
pm)
0 0.2 0.4 0.6 0.8 1 1.2 1.4 1.6 1.8400
410
420
430
440
450
460
470
480
490
SO2 (ppm)
CO2 (p
pm)
0 0.2 0.4 0.6 0.8 1 1.2 1.4 1.6 1.8430
440
450
460
470
480
490
500
510
520
SO2 (ppm)
CO2 (p
pm)
0 0.2 0.4 0.6 0.8 1 1.2 1.4 1.6 1.8380
390
400
410
420
430
440
450
460
SO2 (ppm)
CO2 (p
pm)
0 0.2 0.4 0.6 0.8 1 1.2 1.4 1.6 1.8390
400
410
420
430
440
450
460
470
480
SO2 (ppm)
CO2 (p
pm)
0 0.2 0.4 0.6 0.8 1 1.2 1.4 1.6 1.8400
450
500
550
600
650
SO2 (ppm)
CO2 (p
pm)
a)
Dec 26th
b)
Dec 28th
c)
Dec 29th
d)
Dec 30th
e)
Dec 31st
f )
Jan 3rd
Figure 4 B Moussallam et al.,
y = 103x + 440n=5100
y = 44.7x + 392n=3660
y = 37.2x + 385n=9600
y = 35.8x + 414n=7590
y = 43.3x + 433n=5130
y = 39.1x + 411n=13950
Page 28
Figure 5 Moussallam et al., Time (min)
2
0
1
H 2 /
SO 2
SO 2 /
H 2
SO 2 / C
O 2
0.02
0.03
0.04
0.05
0.06
0
0.1
0.2
0.3
0.4
0.5
0.6
0.7
0.8
5
3
2
1
0
0 1052.5 7.5 201512.5 17.5 22.5
2.5
1.5
0.5
3
2
1
2.5
1.5
0.5
0
Time (min)
Time (min)
1000 5025 75 150125
1005025 75 150125