The load separation and r/p, development in precracked specimen test records
M . H . S H A R O B E A M * a n d J .D. L A N D E S University of Tenessee, Knoxville, Tennessee 37996-2030, USA; *Present address: Stockton State College, Pomona, New Jersey 08240-9988, USA
Received 15 June 1990; accepted in revised form 18 August 1992
Abstract: Load separation is the theoretical basis for the single specimen J form and the incremental calculation of J-R and J~rR curves. It is based on the assumption that the load can be represented as a multiplication of two separate functions; a crack geometry function and a material deformation function. Until recently, the main experimental basis for such an assumption was the approximate agreement between the experimental results of the single specimen J form and the energy rate interpretation of J in blunt notched bending geometries. The load separation assumption has been also implied in the growing crack records in order to develop the R-curve analysis. Both the crack geometry and material deformation functions were assumed to maintain their forms as the crack grows. Recently, an experimental study investigated the load separation in the test records of stationary crack specimens of different geometry, material, and constraint. The study showed that the load can be represented by a separable form for the entire plastic region except for a limited region at the early region of plastic behavior. Also, it was found that the load separation is not limited to a certain geometry, material, or constraint but it is a dominant property in the ductile fracture behavior of stationary crack specimens. The study also showed that the crack geometry function is a power law function. Hence r/pt is a constant equal to the power law exponent of the geometry function.
The objective of this study is to investigate the extension of load separation to growing crack records. Sets of test records from three different materials are used in this study. For each material three or four precracked specimen test records and one blunt notched record are analyzed for the compact specimen geometry. The study will discuss the main condition to have a separable behavior in a growing crack test record. It will also construct the geometry and deformation functions for the materials studied, these functions are compared with those obtained from stationary crack records.
1. Introduction
T h e a s s u m p t i o n o f the l o a d s e p a r a t i o n is as ear ly as J itself. In 1971, Rice et al. [1] p ro -
p o s e d tha t the l o a d - d i s p l a c e m e n t r e l a t i onsh ip for deep ly c r acked b e n d spec imen can be rep-
r e sen ted as
0 = F ( M / b 2), ( la )
whe re M is b e n d i n g m o m e n t , b is u n c r a c k e d l igament , a n d 0 is r o t a t i o n due to c rack presence.
Th is form, ( la) , can be r ewr i t t en as
M -= G(b). f(O), ( lb)
where G(b) and f (O) can be def ined as g e o m e t r y and d e f o r m a t i o n funct ions . Th is s epa rab le f o r m
( lb ) y ie lded the first s ingle s p e c i m e n d e f o r m a t i o n f o r m as J
A J = 2 ~ , (2)
214 M.H. Sharobeam and J.D. Landes
where A is the area under the test record M - 0. This form allowed the evaluation of J from a single bend specimen test record. The other method to evaluate J is the multispecimen technique proposed by Landes and Begley [2, 3] and based on the energy rate interpretation of J [4, 5]. It requires testing many identical specimens with different crack sizes.
Merkle and Corten [6] developed a separable form to represent the load in compact geometry using limit load analysis. Their approach yielded a single specimen J form as
2(1 + ~) A J - 1 + ~ b' (3)
where
a is crack length. Landes et al. [7] found a reasonable agreement between the experimental results of the energy rate interpretation of J using their multispecimen technique and the single specimen J form proposed by Merkle and Corten. This established an experimental basis for the load separation and the single specimen J form.
Based on further studies, J was found to be more appropriately represented as the sum of two parts; Jet and Jp~. Je~ can be obtained from linear elastic fracture parameters as the well known Griffith energy release rate. Jpt can be evaluated using the single specimen form as
Jpl = tlpl(Avt/b), (4)
where Ap~ is the area under the load per unit thickness versus plastic displacement record and tlpt is a factor that can be written as
t/pt = 2 (5a)
for the bend specimen,
r/pl = 2 + 0.522 b /W (5b)
for the compact specimen. The tlv~ expression for compact specimen is the linear fit approxi- mation, proposed by Clarke and Landes [8], for the Merkle and Corten q-expression, 2(1 + ~)/(1 + ~2), in (3).
Ernst et al. [9, 10] found that the single specimen J form and q-factor only exist if the load is separable. For the same geometry, material and constraint, the load separation in the plastic region can be mathematically represented as
,6,
Load separation and tlpt development 215
where G(b/W) and H(vpJW) are the crack geometry and material deformation function respectively, qp~ can be related to the crack geometry function as
b 1 dG rlPl- W G d(b/W) (7)
Based on the given ~/p~ expressions in (5a) and (5b), the geometry function can be written as
for bend specimen,
G = e ° ' 5 2 2 b / W
for compact specimen. During the early development time, J was a stationary crack para- meter because it is based on the deformation theory of plasticity. The primary interest in the evaluation of J was to obtain the crack initation point, J1c. However, Hutchinson and Paris [11] discussed the conditions needed to maintain 'deformation theory' J during crack extension. These conditions are: the crack growth must be of the order of the non- proportional plastic region at the crack tip, and the proportional part in the incremental strain must be dominant compared to the nonproportional part. Shih et al. [12] provided quantitative values for these conditions. They found that J-integral, using the contour integral form, maintains its path independence up to crack growth of 6 percent of the uncracked ligament. This allowed Ernst et al. [13] to develop a technique to construct an incremental J-R curve with J updated for the crack growth. Their technique is based on the single specimen J form and load separation. Also the modified JM-R curve, proposed by Ernst [14] to correlate longer crack growth, is based on load separation. In both R-curves the uniqueness of the J (or JM) solution requires that the crack geometry and material deforma- tion functions should each maintain the same form for both the stationary and the growing crack.
It may be worth noting again that the main experimental basis for the load separation was the approximate agreement between the experimental estimations of the single specimen J form and energy rate interpretation of J form for stationary cracked bending geometries which seems to be more an agreement between the results for a specific case than a verification of the theoretical basis itself. Moreover, this agreement may not indicate that the load separation can be extended to growing crack records and that the crack geometry and material deformation functions will maintain the same forms they acquired in the stationary crack case.
Recently, Sharobeam and Landes [15, 16, 17] surveyed 12 sets of stationary crack test records. The test records represent the load-displacement behavior of specimens with different combinations of crack size, material, geometry, and constraint. Through an analysis to test the load separation in the test records, they found that the load can be represented by a separable form for all the studied cases. Moreover, they developed the geometry functions for the different sets. Their analysis found that the geometry function is a power law function for the geometries
216 M.H. Sharobeam and J.D. Landes
studied; single edged notched bend (SENB), compact (CT), center cracked tension (CCT), and single edged notched tension (SENT). Hence the geometry function can be written as
G = (b/W) m, (8a)
r/p l can be obtained using (7) and (8a) as
t/pz = m. (8b)
The main purpose of this paper is to investigate the possibility of the load separation behavior for growing crack records. If load separation behavior exists, the geometry and deformation functions can also be constructed and compared to those obtained from the load separation in the stationary crack case. Based on results obtained in this study, a new procedure to obtain rlpt from precracked test specimen records will be proposed. Finally, an approach which combines a blunt notched specimen test record with precracked specimen test records is proposed and evaluated.
2. The separation analysis
The load separation behavior in stationary crack test records can be evaluated by studying the load-plastic displacement records of two identical blunt notched specimens with different crack lengths (ai, a j). A separation parameter S o, defined as the load ratio between both records at the same plastic displacement, can be written as
P(ai) Si,j = P(aj) ~. ," (9)
In case of load separation, (9) yields
G(bi/W)H(vpt/W) vp, Si,j = G(bj/W)H(vpt/W) '
G(b,/W)
- G(bj/W)"
0o)
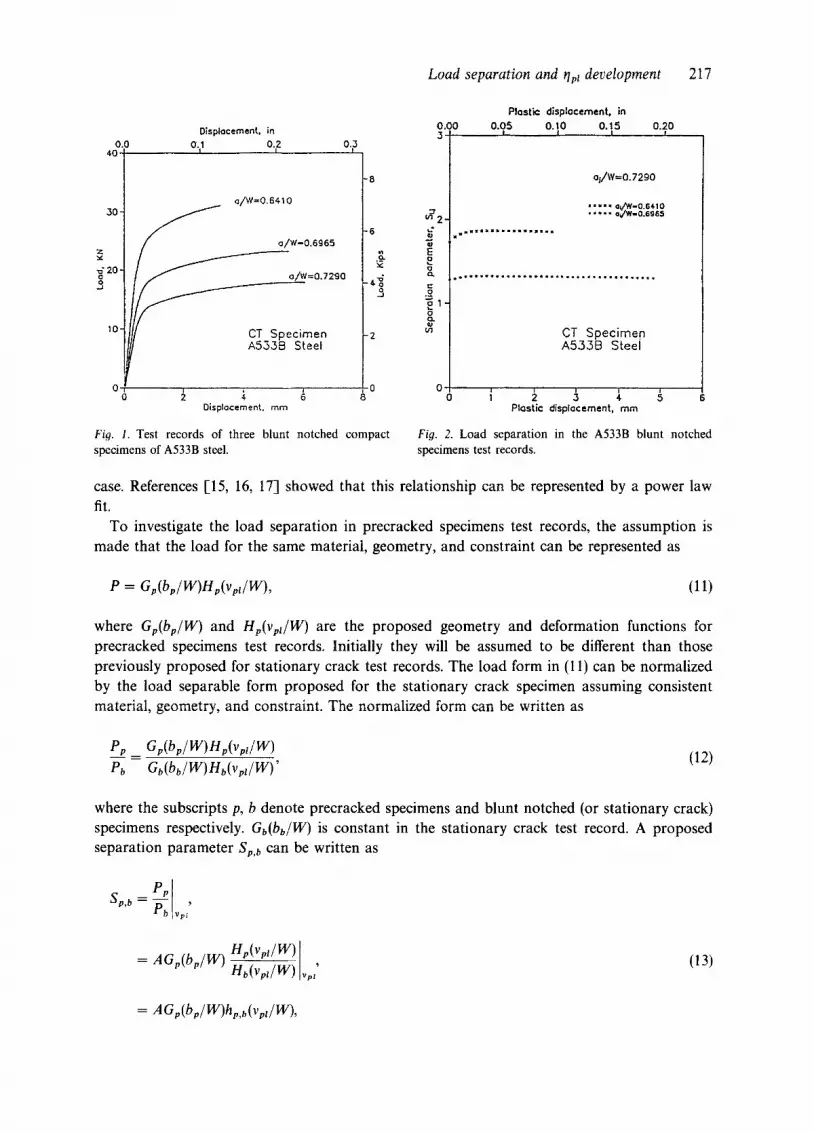
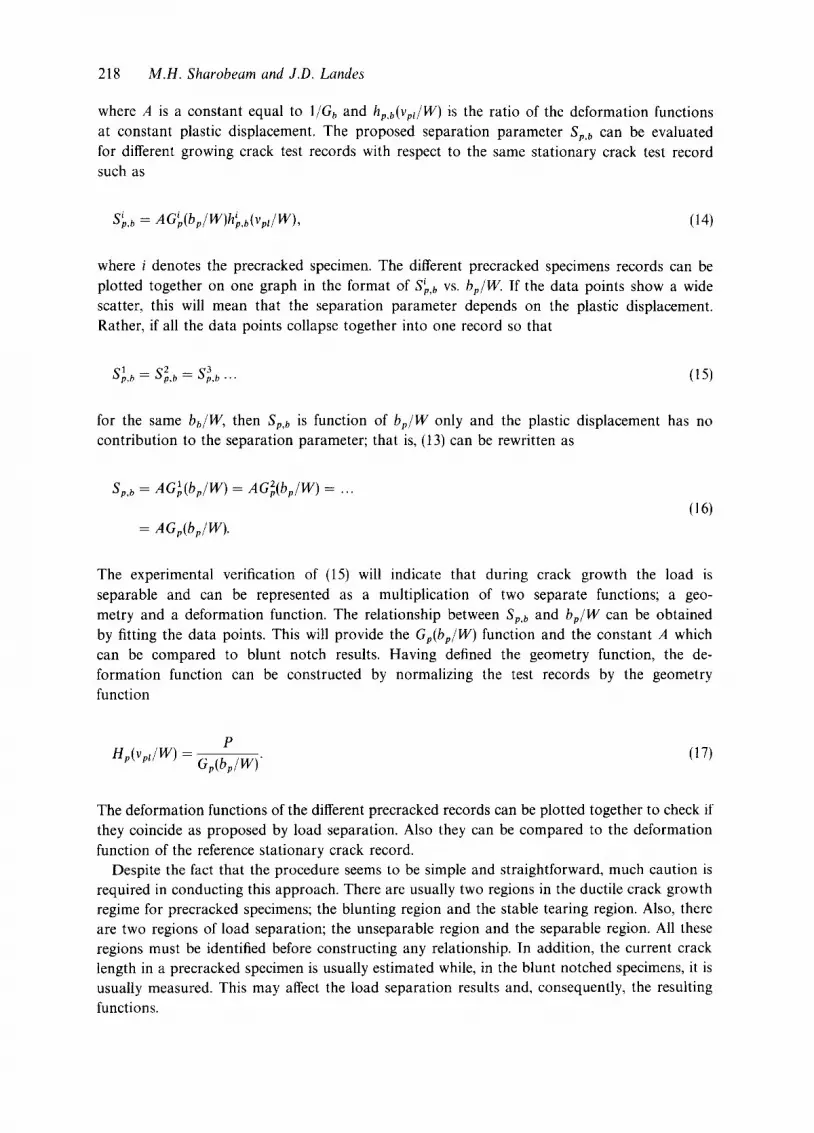
For stationary cracks, Sij will be a constant value. Figure 1 shows three test records of blunt notched A533B steel compact specimens where each specimen has a different crack length. The specimens are 25 mm thick, and 20 percent side grooved. These data have been originally reported in [18] and the load separation results have been reported in [15]. Figure 2 shows the separation parameters for the different test records. The separation parameters maintain a constant value all over the plastic region except for a limited region at the early region of plastic behavior. Also, if Si,j is evaluated for different b i /W test records using one b i / W test record as a reference, the relationship between Si,j and b~/W can be constructed, and eventually the relationship between G(b~/W) and b~/W can be obtained because G(bJW) is constant in this
Load separation and tlp~ development 217
Displacement. in 0 . 0 0.11 0.2 0.3
40 t
30-
20-
10-
~/W=0.6410
o/w-0.6965
a/W=0.72~O
CT Specimen A553B Steel
-8
-6
_J
-2
t , ~ 2 _ =
E
Plast~ displacement, in
0.00 0.05 0.10 0.15 0.20
RmMIm~JBwlsmmJJimm
a~/W=O.7290
• " = ' ' @.~'-a.641 o . . . . . ob~v-O.SS65
CT Specimen A533B Steel
0 0 o ~ -~ ~ a o ~ ~, ~ ~, .~ 6
Displacement. rnrn P l a s t i c displacement, m m
Fis. 1. Test records of three blunt notched compact specimens of A533B steel.
Fig. 2. Load separation in the A533B blunt notched specimens test records.
case. References [15, 16, 17] showed that this relationship can be represented by a power law fit.
To investigate the load separation in precracked specimens test records, the assumption is made that the load for the same material, geometry, and constraint can be represented as
P = Gp(bp/W)Hp(vp,/W), (11)
where Gp(bp/W) and Hp(vpJW) are the proposed geometry and deformation functions for precracked specimens test records. Initially they will be assumed to be different than those previously proposed for stationary crack test records. The load form in (11) can be normalized by the load separable form proposed for the stationary crack specimen assuming consistent material, geometry, and constraint. The normalized form can be written as
P_£ = G~,(bp/W)Hp(vpJW)
Pb Gb(bb/W)Hb(vpJW)' (12)
where the subscripts p, b denote precracked specimens and blunt notched (or stationary crack) specimens respectively. Gb(bb/W) is constant in the stationary crack test record. A proposed separation parameter Sp,b can be written as
Sp b = PP " Pb v p £
= AGp(bp/W) Hp(vpJW) ~, Hb(vpt/W) '
(13)
= AGp(bp/W)hp,b(vpt/W),
218 M.H. Sharobeam and J.D. Landes
where A is a constant equal to l/Gh and hp,b(Vpt/W ) is the ratio of the deformation functions at constant plastic displacement. The proposed separation parameter St, b can be evaluated for different growing crack test records with respect to the same stationary crack test record such as
S~,b = AG~(bv/W)hp,h(vvdW), (14)
where i denotes the precracked specimen. The different precracked specimens records can be plotted together on one graph in the format of S~,b vs. bp/W. If the data points show a wide scatter, this will mean that the separation parameter depends on the plastic displacement. Rather, if all the data points collapse together into one record so that
= = t l 5 )
for the same bb/W, then Sv,b is function of bp/W only and the plastic displacement has no contribution to the separation parameter; that is, (13) can be rewritten as
Sp.b = AG~p(bp/W)= AGZ(bp/W) . . . .
= AGp(bp/W). (16)
The experimental verification of (15) will indicate that during crack growth the load is separable and can be represented as a multiplication of two separate functions; a geo- metry and a deformation function. The relationship between Sp,b and bp/W can be obtained by fitting the data points. This will provide the Gv(bp/W) function and the constant A which can be compared to blunt notch results. Having defined the geometry function, the de- formation function can be constructed by normalizing the test records by the geometry function
P Hv(vvdW) - u to /vv "W'" (17)
The deformation functions of the different precracked records can be plotted together to check if they coincide as proposed by load separation. Also they can be compared to the deformation function of the reference stationary crack record.
Despite the fact that the procedure seems to be simple and straightforward, much caution is required in conducting this approach. There are usually two regions in the ductile crack growth regime for precracked specimens; the blunting region and the stable tearing region. Also, there are two regions of load separation; the unseparable region and the separable region. All these regions must be identified before constructing any relationship. In addition, the current crack length in a precracked specimen is usually estimated while, in the blunt notched specimens, it is usually measured. This may affect the load separation results and, consequently, the resulting functions.
Load separation and rlp~ development 219
3. The experimental results
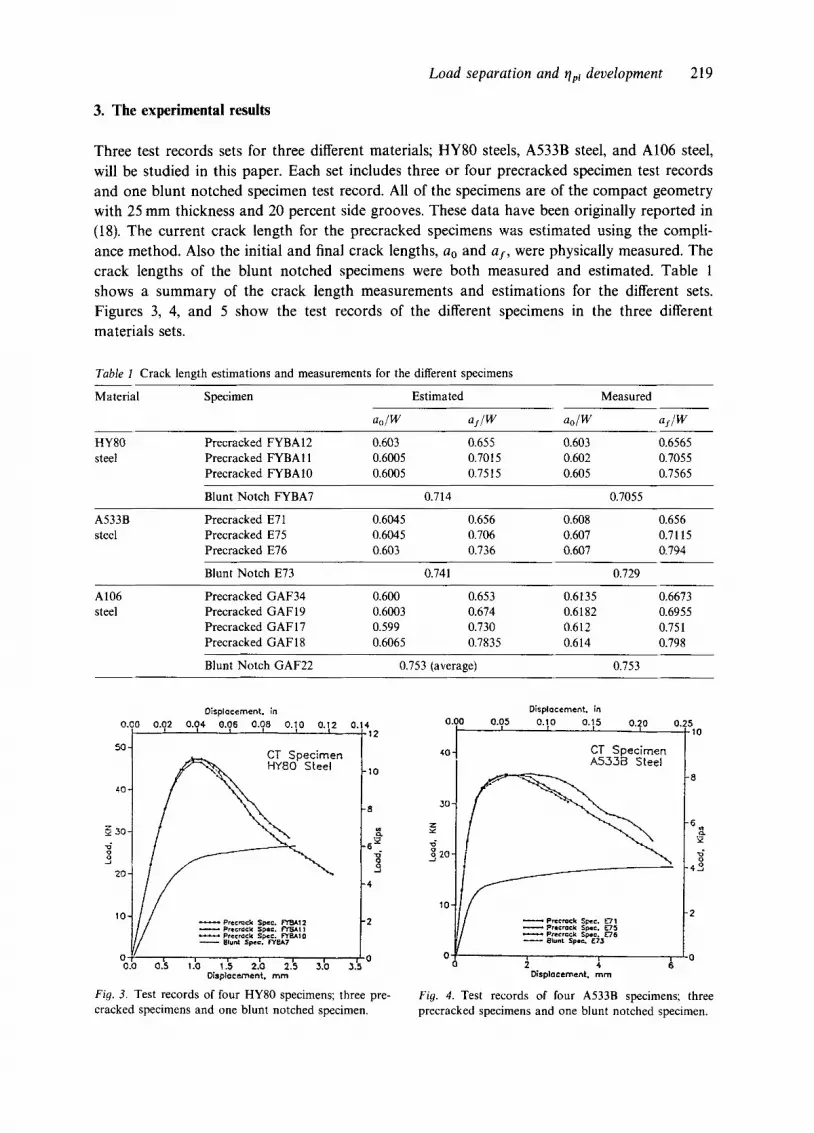
Three test records sets for three different materials; HY80 steels, A533B steel, and A106 steel, will be studied in this paper. Each set includes three or four precracked specimen test records and one blunt notched specimen test record. All of the specimens are of the compact geometry with 25 mm thickness and 20 percent side grooves. These data have been originally reported in (18). The current crack length for the precracked specimens was estimated using the compli- ance method. Also the initial and final crack lengths, ao and a I, were physically measured. The crack lengths of the blunt notched specimens were both measured and estimated. Table 1 shows a summary of the crack length measurements and estimations for the different sets. Figures 3, 4, and 5 show the test records of the different specimens in the three different materials sets.
Table I Crack length estimations and measurements for the different specimens
Fi 9. 3, Test records of four HY80 specimens; three pre- cracked specimens and one blunt notched specimen.
D~splacement. in o.oo o.o5 oqo %5 o.2,o o.25o
40- CT Specimen A535B Steel
-8
30 -
. ",7
2 0 - ~
~ -43
I0-~ - 2
Pnecmck Spec. E'71
o { ; & o
D~splacsment. mm
Fio. 4. Test records of four A533B specimens; three precracked specimens and one blunt notched specimen.
220 M.H. Sharobeam and J.D. Landes
4. Load separation in precracked specimens test records
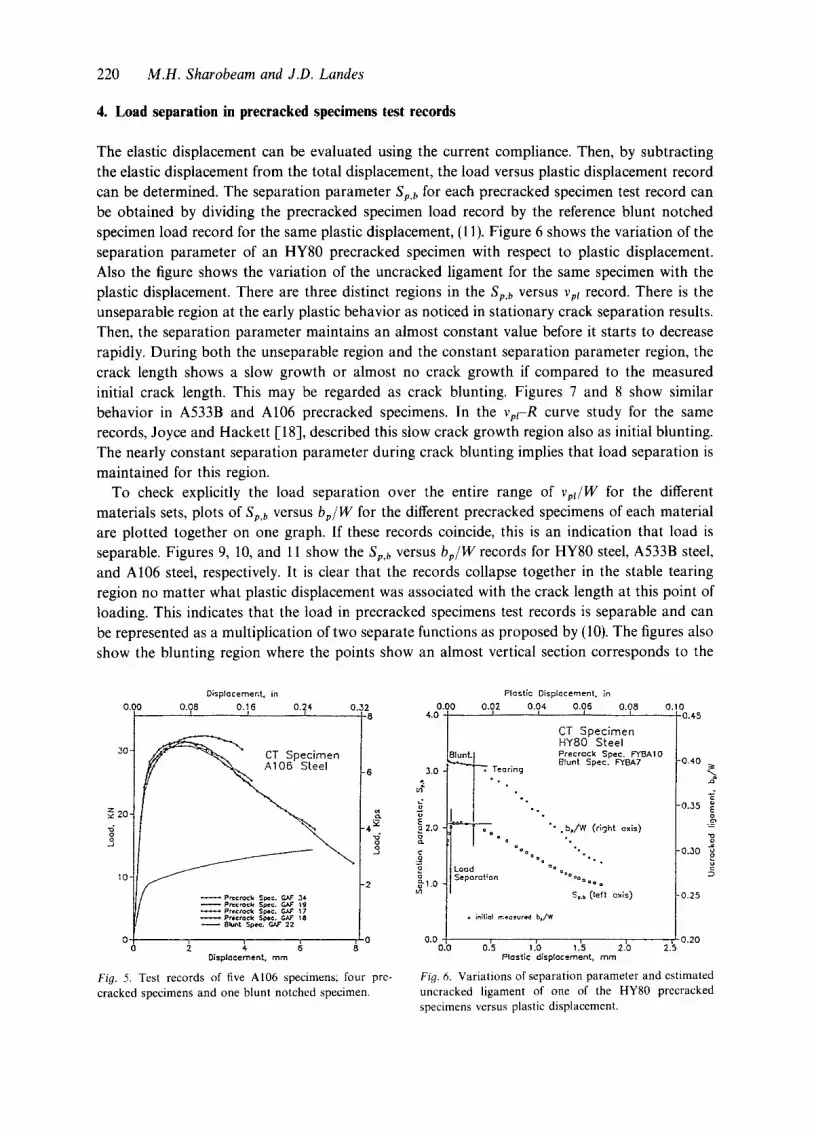
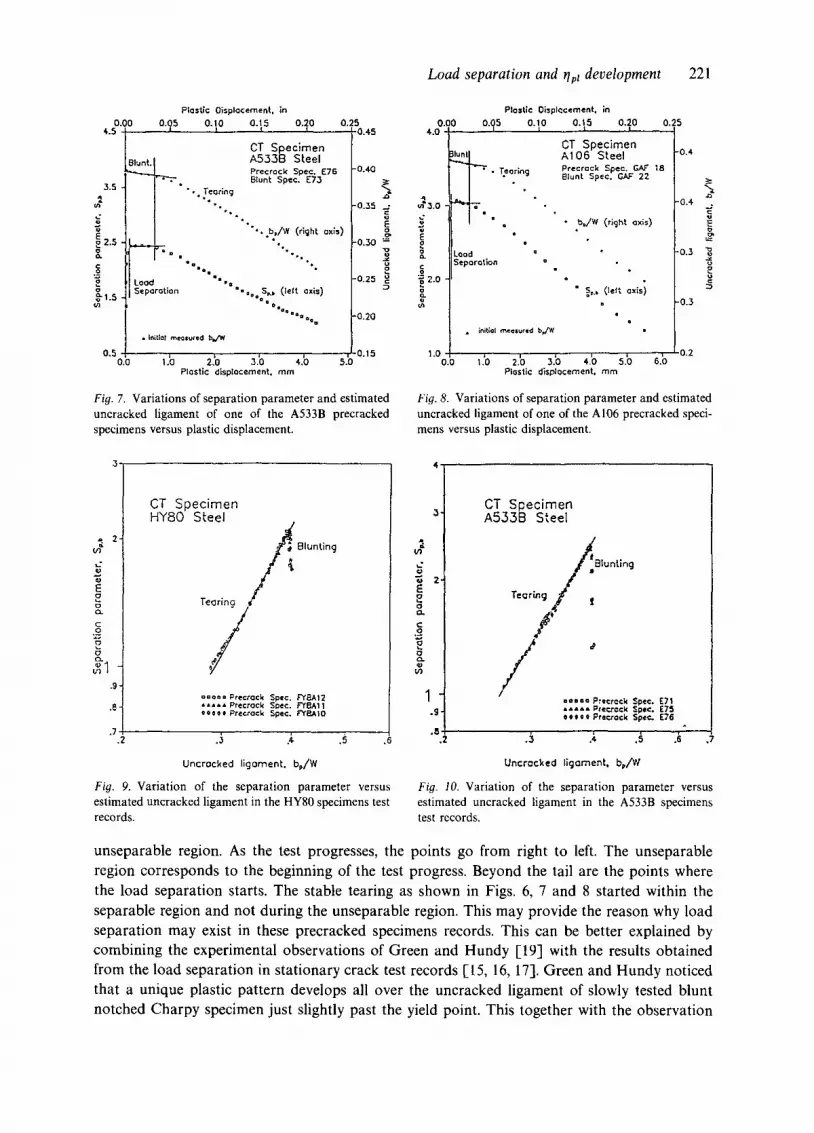
The elastic displacement can be evaluated using the current compliance. Then, by subtracting the elastic displacement from the total displacement, the load versus plastic displacement record can be determined. The separation parameter Sp,b for each precracked specimen test record can be obtained by dividing the precracked specimen load record by the reference blunt notched specimen load record for the same plastic displacement, (l 1). Figure 6 shows the variation of the separation parameter of an HY80 precracked specimen with respect to plastic displacement. Also the figure shows the variation of the uncracked ligament for the same specimen with the plastic displacement. There are three distinct regions in the Sp,b versus Vp~ record. There is the unseparable region at the early plastic behavior as noticed in stationary crack separation results. Then, the separation parameter maintains an almost constant value before it starts to decrease rapidly. During both the unseparable region and the constant separation parameter region, the crack length shows a slow growth or almost no crack growth if compared to the measured initial crack length. This may be regarded as crack blunting. Figures 7 and 8 show similar behavior in A533B and A106 precracked specimens. In the Vpt-R curve study for the same records, Joyce and Hackett [I 8], described this slow crack growth region also as initial blunting. The nearly constant separation parameter during crack blunting implies that load separation is maintained for this region.
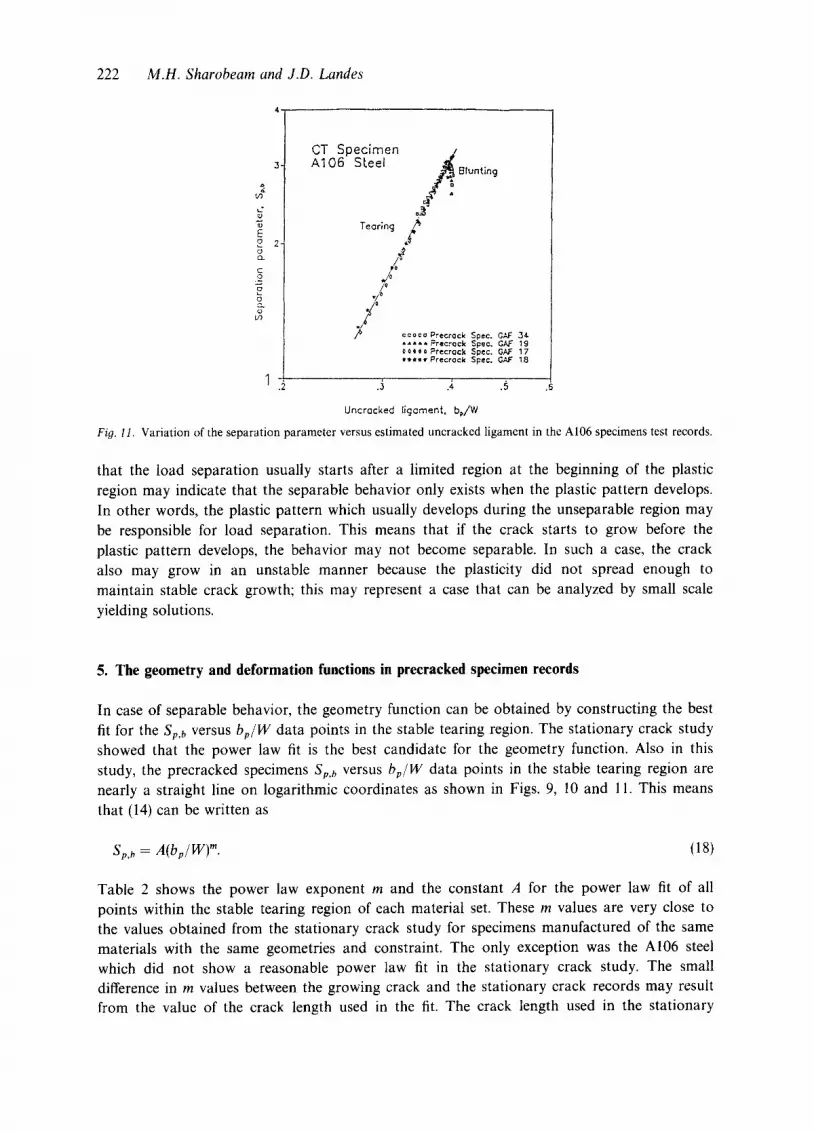
To check explicitly the load separation over the entire range of vpt/W for the different materials sets, plots of Sp,b versus bp/W for the different precracked specimens of each material are plotted together on one graph. If these records coincide, this is an indication that load is separable. Figures 9, 10, and 11 show the Sp,b versus bp/W records for HY80 steel, A533B steel, and A106 steel, respectively. It is clear that the records collapse together in the stable tearing region no matter what plastic displacement was associated with the crack length at this point of loading. This indicates that the load in precracked specimens test records is separable and can be represented as a multiplication of two separate functions as proposed by (10). The figures also show the blunting region where the points show an almost vertical section corresponds to the
Oisplocement, in
o.oo 0.08 046 0.2,+ 0.32 I 8
3O- ~ CT S p e c i m e n
20- ~. .4 ~:
- - Precn~cW $~ec, GAF 19 PrecrQck Spe¢. GAF 17
- - Prectock $~e¢. ~ 18 - - 81un¢ Spec. ~ 22
o ~ ~ ~ , o
Oisplacernent, mrn
Fig. 5. Test records of five A I 0 6 specimens; four pre- cracked spec imens and one blunt notched specimen.
3.0
Eo2.0
8 a o
1.0
Plastic D{splacernent. in o.oo 0.02 o.o~ o.o,6 0.08 o . , o
4.0 0.45
C T S p e c i m e n H Y 8 0 Steel
m
I == a Q ",o
~ - ~ " " b,/W (right axls)
"== °,. Load a° Separation °°°oO~°o o
SD, . (left cxis)
• iniI;~l measured bJW
0.0 ~ 0.20 0.0 O.'S ;.0 1.'S 2.b 2.s
Plastic d~splocgment, mm
Fig. 6. Variat ions of separat ion parameter and est imated uncracked l igament of one of the H Y 8 0 precracked specimens versus plastic displacement.
"0.40
-g "0.35
.0.,30 ~
'0.25
Load separation and ~1~ development 221
Plas~dc 0isplacernent, in o.oo o.os o.~o a . p o.~o o.2s
4-.5 ,. i 1 0.45 CT Specimen A 5 3 3 B S t e e l Precrack Spe¢. F76 "0.40 Blunt Spec. E73 ~=
Fig. I0. Variation of the separation parameter v e r s u s
e s t i m a t e d uncracked ligament in the A533B s p e c i m e n s
tes t records.
unseparable region. As the test progresses, the points go from right to left. The unseparable region corresponds to the beginning of the test progress. Beyond the tail are the points where the load separation starts. The stable tearing as shown in Figs. 6, 7 and 8 started within the separable region and not during the unseparable region. This may provide the reason why load separation may exist in these precracked specimens records. This can be better explained by combining the experimental observations of Green and Hundy 1-19] with the results obtained from the load separation in stationary crack test records [15, 16, 17]. Green and Hundy noticed that a unique plastic pattern develops all over the uncracked ligament of slowly tested blunt notched Charpy specimen just slightly past the yield point. This together with the observation
Fig. 11. Variation of the separation parameter versus estimated uncracked ligament in the A106 specimens test records.
that the load separation usually starts after a limited region at the beginning of the plastic region may indicate that the separable behavior only exists when the plastic pattern develops. In other words, the plastic pattern which usually develops during the unseparable region may be responsible for load separation. This means that if the crack starts to grow before the plastic pattern develops, the behavior may not become separable. In such a case, the crack also may grow in an unstable manner because the plasticity did not spread enough to maintain stable crack growth; this may represent a case that can be analyzed by small scale
yielding solutions.
5. The geometry and deformation functions in precracked specimen records
In case of separable behavior, the geometry function can be obtained by constructing the best fit for the Sp,b versus bp/W data points in the stable tearing region. The stationary crack study showed that the power law fit is the best candidate for the geometry function. Also in this study, the precracked specimens Sp,b versus bp/W data points in the stable tearing region are nearly a straight line on logarithmic coordinates as shown in Figs. 9, 10 and 11. This means
that (14) can be written as
Sp,~ = A(bp/W) m. (18)
Table 2 shows the power law exponent m and the constant A for the power law fit of all points within the stable tearing region of each material set. These m values are very close to the values obtained from the stationary crack study for specimens manufactured of the same materials with the same geometries and constraint. The only exception was the A106 steel which did not show a reasonable power law fit in the stationary crack study. The small difference in m values between the growing crack and the stationary crack records may result from the value of the crack length used in the fit. The crack length used in the stationary
Load separation and rlpt development 223
Table 2. Power law fit results
Material Precrack results, (18) Stationary Crack Results m, 1-16] m A
crack specimens study is the physically measured crack length while in the precracked
specimens study, it is an estimated crack length. This can be further explained by looking at the constant A in (18). The constant A should represent the reciprocal of the blunt
notched geometry function. Assuming that the blunt notched geometry function has the same
power law exponent as the precracked geometry function, then a calculated reference blunt
specimen crack length value can be obtained using (8). These calculated values were found to be
ab = 1.422 for HY80 steel,
ab = 1.480 for A533B steel,
ab = 1.506 for A106 steel.
These values of crack length are between the estimated and measured crack length values, given
in Table 1. This may indicate that if there was no difference between the measured and estimated crack length the same power law exponent might be found in both cases.
The blunting region in the precracked specimens records also can be handled as a stationary crack case. Then m can be obtained using (10); Sij is the nearly constant separa-
tion parameter in the blunting region in each record, Figs. 7, 8, and 9, and both G(bJW) and G(bj/W) are assumed to be power law functions with m as the power law exponent.
Table 3 shows the range of the m values obtained from the different precracked specimens of each material. The estimated blunt notched specimen crack length and an average es- timated value of the precracked specimen crack length in the blunting region were
used in these calculations. The m values are very close to those obtained from the
stable tearing region which indicates the consistency in the material load separation be- havior.
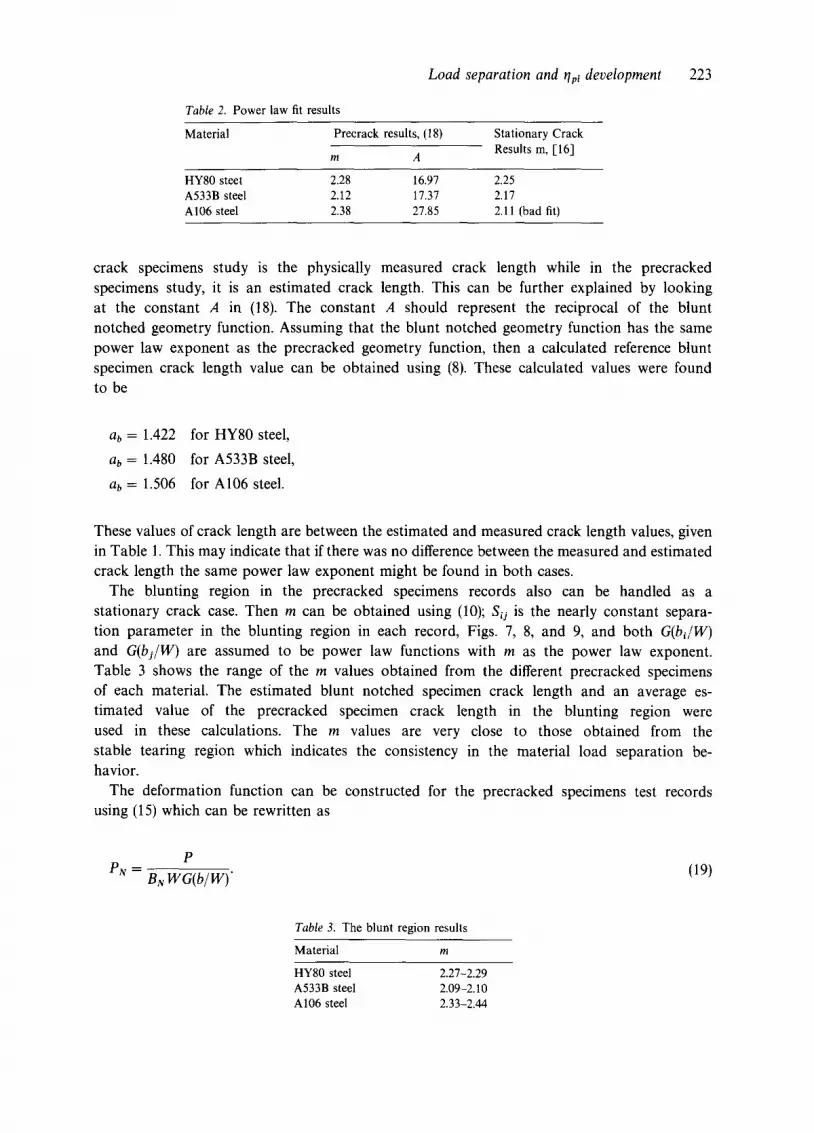
The deformation function can be constructed for the precracked specimens test records using (15) which can be rewritten as
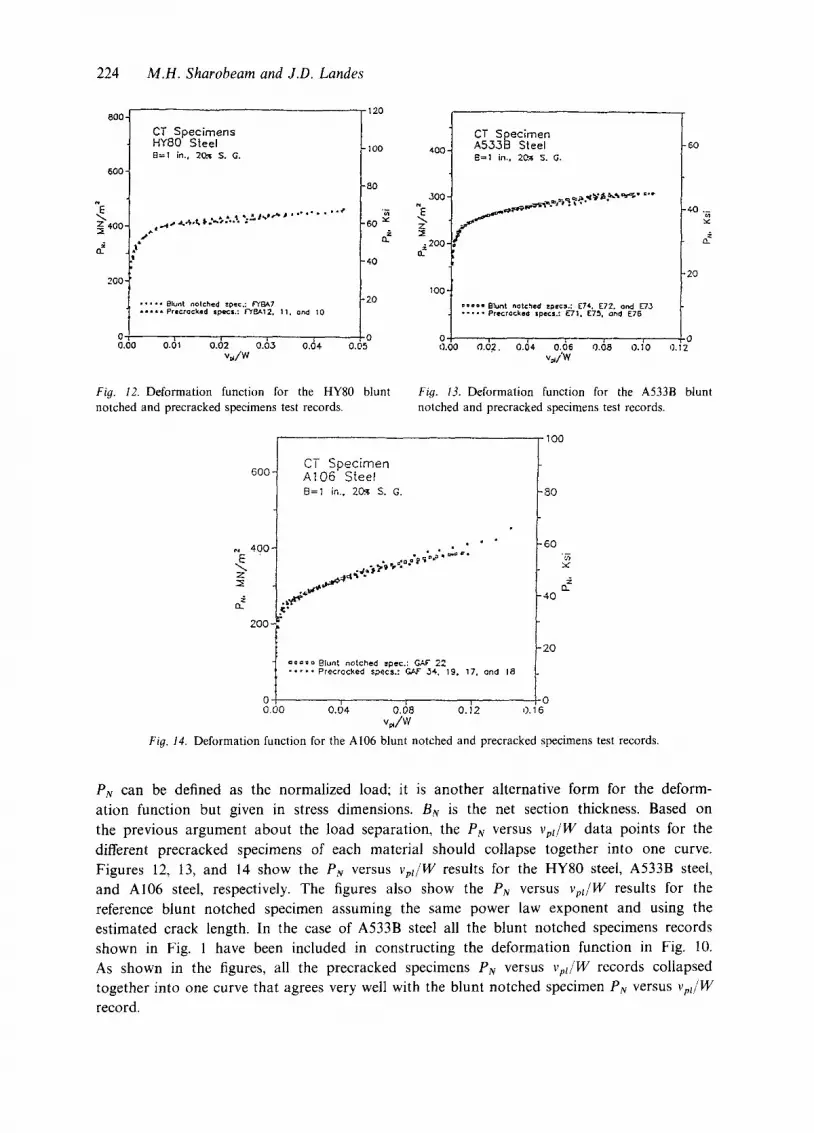
Fig. 14. Deformation function for the A106 blunt notched and precracked specimens test records.
PN can be defined as the normalized load; it is another alternative form for the deform- ation function but given in stress dimensions. BN is the net section thickness. Based on the previous argument about the load separation, the PN versus vpg/W data points for the different precracked specimens of each material should collapse together into one curve. Figures 12, 13, and 14 show the PN versus vpz/W results for the HY80 steel, A533B steel, and AI06 steel, respectively. The figures also show the PN versus vvt/W results for the reference blunt notched specimen assuming the same power law exponent and using the estimated crack length. In the case of A533B steel all the blunt notched specimens records shown in Fig. 1 have been included in constructing the deformation function in Fig. 10. As shown in the figures, all the precracked specimens PN versus vpt/W records collapsed together into one curve that agrees very well with the blunt notched specimen PN versus vpt/W record.
Load separation and rlpl development 225
6. ~/pt evaluation
The previous stationary crack load separation study showed different values of r/r~ from the ones used in the test standards and given by (5a and 5b); r/p~ appears to be less dependent on the crack length for compact geometry than indicated by (5b). Also, it may be sensitive to material properties.
From the precracked specimens load separation results, it is also found that the geometry function is a power law function which consequently means that r/p~ is equal to the power law exponent as shown by (7) and (8b). r/p~ results for the different materials studied are shown in Table 2. Because these values are obtained from the experimental data, they show the material properties effect. Briefly, results from testing a blunt notched specimen can be, in addition to the precracked specimen, used to obtain accurate r/pt values. This represents one method to obtain r/p~ values for new geometries.
7. Conclusions
• The principle of load separation can be extended to precracked specimens records if the crack starts to grow beyond the unseparable region which is a limited region at the early plastic behavior.
• If the load is separable, the geometry and deformation functions maintain their form as the crack grows and up to crack growth of more than 40 percent of the initial uncracked ligament. This is far beyond the J-R and JM-R limits which makes the load separation a criterion that can be used in large crack extension cases.
• A new simple procedure to obtain a realistic r/p t value is proposed. This procedure requires the testing of a blunt notched specimen with a precracked specimen. In this case, a longer crack extension in the precrack specimen may be required in order to provide a reasonable fitting range.
• Testing an additional blunt notched specimen together with the R-curve precracked specimen may provide many other benefits such as: verification of the load separation in the precracked record, and defining the crack initiation point in an accurate way that does not depend on the J-R curve fitting.
• Since the principle of load separation is valid for the growing crack, use of a ductile fracture methodology based on J-R curve behavior can be used with more confidence.
References
1. J.R. Rice, P.C. Paris and J.G. Merkle, in Progress in Flaw Growth and Fracture Toughness Testing, ASTM STP 536 (1973) 231-245.
2. J.A. Begley and J.D. Landes, in Fracture Toughness, ASTM STP 514 (1972) 1-23. 3. J.D. Landes and J.A. Begley, in Fracture Toughness, ASTM STP 514 (1972) 24-39. 4. J.R. Rice, Journal of Applied Mechanics 35 (1968) 379-386. 5. J.R. Rice, Fracture, an Advanced Treatise, 2, H. Liebowitz (ed.), Academic Press (1968). 6. J.G. Merkle and H.T. Corten, A J-Integral Analysis for the Compact Specimen, Considering Axial Force as Well as
Bending Effects, ASME Paper No. 74-PVP-33 (1974). 7. J.D. Landes, H. Walker and G.A. Clarke, Elastic-Plastic Fracture, ASTM STP 668 (1979) 266-287. 8. G.A. Clarke and J.D. Landes, Journal of Testing and Evaluation, JTEVA 7, No. 5 (1979) 264-265.
226 M.H. Sharobeam and J.D. Landes
9. H.A. Ernst and P.C. Paris, Techniques of Analysis of Load-Displacemnt Records by J-Integral Methods, Nuclear Regulatory Commission, NUREG/CR-1222 (January 1980).
10. P.C. Paris, H. Ernst and C.E. Turner in Fracture Mechanics, Twelfth Conference, ASTM STP 700 (1980) 338-35l. ll . J.W. Hutchinson and P.C. Paris Elastic-Plastic Fracture, ASTM STP 668 (1979) 37-64. 12. C.F. Shih, H.G. deLorenzi and W.R. Andrews, Elastic-Plastic Fracture, ASTM STP 668 (1979) 65 120. 13. H.A. Ernst, P.C. Paris and J.D. Landes, ASTM STP 743 (1980) 476-502. 14. H.A. Ernst Elastic-Plastic Fracture 2nd Symposium, Vol. I, ASTM STP 803 (1983) 1-191-I-213. 15. M.H. Sharobeam and J.D. Landes, International Journal of Fracture 47 (1991) 81-104. 16. M.H. Sharobeam, J.D. Landes and R. Herrera, in ASTM 2nd Symposium on User Experience With Elastic-Plastic
Test Methods, Lake Buena Vista, Florida, November 1989. 17. M.H. Sharobeam, 'The Role of Geometry and Deformation in Ductile Fracture Methodology,' Ph.D. dissertation,
University of Tennessee, in progress. 18. J.A. Joyce, D.A. Davis, E.M. Hackett and R.A. Hayes, Application of the J-Integral and the Modified J-Integral to
Cases of Large Crack Extension, NUREG CR-5143 (Feb. 1989). 19. A~P. Green and B.B. Hundy, Journal of the Mechanics and Physics of Solids 4 (1956) 128-144.