Nuclear Instruments and Methods in Physics Research A 554 (2005) 247–254 High precision measurements with nuclear emulsions using fast automated microscopes M. De Serio a , M. Ieva a , M.T. Muciaccia a , S. Simone a , M. Cozzi b , G. Giacomelli b , L. Patrizii b , G. Sirri b , S. Blokhin c , S. Buontempo c , D. Coppola c , N. D’Ambrosio c , G. De Lellis c, , P. Migliozzi c , C. Pistillo c , P. Strolin c , V. Tioukov c , E. Barbuto d , C. Bozza d , G. Grella d , C. Sirignano d a Universita` di Bari and INFN, Bari, Italy b Universita` di Bologna and INFN, Bologna, Italy c Universita` di Napoli ‘‘Federico II’’ and INFN, Napoli, Italy d Universita` di Salerno and INFN, Salerno, Italy Received 27 June 2005; received in revised form 29 July 2005; accepted 4 August 2005 Available online 25 August 2005 Abstract We report on the development of an automated scanning system for nuclear emulsions aiming at very precise spatial and angular measurements. An accuracy of 0:06 mm in position was achieved with the emulsion films used for the measurement. An accuracy of 0.4 mrad was achieved for tracks penetrating orthogonally the emulsion films while an accuracy of 1 mrad was obtained for tracks inclined by about 300 mrad with respect to the perpendicular direction. This result shows unprecedented position and angular resolutions achieved by automated measurements. r 2005 Elsevier B.V. All rights reserved. PACS: 29.40.Gx; 29.40.Rg Keywords: Nuclear emulsions; Precision measurement; Automated measurement 1. Introduction Nuclear emulsions have been largely used in high energy physics, leading to the discovery of new particles and to the measurement of their properties [1–4]. The high sensitivity and grain uniformity of nuclear emulsions make them capable of observing tracks of single particles with submicrometric space resolution and therefore they are especially suitable for the observation of short lived particles. The present use of the ARTICLE IN PRESS www.elsevier.com/locate/nima 0168-9002/$ - see front matter r 2005 Elsevier B.V. All rights reserved. doi:10.1016/j.nima.2005.08.017 Corresponding author. E-mail address: [email protected] (G. De Lellis).
Transcript
ARTICLE IN PRESS
0168-9002/$ - se
doi:10.1016/j.ni
�CorrespondiE-mail addre
Nuclear Instruments and Methods in Physics Research A 554 (2005) 247–254
www.elsevier.com/locate/nima
High precision measurements with nuclear emulsions usingfast automated microscopes
M. De Serioa, M. Ievaa, M.T. Muciacciaa, S. Simonea, M. Cozzib, G. Giacomellib,L. Patriziib, G. Sirrib, S. Blokhinc, S. Buontempoc, D. Coppolac, N. D’Ambrosioc,G. De Lellisc,�, P. Migliozzic, C. Pistilloc, P. Strolinc, V. Tioukovc, E. Barbutod,
C. Bozzad, G. Grellad, C. Sirignanod
aUniversita di Bari and INFN, Bari, ItalybUniversita di Bologna and INFN, Bologna, Italy
cUniversita di Napoli ‘‘Federico II’’ and INFN, Napoli, ItalydUniversita di Salerno and INFN, Salerno, Italy
Received 27 June 2005; received in revised form 29 July 2005; accepted 4 August 2005
Available online 25 August 2005
Abstract
We report on the development of an automated scanning system for nuclear emulsions aiming at very precise spatial
and angular measurements. An accuracy of 0:06mm in position was achieved with the emulsion films used for the
measurement. An accuracy of 0.4mrad was achieved for tracks penetrating orthogonally the emulsion films while an
accuracy of 1mrad was obtained for tracks inclined by about 300mrad with respect to the perpendicular direction. This
result shows unprecedented position and angular resolutions achieved by automated measurements.
new particles and to the measurement of theirproperties [1–4]. The high sensitivity and grainuniformity of nuclear emulsions make themcapable of observing tracks of single particles withsubmicrometric space resolution and thereforethey are especially suitable for the observation ofshort lived particles. The present use of the
M. De Serio et al. / Nuclear Instruments and Methods in Physics Research A 554 (2005) 247–254248
emulsion technique is linked to the impressiveachievements in the development of automatedscanning systems [5–8]. This allowed the design ofa new generation of ‘‘hybrid’’ experiments [9–12],where nuclear emulsions are combined withelectronic detectors.
The need for massive detectors has recentlymotivated the revival of the Emulsion CloudChamber (ECC) technique [13] for neutrinoexperiments aiming at the detection of the t lepton[11,12]. The ECC consists of a sandwich structuremade of thick metal plates (passive material) andthin emulsion layers (tracking device). This detec-tor was successfully used in cosmic ray experi-ments, having the advantages of cost effectivenessand of particle identification capabilities. Most ofthe detector mass consists of metal plates, allowingfor a substantial cost reduction (a few percent)compared with stacks of pure emulsions.
The use of metal plates in the ECC designprevents the recognition of short lived particlesthrough the visual observation of their decaypoint, as done in experiments where only emulsionstacks are used as a target. This feature is replacedby the use of impact parameter techniques. Forbackground rejection, one profits from bettermeasurements of kinematical parameters throughthe showering and multiple Coulomb scatteringmeasurements [14].
The intrinsic position resolution of the nuclearemulsions used is about 0:2=
ffiffiffiffiffi
12p
mm, where 0:2mmis the diameter of the original AgBr crystal [15] forthe used emulsions. The emulsion films used in thispaper are made of two 44mm thick layers stuck onboth sides of a 210mm plastic base. Given the levelarm of 210mm between the two layers, the intrinsicangular accuracy is about 0.4mrad.
Automated scanning systems aimed at achievinga maximal scanning speed (now reaching 20 cm2=h[8]) are not focused on fully exploiting the intrinsicresolution of the nuclear emulsions. In this paperwe report on the realization of an automatedmicroscope aimed at achieving a high resolution,with a somewhat slower scanning speed (about0:1 cm2=h). This system is meant to scan a limitednumber of events for which a very high precision isneeded. Therefore, the scanning speed should bemeasured per track rather than per unit surface. A
speed per track of 270 tracks/h has been achieved.We also report on the development of a dedicatedmeasurement procedure.
2. The automated microscope
The automated scanning system consists of amicroscope equipped with a computer-controlledmotorized stage, movable in all three directions, adedicated optical system and a CCD camera, ontop of an optical tube. For each field of view,several tomographic images of the emulsions aretaken at equidistant depths by moving the focalplane across the emulsion thickness (Z direction).Images are grabbed and processed by a visionmulti-processor board, hosted in the control PCtogether with the motor control board. Its designprofits from the experience gained in the design ofhigh speed microscopes developed in an R&Dproject in the framework of the OPERA experi-ment [8], with the addition of special features toenhance the precision of the measurements.The mechanical stage is equipped with nano-
step motors and optical encoders with a resolutionof 0:1mm for the horizontal axes. The stage allowsto cover a range of 20 cm on the horizontal axesand 5 cm on the vertical one. A modified opticalbench hosts the illumination system and it isequipped with a granite arm bearing on the Z
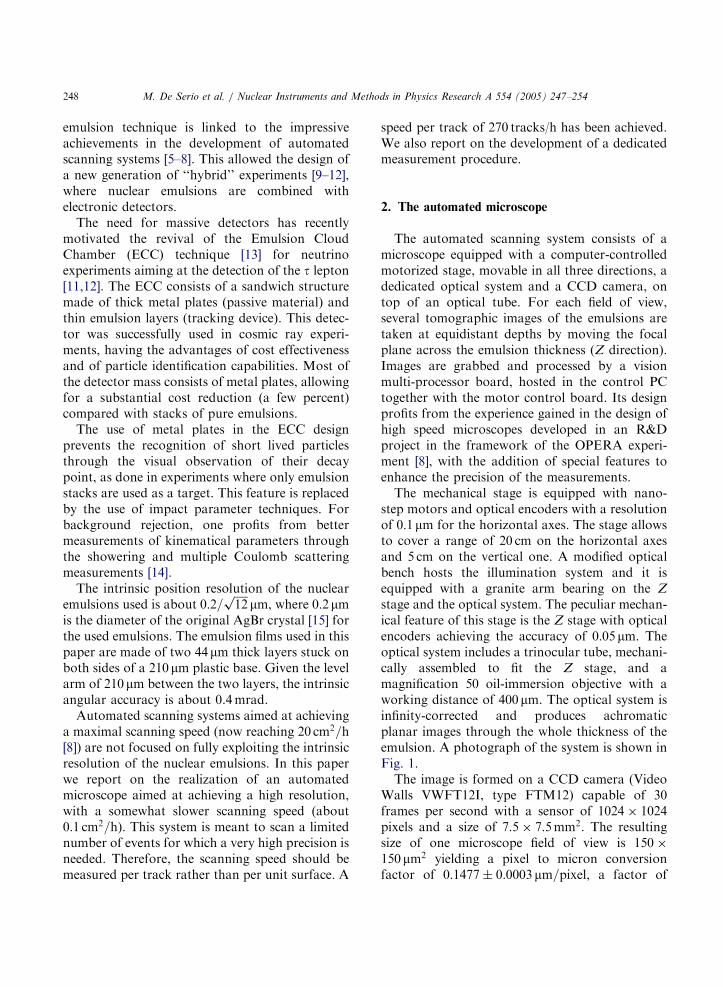
stage and the optical system. The peculiar mechan-ical feature of this stage is the Z stage with opticalencoders achieving the accuracy of 0:05mm. Theoptical system includes a trinocular tube, mechani-cally assembled to fit the Z stage, and amagnification 50 oil-immersion objective with aworking distance of 400mm. The optical system isinfinity-corrected and produces achromaticplanar images through the whole thickness of theemulsion. A photograph of the system is shown inFig. 1.The image is formed on a CCD camera (Video
Walls VWFT12I, type FTM12) capable of 30frames per second with a sensor of 1024� 1024pixels and a size of 7:5� 7:5mm2. The resultingsize of one microscope field of view is 150�150mm2 yielding a pixel to micron conversionfactor of 0:1477� 0:0003mm=pixel, a factor of
ARTICLE IN PRESS
Fig. 1. Photograph of the automated scanning system devel-
oped in this work.
M. De Serio et al. / Nuclear Instruments and Methods in Physics Research A 554 (2005) 247–254 249
about 2 better than in the high speed system [8].Images are filtered using a Matrox Genesis framegrabber and vision processor.
Nuclear emulsions are very sensitive to thevariation of the environmental parameters liketemperature and humidity. In order to achieve thedesired accuracy, it is necessary to keep theseparameters around the suggested values (about24 1C and 60% relative humidity) with a fewpercent stability. This needs their continuousmonitoring. We have designed and installed anacquisition system for the measurement andstorage of the values read out from differentsensors at fixed time intervals with a user friendlyinterface. The system uses FieldPoint controldevices developed by National Instruments [16].Resistive sensors are used for temperature mon-itoring while solid state sensors are employed inhumidity monitoring. A control board with real-time functionality is used. The applicative programwas developed under the LabView environment.The control unit takes the data on a memory anddownloads them to the server. A Web access wasalso developed.
3. Data taking software
We developed a dedicated software to grab andprocess the images of nuclear emulsions. Thesoftware is divided into two independent parts:
one is dedicated to image grabbing and clusterforming analysis (the so-called ‘‘clusterization’’),the other one to tracking analysis (‘‘segmentation’’).The on-line program is written in the object-
oriented Cþþ language and developed under theMicrosoft Visual Cþþ environment as standardWindows application with an user-friendly interface.The program performs the following main opera-tions: stage moving, image grabbing and processing,data storage. An input file containing the predictedtrack positions and slopes must be provided. Theseparameters come from previous measurementsperformed by a fast automated system.The microscope stage is driven to the position of
each predicted track. The number of repeatedacquisitions as well as the vertical distance betweengrabbed layers can be selected by the user (thetypical value is 40). The so-called tomographicanalysis of emulsions is performed both in the topand in the bottom emulsion layer. For each level, adigital image of 1024� 1024 pixels is saved andprocessed, i.e. filtered and binarized. The grabbingprocess is performed in asynchronous mode toincrease the speed of the system. In this way thevertical axis moves through the emulsion withoutstopping and the storage of images is notsynchronized with the end of its grabbing. Allthe saved frames are then ready to be processed.Images are filtered by applying a Finite ImpulseResponse (FIR) filter. This operation improves thediscrimination between emulsion grains and back-ground noise. The binarization is then performedby applying a gray level threshold to the filteredimage. Thus, the resulting black and white image isthe best separation between signal and back-ground. A clustering operation is needed torecognize the emulsion grains. Clusters of pixelsrepresent the physical grains produced by thepassage of particles through nuclear emulsions.The identification of clusters is made on binary
images, while features of clusters (area and center ofgravity) are calculated by using the pixel gray level.The center of gravity of all the pixels belonging to agiven cluster provides the position of the grain. It iscalculated by using the gray level of each pixel asweight. The number of pixels belonging to a clusteris by definition its area. Image processing isperformed on-line by using the Matrox Vision
ARTICLE IN PRESS
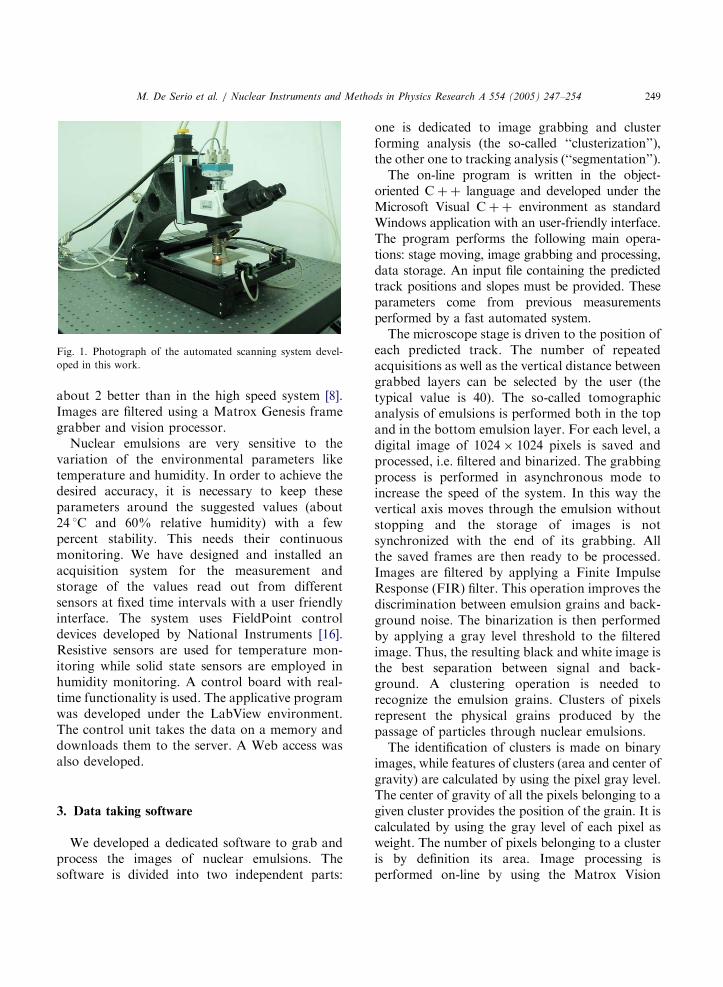
Fig. 2. Schematic drawing of the emulsion stack used for the measurements. The micro-track and base-track are defined.
M. De Serio et al. / Nuclear Instruments and Methods in Physics Research A 554 (2005) 247–254250
processor. The scanning results are stored andprocessed by the FEDRA analysis framework [17]which operates in a ROOT [18] environment.
An off-line tracking procedure (‘‘segmenta-tion’’) is then applied. The tracking is independentof the clusterization procedure and can be used forany kind of ‘‘segmentation’’ analysis. This proce-dure can be compiled either under the Windows orthe Linux operating systems.
The off-line tracking algorithm is based on the‘‘layer-shifting’’ procedure described in the follow-ing. By superimposing all the digitized layers, a bi-dimensional histogram is produced with peakscorresponding to perpendicular tracks. For in-clined tracks, peaks in the bi-dimensional histo-gram appear only after a layer shift proportionalto the track slope. These shifts converted intoslope units are used as input values for the fittingprocedure. This procedure involves all the clusterswith a distance from the track below a giventhreshold. In the current realization of the algo-rithm, the threshold is estimated by using the factthat the distance of clusters from the fitted linedoes not depend on the track slopes in the used‘‘normalized’’ (to the measured error) space. Thefitted line is the result of the tracking procedure.
1Fuji Film, Minamiashigara, 250-0193, Japan.
4. Beam exposure
In order to test the performances of the scanningsystem, emulsion stacks were assembled and
exposed to high energy particle beams. The stackused for the measurement reported here was madeof seven consecutive emulsion sheets, as shown inFig. 2. Unlike the ECC case, no metal plate wasused, in order to minimize scattering effects whichwould prevent the evaluation of the precisionreachable with nuclear emulsions, which is thepurpose of this study.The emulsion films were produced by the Fuji
Film company.1 They belong to the same batch ofthe nuclear emulsions used for the OPERAexperiment [12].The emulsion stack was exposed to the p� beam
in the T7 experimental area of the CERN PS. Datawere taken at a pion momentum of 8GeV=c. Theuncertainty on the beam momentum is of the orderof 1%. At this energy, the T7 pion beam shows anelectron contamination of less than 10% [19]. Inorder to avoid irradiation of the emulsion layersby the electron-generated showers above anacceptable track density, we placed about 2.5 cmof lead ð�5 X 0Þ upstream of the last focusingmagnet. This reduced the electron contaminationwell below the per-mil level, as monitored byCherenkov detectors. Its effect became completelynegligible.In order to determine the measurement accuracy
as a function of the track angle, we made severalbeam exposures by rotating the emulsion stack insteps of 100mrad (well above the beam angular
ARTICLE IN PRESS
M. De Serio et al. / Nuclear Instruments and Methods in Physics Research A 554 (2005) 247–254 251
spread), up to 300mrad. The coincidence of twoscintillation counters was used to monitor theincident flux and set the exposure time to obtainthe desired statistical sample. The recorded trackdensity was about 15 tracks per mm2.
µm-590 -580 -570 -560 -550 -540 -530
0
50
100
150
200
250
300
350
400
450
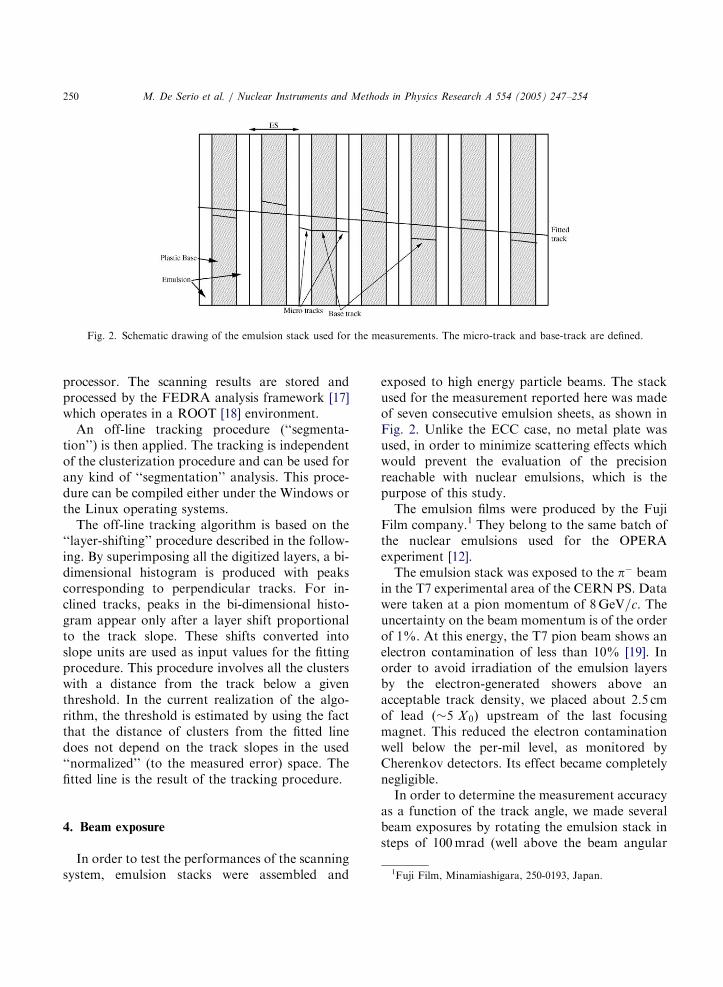
Fig. 3. Measured profile of the number of clusters as a function
of the z (mm) coordinate of the frame.
µm-590 -580 -570 -560 -550 -540 -530
0
50
100
150
200
250
300
350
400
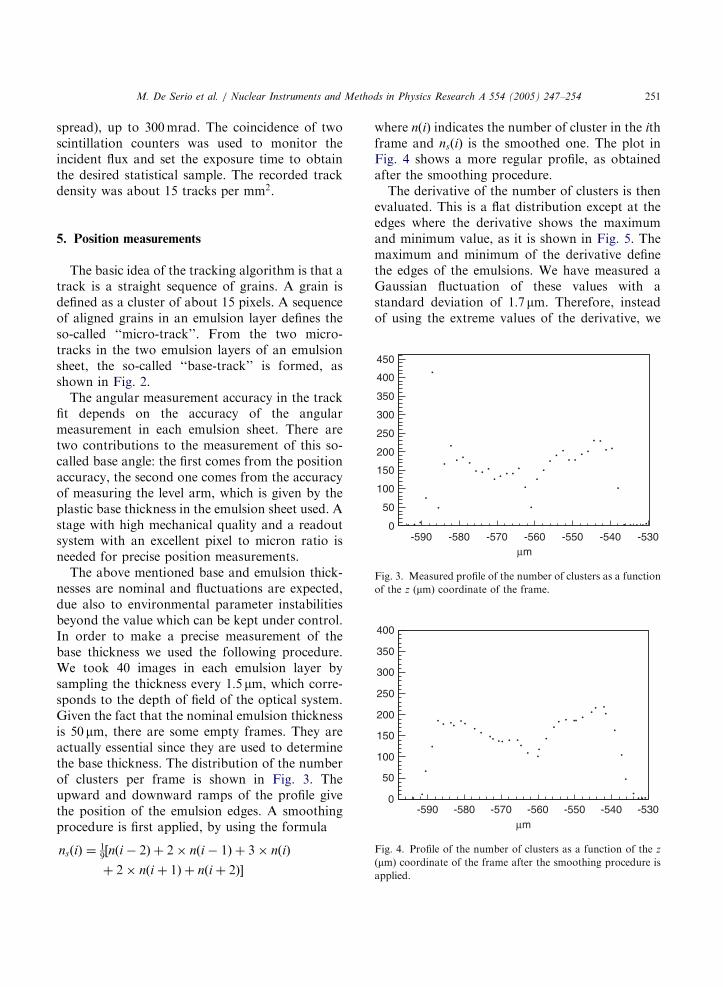
Fig. 4. Profile of the number of clusters as a function of the z
(mm) coordinate of the frame after the smoothing procedure is
applied.
5. Position measurements
The basic idea of the tracking algorithm is that atrack is a straight sequence of grains. A grain isdefined as a cluster of about 15 pixels. A sequenceof aligned grains in an emulsion layer defines theso-called ‘‘micro-track’’. From the two micro-tracks in the two emulsion layers of an emulsionsheet, the so-called ‘‘base-track’’ is formed, asshown in Fig. 2.
The angular measurement accuracy in the trackfit depends on the accuracy of the angularmeasurement in each emulsion sheet. There aretwo contributions to the measurement of this so-called base angle: the first comes from the positionaccuracy, the second one comes from the accuracyof measuring the level arm, which is given by theplastic base thickness in the emulsion sheet used. Astage with high mechanical quality and a readoutsystem with an excellent pixel to micron ratio isneeded for precise position measurements.
The above mentioned base and emulsion thick-nesses are nominal and fluctuations are expected,due also to environmental parameter instabilitiesbeyond the value which can be kept under control.In order to make a precise measurement of thebase thickness we used the following procedure.We took 40 images in each emulsion layer bysampling the thickness every 1:5 mm, which corre-sponds to the depth of field of the optical system.Given the fact that the nominal emulsion thicknessis 50mm, there are some empty frames. They areactually essential since they are used to determinethe base thickness. The distribution of the numberof clusters per frame is shown in Fig. 3. Theupward and downward ramps of the profile givethe position of the emulsion edges. A smoothingprocedure is first applied, by using the formula
nsðiÞ ¼19½nði � 2Þ þ 2� nði � 1Þ þ 3� nðiÞ
þ 2� nði þ 1Þ þ nði þ 2Þ�
where nðiÞ indicates the number of cluster in the ithframe and nsðiÞ is the smoothed one. The plot inFig. 4 shows a more regular profile, as obtainedafter the smoothing procedure.The derivative of the number of clusters is then
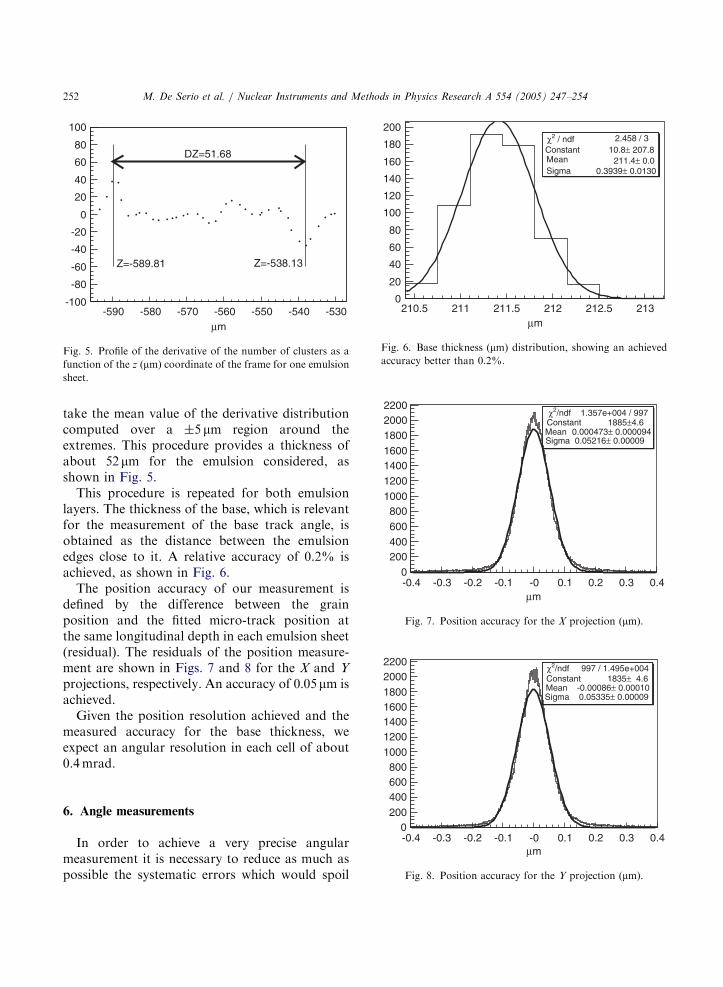
evaluated. This is a flat distribution except at theedges where the derivative shows the maximumand minimum value, as it is shown in Fig. 5. Themaximum and minimum of the derivative definethe edges of the emulsions. We have measured aGaussian fluctuation of these values with astandard deviation of 1:7mm. Therefore, insteadof using the extreme values of the derivative, we
ARTICLE IN PRESS
µm-590 -580 -570 -560 -550 -540 -530
-100
-80
-60
-40
-20
0
20
40
60
80
100
Z=-589.81 Z=-538.13
DZ=51.68
Fig. 5. Profile of the derivative of the number of clusters as a
function of the z (mm) coordinate of the frame for one emulsion
sheet.
Mean Sigma
µm210.5 211 211.5 212 212.5 213
0
20
40
60
80
100
120
140
160
180
200
0.3939± 0.0130211.4± 0.0
Constant 10.8± 207.82.458 / 3χ2 / ndf
Fig. 6. Base thickness (mm) distribution, showing an achieved
M. De Serio et al. / Nuclear Instruments and Methods in Physics Research A 554 (2005) 247–254252
take the mean value of the derivative distributioncomputed over a �5 mm region around theextremes. This procedure provides a thickness ofabout 52mm for the emulsion considered, asshown in Fig. 5.
This procedure is repeated for both emulsionlayers. The thickness of the base, which is relevantfor the measurement of the base track angle, isobtained as the distance between the emulsionedges close to it. A relative accuracy of 0.2% isachieved, as shown in Fig. 6.
The position accuracy of our measurement isdefined by the difference between the grainposition and the fitted micro-track position atthe same longitudinal depth in each emulsion sheet(residual). The residuals of the position measure-ment are shown in Figs. 7 and 8 for the X and Y
projections, respectively. An accuracy of 0:05mm isachieved.
Given the position resolution achieved and themeasured accuracy for the base thickness, weexpect an angular resolution in each cell of about0.4mrad.
µm-0.4 -0.3 -0.2 -0.1 -0 0.1 0.2 0.3 0.40
200400600
Fig. 8. Position accuracy for the Y projection (mm).
6. Angle measurements
In order to achieve a very precise angularmeasurement it is necessary to reduce as much aspossible the systematic errors which would spoil
ARTICLE IN PRESS
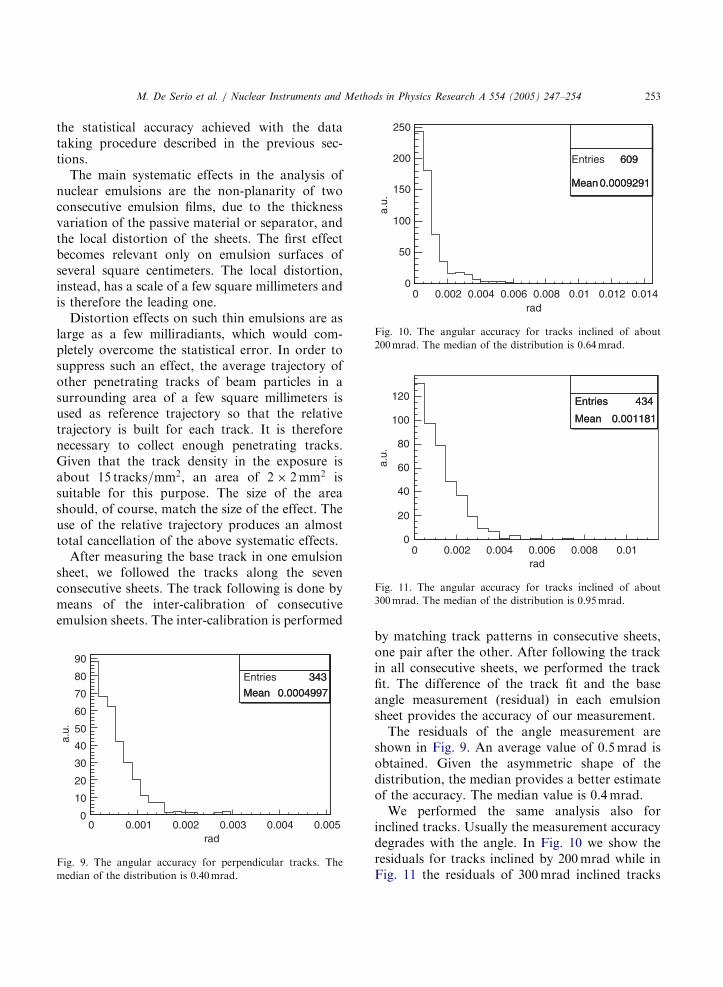
Entries 609
Mean 0.0009291
rad0 0.002 0.004 0.006 0.008 0.01 0.012 0.014
0
50
100
150
200
250
a.u.
609
Mean 0.0009291
Fig. 10. The angular accuracy for tracks inclined of about
200mrad. The median of the distribution is 0.64mrad.
Entries 434
Mean 0.001181
rad0 0.002 0.004 0.006 0.008 0.01
0
20
40
60
80
100
120a.
u.
Entries 434
Mean 0.001181
Fig. 11. The angular accuracy for tracks inclined of about
300mrad. The median of the distribution is 0.95mrad.
M. De Serio et al. / Nuclear Instruments and Methods in Physics Research A 554 (2005) 247–254 253
the statistical accuracy achieved with the datataking procedure described in the previous sec-tions.
The main systematic effects in the analysis ofnuclear emulsions are the non-planarity of twoconsecutive emulsion films, due to the thicknessvariation of the passive material or separator, andthe local distortion of the sheets. The first effectbecomes relevant only on emulsion surfaces ofseveral square centimeters. The local distortion,instead, has a scale of a few square millimeters andis therefore the leading one.
Distortion effects on such thin emulsions are aslarge as a few milliradiants, which would com-pletely overcome the statistical error. In order tosuppress such an effect, the average trajectory ofother penetrating tracks of beam particles in asurrounding area of a few square millimeters isused as reference trajectory so that the relativetrajectory is built for each track. It is thereforenecessary to collect enough penetrating tracks.Given that the track density in the exposure isabout 15 tracks=mm2, an area of 2� 2mm2 issuitable for this purpose. The size of the areashould, of course, match the size of the effect. Theuse of the relative trajectory produces an almosttotal cancellation of the above systematic effects.
After measuring the base track in one emulsionsheet, we followed the tracks along the sevenconsecutive sheets. The track following is done bymeans of the inter-calibration of consecutiveemulsion sheets. The inter-calibration is performed
Entries 343
Mean 0.0004997
rad0 0.001 0.002 0.003 0.004 0.005
0
10
20
30
40
50
60
70
80
90
a.u.
343
Mean 0.0004997
Fig. 9. The angular accuracy for perpendicular tracks. The
median of the distribution is 0.40mrad.
by matching track patterns in consecutive sheets,one pair after the other. After following the trackin all consecutive sheets, we performed the trackfit. The difference of the track fit and the baseangle measurement (residual) in each emulsionsheet provides the accuracy of our measurement.The residuals of the angle measurement are
shown in Fig. 9. An average value of 0.5mrad isobtained. Given the asymmetric shape of thedistribution, the median provides a better estimateof the accuracy. The median value is 0.4mrad.We performed the same analysis also for
inclined tracks. Usually the measurement accuracydegrades with the angle. In Fig. 10 we show theresiduals for tracks inclined by 200mrad while inFig. 11 the residuals of 300mrad inclined tracks
ARTICLE IN PRESS
M. De Serio et al. / Nuclear Instruments and Methods in Physics Research A 554 (2005) 247–254254
are shown. The median is about 0.6mrad for200mrad tracks while it is still below 1mrad for300mrad tracks.
7. Conclusions
We have developed an automated scanningsystem aiming at very precise spatial and angularmeasurements. The system is designed for theanalysis of rare events where the accuracy is themain issue rather than the scanning speed. Wehave developed a new data taking and analysisprocedure to measure the track angles and we haveachieved unprecedented results: 0:06mm for theposition measurement, 0.4mrad for low angletracks (around 50mrad) and 0.95mrad for300mrad inclined tracks.
Acknowledgements
We acknowledge the support of the ItalianMinistry for Education (MIUR) which partiallyfunded this work within the PRIN2002 projects.We also acknowledge the fruitful collaboration ofmany colleagues of the OPERA Collaboration andof the technical staff in our laboratories. For thebeam exposure, we acknowledge the support of thePS staff at CERN.
References
[1] K. Niu, E. Mikumo, Y. Maeda, Prog. Theor. Phys. 46
(1971) 1644.
[2] J. Sacton, IIHE-98-02 Invited talk at International Work-
shop on Nuclear Emulsion, Nagoya, Japan, 12–14 June
1998.
[3] C.M.G. Lattes, H. Muirhead, G.P.S. Occhialini, C.F.
Powell, Nature 159 (1947) 585.
[4] S.W. Herb, et al., Phys. Rev. Lett. 39 (1977) 252.
[5] S. Aoki, et al., Nucl. Instr. and Meth. B 51 (1990) 466.
[6] G. Rosa, et al., Nucl. Instr. and Meth. A 394 (1997)
357.
[7] N. D’Ambrosio, et al., Nucl. Phys. B Proc. Suppl. 125
(2003) 22.
[8] N. Armenise, et al., Nucl. Instr. and Meth. A 551 (2–3) 75.
[9] E531 Collaboration, Nucl. Instr. and Meth. 224 (1984)
50.
[10] CHORUS Collaboration, Nucl. Instr. and Meth. A 401