ELSEVIER Journal of Food En&wing 25 ( 1995) 427-440 Copyright 8 1995 Elsevier Science Limited Printed in Great Britain. All rights reserved 0260-8774/05/S9.50 0260-8774(94)00000-O A Study of the Rheological Properties of Concentrated Food Emulsions 0. H. Campanella,” N. M. Dorward & H. Singh Department of Food Technology, Massey University, Palmerston North, New Zealand (Accepted 3 March 1994) ABSTRACT The rheological properties of oil-in-water emulsions stabilised by a variety of emulsifiers were investigated at oil phase volume concentrations rangingfiom 10 to 70% Most emulsions exhibited Newtonian behaviour at lower oil concentrations and either pseudoplastic or plastic behaviour at higher concentrations. Oil concentrations for all emulsions were normalised using a normalisation factor which was dependent on shear rate. This resulted in shear-independent curves of relative viscosity of emulsion (uJ against normalised oil concentration. These experimental shear-independent curves could be fitted with a mathematical empirical model up to a normalised oil concentration of about 1,2. The model was successfilly used to predict viscosities of other emulsion systems reported in the literature. It was also able to predict the rheological behaviour of an emulsion at a given oil concentration provided the flow curve of the same emulsion was known at another oil concentration. A theoretical model based on the increase of the volume of the emulsion globule due to the emulsifier adsorbed on the globule sulfhce and a flocculation 5 de- flocculation shear-dependent reaction was developed. This yielded an expression practically identical to the empirical model. Parameters of the theoretical model may be used to estimate the degree of aggregation and other microstructural characteristics of emulsions. INTRODUCTION Emulsions form the basis of many food products including homogenised milk, ice cream, butter and margarine, mayonnaise, cake batters, and sugar con- fectioneries, to name a few. The rheological properties of food emulsions are of *To whom correspondence should be addressed. 427
Transcript
ELSEVIER
Journal of Food En&wing 25 ( 1995) 427-440 Copyright 8 1995 Elsevier Science Limited Printed in Great Britain. All rights reserved
0260-8774/05/S9.50 0260-8774(94)00000-O
A Study of the Rheological Properties of Concentrated Food Emulsions
0. H. Campanella,” N. M. Dorward & H. Singh
Department of Food Technology, Massey University, Palmerston North, New Zealand
(Accepted 3 March 1994)
ABSTRACT
The rheological properties of oil-in-water emulsions stabilised by a variety of emulsifiers were investigated at oil phase volume concentrations rangingfiom 10 to 70% Most emulsions exhibited Newtonian behaviour at lower oil concentrations and either pseudoplastic or plastic behaviour at higher concentrations. Oil concentrations for all emulsions were normalised using a normalisation factor which was dependent on shear rate. This resulted in shear-independent curves of relative viscosity of emulsion (uJ against normalised oil concentration. These experimental shear-independent curves could be fitted with a mathematical empirical model up to a normalised oil concentration of about 1,2. The model was successfilly used to predict viscosities of other emulsion systems reported in the literature. It was also able to predict the rheological behaviour of an emulsion at a given oil concentration provided the flow curve of the same emulsion was known at another oil concentration. A theoretical model based on the increase of the volume of the emulsion globule due to the emulsifier adsorbed on the globule sulfhce and a flocculation 5 de- flocculation shear-dependent reaction was developed. This yielded an expression practically identical to the empirical model. Parameters of the theoretical model may be used to estimate the degree of aggregation and other microstructural characteristics of emulsions.
INTRODUCTION
Emulsions form the basis of many food products including homogenised milk, ice cream, butter and margarine, mayonnaise, cake batters, and sugar con- fectioneries, to name a few. The rheological properties of food emulsions are of
*To whom correspondence should be addressed.
427
428 0. H. Curnpanellu, N. M. Dorward, H. Singh
great interest to many industrial applications; examples being the selection of mixing equipment and the prediction of flow behaviour through pipelines and pumps. Assessment of texture including mouth-feel in emulsion-type food products also requires an understanding of the emulsion rheological properties and the factors that can influence the emulsion’s textural characteristics (Sherman, 1975).
To date, most of the research concerning the rheology of emulsions has been undertaken within the framework of equations derived for dispersions of non- deformable solid particles. In many cases the similarity of these systems with emulsions has proven to be close. Perhaps one of the best examples is the use of the well-known Einstein equation for dilute dispersions of hard spheres to predict the viscosity of very dilute emulsions
,&=1+25+ (I)
In this equation ,u, is the relative viscosity, which is defined as the ratio between the emulsion viscosity (,u) and the continuous phase viscosity (,M~), and # is the dispersed phase concentration in ‘Xv/v. However, as stated by Sherman ( 1968), most emulsions of practical interest largely exceed the range of oil concentra- tions for which the Einstein equation was derived. Therefore, a large number of modifications which extend the application of Einstein’s equation to more concentrated emulsions have been proposed. In general, all the relevant equa- tions derived from Einstein’s equation can be represented by the following poly- nomial in I:
&=l+a~+b~‘+C~~+d~~+ . . . (2)
where a, b, c and d are constants which vary from one emulsion to another and with shear rate. The results of studies applying eqn (2) and values of the model constants for various suspensions and emulsion systems have been summarised by Sherman ( 1968).
van Vliet and Walstra ( 1980) described the rheological behaviour of milk and cream with fat concentrations of up to 40% using a single equation for the relative viscosity which depends on the fat concentration (4) and the maximum packing concentration of the emulsion droplets (&,,.J:
Pal and Rhodes (1985, 1989) reviewed other relevant rheological models which were derived mainly for Newtonian suspensions, and demonstrated their inadequacy in describing the rheology of emulsions. These authors also developed an empirical equation capable to describing and predicting the Newtonian and non-Newtonian rheological behaviour of emulsions prepared with motor oils. A similar approach was followed by Jayasuriya et al. (1986), though they extended their investigation to the study of viscoelastic properties as well.
Recently, Suzuki et al. ( 1991) studied the effect of oil concentration, and type and concentration of emulsifier, on the rheological properties of oil-in-water
Kheological properties of concerztruted food emulsions 429
food emulsions. They found that the rheological behaviour of the emulsions studied ranged between Newtonian and pseudoplastic, and that the properties changed largely with both the type and concentration of emulsifier and with the oil concentration. These data, when plotted as viscosity against oil concentra- tion, showed a large spread, indicating that even for Newtonian emulsions it is not possible to obtain a single equation that can describe adequately the rheological behaviour of concentrated food emulsions.
As many concentrated food emulsions are pseudoplastic, it is of practical importance to be able to predict the viscosity of an emulsion as a function of both oil concentration and shear rate using one equation that represents the behaviour of these systems. Thus, the objectives of this investigation were:
( 1) To develop an empirical equation that can describe the Newtonian and non-Newtonian rheological behaviour of concentrated food emulsions using the normalisation approach of Pal and Rhodes.
(2) To propose a theoretical model for the flow behaviour of concentrated food emulsions based on an increase of the emulsion droplet volume owing to the emulsifier layer adsorbed on its surface, and on a shear rate- dependent flocculation 5 deflocculation process.
(3) To test the suitability of the equation developed to predict experimental data published in the literature.
MATERIALS AND METHODS
Seven sets of oil-in-water emulsions, each containing a different oil-emulsifier combination were prepared. The oils used were anhydrous milkfat (AMF) from the New Zealand Dairy Board, and palm oil and soy bean oil from Davis Trade Ltd.. New Zealand. The emulsifiers were sodium caseinate, lecithin (both supplied by the New Zealand Dairy Research Institute), and Tween 20 (polyoxyethylene-sorbitan monolaurate) and Span 20 (sorbitan monolaurate) made by Sigma. Each set consisted of six emulsions with oil concentrations of 20, 30, 40, 50, 60 and 70%. Table 1 shows the composition of each emulsion set. In all emulsions distilled water was used as the continuous phase.
For the water-soluble emulsifiers (sodium caseinate and Tween 20) a stock solution of each emulsifier was prepared. Aliquots of the stock solution were diluted with water to the appropriate level for each emulsion. Stock solutions of lecithin and Span 20 in oil were also prepared and diluted with the appropriate oil to the appropriate level.
All emulsions were prepared using a two-stage Rannie homogeniser operat- ing at a pressure of 2500 psig in the first stage and 500 psig in the second stage. Prior to homogenisation, a preliminary mixing of the oil and aqueous phase was carried out with a Sylverson variable speed mixer.
In order to determine the relative viscosity of the emulsion, the viscosity of the continuous phase was measured after subjecting it to the same homogenisa- tion cycle as that of the emulsion. As expected, the values measured differed only slightly from the viscosity of water. Rheological measurements were obtained at 25°C with a Bohlin Rheometer model VOR (Bohlin, Inc.) using a concentric-cylinder geometry (cup and bob diameters of 27.5 and 25 mm, respectively) over a shear rate range of 20-750 SK’.
430 0. H. Cumpanella, N. M. Dorward, H. Singh
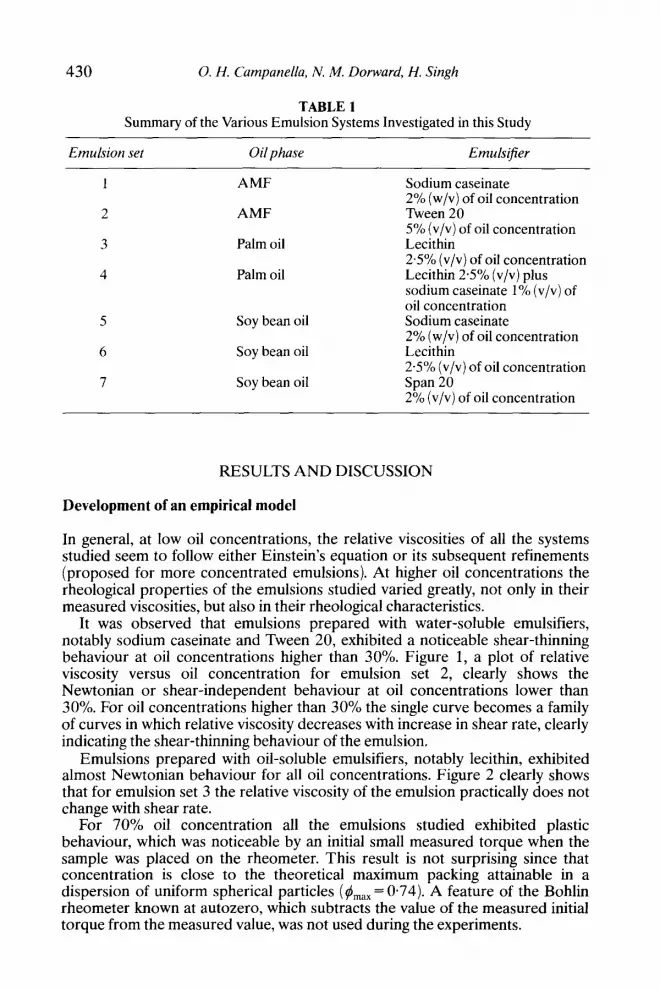
TABLE 1 Summary of the Various Emulsion Systems Investigated in this Study
Emulsion set Oil phase Emulsifier
1 AMF
2 AMF
3 Palm oil
4 Palm oil
5 Soy bean oil
6 Soy bean oil
7 Soy bean oil
Sodium caseinate 2% (w/v) of oil concentration Tween 20 5% (v/v) of oil concentration Lecithin 2.5% (v/v) of oil concentration Lecithin 2.5% (v/v) plus sodium caseinate 1% (v/v) of oil concentration Sodium caseinate 2% (w/v) of oil concentration Lecithin 2.5% (v/v) of oil concentration Span 20 2% (v/v) of oil concentration
RESULTS AND DISCUSSION
Development of an empirical model
In general, at low oil concentrations, the relative viscosities of all the systems studied seem to follow either Einstein’s equation or its subsequent refinements (proposed for more concentrated emulsions). At higher oil concentrations the rheological properties of the emulsions studied varied greatly, not only in their measured viscosities, but also in their rheological characteristics.
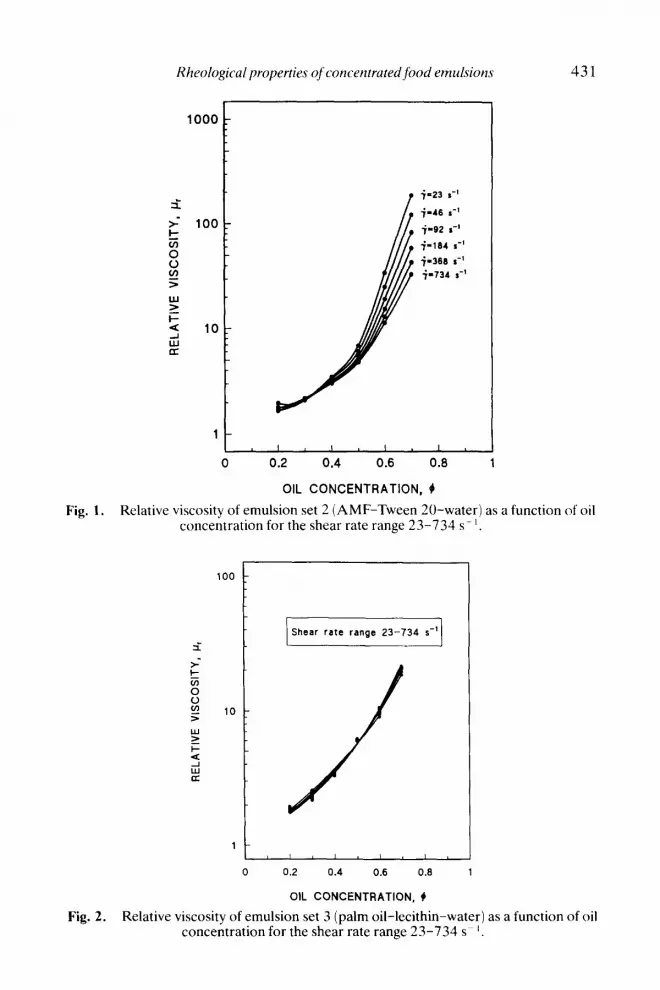
It was observed that emulsions prepared with water-soluble emulsifiers, notably sodium caseinate and Tween 20, exhibited a noticeable shear-thinning behaviour at oil concentrations higher than 30%. Figure 1, a plot of relative viscosity versus oil concentration for emulsion set 2, clearly shows the Newtonian or shear-independent behaviour at oil concentrations lower than 30%. For oil concentrations higher than 30% the single curve becomes a family of curves in which relative viscosity decreases with increase in shear rate, clearly indicating the shear-thinning behaviour of the emulsion.
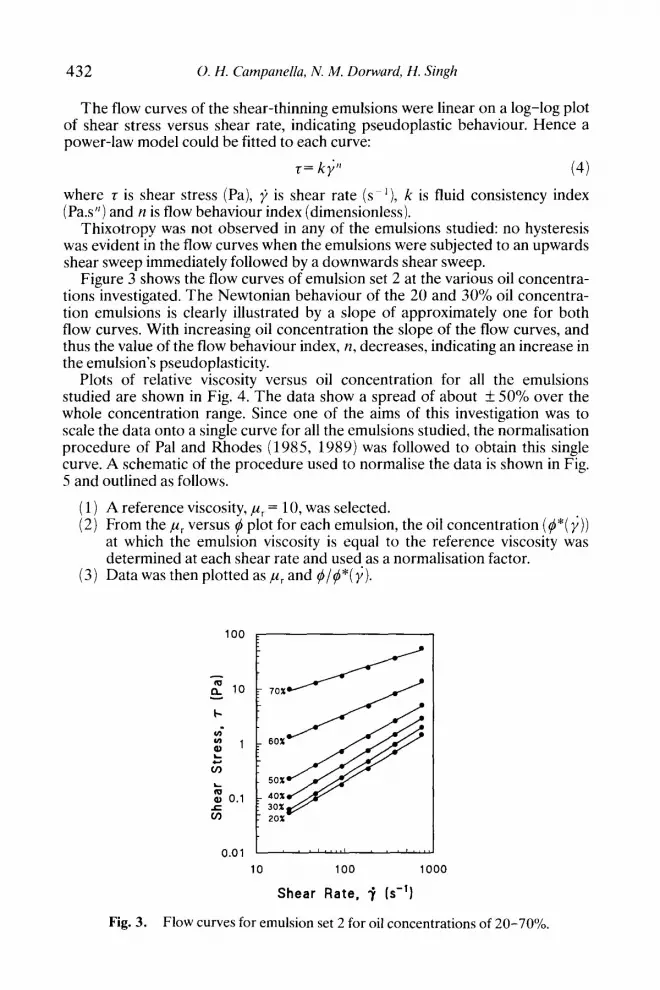
Emulsions prepared with oil-soluble emulsifiers, notably lecithin, exhibited almost Newtonian behaviour for all oil concentrations. Figure 2 clearly shows that for emulsion set 3 the relative viscosity of the emulsion practically does not change with shear rate.
For 70% oil concentration all the emulsions studied exhibited plastic behaviour, which was noticeable by an initial small measured torque when the sample was placed on the rheometer. This result is not surprising since that concentration is close to the theoretical maximum packing attainable in a dispersion of uniform spherical particles (I,,,,, = 0.74). A feature of the Bohlin rheometer known at autozero, which subtracts the value of the measured initial torque from the measured value, was not used during the experiments.
Rheological properties of concentrated food emulsion 431
1000
5
=‘ 100
z
g > w L l- 4 10 =I a
1
i-23 s-1
i-46 s-'
j-62 s-1
f-164 s-1
f-366 s-'
f-734 se'
0 0.2 0.4 0.6 0.6 1
OIL CONCENTRATION, 4
Fig. 1. Relative viscosity of emulsion set 2 (AMF-Tween 20-water) as a function of oil concentration for the shear rate range 23-734 SC’.
1
0 0.2 0.4 0.6 0.8 1
OIL CONCENTRATION, +
Fig. 2. Relative viscosity of emulsion set 3 (palm oil-lecithin-water) as a function of oil concentration for the shear rate range 23-734 s- I.
432 0. H. Campanella, N. M. Forward, H. Singh
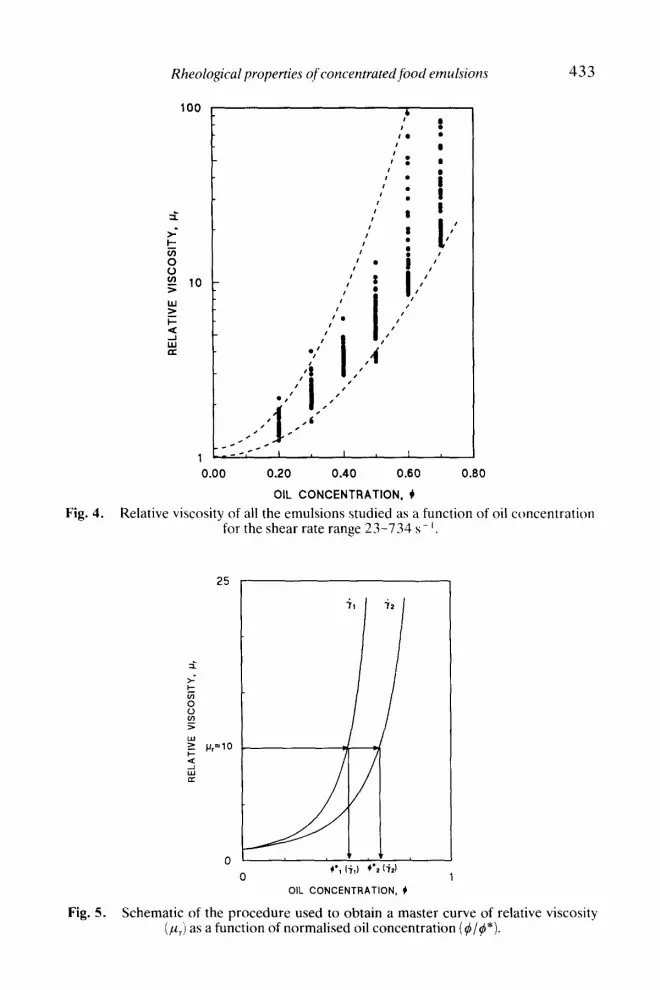
The flow curves of the shear-thinning emulsions were linear on a log-log plot of shear stress versus shear rate, indicating pseudoplastic behaviour. Hence a power-law model could be fitted to each curve:
r= ky” (4)
where t is shear stress (Pa), i is shear rate (ss’), k is fluid consistency index (Pa.s”) and n is flow behaviour index (dimensionless).
Thixotropy was not observed in any of the emulsions studied: no hysteresis was evident in the flow curves when the emulsions were subjected to an upwards shear sweep immediately followed by a downwards shear sweep.
Figure 3 shows the flow curves of emulsion set 2 at the various oil concentra- tions investigated. The Newtonian behaviour of the 20 and 30% oil concentra- tion emulsions is clearly illustrated by a slope of approximately one for both flow curves. With increasing oil concentration the slope of the flow curves, and thus the value of the flow behaviour index, n, decreases, indicating an increase in the emulsion’s pseudoplasticity.
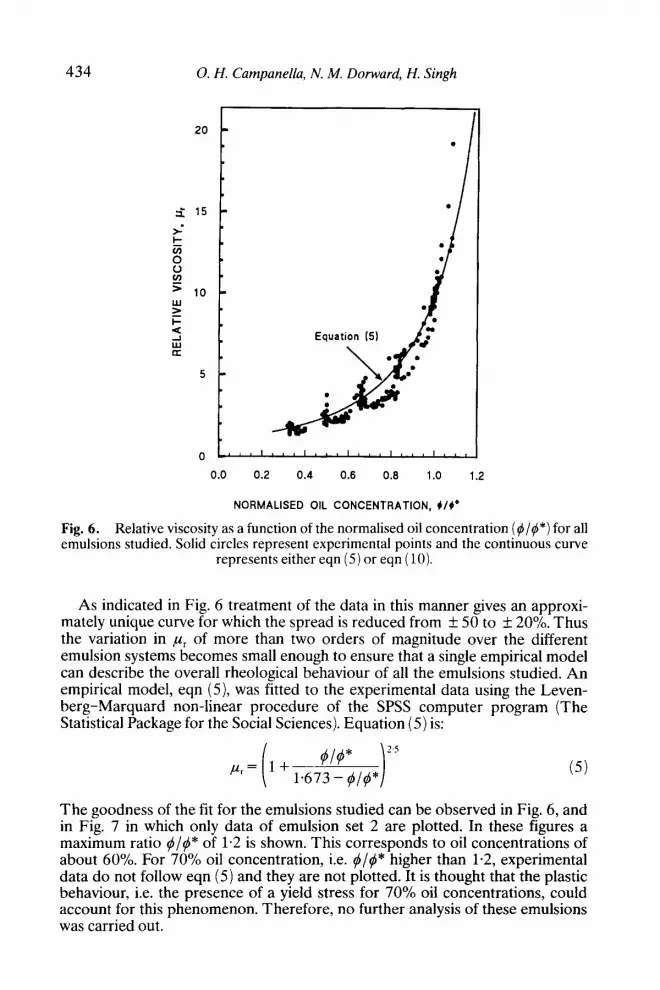
Plots of relative viscosity versus oil concentration for all the emulsions studied are shown in Fig. 4. The data show a spread of about IL 50% over the whole concentration range. Since one of the aims of this investigation was to scale the data onto a single curve for all the emulsions studied, the normalisation procedure of Pal and Rhodes (1985, 1989) was followed to obtain this single curve. A schematic of the procedure used to normalise the data is shown in Fig. 5 and outlined as follows.
( 1) A reference viscosity, ,uu, = 10, was selected. (2) From the p, versus 4 plot for each emulsion, the oil concentration (I*(j))
at which the emulsion viscosity is equal to the reference viscosity was determined at each shear rate and used as a normalisation factor.
(3) Data was then plotted as y, and #/4*(y).
10 100 1000
Shear Rate, T Is-‘)
Fig. 3. Flow curves for emulsion set 2 for oil concentrations of 20-70%.
Fig. 4. Relative viscositv of all the emulsions studied as a function of oil concentration -for the shear rate range 23-734 SC’.
OIL CONCENTRATION, +
Fig. 5. Schematic of the procedure used to obtain a master curve of relative viscosity (pu,) as a function of normalised oil concentration (#I$*).
434 0. H. Campanella, N. M. Dorward, H. Singh
20 -
0 ,,,',,,'..,'.',',,,',.,
0.0 0.2 0.4 0.6 0.6 1.0 1.2
NORMALISED OIL CONCENTRATION, 4/V
Fig. 6. Relative viscosity as a function of the normalised oil concentration (#/#*) for all emulsions studied. Solid circles represent experimental points and the continuous curve
represents either eqn (5) or eqn ( 10).
As indicated in Fig. 6 treatment of the data in this manner gives an approxi- mately unique curve for which the spread is reduced from + 50 to f 20%. Thus the variation in ,u, of more than two orders of magnitude over the different emulsion systems becomes small enough to ensure that a single empirical model can describe the overall rheological behaviour of all the emulsions studied. An empirical model, eqn (5), was fitted to the experimental data using the Leven- berg-Marquard non-linear procedure of the SPSS computer program (The Statistical Package for the Social Sciences). Equation (5) is:
4t4* 2.5
“= ’ + I.673 - $I#*
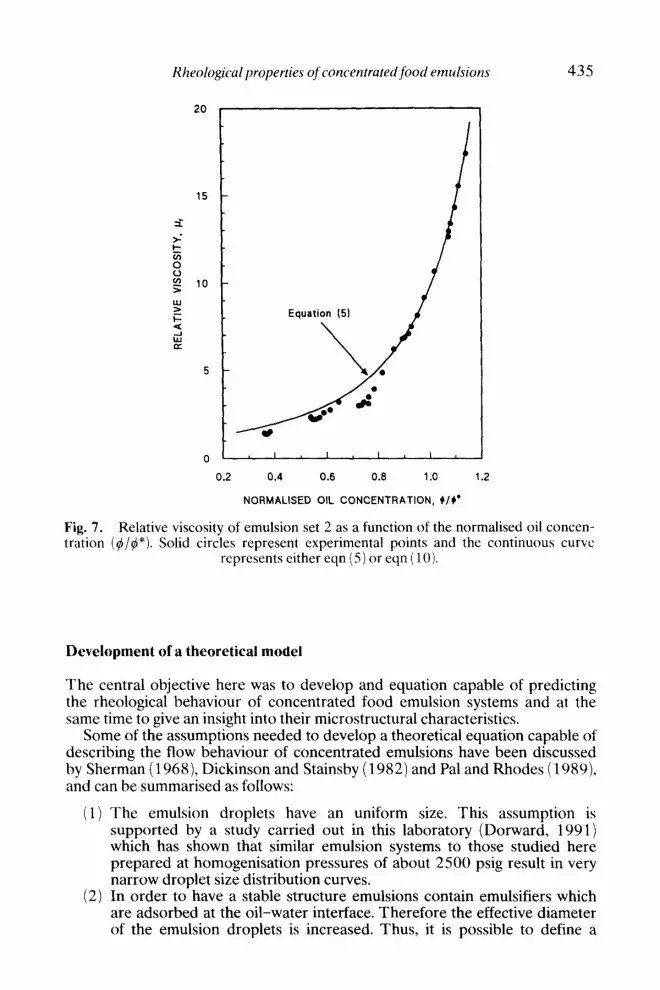
The goodness of the fit for the emulsions studied can be observed in Fig. 6, and in Fig. 7 in which only data of emulsion set 2 are plotted. In these figures a maximum ratio 4/4* of 1.2 is shown. This corresponds to oil concentrations of about 60%. For 70% oil concentration, i.e. 4/4* higher than 1.2, experimental data do not follow eqn (5) and they are not plotted. It is thought that the plastic behaviour, i.e. the presence of a yield stress for 70% oil concentrations, could account for this phenomenon. Therefore, no further analysis of these emulsions was carried out.
Rheological properties of concentrated food emulsions 435
i
0.2 0.4 0.6 0.6 1.0 1.2
NORMALISED OIL CONCENTRATION, +I+’
Fig. 7. Relative viscosity of emulsion set 2 as a function of the normalised oil concen- tration ($/#*). Solid circles represent experimental points and the continuous curve
represents either eqn (5) or eqn ( 10).
Development of a theoretical model
The central objective here was to develop and equation capable of predicting the rheological behaviour of concentrated food emulsion systems and at the same time to give an insight into their microstructural characteristics.
Some of the assumptions needed to develop a theoretical equation capable of describing the flow behaviour of concentrated emulsions have been discussed by Sherman (1968), Dickinson and Stainsby (1982) and Pal and Rhodes (lW&), and can be summarised as follows:
(1)
(2)
The emulsion droplets have an uniform size. This assumption is supported by a study carried out in this laboratory (Dorward, 1991) which has shown that similar emulsion systems to those studied here prepared at homogenisation pressures of about 2500 psig result in very narrow droplet size distribution curves. In order to have a stable structure emulsions contain emulsifiers which are adsorbed at the oil-water interface. Therefore the effective diameter of the emulsion droplets is increased. Thus, it is possible to define a
436 0. H. Campanella, N. M. Donvard, H. Singh
(3)
volume increase factor, K,, given by the equation:
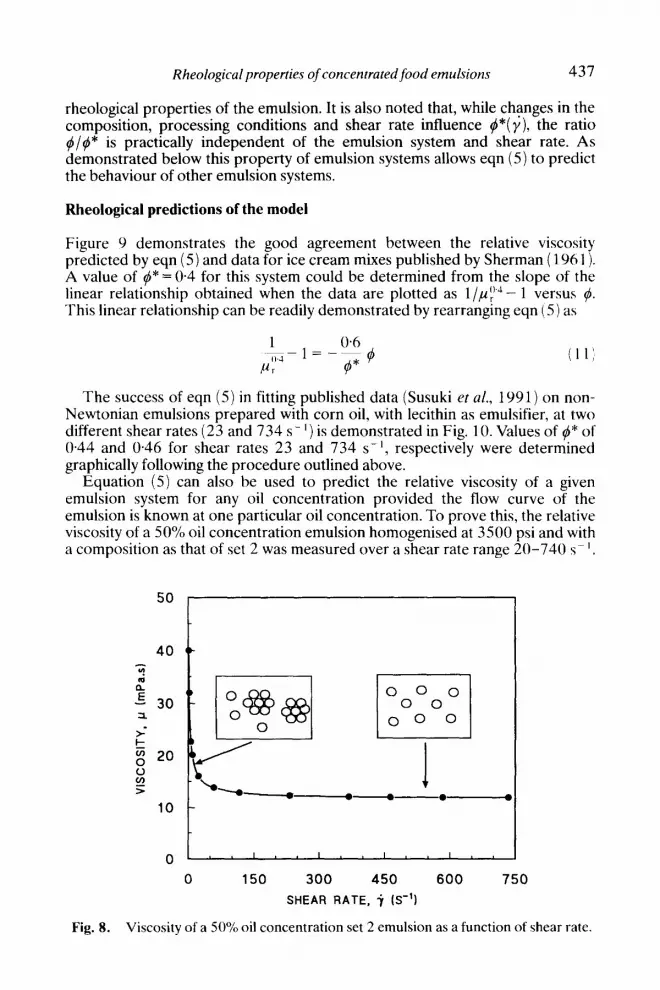
I$ is the volume of the emulsion droplet and Vr is the combined volume of the droplet and the emulsifier layer. Emulsion droplets can be held together by London-Van der Waal’s attractive forces forming aggregates or floes which hold a certain amount of continuous phase. The structure of these aggregates is affected by the shear rate. With increasing shear rates this structure breaks up and some continuous phase liquid is released. Thus, an increase in shear rate leads to a decrease in the effective dispersed phase concentration and a reduc- tion in viscosity. When the aggregates are completely broken into single droplets further increase in shear rate does not affect the viscosity. This behaviour is illustrated in Fig. 8 in which the viscosity of emulsion set 2 is plotted as a function of shear rate. The absence of thixotropy indicates that the deflocculation phenomenon is reversible, that is floes will form again when the shear rate is reduced. Therefore, it can be considered that the shear-thinning effect observed in concentrated emulsions is due to a flocculation % deflocculation reaction which depends on shear rate. Since the existence of aggregates or floes in a concentrated emulsion depends primarily on the shear rate, a coefficient Kr( y) could be defined.
Pal and Rhodes ( 1989), using both coefficients K,, and KF( y ), showed that the relative viscosity of the emulsion (,u~) can be expressed as:
1
Lcr=(l -K,,K,(y)$)Z~5
Given the definition of I*(y) followed in this work,
pL,=10 at #=#*
Substitution of eqn (8) into eqn (7) gives:
0.60 &a4=-
I*
and the equation for the relative viscosity results in:
1
” = (I- @6Qj/#*)2’5 = (10)
It can be noted that the agreement between eqn (5) and eqn ( 10) is excellent. As indicated by eqn (9) the model also shows that the normalisation factor I*(y) depends on both the characteristics of the emulsion and the shear rate. The parameter K, accounts for factors inherent in the emulsion that affect the viscosity, such as concentration and type of emulsifier and droplet size, whereas the parameter Kr( j) takes into account the effect of the shear rate on the
Rheological properties of concentrated food emulsions 437
rheological properties of the emulsion. It is also noted that, while changes in the composition, processing conditions and shear rate influence 4*(y), the ratio $/$* is p rat rca t’ 11 y independent of the emulsion system and shear rate. As demonstrated below this property of emulsion systems allows eqn (5) to predict the behaviour of other emulsion systems.
Rheological predictions of the model
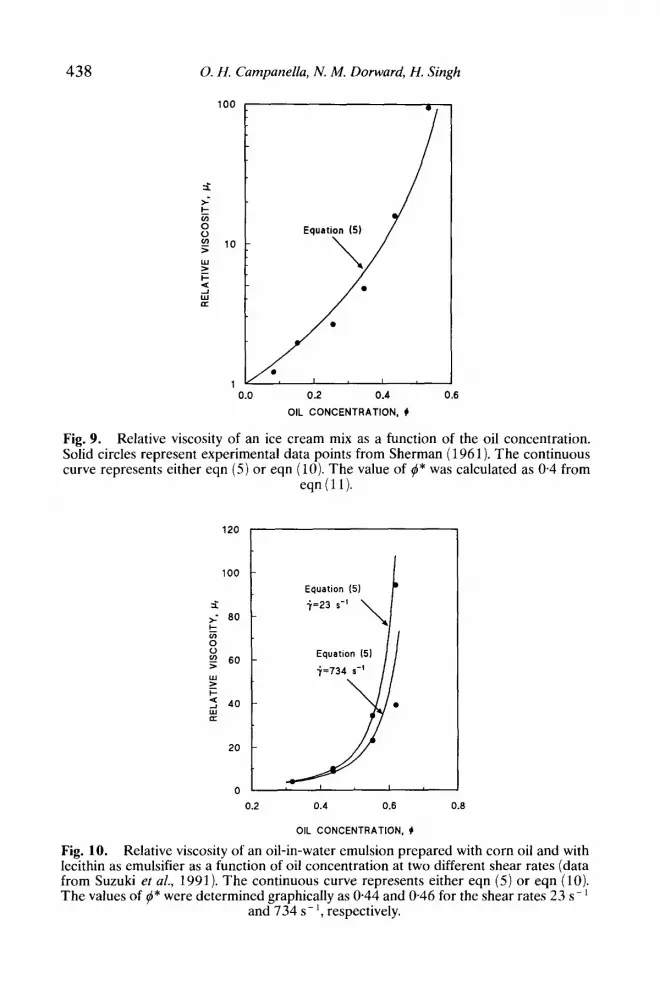
Figure 9 demonstrates the good agreement between the relative viscosity predicted by eqn (5) and data for ice cream mixes published by Sherman ( 196 1). A value of #* = 0.4 for this system could be determined from the slope of the linear relationship obtained when the data are plotted as l/p:” - 1 versus 4. This linear relationship can be readily demonstrated by rearranging eqn ( 5) as
The success of eqn (5) in fitting published data (Susuki et al., 1991) on non- Newtonian emulsions prepared with corn oil, with lecithin as emulsifier, at two different shear rates (23 and 734 s- ’ ) is demonstrated in Fig. 10. Values of #:” of 0.44 and 0.46 for shear rates 23 and 734 SC’, respectively were determined graphically following the procedure outlined above.
Equation (5) can also be used to predict the relative viscosity of a given emulsion system for any oil concentration provided the flow curve of the emulsion is known at one particular oil concentration. To prove this, the relative viscosity of a 50% oil concentration emulsion homogenised at 3500 psi and with a composition as that of set 2 was measured over a shear rate range 20-740 s- ’ .
50
40 ‘;; ui 2 - 30 1
z g 20 0 ” z
10
0
0 300 450 SHEAR RATE. + (S-‘1
600
Fig. 8. Viscosity of a 50% oil concentration set 2 emulsion as a function of shear rate.
438 0. H. Campanella, N. M. Dorward, H. Singh
i
t
0.0 0.2 0.4 0.6
OIL CONCENTRATION, #
Fig. 9. Relative viscosity of an ice cream mix as a function of the oil concentration. Solid circles represent experimental data points from Sherman ( 196 1). The continuous curve represents either eqn (5) or eqn (10). The value of I* was calculated as 0.4 from
eqn(l1).
100
20
0
0.2 0.4 0.6 0.8
OIL CONCENTRATION, #
Fig. 10. Relative viscosity of an oil-in-water emulsion prepared with corn oil and with lecithin as emulsifier as a function of oil concentration at two different shear rates (data from Suzuki et al., 1991). The continuous curve represents either eqn (5) or eqn (10). The values of #* were determined graphically as 0.44 and 0.46 for the shear rates 23 S-I
and 734 s - ’ , respectively.
Rheologicalproperties of concentrated food emulsions 4139
At various shear rates $* was calculated (by rearrangement of eqn ( 11)) as:
(12)
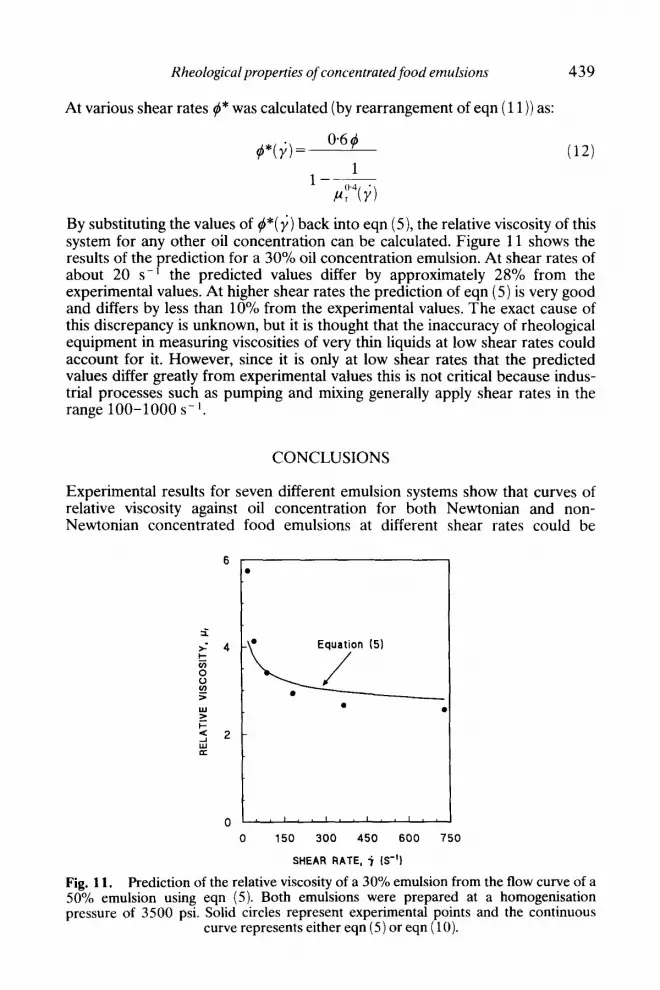
By substituting the values of 4*(j) back into eqn (5), the relative viscosity of this system for any other oil concentration can be calculated. Figure 11 shows the results of the prediction for a 30% oil concentration emulsion. At shear rates of about 20 s-r the predicted values differ by approximately 28% from the experimental values. At higher shear rates the prediction of eqn (5) is very good and differs by less than 10% from the experimental values. The exact cause of this discrepancy is unknown, but it is thought that the inaccuracy of rheological equipment in measuring viscosities of very thin liquids at low shear rates could account for it. However, since it is only at low shear rates that the predicted values differ greatly from experimental values this is not critical because indus- trial processes such as pumping and mixing generally apply shear rates in the range 100-1000 s-l.
CONCLUSIONS
Experimental results for seven different emulsion systems show that curves of relative viscosity against oil concentration for both Newtonian and non- Newtonian concentrated food emulsions at different shear rates could be
6 .
i
z - 4
f 0
2 5 w 2
2 2 iii oz
LL7” (5,
. , .
0 150 300 450 600 750
SHEAR RATE, -j IS-‘)
Fig. 11. Prediction of the relative viscosity of a 30% emulsion from the flow curve of a 50% emulsion using eqn (5). Both emulsions were prepared at a homogenisation pressure of 3500 psi. Solid circles represent experimental points and the continuous
curve represents either eqn (5) or eqn ( 10).
440 0. H. Campanella, N. M. Dorward, H. Singh
reduced to a single curve provided the oil concentration is normalised and provided the normalised oil concentration does not exceed the value 1.2. With a proper value for the normalisation factor, in the present work defined as the oil concentration at which the relative viscosity has a value of 10, a suitable empirical equation was obtained by fitting the ex erimental suitability of the empirical equation obtained (eqn (5) P
results. The was tested successfully
with rheological data for Newtonian and non-Newtonian emulsions published in the literature. The equation was also able to predict the rheological properties of an emulsion at a selected oil concentration provided the flow curve of the emulsion at another oil concentration was known.
A theoretical model, eqn ( lo), was obtained which is practically identical to the empirical equation. The model depends on the definition of the normalisa- tion factor and takes into account the effective volume of the emulsion globules and the effect of shear rate on a flocculation % deflocculation reaction. It relates the viscosity of the emulsion to the effective globule volume and the extent of liquid occluded within floes; these two factors being accounted for by the para- meters K,, and K&Y), respectively. Therefore, the theoretical model may be used to interpret the measured rheological properties of emulsions in terms of their microstructural properties.
ACKNOWLEDGEMENTS
The financial support from Massey University as a Summer Scholarship for N. M. Dorward in gratefully acknowledged. The authors also want to thank Dr 0. J. McCarthy, whose valuable remarks have contributed to the improvement of the manuscript.
REFERENCES
Dickinson. E. & Stainsby. G. (1982). Rheology. In Colloids in Food. Applied Science, London.
Dorward. N. M. ( 1991). Properties of Food Emulsions. Bachelor of Technology Research Project Report, Massey University, New Zealand.
Jayasuriya, D. S., Varanasi, P. R. & Tcheurekdjian, N. (1986). Viscoelastic properties of concentrated oil-in-water emulsions stabilised by mixed non-ionic surfactant. Colloids and Surfaces, 2 1,37 l-9 1.
Pal, R. & Rhodes, E. (1985). A novel viscosity correlation for non-Newtonian con- centrated emulsions. J. Colloid Interface Sci., 107 (2), 30 l-7.
Pal, R. & Rhodes, E. (1989). Viscosity/concentration relationships for emulsions. J. Rheol., 33 (7), 1021-44.
Sherman, P. ( 196 1). Rheological methods for studying the physical properties of emulsi- fier films at the oil-water interface in ice cream. Food Technol., September, 394-9.
Sherman, P. (1968). Rheology of emulsions. In Emulsion Science, ed. P. Sherman. Academic Press, London.
Sherman, P. ( 1975). Factors influencing the instrumental and sensory evaluation of food emulsions. In Theory, Determination and Control of Physical Properties of Food Materials, ed. D. ChoKyun Rha. Reidel Publishing, Dordrecht, Holland, pp. 2.5 l-6.
Suzuki, K., Maeda, T., Matsuoka, K. & Kubota, K. ( 199 1). Effects of constituent con- centration on rheological properties of corn oil-in-water emulsions. J. Food Sci., 56 (3), 796-8.
van Vliet, T. & Walstra, P. (1980). Relationship between viscosity and fat content of milk and cream. J. Texture Studies, 11,658.