This is an Open Access article distributed under the terms of the Creative Commons Attribution Non-Commercial License (http://creativecommons.org/ licenses/by-nc/4.0/), which permits non-commercial re-use, distribution, and reproduction in any medium, provided the original work is properly cited. For commercial re-use, please contact [email protected]
Research Paper
Detection of the adulteration of extra virgin olive oil by near-infrared spectroscopy and chemometric techniquesNick Vanstone,*,** Andrew Moore,** Perry Martos** and Suresh Neethirajan*
*BioNano Laboratory, School of Engineering, University of Guelph, 50 Stone Road East, Guelph, Ontario N1G 2W1, Canada, **Agriculture & Food Laboratory, Laboratory Services Division, University of Guelph, 95 Stone Road West, Guelph, Ontario N1G 2Z4, Canada
Correspondence to: Nick Vanstone, Agriculture & Food Laboratory, Laboratory Services Division, University of Guelph, 95 Stone Road West, Guelph, Ontario N1G 2Z4, Canada. E-mail: [email protected]
Received 15 November 2017; Revised 29 January 2018; Editorial decision 24 April 2018.
Abstract
Introduction and Objectives: Due to the value of extra virgin olive oil (EVOO), adulteration has become an important issue in the industry, which has created demand for quick and inexpensive fraud detection testing. In contrast to many current food fraud detection methods, near-infrared spectroscopy (NIRS) can be inexpensive and convenient by minimizing sample preparation and measurement times. In this study, we developed a method using NIRS and chemometrics to detect adulteration of EVOO with other edible oil types that does not require sample preparation and can be completed in less than 10 min. Methods, Results, and Discussions: First, a single EVOO was adulterated with corn oil from 2.7% to 25% w/w. Spectra for the unadulterated sample and its adulterated counterparts were measured. A principal component analysis (PCA) scores plot showed separation between the adulterated mixtures and the unadulterated sample, which demonstrated that the developed method could detect as low as 2.7% w/w adulteration if an unadulterated sample of the oil in question is provided. To study adulteration detection without an unadulterated sample for reference, the spectra of unadulterated samples and samples adulterated with corn, sunflower, soybean, and canola oils were measured. A PCA with soft independent modelling of class analogy was used for adulteration detection. Lower limits of adulteration detection for corn, sunflower, soybean, and canola oils were found to be approximately 20%, 20%, 15%, and 10%, respectively.Conclusions: These results demonstrate that the developed method can be used to rapidly screen for adulterated olive oils.
Edible plant oils are a commonly used cooking ingredient around the world. With high unsaturated fat content, plant oils are often considered to be an important component of a healthy diet. Olive oil is plant oil extracted from the pressings of olives and is an important
fat source in many Mediterranean countries and throughout the world (López-Miranda et al., 2010). Extra virgin olive oil (EVOO) is the highest quality olive oil and its health benefits have been exten-sively studied. When consumed as part of a traditional Mediterranean diet, EVOO has shown to be beneficial in preventing heart- and
Food Quality and Safety, 2018, 2, 189–198doi:10.1093/fqsafe/fyy018
Research PaperAdvance Access publication 7 November 2018
Dow
nloaded from https://academ
ic.oup.com/fqs/article/2/4/189/5164291 by guest on 16 O
obesity-related health issues (López-Miranda et al., 2010). The health benefits of EVOO are largely attributed to high levels of monounsatu-rated fat as well as anti-oxidant and anti-inflammatory properties of minor phenolic compounds in the oil (López-Miranda et al., 2010). In addition to health benefits, olive oil is also desired for its flavour-related qualities (Yang and Irudayaraj, 2001). As a healthy and enjoy-able product, a large and lucrative global market for EVOO products has formed. According to the International Olive Council (IOC), 2.9 million tons of olive oil were consumed globally in the 2014/2015 olive crop year (1 October to 30 September), with the majority being produced in Spain, Italy, Portugal, and Greece (International Olive Council, 2017c). In the 2014/2015 olive crop year, EVOO consump-tion in Canada, the USA, and the European Union was approximately 37,500, 295,000, and 1.6 million tons, respectively (International Olive Council, 2017c). According to the government of Canada, Canadians imported approximately $169 million CAD worth of olive oil in 2015 (Statistics Canada & US Census Bureau, 2016). Demand for EVOO as a result of health and flavour qualities has resulted in higher selling prices and an overall lucrative industry.
Adulteration
With the potential for profitability, the olive oil industry has become subject to fraudulent activity. EVOO, being the highest quality olive oil, is logically the most prone to fraud. EVOO is extracted by mechanical means from the first pressing of the olives and does not undergo any further chemical treatment or heating (Yang and Irudayaraj, 2001). Lower grades of oil may undergo further processing which can remove many of the desirable flavour-related features possessed by an EVOO (Yang and Irudayaraj, 2001). Although EVOOs have a greater value than refined oils, they appear to share a lot of similar physical char-acteristics. The typical consumer may not be able to detect whether a product that is labelled as extra virgin is in fact authentic, or whether it is refined or mixed to some degree with lower quality oil. The high value of EVOO and the potential difficulty in detecting fraud have created an incentive for adulteration in the industry. With respect to EVOO, adulteration typically consists of the addition and/or substi-tution of lower quality olive oils or other types of edible oils (Frankel et al., 2011). Most edible vegetable oils are mainly composed of differ-ent proportions of the same or similar fatty acids (Kostik et al., 2013). When an EVOO and edible oil are mixed, the resulting oil consists of the fatty acids and other compounds from both oils (Ruiz-Samblás et al., 2012). The addition of edible oils to an EVOO in moderate or small amounts can be difficult for the typical consumer or retailer to detect by examining the physical characteristics of an EVOO product. An EVOO product may be significantly adulterated such that it does not meet extra virgin requirements but still appears to be of extra vir-gin quality to the retailer or consumer. This can provide an economic benefit to the producer. A producer may adulterate EVOO with refined olive oils or other refined edible oils in an attempt to sell a lower qual-ity mixture for a higher price. Typical adulterants would likely include edible oils that are much cheaper than EVOO, as there will be a greater profit for the fraudulent producer.
To ensure the quality and purity of EVOO, the IOC exists as an international organization which has duties that include providing quality standards for different grades of olive oil (International Olive Council, 2017a). Despite these legal standards, fraudulent activity has been reported in the olive oil industry. A report from the UC Davis Olive Center in 2011 stated that many of the most popular olive oil brands in California did not meet the international legal requirements to be classified as Extra Virgin (Frankel et al., 2011). Additionally, the report outlined that reasons for failing to meet extra virgin standards include “(a) oxidation by exposure to elevated temperatures, light,
and/or aging; (b) adulteration with cheaper refined olive oil; and (c) poor quality oil made from damaged and overripe olives, processing flaws, and/or improper oil storage” (Frankel et al., 2011). In addition to possibly preventing olive oils from meeting extra virgin require-ments, adulteration will reduce the presence of EVOO in a product and can in turn reduce its associated health benefits and flavour quali-ties. Additional health issues may also occur if an adulterant such as peanut oil is used, as some consumers may be allergic to the peanut proteins in the adulterant. Adulteration of EVOO may also lead to performance-related issues with regards to cooking (Nunes, 2014).
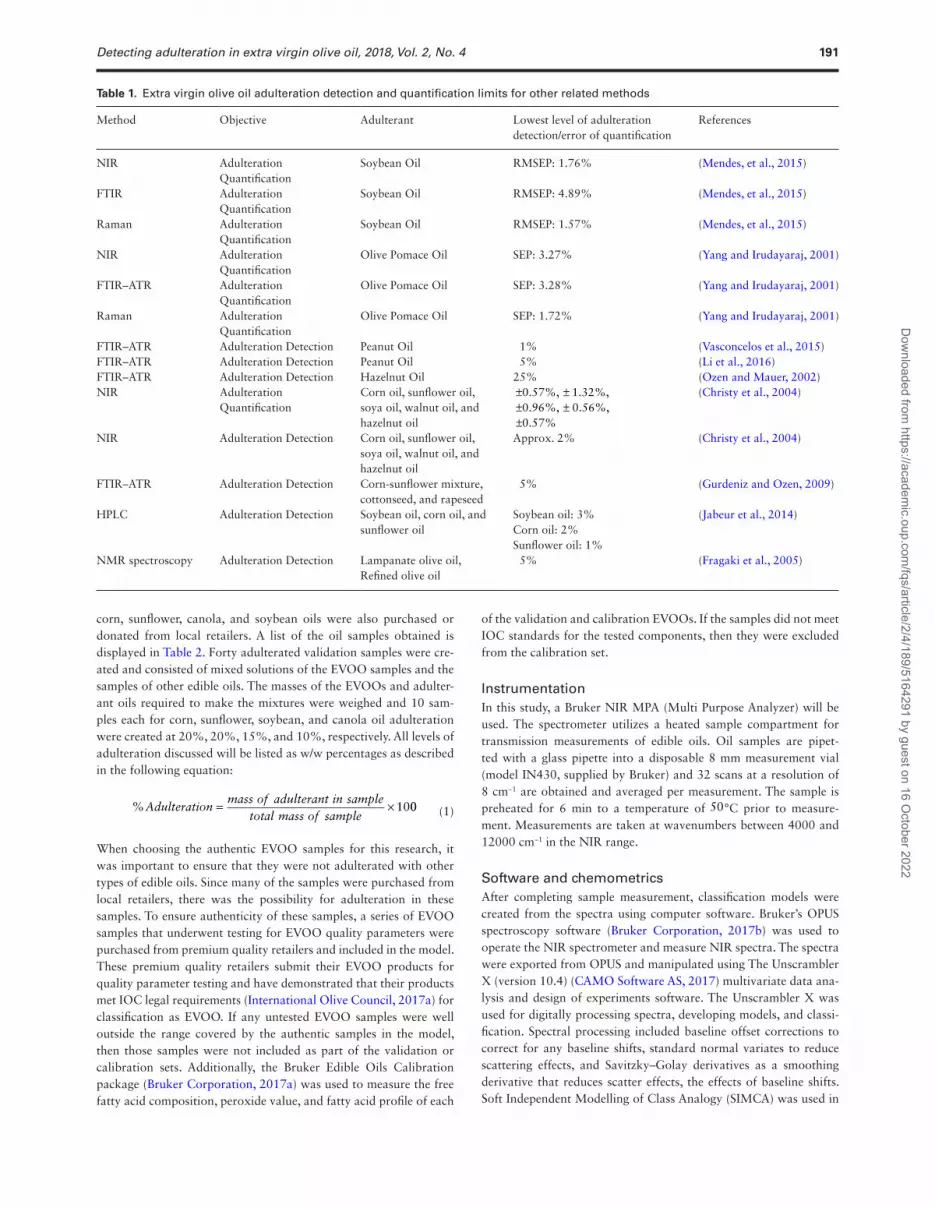
Near-infrared spectroscopy
There is a need for reliable, rapid, and inexpensive adulteration detec-tion methods in the commercial extra virgin olive oil industry. A com-mercially effective testing method will be inexpensive and able to quickly and accurately handle large volumes of samples. Techniques such as gas and liquid chromatography have been shown to be able to detect adulteration in EVOO (Andrikopoulos et al., 2001) and sen-sory panels also exist for the evaluation of EVOO (International Olive Council, 2017b). Vibrational spectroscopy provides non-destructive options that can be accurate, quick, and inexpensive (Mendes et al., 2015). Studies described in Table 1 have shown that mid-infrared (MIR) spectroscopy can detect and quantify adulteration of EVOO with Attenuated Total Reflection (ATR) sampling components. Table 1 also lists studies that show that Raman spectroscopy can accurately identify and quantify adulteration. Near-infrared spectros-copy (NIRS) has also been shown to be a promising testing method for the detection and quantification of adulteration in extra virgin olive oil (Christy et al., 2004). Near-infrared (NIR) spectroscopic measure-ments can be accurate, quick, inexpensive, and non-destructive, giving it the potential to be an ideal method for testing in the EVOO indus-try. Methods require little to no sample preparation and samples can remain intact after analysis. The largest disadvantage of NIRS appears to be a lack of development in the area of adulteration detection. A study by Azizian et al. explains and describes a NIRS adulteration detection method, but indicates that further development of the tech-nique is required (Azizian et al., 2015). Further development of NIRS methods for EVOO adulteration detection may allow for NIRS to be ideal for large-scale testing applications in industry.
A method to detect adulteration in extra virgin olive oil will be developed and validated using NIRS and chemometrics. In general, a lot of the previously existing research in this area focuses on detecting EVOO adulteration with some knowledge of the EVOO or adulterant. In many cases, adulteration detection is studied for a single sample of olive oil. That is, a single type or brand of olive oil is considered and adulteration detection in that type or brand is measured. The purpose of this study is to develop a more general method to detect adulteration in EVOO regardless of the type and origin of either the EVOO or the adul-terant. Additional challenges are introduced in this scenario because the properties of an authentic version of the sample in question are unavail-able for comparison. Although more difficult, this has the potential to be more applicable in industry because information about the EVOO and the adulterant is not always known. The ultimate goal is to develop a method that meets the needs of the olive oil industry. To do this, the method should be practical, fast, inexpensive, and applicable to samples with and without an unadulterated control for reference.
Materials and methods
SamplesForty-seven samples of EVOO were purchased or donated from local retailers near Guelph, Ontario, Canada. Five samples each of
190 N. Vanstone et al., 2018, Vol. 2, No. 4
Dow
nloaded from https://academ
ic.oup.com/fqs/article/2/4/189/5164291 by guest on 16 O
ctober 2022
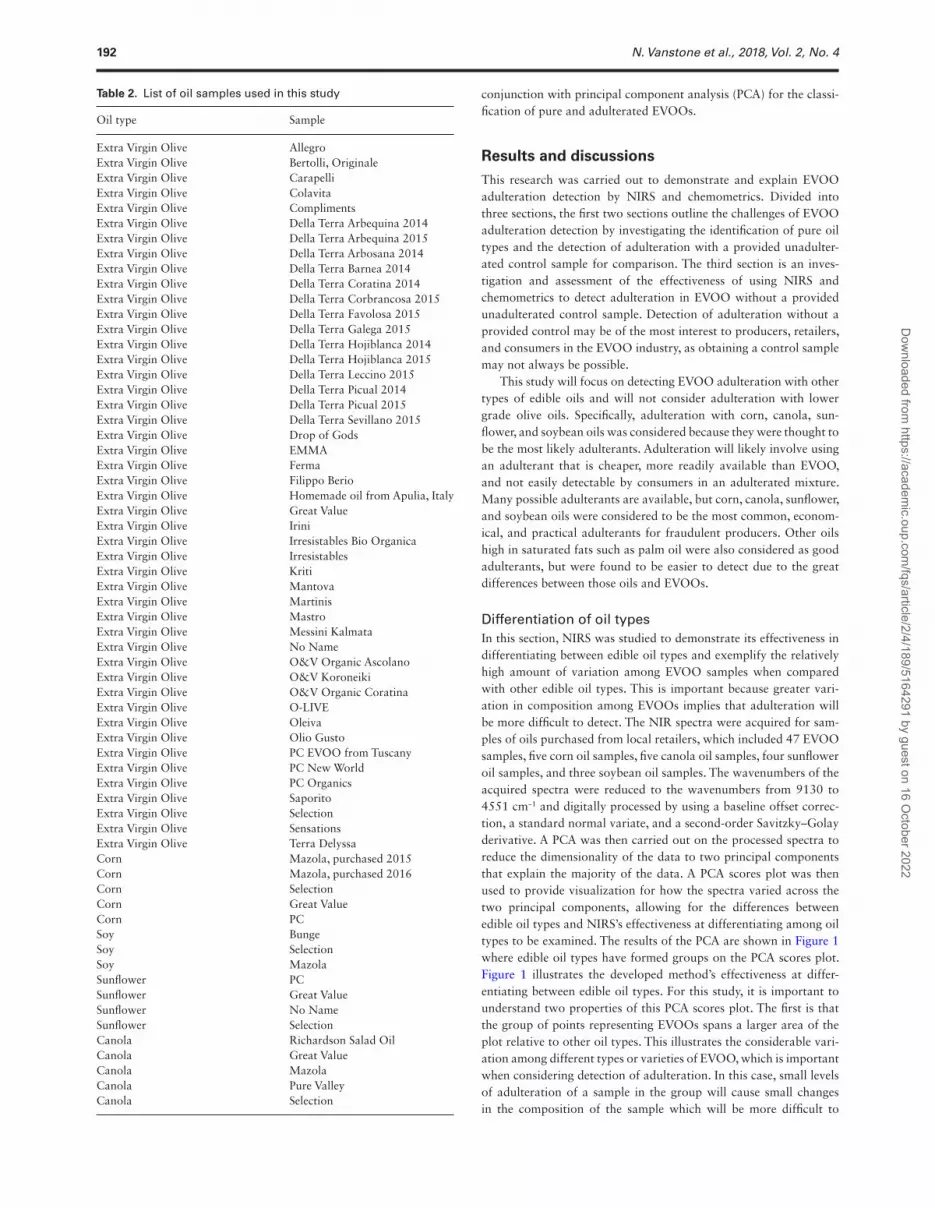
corn, sunflower, canola, and soybean oils were also purchased or donated from local retailers. A list of the oil samples obtained is displayed in Table 2. Forty adulterated validation samples were cre-ated and consisted of mixed solutions of the EVOO samples and the samples of other edible oils. The masses of the EVOOs and adulter-ant oils required to make the mixtures were weighed and 10 sam-ples each for corn, sunflower, soybean, and canola oil adulteration were created at 20%, 20%, 15%, and 10%, respectively. All levels of adulteration discussed will be listed as w/w percentages as described in the following equation:
%Adulterationmass of adulterant in sample
total mass of sample= × 1000 (1)
When choosing the authentic EVOO samples for this research, it was important to ensure that they were not adulterated with other types of edible oils. Since many of the samples were purchased from local retailers, there was the possibility for adulteration in these samples. To ensure authenticity of these samples, a series of EVOO samples that underwent testing for EVOO quality parameters were purchased from premium quality retailers and included in the model. These premium quality retailers submit their EVOO products for quality parameter testing and have demonstrated that their products met IOC legal requirements (International Olive Council, 2017a) for classification as EVOO. If any untested EVOO samples were well outside the range covered by the authentic samples in the model, then those samples were not included as part of the validation or calibration sets. Additionally, the Bruker Edible Oils Calibration package (Bruker Corporation, 2017a) was used to measure the free fatty acid composition, peroxide value, and fatty acid profile of each
of the validation and calibration EVOOs. If the samples did not meet IOC standards for the tested components, then they were excluded from the calibration set.
InstrumentationIn this study, a Bruker NIR MPA (Multi Purpose Analyzer) will be used. The spectrometer utilizes a heated sample compartment for transmission measurements of edible oils. Oil samples are pipet-ted with a glass pipette into a disposable 8 mm measurement vial (model IN430, supplied by Bruker) and 32 scans at a resolution of 8 cm−1 are obtained and averaged per measurement. The sample is preheated for 6 min to a temperature of 50°C prior to measure-ment. Measurements are taken at wavenumbers between 4000 and 12000 cm−1 in the NIR range.
Software and chemometricsAfter completing sample measurement, classification models were created from the spectra using computer software. Bruker’s OPUS spectroscopy software (Bruker Corporation, 2017b) was used to operate the NIR spectrometer and measure NIR spectra. The spectra were exported from OPUS and manipulated using The Unscrambler X (version 10.4) (CAMO Software AS, 2017) multivariate data ana-lysis and design of experiments software. The Unscrambler X was used for digitally processing spectra, developing models, and classi-fication. Spectral processing included baseline offset corrections to correct for any baseline shifts, standard normal variates to reduce scattering effects, and Savitzky–Golay derivatives as a smoothing derivative that reduces scatter effects, the effects of baseline shifts. Soft Independent Modelling of Class Analogy (SIMCA) was used in
Table 1. Extra virgin olive oil adulteration detection and quantification limits for other related methods
Method Objective Adulterant Lowest level of adulteration detection/error of quantification
References
NIR Adulteration Quantification
Soybean Oil RMSEP: 1.76% (Mendes, et al., 2015)
FTIR Adulteration Quantification
Soybean Oil RMSEP: 4.89% (Mendes, et al., 2015)
Raman Adulteration Quantification
Soybean Oil RMSEP: 1.57% (Mendes, et al., 2015)
NIR Adulteration Quantification
Olive Pomace Oil SEP: 3.27% (Yang and Irudayaraj, 2001)
FTIR–ATR Adulteration Quantification
Olive Pomace Oil SEP: 3.28% (Yang and Irudayaraj, 2001)
Raman Adulteration Quantification
Olive Pomace Oil SEP: 1.72% (Yang and Irudayaraj, 2001)
FTIR–ATR Adulteration Detection Peanut Oil 1% (Vasconcelos et al., 2015)FTIR–ATR Adulteration Detection Peanut Oil 5% (Li et al., 2016)FTIR–ATR Adulteration Detection Hazelnut Oil 25% (Ozen and Mauer, 2002)NIR Adulteration
Detecting adulteration in extra virgin olive oil, 2018, Vol. 2, No. 4 191
Dow
nloaded from https://academ
ic.oup.com/fqs/article/2/4/189/5164291 by guest on 16 O
ctober 2022
conjunction with principal component analysis (PCA) for the classi-fication of pure and adulterated EVOOs.
Results and discussions
This research was carried out to demonstrate and explain EVOO adulteration detection by NIRS and chemometrics. Divided into three sections, the first two sections outline the challenges of EVOO adulteration detection by investigating the identification of pure oil types and the detection of adulteration with a provided unadulter-ated control sample for comparison. The third section is an inves-tigation and assessment of the effectiveness of using NIRS and chemometrics to detect adulteration in EVOO without a provided unadulterated control sample. Detection of adulteration without a provided control may be of the most interest to producers, retailers, and consumers in the EVOO industry, as obtaining a control sample may not always be possible.
This study will focus on detecting EVOO adulteration with other types of edible oils and will not consider adulteration with lower grade olive oils. Specifically, adulteration with corn, canola, sun-flower, and soybean oils was considered because they were thought to be the most likely adulterants. Adulteration will likely involve using an adulterant that is cheaper, more readily available than EVOO, and not easily detectable by consumers in an adulterated mixture. Many possible adulterants are available, but corn, canola, sunflower, and soybean oils were considered to be the most common, econom-ical, and practical adulterants for fraudulent producers. Other oils high in saturated fats such as palm oil were also considered as good adulterants, but were found to be easier to detect due to the great differences between those oils and EVOOs.
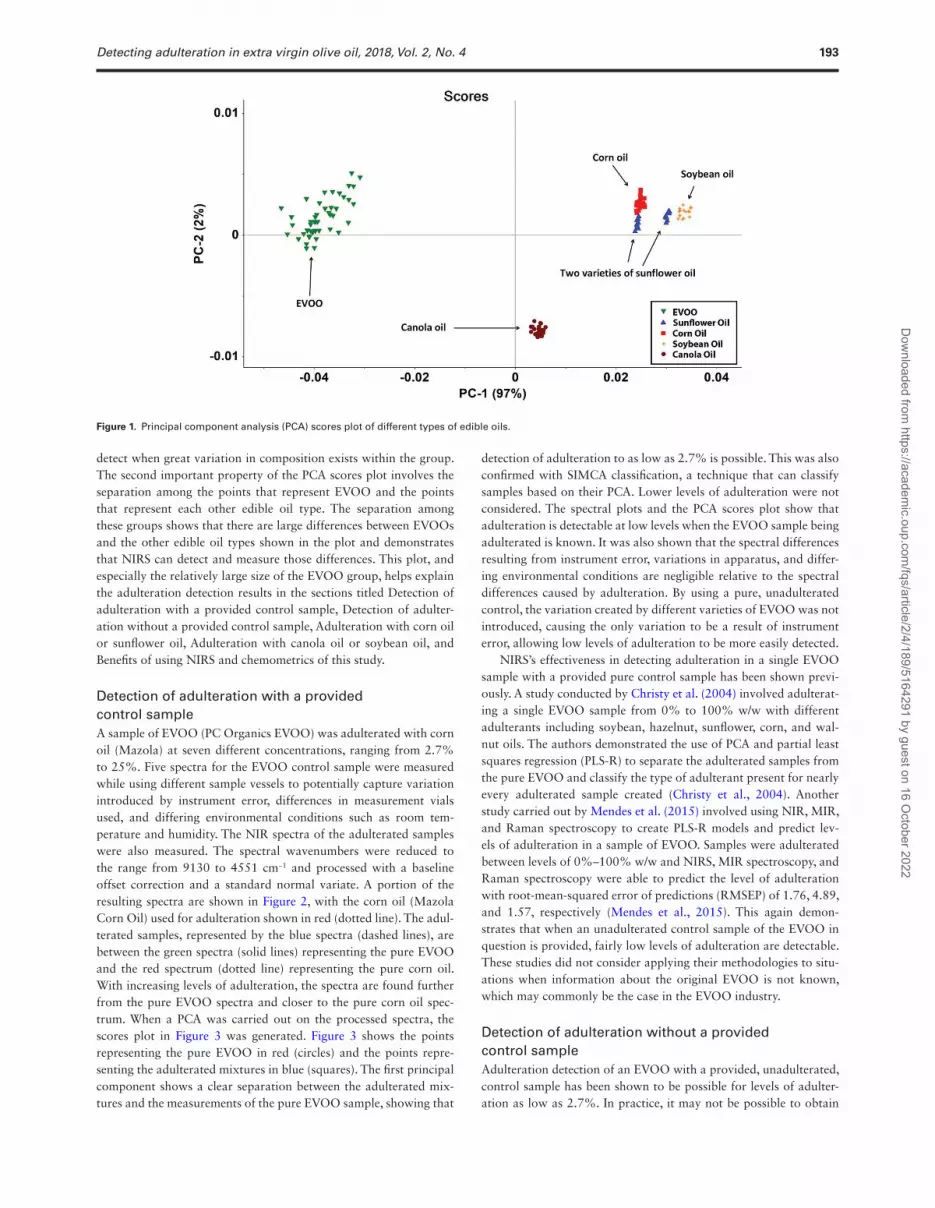
Differentiation of oil typesIn this section, NIRS was studied to demonstrate its effectiveness in differentiating between edible oil types and exemplify the relatively high amount of variation among EVOO samples when compared with other edible oil types. This is important because greater vari-ation in composition among EVOOs implies that adulteration will be more difficult to detect. The NIR spectra were acquired for sam-ples of oils purchased from local retailers, which included 47 EVOO samples, five corn oil samples, five canola oil samples, four sunflower oil samples, and three soybean oil samples. The wavenumbers of the acquired spectra were reduced to the wavenumbers from 9130 to 4551 cm−1 and digitally processed by using a baseline offset correc-tion, a standard normal variate, and a second-order Savitzky–Golay derivative. A PCA was then carried out on the processed spectra to reduce the dimensionality of the data to two principal components that explain the majority of the data. A PCA scores plot was then used to provide visualization for how the spectra varied across the two principal components, allowing for the differences between edible oil types and NIRS’s effectiveness at differentiating among oil types to be examined. The results of the PCA are shown in Figure 1 where edible oil types have formed groups on the PCA scores plot. Figure 1 illustrates the developed method’s effectiveness at differ-entiating between edible oil types. For this study, it is important to understand two properties of this PCA scores plot. The first is that the group of points representing EVOOs spans a larger area of the plot relative to other oil types. This illustrates the considerable vari-ation among different types or varieties of EVOO, which is important when considering detection of adulteration. In this case, small levels of adulteration of a sample in the group will cause small changes in the composition of the sample which will be more difficult to
Table 2. List of oil samples used in this study
Oil type Sample
Extra Virgin Olive AllegroExtra Virgin Olive Bertolli, OriginaleExtra Virgin Olive CarapelliExtra Virgin Olive ColavitaExtra Virgin Olive ComplimentsExtra Virgin Olive Della Terra Arbequina 2014Extra Virgin Olive Della Terra Arbequina 2015Extra Virgin Olive Della Terra Arbosana 2014Extra Virgin Olive Della Terra Barnea 2014Extra Virgin Olive Della Terra Coratina 2014Extra Virgin Olive Della Terra Corbrancosa 2015Extra Virgin Olive Della Terra Favolosa 2015Extra Virgin Olive Della Terra Galega 2015Extra Virgin Olive Della Terra Hojiblanca 2014Extra Virgin Olive Della Terra Hojiblanca 2015Extra Virgin Olive Della Terra Leccino 2015Extra Virgin Olive Della Terra Picual 2014Extra Virgin Olive Della Terra Picual 2015Extra Virgin Olive Della Terra Sevillano 2015Extra Virgin Olive Drop of GodsExtra Virgin Olive EMMAExtra Virgin Olive FermaExtra Virgin Olive Filippo BerioExtra Virgin Olive Homemade oil from Apulia, ItalyExtra Virgin Olive Great ValueExtra Virgin Olive IriniExtra Virgin Olive Irresistables Bio OrganicaExtra Virgin Olive IrresistablesExtra Virgin Olive KritiExtra Virgin Olive MantovaExtra Virgin Olive MartinisExtra Virgin Olive MastroExtra Virgin Olive Messini KalmataExtra Virgin Olive No NameExtra Virgin Olive O&V Organic AscolanoExtra Virgin Olive O&V KoroneikiExtra Virgin Olive O&V Organic CoratinaExtra Virgin Olive O-LIVEExtra Virgin Olive OleivaExtra Virgin Olive Olio GustoExtra Virgin Olive PC EVOO from TuscanyExtra Virgin Olive PC New WorldExtra Virgin Olive PC OrganicsExtra Virgin Olive SaporitoExtra Virgin Olive SelectionExtra Virgin Olive SensationsExtra Virgin Olive Terra DelyssaCorn Mazola, purchased 2015Corn Mazola, purchased 2016Corn SelectionCorn Great ValueCorn PCSoy BungeSoy SelectionSoy MazolaSunflower PCSunflower Great ValueSunflower No NameSunflower SelectionCanola Richardson Salad OilCanola Great ValueCanola MazolaCanola Pure ValleyCanola Selection
192 N. Vanstone et al., 2018, Vol. 2, No. 4
Dow
nloaded from https://academ
ic.oup.com/fqs/article/2/4/189/5164291 by guest on 16 O
ctober 2022
detect when great variation in composition exists within the group. The second important property of the PCA scores plot involves the separation among the points that represent EVOO and the points that represent each other edible oil type. The separation among these groups shows that there are large differences between EVOOs and the other edible oil types shown in the plot and demonstrates that NIRS can detect and measure those differences. This plot, and especially the relatively large size of the EVOO group, helps explain the adulteration detection results in the sections titled Detection of adulteration with a provided control sample, Detection of adulter-ation without a provided control sample, Adulteration with corn oil or sunflower oil, Adulteration with canola oil or soybean oil, and Benefits of using NIRS and chemometrics of this study.
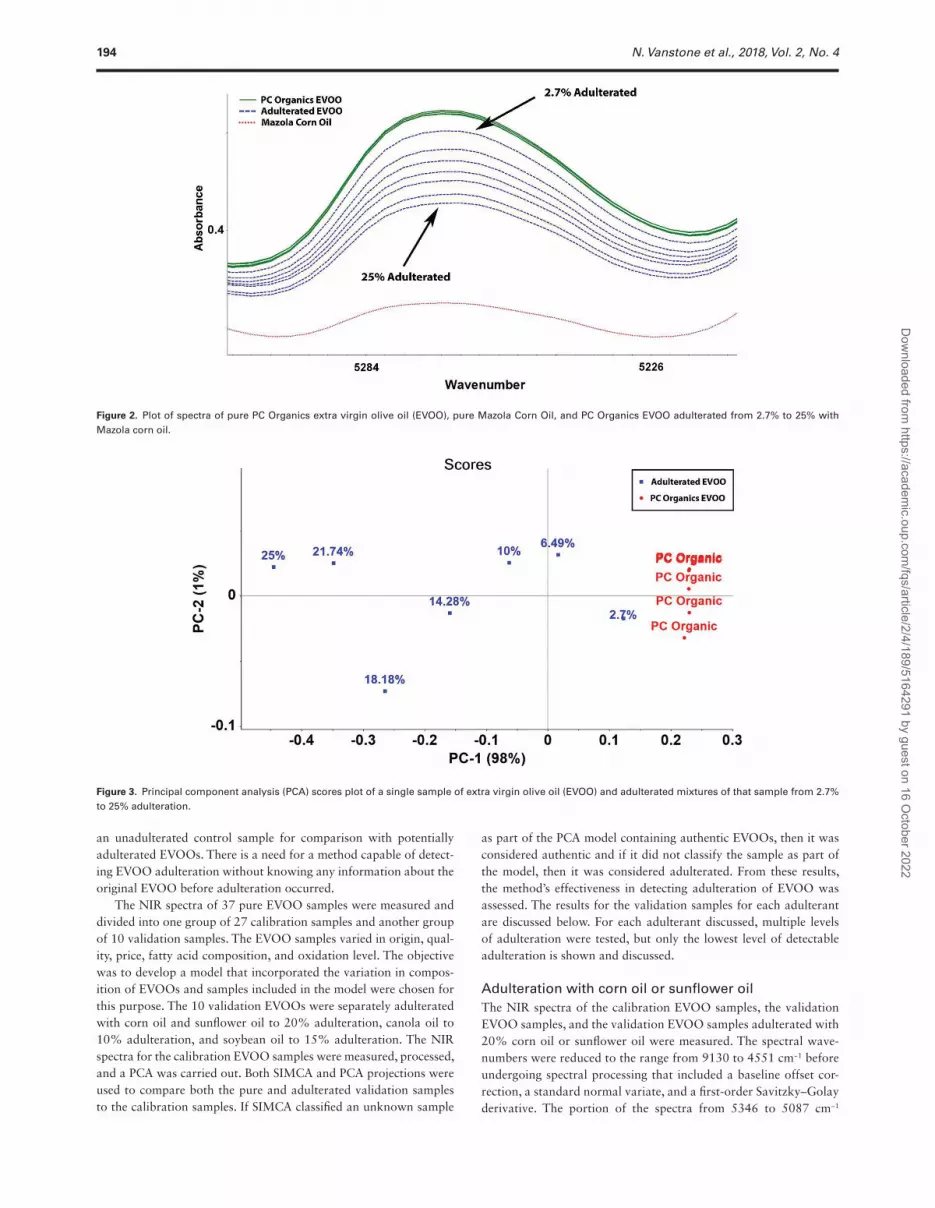
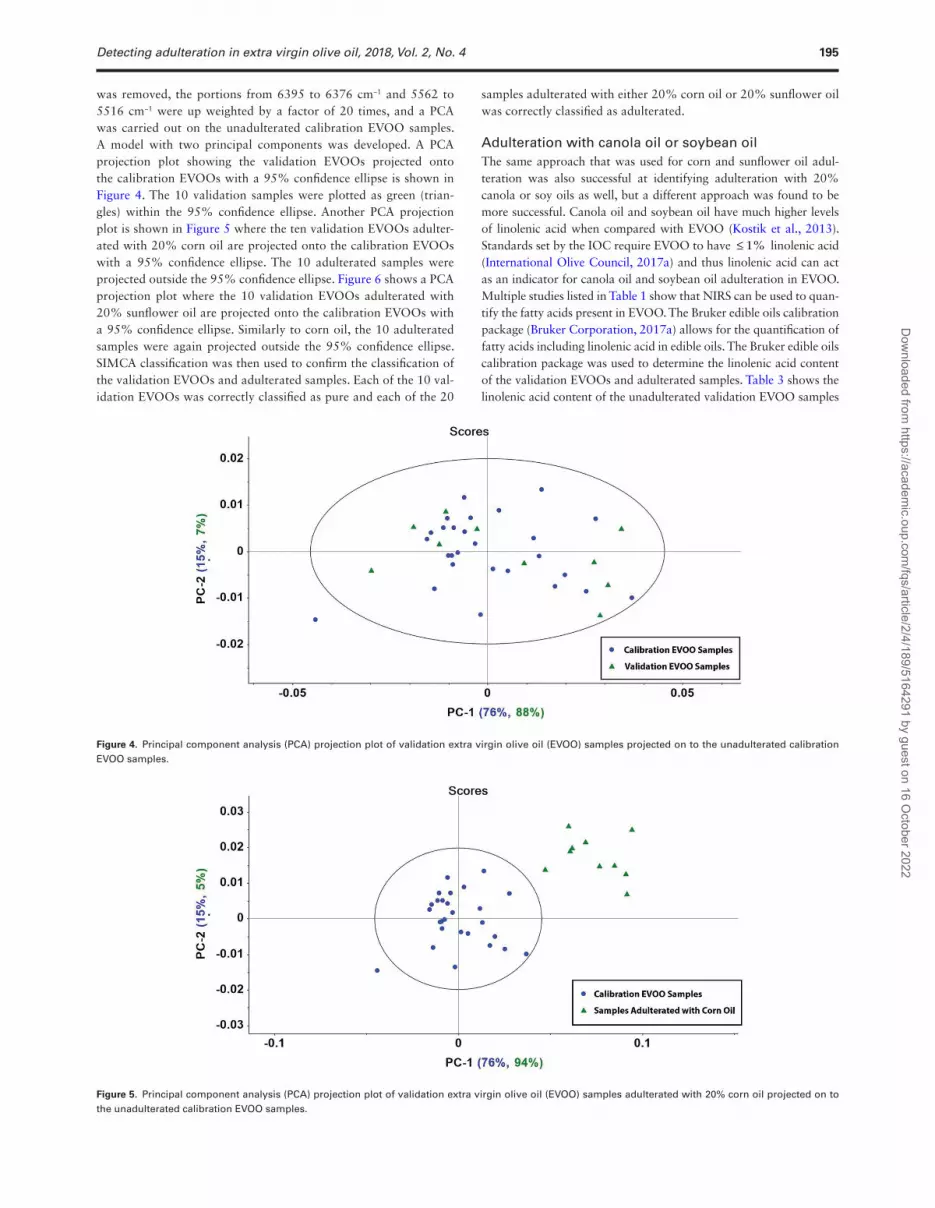
Detection of adulteration with a provided control sampleA sample of EVOO (PC Organics EVOO) was adulterated with corn oil (Mazola) at seven different concentrations, ranging from 2.7% to 25%. Five spectra for the EVOO control sample were measured while using different sample vessels to potentially capture variation introduced by instrument error, differences in measurement vials used, and differing environmental conditions such as room tem-perature and humidity. The NIR spectra of the adulterated samples were also measured. The spectral wavenumbers were reduced to the range from 9130 to 4551 cm−1 and processed with a baseline offset correction and a standard normal variate. A portion of the resulting spectra are shown in Figure 2, with the corn oil (Mazola Corn Oil) used for adulteration shown in red (dotted line). The adul-terated samples, represented by the blue spectra (dashed lines), are between the green spectra (solid lines) representing the pure EVOO and the red spectrum (dotted line) representing the pure corn oil. With increasing levels of adulteration, the spectra are found further from the pure EVOO spectra and closer to the pure corn oil spec-trum. When a PCA was carried out on the processed spectra, the scores plot in Figure 3 was generated. Figure 3 shows the points representing the pure EVOO in red (circles) and the points repre-senting the adulterated mixtures in blue (squares). The first principal component shows a clear separation between the adulterated mix-tures and the measurements of the pure EVOO sample, showing that
detection of adulteration to as low as 2.7% is possible. This was also confirmed with SIMCA classification, a technique that can classify samples based on their PCA. Lower levels of adulteration were not considered. The spectral plots and the PCA scores plot show that adulteration is detectable at low levels when the EVOO sample being adulterated is known. It was also shown that the spectral differences resulting from instrument error, variations in apparatus, and differ-ing environmental conditions are negligible relative to the spectral differences caused by adulteration. By using a pure, unadulterated control, the variation created by different varieties of EVOO was not introduced, causing the only variation to be a result of instrument error, allowing low levels of adulteration to be more easily detected.
NIRS’s effectiveness in detecting adulteration in a single EVOO sample with a provided pure control sample has been shown previ-ously. A study conducted by Christy et al. (2004) involved adulterat-ing a single EVOO sample from 0% to 100% w/w with different adulterants including soybean, hazelnut, sunflower, corn, and wal-nut oils. The authors demonstrated the use of PCA and partial least squares regression (PLS-R) to separate the adulterated samples from the pure EVOO and classify the type of adulterant present for nearly every adulterated sample created (Christy et al., 2004). Another study carried out by Mendes et al. (2015) involved using NIR, MIR, and Raman spectroscopy to create PLS-R models and predict lev-els of adulteration in a sample of EVOO. Samples were adulterated between levels of 0%–100% w/w and NIRS, MIR spectroscopy, and Raman spectroscopy were able to predict the level of adulteration with root-mean-squared error of predictions (RMSEP) of 1.76, 4.89, and 1.57, respectively (Mendes et al., 2015). This again demon-strates that when an unadulterated control sample of the EVOO in question is provided, fairly low levels of adulteration are detectable. These studies did not consider applying their methodologies to situ-ations when information about the original EVOO is not known, which may commonly be the case in the EVOO industry.
Detection of adulteration without a provided control sampleAdulteration detection of an EVOO with a provided, unadulterated, control sample has been shown to be possible for levels of adulter-ation as low as 2.7%. In practice, it may not be possible to obtain
Figure 1. Principal component analysis (PCA) scores plot of different types of edible oils.
Detecting adulteration in extra virgin olive oil, 2018, Vol. 2, No. 4 193
Dow
nloaded from https://academ
ic.oup.com/fqs/article/2/4/189/5164291 by guest on 16 O
ctober 2022
an unadulterated control sample for comparison with potentially adulterated EVOOs. There is a need for a method capable of detect-ing EVOO adulteration without knowing any information about the original EVOO before adulteration occurred.
The NIR spectra of 37 pure EVOO samples were measured and divided into one group of 27 calibration samples and another group of 10 validation samples. The EVOO samples varied in origin, qual-ity, price, fatty acid composition, and oxidation level. The objective was to develop a model that incorporated the variation in compos-ition of EVOOs and samples included in the model were chosen for this purpose. The 10 validation EVOOs were separately adulterated with corn oil and sunflower oil to 20% adulteration, canola oil to 10% adulteration, and soybean oil to 15% adulteration. The NIR spectra for the calibration EVOO samples were measured, processed, and a PCA was carried out. Both SIMCA and PCA projections were used to compare both the pure and adulterated validation samples to the calibration samples. If SIMCA classified an unknown sample
as part of the PCA model containing authentic EVOOs, then it was considered authentic and if it did not classify the sample as part of the model, then it was considered adulterated. From these results, the method’s effectiveness in detecting adulteration of EVOO was assessed. The results for the validation samples for each adulterant are discussed below. For each adulterant discussed, multiple levels of adulteration were tested, but only the lowest level of detectable adulteration is shown and discussed.
Adulteration with corn oil or sunflower oilThe NIR spectra of the calibration EVOO samples, the validation EVOO samples, and the validation EVOO samples adulterated with 20% corn oil or sunflower oil were measured. The spectral wave-numbers were reduced to the range from 9130 to 4551 cm−1 before undergoing spectral processing that included a baseline offset cor-rection, a standard normal variate, and a first-order Savitzky–Golay derivative. The portion of the spectra from 5346 to 5087 cm−1
Figure 2. Plot of spectra of pure PC Organics extra virgin olive oil (EVOO), pure Mazola Corn Oil, and PC Organics EVOO adulterated from 2.7% to 25% with Mazola corn oil.
Figure 3. Principal component analysis (PCA) scores plot of a single sample of extra virgin olive oil (EVOO) and adulterated mixtures of that sample from 2.7% to 25% adulteration.
194 N. Vanstone et al., 2018, Vol. 2, No. 4
Dow
nloaded from https://academ
ic.oup.com/fqs/article/2/4/189/5164291 by guest on 16 O
ctober 2022
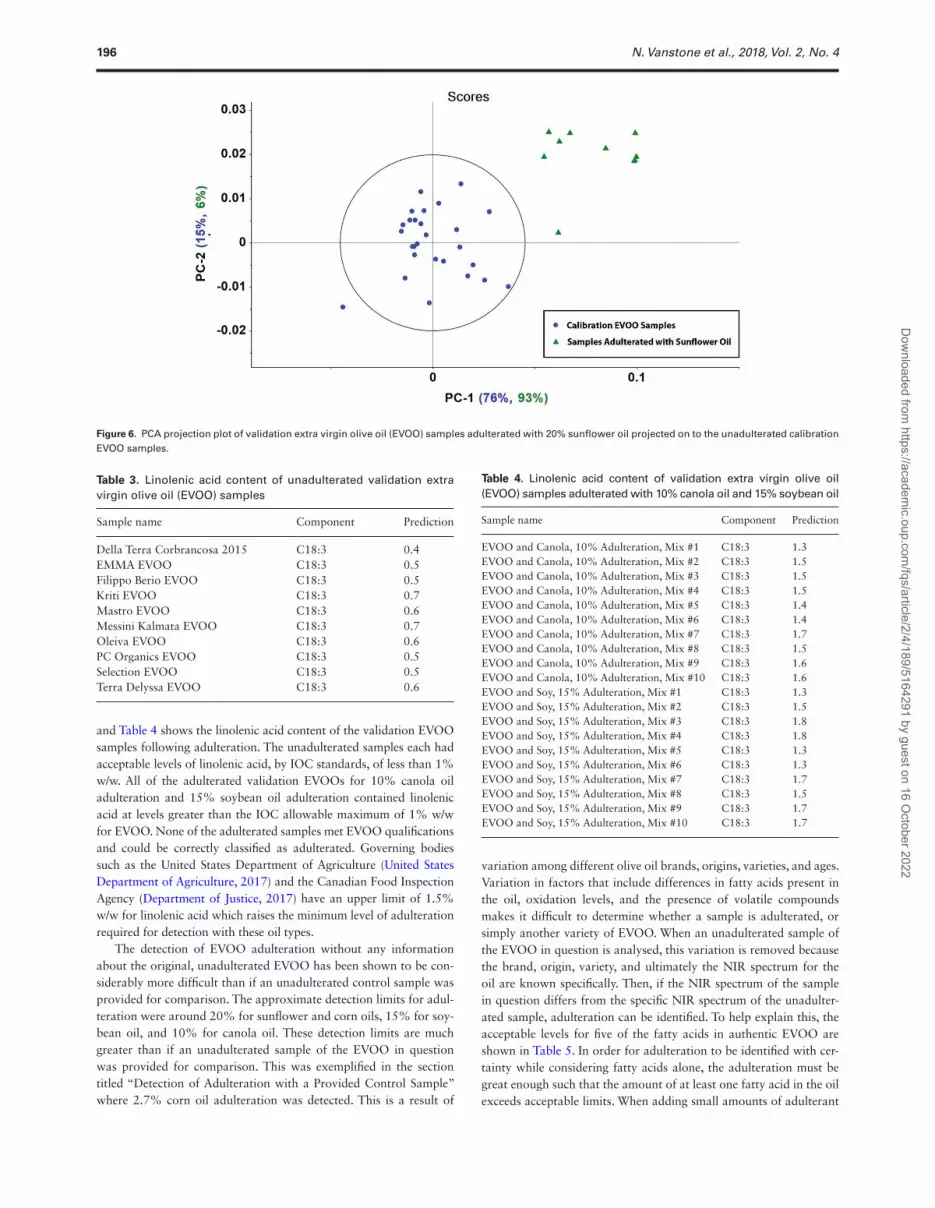
was removed, the portions from 6395 to 6376 cm−1 and 5562 to 5516 cm−1 were up weighted by a factor of 20 times, and a PCA was carried out on the unadulterated calibration EVOO samples. A model with two principal components was developed. A PCA projection plot showing the validation EVOOs projected onto the calibration EVOOs with a 95% confidence ellipse is shown in Figure 4. The 10 validation samples were plotted as green (trian-gles) within the 95% confidence ellipse. Another PCA projection plot is shown in Figure 5 where the ten validation EVOOs adulter-ated with 20% corn oil are projected onto the calibration EVOOs with a 95% confidence ellipse. The 10 adulterated samples were projected outside the 95% confidence ellipse. Figure 6 shows a PCA projection plot where the 10 validation EVOOs adulterated with 20% sunflower oil are projected onto the calibration EVOOs with a 95% confidence ellipse. Similarly to corn oil, the 10 adulterated samples were again projected outside the 95% confidence ellipse. SIMCA classification was then used to confirm the classification of the validation EVOOs and adulterated samples. Each of the 10 val-idation EVOOs was correctly classified as pure and each of the 20
samples adulterated with either 20% corn oil or 20% sunflower oil was correctly classified as adulterated.
Adulteration with canola oil or soybean oilThe same approach that was used for corn and sunflower oil adul-teration was also successful at identifying adulteration with 20% canola or soy oils as well, but a different approach was found to be more successful. Canola oil and soybean oil have much higher levels of linolenic acid when compared with EVOO (Kostik et al., 2013). Standards set by the IOC require EVOO to have ≤ 1% linolenic acid (International Olive Council, 2017a) and thus linolenic acid can act as an indicator for canola oil and soybean oil adulteration in EVOO. Multiple studies listed in Table 1 show that NIRS can be used to quan-tify the fatty acids present in EVOO. The Bruker edible oils calibration package (Bruker Corporation, 2017a) allows for the quantification of fatty acids including linolenic acid in edible oils. The Bruker edible oils calibration package was used to determine the linolenic acid content of the validation EVOOs and adulterated samples. Table 3 shows the linolenic acid content of the unadulterated validation EVOO samples
Figure 4. Principal component analysis (PCA) projection plot of validation extra virgin olive oil (EVOO) samples projected on to the unadulterated calibration EVOO samples.
Figure 5. Principal component analysis (PCA) projection plot of validation extra virgin olive oil (EVOO) samples adulterated with 20% corn oil projected on to the unadulterated calibration EVOO samples.
Detecting adulteration in extra virgin olive oil, 2018, Vol. 2, No. 4 195
Dow
nloaded from https://academ
ic.oup.com/fqs/article/2/4/189/5164291 by guest on 16 O
ctober 2022
and Table 4 shows the linolenic acid content of the validation EVOO samples following adulteration. The unadulterated samples each had acceptable levels of linolenic acid, by IOC standards, of less than 1% w/w. All of the adulterated validation EVOOs for 10% canola oil adulteration and 15% soybean oil adulteration contained linolenic acid at levels greater than the IOC allowable maximum of 1% w/w for EVOO. None of the adulterated samples met EVOO qualifications and could be correctly classified as adulterated. Governing bodies such as the United States Department of Agriculture (United States Department of Agriculture, 2017) and the Canadian Food Inspection Agency (Department of Justice, 2017) have an upper limit of 1.5% w/w for linolenic acid which raises the minimum level of adulteration required for detection with these oil types.
The detection of EVOO adulteration without any information about the original, unadulterated EVOO has been shown to be con-siderably more difficult than if an unadulterated control sample was provided for comparison. The approximate detection limits for adul-teration were around 20% for sunflower and corn oils, 15% for soy-bean oil, and 10% for canola oil. These detection limits are much greater than if an unadulterated sample of the EVOO in question was provided for comparison. This was exemplified in the section titled “Detection of Adulteration with a Provided Control Sample” where 2.7% corn oil adulteration was detected. This is a result of
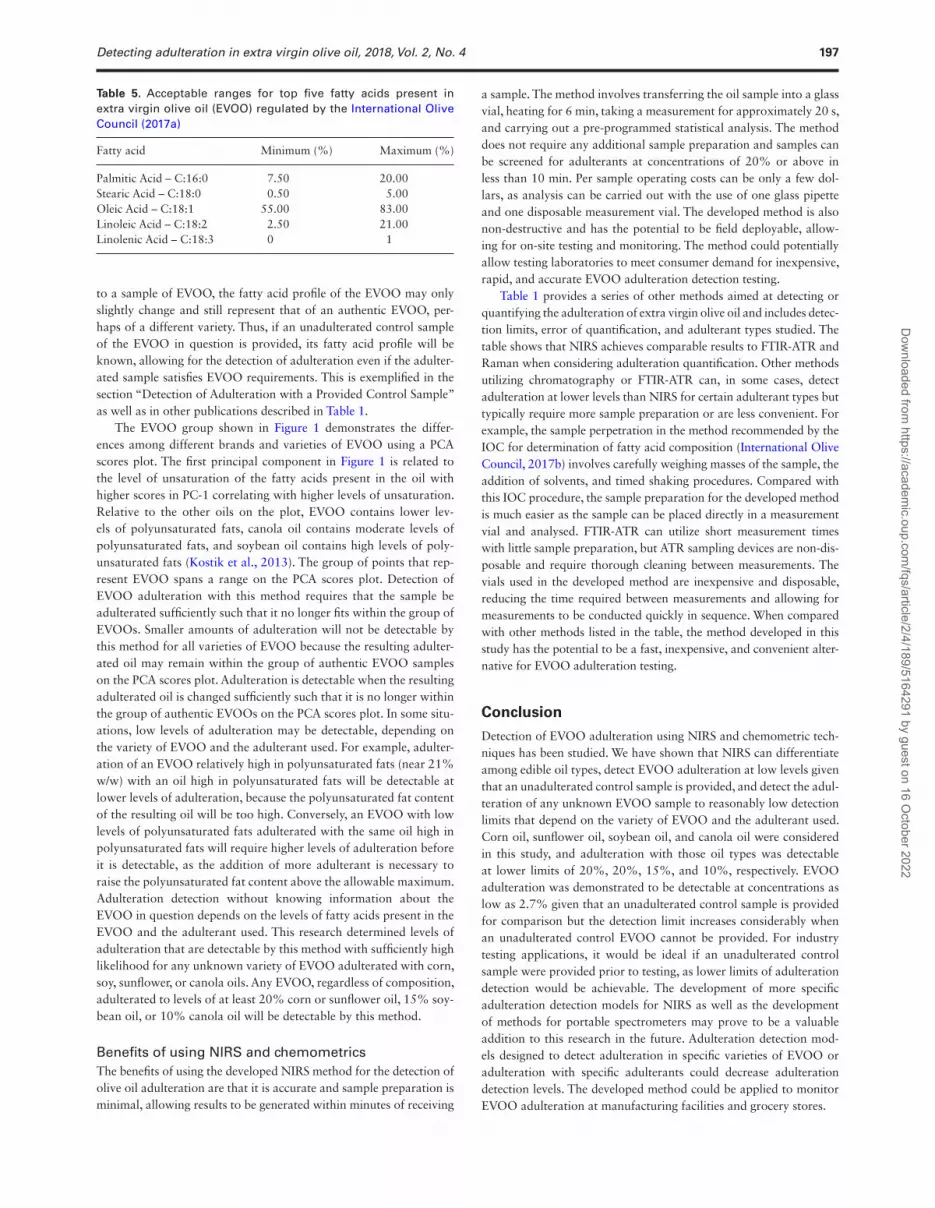
variation among different olive oil brands, origins, varieties, and ages. Variation in factors that include differences in fatty acids present in the oil, oxidation levels, and the presence of volatile compounds makes it difficult to determine whether a sample is adulterated, or simply another variety of EVOO. When an unadulterated sample of the EVOO in question is analysed, this variation is removed because the brand, origin, variety, and ultimately the NIR spectrum for the oil are known specifically. Then, if the NIR spectrum of the sample in question differs from the specific NIR spectrum of the unadulter-ated sample, adulteration can be identified. To help explain this, the acceptable levels for five of the fatty acids in authentic EVOO are shown in Table 5. In order for adulteration to be identified with cer-tainty while considering fatty acids alone, the adulteration must be great enough such that the amount of at least one fatty acid in the oil exceeds acceptable limits. When adding small amounts of adulterant
Figure 6. PCA projection plot of validation extra virgin olive oil (EVOO) samples adulterated with 20% sunflower oil projected on to the unadulterated calibration EVOO samples.
Table 3. Linolenic acid content of unadulterated validation extra virgin olive oil (EVOO) samples
Table 4. Linolenic acid content of validation extra virgin olive oil (EVOO) samples adulterated with 10% canola oil and 15% soybean oil
Sample name Component Prediction
EVOO and Canola, 10% Adulteration, Mix #1 C18:3 1.3EVOO and Canola, 10% Adulteration, Mix #2 C18:3 1.5EVOO and Canola, 10% Adulteration, Mix #3 C18:3 1.5EVOO and Canola, 10% Adulteration, Mix #4 C18:3 1.5EVOO and Canola, 10% Adulteration, Mix #5 C18:3 1.4EVOO and Canola, 10% Adulteration, Mix #6 C18:3 1.4EVOO and Canola, 10% Adulteration, Mix #7 C18:3 1.7EVOO and Canola, 10% Adulteration, Mix #8 C18:3 1.5EVOO and Canola, 10% Adulteration, Mix #9 C18:3 1.6EVOO and Canola, 10% Adulteration, Mix #10 C18:3 1.6EVOO and Soy, 15% Adulteration, Mix #1 C18:3 1.3EVOO and Soy, 15% Adulteration, Mix #2 C18:3 1.5EVOO and Soy, 15% Adulteration, Mix #3 C18:3 1.8EVOO and Soy, 15% Adulteration, Mix #4 C18:3 1.8EVOO and Soy, 15% Adulteration, Mix #5 C18:3 1.3EVOO and Soy, 15% Adulteration, Mix #6 C18:3 1.3EVOO and Soy, 15% Adulteration, Mix #7 C18:3 1.7EVOO and Soy, 15% Adulteration, Mix #8 C18:3 1.5EVOO and Soy, 15% Adulteration, Mix #9 C18:3 1.7EVOO and Soy, 15% Adulteration, Mix #10 C18:3 1.7
196 N. Vanstone et al., 2018, Vol. 2, No. 4
Dow
nloaded from https://academ
ic.oup.com/fqs/article/2/4/189/5164291 by guest on 16 O
ctober 2022
to a sample of EVOO, the fatty acid profile of the EVOO may only slightly change and still represent that of an authentic EVOO, per-haps of a different variety. Thus, if an unadulterated control sample of the EVOO in question is provided, its fatty acid profile will be known, allowing for the detection of adulteration even if the adulter-ated sample satisfies EVOO requirements. This is exemplified in the section “Detection of Adulteration with a Provided Control Sample” as well as in other publications described in Table 1.
The EVOO group shown in Figure 1 demonstrates the differ-ences among different brands and varieties of EVOO using a PCA scores plot. The first principal component in Figure 1 is related to the level of unsaturation of the fatty acids present in the oil with higher scores in PC-1 correlating with higher levels of unsaturation. Relative to the other oils on the plot, EVOO contains lower lev-els of polyunsaturated fats, canola oil contains moderate levels of polyunsaturated fats, and soybean oil contains high levels of poly-unsaturated fats (Kostik et al., 2013). The group of points that rep-resent EVOO spans a range on the PCA scores plot. Detection of EVOO adulteration with this method requires that the sample be adulterated sufficiently such that it no longer fits within the group of EVOOs. Smaller amounts of adulteration will not be detectable by this method for all varieties of EVOO because the resulting adulter-ated oil may remain within the group of authentic EVOO samples on the PCA scores plot. Adulteration is detectable when the resulting adulterated oil is changed sufficiently such that it is no longer within the group of authentic EVOOs on the PCA scores plot. In some situ-ations, low levels of adulteration may be detectable, depending on the variety of EVOO and the adulterant used. For example, adulter-ation of an EVOO relatively high in polyunsaturated fats (near 21% w/w) with an oil high in polyunsaturated fats will be detectable at lower levels of adulteration, because the polyunsaturated fat content of the resulting oil will be too high. Conversely, an EVOO with low levels of polyunsaturated fats adulterated with the same oil high in polyunsaturated fats will require higher levels of adulteration before it is detectable, as the addition of more adulterant is necessary to raise the polyunsaturated fat content above the allowable maximum. Adulteration detection without knowing information about the EVOO in question depends on the levels of fatty acids present in the EVOO and the adulterant used. This research determined levels of adulteration that are detectable by this method with sufficiently high likelihood for any unknown variety of EVOO adulterated with corn, soy, sunflower, or canola oils. Any EVOO, regardless of composition, adulterated to levels of at least 20% corn or sunflower oil, 15% soy-bean oil, or 10% canola oil will be detectable by this method.
Benefits of using NIRS and chemometricsThe benefits of using the developed NIRS method for the detection of olive oil adulteration are that it is accurate and sample preparation is minimal, allowing results to be generated within minutes of receiving
a sample. The method involves transferring the oil sample into a glass vial, heating for 6 min, taking a measurement for approximately 20 s, and carrying out a pre-programmed statistical analysis. The method does not require any additional sample preparation and samples can be screened for adulterants at concentrations of 20% or above in less than 10 min. Per sample operating costs can be only a few dol-lars, as analysis can be carried out with the use of one glass pipette and one disposable measurement vial. The developed method is also non-destructive and has the potential to be field deployable, allow-ing for on-site testing and monitoring. The method could potentially allow testing laboratories to meet consumer demand for inexpensive, rapid, and accurate EVOO adulteration detection testing.
Table 1 provides a series of other methods aimed at detecting or quantifying the adulteration of extra virgin olive oil and includes detec-tion limits, error of quantification, and adulterant types studied. The table shows that NIRS achieves comparable results to FTIR-ATR and Raman when considering adulteration quantification. Other methods utilizing chromatography or FTIR-ATR can, in some cases, detect adulteration at lower levels than NIRS for certain adulterant types but typically require more sample preparation or are less convenient. For example, the sample perpetration in the method recommended by the IOC for determination of fatty acid composition (International Olive Council, 2017b) involves carefully weighing masses of the sample, the addition of solvents, and timed shaking procedures. Compared with this IOC procedure, the sample preparation for the developed method is much easier as the sample can be placed directly in a measurement vial and analysed. FTIR-ATR can utilize short measurement times with little sample preparation, but ATR sampling devices are non-dis-posable and require thorough cleaning between measurements. The vials used in the developed method are inexpensive and disposable, reducing the time required between measurements and allowing for measurements to be conducted quickly in sequence. When compared with other methods listed in the table, the method developed in this study has the potential to be a fast, inexpensive, and convenient alter-native for EVOO adulteration testing.
Conclusion
Detection of EVOO adulteration using NIRS and chemometric tech-niques has been studied. We have shown that NIRS can differentiate among edible oil types, detect EVOO adulteration at low levels given that an unadulterated control sample is provided, and detect the adul-teration of any unknown EVOO sample to reasonably low detection limits that depend on the variety of EVOO and the adulterant used. Corn oil, sunflower oil, soybean oil, and canola oil were considered in this study, and adulteration with those oil types was detectable at lower limits of 20%, 20%, 15%, and 10%, respectively. EVOO adulteration was demonstrated to be detectable at concentrations as low as 2.7% given that an unadulterated control sample is provided for comparison but the detection limit increases considerably when an unadulterated control EVOO cannot be provided. For industry testing applications, it would be ideal if an unadulterated control sample were provided prior to testing, as lower limits of adulteration detection would be achievable. The development of more specific adulteration detection models for NIRS as well as the development of methods for portable spectrometers may prove to be a valuable addition to this research in the future. Adulteration detection mod-els designed to detect adulteration in specific varieties of EVOO or adulteration with specific adulterants could decrease adulteration detection levels. The developed method could be applied to monitor EVOO adulteration at manufacturing facilities and grocery stores.
Table 5. Acceptable ranges for top five fatty acids present in extra virgin olive oil (EVOO) regulated by the International Olive Council (2017a)
Detecting adulteration in extra virgin olive oil, 2018, Vol. 2, No. 4 197
Dow
nloaded from https://academ
ic.oup.com/fqs/article/2/4/189/5164291 by guest on 16 O
ctober 2022
AcknowledgementsThe authors acknowledge the University of Guelph, Agriculture and Food Laboratory for providing support, funding, and access to instruments. The authors also thank the O&V Tasting Room and Della Terra – Fresh Olive Oils and Balsamics for providing information about the industry and reference samples. The funding was provided by the University of Guelph, Agriculture and Food Laboratory and the Natural Sciences and Engineering Research Council of Canada.
Conflict of interest statement None declared.
ReferencesAndrikopoulos, N. K., Giannakis, I. G., Tzamtzis, V. (2001). Analysis of olive
oil and seed oil triglycerides by capillary gas chromatography as a tool for the detection of the adulteration of olive oil. Journal of Chromatographic Science, 39: 137–145.
Azizian, H., Mossoba, M. M., Fardin-Kia, A. R., Delmonte, P., Karunathilaka, S. R., Kramer, J. K. (2015). Novel, rapid identification, and quantification of adulterants in extra virgin olive oil using near-infrared spectroscopy and chemometrics. Lipids, 50: 705–718.
Bruker Corporation. (2017a). Edible Oils Calibrations Package [computer software]. Billerica, MA, USA.
Bruker Corporation. (2017b). OPUS Spectroscopy Software [computer soft-ware]. Billerica, MA, USA.
CAMO Software AS. (2017). The Unscrambler X [computer software]. Magnolia, TX, USA.
Christy, A. A., Kasemsumran, S., Du, Y., Ozaki, Y. (2004). The detection and quantification of adulteration in olive oil by near-infrared spectroscopy and chemometrics. Analytical Sciences, 20: 935–940.
Department of Justice, Canada. (2017). Department of Justice. Retrieved 15 October 2017, from Justice Laws Website: http://laws-lois.justice.gc.ca/eng/regulations/C.R.C.,_c._870/page-54.html#h-80
Fragaki, G., Spyros, A., Siragakis, G., Salivaras, E., Dais, P. (2005). Detection of extra virgin olive oil adulteration with lampante olive oil and refined olive oil using nuclear magnetic resonance spectroscopy and multivariate statis-tical analysis. Journal of Agricultural and Food Chemistry, 53: 2810–2816.
Frankel, E. N., Mailer, R. J., Wang, S. C., et al. (2011). Evaluation of Extra-Virgin Olive Oil Sold in California. UC Davis Olive Center, Davis.
Gurdeniz, G., Ozen, B. (2009). Detection of adulteration of extra-virgin olive oil by chemometric analysis of mid-infrared spectral data. Food Chemistry, 116: 519–525.
International Olive Council. (2017a). International Olive Council Standards. Retrieved 5 February 2017, from International Olive Council: http://www.internationaloliveoil.org/estaticos/view/222-standards
International Olive Council. (2017b). Testing Methods. Retrieved 2 November 2017, from http://www.internationaloliveoil.org/estaticos/view/224-testing-methods
International Olive Council. (2017c). World Olive Oil Figures. Retrieved 9 February 2017, from International Olive Council: http://www.internation-aloliveoil.org/estaticos/view/131-world-olive-oil-figures
Jabeur, H., Zribi, A., Makni, J., Rebai, A., Abdelhedi, R., Bouaziz, M. (2014). Detection of chemlali extra-virgin olive oil adulteration mixed with soy-bean oil, corn oil, and sunflower oil by using GC and HPLC. Journal of Agricultural and Food Chemistry, 62: 4893–4904.
Kostik, V., Memeti, S., Bauer, B. (2013). Fatty acid composition of edible oils and fats. Journal of Hygienic Engineering and Design, 4: 112–116.
Li, X., Wang, S., Shi, W., Shen, Q. (2016). Partial least squares discriminant analysis model based on variable selection applied to identify the adulter-ated olive oil. Food Analytical Methods, 9: 1713–1718.
López-Miranda, J., Pérez-Jiménez, F., Ros, E., et al. (2010). Olive oil and health: summary of the II international conference on olive oil and health consensus report, Jaén and Córdoba (Spain) 2008. Nutrition, Metabolism and Cardiovascular Diseases, 20: 284–294.
Mendes, O. T., da Rocha, R. A., Porto, B. L., Oliveira, M. A., dos Anjos, V. D., Bell, M. J. (2015). Quantification of extra-virgin olive oil adulteration with soybean oil: a comparative study of NIR, MIR, and Raman spectros-copy associated with chemometric approaches. Food Analysis Methods, 8: 2339–2346.
Nunes, C. A. (2014). Vibrational spectroscopy and chemometrics to assess authenticity, adulteration, and intrinsic quality parameters of edible oils and fats. Food Research International, 60: 255–261.
Ozen, B. F., Mauer, L. J. (2002). Detection of hazelnut oil adulteration using FT-IR spectroscopy. Journal of Agricultural and Food Chemistry, 50: 3898–3901.
Ruiz-Samblás, C., Marini, F., Cuadros-Rodríguez, L., González-Casado, A. (2012). Quantification of blending of olive oils and edible vegetable oils by triacylglycerol fingerprint gas chromatography and chemometric tools. Journal of Chromatography, 910: 71–77.
Statistics Canada & US Census Bureau. (2016). Report – Trade Data Online. Retrieved 9 February 2016, from Government of Canada, Innovation, Science and Economic Development Canada: https://www.ic.gc.ca/app/scr/tdst/tdo/crtr.html?naArea=9999&searchType=KS_CS&hSelectedCodes=%7C150910&customYears=2015&productType=HS6&reportType=TI&timePeriod=%7CCustom+Years¤cy=CDN&toFromCountry=CDN&countryList=ALL&grouped=GROUPED&runReport=true
United States Department of Agriculture. (2017). Olive Oil and Olive-Pomace Oil Grades and Standards. Retrieved 15 October 2017, from United Stated Department of Agriculture: https://www.ams.usda.gov/sites/default/files/media/Olive_Oil_and_Olive-Pomace_Oil_Standard%5B1%5D.pdf
Vasconcelos, M., Coelho, L., Barros, A., & de Almeida, J. M. (2015). Study of adulteration of extra virgin olive oil with peanut oil using FTIR spectroscopy and chemometrics. Cogent Food & Agriculture, 1: 1–13.
Yang, H., Irudayaraj, J. (2001). Comparison of near-infrared, fourier trans-form-infrared, and fourier transform-raman methods for determining olive pomace oil adulteration in extra virgin olive oil. Journal of the American Oil Chemists’ Society, 78: 889–895.
198 N. Vanstone et al., 2018, Vol. 2, No. 4
Dow
nloaded from https://academ
ic.oup.com/fqs/article/2/4/189/5164291 by guest on 16 O