Annali di Chimica, 97, 2007, by Società Chimica Italiana THE INFORMATION CONTENT OF VISIBLE SPECTRA OF EXTRA VIRGIN OLIVE OIL IN THE CHARACTERIZATION OF ITS ORIGIN Michele FORINA(°), Raffaella BOGGIA, Monica CASALE Dipartimento di Chimica e Tecnologie Farmaceutiche ed Alimentari, Università di Genova, Via Brigata Salerno 13, I-16147 Genova, Italy Summary - The information content of visible spectra has been evaluated, by means of some selected chemometrical techniques, for its ability to trace the geographical origin of extra virgin olive oils coming from several Mediterranean regions. Special attention was paid to extra virgin olive oil produced in West Liguria, a North Italy region which leans over the Mediterranean Sea and borders France. The peculiar organoleptic features of this “niche product” deserved the protected designation of origin “Riviera Ligure-Riviera dei fiori”. Unfortunately, this expensive oil is often submitted to profitable adulterations, commonly involving addition of other cheaper Mediterranean oils. Using suitable transforms, such as profiles and derivatives, the visible spectra of extra virgin olive oils showed a very important discriminant power in that regards the geographical characterization of the studied samples. In particular, the developed class models for West Liguria oils have 100% sensitivity and specificity. Moreover, even if this paper is focused on West Liguria oil, it is important to emphasize that a similar study, involving a so widespread and timesaving technique, could be analogously developed for all the other Mediterranean regions taken into account and it could be used in other olive oil characterization problems. INTRODUCTION The large increase in demand for extra virgin olive oil of high-quality due, not only to its health qualities, but also to its organoleptic features makes virgin olive oil authenticity of prime importance in food industry. To guarantee this authenticity and to avoid mislabelling, European Community promulgates regulations to those olive oils that could claim a typical quality based on geographical origin of production (PDO protected designation of origin). These specifications protect producers of high-quality olive oils and ensure consumer awareness of product quality (tipicity). A subjective sensory analysis has usually performed by professional trade associations, which are responsible for the different PDOs. Anyway, this characterization is often insufficient to protect the olive oil tipicity. Therefore, many analytical procedures have been used to objectively characterize the geographical origin of extra virgin olive oils and cultivars as well as detecting adulteration and guaranteeing authentication, without using a panel test (subjective sensory analysis). These authentication methods, usually associated with chemometrics analysis, can be classified as “with identification” and “without identification” (or “fingerprint”) techniques. The former are focused on the existence or absence of certain chemical compounds in the adulterated sample (e.g. major and minor components of virgin olive oils: triacylglycerols, diacylglycerols, wax esters, free fatty acids, triterpenic alcohols, hydrocarbons, sterols, phenols, flavonoids, pigments, tocopherols, volatile compounds, etc.), the latter are based on a combination of measurements (e.g. spectral fingerprints, multi-sensor array fingerprints, etc.). (°), corresponding author; e-mail: [email protected]
Transcript
Annali di Chimica, 97, 2007, by Società Chimica Italiana
THE INFORMATION CONTENT OF VISIBLE SPECTRA OF EXTRA VIRGIN OLIVE OIL IN THE CHARACTERIZATION OF ITS ORIGIN
Dipartimento di Chimica e Tecnologie Farmaceutiche ed Alimentari, Università di Genova, Via Brigata Salerno 13, I-16147 Genova, Italy
Summary - The information content of visible spectra has been evaluated, by means of some selected chemometrical techniques, for its ability to trace the geographical origin of extra virgin olive oils coming from several Mediterranean regions. Special attention was paid to extra virgin olive oil produced in West Liguria, a North Italy region which leans over the Mediterranean Sea and borders France. The peculiar organoleptic features of this “niche product” deserved the protected designation of origin “Riviera Ligure-Riviera dei fiori”. Unfortunately, this expensive oil is often submitted to profitable adulterations, commonly involving addition of other cheaper Mediterranean oils. Using suitable transforms, such as profiles and derivatives, the visible spectra of extra virgin olive oils showed a very important discriminant power in that regards the geographical characterization of the studied samples. In particular, the developed class models for West Liguria oils have 100% sensitivity and specificity. Moreover, even if this paper is focused on West Liguria oil, it is important to emphasize that a similar study, involving a so widespread and timesaving technique, could be analogously developed for all the other Mediterranean regions taken into account and it could be used in other olive oil characterization problems.
INTRODUCTION
The large increase in demand for extra virgin olive oil of high-quality due, not only to its health qualities, but also to its organoleptic features makes virgin olive oil authenticity of prime importance in food industry. To guarantee this authenticity and to avoid mislabelling, European Community promulgates regulations to those olive oils that could claim a typical quality based on geographical origin of production (PDO protected designation of origin). These specifications protect producers of high-quality olive oils and ensure consumer awareness of product quality (tipicity). A subjective sensory analysis has usually performed by professional trade associations, which are responsible for the different PDOs. Anyway, this characterization is often insufficient to protect the olive oil tipicity.
Therefore, many analytical procedures have been used to objectively characterize the geographical origin of extra virgin olive oils and cultivars as well as detecting adulteration and guaranteeing authentication, without using a panel test (subjective sensory analysis). These authentication methods, usually associated with chemometrics analysis, can be classified as “with identification” and “without identification” (or “fingerprint”) techniques. The former are focused on the existence or absence of certain chemical compounds in the adulterated sample (e.g. major and minor components of virgin olive oils: triacylglycerols, diacylglycerols, wax esters, free fatty acids, triterpenic alcohols, hydrocarbons, sterols, phenols, flavonoids, pigments, tocopherols, volatile compounds, etc.), the latter are based on a combination of measurements (e.g. spectral fingerprints, multi-sensor array fingerprints, etc.).
The identification methods are dominated by chromatographic techniques1-5, mainly GC (gas-chromatography), using several sample introduction and detection methods, according to the chemical fraction to analyse6-11. HPLC (high-pressure liquid chromatography)12-14, even coupled with mass-spectrometry (HPLC-MS)15, has been used in order to solve the authenticity problem of olive oil too. An analogous aim was also pursued by other identification, but non-chromatographic techniques. E.g. Zeiner et al. performed a pilot study on the geographical traceability of several olive oils coming from different regions in Croatia (including industrial regions, national parks and rural areas) determining their trace elemental content by ICP-AES (inductively coupled plasma-atomic emission spectrometry) and ETA-AAS (electro thermal atomisation-atomic absorption spectrometry)16. Currently, many authors17-21 are also describing the use of biochemical techniques based on DNA analysis for determining the authenticity of PDO oils.
As far as fingerprint techniques are concerned, electronic noses both based on chemical sensors and on mass spectrometry22-23 and spectroscopic methods such as NMR (nuclear magnetic resonance)24-27, NIR (near-infrared spectroscopy)28, UV29, Stable Isotope Ratio Analysis30 have been largely applied with the aim at unravelling olive oil adulteration. E.g., Mannina et al. reviewed the contribution of high-resolution NMR to olive oil characterization24. Rezzi et al.25 used 1H NMR fingerprints for assessing the geographical origin and the year of production for olive oils coming from various Mediterranean areas, whereas Shawa et al. 26 in 1997 and Vhalov et al.27 in 2003 tried to discriminate Italian olive oil, on the basis of their 13C NMR spectra. Bertran et al.28 applied NIR for discriminating virgin olive oils of two very similar and geographically close Spanish denominations of origin. In 1999 Angerosa et al.30 showed that isotopic data measured on virgin olive oil coming from the Mediterranean basin, could be useful for determining the oil tipicity, above all for non-neighbouring and climatically different Countries.
As far as visible extra virgin olive oils spectra are concerned, the visible region has been rarely used in the characterization of food origin. Downey et al.29 used combined visible and NIR spectra for the classification of extra virgin olive oils coming from the eastern Mediterranean and they concluded that only the combination of visible and NIR spectra have a noticeable classification potential, mainly due to the information in the NIR range.
Despite the wide range of modern analytical tool, all of them have at least one of the following weaknesses: time-consuming (e.g. identification techniques), money-consuming (e.g. NMR, NIR, electronic noses, pyrolysis-mass spectrometry, etc.), involvement of unusual instruments in chemical quality control laboratories, which required skilled users (e.g. biochemical techniques, etc.). Thus, our aim is to demonstrate the usefulness of the cheep, fast, easy and possibly on-line achievable UV/visible analytical method coupled with chemometrics data analysis. UV/visible spectrophotometer is surely present in each chemical laboratory analysing vegetable oils. In fact, K232 and K270 extinction coefficients, calculated from absorption at 232 and 270 nm respectively with a UV spectrophotometer using a 1% solution of oil in cyclohexane, represent some of the quality indices required by the EC regulation for the commercial classification of olive oils31. Moreover, chemometrics methods, which extract relevant information from a set of numerous, chemical or physical, variables, are nowadays “a must” for food characterization, with regard to genuineness, origin and variety.
In particular, this paper reports on the classification ability of high-quality extra virgin olive oils coming from different Mediterranean areas, simply using the UV/Visible spectra of pure oils and elaborating the obtained signals by means of multivariate statistical analysis. Special attention was paid to characterize the extra virgin olive oil from West Liguria (a North Italy region), whose peculiar organoleptic features deserved it the protected designation of origin (PDO “Riviera Ligure-Riviera dei fiori”)32. The peculiar aroma of this oil, where cultivar Taggiasca largely prevails (>90 %), is particularly valued for its nutritional and sensorial qualities, resulting both from the olives cultivar and from some peculiar features of the growing area. This high quality niche product is very expensive and thus it is often submitted to profitable adulterations. The UV region saturation limited the investigations to the visible region.A preliminary study just on the visible spectra of extra virgin olive oils coming from several Mediterranean regions showed a large overlap and it singled out the impossibility to use visible spectra to obtain a reasonable classification performance.
However, chemometrics offers a lot of tools to extract useful information, even if the original data seem almost useless. For example, in NIR spectroscopy the original spectra are
The information content of visible spectra of e.v. olive oil in the characterization of its origin
frequently influenced by light scattering and dominated by the peaks of water. Anyway, by means of pre-processing data, using multiplicative scattering correction and using the second derivative of spectra, a small prediction error is often obtained, even if the original spectra are almost useless. For this reason, we decided to study again the visible spectra of extra virgin olive oils, in order to evaluate their information content by means of some selected chemometrics techniques.
Usually typical foodstuff characterization is performed by classification techniques, such as the Linear Discriminant Analysis (LDA) of R.A. Fisher33, the oldest and probably the most used classification tool. Probabilistic classification techniques, as LDA, classify a sample described by the value x of a variable or by a vector x of many variables in the class c whose estimated probability density p(x/c) is largest. These techniques are not very useful in the control of origin or genuineness of a sample, where the question to be answered is “Does the sample really have the characteristics of its label?”. In fact, the classification methods always assign each sample to one among the available classes without rejecting samples.
On the contrary, class-modelling techniques build one model of the target class (e.g. the “labelled class” of the foodstuff under study) and they are able to reject samples if they are evaluated as belonging to none of the available classes and, moreover, they are able to determine samples as potential membership in more than a single class (confused samples). In fact, a class model is characterized by two parameters: sensitivity (the percentage of correctly classified samples for a target class) and specificity (the percentage of samples rejected by the class model under study). So a “perfect” class model has 100% sensitivity and 100% specificity.
Class modelling techniquesThe class modelling techniques more frequently used are SIMCA and UNEQ34-36. The
former technique builds a class model on the significant principal components of the studied class. The principal components are generally computed after variables column centring or autoscaling. Column centring subtracts to each variable (column) its mean computed on all the objects. Autoscaling divides the centred data by the standard deviation of the variable. The dispersion around the class model (the SIMCA distance) is computed using the other, not-significant, principal components. A sample is accepted by the class model when its SIMCA distance is not significantly larger than the mean distance of the objects of the studied category. SIMCA can also be used when the number of variables is larger than the number of samples used to develop the class model. A drawback of SIMCA, generally not well recognized, is that not-discriminant variables have a harmful effect on the model performance, especially specificity.
UNEQ is the name currently used in chemometrics for the class modelling technique developed by H. Hotelling and based on the Hotelling T2 statistics. UNEQ is the class modelling version of quadratic discriminant analysis (QDA), where each category is described by the estimates of the means of the variables and the category variance-covariance matrix. The underlying statistical hypothesis to use QDA is that the probability density distribution is multivariate normal. UNEQ is less sensitive than SIMCA to the presence of non-discriminant variables, but the results can be very bad when the distribution is very different from the multivariate normal one. Moreover, QDA cannot be used when the number of objects in each class is less than the number of variables. Even if the ratio between the number of objects and the number of variables is close to 1, the variance-covariance matrix cannot usually be inverted. Thus, a ratio of at least 3 is usually suggested. If ratio is <3, QDA can be performed after reduction of the dimensionality, e.g. by using the first principal components. However, in the case of many non-discriminant variables the results of QDA on the principal components are generally bad.
In the case of complex distributions, too different from the multivariate normal distribution to apply UNEQ, a non-parametric modelling technique based on the potential functions can be used37-38. Potential functions have also been used to develop a modelling technique, CLASSY, based on the synergism with SIMCA39.
The selected critical levels (to accept a sample in the target class model), of Fisher F in SIMCA, of Hotelling variable T2 in UNEQ, usually correspond to a significance level of 5%, but rarely the experimental sensitivity is 95%, because of the deviation from the statistical hypotheses (of multivariate normality in UNEQ, of the distribution of the distances in SIMCA). Frequently the sensitivity is too low.
Indeed, in practical cases the samples used to develop a class model are sure samples, e.g. certified by professional trade associations of a typical food. Thus, the models should be enlarged,
FORINA and coworkers
forcing them to have 100% sensitivity, what generally results in a lack of specificity. Moreover, the specificity of a class model is an ill-defined quantity. Its reliability depends on the representativity of the external objects, objects of categories other than the modelled one, used to measure the specificity. In this paper the modelled category is the PDO “Riviera Ligure-Riviera dei fiori” extra virgin olive oil and the external objects were selected to represent the oils whose high production might induce profitable adulterations32.
Selection of discriminant variablesDue to the harmful effect of non-discriminant variables on the specificity, mainly for
SIMCA, and due to the constraint ratio between the number of objects and the number of variables, selection techniques must usually be used.Stepwise Linear discriminant analysis (Stepwise LDA) is probably the oldest method of variable selection for the classification techniques40.
There are many other techniques to select relevant variables (e.g. SIMCA discriminant power, genetic algorithms, stepwise orthogonalization, etc.). Due to the satisfactory results obtained by stepwise LDA, the use of other selection techniques was considered not necessary for this research.
EXPERIMENTAL
Samples104 extra virgin olive oils were analyzed: 30 were oils from West Liguria, 30 from Puglia,
15 from Greece, 15 from Spain and 14 from Tunisia. All the samples were obtained from the same olive crop (2003-2004) by collecting them from producers in each considered geographical area. For labeling purpose during the chemometrics analysis the samples were designated as LIG; PUG, GRE; SPA and TUN respectively. The samples were stored in hermetically sealed topaz glass flask in a cold dark place till analysis to avoid losses or oxidations.
StandardsIsooctane (spectrophotometer grade) was used as a blank and it was purchased by Sigma-
Aldrich (St. Louis, MO, USA).
InstrumentsUV-visible spectra (range from 190 to 820 nm with 2 nm resolution) were recorded on HP
8452A Diode-Array Spectrophotometer, a single-beam, microprocessor-controlled spectrophotometer.
Sample analysisExtra virgin olive oils were directly analyzed with no sample pre-treatment step other than
filtration trough paper. Oil spectra were collected at room temperature, filling the quartz cell with samples (0.9 mL approximately). Between samples, the sample cell components were washed with detergent in warm water, rinsed with acetone and then dried. All samples were run at least in two repetitions.
Data analysisRaw spectral files were imported into PARVUS package41 for data analysis. Before
classification and class-modelling, the following steps were performed on the data set:a) Pre-treatments. A lot of spectra pre-treatments have been performed, however only the
results most interesting in that regards the classification and modelling performances, those obtained using row profiles (below simply “Profiles”), are reported. Row profiles are obtained for each sample dividing the original values of absorbance (original variables, below simply “Original”) by the sum of the absorbances. The result is a spectrum of “percent absorbances”, where the differences in saturation are deleted and those in tonality retained.
When principal components data were used, the data were usually autoscaled, sometimes only centred).
The information content of visible spectra of e.v. olive oil in the characterization of its origin
b) Transforms. First, second and third derivatives of the profiles were computed by means of third-order smoothing polynomials through eleven points.
c) Features Selection. Selection of discriminant wavelengths was performed by means of Stepwise Linear discriminant analysis (with F to enter = 1, F-to-remove 0.5) following three different criteria: with all the samples, with the selection, in each step, of the variable producing the largest increase in the Mahalanobis distance between the two closest categories; with all the samples, with the selection, in each step, of the variable producing the largest increase in the Mahalanobis distance between West Liguria and the closest category; with the samples of West Liguria oils and with those of one of the other categories. So each model computed with the selected variables is prepared to check only one external category at a time.
Then, QDA and UNEQ were applied. The results obtained using LDA, only for classification, and SIMCA are of limited interest, and thus they are not reported.
The classification rate and the prediction rate were computed only for the objects of the modelled class. To evaluate the prediction rate the usual cross-validation procedure was performed, with five cancellation groups. The classification rule was computed five times, each time with the objects of four cancellation groups, and the prediction ability was measured on the objects of the left-out group. The number of cancellation groups, five, is considered to provide a more realistic, not too optimistic, evaluation of the prediction rate, as usually happens using the leave-one-out validation procedure. Firstly, the class models were used with critical levels, of Fisher F in SIMCA, of Hotelling variable T2 in UNEQ, corresponding to a significance level of 95%. Then the models were enlarged to have 100% sensitivity and they are reported below as “forced models”.
RESULTS AND DISCUSSION
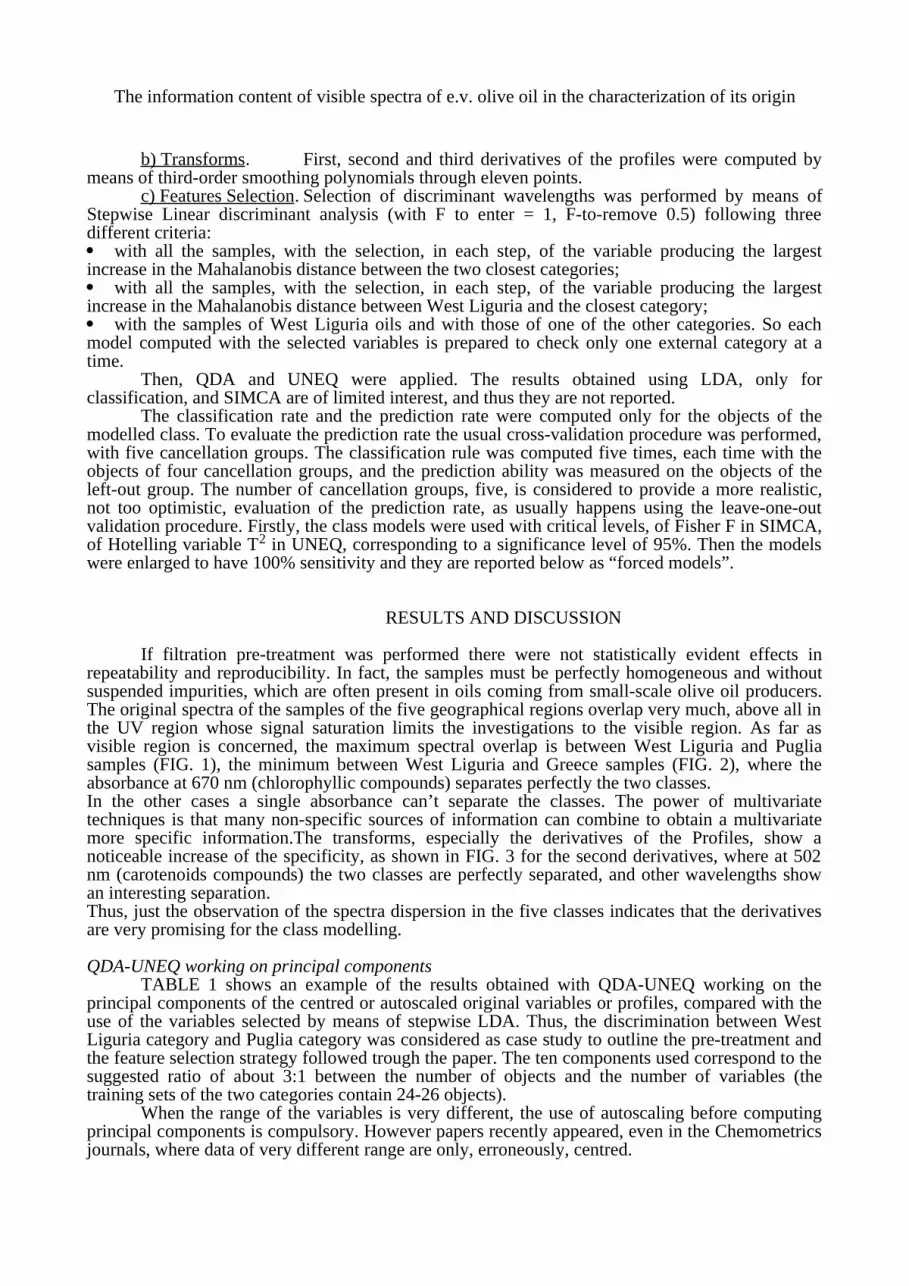
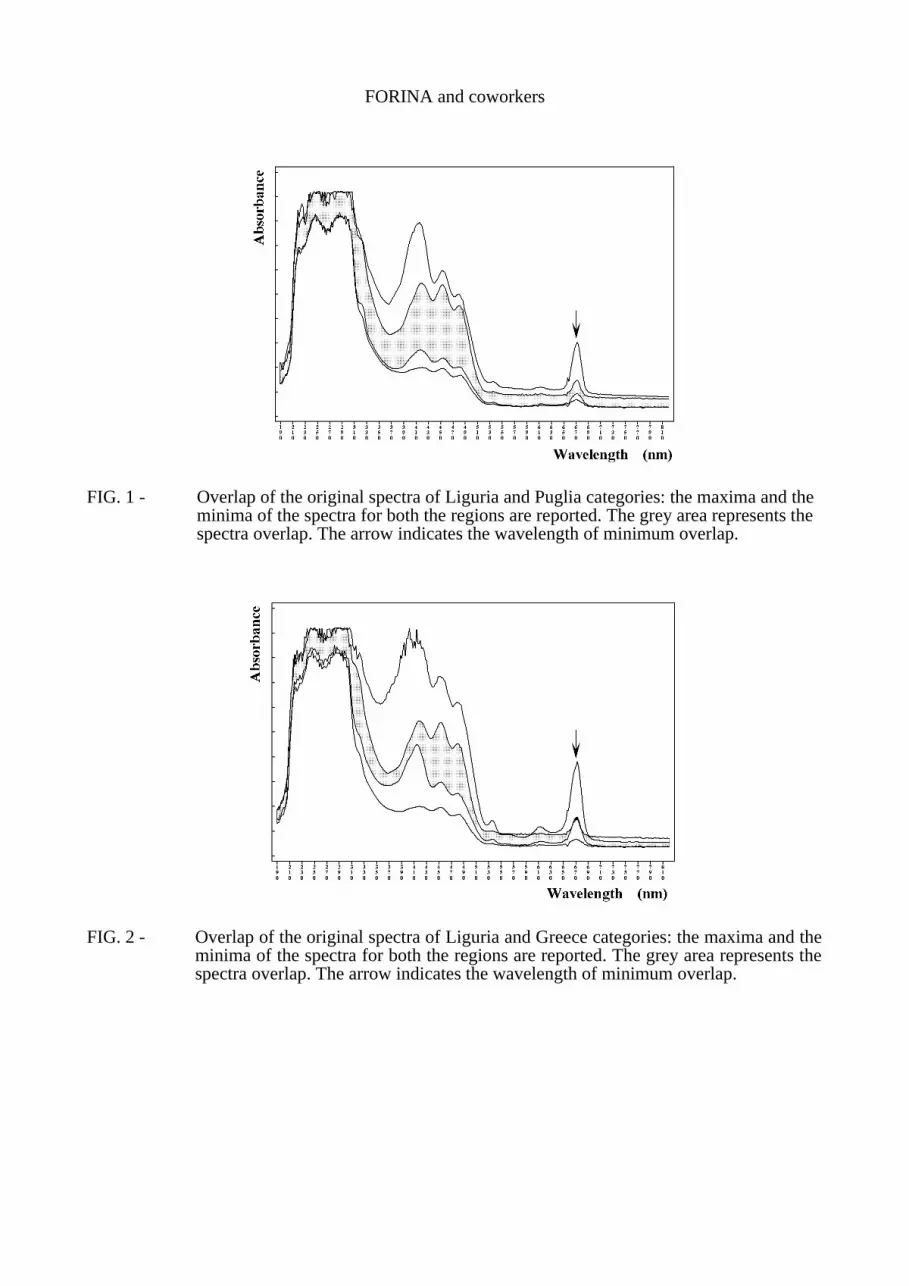
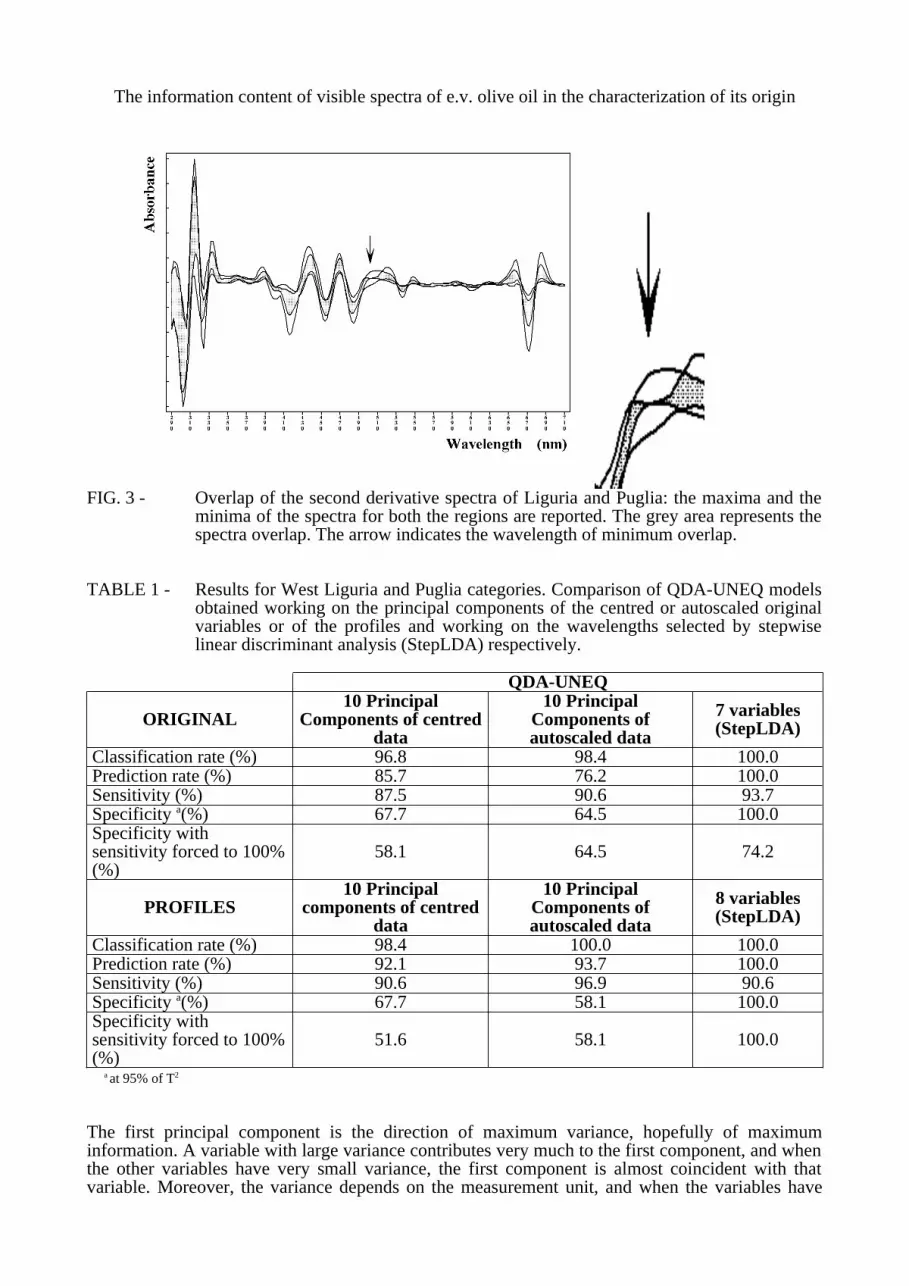
If filtration pre-treatment was performed there were not statistically evident effects in repeatability and reproducibility. In fact, the samples must be perfectly homogeneous and without suspended impurities, which are often present in oils coming from small-scale olive oil producers. The original spectra of the samples of the five geographical regions overlap very much, above all in the UV region whose signal saturation limits the investigations to the visible region. As far as visible region is concerned, the maximum spectral overlap is between West Liguria and Puglia samples (FIG. 1), the minimum between West Liguria and Greece samples (FIG. 2), where the absorbance at 670 nm (chlorophyllic compounds) separates perfectly the two classes.In the other cases a single absorbance can’t separate the classes. The power of multivariate techniques is that many non-specific sources of information can combine to obtain a multivariate more specific information.The transforms, especially the derivatives of the Profiles, show a noticeable increase of the specificity, as shown in FIG. 3 for the second derivatives, where at 502 nm (carotenoids compounds) the two classes are perfectly separated, and other wavelengths show an interesting separation.Thus, just the observation of the spectra dispersion in the five classes indicates that the derivatives are very promising for the class modelling.
QDA-UNEQ working on principal componentsTABLE 1 shows an example of the results obtained with QDA-UNEQ working on the
principal components of the centred or autoscaled original variables or profiles, compared with the use of the variables selected by means of stepwise LDA. Thus, the discrimination between West Liguria category and Puglia category was considered as case study to outline the pre-treatment and the feature selection strategy followed trough the paper. The ten components used correspond to the suggested ratio of about 3:1 between the number of objects and the number of variables (the training sets of the two categories contain 24-26 objects).
When the range of the variables is very different, the use of autoscaling before computing principal components is compulsory. However papers recently appeared, even in the Chemometrics journals, where data of very different range are only, erroneously, centred.
FORINA and coworkers
FIG. 1 - Overlap of the original spectra of Liguria and Puglia categories: the maxima and the minima of the spectra for both the regions are reported. The grey area represents the spectra overlap. The arrow indicates the wavelength of minimum overlap.
FIG. 2 - Overlap of the original spectra of Liguria and Greece categories: the maxima and the minima of the spectra for both the regions are reported. The grey area represents the spectra overlap. The arrow indicates the wavelength of minimum overlap.
The information content of visible spectra of e.v. olive oil in the characterization of its origin
FIG. 3 - Overlap of the second derivative spectra of Liguria and Puglia: the maxima and the
minima of the spectra for both the regions are reported. The grey area represents the spectra overlap. The arrow indicates the wavelength of minimum overlap.
TABLE 1 - Results for West Liguria and Puglia categories. Comparison of QDA-UNEQ models obtained working on the principal components of the centred or autoscaled original variables or of the profiles and working on the wavelengths selected by stepwise linear discriminant analysis (StepLDA) respectively.
The first principal component is the direction of maximum variance, hopefully of maximum information. A variable with large variance contributes very much to the first component, and when the other variables have very small variance, the first component is almost coincident with that variable. Moreover, the variance depends on the measurement unit, and when the variables have
FORINA and coworkers
different nature it is possible, with the use of different units, to orient the first component (and also the other components) in whatever direction. On the contrary, autoscaled variables have the same unit, variance, thus the direction of the components only depends on the structure of the data. In the case the variables have the same nature (as in spectra) autoscaling can give too much importance to noisy variables with small range. For this reason it is advisable to evaluate both the treatments.
In our case the range of the profiled variables (roughly proportional to their standard deviation), is from 0.004 to 0.060 about, and the smallest ranges correspond to the intervals of small absorbance, whose importance in the discrimination is probably lesser than the intervals characterized by high absorbances. However, also in this case the results obtained with the principal components of centred data are neatly worse than those obtained with the principal components of autoscaled data.The larger value of the specificity corresponding to the sensitivity evaluated with the 95% critical value of the Hotelling variable T2 is deceptive, since it was obtained from a model whose sensitivity is only 90.62%. When the model is forced to have 100% sensitivity, the specificity becomes smaller than that obtained using autoscaled data.
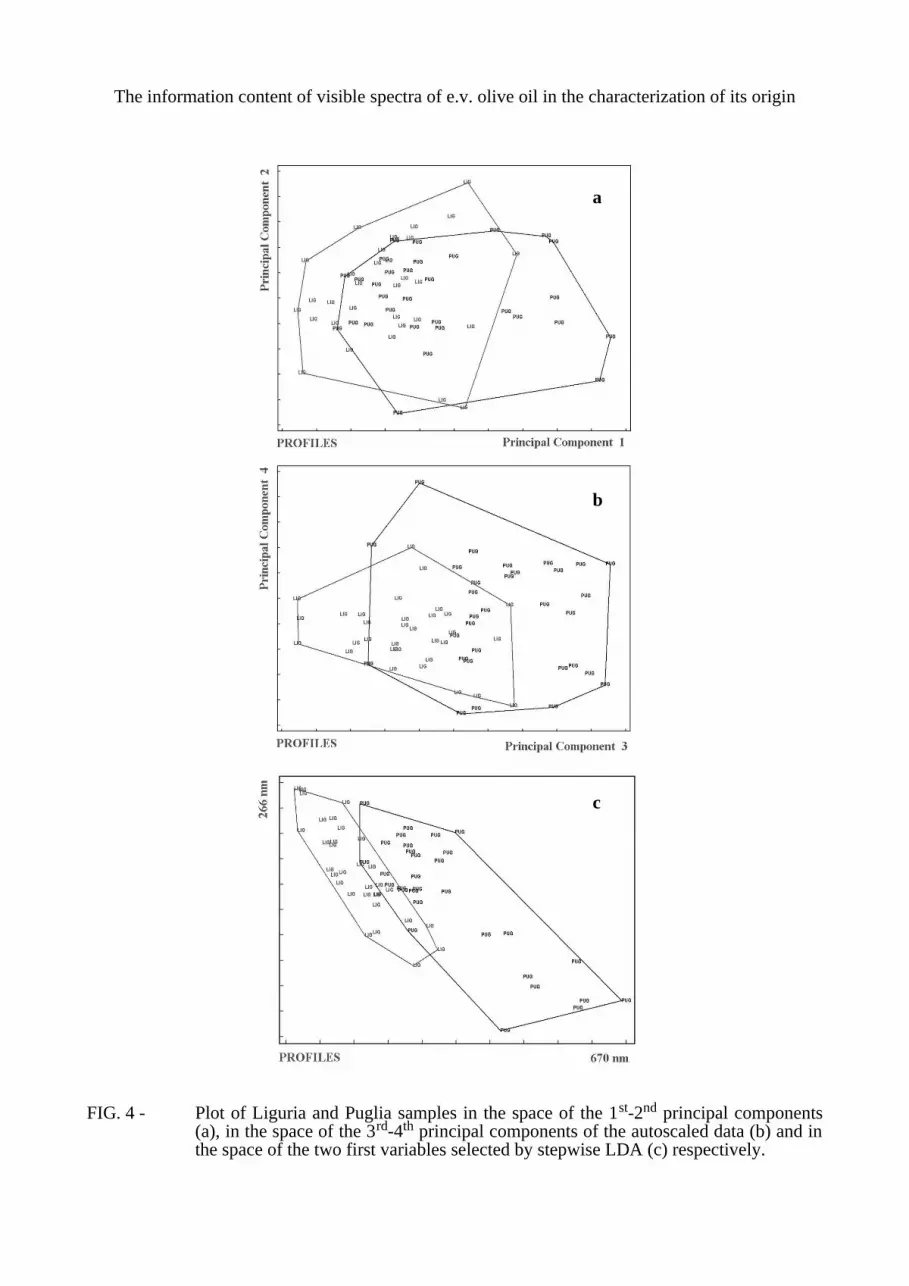
However, working on the principal components of the autoscaled data the results are not satisfactory too. The large amount of non-discriminant information permeates the principal components. FIG. 4 shows as the overlap of the two classes in the space of the principal components is very large, compared with the overlap in the space of the two first variables selected by stepwise LDA. Thus, it seems important to reduce the number of variables not by the use of principal components but by selection of discriminant variables.The last column of TABLE 1 shows as the performances of the models computed with the variables selected by stepwise LDA are much better, especially when the profiles are used.For this reason, in the following study, QDA-UNEQ was always used after selection of discriminant variables.
The information content of visible spectra of e.v. olive oil in the characterization of its origin
FIG. 4 - Plot of Liguria and Puglia samples in the space of the 1st-2nd principal components (a), in the space of the 3rd-4th principal components of the autoscaled data (b) and in the space of the two first variables selected by stepwise LDA (c) respectively.
a
b
c
FORINA and coworkers
Results obtained studying all the five categories togetherThe number of variables selected by stepwise LDA is limited because the F-to-enter value
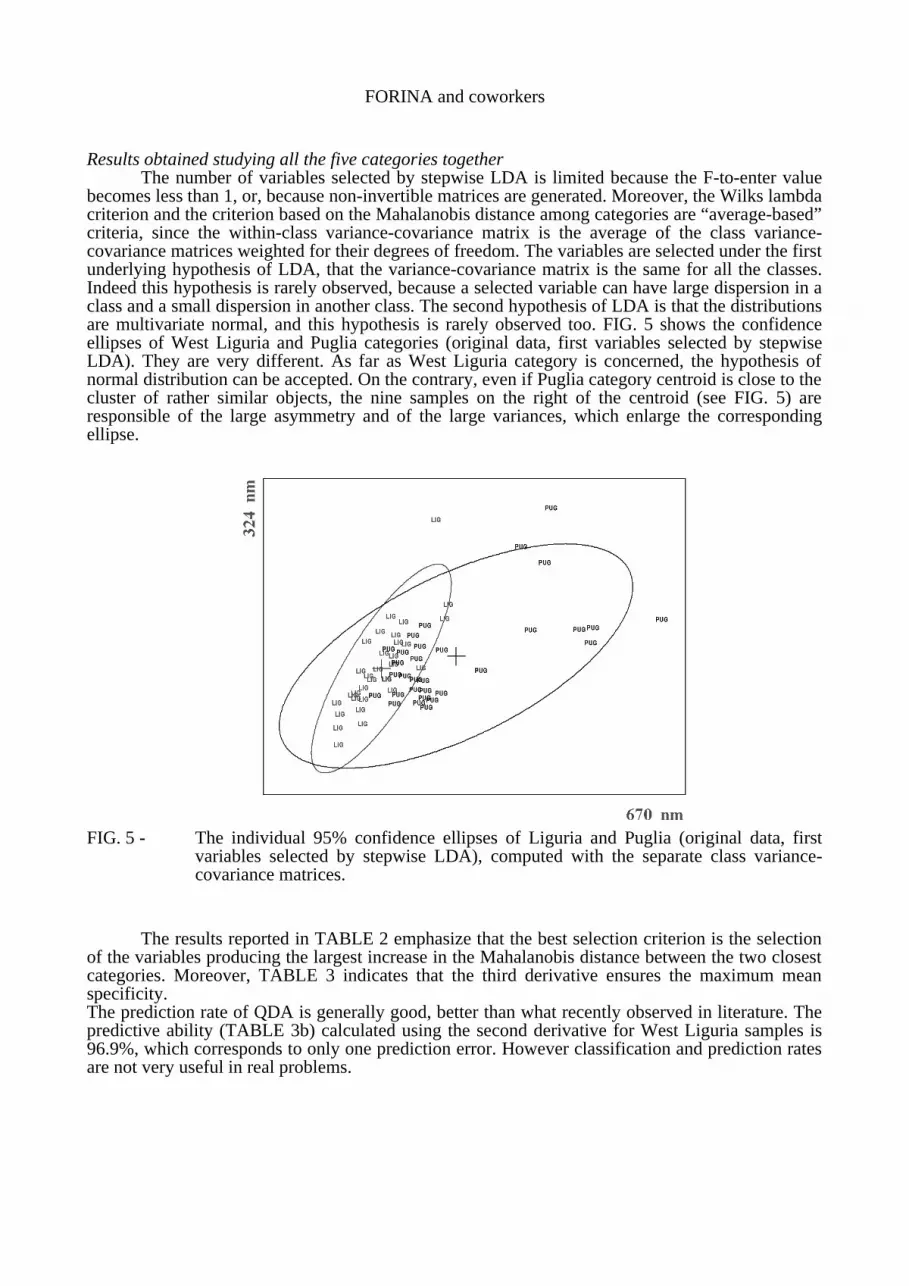
becomes less than 1, or, because non-invertible matrices are generated. Moreover, the Wilks lambda criterion and the criterion based on the Mahalanobis distance among categories are “average-based” criteria, since the within-class variance-covariance matrix is the average of the class variance-covariance matrices weighted for their degrees of freedom. The variables are selected under the first underlying hypothesis of LDA, that the variance-covariance matrix is the same for all the classes. Indeed this hypothesis is rarely observed, because a selected variable can have large dispersion in a class and a small dispersion in another class. The second hypothesis of LDA is that the distributions are multivariate normal, and this hypothesis is rarely observed too. FIG. 5 shows the confidence ellipses of West Liguria and Puglia categories (original data, first variables selected by stepwise LDA). They are very different. As far as West Liguria category is concerned, the hypothesis of normal distribution can be accepted. On the contrary, even if Puglia category centroid is close to the cluster of rather similar objects, the nine samples on the right of the centroid (see FIG. 5) are responsible of the large asymmetry and of the large variances, which enlarge the corresponding ellipse.
FIG. 5 - The individual 95% confidence ellipses of Liguria and Puglia (original data, first variables selected by stepwise LDA), computed with the separate class variance-covariance matrices.
The results reported in TABLE 2 emphasize that the best selection criterion is the selection of the variables producing the largest increase in the Mahalanobis distance between the two closest categories. Moreover, TABLE 3 indicates that the third derivative ensures the maximum mean specificity.The prediction rate of QDA is generally good, better than what recently observed in literature. The predictive ability (TABLE 3b) calculated using the second derivative for West Liguria samples is 96.9%, which corresponds to only one prediction error. However classification and prediction rates are not very useful in real problems.
The information content of visible spectra of e.v. olive oil in the characterization of its origin
TABLE 2 - Results obtained working on original variables and on row profiles. Variables selected by the following two different options of Stepwise LDA:
Model developed with 95% critical value of T2 statistics
a In each step the selected variable is that producing the largest increase of the Mahalanobis distance between the two closest categories.
b In each step the selected variable is that producing the largest increase of the Mahalanobis distance between West Liguria and the closest category.
TABLE 3 - Results obtained working on derivatives. Variables selected by stepwise LDA. In each step the selected variable is that producing the largest increase of the Mahalanobis distance between the two closest categories.
a) Sensitivity and specificities
Model developed with 95% critical value of T2 statisticsFirst derivative Second derivative Third derivative
Results obtained studying West Liguria category against each other categoryThe real problem is the protection of PDO “Riviera Ligure-Riviera dei fiori” extra virgin
olive oil, from possible adulterants, such as the samples of the other regions taken into account. Due to the limitations of the selection of relevant variables when all the five categories are
studied together, the West Liguria samples were studied against the samples of each other category separately. Anytime, starting from original variables, from profiles and from derivatives, after variable selection, the corresponding class model was developed. Thus, four distinct models of West Liguria were obtained, as tools to check a possible suspect sample. In fact, a suspect sample should be checked by all these models and only if all the four models accept it, it can be considered a true West Liguria sample. In particular, it is important to single out that only the F value (Wilks statistics) of the first entered variable is very indicative of the category separation. Using the original variables, the F value for the first selected variable is very large only in the case of Greek oils (it corresponds to the perfect separation of West Liguria and Greek oils at 670 nm, shown in FIG. 2). Generally the F value increases from the original variables to the profiles to the derivatives. Among the derivatives, the maximum F value of the first entered variable is obtained three times with the third derivative (e.g. West Liguria vs. Puglia, West Liguria Greece, West Liguria vs. Spain), once with the second derivative (West Liguria vs. Tunisia).
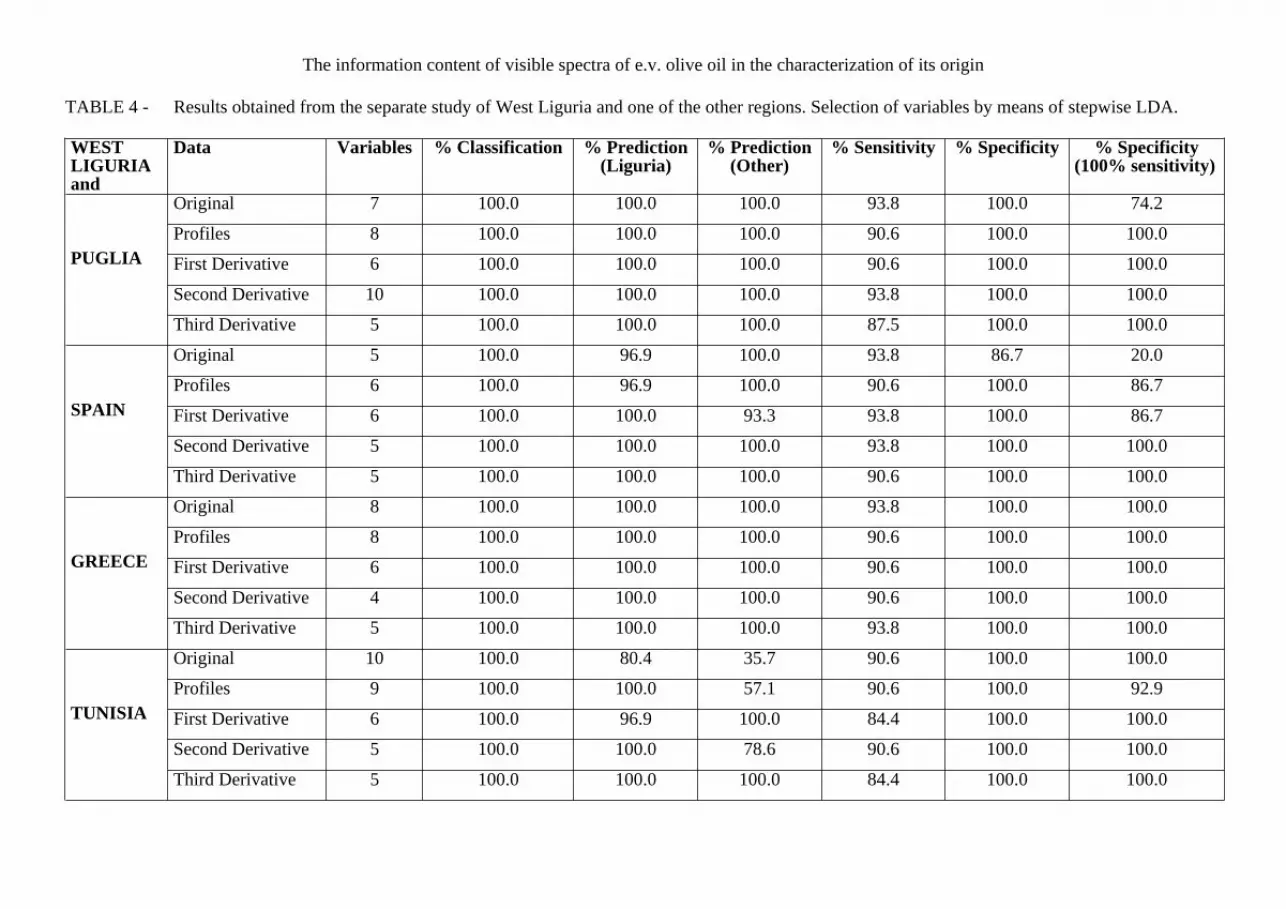
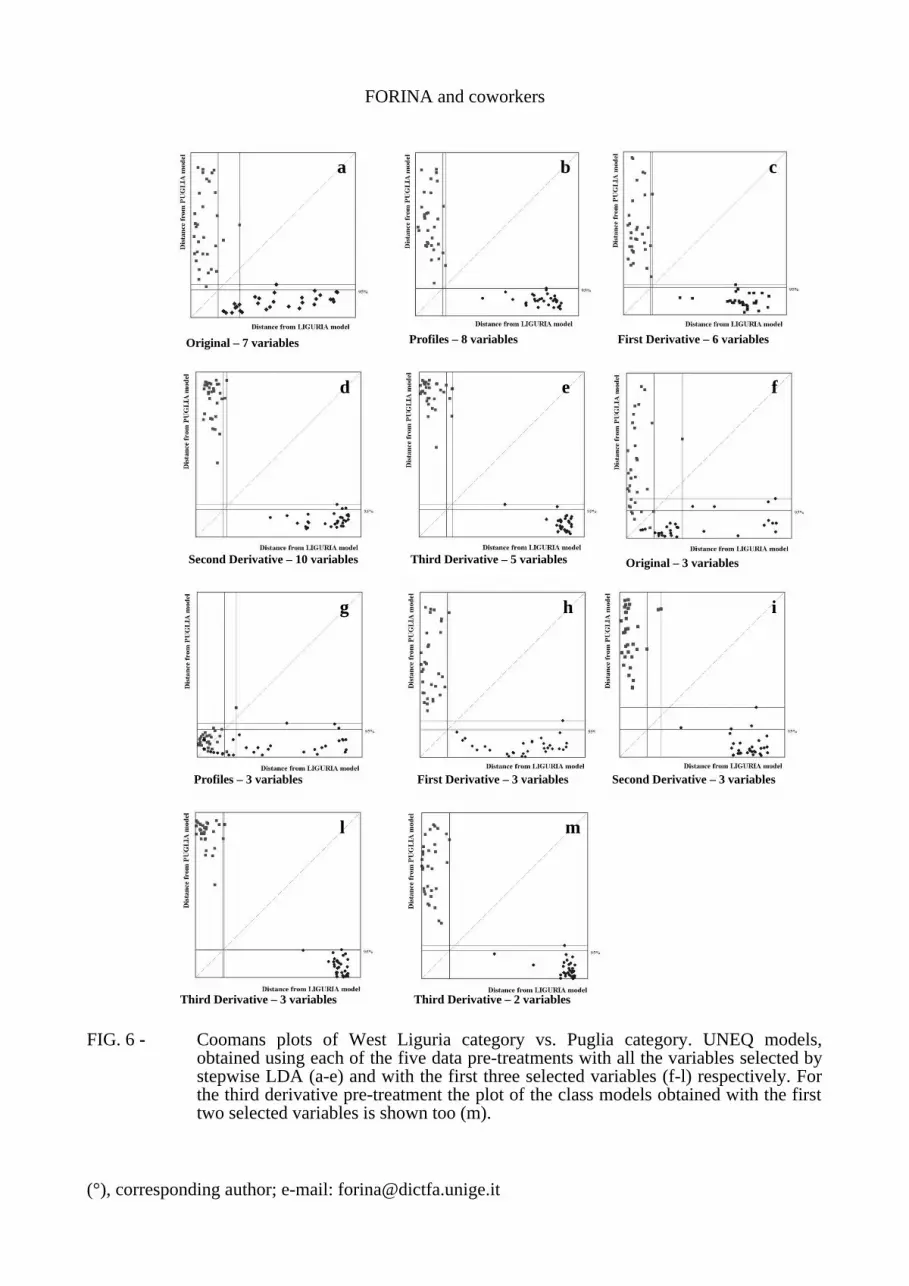
The results reported in TABLE 4 were obtained using all the variables selected by stepwise LDA. TABLE 4 shows as classification rate, prediction rate, sensitivity and specificity of forced models are always 100% with the third derivative. With the second derivative only the prediction of three samples are predicted as West Liguria oils, but they are not accepted by the West Liguria model. With the first derivative sometimes the West Liguria model with sensitivity 100% has less than 100% specificity. The results with profiles and original variables are slightly worse, except in the case of Greece. Obviously, when more than two variables are used to build the class model, the separation ability shown in the space of original variables is only partial. On the contrary, Coomans plots (FIGS. 6-7), whose axes report the multivariate (Mahalanobis) distances from the model (the centroid of the categories), exhaustively represent the class separation. Thus, it is possible to observe that even if West Liguria model against Puglia model has 100% forced specificity using several treatments (such as profiles, first, second and third derivative), working with the third derivative Puglia samples are farther from the model of West Liguria than working with the other treatments. Using the third derivative, the class separation is excellent also when only two or three variables are taken into account. Really with three variables the separation is better than with all the selected variables.
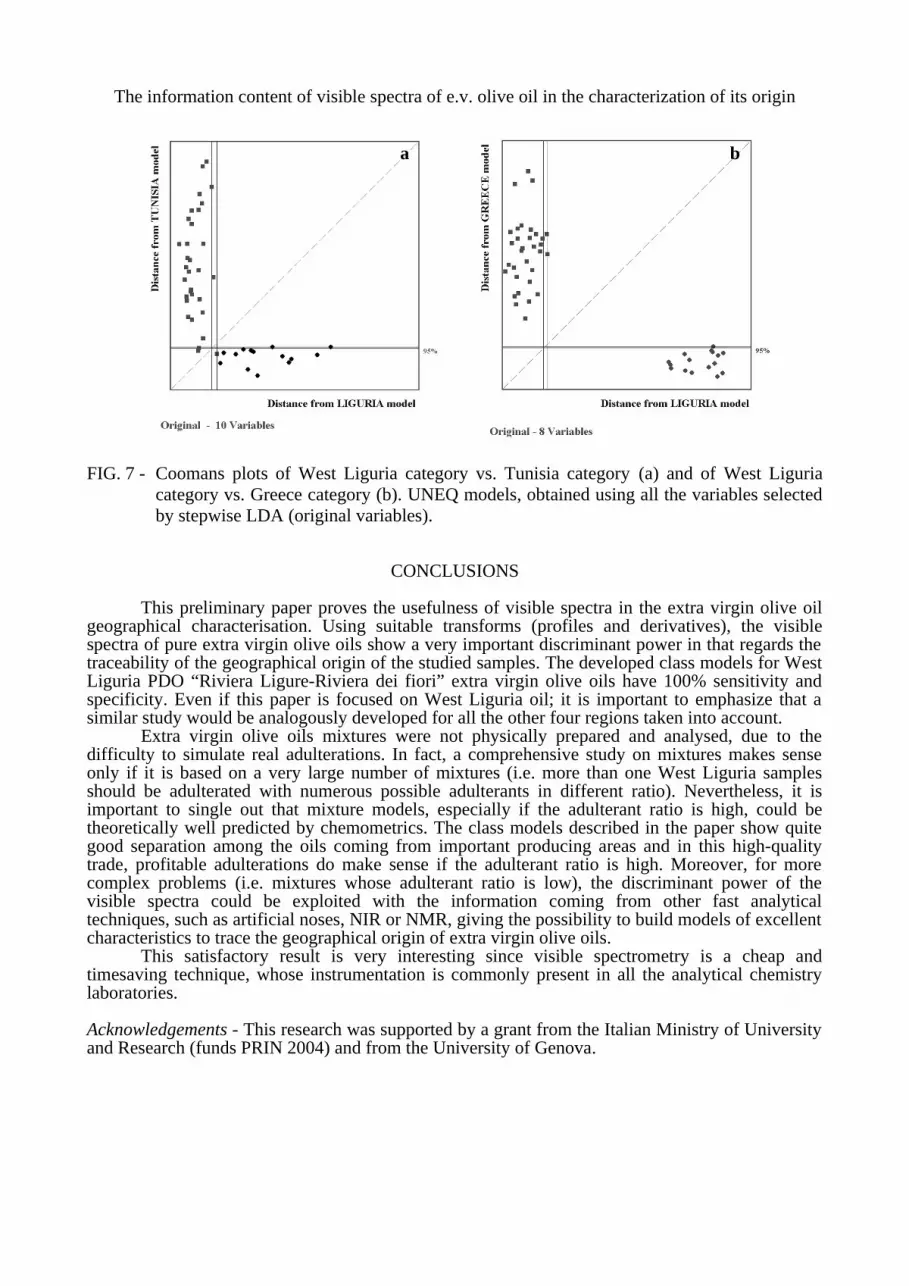
Finally, FIG. 7 emphasizes respectively the separation of Tunisian samples (left side) and Greek samples (right side) from West Liguria models. The models are always 100% specific working with the original data, even if some Tunisian samples are rather close to the model boundary, while all the Greek samples are very far from West Liguria model.
The information content of visible spectra of e.v. olive oil in the characterization of its origin
TABLE 4 - Results obtained from the separate study of West Liguria and one of the other regions. Selection of variables by means of stepwise LDA.
WEST LIGURIAand
Data Variables % Classification % Prediction(Liguria)
First Derivative 6 100.0 100.0 100.0 90.6 100.0 100.0
Second Derivative 10 100.0 100.0 100.0 93.8 100.0 100.0
Third Derivative 5 100.0 100.0 100.0 87.5 100.0 100.0
SPAIN
Original 5 100.0 96.9 100.0 93.8 86.7 20.0
Profiles 6 100.0 96.9 100.0 90.6 100.0 86.7
First Derivative 6 100.0 100.0 93.3 93.8 100.0 86.7
Second Derivative 5 100.0 100.0 100.0 93.8 100.0 100.0
Third Derivative 5 100.0 100.0 100.0 90.6 100.0 100.0
GREECE
Original 8 100.0 100.0 100.0 93.8 100.0 100.0
Profiles 8 100.0 100.0 100.0 90.6 100.0 100.0
First Derivative 6 100.0 100.0 100.0 90.6 100.0 100.0
Second Derivative 4 100.0 100.0 100.0 90.6 100.0 100.0
Third Derivative 5 100.0 100.0 100.0 93.8 100.0 100.0
TUNISIA
Original 10 100.0 80.4 35.7 90.6 100.0 100.0
Profiles 9 100.0 100.0 57.1 90.6 100.0 92.9
First Derivative 6 100.0 96.9 100.0 84.4 100.0 100.0
Second Derivative 5 100.0 100.0 78.6 90.6 100.0 100.0
Third Derivative 5 100.0 100.0 100.0 84.4 100.0 100.0
FORINA and coworkers
FIG. 6 - Coomans plots of West Liguria category vs. Puglia category. UNEQ models, obtained using each of the five data pre-treatments with all the variables selected by stepwise LDA (a-e) and with the first three selected variables (f-l) respectively. For the third derivative pre-treatment the plot of the class models obtained with the first two selected variables is shown too (m).
The information content of visible spectra of e.v. olive oil in the characterization of its origin
FIG. 7 - Coomans plots of West Liguria category vs. Tunisia category (a) and of West Liguria category vs. Greece category (b). UNEQ models, obtained using all the variables selected by stepwise LDA (original variables).
CONCLUSIONS
This preliminary paper proves the usefulness of visible spectra in the extra virgin olive oil geographical characterisation. Using suitable transforms (profiles and derivatives), the visible spectra of pure extra virgin olive oils show a very important discriminant power in that regards the traceability of the geographical origin of the studied samples. The developed class models for West Liguria PDO “Riviera Ligure-Riviera dei fiori” extra virgin olive oils have 100% sensitivity and specificity. Even if this paper is focused on West Liguria oil; it is important to emphasize that a similar study would be analogously developed for all the other four regions taken into account.
Extra virgin olive oils mixtures were not physically prepared and analysed, due to the difficulty to simulate real adulterations. In fact, a comprehensive study on mixtures makes sense only if it is based on a very large number of mixtures (i.e. more than one West Liguria samples should be adulterated with numerous possible adulterants in different ratio). Nevertheless, it is important to single out that mixture models, especially if the adulterant ratio is high, could be theoretically well predicted by chemometrics. The class models described in the paper show quite good separation among the oils coming from important producing areas and in this high-quality trade, profitable adulterations do make sense if the adulterant ratio is high. Moreover, for more complex problems (i.e. mixtures whose adulterant ratio is low), the discriminant power of the visible spectra could be exploited with the information coming from other fast analytical techniques, such as artificial noses, NIR or NMR, giving the possibility to build models of excellent characteristics to trace the geographical origin of extra virgin olive oils.
This satisfactory result is very interesting since visible spectrometry is a cheap and timesaving technique, whose instrumentation is commonly present in all the analytical chemistry laboratories.
Acknowledgements - This research was supported by a grant from the Italian Ministry of University and Research (funds PRIN 2004) and from the University of Genova.
ba
FORINA and coworkers
REFERENCES
1) M. Forina and E. Tiscornia, Annali di Chimica (Rome), 72, 143 (1982). 2) A. Cert, W. Moreda and M.C. Perez-Camino, Journal of Chromatography A, 881, 131 (2000). 3) D. Ollivier, J. Artaud, C. Pinatel, J.P. Durbec and M. Guerere, Food Chemistry, 97, 382 (2006).4) F. Marini, A. Magrì, R. Bucci, F. Balestrieri and D. Marini, Chemometrics and Intelligent
Laboratory Systems, 80, 140 (2006).5) R. Boggia, P. Zunin, S. Lanteri, N. Rossi and F. Evangelisti, Journal of Agricultural and Food
Chemistry, 50, 2444 (2002).6) G.F. Montedoro, M. Servili, M. Baldioli, R. Selvaggini, G. Perretti, C. Magnarini, L. Cossignani
and P. Damiani, La Rivista Italiana delle Sostanze Grasse, 72, 403 (1995).7) R. Aparicio and G. Luna, European Journal of Lipid Science and Technology, 104, 614 (2002).8) S. Vichi, L. Pizzale, L. Conte, S. Buxaderas and E. Lopez-Tamames, Journal of Agricultural
and Food Chemistry, 51, 6572 (2003).9) F. Angerosa, M. Servili, R. Selvaggini, A. Taticchi, S. Esposto and G.F. Montedoro, Journal of
Chromatography A, 1054, 17 (2004).10) P. Zunin, R. Boggia, P. Salvadeo and F. Evangelisti, Journal of Chromatography A, 1089, 243
(2005).11) G. Luna, M.T. Morales and R. Aparicio, Food Chemistry, 98, 243 (2006).12) A.F. Vinha, F. Ferreres, B.M. Silva, P. Valentao, A. Gonçalves, J.A. Pereira, M.B. Oliveira,
R.M. Seabra and P.B. Andrade, Food Chemistry, 89, 561 (2005).13) A. Cichelli and G.P. Pertesana, Journal of Chromatography A, 1046, 141 (2004).14) D. Giuffrida, F. Salvo, A. Salvo, L. La Pera and G. Dugo, Food Chemistry, Article in press
(2006).15) K. Nagy, D. Bongiorno, G. Avellone, P. Agozzino, L. Ceraulo and K. Vekey, Journal of
Chromatography A, 1078, 90 (2005).16) M. Zeinera, I. Steffana and C.I. Juranovic, Microchemical Journal, 81, 171 (2005).17) S. Alessandri, A. Cimato, G. Modi, A. Mattei, A. Crescenzi, S. Caselli and S. Tracchi, La
Rivista Italiana delle Sostanze Grasse, 74, 155 (1997).18) A. Angiolillo, M. Mencuccini and L. Baldoni, Theoretical Applied Genetics, 98, 411 (1999).19) K.M. Sefc, M.S. Lopes, D. Mendonça, M. Rodrigues Dos Santos, M. Laimer Da Câmara
Machado and A. Da Câmara Machado, Molecular Ecology, 9, 1171 (2000).20) M. Busconi, C. Foroni, M. Corradi, C. Bongiorni, F. Cattapan and C. Fogher, Food Chemistry,
83, 127 (2003). 21) M. Woolfe and S. Primrose , Trends in Biochemistry, 22, 222 (2004).22) A. Cimato, D. Dello Monaco, C. Distante, M. Epifani, P. Siciliano, A.M. Taurino, M. Zuppa
and G. Sani, Sensors and Actuators B, Article in press (2005).23) C. Cerrato Oliveros, R. Boggia, M. Casale, C. Armanino and M. Forina, Journal of
Chromatography A, 1076, 7 (2005). 24) L. Mannina, A.P. Sobolev and A. Segre, Spectroscopy Europe, 15/3, 6 (2003).25) S. Rezzi, D.E. Axelson, K. Heberger, F. Reniero, C. Mariani and C. Guillou, Analytica Chimica
Acta, 552, 13 (2005).26) A.D. Shawa, A. Di Camillo, G. Vlahov, A. Jones, G. Bianchi, J. Rowland and D.B. Kell,
Analytica Chimica Acta, 348, 357 (1997).27) G. Vlahov, P. Del Re and N. Simone, Journal of Agricultural and Food Chemistry, 51, 5612
(2003)28) E. Bertran, M. Blanco, J. Coello, H. Iturriaga, S. Maspoch and I. Monteliu, Journal of Near
Infrared Spectroscopy, 8, 45 (2000).29) G. Downey, P. McIntyre and A.N. Davies, Applied Spectroscopy, 57, 158 (2003).30) F. Angerosa, O. Breas, S. Contento, C. Guillou, F. Reniero and E. Sada, Journal of Agricultural
and Food Chemistry, 47, 1013 (1999).31) EC Regulation 2003. European Community Regulation No. 1989. Off. J. Eur. Communities:
Legislation 295 (2003).32) EC Regulation 1997. European Community Regulation No.123/97. Off. J. Eur. Communities:
Legislation 40 (1/23/1997) (1997).33) R.A. Fisher, Annals of Eugenics, 7, 179 (1936).34) S. Wold, Pattern Recognition, 8, 127 (1976).
The information content of visible spectra of e.v. olive oil in the characterization of its origin
35) H. Hotelling, in: C. Eisenhart, Hastay MHand Wallis WA (Eds.), Techniques of Statistical Analysis, McGraw-Hill, N.Y., 111 (1947).
36) M.P. Derde and D.L. Massart, Analytica Chimica Acta, 184, 33 (1986).37) D. Coomans and I. Broeckaert, Potential Pattern Recognition in Chemical and Medical Decision
Making, Reasearch Studies Press, Letchworth (1986).38) M. Forina, C. Armanino, R. Leardi and G. Drava, Journal of Chemometrics, 5, 435 (1991).39) H. Van der Voet, P.M.J. Coenegracht and J.B. Hemel, Analytica Chimica Acta, 192, 63 (1987).40) J.W. Dixon, (Ed.) Biomedical Computer Programs. University of California Press, Berkeley
(1973).41) M. Forina, S. Lanteri, C. Armanino, C. Cerrato Oliveros and C. Casolino, (2003) V-PARVUS
Release. An extendable package of programs for explorative data analysis, classification and regression analysis. Dipartimento di Chimica e Tecnologie Farmaceutiche ed Alimentari, University of Genova. Free available at http://www.parvus.unige.it