Page 1
1
An Experimental Investigation and Modelling of the Viscosity Refrigerant/oil Solutions.
V. P. Zhelezny1*, V.V. Sechenyh1, Yu. V. Semenyuk1, A. J. Grebenkov2, O. V. Beliayeva2
1 Odessa State Academy of Refrigeration, 1/3 Dvoryanskaya Str., 65026 Odessa, Ukraine
2 Joint Institute for Power and Nuclear Research – Sosny, 99 Akademik Krasin Str., 220109
Minsk, Belarus
* Corresponding author. Tel.: + 380 487 663146. Fax: + 380 482 238931.
E-mail address: [email protected]
Abstract
This paper presents experimental data for the viscosity of solutions of refrigerant
R600a (isobutane) with mineral compressor oils Azmol, Reniso WF 15A, and R245fa
(1,1,1,3,3-pentafluoropropane) with polyolester compressor oil Planetelf ACD 100 FY on the
saturation line. The experimental data were obtained for solution of R600a with mineral
compressor oil Azmol in the temperature range from 294.7 to 338.1 К and the concentration
range 0.04399 Rw 0.3651, the solution of R600a with mineral compressor oil Reniso WF
15A at the temperatures from 285.8 to 348.4 К and the concentration range 0.03364 Rw
0.2911, the solution of R245fa with polyolester compressor oil Planetelf ACD 100 FY at the
temperatures from 309 to 348.2 and the concentration range 0.06390 Rw 0.3845. The
viscosity was measured using a rolling ball method. The method for prediction of dynamic
viscosity for refrigerant/oil solutions is reported.
Keywords: Experimentation; Isobutane; Solution; R245fa; Oil; Viscosity.
Page 2
2
Nomenclature
a, b, c, d, e Coefficients in Eq. (4, 6-9)
C Viscosimeter constant, m2 s-2
m Mass, kg
T Temperature, K
t Reduced temperature
w Weight concentration
x Mole fraction
Greek symbols
Universal function of reduced temperature
Parameter in Eq. (3) depends on refrigerant mole fraction
Dynamic viscosity, Pa s
Density, kg m-3
Time, s
Subscripts and superscripts
Pseudocritical property
B Ball
ROS Refrigerant oil solution
OIL Property of oil
R Property of the pure refrigerant
0 Coefficient in Eq. (3) depends on refrigerant mole fraction
Page 3
3
1. Introduction
Lately, ecological factors and ecological safety issues prevail over other requirements
laid for refrigerants. Heat pumps, refrigeration installations and air conditioners are retrofitted
by ozone-safe refrigerants with low global warming potential (GWP). Among such
refrigerants natural refrigerant R600a and halogen derivative refrigerant R245fa find wide
application [1–3]. The latter is regarded as the most prospective refrigerant for replacing
ozone depleting refrigerant R11.
Well known fact that the real working fluid in a vapor-compression refrigeration systems
represents a solution consisting of the refrigerant and the compressor oil admixtures. Thus,
the properties of refrigerant/oil solutions (ROS) should be used [4] when estimating an
efficiency of the compressor system or analyzing heat transfer processes in evaporator and
condenser.
The dependence of the viscosity for the ROS on the temperature and the concentration
has a complicated behaviour. However, the accurate experimental data for the viscosity of
the ROS still remains limited. It should be mentioned that the prediction methods for ROS
viscosity available in literature do not provide an appropriate level of accuracy [5]. Therefore,
the purpose of the present paper is to perform experimental study of the viscosity for the
solutions of widely used refrigerants and compressor oils.
2. Experimental section
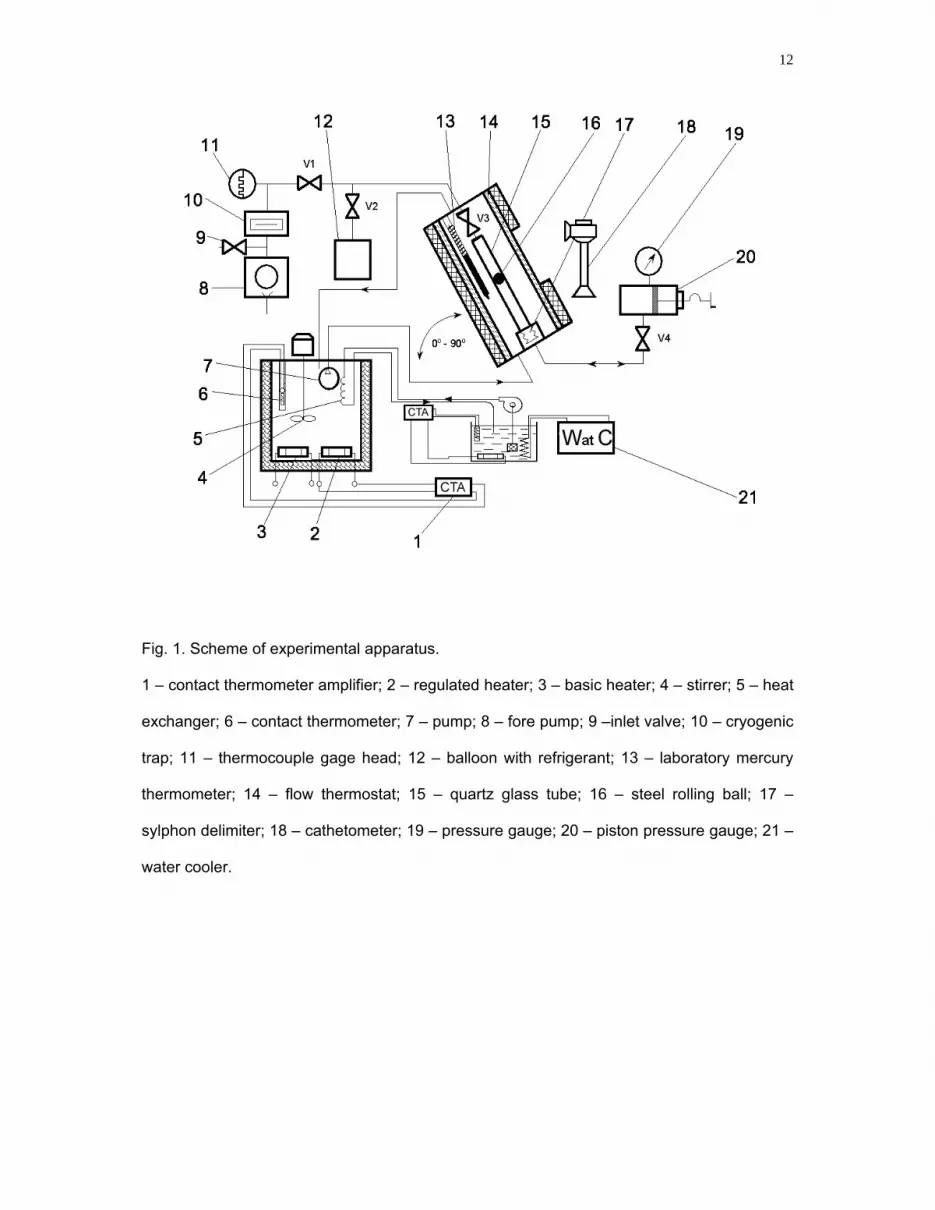
In order to study the viscosity of the ROS, an experimental apparatus was designed. A
schematic outline of the experimental setup is given in Fig. 1.
Fig. 1.
Page 4
4
The main element of the experimental setup is a measuring cell, which represents a
glass tube (15) filled up with a solution to be investigated and a small steel ball inside. (16).
There are two marks on the tube in order to register time taken by the ball passing a certain
distance. The measuring cell is placed inside flow thermostat (14). The auxiliary thermostat is
equipped with basic (3) and regulated (2) heaters, stirrer (4), pump (7) and heat exchanger
(5). Constant temperature in the auxiliary thermostat is kept up by automatic control system
which consists of contact thermometer (6), amplifier (1) and heater (2). During the process
of experiment the temperature was measured with the help of laboratory mercury expansion
thermometers (13) with scale factor of 0.1 K. The thermometers were placed in immediate
vicinity of the experimental cell.
The thermostat temperature stability has been estimated to be within ±0.05 К. The flow
thermostat is fixed at a slewing table which allows changing an angle of slope of the
measuring cell in order to provide measurements in a wide range of the viscosity values of
the investigated solutions. Cathetometer (18) is used for visual observations of the ball
movement.
Filling of the measuring cell with compressor oil is done with the help of an injector. The
quantity of refrigerant required for a given concentration of the solution is condensed in the
cell from a heated balloon (12). Afterwards, when valve V3 is closed the balloon is cooled by
liquid nitrogen in order to condense the vapour of the refrigerant, which has resided in
connecting pipes. Masses of solution components are determined using the results of
weighing of the injector and the balloon before and after filling. Weighing is provided with the
help of an analytical balance with an uncertainty of 5·10–7 kg.
The sylphon (17) performs a function of a separator between the investigating solution
and the oil of the piston pressure gauge (20). The latter is used for making, maintaining and
measuring the pressure of the investigated sample in the viscometer. In the given
experiments the pressure in the measuring cell was established in a value by 1–2 bar higher
Page 5
5
than the saturated vapor pressure of the investigated solution of the given concentration.
Thus, the possibility of vapor phase formation in the cell was avoided.
According to the results of the additional experiment, in the temperature range from 30
to 350 K the increase of pressure by 10 bar leads to negligibly small growth of viscosity in the
ROS liquid phase. Therefore, measurement the viscosity of the ROS may quite reasonably
be referred to the saturated liquid state.
Before experimental investigation of the viscosity for the ROS, calibration tests were
carried out in order to define values of the viscometer constant with different angles of the
measuring cell slope. In addition, the compressor oils, which were components of the
investigated ROS and were preliminarily measured on an Ubbelohde viscosimeter, and then
were used as reference fluids. The data for the viscosity of the compressor oils were
reported in [5].
The concentration of the liquid phase of the ROS is estimated by the following formula:
RR
R OIL
mw
m m
(1)
where Rm and OILm are the mass of refrigerant filled into the cell and that of oil
correspondingly. Relative uncertainty of determination of mass concentration does not
exceed 0.01–0.05 %.
In order to clean the investigated sample of water admixtures and permanent gases the
compressor oil was heated to T= 388 K and then vacuumized for 60 s. The cleaning
procedure was repeated several times. The purity of the compressor oils was checked by an
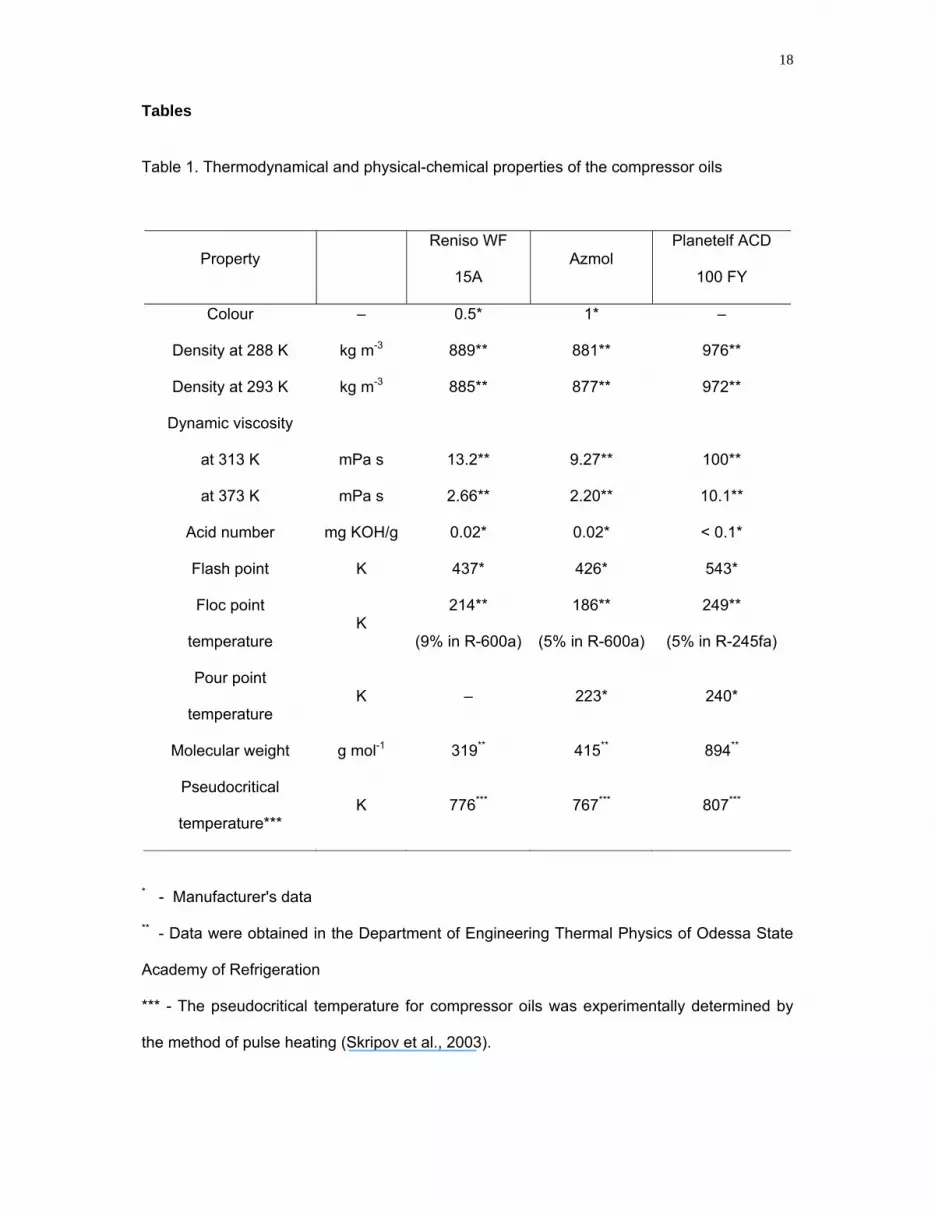
Abbe refractometer. Thermodynamic and physical-chemical properties of the compressor
oils are listed in Table 1.
Table 1.
Page 6
6
The compressor oil Azmol was manufactured by «Azmol» company (Ukraine).
Compressor oils Planetelf ACD 100FY and Reniso WF 15A were produced by «TOTAL
Lubricants» and «FUCHS» respectively. The purity of the R600a and R245fa was 99.8 wt.
% and 99.9 wt. %.
3. Calculation and discussion
In the framework of the rolling ball method which was used in the experiments, the
dynamic viscosity for the liquid phase of the ROS is calculated by the formula:
( )ROS B ROSC (2)
where C is the viscometer constant, B is the density of the material which the ball is made
of ( 7810B kg m-3), ROS is the density of the ROS in the saturated liquid phase (data for
the density of the ROS were taken from [6-8] ), is the time taken for the ball passing a
fixed distance between marks on the glass tube. The total uncertainty of the measurements
in viscosity in the experiment was estimated to be 1.5 to 4%. The experimental data are
listed in Table 2-4.
Table 2-4.
The experimental data for the viscosity of the ROS were described using the following
equation:
0
Rt x
R O S Rx t (3)
Page 7
7
where R O S is the dynamic viscosity of the ROS on a saturation line, 0 Rx is the
coefficient depended on mole fraction of the refrigerant, Rx is the parameter depended
mole fraction of the refrigerant, t is universal function of reduced temperature for the
refrigerants, 1 / Ct T T is the reduced temperature, CT is the pseudocritical temperature
of the ROS.
The pseudocritical temperature for the ROS in the concentration range 0.3 1Rw
can be calculated by method reported in [9], the pseudocritical temperature for the ROS in
concentration range 0 0.3Rw was calculated by method based on minimization of the
deviations for the experimental data obtained from calculated value by the Eq.(3). The
concentration dependence for the pseudocritical temperature of the ROS in the concentration
range 0 1Rw was fitted by Eq. (4).
0.52 3c R R RT a b x c x d x (4)
where a, b, c, and d are the coefficients. The values of the coefficients of the Eq.(4) are
listed in Table 5.
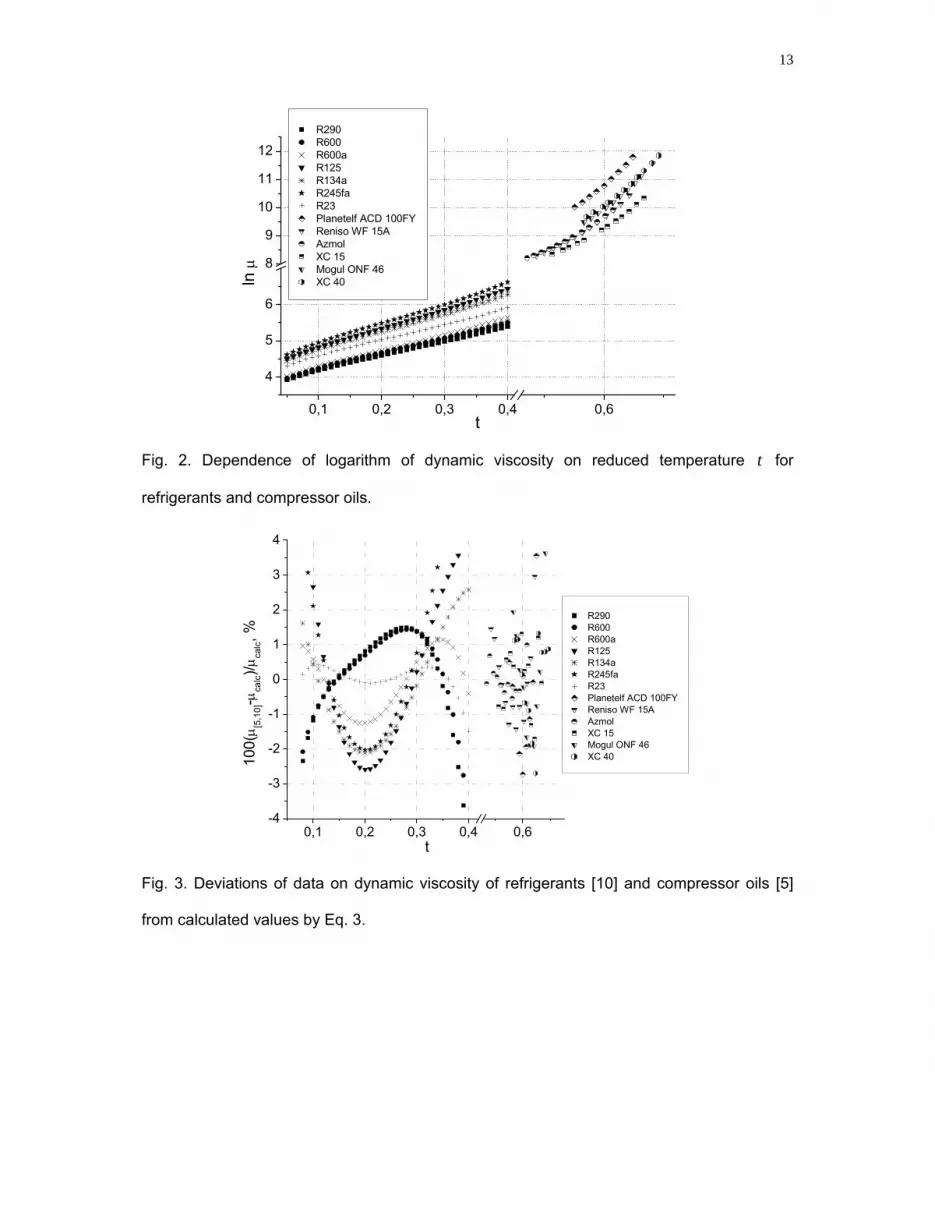
For determination the value for the universal function t the data for the dynamic
viscosity for different refrigerants [10] in the range 0.08 0.4t and data for the viscosity
of the compressor oils [5] in the range 0.4 0.65t were taken and then analyzed (as is
shown in Fig. 2 ).
Fig. 2.
Based on performed analysis the following universal dependence t was obtained:
2
2 3
0.61538 16.155 33.098
1 10.591 33.506 24.077
t tt
t t t
. (5)
Page 8
8
As a result of fitting of the experimental data on the dynamic viscosity in the liquid phase of
the ROS, the concentration dependence for the parameter 0 Rx can be determined as:
0 exp2
R RR 2
R R
a + cx + exx
1 + bx + dx
with 0 Rx 1 (6)
where a, b, c, and d are the coefficients. The values of the coefficients of the Eq.(4) are
listed in Table 5. The concentration dependences of coefficient Rx can be calculated by
the following equations:
for the ROS R600a/Azmol with 0 Rx 1
exp exp1.5R R R R Rx a+bx +cx +d x +e x (7)
for the ROS R600a/Reniso WF 15A with 0 Rx 1
exp1.5 2R R R R Rx a+bx +cx +dx +e x (8)
for the ROS R245fa/Planetelf ACD 100 FY with 0 Rx 1
3 0.5= expR R R R Rx a+bx +cx +d x +ex (9)
where a, b, c, d, e are coefficients listed in Table 5.
As is seen, the Eq.3 has only 2 coefficients. The both coefficients can be calculated
from the experimental data. Thus, Eq.(3) can be applied to prediction of the dynamic
viscosity of the refrigerants in the range 0.08 0.4Rw (scaling area) and for the
compressor oils in the range 0.4 0.65Rw . As is shown in Fig.3, the relative deviations of
the values for the dynamic viscosity for the refrigerants and the compressor oils [5, 10] from
data calculated by Eq.3 lie in the range from 1.5 to 3.7%.
Page 9
9
Fig. 3.
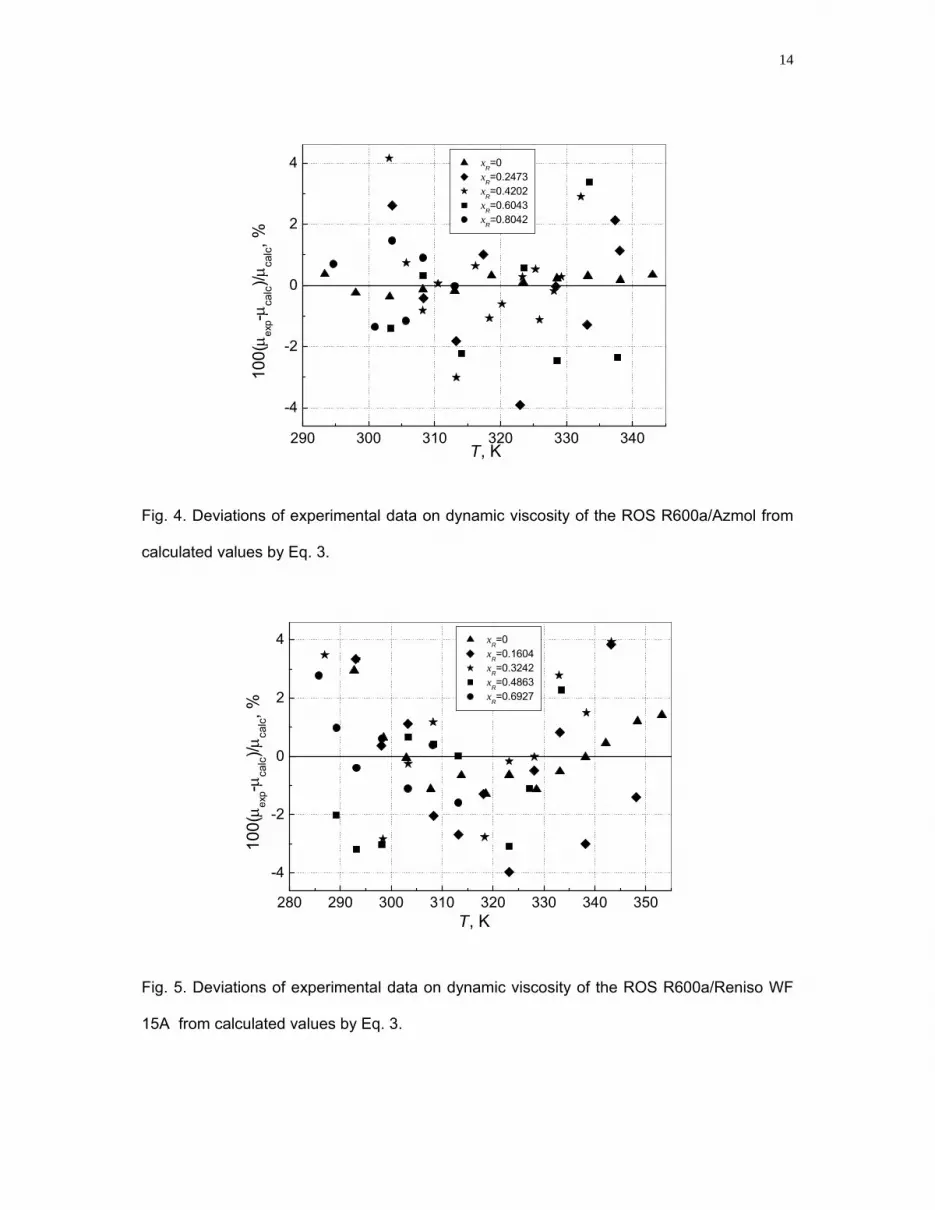
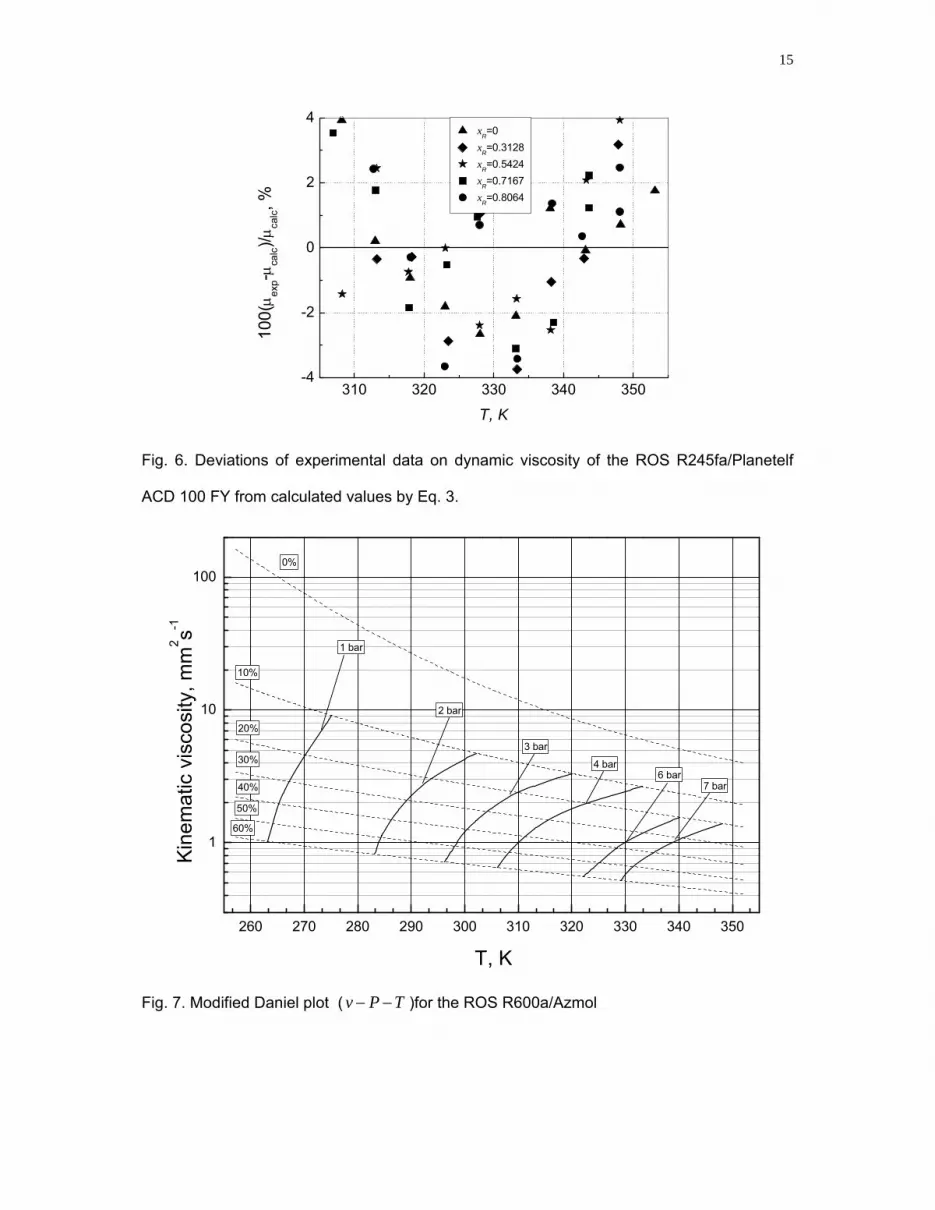
Deviations of the experimental data obtained from the values calculated by Eq.3 (see Figs. 4
-6) lie in the range from 1.5 to 4.5%.
Figs. 4-6.
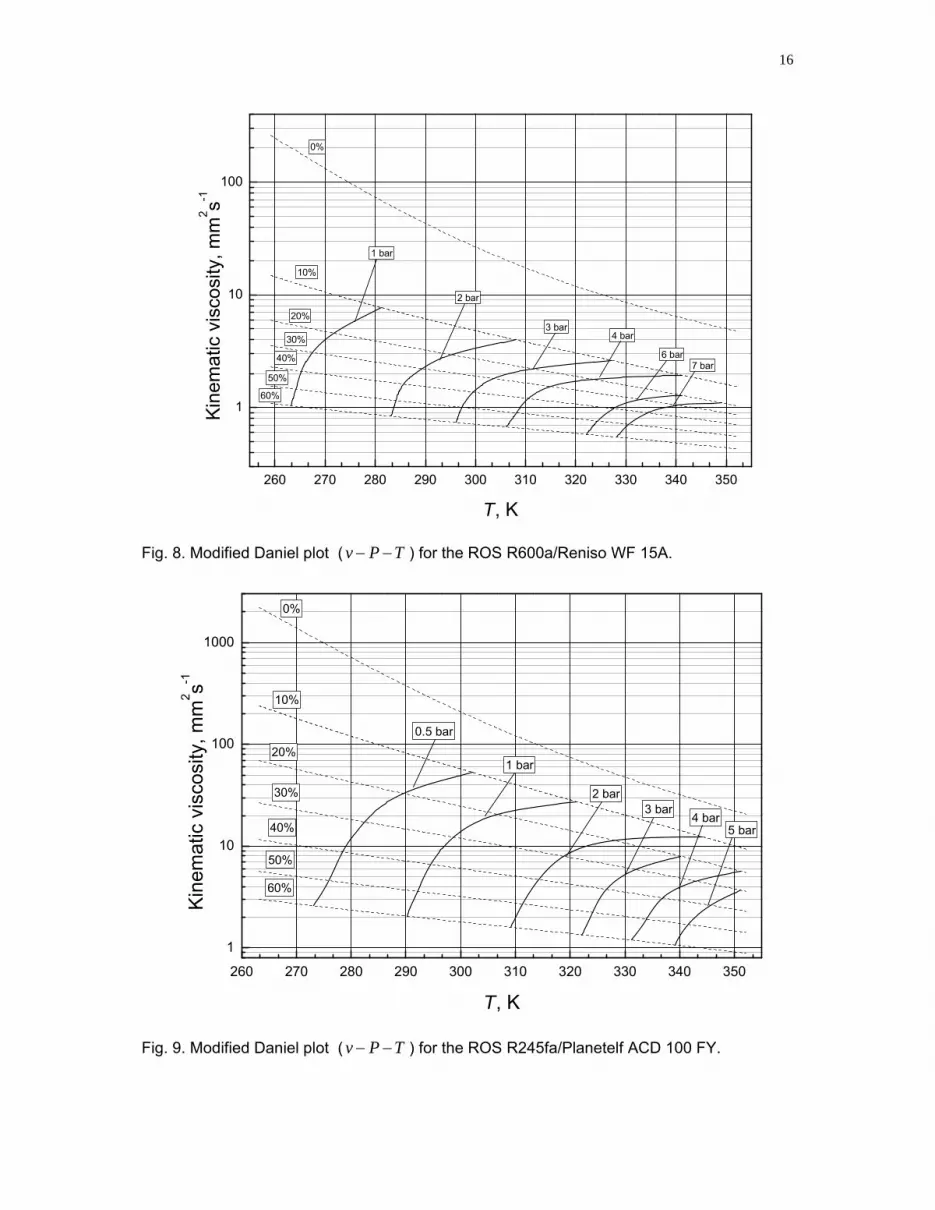
The modified Daniel plot [11] developed using Eqs.3-9 are presented on Figs.7-9
Figs. 7-9.
5. Conclusion
The new accurate experimental information on dynamic viscosity of the refrigerant
solution of R600a with compressor mineral oil Azmol, the refrigerant solution of R600a with
compressor mineral oil Reniso WF 15A and the solution of refrigerant R245fa with
polyolester oil Planetelf ACD 100 FY have been obtained. The simple correlation for
prediction the dynamic viscosity for the refrigerant/oil solutions in the wide range of
concentrationsand temperatures based on limited empirical information has been proposed.
As can be seen the experimental data for the ROS have been successfully described by the
correlation. The experimental data obtained can be applied when designing evaporators,
compressors, heat exchangers and other important parts of refrigeration systems.
Page 10
10
References
[1] Pearson F. Refrigerants past, present and future. In Proceedings 21st International
Congress of Refrigeration, IIR/IIF, 2003; Washington DC, USA. p. 1-12.
[2] Khlieva OYa, Kosoy BV, Stepanova VP, Zhelezny VP. The End and New the Beginning:
Alternative Refrigerants for the New Heat Pump Generation. Abstracts 5-th International
Conference “Problems of Industrial Heat Engineering”, May 22-27 2007; Kiev, Ukraine. p.
234-235.
[3] Kuijpers L. The impact of the Montreal and Kyoto protocol on new developments in
refrigeration and a/c. In Proceedings IIR conference "Emerging Trends in Refrigeration & Air-
conditioning", 1998; New Delhi, India. p. 1-14.
[4] Meltzer LZ. Lubricants for freon refrigerating machines, Moscow: Pischevaya
promishlennost, 1969. p.121-158 (in Russian).
[5] Zhelezny VP, Sechenyh VV, Semenyuk YV, Ancherbak SN, Tsvetkov ON. Experimental
investigation of thermophysical properties of compressor oils: Mogul ONF 46, Planetelf ACD
100 FY, Azmol, Lunaria FR 32, XC 15, XC 40. Bulletin of the International Academy of
Refrigeration. 2007; 2; 23-30. (in Russian).
[6] Zhelezny PV, Procenko DA, Zhelezny VP, Ancherbak SN. An experimental investigation
and modelling of the thermodynamic properties of isobutane-compressor oil solutions: Some
aspects of experimental methodology. Int J Refrigeration 2007; 30; 433-445.
[7] Zhelezny VP, Semenyuk YuV, Ancherbak SN, Grebenkov AJ, Beliayeva OV. An
Experimental investigation and modeling of the solubility, density and surface tension of
1,1,1,3,3,- pentafluoropropane (R245fa)/ synthetic polyolester compressor oil solutions. J
Fluor Chemistry 2007; 128; 1029-1038.
[8] Nichenko SV; Semenyuk YuV, Zhelezny VP; Density and surface tension for the solution
R600a/Reniso WF 15. Refrigeration Eng Technology. 2008, in press (in Russian).
[9] Zhelezny PV, Zhelezny VP, Skripov PV. Determination of the pseudocritical parameters
for refrigerant/oil solutions. Fluid Phase Equilib 2003; 212; 285-302.
Page 11
11
[10] McLinden MO, Klein SA, Lemmon EW and Peskin APG, 2003, NIST Standard
Reference Database 23, NIST Thermodynamic Properties of Refrigerants and Refrigerants
Mixtures Database (REFPROP), Version 7.1 (Gaithersburg: National Institute of Standard
and Technology).
[11] Daniel G, Anderson M, Schmidt W, Tokumitsu M. Performance of selected synthetic
lubricants in industrial heat pumps. Heat Recov Systems 1982; 2; 359-368.
[12] Skripov PV, Starostin AA, Volosnikov DV, Zhelezny VP. Comparison of thermophysical
properties for oil/refrigerant mixtures by use the pulse heating method, Int J Refrigeration
2003; 26; 721-728.
Page 12
12
Fig. 1. Scheme of experimental apparatus.
1 – contact thermometer amplifier; 2 – regulated heater; 3 – basic heater; 4 – stirrer; 5 – heat
exchanger; 6 – contact thermometer; 7 – pump; 8 – fore pump; 9 –inlet valve; 10 – cryogenic
trap; 11 – thermocouple gage head; 12 – balloon with refrigerant; 13 – laboratory mercury
thermometer; 14 – flow thermostat; 15 – quartz glass tube; 16 – steel rolling ball; 17 –
sylphon delimiter; 18 – cathetometer; 19 – pressure gauge; 20 – piston pressure gauge; 21 –
water cooler.
Page 13
13
0,1 0,2 0,3 0,4 0,6
4
5
6
8
9
10
11
12
ln
t
R290 R600 R600a R125 R134a R245fa R23 Planetelf ACD 100FY Reniso WF 15A Azmol XC 15 Mogul ONF 46 XC 40
Fig. 2. Dependence of logarithm of dynamic viscosity on reduced temperature t for
refrigerants and compressor oils.
0,1 0,2 0,3 0,4 0,6-4
-3
-2
-1
0
1
2
3
4
100( [5
,10
]-ca
lc)/ ca
lc,
%
t
R290 R600 R600a R125 R134a R245fa R23 Planetelf ACD 100FY Reniso WF 15A Azmol XC 15 Mogul ONF 46 XC 40
Fig. 3. Deviations of data on dynamic viscosity of refrigerants [10] and compressor oils [5]
from calculated values by Eq. 3.
Page 14
14
290 300 310 320 330 340
-4
-2
0
2
4
100( e
xp-
calc)/ ca
lc, %
T, K
xR=0
xR=0.2473
xR=0.4202
xR=0.6043
xR=0.8042
Fig. 4. Deviations of experimental data on dynamic viscosity of the ROS R600a/Azmol from
calculated values by Eq. 3.
280 290 300 310 320 330 340 350
-4
-2
0
2
4
100( e
xp-
calc)/ ca
lc, %
T, K
xR=0
xR=0.1604
xR=0.3242
xR=0.4863
xR=0.6927
Fig. 5. Deviations of experimental data on dynamic viscosity of the ROS R600a/Reniso WF
15A from calculated values by Eq. 3.
Page 15
15
310 320 330 340 350-4
-2
0
2
4
100( ex
p-
calc)/ ca
lc, %
T, K
xR=0
xR=0.3128
xR=0.5424
xR=0.7167
xR=0.8064
Fig. 6. Deviations of experimental data on dynamic viscosity of the ROS R245fa/Planetelf
ACD 100 FY from calculated values by Eq. 3.
260 270 280 290 300 310 320 330 340 350
1
10
100
7 bar6 bar
4 bar
3 bar
2 bar
1 bar
60%
50%
40%
30%
20%
10%
Kin
emat
ic v
isco
sity
, mm
2 s-1
T, K
0%
Fig. 7. Modified Daniel plot ( v P T )for the ROS R600a/Azmol
Page 16
16
260 270 280 290 300 310 320 330 340 350
1
10
100
7 bar6 bar
4 bar3 bar
2 bar
1 bar
60%
50%
40%
30%
20%
10%
Kin
emat
ic v
isco
sity
, mm
2 s-1
T, K
0%
Fig. 8. Modified Daniel plot ( v P T ) for the ROS R600a/Reniso WF 15A.
260 270 280 290 300 310 320 330 340 350
1
10
100
1000
5 bar4 bar
3 bar2 bar
1 bar
0.5 bar
60%
50%
40%
30%
20%
10%
Kin
emat
ic v
isco
sity
, mm
2 s-1
T, K
0%
Fig. 9. Modified Daniel plot ( v P T ) for the ROS R245fa/Planetelf ACD 100 FY.
Page 17
17
Figure Captions:
Fig. 1. Scheme of experimental apparatus for study of ROS viscosity.
1 – contact thermometer amplifier; 2 – regulated heater; 3 – basic heater; 4 – stirrer; 5 – heat
exchanger; 6 – contact thermometer; 7 – pump; 8 – fore pump; 9 –inlet valve; 10 – cryogenic
trap; 11 – thermocouple gage head; 12 – balloon with refrigerant; 13 – laboratory mercury
thermometer; 14 – flow thermostat; 15 – quartz glass tube; 16 – steel rolling ball; 17 –
sylphon delimiter; 18 – cathetometer; 19 – standard pressure gage; 20 – piston pressure
gauge; 21 – water cooler.
Fig. 2. Dependence of logarithm of dynamic viscosity on reduced temperature t for
refrigerants and compressor oils.
Fig. 3. Deviations of data on dynamic viscosity of refrigerants [10] and compressor oils [5]
from calculated values by Eq. 3.
Fig. 4. Deviations of experimental data on dynamic viscosity of the ROS R600a/Azmol from
calculated values by Eq. 3.
Fig. 5. Deviations of experimental data on dynamic viscosity of the ROS R600a/Reniso WF
15A from calculated values by Eq. 3.
Fig. 6. Deviations of experimental data on dynamic viscosity of the ROS R245fa/Planetelf
ACD 100 FY from calculated values by Eq. 3.
Fig. 7. Modified Daniel plot ( v P T ) for the ROS R600a/Azmol
Fig. 8. Modified Daniel plot ( v P T ) for the ROS R600a/Reniso WF 15A.
Fig. 9. Modified Daniel plot ( v P T ) for the ROS R245fa/Planetelf ACD 100 FY.
Page 18
18
Tables
Table 1. Thermodynamical and physical-chemical properties of the compressor oils
Property Reniso WF
15A Azmol
Planetelf ACD
100 FY
Colour – 0.5* 1* –
Density at 288 K kg m-3 889** 881** 976**
Density at 293 K kg m-3 885** 877** 972**
Dynamic viscosity
at 313 K
at 373 K
mPa s
mPa s
13.2**
2.66**
9.27**
2.20**
100**
10.1**
Acid number mg KOH/g 0.02* 0.02* < 0.1*
Flash point K 437* 426* 543*
Floc point
temperature K
214**
(9% in R-600а)
186**
(5% in R-600а)
249**
(5% in R-245fa)
Pour point
temperature K – 223* 240*
Molecular weight g mol-1 319** 415** 894**
Pseudocritical
temperature*** K 776*** 767*** 807***
* - Manufacturer's data
** - Data were obtained in the Department of Engineering Thermal Physics of Odessa State
Academy of Refrigeration
*** - The pseudocritical temperature for compressor oils was experimentally determined by
the method of pulse heating (Skripov et al., 2003).
Page 19
19
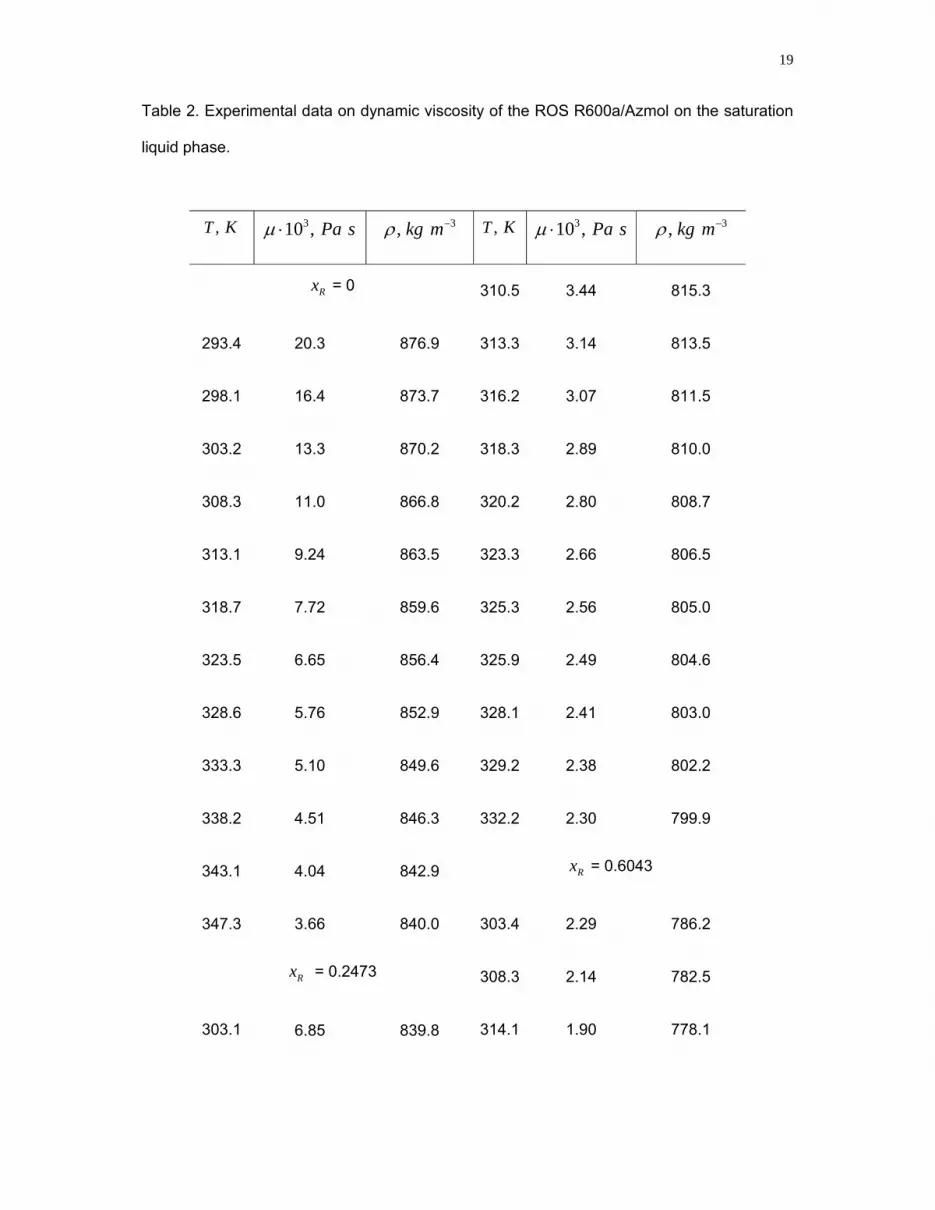
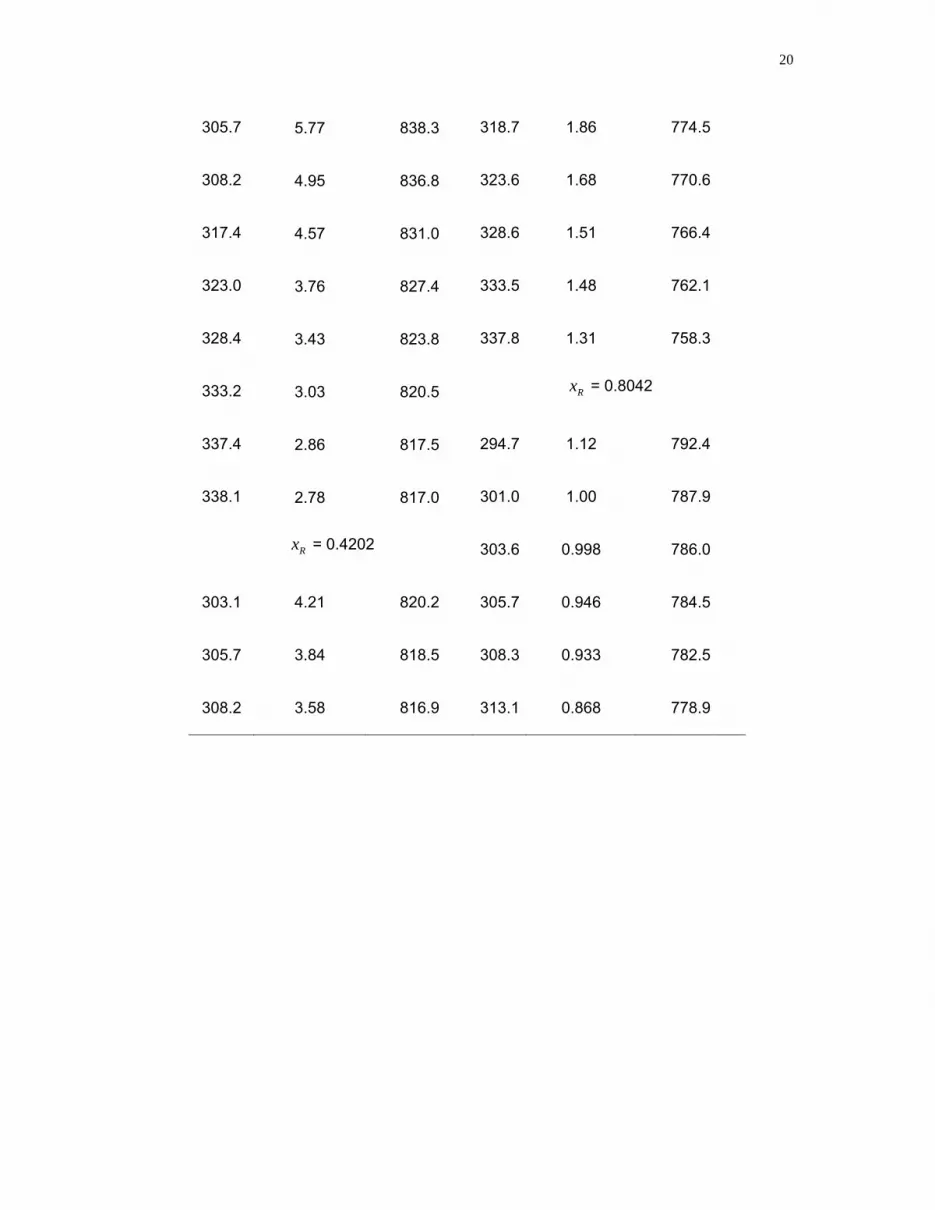
Table 2. Experimental data on dynamic viscosity of the ROS R600a/Azmol on the saturation
liquid phase.
,T K 310 , Pa s , kg 3m ,T K 310 , Pa s , kg 3m
Rx = 0 310.5 3.44 815.3
293.4 20.3 876.9 313.3 3.14 813.5
298.1 16.4 873.7 316.2 3.07 811.5
303.2 13.3 870.2 318.3 2.89 810.0
308.3 11.0 866.8 320.2 2.80 808.7
313.1 9.24 863.5 323.3 2.66 806.5
318.7 7.72 859.6 325.3 2.56 805.0
323.5 6.65 856.4 325.9 2.49 804.6
328.6 5.76 852.9 328.1 2.41 803.0
333.3 5.10 849.6 329.2 2.38 802.2
338.2 4.51 846.3 332.2 2.30 799.9
343.1 4.04 842.9 Rx = 0.6043
347.3 3.66 840.0 303.4 2.29 786.2
Rx = 0.2473 308.3 2.14 782.5
303.1 6.85 839.8 314.1 1.90 778.1
Page 20
20
305.7 5.77 838.3 318.7 1.86 774.5
308.2 4.95 836.8 323.6 1.68 770.6
317.4 4.57 831.0 328.6 1.51 766.4
323.0 3.76 827.4 333.5 1.48 762.1
328.4 3.43 823.8 337.8 1.31 758.3
333.2 3.03 820.5 Rx = 0.8042
337.4 2.86 817.5 294.7 1.12 792.4
338.1 2.78 817.0 301.0 1.00 787.9
Rx = 0.4202 303.6 0.998 786.0
303.1 4.21 820.2 305.7 0.946 784.5
305.7 3.84 818.5 308.3 0.933 782.5
308.2 3.58 816.9 313.1 0.868 778.9
Page 21
21
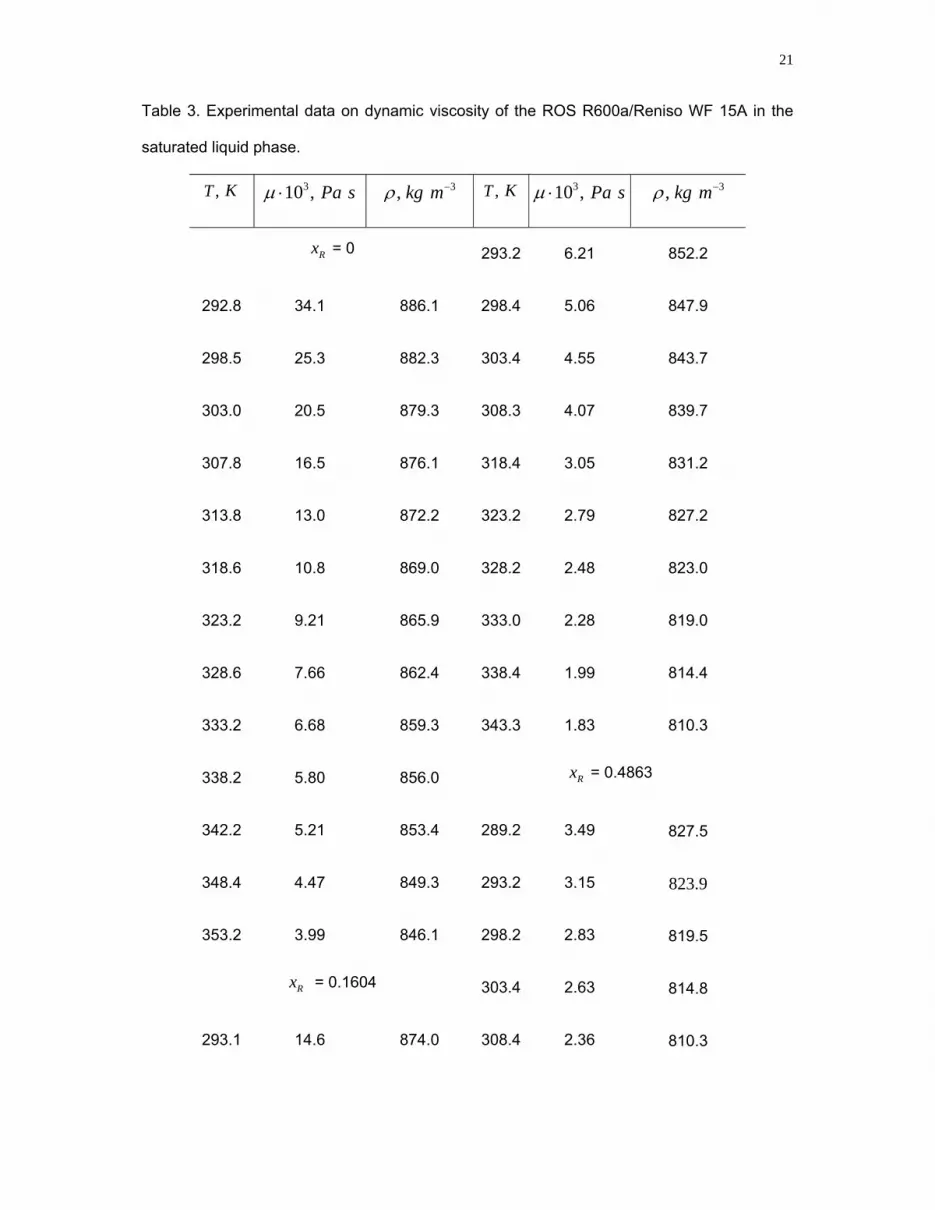
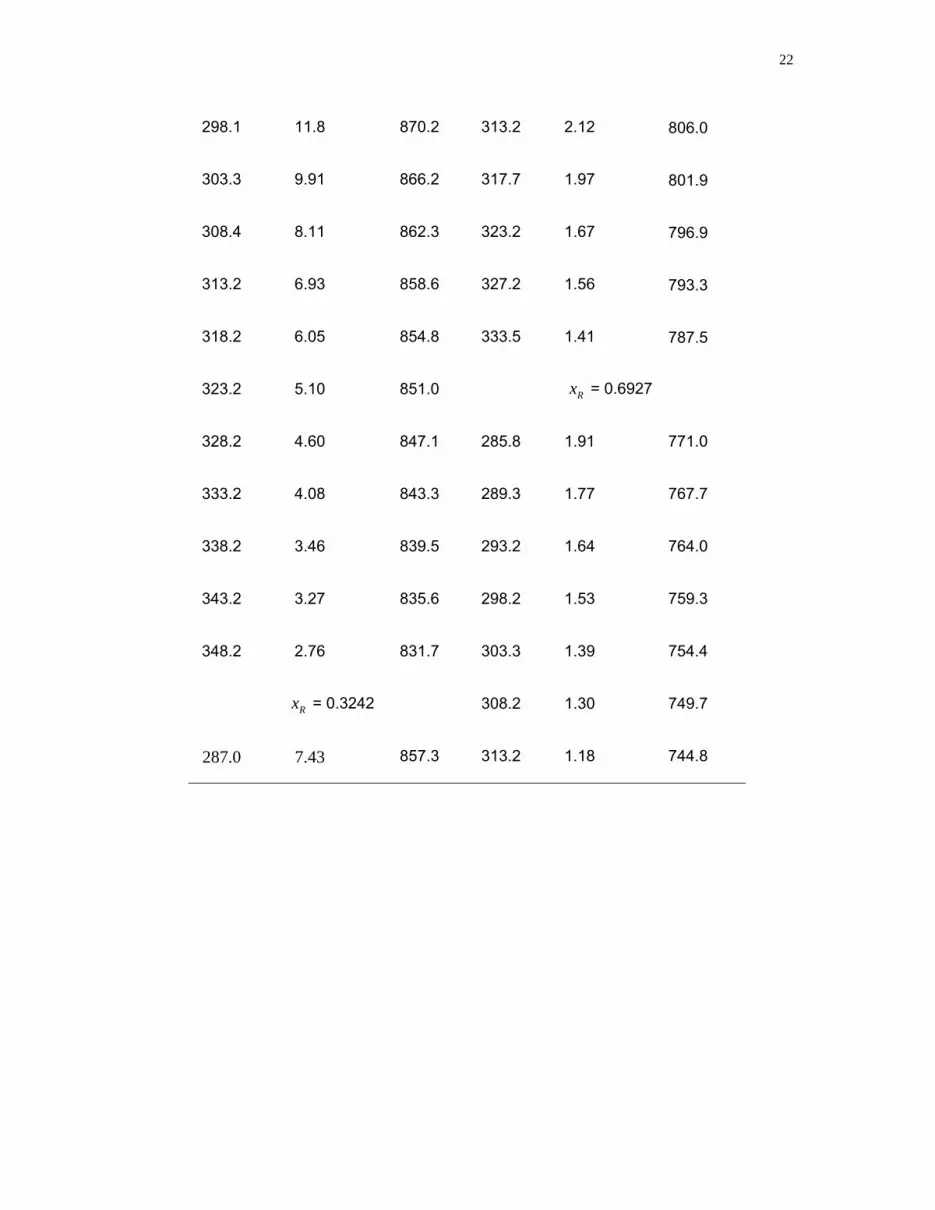
Table 3. Experimental data on dynamic viscosity of the ROS R600a/Reniso WF 15A in the
saturated liquid phase.
,T K 310 , Pa s , kg 3m ,T K 310 , Pa s , kg 3m
Rx = 0 293.2 6.21 852.2
292.8 34.1 886.1 298.4 5.06 847.9
298.5 25.3 882.3 303.4 4.55 843.7
303.0 20.5 879.3 308.3 4.07 839.7
307.8 16.5 876.1 318.4 3.05 831.2
313.8 13.0 872.2 323.2 2.79 827.2
318.6 10.8 869.0 328.2 2.48 823.0
323.2 9.21 865.9 333.0 2.28 819.0
328.6 7.66 862.4 338.4 1.99 814.4
333.2 6.68 859.3 343.3 1.83 810.3
338.2 5.80 856.0 Rx = 0.4863
342.2 5.21 853.4 289.2 3.49 827.5
348.4 4.47 849.3 293.2 3.15 823.9
353.2 3.99 846.1 298.2 2.83 819.5
Rx = 0.1604 303.4 2.63 814.8
293.1 14.6 874.0 308.4 2.36 810.3
Page 22
22
298.1 11.8 870.2 313.2 2.12 806.0
303.3 9.91 866.2 317.7 1.97 801.9
308.4 8.11 862.3 323.2 1.67 796.9
313.2 6.93 858.6 327.2 1.56 793.3
318.2 6.05 854.8 333.5 1.41 787.5
323.2 5.10 851.0 Rx = 0.6927
328.2 4.60 847.1 285.8 1.91 771.0
333.2 4.08 843.3 289.3 1.77 767.7
338.2 3.46 839.5 293.2 1.64 764.0
343.2 3.27 835.6 298.2 1.53 759.3
348.2 2.76 831.7 303.3 1.39 754.4
Rx = 0.3242 308.2 1.30 749.7
287.0 7.43 857.3 313.2 1.18 744.8
Page 23
23
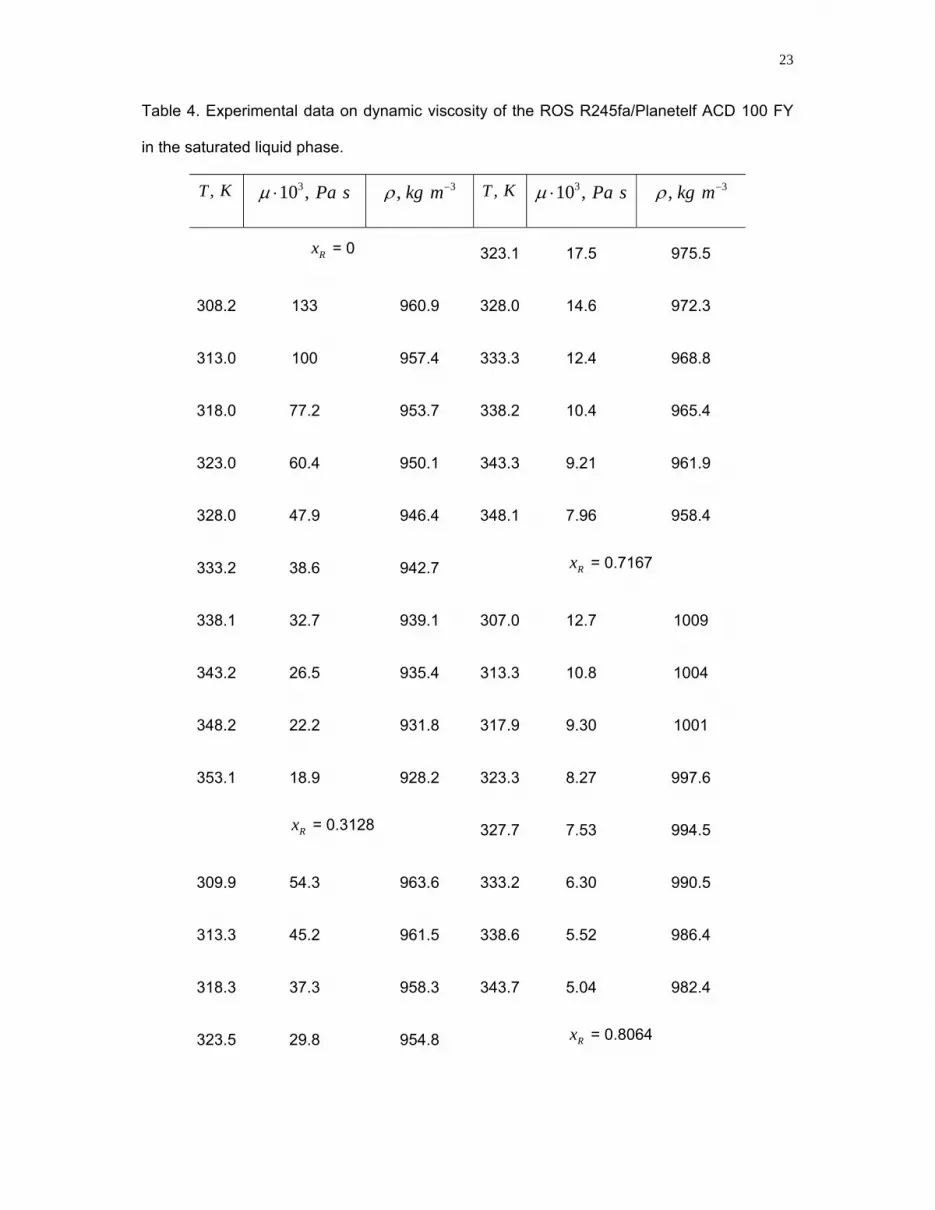
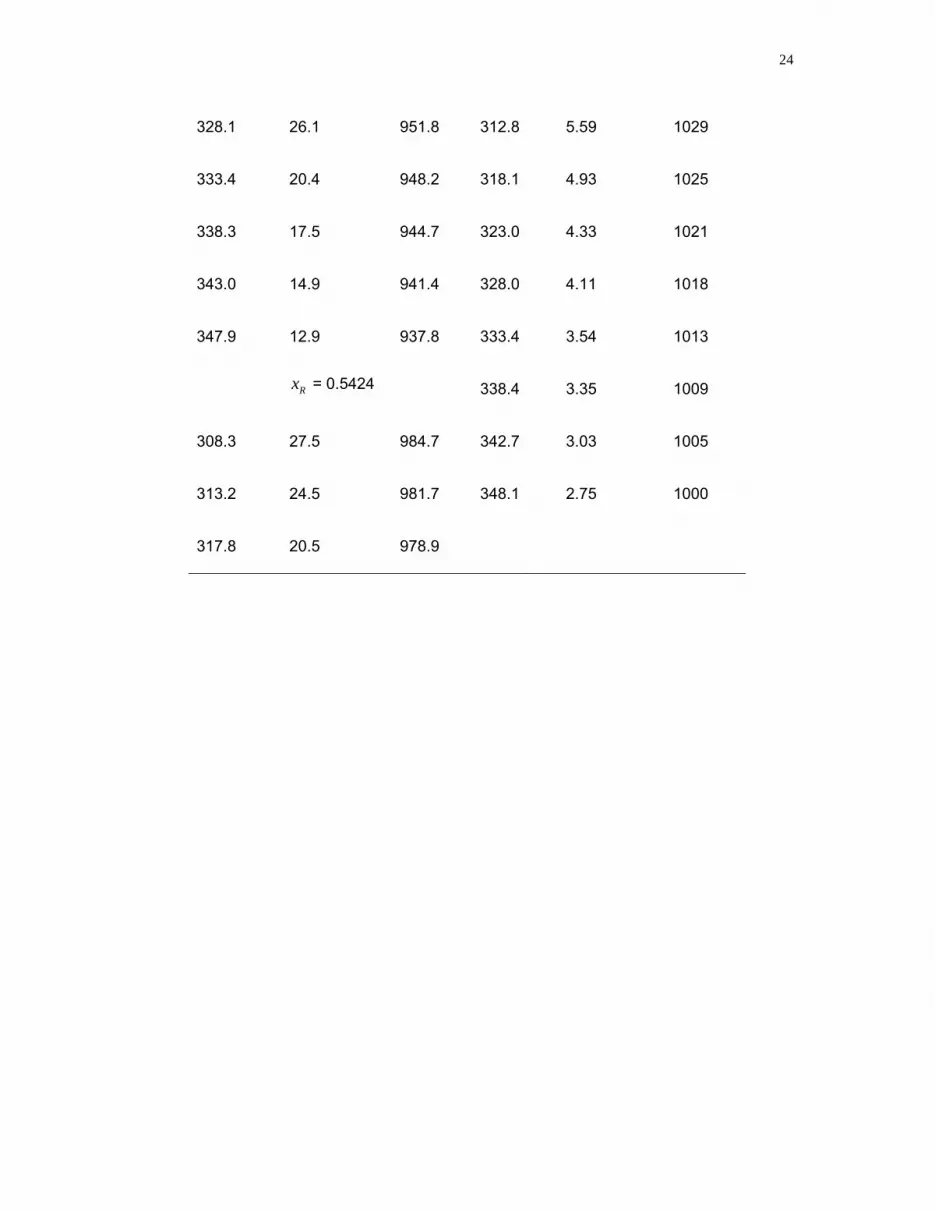
Table 4. Experimental data on dynamic viscosity of the ROS R245fa/Planetelf ACD 100 FY
in the saturated liquid phase.
,T K 310 , Pa s , kg 3m ,T K 310 , Pa s , kg 3m
Rx = 0 323.1 17.5 975.5
308.2 133 960.9 328.0 14.6 972.3
313.0 100 957.4 333.3 12.4 968.8
318.0 77.2 953.7 338.2 10.4 965.4
323.0 60.4 950.1 343.3 9.21 961.9
328.0 47.9 946.4 348.1 7.96 958.4
333.2 38.6 942.7 Rx = 0.7167
338.1 32.7 939.1 307.0 12.7 1009
343.2 26.5 935.4 313.3 10.8 1004
348.2 22.2 931.8 317.9 9.30 1001
353.1 18.9 928.2 323.3 8.27 997.6
Rx = 0.3128 327.7 7.53 994.5
309.9 54.3 963.6 333.2 6.30 990.5
313.3 45.2 961.5 338.6 5.52 986.4
318.3 37.3 958.3 343.7 5.04 982.4
323.5 29.8 954.8 Rx = 0.8064
Page 24
24
328.1 26.1 951.8 312.8 5.59 1029
333.4 20.4 948.2 318.1 4.93 1025
338.3 17.5 944.7 323.0 4.33 1021
343.0 14.9 941.4 328.0 4.11 1018
347.9 12.9 937.8 333.4 3.54 1013
Rx = 0.5424 338.4 3.35 1009
308.3 27.5 984.7 342.7 3.03 1005
313.2 24.5 981.7 348.1 2.75 1000
317.8 20.5 978.9
Page 25
25
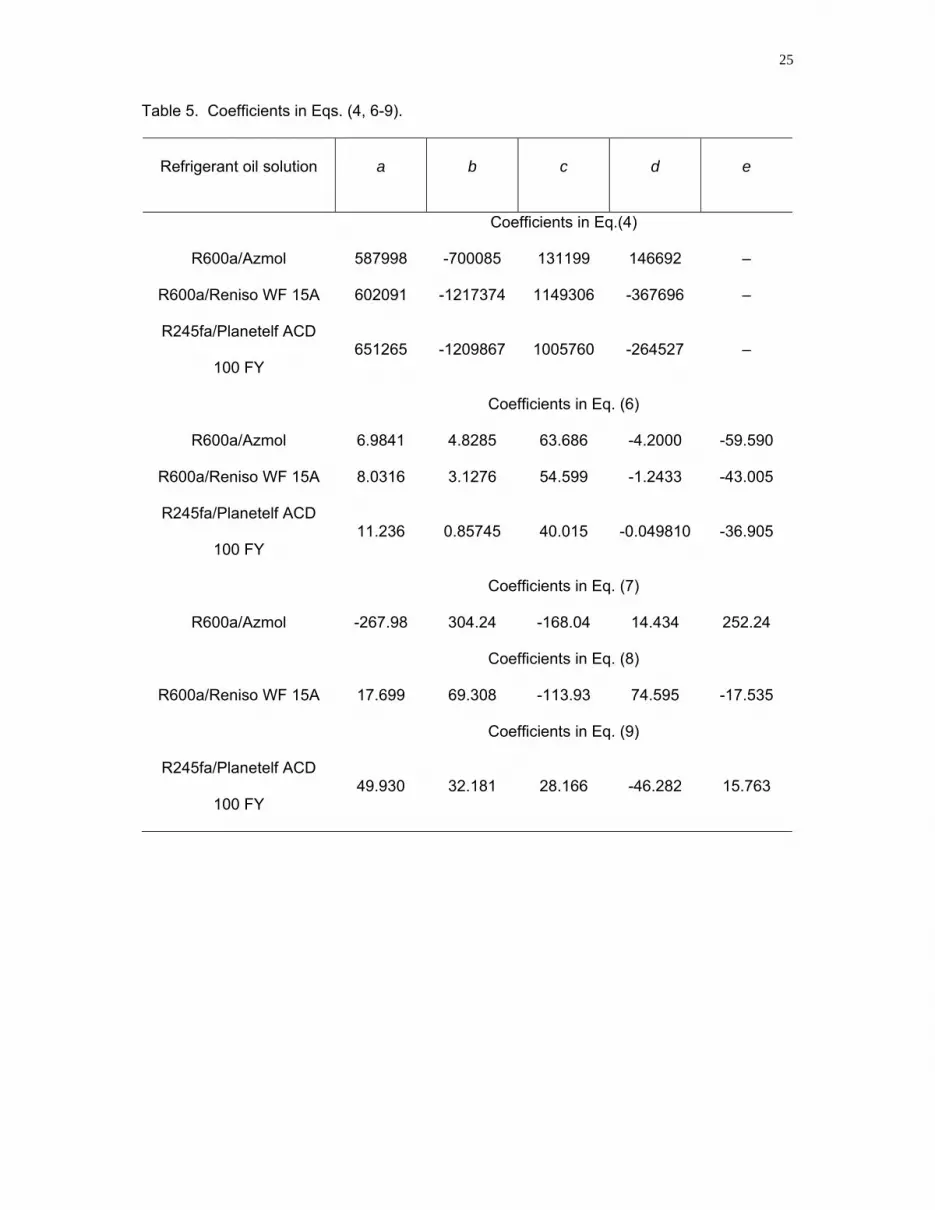
Table 5. Coefficients in Eqs. (4, 6-9).
Refrigerant oil solution a b c d e
Сoefficients in Eq.(4)
R600a/Azmol 587998 -700085 131199 146692 –
R600a/Reniso WF 15A 602091 -1217374 1149306 -367696 –
R245fa/Planetelf ACD
100 FY 651265 -1209867 1005760 -264527 –
Сoefficients in Eq. (6)
R600a/Azmol 6.9841 4.8285 63.686 -4.2000 -59.590
R600a/Reniso WF 15A 8.0316 3.1276 54.599 -1.2433 -43.005
R245fa/Planetelf ACD
100 FY 11.236 0.85745 40.015 -0.049810 -36.905
Сoefficients in Eq. (7)
R600a/Azmol -267.98 304.24 -168.04 14.434 252.24
Сoefficients in Eq. (8)
R600a/Reniso WF 15A 17.699 69.308 -113.93 74.595 -17.535
Сoefficients in Eq. (9)
R245fa/Planetelf ACD
100 FY 49.930 32.181 28.166 -46.282 15.763