Emulsions are dispersions of two immiscible liquids such as oil and water which findapplication in a wide range of industries including chemical engineering, food process-ing, pharmaceutical manufacturing, and enhanced oil recovery. In order to increase theirstability, a small amount of surfactant~emulsifier! is added to the continuous phase. If thesurfactant concentration is above the critical micelle concentration~CMC!, surfactantaggregates, or micelles, form. Emulsions with an excess amount of surfactant can there-fore be regarded as a dispersion of large, micron sized, fluid droplets surrounded by acontinuous phase with small~nanometer sized! micelles. Aronson~1989! studied unstableemulsion systems and concluded that the flocculation and creaming observed could becaused by micelle depletion effects in the gap between two emulsion droplets. This isanalogous to the effect of nonadsorbed polymers on colloid stability@Asakura andOosawa~1958!#. Aronson then showed that the associated free energies are in excess ofseveral kT. This idea of micelle depletion induced creaming was used by Bibette~1991!to separate emulsions by drop size, resulting in nearly monodisperse emulsions. Othersurfactant induced effects were observed by Pal~1993! who explained the observedviscosity changes by surfactant-induced inhibition of internal circulation. The same au-thor studied the depletion effect caused by polymer additives on the viscosity of emul-sions@Pal ~1992, 1993!#. This article however is, to the best of our knowledge, the firstfirst detailed study in which micelle-induced depletion forces are used to scale the emul-sion viscosity.
a!Author to whom all correspondence should be addressed; electronic mail: [email protected]
The purpose of this article is twofold. First, we will introduce a new scaling parameterbased on micelle depletion interaction and show that this parameter is capable of explain-ing previously observed dependencies of the surfactant concentration, droplet radius, andsolvent viscosity. The second purpose is to provide a simple empirical model for theemulsion viscosity. This model may prove useful both as a reference for future viscositymeasurements and as a tool for the design of processing equipment.
II. PREVIOUS WORK
Although many viscosity studies of all kinds of emulsions are reported in literature,only a small minority of them actually deals with a search for a physical [email protected]., Otsubo and Prud’homme~1994a!; Pal ~1997!; Princen and Kiss~1989!#. There isgeneral agreement in the literature that the shape of the viscosity curves is similar tothose of suspensions of solid particles: a shear rate independent viscosity at low shearrates~if yield stress is absent!, a shear thinning region, and a high shear plateau. Thisbehavior is captured with the modified Cross equation:
hr 5 hr,`~w,l!1hr,0~w,l!2h r ,`~w,l!
11~k8g !m 1ty
hsg, ~1!
where the relative viscosityh r 5 h/hs is the ratio between the emulsion viscosity andthe solvent viscosity,w stands for the dispersed phase volume fraction, andl5 hd /hs is the ratio between the viscosity of the dispersed phase and the solvent. The
subscripts ‘‘ ’’ and ‘‘0’’ refer to the high shear and low shear plateaus, respectively. Thecoefficientm in the second term corresponds to the slope of the viscosity curve in theshear thinning region and it is usually close to 0.8. The yield stress term@the last term inEq. ~1!# will be discussed later. The onset of shear thinning is determined by the value ofk8 and it is this parameter which is of physical interest for understanding of the shearthinning region. Sincek8g is dimensionless, the parameterk8 has the dimension of timeand must be a combination of system variables like the droplet radiusa, the solventviscosityhs , the densityrs , and surfactant properties like the interfacial tensions. It isevident that the disruptive force is due to viscous friction but the origin of the cohesiveforce is not yet clear.
For a suspension of hard colloidal particles~with radiusa , 1 mm! it turned out thatthe competition between the Brownian and hydrodynamic forces determines the flowbehavior. Krieger~1972! showed that the Peclet numberPe 5 hsga3/kT was the ap-propriate scaling parameter for the viscosity. For larger particles like emulsion droplets(a ; 10mm) the Brownian force becomes negligibly small and a different explanationfor the flow behavior is needed. A natural choice for a dimensionless parameter in emul-sions is the ratio between the viscous force and interfacial tension force, known as thecapillary number:Ca 5 hsga/s. This scaling parameter is used for modeling the vis-cosity of foams@or highly concentrated emulsions, Princen and Kiss~1989!; Reinelt andKraynik ~1989!# and in simulations of emulsion flow@see e.g., Loewenberg and Hinch~1996!#. The problem is that all experiments on emulsions show scaling proportional to; ga2 @Pal ~1996, 1997!; Otsubo and Prud’homme~1992, 1994a, 1994b!#, which does
not match that of the capillary number (; ga) nor that of the Peclet number( ; ga3). Otsubo and Prud’homme~1992, 1994a, 1994b! performed an extensive set ofmeasurements on systems in which they systematically varied the dispersed phase vol-ume fraction~between 10% and 90%!, the average drop radius~between 4.5 and 12mm!,and the solvent viscosity~between 2.65 and 660 mPa s!. In all cases they found thatscaling of ; ga2 ~or ; ga2/s as they claim! caused individual viscosity curves to
overlap. Pal~1996! showed thatga2 scaling holds even if the drop size varies by morethan an order of magnitude. In an attempt to explain his results he proposed the particleReynolds number as the only possible dimensionless number with the requiredga2
scaling:Rep 5 rsga2/hs , which is the ratio between inertia and viscous forces. Theproblem here is that at the onset of shear thinning the inertia force is typically six ordersof magnitude smaller than the viscous force@cf. Pal ~1997!# and is thus not likely to bethe true scaling parameter. Note that theRep number scalesinverselyproportional to thesolvent viscosity while the other dimensionless numbers scale ashsg. Unfortunately nostudies are available in which the solvent viscosity was changed systematically whilekeeping all other parameters~including the viscosity ratio! constant.
III. NEW SCALING HYPOTHESIS
In the following we will propose a new and completely different physical explanationfor viscosity scaling. In our view the attractive force between the relatively large fluiddroplets is due to depletion effects caused by the much smaller surfactant molecules andmicelles. According to Asakura and Oosawa theory~1958! the depletion energy in thelimit of a/am Þ 1 is given asEdepl >
32kTfma/am where am and fm stand for the
micelle ~or coiled surfactant! radius and volume fraction, respectively. The viscous en-ergy needed to overcome this attraction energy is given by the viscous friction forcemultiplied by the distance over which the force must be applied to ensure breakage. Inshear flows this distance scales proportionally toa, thus Evisc 5 6phsga3. This thenresults in a new dimensionless number which will be referred to as the depletion flownumber,
Fld 54phsga2am
kTfm. ~2!
The new scaling parameter should apply in the region where Brownian forces are small~this condition is usually fulfilled for emulsions with drop sizes above 1mm! and wherethe dispersed phase fraction is below the close packing limit~about 0.70!. Above thislimit the droplets are deformed and different scaling behavior is expected. In this articlewe will focus on emulsions in which the surfactant is present in the form of micelles. Itis, however, also of interest to consider the depletion flow number during micelle forma-tion. Below the CMC surfactant molecules are present as coiled molecules with dimen-sions of 1 nm typically. During micelle formation about 100 of these molecules form asingle micelle with a radius of, say, 3 nm. The scaling parameterFl d which is propor-tional to the ratioam /fm will thus increase by a factor of 10 during micelle formation~assuming that all surfactant molecules convert into micelles!. This means that just belowthe CMC depletion effects are even stronger and may lead to unexpected aggregationeffects.
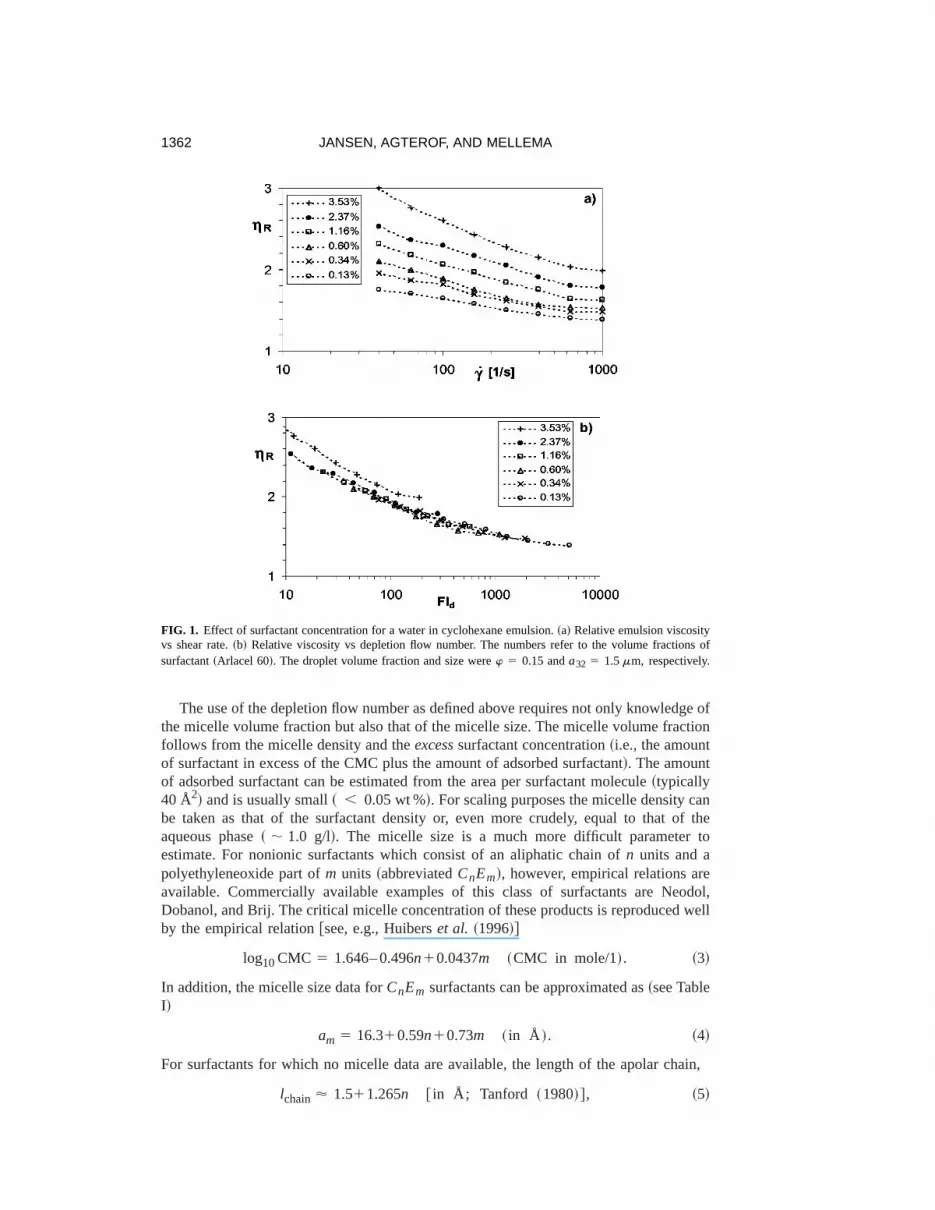
The depletion flow number just introduced has thehsga2 scaling observed in theexperiments and predicts a shift of the viscosity curves towards lower shear rates if themicelle concentration increases or the micelle size decreases. Such surfactant concentra-tion effects have sometimes been reported in the literature. Here we consider the mea-surement set of Suzukiet al. ~1969! for water in cyclohexane (1CCl4) emulsions stabi-lized with Arlacel 60~sorbitan monostearate! surfactant. As shown in Figs. 1~a! and 1~b!the viscosity curves indeed superpose when plotted against the depletion flow number.The only exception appears to be the curve for the highest surfactant concentration whichis slightly higher than the rest.
The use of the depletion flow number as defined above requires not only knowledge ofthe micelle volume fraction but also that of the micelle size. The micelle volume fractionfollows from the micelle density and theexcesssurfactant concentration~i.e., the amountof surfactant in excess of the CMC plus the amount of adsorbed surfactant!. The amountof adsorbed surfactant can be estimated from the area per surfactant molecule~typically40 Å2! and is usually small~ , 0.05 wt %!. For scaling purposes the micelle density canbe taken as that of the surfactant density or, even more crudely, equal to that of theaqueous phase~ ; 1.0 g/l!. The micelle size is a much more difficult parameter toestimate. For nonionic surfactants which consist of an aliphatic chain ofn units and apolyethyleneoxide part ofm units ~abbreviatedCnEm!, however, empirical relations areavailable. Commercially available examples of this class of surfactants are Neodol,Dobanol, and Brij. The critical micelle concentration of these products is reproduced wellby the empirical relation@see, e.g., Huiberset al. ~1996!#
log10CMC 5 1.646– 0.496n10.0437m ~CMC in mole/1!. ~3!
In addition, the micelle size data forCnEm surfactants can be approximated as~see TableI!
am 5 16.310.59n10.73m ~ in Å !. ~4!
For surfactants for which no micelle data are available, the length of the apolar chain,
lchain' 1.511.265n @ in Å; Tanford ~1980!#, ~5!
FIG. 1. Effect of surfactant concentration for a water in cyclohexane emulsion.~a! Relative emulsion viscosityvs shear rate.~b! Relative viscosity vs depletion flow number. The numbers refer to the volume fractions ofsurfactant~Arlacel 60!. The droplet volume fraction and size werew 5 0.15 anda32 5 1.5mm, respectively.
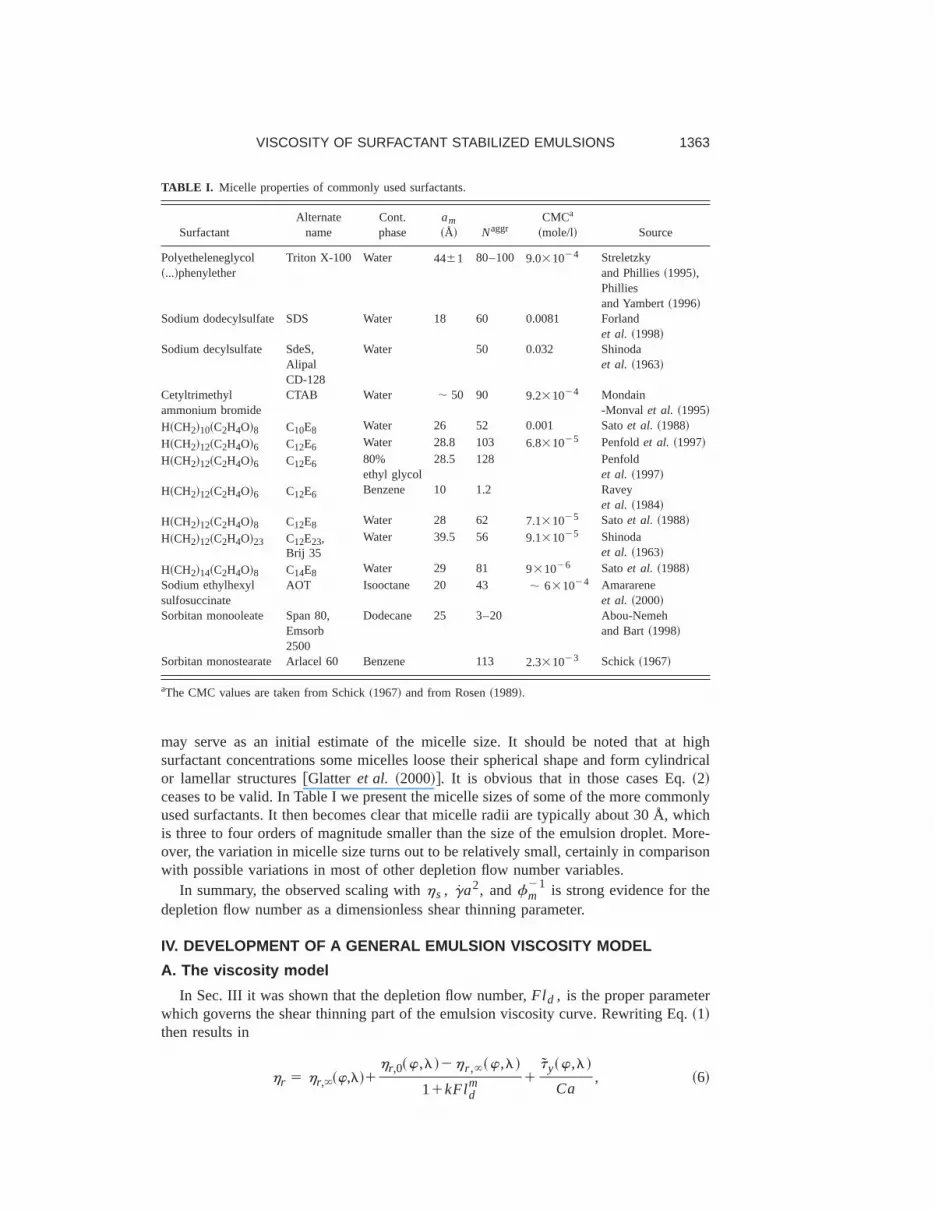
may serve as an initial estimate of the micelle size. It should be noted that at highsurfactant concentrations some micelles loose their spherical shape and form cylindricalor lamellar structures@Glatter et al. ~2000!#. It is obvious that in those cases Eq.~2!ceases to be valid. In Table I we present the micelle sizes of some of the more commonlyused surfactants. It then becomes clear that micelle radii are typically about 30 Å, whichis three to four orders of magnitude smaller than the size of the emulsion droplet. More-over, the variation in micelle size turns out to be relatively small, certainly in comparisonwith possible variations in most of other depletion flow number variables.
In summary, the observed scaling withhs , ga2, andfm21 is strong evidence for the
depletion flow number as a dimensionless shear thinning parameter.
IV. DEVELOPMENT OF A GENERAL EMULSION VISCOSITY MODEL
A. The viscosity model
In Sec. III it was shown that the depletion flow number,Fl d , is the proper parameterwhich governs the shear thinning part of the emulsion viscosity curve. Rewriting Eq.~1!then results in
hr 5 hr,`~w,l!1hr,0~w,l!2h r ,`~w,l!
11kFldm 1
ty~w,l!
Ca, ~6!
TABLE I. Micelle properties of commonly used surfactants.
SurfactantAlternate
nameCont.phase
am~Å! Naggr
CMCa
~mole/l! Source
Polyetheleneglycol~...!phenylether
Triton X-100 Water 4461 80–100 9.031024 Streletzkyand Phillies~1995!,Philliesand Yambert~1996!
Sodium dodecylsulfate SDS Water 18 60 0.0081 Forlandet al. ~1998!
Sodium decylsulfate SdeS,AlipalCD-128
Water 50 0.032 Shinodaet al. ~1963!
Cetyltrimethylammonium bromide
CTAB Water ; 50 90 9.231024 Mondain-Monval et al. ~1995!
H~CH2!10~C2H4O!8 C10E8 Water 26 52 0.001 Satoet al. ~1988!
H~CH2!12~C2H4O!6 C12E6 Water 28.8 103 6.831025 Penfoldet al. ~1997!
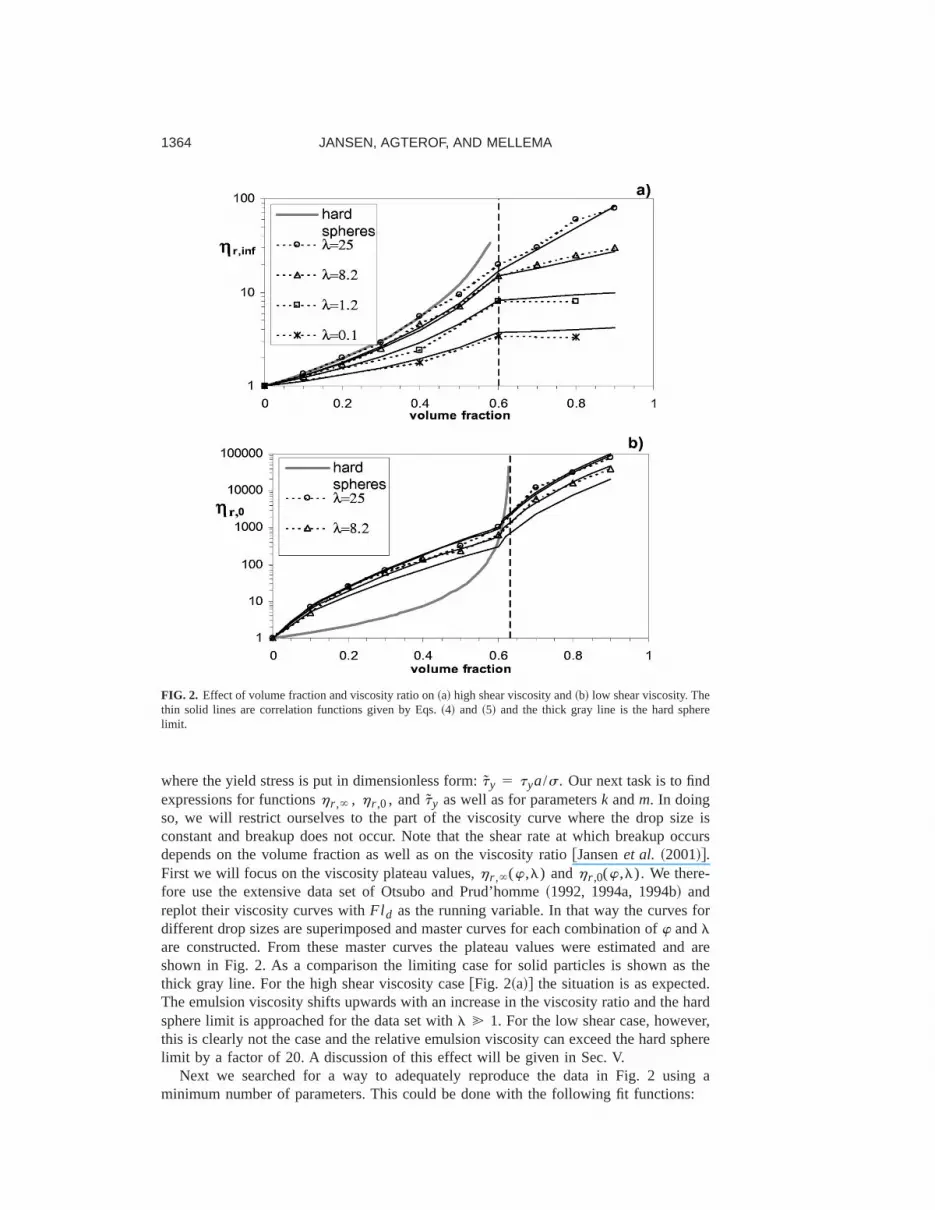
where the yield stress is put in dimensionless form:ty 5 tya/s. Our next task is to findexpressions for functionsh r ,` , h r ,0, andty as well as for parametersk andm. In doingso, we will restrict ourselves to the part of the viscosity curve where the drop size isconstant and breakup does not occur. Note that the shear rate at which breakup occursdepends on the volume fraction as well as on the viscosity ratio@Jansenet al. ~2001!#.First we will focus on the viscosity plateau values,h r ,`(w,l) andh r ,0(w,l). We there-fore use the extensive data set of Otsubo and Prud’homme~1992, 1994a, 1994b! andreplot their viscosity curves withFl d as the running variable. In that way the curves fordifferent drop sizes are superimposed and master curves for each combination ofw andlare constructed. From these master curves the plateau values were estimated and areshown in Fig. 2. As a comparison the limiting case for solid particles is shown as thethick gray line. For the high shear viscosity case@Fig. 2~a!# the situation is as expected.The emulsion viscosity shifts upwards with an increase in the viscosity ratio and the hardsphere limit is approached for the data set withl @ 1. For the low shear case, however,this is clearly not the case and the relative emulsion viscosity can exceed the hard spherelimit by a factor of 20. A discussion of this effect will be given in Sec. V.
Next we searched for a way to adequately reproduce the data in Fig. 2 using aminimum number of parameters. This could be done with the following fit functions:
FIG. 2. Effect of volume fraction and viscosity ratio on~a! high shear viscosity and~b! low shear viscosity. Thethin solid lines are correlation functions given by Eqs.~4! and ~5! and the thick gray line is the hard spherelimit.
where K1 5 (2.5l11)/(l11), Kl 5 (10l18)/(l11), a1 5 0.7, a2 5 25, a35 0.2, andwmax 5 1.15. Finally, the constants in the shear thinning term of Eq.~6! were
determined ask 5 0.84 andm 5 0.8. Equation~7a! known as the Mooney equationwhich was shown before to be useful to predict the high shear limit of emulsions@Pal~1992!#. Above a critical volume fractionwc 5 0.60 the droplets are in close contact andthe interaction mechanism changes. For simplicity, however, we do not introduce a dif-ferent scaling parameter but simply introduce correction factors above the critical volumefraction @Eqs.~7b! and~8b!#. The results of the fit functions are shown in Fig. 2 as solidlines. For thel 5 1.2 and 0.1 case the zero shear viscosities could not be determinedfrom the Otsubo data with sufficient accuracy and were therefore omitted in Fig. 2~b!.The curves for the fit functions at these viscosity ratios were obtained by comparison withother data sets.
B. The yield stress term
For high volume fractions the drops are in constant contact and form a network ofpolyhedrally deformed drops. Emulsions of these concentrations do not flow below acertain stress value, termed the yield stress,ty . Above that stress value the viscosity isgoverned by the capillary pressure in the interdroplet gaps. Princen and Kiss~1985, 1986!performed careful measurements on well stabilizedl 5 22 emulsions and observed thatthis yield stress indeed scaled withs/a and could be fitted to the semiempirical relation,
where they used the so-called Sauter mean drop radiusa32 5 Sniai3/Sniai
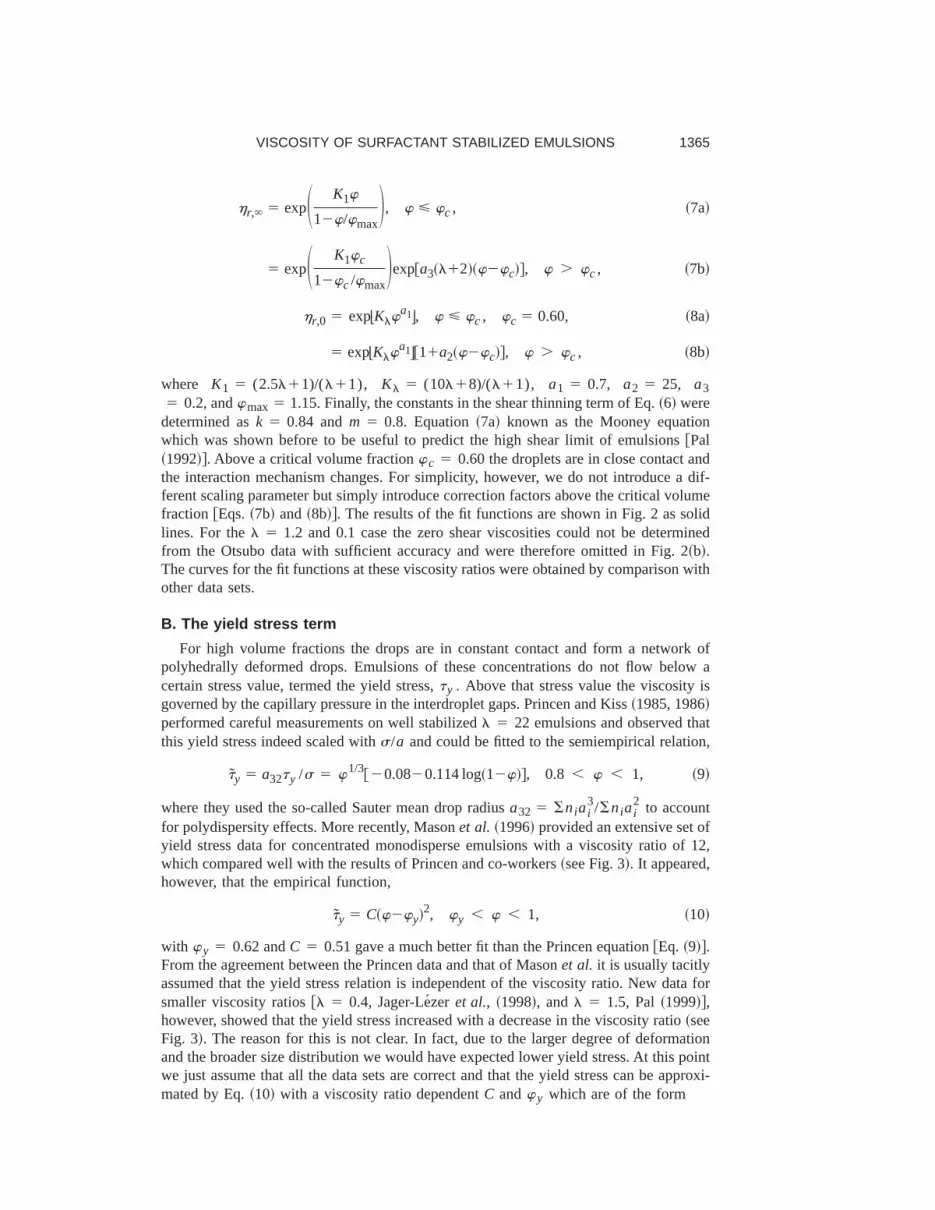
2 to accountfor polydispersity effects. More recently, Masonet al. ~1996! provided an extensive set ofyield stress data for concentrated monodisperse emulsions with a viscosity ratio of 12,which compared well with the results of Princen and co-workers~see Fig. 3!. It appeared,however, that the empirical function,
ty 5 C~w2wy!2, wy , w , 1, ~10!
with wy 5 0.62 andC 5 0.51 gave a much better fit than the Princen equation@Eq. ~9!#.From the agreement between the Princen data and that of Masonet al. it is usually tacitlyassumed that the yield stress relation is independent of the viscosity ratio. New data forsmaller viscosity ratios@l 5 0.4, Jager-Le´zer et al., ~1998!, andl 5 1.5, Pal~1999!#,however, showed that the yield stress increased with a decrease in the viscosity ratio~seeFig. 3!. The reason for this is not clear. In fact, due to the larger degree of deformationand the broader size distribution we would have expected lower yield stress. At this pointwe just assume that all the data sets are correct and that the yield stress can be approxi-mated by Eq.~10! with a viscosity ratio dependentC andwy which are of the form
1365VISCOSITY OF SURFACTANT STABILIZED EMULSIONS
C~l! 5 c0
l1c1
l1c2, wy~l! 5 b0
l1b1
l11, ~11!
with c0 5 0.4, c1 5 4.2, c2 5 0.2, b0 5 0.62, andb1 5 1.1. Note that, although thevariation of wy with l is small, a model with a constantwy resulted in a significantlypoorer fit. The results of this correlation model are shown in Fig. 3 as solid lines.
C. Comparison with different data sources
We will now compare the viscosity predictions as given by the above correlationfunction with viscosity data available in the literature. We restricted ourselves to studiesof emulsion systems that are well characterized in terms of volume fraction, drop size,and surfactant concentration and which precautions were taken to correct or eliminatewall slip. The polydispersity of these emulsion systems was always between 10% and20%. Data ranges in which drop breakup was reported were not taken into account. Themicelle sizes needed for the viscosity predictions were taken from Table I unless other-wise indicated.
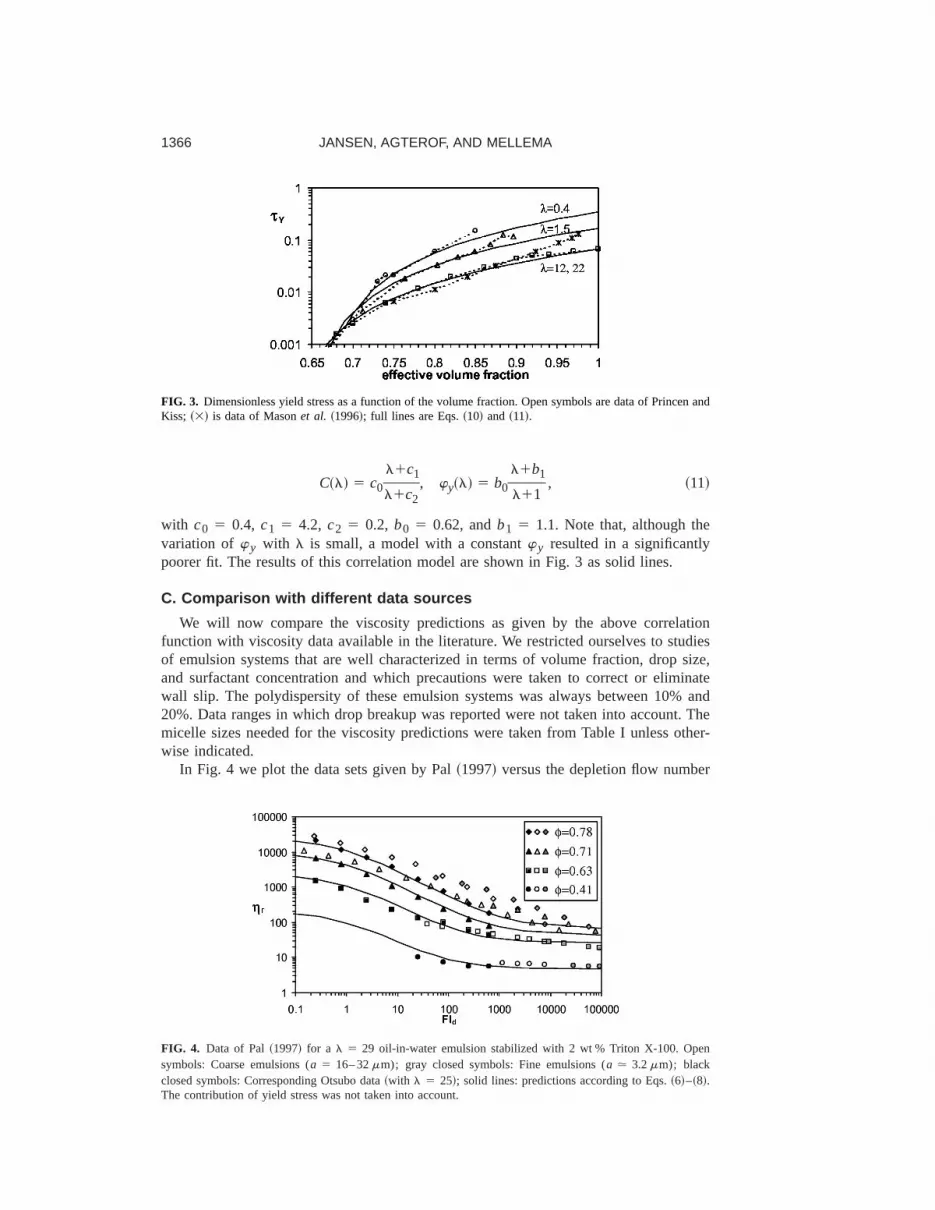
In Fig. 4 we plot the data sets given by Pal~1997! versus the depletion flow number
FIG. 3. Dimensionless yield stress as a function of the volume fraction. Open symbols are data of Princen andKiss; ~3! is data of Masonet al. ~1996!; full lines are Eqs.~10! and ~11!.
FIG. 4. Data of Pal~1997! for a l 5 29 oil-in-water emulsion stabilized with 2 wt % Triton X-100. Opensymbols: Coarse emulsions (a 5 16– 32mm); gray closed symbols: Fine emulsions (a . 3.2mm); blackclosed symbols: Corresponding Otsubo data~with l 5 25!; solid lines: predictions according to Eqs.~6!–~8!.The contribution of yield stress was not taken into account.
1366 JANSEN, AGTEROF, AND MELLEMA
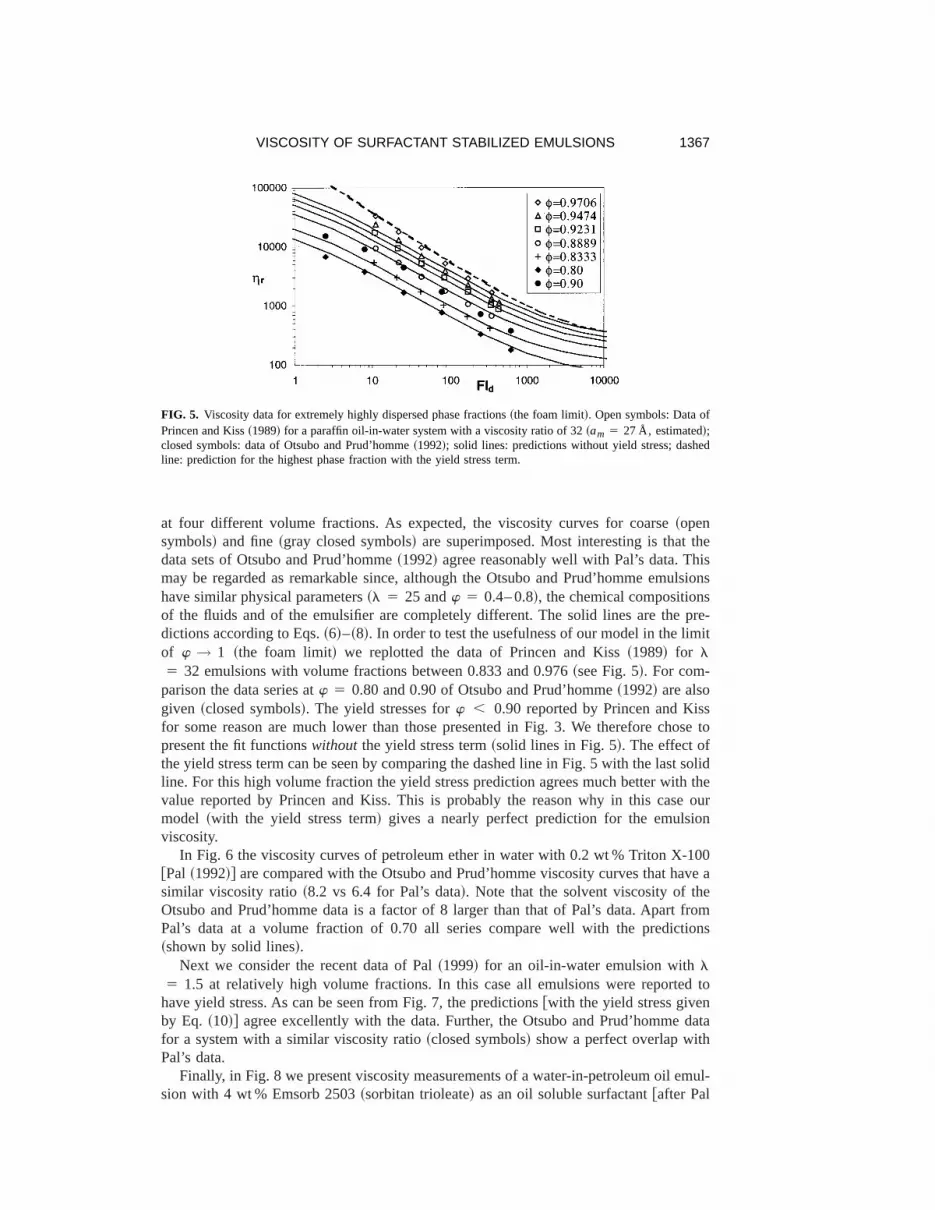
at four different volume fractions. As expected, the viscosity curves for coarse~opensymbols! and fine~gray closed symbols! are superimposed. Most interesting is that thedata sets of Otsubo and Prud’homme~1992! agree reasonably well with Pal’s data. Thismay be regarded as remarkable since, although the Otsubo and Prud’homme emulsionshave similar physical parameters~l 5 25 andw 5 0.4– 0.8!, the chemical compositionsof the fluids and of the emulsifier are completely different. The solid lines are the pre-dictions according to Eqs.~6!–~8!. In order to test the usefulness of our model in the limitof w → 1 ~the foam limit! we replotted the data of Princen and Kiss~1989! for l5 32 emulsions with volume fractions between 0.833 and 0.976~see Fig. 5!. For com-
parison the data series atw 5 0.80 and 0.90 of Otsubo and Prud’homme~1992! are alsogiven ~closed symbols!. The yield stresses forw , 0.90 reported by Princen and Kissfor some reason are much lower than those presented in Fig. 3. We therefore chose topresent the fit functionswithout the yield stress term~solid lines in Fig. 5!. The effect ofthe yield stress term can be seen by comparing the dashed line in Fig. 5 with the last solidline. For this high volume fraction the yield stress prediction agrees much better with thevalue reported by Princen and Kiss. This is probably the reason why in this case ourmodel ~with the yield stress term! gives a nearly perfect prediction for the emulsionviscosity.
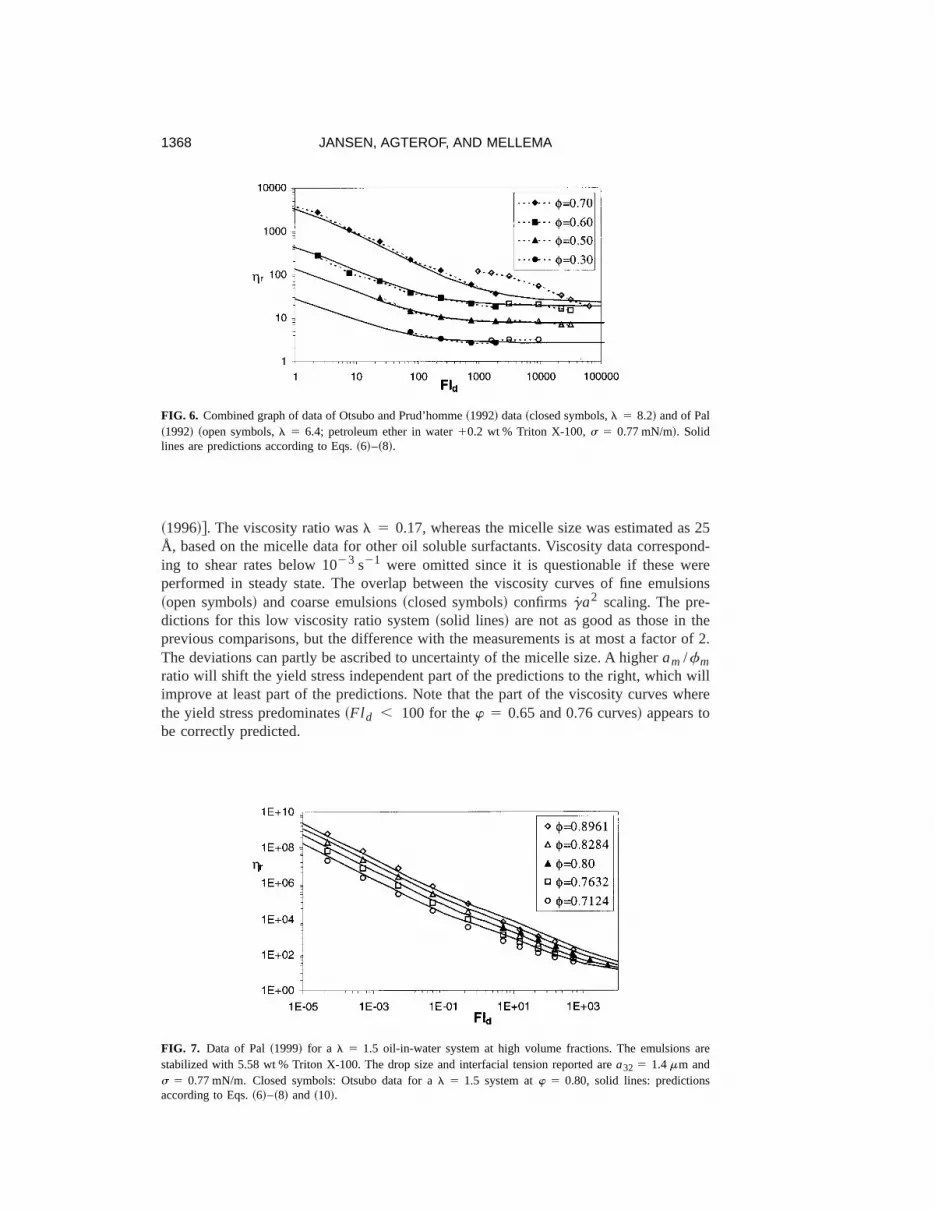
In Fig. 6 the viscosity curves of petroleum ether in water with 0.2 wt % Triton X-100@Pal ~1992!# are compared with the Otsubo and Prud’homme viscosity curves that have asimilar viscosity ratio~8.2 vs 6.4 for Pal’s data!. Note that the solvent viscosity of theOtsubo and Prud’homme data is a factor of 8 larger than that of Pal’s data. Apart fromPal’s data at a volume fraction of 0.70 all series compare well with the predictions~shown by solid lines!.
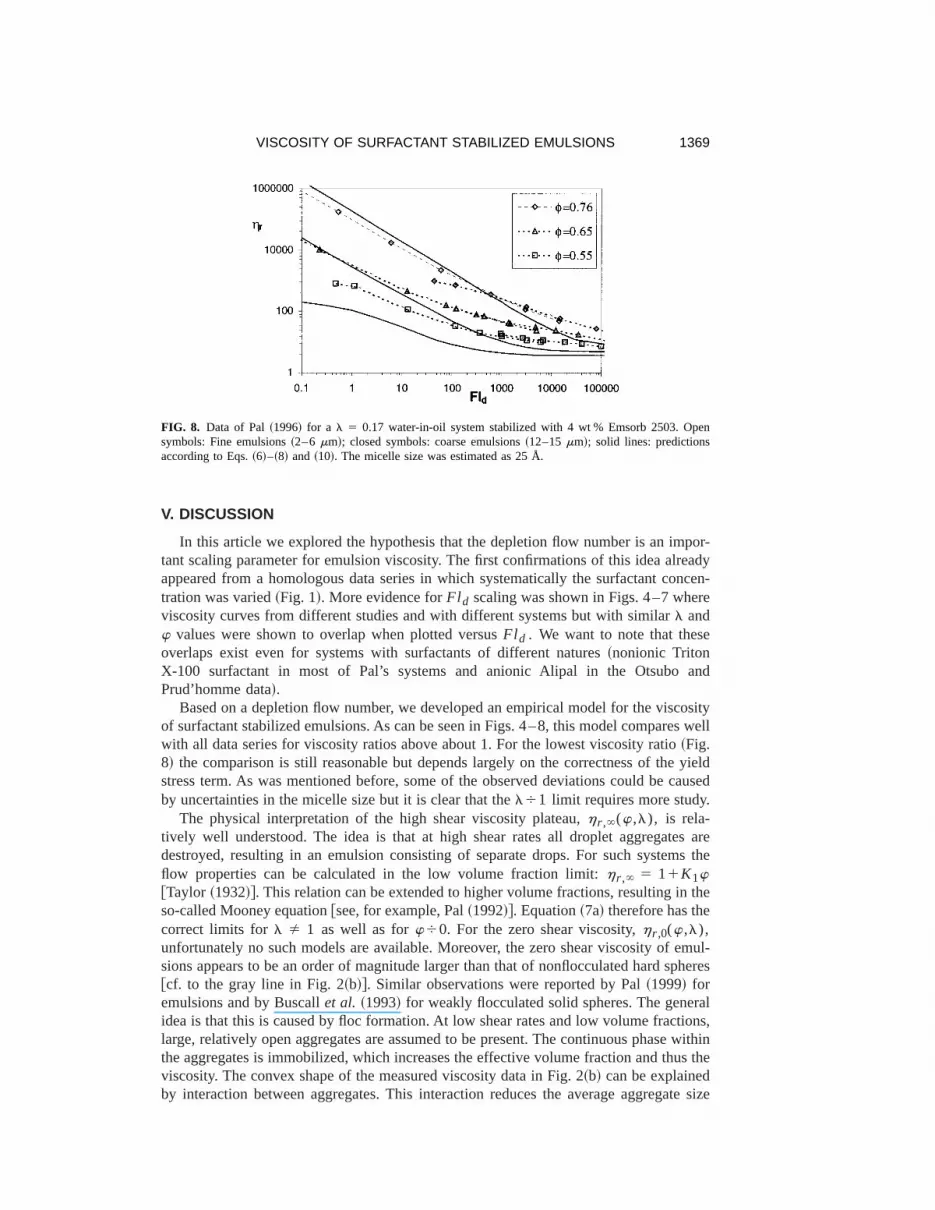
Next we consider the recent data of Pal~1999! for an oil-in-water emulsion withl5 1.5 at relatively high volume fractions. In this case all emulsions were reported to
have yield stress. As can be seen from Fig. 7, the predictions@with the yield stress givenby Eq. ~10!# agree excellently with the data. Further, the Otsubo and Prud’homme datafor a system with a similar viscosity ratio~closed symbols! show a perfect overlap withPal’s data.
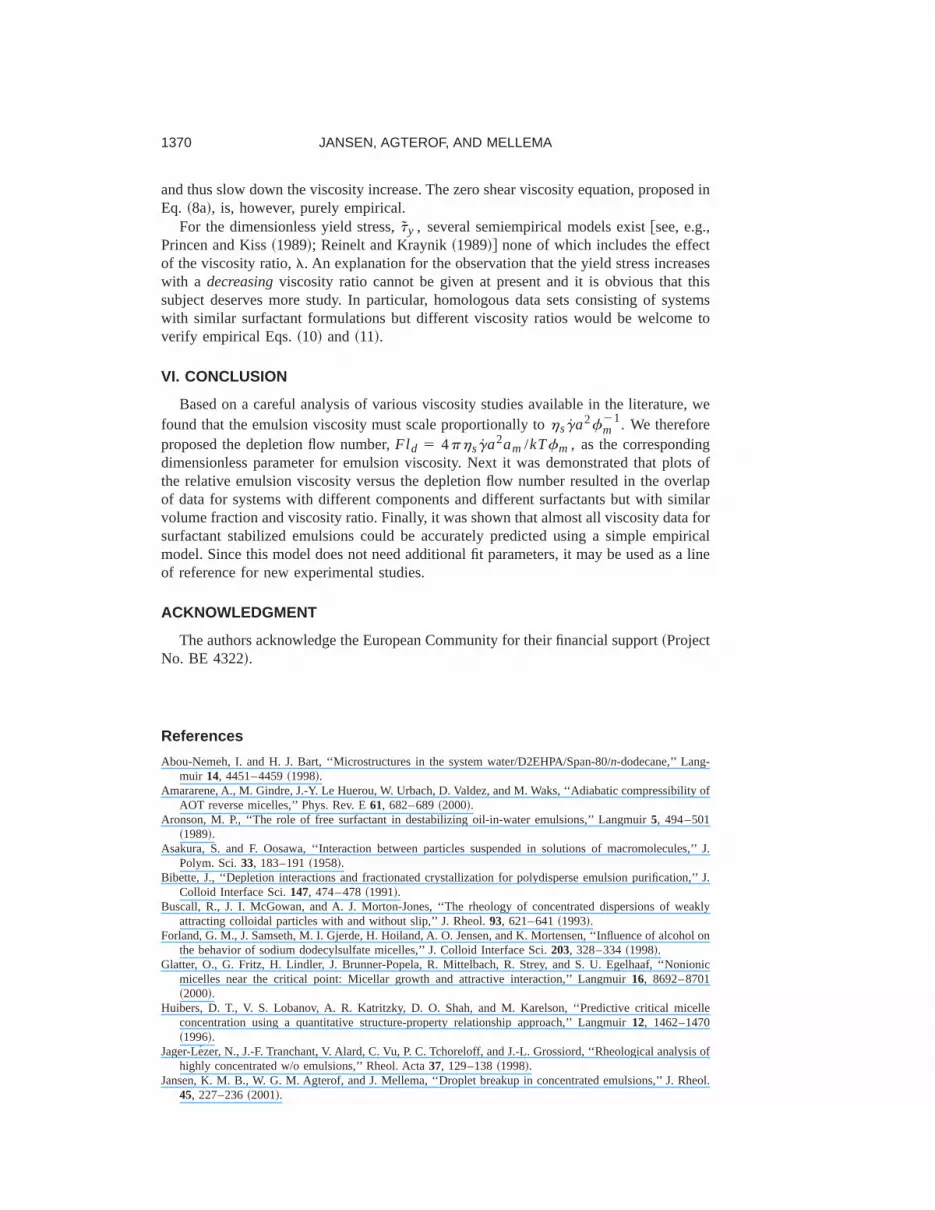
Finally, in Fig. 8 we present viscosity measurements of a water-in-petroleum oil emul-sion with 4 wt % Emsorb 2503~sorbitan trioleate! as an oil soluble surfactant@after Pal
FIG. 5. Viscosity data for extremely highly dispersed phase fractions~the foam limit!. Open symbols: Data ofPrincen and Kiss~1989! for a paraffin oil-in-water system with a viscosity ratio of 32~am 5 27 Å, estimated!;closed symbols: data of Otsubo and Prud’homme~1992!; solid lines: predictions without yield stress; dashedline: prediction for the highest phase fraction with the yield stress term.
1367VISCOSITY OF SURFACTANT STABILIZED EMULSIONS
~1996!#. The viscosity ratio wasl 5 0.17, whereas the micelle size was estimated as 25Å, based on the micelle data for other oil soluble surfactants. Viscosity data correspond-ing to shear rates below 1023 s21 were omitted since it is questionable if these wereperformed in steady state. The overlap between the viscosity curves of fine emulsions~open symbols! and coarse emulsions~closed symbols! confirms ga2 scaling. The pre-dictions for this low viscosity ratio system~solid lines! are not as good as those in theprevious comparisons, but the difference with the measurements is at most a factor of 2.The deviations can partly be ascribed to uncertainty of the micelle size. A higheram /fmratio will shift the yield stress independent part of the predictions to the right, which willimprove at least part of the predictions. Note that the part of the viscosity curves wherethe yield stress predominates~Fl d , 100 for thew 5 0.65 and 0.76 curves! appears tobe correctly predicted.
FIG. 6. Combined graph of data of Otsubo and Prud’homme~1992! data~closed symbols,l 5 8.2! and of Pal~1992! ~open symbols,l 5 6.4; petroleum ether in water10.2 wt % Triton X-100,s 5 0.77 mN/m!. Solidlines are predictions according to Eqs.~6!–~8!.
FIG. 7. Data of Pal~1999! for a l 5 1.5 oil-in-water system at high volume fractions. The emulsions arestabilized with 5.58 wt % Triton X-100. The drop size and interfacial tension reported area32 5 1.4mm ands 5 0.77 mN/m. Closed symbols: Otsubo data for al 5 1.5 system atw 5 0.80, solid lines: predictionsaccording to Eqs.~6!–~8! and ~10!.
1368 JANSEN, AGTEROF, AND MELLEMA
V. DISCUSSION
In this article we explored the hypothesis that the depletion flow number is an impor-tant scaling parameter for emulsion viscosity. The first confirmations of this idea alreadyappeared from a homologous data series in which systematically the surfactant concen-tration was varied~Fig. 1!. More evidence forFl d scaling was shown in Figs. 4–7 whereviscosity curves from different studies and with different systems but with similarl andw values were shown to overlap when plotted versusFl d . We want to note that theseoverlaps exist even for systems with surfactants of different natures~nonionic TritonX-100 surfactant in most of Pal’s systems and anionic Alipal in the Otsubo andPrud’homme data!.
Based on a depletion flow number, we developed an empirical model for the viscosityof surfactant stabilized emulsions. As can be seen in Figs. 4–8, this model compares wellwith all data series for viscosity ratios above about 1. For the lowest viscosity ratio~Fig.8! the comparison is still reasonable but depends largely on the correctness of the yieldstress term. As was mentioned before, some of the observed deviations could be causedby uncertainties in the micelle size but it is clear that thel41 limit requires more study.
The physical interpretation of the high shear viscosity plateau,h r ,`(w,l), is rela-tively well understood. The idea is that at high shear rates all droplet aggregates aredestroyed, resulting in an emulsion consisting of separate drops. For such systems theflow properties can be calculated in the low volume fraction limit:h r ,` 5 11K1w@Taylor ~1932!#. This relation can be extended to higher volume fractions, resulting in theso-called Mooney equation@see, for example, Pal~1992!#. Equation~7a! therefore has thecorrect limits forl Þ 1 as well as forw40. For the zero shear viscosity,h r ,0(w,l),unfortunately no such models are available. Moreover, the zero shear viscosity of emul-sions appears to be an order of magnitude larger than that of nonflocculated hard spheres@cf. to the gray line in Fig. 2~b!#. Similar observations were reported by Pal~1999! foremulsions and by Buscallet al. ~1993! for weakly flocculated solid spheres. The generalidea is that this is caused by floc formation. At low shear rates and low volume fractions,large, relatively open aggregates are assumed to be present. The continuous phase withinthe aggregates is immobilized, which increases the effective volume fraction and thus theviscosity. The convex shape of the measured viscosity data in Fig. 2~b! can be explainedby interaction between aggregates. This interaction reduces the average aggregate size
FIG. 8. Data of Pal~1996! for a l 5 0.17 water-in-oil system stabilized with 4 wt % Emsorb 2503. Opensymbols: Fine emulsions~2–6 mm!; closed symbols: coarse emulsions~12–15mm!; solid lines: predictionsaccording to Eqs.~6!–~8! and ~10!. The micelle size was estimated as 25 Å.
and thus slow down the viscosity increase. The zero shear viscosity equation, proposed inEq. ~8a!, is, however, purely empirical.
For the dimensionless yield stress,ty , several semiempirical models exist@see, e.g.,Princen and Kiss~1989!; Reinelt and Kraynik~1989!# none of which includes the effectof the viscosity ratio,l. An explanation for the observation that the yield stress increaseswith a decreasingviscosity ratio cannot be given at present and it is obvious that thissubject deserves more study. In particular, homologous data sets consisting of systemswith similar surfactant formulations but different viscosity ratios would be welcome toverify empirical Eqs.~10! and ~11!.
VI. CONCLUSION
Based on a careful analysis of various viscosity studies available in the literature, wefound that the emulsion viscosity must scale proportionally tohsga2fm
21. We thereforeproposed the depletion flow number,Fl d 5 4phsga2am /kTfm , as the correspondingdimensionless parameter for emulsion viscosity. Next it was demonstrated that plots ofthe relative emulsion viscosity versus the depletion flow number resulted in the overlapof data for systems with different components and different surfactants but with similarvolume fraction and viscosity ratio. Finally, it was shown that almost all viscosity data forsurfactant stabilized emulsions could be accurately predicted using a simple empiricalmodel. Since this model does not need additional fit parameters, it may be used as a lineof reference for new experimental studies.
ACKNOWLEDGMENT
The authors acknowledge the European Community for their financial support~ProjectNo. BE 4322!.
References
Abou-Nemeh, I. and H. J. Bart, ‘‘Microstructures in the system water/D2EHPA/Span-80/n-dodecane,’’ Lang-muir 14, 4451–4459~1998!.
Amararene, A., M. Gindre, J.-Y. Le Huerou, W. Urbach, D. Valdez, and M. Waks, ‘‘Adiabatic compressibility ofAOT reverse micelles,’’ Phys. Rev. E61, 682–689~2000!.
Aronson, M. P., ‘‘The role of free surfactant in destabilizing oil-in-water emulsions,’’ Langmuir5, 494–501~1989!.
Asakura, S. and F. Oosawa, ‘‘Interaction between particles suspended in solutions of macromolecules,’’ J.Polym. Sci.33, 183–191~1958!.
Bibette, J., ‘‘Depletion interactions and fractionated crystallization for polydisperse emulsion purification,’’ J.Colloid Interface Sci.147, 474–478~1991!.
Buscall, R., J. I. McGowan, and A. J. Morton-Jones, ‘‘The rheology of concentrated dispersions of weaklyattracting colloidal particles with and without slip,’’ J. Rheol.93, 621–641~1993!.
Forland, G. M., J. Samseth, M. I. Gjerde, H. Hoiland, A. O. Jensen, and K. Mortensen, ‘‘Influence of alcohol onthe behavior of sodium dodecylsulfate micelles,’’ J. Colloid Interface Sci.203, 328–334~1998!.
Glatter, O., G. Fritz, H. Lindler, J. Brunner-Popela, R. Mittelbach, R. Strey, and S. U. Egelhaaf, ‘‘Nonionicmicelles near the critical point: Micellar growth and attractive interaction,’’ Langmuir16, 8692–8701~2000!.
Huibers, D. T., V. S. Lobanov, A. R. Katritzky, D. O. Shah, and M. Karelson, ‘‘Predictive critical micelleconcentration using a quantitative structure-property relationship approach,’’ Langmuir12, 1462–1470~1996!.
Jager-Le´zer, N., J.-F. Tranchant, V. Alard, C. Vu, P. C. Tchoreloff, and J.-L. Grossiord, ‘‘Rheological analysis ofhighly concentrated w/o emulsions,’’ Rheol. Acta37, 129–138~1998!.
Jansen, K. M. B., W. G. M. Agterof, and J. Mellema, ‘‘Droplet breakup in concentrated emulsions,’’ J. Rheol.45, 227–236~2001!.
Krieger, I. M., ‘‘Rheology of monodisperse lattices,’’ Adv. Colloid Interface Sci.3, 111–136~1972!.Loewenberg, M. and E. J. Hinch, ‘‘Numerical simulation of a concentrated emulsion in shear flow,’’ J. Fluid
Mech.321, 395–419~1996!.Mason, T. G., J. Bibette, and D. A. Weitz, ‘‘Yielding and flow of monodisperse emulsions,’’ J. Colloid Interface
Sci. 179, 439–448~1996!.Mondain-Monval, O., F. Leal-Calderon, J. Phillip, and J. Bibette, ‘‘Depletion forces in the presence of electro-
static double layer repulsion,’’ Phys. Rev. Lett.75, 3364–3367~1995!.Otsubo, Y. and R. K. Prud’homme, ‘‘Flow behavior of oil-in-water emulsions,’’ J. Soc. Rheol., Jpn.20, 125–
131 ~1992!.Otsubo, Y. and R. K. Prud’homme, ‘‘Rheology of oil-in-water emulsions,’’ Rheol. Acta33, 29–37~1994a!.Otsubo, Y. and R. K. Prud’homme, ‘‘Effect of drop size distribution on the flow behavior of oil-in-water
emulsions,’’ Rheol. Acta33, 303–306~1994b!.Pal, R., ‘‘Rheology of polymer-thickened emulsions,’’ J. Rheol.36, 1245–1259~1992!.Pal, R., ‘‘Viscous properties of polymer-thickened water-in-oil emulsions,’’ J. Appl. Polym. Sci.49, 65–80
~1993!.Pal, R., ‘‘Effect of droplet size on the rheology of emulsions,’’ AIChE J.42, 3181–3190~1996!.Pal, R., ‘‘Scaling of relative viscosity of emulsions,’’ J. Rheol.41, 141–150~1997!.Pal, R., ‘‘Yield stress and viscoelastic properties of high internal phase ratio emulsions,’’ Colloid Polym. Sci.
277, 583–588~1999!.Penfold, J., E. Staples, I. Tucker, and P. Cummins, ‘‘The structure of nonionic micelles in less polar solvents,’’
J. Colloid Interface Sci.185, 424–431~1997!.Phillies, G. D. J. and J. E. Yambert, ‘‘Solvent and solute effects on hydration and aggregation numbers of Triton
X-100 micelles,’’ Langmuir12, 3431–3436~1996!.Princen, H. M. and A. D. Kiss, ‘‘Rheology of foams and highly concentrated emulsions. II. Yield stress and wall
effects,’’ J. Colloid Interface Sci.105, 150–171~1985!.Princen, H. M. and A. D. Kiss, ‘‘Rheology of foams and highly concentrated emulsions. III. Static shear
modulus,’’ J. Colloid Interface Sci.112, 427–437~1986!.Princen, H. M. and A. D. Kiss, ‘‘Rheology of foams and highly concentrated emulsions. IV. Shear viscosity and
yield stress,’’ J. Colloid Interface Sci.128, 176–187~1989!.Ravey, J. C., M. Buzier, and C. Picot, ‘‘Micellar structures of non-ionic surfactants in apolar media,’’ J. Colloid
Interface Sci.97, 9–25~1984!.Reinelt, D. A. and A. M. Kraynik, ‘‘Viscous effects in the rheology of foams and concentrated emulsions,’’ J.
Colloid Interface Sci.132, 491–503~1989!.Rosen, M. J.,Surfactants and Interfacial Phenomena~Wiley, New York, 1989!.Sato, T., Y. Saito, and I. Anazawa, ‘‘Micellar structure and micellar inner polarity of octaethylene glycoln-alkyl
ethers,’’ J. Chem. Soc., Faraday Trans. 181, 275–279~1988!.Schick, M., ed.,Nonionic Surfactants, Surfactant Science Series~Dekker, New York, 1967!.Shinoda, K., T. Nakagawa, B. I. Tamamushi, and T. Isemura,Colloidal Surfactants: Some Physicochemical
Properties~Academic, New York, 1963!.Streletzky, K. and D. J. Phillies, ‘‘Temperature dependence of Triton X-100 micelle size and hydration,’’
Langmuir11, 42–47~1995!.Suzuki, K., S. Matsumoto, T. Watanabe, and S. Ono, ‘‘Non-Newtonian flow of water-in-oil emulsions,’’ Bull.
Chem. Soc. Jpn.43, 2773–2777~1969!.Tanford, C.,The Hydrophobic Effect: Formation of Micelles and Biological Membranes~Wiley, New York,
1980!.Taylor, G. I., ‘‘The viscosity of a fluid containing small drops of another fluid,’’ Proc. R. Soc. London, Ser. A