Web-based application for oil spill related ecological risk assessment 1 Aps, R., 2 Sawano, N., 3 Hamada, S., 1 Fetissov, M., 1 Kotta, J., 1 Kopti, M., 1, 4 Leiger, R. 1) University of Tartu, Estonian Marine Institute, Tallinn, Estonia 2) Inaoki Educational Insitute & Seiryo Women's Junior College, Kanazawa City, Japan 3) Geological Survey of Hokkaido, Department of Marine Geosciences, Chikko, Otaru Sity, Japan 4) Estonian Maritime Academy, Tallinn, Estonia Extended Abstract This paper attempts to compare the potential oil spill related risk assessment methodology implemented for the Gulf of Finland (Baltic Sea) and for the La Perouse (Soya) Strait adjacent marine area. Gulf of Finland (Baltic Sea) At International Maritime Organization’s (IMO) Marine Environment Protection Committee’s 53rd session in July 2005, the Baltic Sea was designated as a Particularly Sensitive Sea Area (PSSA). At the same time the oil transportation is growing significantly in the Baltic Sea area and especially in the Gulf of Finland exceeding 200 million tons a year by 2010. The GoF (Figure 1) is a part of the world’s largest area of brackish water, the Baltic Sea. The GoF is 400 km long and its width varies between 60 and 135 km. Three countries surround the GoF: Finland, Russia and Estonia. The GoF is very shallow: the maximum depth is 60 meters and the average depth 37 meters. The GoF is partly ice-covered in the winter, approximately from December to April. The ice-cover is the heaviest in the eastern of the gulf. Because of its narrowness and shallowness, the GoF can be considered a high-level risk zone. The maritime traffic has increased fast during the last decade in the GoF, and especially due to the rapid growth of the various cargoes transported to and from Russia, including the oil transport from Russia. For example, as presented by Kuronen et al. [1] and in the Figure 2 the 263 M tons of cargo were transported by ship transport in the GoF in 2007, of which the share of oil products was 56%, while 23% of the cargo were loaded or unloaded in the Finnish ports, 60% in the Russian ports and 17% in the Estonian ports. The largest ports in that respect were Primorsk (74,2 M tons), St. Petersburg (59,5 M tons), Tallinn (35,9 M tons), Sköldvik (19,8 M tons), Vysotsk (16,5 M tons) and Helsinki (13,4 M tons). Approximately 53 600 ship calls were reported in the ports of the GoF. The densest traffic was found in the ports of St. Petersburg (14 651 ship calls), Helsinki (11 727 ship calls) and Tallinn (10 614 ship calls) in 2007.
Transcript
Web-based application for oil spill related ecological risk assessment 1Aps, R., 2Sawano, N., 3Hamada, S., 1Fetissov, M., 1Kotta, J., 1Kopti, M., 1, 4Leiger, R.
1) University of Tartu, Estonian Marine Institute, Tallinn, Estonia 2) Inaoki Educational Insitute & Seiryo Women's Junior College, Kanazawa City, Japan 3) Geological Survey of Hokkaido, Department of Marine Geosciences, Chikko, Otaru Sity, Japan 4) Estonian Maritime Academy, Tallinn, Estonia Extended Abstract This paper attempts to compare the potential oil spill related risk assessment methodology implemented for the Gulf of Finland (Baltic Sea) and for the La Perouse (Soya) Strait adjacent marine area. Gulf of Finland (Baltic Sea) At International Maritime Organization’s (IMO) Marine Environment Protection Committee’s 53rd session in July 2005, the Baltic Sea was designated as a Particularly Sensitive Sea Area (PSSA). At the same time the oil transportation is growing significantly in the Baltic Sea area and especially in the Gulf of Finland exceeding 200 million tons a year by 2010. The GoF (Figure 1) is a part of the world’s largest area of brackish water, the Baltic Sea. The GoF is 400 km long and its width varies between 60 and 135 km. Three countries surround the GoF: Finland, Russia and Estonia. The GoF is very shallow: the maximum depth is 60 meters and the average depth 37 meters. The GoF is partly ice-covered in the winter, approximately from December to April. The ice-cover is the heaviest in the eastern of the gulf. Because of its narrowness and shallowness, the GoF can be considered a high-level risk zone. The maritime traffic has increased fast during the last decade in the GoF, and especially due to the rapid growth of the various cargoes transported to and from Russia, including the oil transport from Russia. For example, as presented by Kuronen et al. [1] and in the Figure 2 the 263 M tons of cargo were transported by ship transport in the GoF in 2007, of which the share of oil products was 56%, while 23% of the cargo were loaded or unloaded in the Finnish ports, 60% in the Russian ports and 17% in the Estonian ports. The largest ports in that respect were Primorsk (74,2 M tons), St. Petersburg (59,5 M tons), Tallinn (35,9 M tons), Sköldvik (19,8 M tons), Vysotsk (16,5 M tons) and Helsinki (13,4 M tons). Approximately 53 600 ship calls were reported in the ports of the GoF. The densest traffic was found in the ports of St. Petersburg (14 651 ship calls), Helsinki (11 727 ship calls) and Tallinn (10 614 ship calls) in 2007.
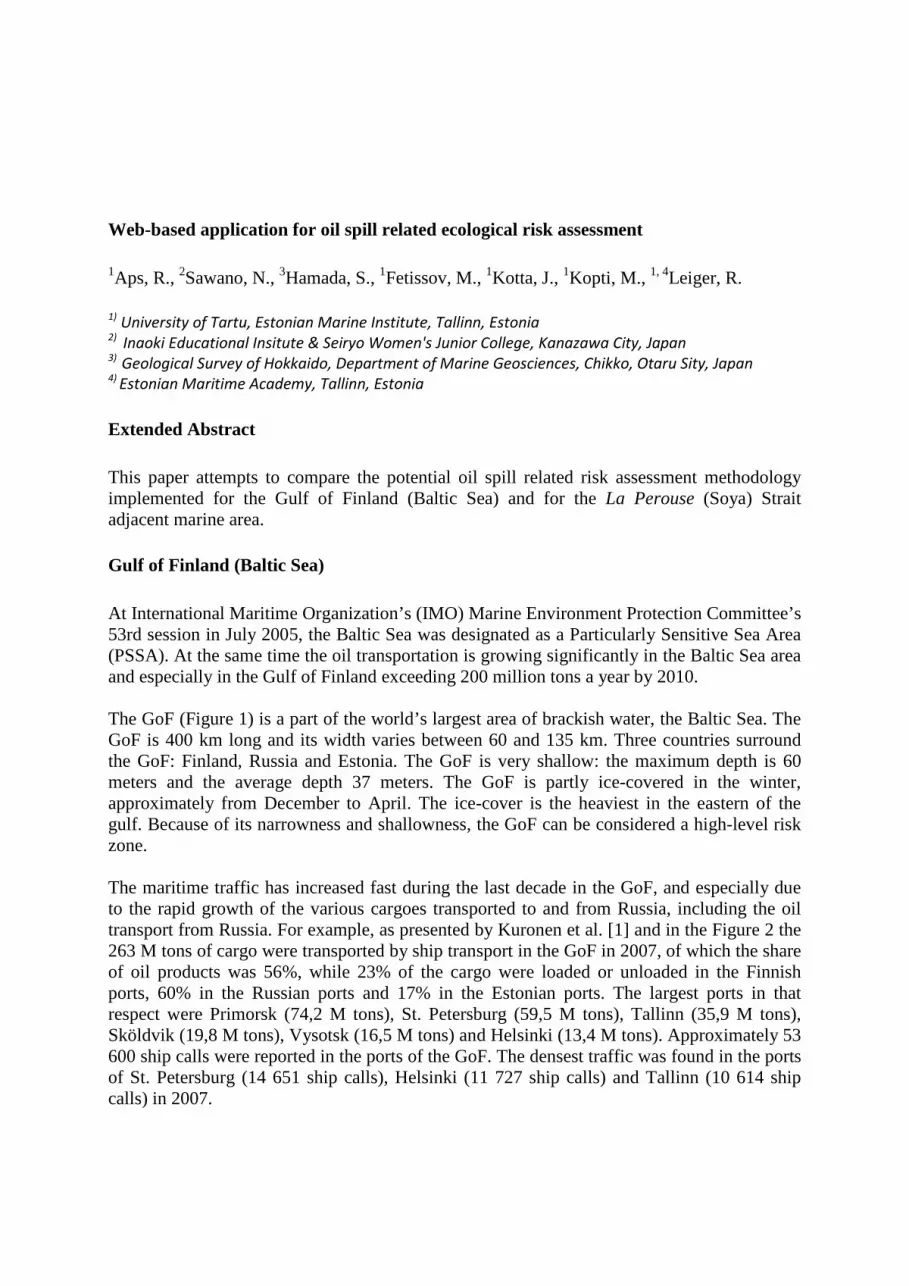
Figure 1. The Gulf of Finland In accordance of IMO’s requirements [2, 3] ships, and especially oil and chemical tankers, carrying hazardous cargo and deep-draught ships proceeding form the Baltic Sea to the GoF and vice versa are strongly recommended to follow the traffic separation schemes in the GoF. The traffic separation schemes in the GoF have been adopted by IMO, and the Rule 10 of the International Regulations for Preventing Collisions at Sea (COLREG 72) as amended, applies. In addition to following traffic separation schemes it is necessary to follow the regulations of COLREG 72 [4]. A mandatory ship reporting system for vessels in the GoF came into force on 1 July 2004 (Figure 2). The reporting area covers the international waters between the West reporting line drawn from the Kõpu peninsula (58̊55’ 22˚12’E) and the East reporting line at longitude 26˚30’E. This area is divided into two by the Central reporting line, drawn through the midpoints of the separation zones of the traffic separation schemes of Kõpu, Hankoniemi, Porkkala and Kalbådagrund to 59˚59’ 26˚30’E [2].
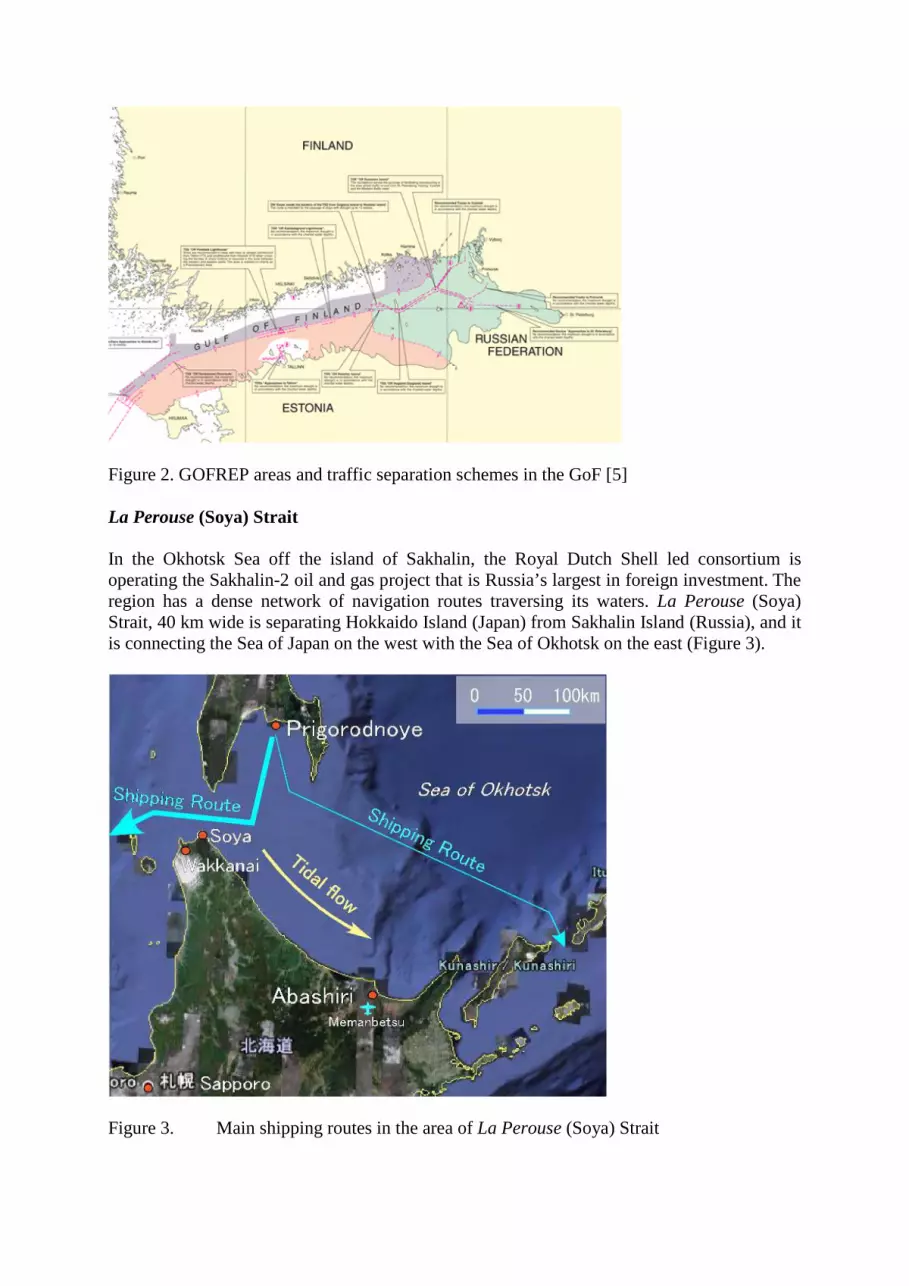
Figure 2. GOFREP areas and traffic separation schemes in the GoF [5] La Perouse (Soya) Strait In the Okhotsk Sea off the island of Sakhalin, the Royal Dutch Shell led consortium is operating the Sakhalin-2 oil and gas project that is Russia’s largest in foreign investment. The region has a dense network of navigation routes traversing its waters. La Perouse (Soya) Strait, 40 km wide is separating Hokkaido Island (Japan) from Sakhalin Island (Russia), and it is connecting the Sea of Japan on the west with the Sea of Okhotsk on the east (Figure 3).
Figure 3. Main shipping routes in the area of La Perouse (Soya) Strait
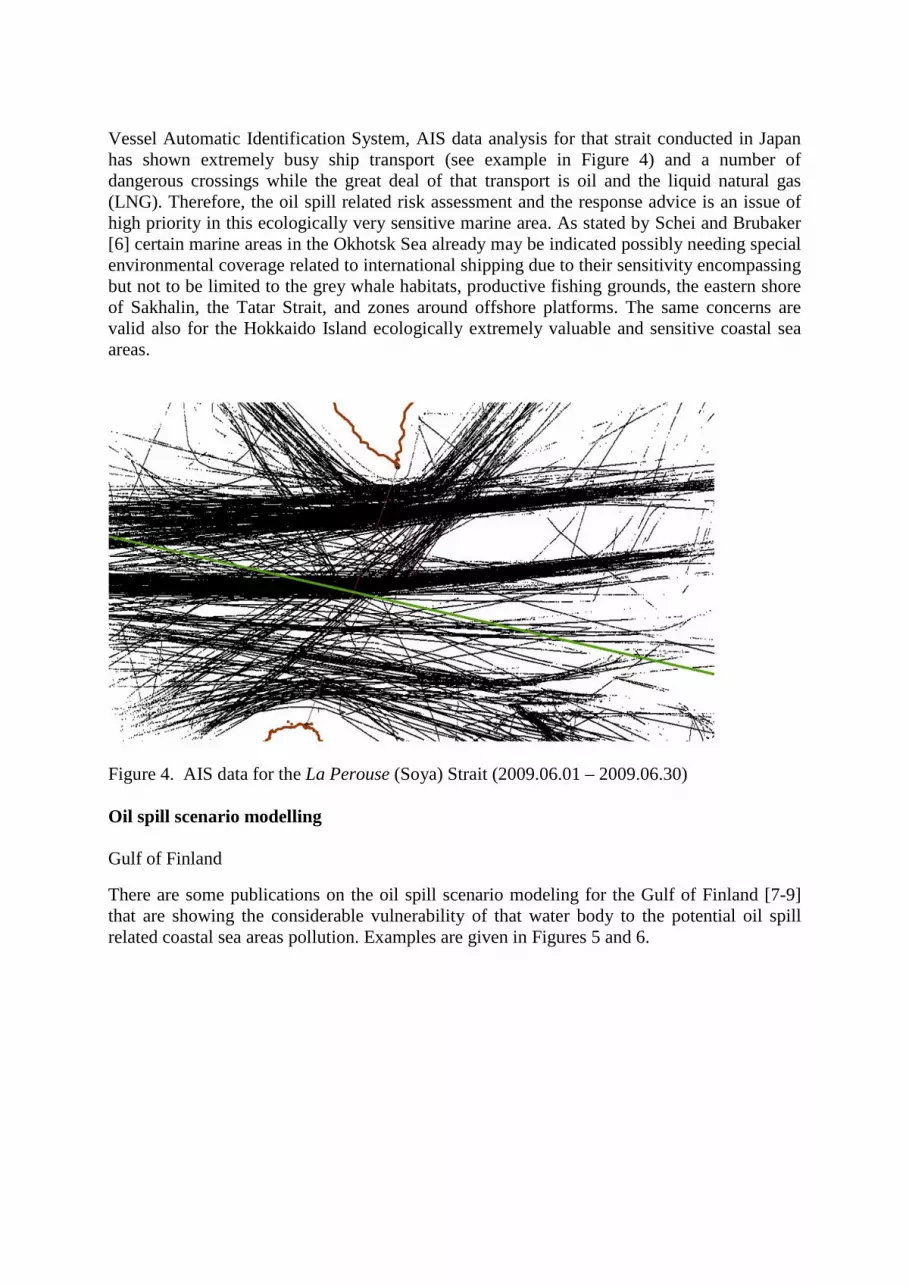
Vessel Automatic Identification System, AIS data analysis for that strait conducted in Japan has shown extremely busy ship transport (see example in Figure 4) and a number of dangerous crossings while the great deal of that transport is oil and the liquid natural gas (LNG). Therefore, the oil spill related risk assessment and the response advice is an issue of high priority in this ecologically very sensitive marine area. As stated by Schei and Brubaker [6] certain marine areas in the Okhotsk Sea already may be indicated possibly needing special environmental coverage related to international shipping due to their sensitivity encompassing but not to be limited to the grey whale habitats, productive fishing grounds, the eastern shore of Sakhalin, the Tatar Strait, and zones around offshore platforms. The same concerns are valid also for the Hokkaido Island ecologically extremely valuable and sensitive coastal sea areas.
Figure 4. AIS data for the La Perouse (Soya) Strait (2009.06.01 – 2009.06.30) Oil spill scenario modelling Gulf of Finland
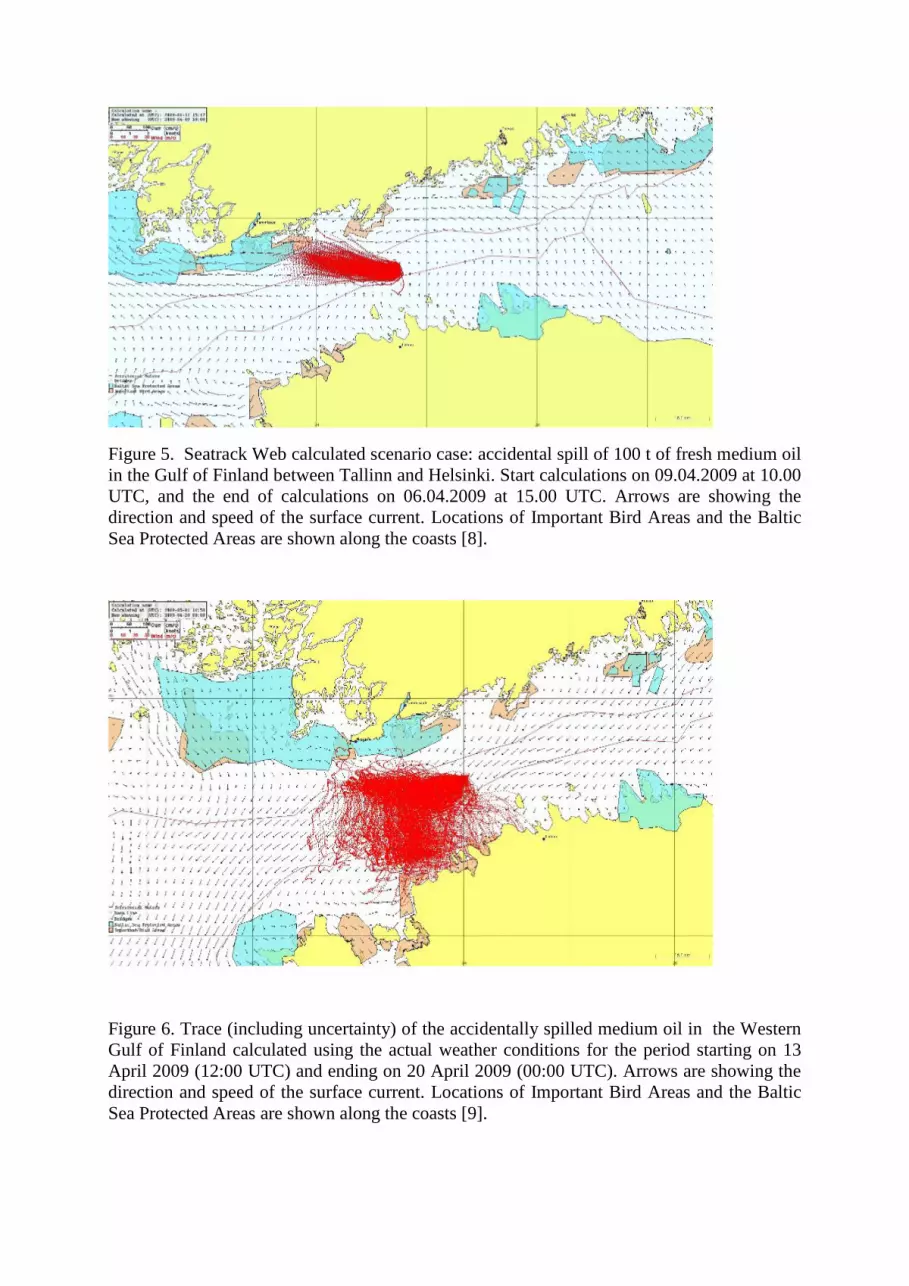
There are some publications on the oil spill scenario modeling for the Gulf of Finland [7-9] that are showing the considerable vulnerability of that water body to the potential oil spill related coastal sea areas pollution. Examples are given in Figures 5 and 6.
Figure 5. Seatrack Web calculated scenario case: accidental spill of 100 t of fresh medium oil in the Gulf of Finland between Tallinn and Helsinki. Start calculations on 09.04.2009 at 10.00 UTC, and the end of calculations on 06.04.2009 at 15.00 UTC. Arrows are showing the direction and speed of the surface current. Locations of Important Bird Areas and the Baltic Sea Protected Areas are shown along the coasts [8].
Figure 6. Trace (including uncertainty) of the accidentally spilled medium oil in the Western Gulf of Finland calculated using the actual weather conditions for the period starting on 13 April 2009 (12:00 UTC) and ending on 20 April 2009 (00:00 UTC). Arrows are showing the direction and speed of the surface current. Locations of Important Bird Areas and the Baltic Sea Protected Areas are shown along the coasts [9].
La Perouse (Soya) Strait
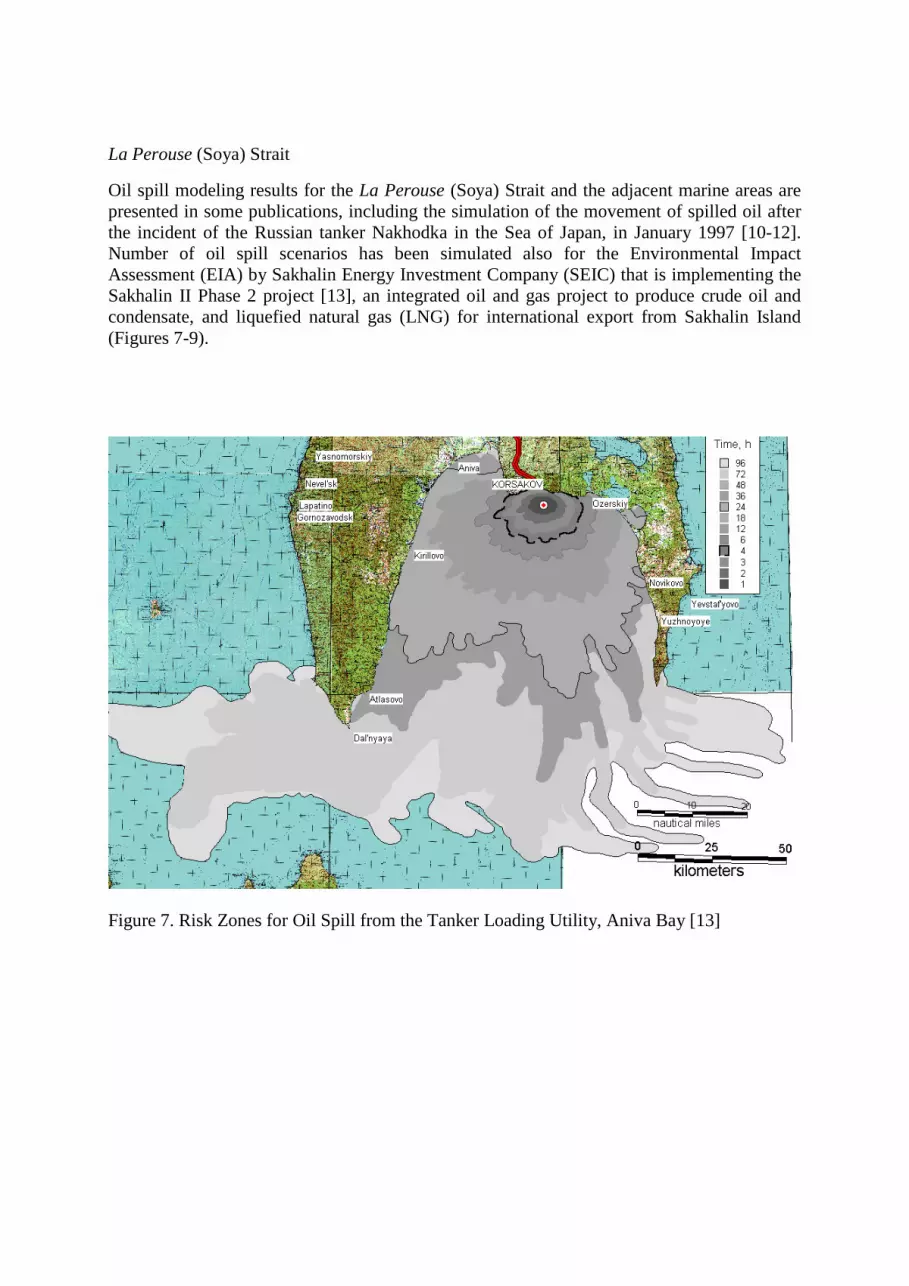
Oil spill modeling results for the La Perouse (Soya) Strait and the adjacent marine areas are presented in some publications, including the simulation of the movement of spilled oil after the incident of the Russian tanker Nakhodka in the Sea of Japan, in January 1997 [10-12]. Number of oil spill scenarios has been simulated also for the Environmental Impact Assessment (EIA) by Sakhalin Energy Investment Company (SEIC) that is implementing the Sakhalin II Phase 2 project [13], an integrated oil and gas project to produce crude oil and condensate, and liquefied natural gas (LNG) for international export from Sakhalin Island (Figures 7-9).
Figure 7. Risk Zones for Oil Spill from the Tanker Loading Utility, Aniva Bay [13]
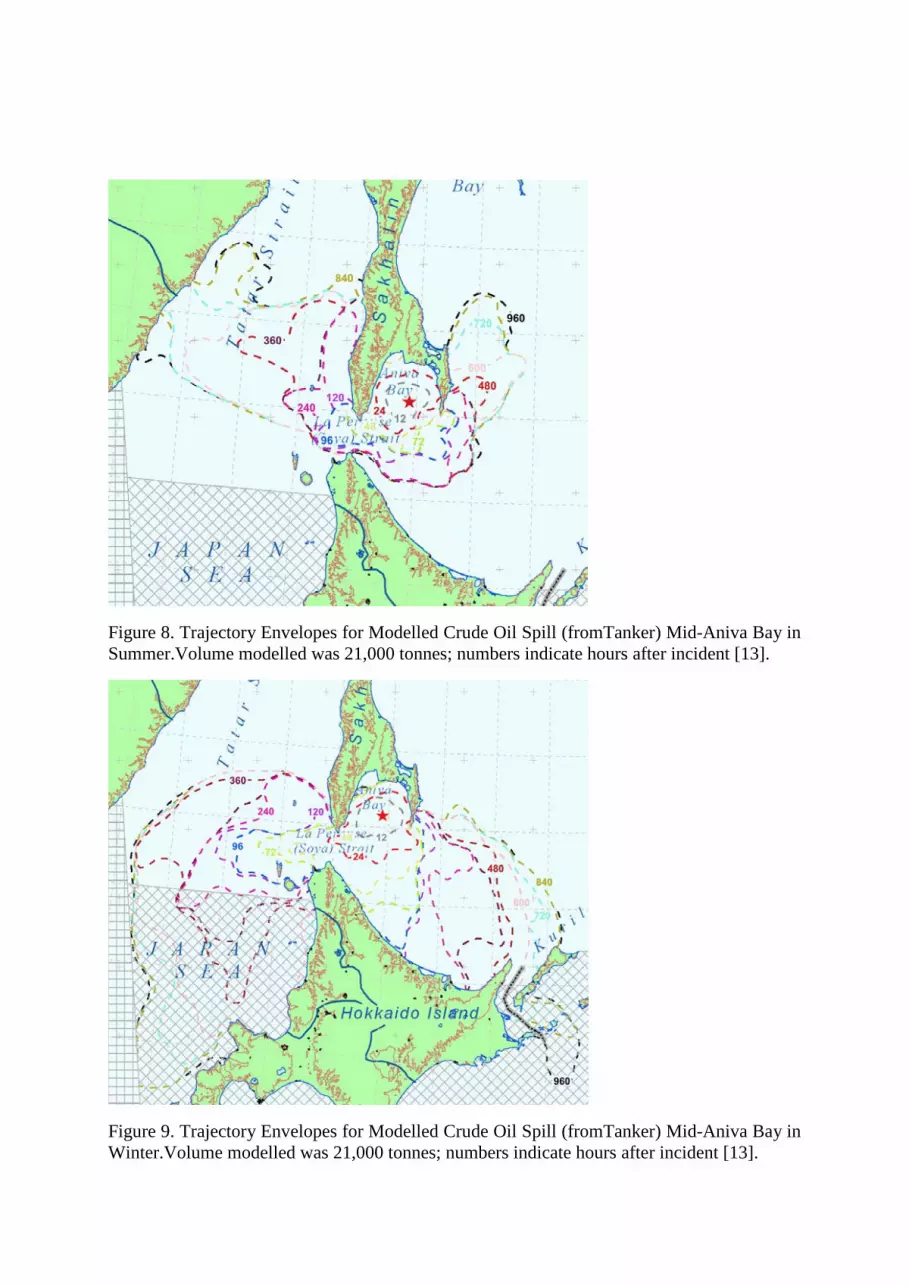
Figure 8. Trajectory Envelopes for Modelled Crude Oil Spill (fromTanker) Mid-Aniva Bay in Summer.Volume modelled was 21,000 tonnes; numbers indicate hours after incident [13].
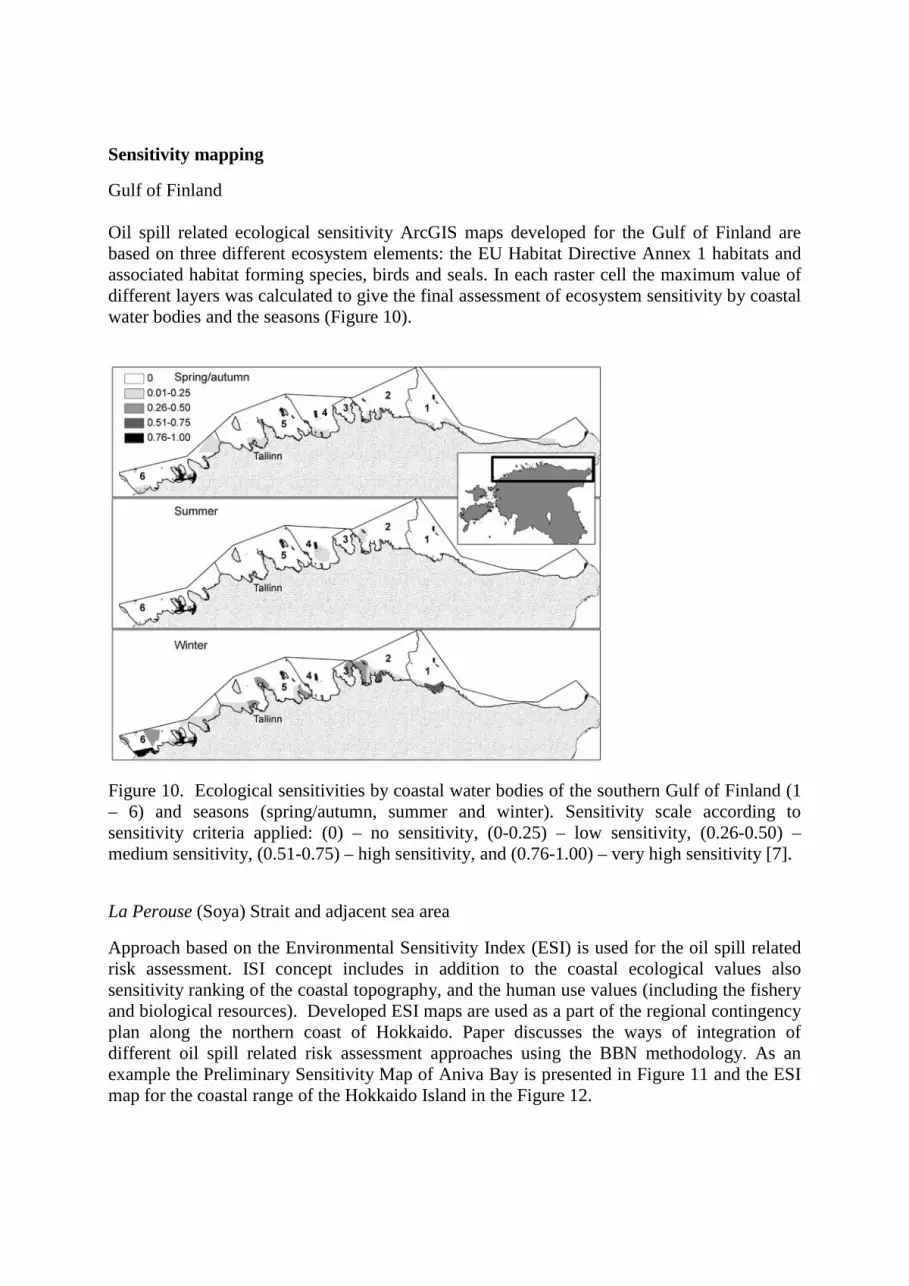
Figure 9. Trajectory Envelopes for Modelled Crude Oil Spill (fromTanker) Mid-Aniva Bay in Winter.Volume modelled was 21,000 tonnes; numbers indicate hours after incident [13].
Sensitivity mapping
Gulf of Finland Oil spill related ecological sensitivity ArcGIS maps developed for the Gulf of Finland are based on three different ecosystem elements: the EU Habitat Directive Annex 1 habitats and associated habitat forming species, birds and seals. In each raster cell the maximum value of different layers was calculated to give the final assessment of ecosystem sensitivity by coastal water bodies and the seasons (Figure 10).
Figure 10. Ecological sensitivities by coastal water bodies of the southern Gulf of Finland (1 – 6) and seasons (spring/autumn, summer and winter). Sensitivity scale according to sensitivity criteria applied: (0) – no sensitivity, (0-0.25) – low sensitivity, (0.26-0.50) – medium sensitivity, (0.51-0.75) – high sensitivity, and (0.76-1.00) – very high sensitivity [7].
La Perouse (Soya) Strait and adjacent sea area
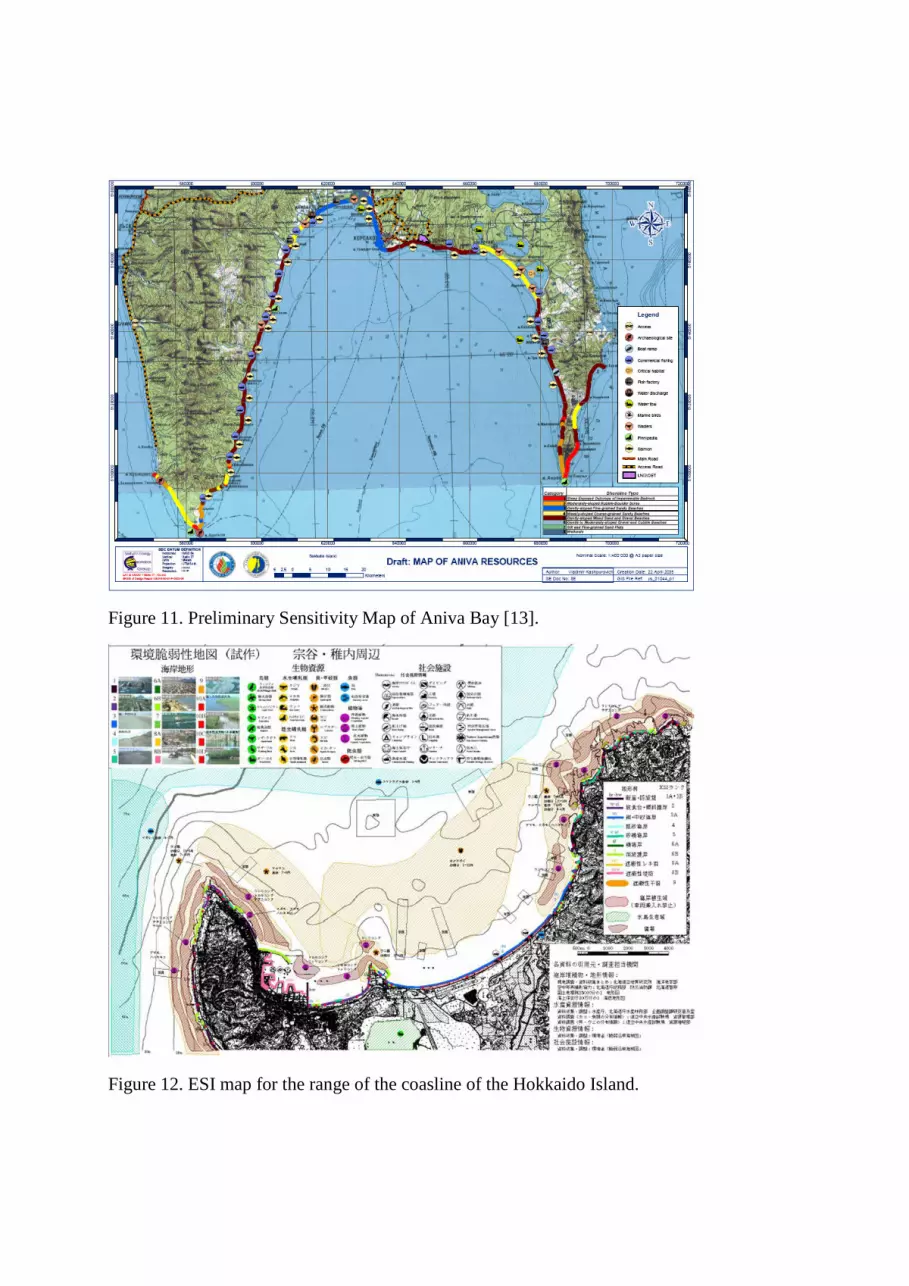
Approach based on the Environmental Sensitivity Index (ESI) is used for the oil spill related risk assessment. ISI concept includes in addition to the coastal ecological values also sensitivity ranking of the coastal topography, and the human use values (including the fishery and biological resources). Developed ESI maps are used as a part of the regional contingency plan along the northern coast of Hokkaido. Paper discusses the ways of integration of different oil spill related risk assessment approaches using the BBN methodology. As an example the Preliminary Sensitivity Map of Aniva Bay is presented in Figure 11 and the ESI map for the coastal range of the Hokkaido Island in the Figure 12.
Figure 11. Preliminary Sensitivity Map of Aniva Bay [13].
Figure 12. ESI map for the range of the coasline of the Hokkaido Island.
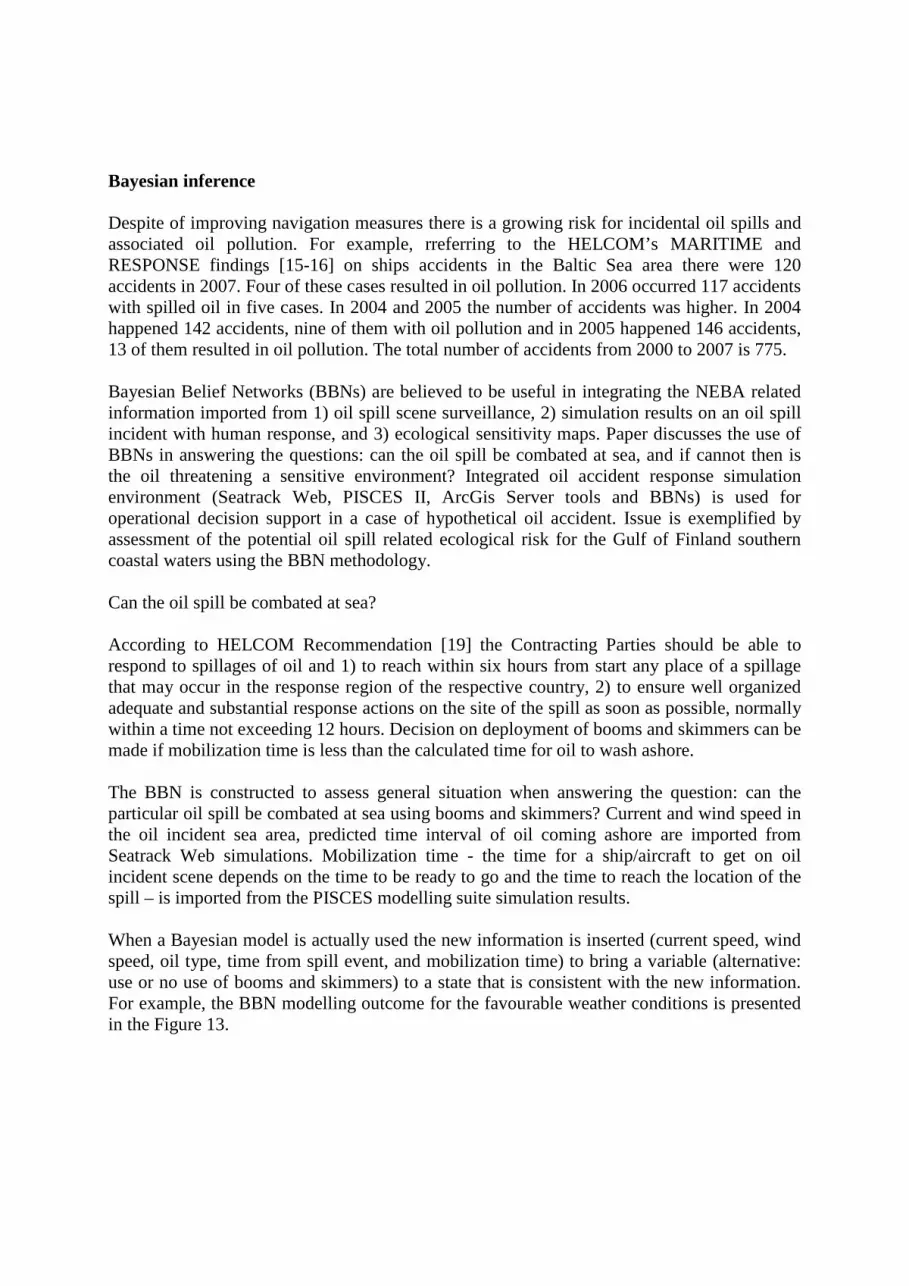
Bayesian inference Despite of improving navigation measures there is a growing risk for incidental oil spills and associated oil pollution. For example, rreferring to the HELCOM’s MARITIME and RESPONSE findings [15-16] on ships accidents in the Baltic Sea area there were 120 accidents in 2007. Four of these cases resulted in oil pollution. In 2006 occurred 117 accidents with spilled oil in five cases. In 2004 and 2005 the number of accidents was higher. In 2004 happened 142 accidents, nine of them with oil pollution and in 2005 happened 146 accidents, 13 of them resulted in oil pollution. The total number of accidents from 2000 to 2007 is 775. Bayesian Belief Networks (BBNs) are believed to be useful in integrating the NEBA related information imported from 1) oil spill scene surveillance, 2) simulation results on an oil spill incident with human response, and 3) ecological sensitivity maps. Paper discusses the use of BBNs in answering the questions: can the oil spill be combated at sea, and if cannot then is the oil threatening a sensitive environment? Integrated oil accident response simulation environment (Seatrack Web, PISCES II, ArcGis Server tools and BBNs) is used for operational decision support in a case of hypothetical oil accident. Issue is exemplified by assessment of the potential oil spill related ecological risk for the Gulf of Finland southern coastal waters using the BBN methodology. Can the oil spill be combated at sea? According to HELCOM Recommendation [19] the Contracting Parties should be able to respond to spillages of oil and 1) to reach within six hours from start any place of a spillage that may occur in the response region of the respective country, 2) to ensure well organized adequate and substantial response actions on the site of the spill as soon as possible, normally within a time not exceeding 12 hours. Decision on deployment of booms and skimmers can be made if mobilization time is less than the calculated time for oil to wash ashore. The BBN is constructed to assess general situation when answering the question: can the particular oil spill be combated at sea using booms and skimmers? Current and wind speed in the oil incident sea area, predicted time interval of oil coming ashore are imported from Seatrack Web simulations. Mobilization time - the time for a ship/aircraft to get on oil incident scene depends on the time to be ready to go and the time to reach the location of the spill – is imported from the PISCES modelling suite simulation results. When a Bayesian model is actually used the new information is inserted (current speed, wind speed, oil type, time from spill event, and mobilization time) to bring a variable (alternative: use or no use of booms and skimmers) to a state that is consistent with the new information. For example, the BBN modelling outcome for the favourable weather conditions is presented in the Figure 13.
Figure 13. Low current < 0.34 m/s, and a calm wind < 2 m/s. Mobilization time is less than time for oil to wash ashore. Use of booms and skimmers is efficient with probability of 0.86, and inefficient with probability of 0.14 [8].
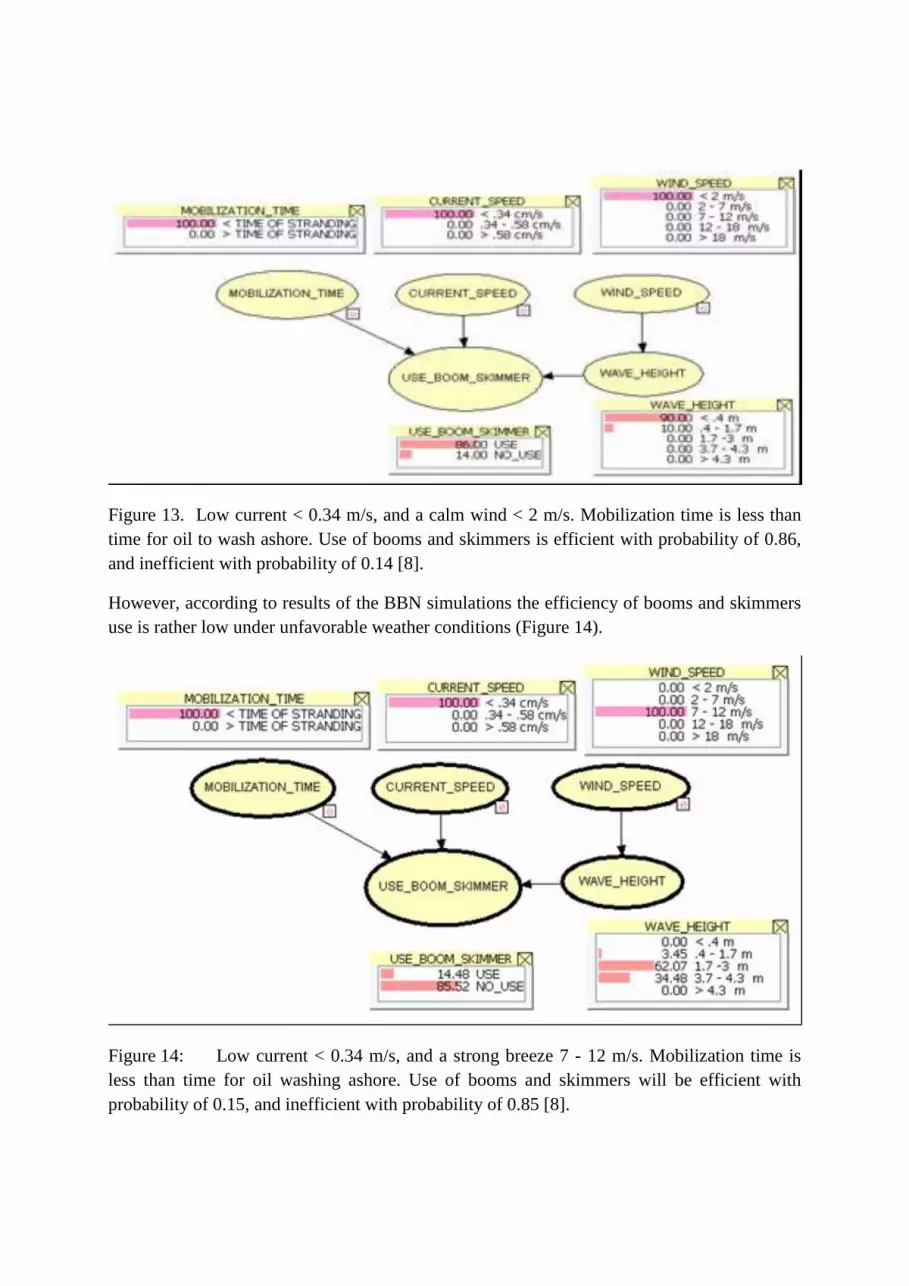
However, according to results of the BBN simulations the efficiency of booms and skimmers use is rather low under unfavorable weather conditions (Figure 14).
Figure 14: Low current < 0.34 m/s, and a strong breeze 7 - 12 m/s. Mobilization time is less than time for oil washing ashore. Use of booms and skimmers will be efficient with probability of 0.15, and inefficient with probability of 0.85 [8].
Is the oil threatening a sensitive resource?
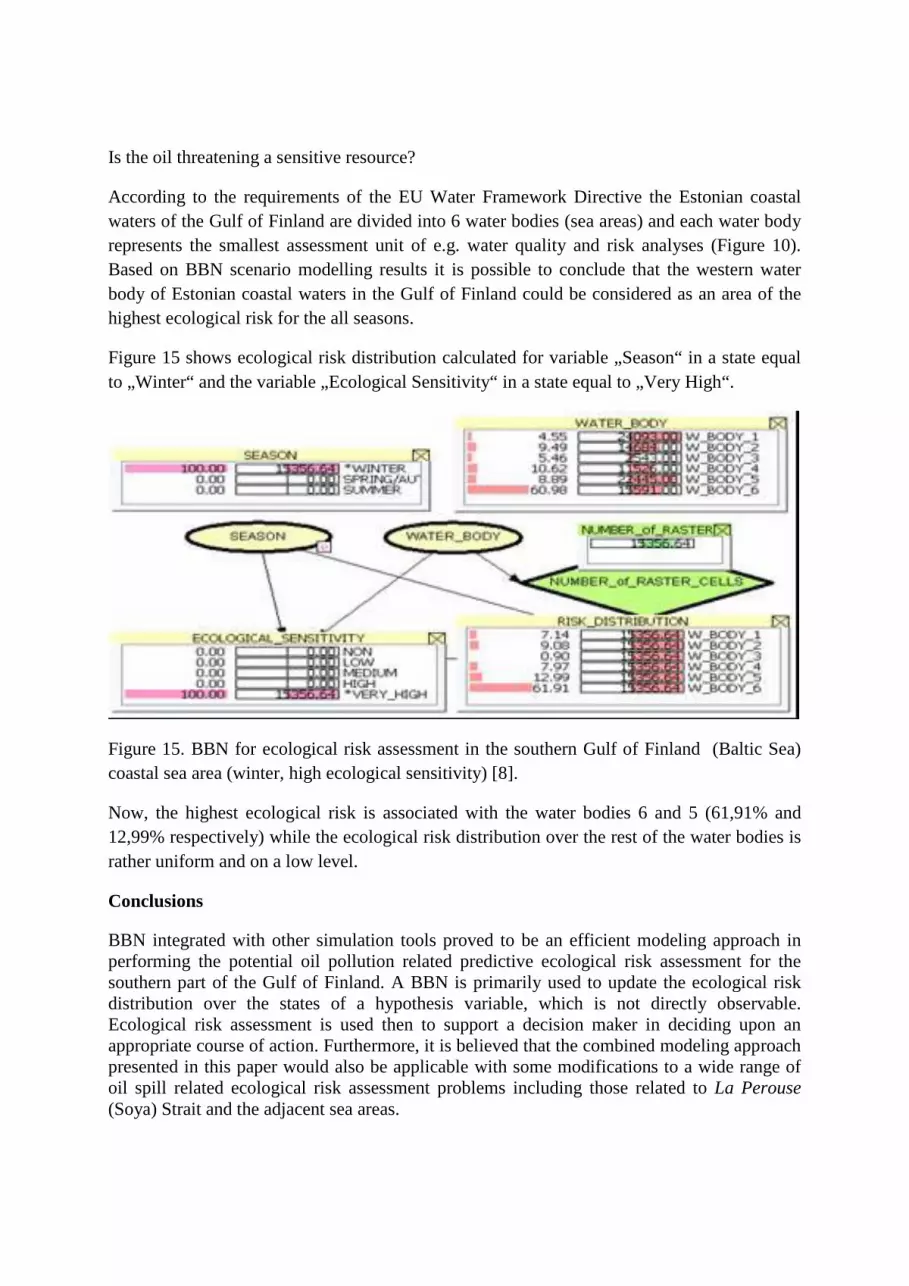
According to the requirements of the EU Water Framework Directive the Estonian coastal waters of the Gulf of Finland are divided into 6 water bodies (sea areas) and each water body represents the smallest assessment unit of e.g. water quality and risk analyses (Figure 10). Based on BBN scenario modelling results it is possible to conclude that the western water body of Estonian coastal waters in the Gulf of Finland could be considered as an area of the highest ecological risk for the all seasons.
Figure 15 shows ecological risk distribution calculated for variable „Season“ in a state equal to „Winter“ and the variable „Ecological Sensitivity“ in a state equal to „Very High“.
Figure 15. BBN for ecological risk assessment in the southern Gulf of Finland (Baltic Sea) coastal sea area (winter, high ecological sensitivity) [8].
Now, the highest ecological risk is associated with the water bodies 6 and 5 (61,91% and 12,99% respectively) while the ecological risk distribution over the rest of the water bodies is rather uniform and on a low level.
Conclusions
BBN integrated with other simulation tools proved to be an efficient modeling approach in performing the potential oil pollution related predictive ecological risk assessment for the southern part of the Gulf of Finland. A BBN is primarily used to update the ecological risk distribution over the states of a hypothesis variable, which is not directly observable. Ecological risk assessment is used then to support a decision maker in deciding upon an appropriate course of action. Furthermore, it is believed that the combined modeling approach presented in this paper would also be applicable with some modifications to a wide range of oil spill related ecological risk assessment problems including those related to La Perouse (Soya) Strait and the adjacent sea areas.
Acknowledgements The study was supported by the Estonian target financing programmes SF0180104s08 and SF0180013s08. Research was also supported by the Ministry of Education, Science, Sports and Culture, Grant-in-Aid for Specific Research type B. No. 19310110 (Research Representative Nobuhiro Sawano), and by the same grant of Grant-in-Aid for Specific Research type B. No. 21310111, (Research Representative Seiichi Hamada). References [1] Kuronen, J., Helminen R., Lehikoinen A., Tapaninen U. 2008. Maritime transportation in the Gulf of Finland in 2007 and in 2015. University of Turku. Turku, 114 p. [2] Baltic Pilot Volume III: Gulf of Finland, Gulf of Bothnia, Aland Islands / United Kingdom Hydrographic Office. Tenth edition. Taunton, 521 p., 2006. [3] Ships’ Routeing / IMO. Ninth edition. London: William Clowes Ltd. 2008. [4] International Regulations for Preventing Collisions at Sea – 1972 / Veeteede Amet. Tallinn, 176 p., 2007. [5] Mariners’ Routeing Guide. / Bundesamt Für Seeschifffahrt Und Hydrographie. Hamburg, Rostock, 2008. [6] Schei, P.J., Brubaker, R.D. Suggestions for a Conceptual Design of an Okhotsk Sea Environmental Regime – Comparison with the Barents Sea. In Kitagawa, Hiromitsu (ed), New Era in Far East Russia & Asia. Tokyo, Ocean Policy Research Foundation, 2006, pp. 259-276. [7] Aps, R., Fetissov, M., Herkül, K., Kotta, J., Leiger, R., Mander, Ü., Suursaar, Ü. (2009). Bayesian inference for predicting potential oil spill related ecological risk. M. Guarascio, C.A. Brebbia, F. Garzia (Eds.). Safety and Security Engineering (149 - 159). UK: WIT Press. [8] Aps, R.; Herkül, K.; Kotta, J.; Kotta, I.; Kopti, M.; Leiger, R.; Mander, Ü.; Suursaar, Ü. (2009). Bayesian inference for oil spill related Net Environmental Benefit Analysis. C.A.Brebbia, G.Benassai, G.R.Rodriguez (Eds.). Coastal Processes (235 - 246). Southampton, Boston: WIT Press. [9] Leiger, R.; Aps, R.; Fetissov, M.; Herkül, K.; Kopti, M.; Kotta, J.; Mander, Ü.; Suursaar, Ü. (2009). Oil accident response simulation: allocation of potential places of refuge. C.A. Brebbia, G. Benassai, G.R. Rodriguez (Eds.). Coastal Processes (247 - 258). Southampton, Boston: WIT Press.
[10] Kochergin, I.E., Bogdanovsky, A.A., Budaeva, V.D., Makarov, V.G., Mishukov, V.F., Ovsienko, S.N., Putov, V.F., Reitsema, L.A., Sciallabba, J.W., Sergusheva, O.O., Yarosh, P.V. Modeling of oil spills for the shelf conditions of northeastern Sakhalin (pp. 123-130). In: Proceedings of the Second PICES Workshop on the Okhotsk Sea and Adjacent Areas [Nemuro, Japan, November 9-12, 1998] Lobanov, V.B. and Nagata, Y. and Riser, S.C., (eds). (1999) Proceedings of the Second PICES Workshop on the Okhotsk Sea and Adjacent Areas [Nemuro, Japan, November 9-12, 1998]. ,Sidney, British Columbia. North Pacific Marine Science Organization (PICES) , (PICES Scientific Report ,12 ). [11] Varlamov, S.M., Jong-Hwan Yoon, Naoki Hirose, Hideyuki Kawamura, Ken Shiohara. Simulation of the oil spill processes in the Sea of Japan with regional ocean circulation model. J Mar Sci Technol (1999) 4. Pp. 94–107. [12] H. Kawamura, T. Kobayashi, N. Hirose, T. Ito & O. Togawa. 2006. Oil spill simulation in the Japan Sea. In: C.A. Brebbia, Environmental Problems in Coastal Regions VI: Including Oil and Chemical Spill Studies. Wessex Institute of Technology, UK. [13] Sakhalin Energy Investment Company (SEIC). 2005. Environmental Impact Assessment (EIA) for the Sakhalin II Phase 2 project. EIA Addendum: Chapter 2 Oil Spill Response, 116 p. [14] Chen, Y.-C., O’Yang, L.-J. 2006. The application of ESI maps with the GIS technique to coastal oil-spill cleanups in Taiwan. . In: C.A. Brebbia, Environmental Problems in Coastal Regions VI: Including Oil and Chemical Spill Studies. Wessex Institute of Technology, UK. [15] HELCOM MARITIME. http://www.helcom.fi/groups/maritime/ en_GB/main/ (29.04.2009). [16] HELCOM RESPONSE. http://www.helcom.fi/groups/response/ en_GB/main/ (29.04.2009). [17] HELCOM. Development of national ability to respond to spillages of oil and other harmful substances. HELCOM Recommendation 11/13. 1990.