Bayesian inference for predicting potential oil spill related ecological risk
R. Aps1, M. Fetissov1, K. Herkül1, J. Kotta1, R. Leiger1, Ü. Mander2 & Ü. Suursaar2 1Estonian Marine Institute, University of Tartu, Estonia 2Institute of Ecology and Earth Sciences, University of Tartu, Estonia
Abstract
The aim of this paper is to assess the potential oil spill related ecological risk for the southern Gulf of Finland coastal waters using the Bayesian Belief Network (BBN) methodology. The BBN prior probabilities were obtained from knowledge on spatial variability in the sensitivity of coastal ecosystem of the southern Gulf of Finland. The sensitivity data represented the three different ecosystem elements: the EU Habitat Directive Annex 1 habitats and associated habitat forming species, the EU Birds Directive Annex 1 birds and seals. Information on bird, seal and habitat layers were integrated into a single measure of ecosystem sensitivity. For this purpose the maximum value of different layers was calculated in each raster cell. The scenario modelling results showed that the western Gulf of Finland could be considered as an area of the highest ecological risk for the all seasons. Keywords: Bayesian inference, oil spill, ecological sensitivity, spatial, ecological risk assessment.
1 Introduction
The Gulf of Finland (Baltic Sea) is a sensitive brackish water area with a unique nature and environment. At the same time the Gulf of Finland has some of the busiest oil shipping routes in the world. In 2000 the total amount of oil transported on the Gulf was 40 million tons; in 2004 about 100 million tons and it may reach 200 million tons by the year 2010. Despite improving navigation measures, there is a growing risk for incidental oil spills and associated oil spill related ecological risk.
Oil spill accident history and simulations show that once the oil spill at sea has occurred, it is almost impossible to prevent it from reaching ashore. Due to immediate reaction to toxicity, acute mortality of benthic invertebrates, fish, birds and mammals occurs when the species come in direct contact with the oil [1–3]. On the other hand, algae and higher plants seem to be much more resistant to acute oil toxicity [3–5]. This immediate reaction of toxicity persists shortly due to the high recolonization potential of the prevailing species in the Gulf of Finland area [6]. However, when certain bird species are affected the recoveries may last decades. Besides, the long-term consequences are caused by indirect effects of habitat degradation due to oil spill and the effects are reversed only if the habitats have fully recovered. Earlier studies have suggested that the oiled surfaces may suppress the formation of filamentous algal community [3, 7] and thus, significantly affect the annual succession of benthic assemblages. Poorer coverage of macrophytes also has indirect effects on associated invertebrates, fish and birds that rely on macrophytes as food and habitat, and on invertebrates as a food [8, 9]. Thus, the assessment of ecosystem sensitivity to oil spill should incorporate the immediate reaction of toxicity as well as its indirect long-term consequences. Bayesian Belief Networks (BBNs) are the modelling tools that facilitate the development of formal representations of a problem or question. Most often these are cast in numerical terms but may also deal with qualitative variables. According to Hayes [10] the use of Bayesian (as opposed to classical) techniques in ecological risk assessment has recently attracted considerable attention. The author explains in his comprehensive overview on the application of the BBNs to ecological risk assessment why Bayesian methods might be attractive to risk analysts: (1) they are able to employ subjective interpretations of probability, and (2) they immediately direct the analyst to the full distributional qualities of parameter uncertainty, through the posterior distribution function. The aim of this paper is to assess the potential oil spill related ecological risk for the southern Gulf of Finland coastal waters using the BBN methodology on the data of integrated ecological sensitivity.
2 Ecosystem sensitivity
This chapter describes a methodology to assess the ecological sensitivity and recovery of oil pollution to site-specific coastal ecosystems. The methodology is based on the requirements of the EU Habitat Directive and the EU Birds directive. All these directives are given an equal weight in the sensitivity assessment procedure. The description of spatial variability in physical environment and communities is important when assessing the sensitivity of coastal ecosystems because this variability strongly modulates the sensitivity of different ecosystem elements. Earlier studies on community ecology and different disturbances in the Estonian coastal range have indicated that (1) species interactions are not very
important but rather abiotic disturbances (e.g. levels of oil spills, exposure) affect the succession of coastal ecosystems, (2) only the loss of the keystone plant species has a significant effect on benthic communities, namely through the effects of habitat modification, (3) impacts are stronger on less exposed areas and where the key habitat building macrophytes had a high density, and (4) together with the losses of the keystone macroalgal species the habitats for associated invertebrates, fish and bird species are altered resulting in notable impoverishment in these ecosystem elements [6, 11–15]. Owing to the significance of spatial component Geographical Information Systems (GIS) was considered as a promising tool to integrate geo-referenced abiotic and biotic data in ecological sensitivity assessment. With the rise of new powerful statistical techniques and GIS tools, the development of predictive habitat distribution models has rapidly increased in ecology. Such models are static and probabilistic in nature, since they statistically relate the geographical distribution of species or communities to their present environment. A wide array of models has been developed to cover aspects as diverse as biogeography, conservation biology, climate change research, and habitat or species management [16]. The EU Habitat Directive is a Community legislative instrument in the field of nature conservation that establishes a common framework for the conservation of wild animal and plant species and natural habitats of Community importance. It provides for the creation of a network of special areas of conservation, called Natura 2000, to “maintain and restore, at favourable conservation status, natural habitats and species of wild fauna and flora of Community interest”. Its Annex I list today 218 European natural habitat types, including 71 priorities (e.g. habitat types in danger of disappearance and whose natural range mainly falls within the territory of the European Union). Annex I is based on the hierarchical classification of European habitats developed by the CORINE Biotopes project 2 since that was the only existing classification at European level. In the southern part of the Gulf of Finland the following types of the EU Habitat Directive, Annex 1 habitats can be found: (1) sandbanks, which are slightly covered by sea water all the time (Type 1110), (2) mudflats and sandflats not covered by seawater at low tide (Type 1140), and (3) reefs (Type 1170). The spatial analysis was used to create maps on the spatial distribution of the EU Habitat Directive Annex 1 habitats in the southern Gulf of Finland. In order to predict the spatial cover of the Annex 1 habitats the following layers were used: (1) depth raster of sea area, (2) raster of seabed sediment type, and (3) coastline vector data set. As a method an overlay analysis using Map algebra tool in ArcInfo was used. As shown earlier the sensitivity of a habitat to oil spill is significantly related to the presence of the associated keystone macroalgal species. Therefore, the additional spatial models were generated to predict the distribution of the habitat forming macroalgal species within the Annex 1 habitats. The study area hosts three of such species groups: the brown alga Fucus vesiculosus, the eelgrass Zostera marina and a number of the charophyte species.
F. vesiculosus is the dominant macroalgal species in the Estonian coastal range. In recent years the biomass of the species has notably diminished at many localities. This decline was attributed to their lower competitiveness at higher nutrient concentrations and the shading effect by the filamentous algae combined with increased herbivory [17]. Offering habitat and food for many macroalgal and invertebrate species this species is recognized as one of the keystone species on reefs [8, 9]. Z. marina grows at its lower salinity tolerance limit in the Estonian coastal range. Yet the eelgrass is one of the most abundant macrophyte on sandbanks and is regarded as a key-species of this habitat. In the study area the distribution of eelgrass has been rarely studied and, thus, information on eelgrass communities is scarce and occasional [18]. Charophytes are a highly developed and diverse group of algae. They are widely distributed in the Estonian coastal range. In recent decades species number, distribution area and biomass of charophytes have significantly declined. This decline has been attributed to increased nutrient loads resulting in higher productivity of phytoplankton, epiphytic algae and angiosperms and indirectly resulting in elevated grazing of mesoherbivores on charophytes [12]. In order to model the distribution of the key macrophyte species the following layers were used: depth raster of sea area, rasters of seabed slope of various spatial scales, raster of seabed sediment type, coastline vector data set, point data on the presence/absence or biomass of phytobenthic species in the sampling stations. Prior to analysis different datasets on phytobenthos and benthic invertebrate monitoring were pooled together (available at the database of the Estonian Marine Institute). The quality of all available information was cross-checked and then pooled to a single geodatabase. Only recent (less than 10 year old) information was used in the analysis. The resulting layers were the maps of probability occurrence of the key macrophyte species F. vesiculosus, Z. marina and charophytes in the southern Gulf of Finland. As a method the generalized regression analysis and spatial prediction (GRASP) in S-PLUS was used. Probability of the presence of a phytobenthic species in each grid point was calculated using GRASP extension for statistical software S-Plus. The methods are very useful for this type of habitat modelling and the results are not very sensitive to the quality of existing data. In order to obtain the high-quality small-scale habitat maps it is essential to include into the prediction model only these environmental variables of which we have sufficient information on their variability both at small and large scale. It is essential to get an overview on the factors that potentially affect the distribution of the modelled species. If possible, then only these key environmental factors should be included to the model. It is known that processes affect ecosystem simultaneously at various spatial scales resulting in different spatial patterns of abiotic and biotic environment [19, 20]. In the Gulf of Finland changes in physical environment explain large part of the variability in benthic communities in the study area. Thus, it is therefore rewarding to seek the relationship between phytobenthos and available physical environment at multitude of spatial scales. For example bottom slopes at various
spatial scales characterize different abiotic processes operating at different spatial scales and thus may describe better the distribution of phytobenthic species than depth or slope value at a single spatial scale alone. Seabirds and seals require routine contact with the sea surface and thus have high contamination risk from floating oil. Those bird species that were listed in the EU Birds Directive Annex 1 were selected into the sensitivity analyses. Additionally, we included the common eider (Somateria mollissima) here as the abundance of the species had notably declined in recent years and the species is known to be very sensitive to oil spills. The sensitivity of bird species to oil spills was assessed by the oil vulnerability index (OVI). The OVI index above 60 refers that species is highly sensitive, the values between 30 and 60 shows that the species are moderately affected by a spill and the values below 30 indicates that oil has little effect on the species. The species that fitted the selection criteria and were present in the southern coastal areas of the Gulf of Finland were as follows: Bewick's swan or tundra swan (Cygnus columbianus) (low sensitivity), whooper swan (Cygnus cygnus) (low sensitivity), Steller's eider (Polysticta stelleri) (high sensitivity), merganser (Mergus albellus) (medium sensitivity), common eider (S. mollissima) (high sensitivity). In the southern Gulf of Finland seals are represented by grey seal (H. grypus) and ringed seal (P. hispida). The selected areas represent those where seals were observed during airborne monitoring. Information on the feeding grounds of seals is currently limited. The sensitivity maps were based on three different ecosystem elements: the Annex 1 habitats and associated habitat forming species, birds and seals. The values of the Annex 1 habitats were weighed according to the presence or absence of the habitat forming species within habitat. F. vesiculosus is considered as a key species in reef ecosystem, Z. marina in sandbanks and, charophytes in mudflats and sandflats respectively. When the key species was not present within valuable habitat then the value of a raster cell was set as 0.5. The presence of the key species within key habitat gave the cell value 1. As the distribution pattern of birds is highly seasonal the values of ecosystem sensitivity were computed for different seasons. Seasonal occurrence of bird species was weighed according to their sensitivity to oil pollution. Those species that had low sensitivity to oil pollution were multiplied by 0.33, those that were moderately impacted by oil spills were multiplied by 0.66 and those that were heavily decimated by oil spills were multiplied by 1. The obtained index shows the sensitivity of sea areas to oil spills in terms of birds. The index varies between 0 and 1; values close to 1 are indicating highly sensitive areas. Information on bird, seal and habitat layers were combined into the integrated maps of ecosystem sensitivity. In each raster cell the maximum value of different layers was calculated to give the final assessment of ecosystem sensitivity (Figure 1).
3 Ecological risk assessment
Potential oil pollution related ecological risk assessment for the southern Gulf of Finland coastal sea areas is of critical importance in order to support decisions whether or not a response is necessary or what kind and extent of response is
appropriate. Assessment of the threat and predicting the damage is difficult because of considerable uncertainty which usually surrounds a spill. However, uncertainty is considerably decreasing as soon as ecological sensitivity maps become available. According to the requirements of the EU Water Framework Directive the Estonian coastal waters of the Gulf of Finland are divided into 6 water bodies (sea areas) and each water body represents the smallest assessment unit of e.g. water quality and risk analyses. A process of BBN development comprised the several stages. First of all the general relationships between the variables of interest, in terms of the relevance of one variable to others were taken into account. This resulted in a graphical representation capturing the conditional dependencies in a qualitative i.e. non-numerical fashion. Further the links in the graphical representation were then assigned numbers representing conditional probabilities. This allows computation of probabilities that are of interest. And finally, the lessons learnt were incorporated into the model and any discrepancies with empirical data or other conflicts were either explained or removed.
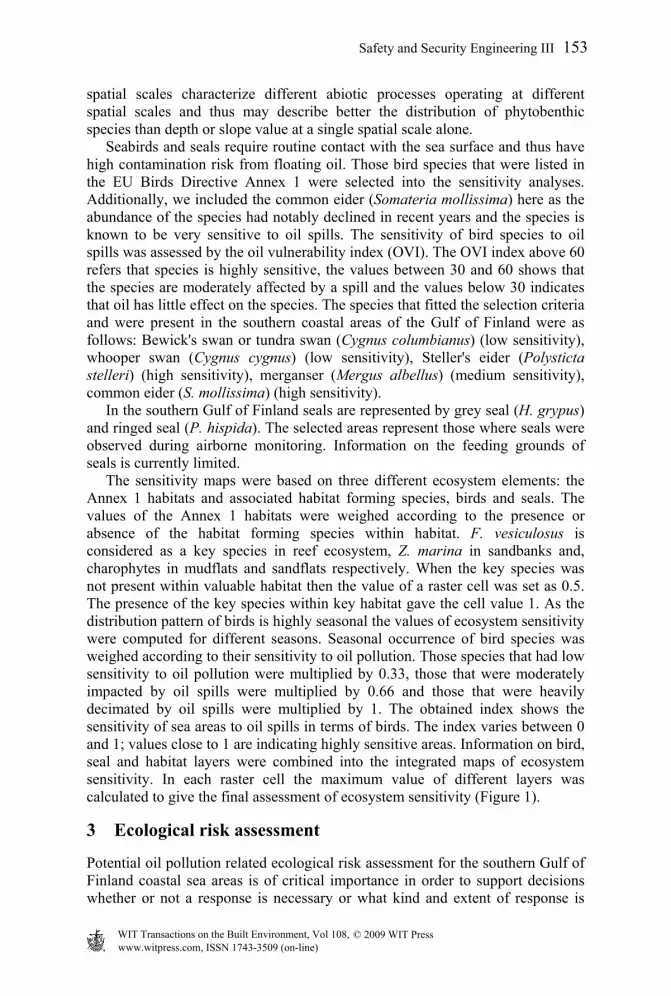
Figure 1: Ecological sensitivities by coastal water bodies of the southern Gulf of Finland (1 – 6) and seasons (spring/autumn, summer and winter). Sensitivity scale according to sensitivity criteria applied: (0) – no sensitivity, (0-0.25) – low sensitivity, (0.26-0.50) – medium sensitivity, (0.51-0.75) – high sensitivity, and (0.76-1.00) – very high sensitivity.
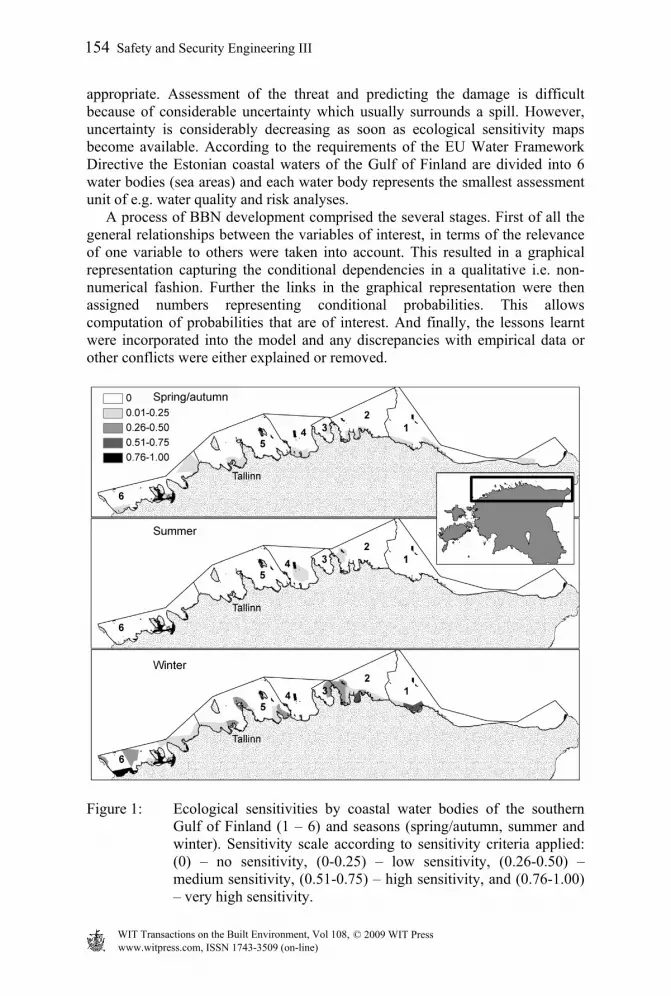
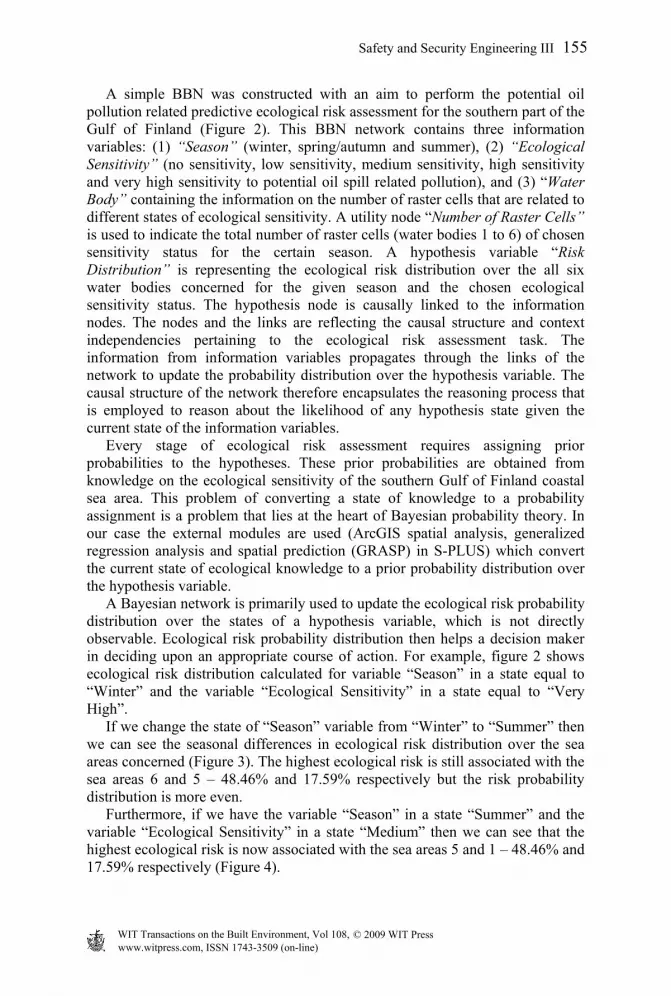
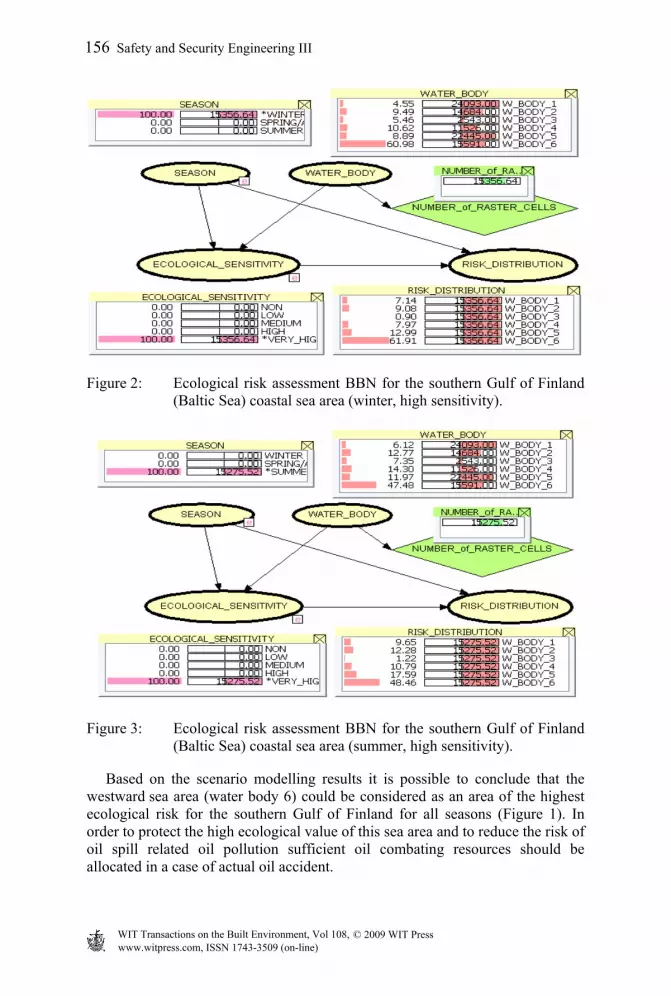
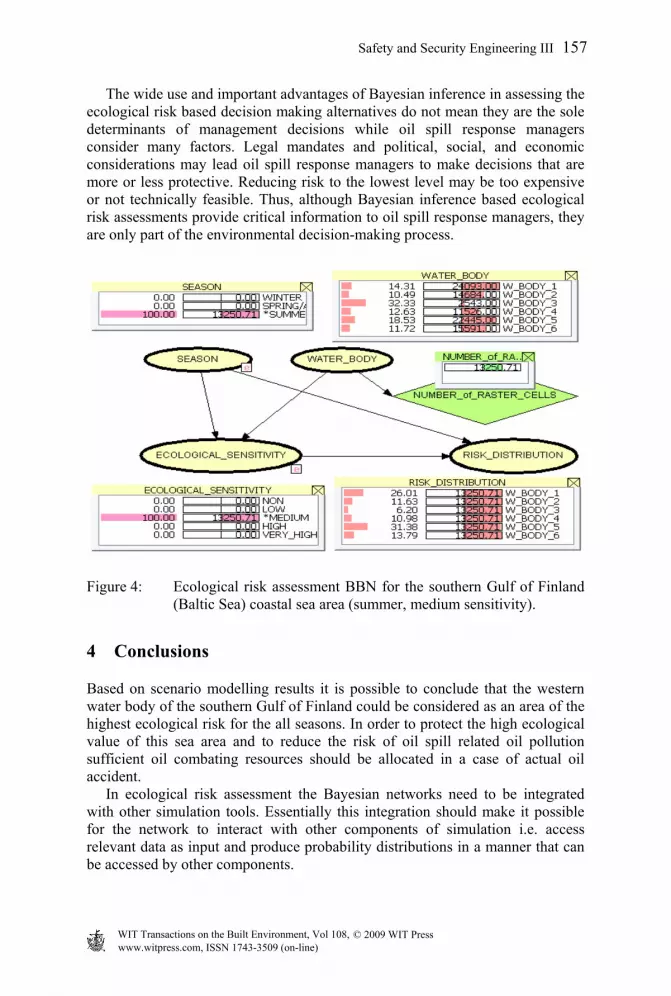
A simple BBN was constructed with an aim to perform the potential oil pollution related predictive ecological risk assessment for the southern part of the Gulf of Finland (Figure 2). This BBN network contains three information variables: (1) “Season” (winter, spring/autumn and summer), (2) “Ecological Sensitivity” (no sensitivity, low sensitivity, medium sensitivity, high sensitivity and very high sensitivity to potential oil spill related pollution), and (3) “Water Body” containing the information on the number of raster cells that are related to different states of ecological sensitivity. A utility node “Number of Raster Cells” is used to indicate the total number of raster cells (water bodies 1 to 6) of chosen sensitivity status for the certain season. A hypothesis variable “Risk Distribution” is representing the ecological risk distribution over the all six water bodies concerned for the given season and the chosen ecological sensitivity status. The hypothesis node is causally linked to the information nodes. The nodes and the links are reflecting the causal structure and context independencies pertaining to the ecological risk assessment task. The information from information variables propagates through the links of the network to update the probability distribution over the hypothesis variable. The causal structure of the network therefore encapsulates the reasoning process that is employed to reason about the likelihood of any hypothesis state given the current state of the information variables. Every stage of ecological risk assessment requires assigning prior probabilities to the hypotheses. These prior probabilities are obtained from knowledge on the ecological sensitivity of the southern Gulf of Finland coastal sea area. This problem of converting a state of knowledge to a probability assignment is a problem that lies at the heart of Bayesian probability theory. In our case the external modules are used (ArcGIS spatial analysis, generalized regression analysis and spatial prediction (GRASP) in S-PLUS) which convert the current state of ecological knowledge to a prior probability distribution over the hypothesis variable. A Bayesian network is primarily used to update the ecological risk probability distribution over the states of a hypothesis variable, which is not directly observable. Ecological risk probability distribution then helps a decision maker in deciding upon an appropriate course of action. For example, figure 2 shows ecological risk distribution calculated for variable “Season” in a state equal to “Winter” and the variable “Ecological Sensitivity” in a state equal to “Very High”. If we change the state of “Season” variable from “Winter” to “Summer” then we can see the seasonal differences in ecological risk distribution over the sea areas concerned (Figure 3). The highest ecological risk is still associated with the sea areas 6 and 5 – 48.46% and 17.59% respectively but the risk probability distribution is more even. Furthermore, if we have the variable “Season” in a state “Summer” and the variable “Ecological Sensitivity” in a state “Medium” then we can see that the highest ecological risk is now associated with the sea areas 5 and 1 – 48.46% and 17.59% respectively (Figure 4).
Figure 2: Ecological risk assessment BBN for the southern Gulf of Finland (Baltic Sea) coastal sea area (winter, high sensitivity).
Figure 3: Ecological risk assessment BBN for the southern Gulf of Finland (Baltic Sea) coastal sea area (summer, high sensitivity).
Based on the scenario modelling results it is possible to conclude that the westward sea area (water body 6) could be considered as an area of the highest ecological risk for the southern Gulf of Finland for all seasons (Figure 1). In order to protect the high ecological value of this sea area and to reduce the risk of oil spill related oil pollution sufficient oil combating resources should be allocated in a case of actual oil accident.
The wide use and important advantages of Bayesian inference in assessing the ecological risk based decision making alternatives do not mean they are the sole determinants of management decisions while oil spill response managers consider many factors. Legal mandates and political, social, and economic considerations may lead oil spill response managers to make decisions that are more or less protective. Reducing risk to the lowest level may be too expensive or not technically feasible. Thus, although Bayesian inference based ecological risk assessments provide critical information to oil spill response managers, they are only part of the environmental decision-making process.
Figure 4: Ecological risk assessment BBN for the southern Gulf of Finland (Baltic Sea) coastal sea area (summer, medium sensitivity).
4 Conclusions
Based on scenario modelling results it is possible to conclude that the western water body of the southern Gulf of Finland could be considered as an area of the highest ecological risk for the all seasons. In order to protect the high ecological value of this sea area and to reduce the risk of oil spill related oil pollution sufficient oil combating resources should be allocated in a case of actual oil accident. In ecological risk assessment the Bayesian networks need to be integrated with other simulation tools. Essentially this integration should make it possible for the network to interact with other components of simulation i.e. access relevant data as input and produce probability distributions in a manner that can be accessed by other components.
The study was also supported by the Estonian target financing programmes SF0180104s08 and SF0180013s08.
References
[1] Rice, S.D., Thomas, R.E., Carls, M.G., Heintz, R.A., Wertheimer, A.C., Murphy, M.L., Short, J.W., Moles, A. Impacts to pink salmon following the Exxon Valdez oil spill: persistence, toxicity, sensitivity, and controversy. Rev. Fish. Sci. 9, pp. 165-211, 2001.
[2] Peterson, C.H., Holland-Bartels, L. Nearshore vertebrate predators: constraints to recovery from oil pollution. Mar. Ecol. Prog. Ser. 241, pp. 235-236, 2002.
[3] Kotta, J., Martin, G., Aps, R. Sensitivity of benthic vegetation and invertebrate functional guilds to oil spills and its use in oil contingency management related negotiation processes. Proc. Estonian Acad. Sci. Biol. Ecol., 56, pp. 255–269, 2007.
[4] Highsmith, R.C., Rucker, T. L., Stekoll, M. S., Saupe, S. M., Lindeberg, M. R., Jenne, R. N. & Erickson, W. P. Impact of the Exxon Valdez oil spill on intertidal biota. American Fisheries Society Symposium, 18, pp. 212–237, 1996.
[5] Stekoll, M. S., Deysher, L. Recolonization and restoration of upper intertidal Fucus gardneri (Fucales, Phaeophyta) following the Exxon Valdez oil spill. Hydrobiologia, 326/327, pp. 311–316, 1996.
[6] Herkül, K., Kotta, J., Kotta, I., Orav-Kotta, H. Effects of physical disturbance, isolation and key macrozoobenthic species on community development, recolonization and sedimentation processes. Oceanologia, 48S, pp. 267–282, 2006.
[7] Stekoll, M. S. & Deysher, L. Response of the Dominant Alga Fucus gardneri (Silva) (Phaeophyceae) to the Exxon Valdez Oil Spill and Clean-up. Marine Pollution Bulletin, 40, pp. 1028-1041, 1996.
[8] Orav-Kotta, H., Kotta, J. Food and habitat choice of the isopod Idotea baltica in the northeastern Baltic Sea. Hydrobiologia, 514, pp. 79–85, 2004.
[9] Kotta, J., Orav-Kotta, H., Paalme, T., Kotta, I., Kukk, H. Seasonal changes in situ grazing of the mesoherbivores Idotea baltica and Gammarus oceanicus on the brown algae Fucus vesiculosus and Pylaiella littoralis in the central Gulf of Finland, Baltic Sea. Hydrobiologia, 554, pp. 117–125, 2006.
[10] Hayes, K. R. Bayesian statistical inference in ecological risk assessment. Crimp Technical Report (No.17), Centre for Research on Introduced Marine Pests, CSIRO, Hobart, Australia. 104 p. 1998.
[11] Kotta, J., Orav, H. Role of benthic macroalgae in regulating macrozoobenthic assemblages in the Väinameri (north-eastern Baltic Sea). Ann. Zool. Fennici, 38, pp. 163–171, 2001.
[12] Kotta, J., Simm, M., Kotta, I., Kanošina, I., Kallaste, K., Raid, T. Factors controlling long-term changes of the eutrophicated ecosystem of Pärnu Bay, Gulf of Riga. Hydrobiologia, 514, pp. 259–268, 2004.
[13] Lauringson, V., Kotta, J. Influence of the thin drift algal mats on the distribution of macrozoobenthos in Kõiguste Bay, NE Baltic Sea. Hydrobiologia, 554, pp. 97–105, 2006.
[14] Kotta, J., Lauringson, V., Kotta, I. Response of zoobenthic communities to changing eutrophication in the northern Baltic Sea. Hydrobiologia, 580, pp. 97–108, 2007.
[15] Kotta, J., Aps, R., Herkül, K. Predicting ecological resilience of marine benthic communities facing a high risk of oil spills. Environmental Problems in Coastal Regions VII, 99, pp. 101–110, 2008.
[16] Guisan, A. and Zimmermann, N.E. Predictive habitat distribution models in ecology. Ecological Modelling, 135, pp. 147-186, 2000.
[17] Kotta, J., Torn, K., Martin, G., Orav-Kotta, H., Paalme, T. Seasonal variation of invertebrate grazing on Chara connivens and C. tomentosa in Kõiguste Bay, NE Baltic Sea. Helgoland Mar. Res., 58, pp. 71–76, 2004.
[18] Möller, T., Martin, G. Distribution of the eelgrass Zostera marina L. in the coastal waters of Estonia, NE Baltic Sea. Proc. Estonian Acad. Sci. Biol. Ecol., 56(4), pp. 270-277, 2007.
[19] Kotta, J., Paalme, T., Püss, T., Herkül, K., Kotta, I. Contribution of scale-dependent environmental variability on the biomass patterns of drift algae and associated invertebrates in the Gulf of Riga, northern Baltic Sea. J. Mar. Syst., 74, Supplement 1, pp. 116-S123, 2008.
[20] Kotta, J., Witman, J. 2009. Regional-scale patterns. In: Marine Hard Bottom Communities. Wahl., M. (ed.), Ecological Studies, 206, Springer, in press.
[21] Kotta, J.; Aps, R.; Martin, G. Sensitivity of benthic vegetation and invertebrate functional guilds to oil spill and its use in oil contingency management related negotiation process. Proceedings of the Estonian Academy of Sciences. Biology, Ecology, 56(4), 255 - 269. (2007).