The 1974 spill of the Bouchard 65 oil barge: Petroleum hydrocarbons persist in Winsor Cove salt marsh sediments Emily E. Peacock a,b, * , George R. Hampson c , Robert K. Nelson a , Li Xu d , Glenn S. Frysinger e , Richard B. Gaines e , John W. Farrington a , Bruce W. Tripp a , Christopher M. Reddy a a Department of Marine Chemistry and Geochemistry, Woods Hole Oceanographic Institution, Woods Hole, MA 02543, USA b Boston University Marine Program, Woods Hole Oceanographic Institution, BU Biology/WHOI Marine Chemistry and Geochemistry, Mail Stop #4 Fye, Woods Hole, MA 02543, USA c Department of Biology, Woods Hole Oceanographic Institution, Woods Hole, MA 02543, USA d National Oceans Accelerator Mass Spectrometer Facility, Department of Geology and Geophysics, Woods Hole Oceanographic Institution, Woods Hole, MA 02543, USA e Department of Science, United States Coast Guard Academy, New London, CT 06320, USA Abstract Petroleum hydrocarbons persist in salt marsh sediments in Winsor Cove (Buzzards Bay, Massachusetts) impacted from the 1974 spill of No. 2 fuel oil by the barge Bouchard 65. Intertidal sediment cores were collected from 2001 to 2005 and analyzed for total petroleum hydrocarbons (TPHs). TPHs content was greatest (as high as 8.7 mg g 1 dry weight) in the surface sediments and decreased with distance landward. Select samples were analyzed for polycyclic aromatic hydrocarbons (PAHs) with values as high as 16.7 lgg 1 for total naph- thalenes and phenanthrenes/anthracenes. These remaining PAHs are mainly C 4 -naphthalenes and C 1 -, C 2 -, and C 3 -phenanthrenes/ anthracenes revealing preferential loss of almost all of the naphthalenes and the parent compound phenanthrene. Inspection of the data indicates that biodegradation, water-washing and evaporation were major removal processes for many of the petroleum hydrocarbons in the marsh sediments. In addition, historical data and photographs combined with their recent counterparts indicate that erosion has physically removed these contaminants from this site. Ó 2006 Elsevier Ltd. All rights reserved. Keywords: No. 2 fuel oil; Bouchard 65; Petroleum hydrocarbons; Salt marsh; Sediments; GC · GC 1. Introduction Over the last several decades, the incidence of major oil tanker or barge spills worldwide and in US waters has decreased dramatically (Anderson and LaBelle, 2000), but acute accidents still occur and impact a wide variety coastlines all over the world. Recent spills investigated in the past decade include the North Cape (Reddy and Quinn, 2001), Julie N (NRC, 2003), Erika (Baars, 2002), Jessica (Edgar et al., 2003), Prestige (Albaiges et al., 2006), and Bouchard 120 (Nelson et al., 2006). It is critical that we con- tinue to study the short and long-term geochemical and biological processes that control the fate of spilled petro- leum products in the marine environment. In the United States, this information is essential to damage assessors who must determine whether to restore, rehabilitate, or replace oil-impacted areas as required by the United States Oil Pollution Act of 1990 (33 USC 2701–2761). In addition, knowledge gained from this research is necessary to understanding the fate of chronic inputs of petroleum 0025-326X/$ - see front matter Ó 2006 Elsevier Ltd. All rights reserved. doi:10.1016/j.marpolbul.2006.10.007 * Corresponding author. Address: Boston University Marine Program, Woods Hole Oceanographic Institution, BU Biology/WHOI Marine Chemistry and Geochemistry, Mail Stop #4 Fye, Woods Hole, MA 02543, USA. Tel.: +1 508 360 8034; fax: +1 508 457 2164. E-mail address: [email protected](E.E. Peacock). www.elsevier.com/locate/marpolbul Marine Pollution Bulletin 54 (2007) 214–225
Transcript
www.elsevier.com/locate/marpolbul
Marine Pollution Bulletin 54 (2007) 214–225
The 1974 spill of the Bouchard 65 oil barge: Petroleumhydrocarbons persist in Winsor Cove salt marsh sediments
Emily E. Peacock a,b,*, George R. Hampson c, Robert K. Nelson a, Li Xu d,Glenn S. Frysinger e, Richard B. Gaines e, John W. Farrington a,
Bruce W. Tripp a, Christopher M. Reddy a
a Department of Marine Chemistry and Geochemistry, Woods Hole Oceanographic Institution, Woods Hole, MA 02543, USAb Boston University Marine Program, Woods Hole Oceanographic Institution, BU Biology/WHOI Marine Chemistry and Geochemistry,
Mail Stop #4 Fye, Woods Hole, MA 02543, USAc Department of Biology, Woods Hole Oceanographic Institution, Woods Hole, MA 02543, USA
d National Oceans Accelerator Mass Spectrometer Facility, Department of Geology and Geophysics, Woods Hole Oceanographic Institution,
Woods Hole, MA 02543, USAe Department of Science, United States Coast Guard Academy, New London, CT 06320, USA
Abstract
Petroleum hydrocarbons persist in salt marsh sediments in Winsor Cove (Buzzards Bay, Massachusetts) impacted from the 1974 spillof No. 2 fuel oil by the barge Bouchard 65. Intertidal sediment cores were collected from 2001 to 2005 and analyzed for total petroleumhydrocarbons (TPHs). TPHs content was greatest (as high as 8.7 mg g�1 dry weight) in the surface sediments and decreased with distancelandward. Select samples were analyzed for polycyclic aromatic hydrocarbons (PAHs) with values as high as 16.7 lg g�1 for total naph-thalenes and phenanthrenes/anthracenes. These remaining PAHs are mainly C4-naphthalenes and C1-, C2-, and C3-phenanthrenes/anthracenes revealing preferential loss of almost all of the naphthalenes and the parent compound phenanthrene. Inspection of the dataindicates that biodegradation, water-washing and evaporation were major removal processes for many of the petroleum hydrocarbons inthe marsh sediments. In addition, historical data and photographs combined with their recent counterparts indicate that erosion hasphysically removed these contaminants from this site.� 2006 Elsevier Ltd. All rights reserved.
Over the last several decades, the incidence of major oiltanker or barge spills worldwide and in US waters hasdecreased dramatically (Anderson and LaBelle, 2000),but acute accidents still occur and impact a wide varietycoastlines all over the world. Recent spills investigated in
0025-326X/$ - see front matter � 2006 Elsevier Ltd. All rights reserved.
doi:10.1016/j.marpolbul.2006.10.007
* Corresponding author. Address: Boston University Marine Program,Woods Hole Oceanographic Institution, BU Biology/WHOI MarineChemistry and Geochemistry, Mail Stop #4 Fye, Woods Hole, MA 02543,USA. Tel.: +1 508 360 8034; fax: +1 508 457 2164.
the past decade include the North Cape (Reddy and Quinn,2001), Julie N (NRC, 2003), Erika (Baars, 2002), Jessica
(Edgar et al., 2003), Prestige (Albaiges et al., 2006), andBouchard 120 (Nelson et al., 2006). It is critical that we con-tinue to study the short and long-term geochemical andbiological processes that control the fate of spilled petro-leum products in the marine environment. In the UnitedStates, this information is essential to damage assessorswho must determine whether to restore, rehabilitate, orreplace oil-impacted areas as required by the United StatesOil Pollution Act of 1990 (33 USC 2701–2761). In addition,knowledge gained from this research is necessary tounderstanding the fate of chronic inputs of petroleum
E.E. Peacock et al. / Marine Pollution Bulletin 54 (2007) 214–225 215
hydrocarbons and other anthropogenic organic com-pounds into the environment.
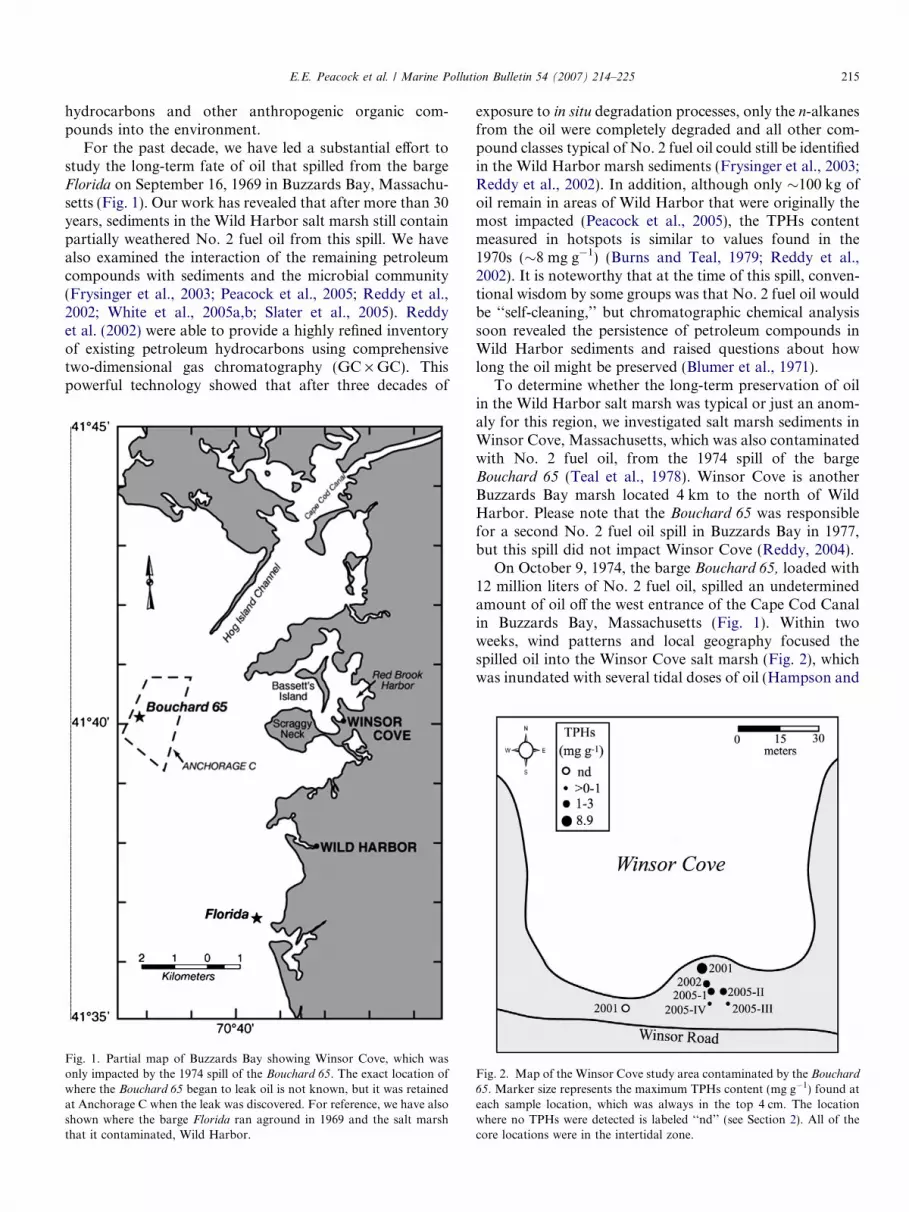
For the past decade, we have led a substantial effort tostudy the long-term fate of oil that spilled from the bargeFlorida on September 16, 1969 in Buzzards Bay, Massachu-setts (Fig. 1). Our work has revealed that after more than 30years, sediments in the Wild Harbor salt marsh still containpartially weathered No. 2 fuel oil from this spill. We havealso examined the interaction of the remaining petroleumcompounds with sediments and the microbial community(Frysinger et al., 2003; Peacock et al., 2005; Reddy et al.,2002; White et al., 2005a,b; Slater et al., 2005). Reddyet al. (2002) were able to provide a highly refined inventoryof existing petroleum hydrocarbons using comprehensivetwo-dimensional gas chromatography (GC · GC). Thispowerful technology showed that after three decades of
Fig. 1. Partial map of Buzzards Bay showing Winsor Cove, which wasonly impacted by the 1974 spill of the Bouchard 65. The exact location ofwhere the Bouchard 65 began to leak oil is not known, but it was retainedat Anchorage C when the leak was discovered. For reference, we have alsoshown where the barge Florida ran aground in 1969 and the salt marshthat it contaminated, Wild Harbor.
exposure to in situ degradation processes, only the n-alkanesfrom the oil were completely degraded and all other com-pound classes typical of No. 2 fuel oil could still be identifiedin the Wild Harbor marsh sediments (Frysinger et al., 2003;Reddy et al., 2002). In addition, although only �100 kg ofoil remain in areas of Wild Harbor that were originally themost impacted (Peacock et al., 2005), the TPHs contentmeasured in hotspots is similar to values found in the1970s (�8 mg g�1) (Burns and Teal, 1979; Reddy et al.,2002). It is noteworthy that at the time of this spill, conven-tional wisdom by some groups was that No. 2 fuel oil wouldbe ‘‘self-cleaning,’’ but chromatographic chemical analysissoon revealed the persistence of petroleum compounds inWild Harbor sediments and raised questions about howlong the oil might be preserved (Blumer et al., 1971).
To determine whether the long-term preservation of oilin the Wild Harbor salt marsh was typical or just an anom-aly for this region, we investigated salt marsh sediments inWinsor Cove, Massachusetts, which was also contaminatedwith No. 2 fuel oil, from the 1974 spill of the bargeBouchard 65 (Teal et al., 1978). Winsor Cove is anotherBuzzards Bay marsh located 4 km to the north of WildHarbor. Please note that the Bouchard 65 was responsiblefor a second No. 2 fuel oil spill in Buzzards Bay in 1977,but this spill did not impact Winsor Cove (Reddy, 2004).
On October 9, 1974, the barge Bouchard 65, loaded with12 million liters of No. 2 fuel oil, spilled an undeterminedamount of oil off the west entrance of the Cape Cod Canalin Buzzards Bay, Massachusetts (Fig. 1). Within twoweeks, wind patterns and local geography focused thespilled oil into the Winsor Cove salt marsh (Fig. 2), whichwas inundated with several tidal doses of oil (Hampson and
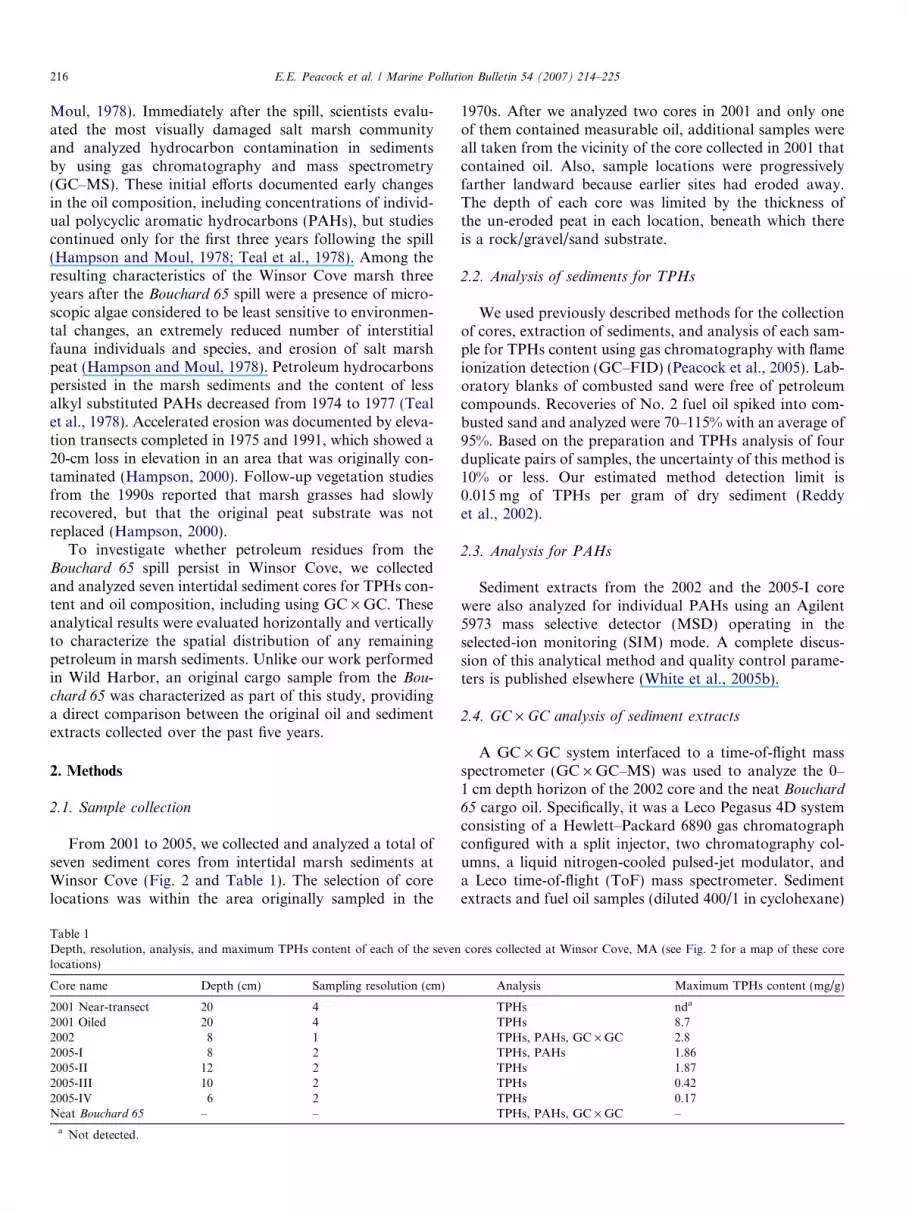
Fig. 2. Map of the Winsor Cove study area contaminated by the Bouchard
65. Marker size represents the maximum TPHs content (mg g�1) found ateach sample location, which was always in the top 4 cm. The locationwhere no TPHs were detected is labeled ‘‘nd’’ (see Section 2). All of thecore locations were in the intertidal zone.
216 E.E. Peacock et al. / Marine Pollution Bulletin 54 (2007) 214–225
Moul, 1978). Immediately after the spill, scientists evalu-ated the most visually damaged salt marsh communityand analyzed hydrocarbon contamination in sedimentsby using gas chromatography and mass spectrometry(GC–MS). These initial efforts documented early changesin the oil composition, including concentrations of individ-ual polycyclic aromatic hydrocarbons (PAHs), but studiescontinued only for the first three years following the spill(Hampson and Moul, 1978; Teal et al., 1978). Among theresulting characteristics of the Winsor Cove marsh threeyears after the Bouchard 65 spill were a presence of micro-scopic algae considered to be least sensitive to environmen-tal changes, an extremely reduced number of interstitialfauna individuals and species, and erosion of salt marshpeat (Hampson and Moul, 1978). Petroleum hydrocarbonspersisted in the marsh sediments and the content of lessalkyl substituted PAHs decreased from 1974 to 1977 (Tealet al., 1978). Accelerated erosion was documented by eleva-tion transects completed in 1975 and 1991, which showed a20-cm loss in elevation in an area that was originally con-taminated (Hampson, 2000). Follow-up vegetation studiesfrom the 1990s reported that marsh grasses had slowlyrecovered, but that the original peat substrate was notreplaced (Hampson, 2000).
To investigate whether petroleum residues from theBouchard 65 spill persist in Winsor Cove, we collectedand analyzed seven intertidal sediment cores for TPHs con-tent and oil composition, including using GC · GC. Theseanalytical results were evaluated horizontally and verticallyto characterize the spatial distribution of any remainingpetroleum in marsh sediments. Unlike our work performedin Wild Harbor, an original cargo sample from the Bou-
chard 65 was characterized as part of this study, providinga direct comparison between the original oil and sedimentextracts collected over the past five years.
2. Methods
2.1. Sample collection
From 2001 to 2005, we collected and analyzed a total ofseven sediment cores from intertidal marsh sediments atWinsor Cove (Fig. 2 and Table 1). The selection of corelocations was within the area originally sampled in the
Table 1Depth, resolution, analysis, and maximum TPHs content of each of the sevenlocations)
1970s. After we analyzed two cores in 2001 and only oneof them contained measurable oil, additional samples wereall taken from the vicinity of the core collected in 2001 thatcontained oil. Also, sample locations were progressivelyfarther landward because earlier sites had eroded away.The depth of each core was limited by the thickness ofthe un-eroded peat in each location, beneath which thereis a rock/gravel/sand substrate.
2.2. Analysis of sediments for TPHs
We used previously described methods for the collectionof cores, extraction of sediments, and analysis of each sam-ple for TPHs content using gas chromatography with flameionization detection (GC–FID) (Peacock et al., 2005). Lab-oratory blanks of combusted sand were free of petroleumcompounds. Recoveries of No. 2 fuel oil spiked into com-busted sand and analyzed were 70–115% with an average of95%. Based on the preparation and TPHs analysis of fourduplicate pairs of samples, the uncertainty of this method is10% or less. Our estimated method detection limit is0.015 mg of TPHs per gram of dry sediment (Reddyet al., 2002).
2.3. Analysis for PAHs
Sediment extracts from the 2002 and the 2005-I corewere also analyzed for individual PAHs using an Agilent5973 mass selective detector (MSD) operating in theselected-ion monitoring (SIM) mode. A complete discus-sion of this analytical method and quality control parame-ters is published elsewhere (White et al., 2005b).
2.4. GC · GC analysis of sediment extracts
A GC · GC system interfaced to a time-of-flight massspectrometer (GC · GC–MS) was used to analyze the 0–1 cm depth horizon of the 2002 core and the neat Bouchard
65 cargo oil. Specifically, it was a Leco Pegasus 4D systemconsisting of a Hewlett–Packard 6890 gas chromatographconfigured with a split injector, two chromatography col-umns, a liquid nitrogen-cooled pulsed-jet modulator, anda Leco time-of-flight (ToF) mass spectrometer. Sedimentextracts and fuel oil samples (diluted 400/1 in cyclohexane)
cores collected at Winsor Cove, MA (see Fig. 2 for a map of these core
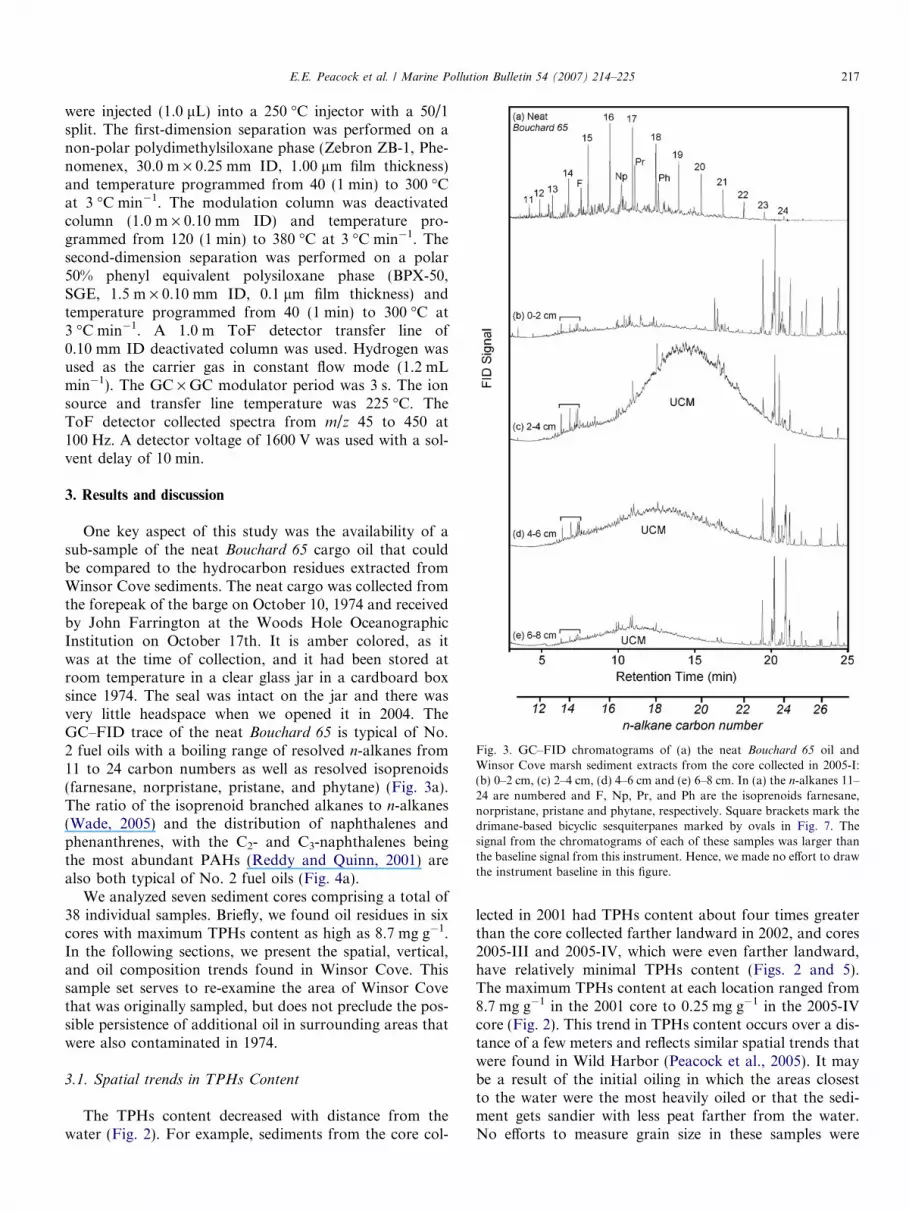
Fig. 3. GC–FID chromatograms of (a) the neat Bouchard 65 oil andWinsor Cove marsh sediment extracts from the core collected in 2005-I:(b) 0–2 cm, (c) 2–4 cm, (d) 4–6 cm and (e) 6–8 cm. In (a) the n-alkanes 11–24 are numbered and F, Np, Pr, and Ph are the isoprenoids farnesane,norpristane, pristane and phytane, respectively. Square brackets mark thedrimane-based bicyclic sesquiterpanes marked by ovals in Fig. 7. Thesignal from the chromatograms of each of these samples was larger thanthe baseline signal from this instrument. Hence, we made no effort to drawthe instrument baseline in this figure.
E.E. Peacock et al. / Marine Pollution Bulletin 54 (2007) 214–225 217
were injected (1.0 lL) into a 250 �C injector with a 50/1split. The first-dimension separation was performed on anon-polar polydimethylsiloxane phase (Zebron ZB-1, Phe-nomenex, 30.0 m · 0.25 mm ID, 1.00 lm film thickness)and temperature programmed from 40 (1 min) to 300 �Cat 3 �C min�1. The modulation column was deactivatedcolumn (1.0 m · 0.10 mm ID) and temperature pro-grammed from 120 (1 min) to 380 �C at 3 �C min�1. Thesecond-dimension separation was performed on a polar50% phenyl equivalent polysiloxane phase (BPX-50,SGE, 1.5 m · 0.10 mm ID, 0.1 lm film thickness) andtemperature programmed from 40 (1 min) to 300 �C at3 �C min�1. A 1.0 m ToF detector transfer line of0.10 mm ID deactivated column was used. Hydrogen wasused as the carrier gas in constant flow mode (1.2 mLmin�1). The GC · GC modulator period was 3 s. The ionsource and transfer line temperature was 225 �C. TheToF detector collected spectra from m/z 45 to 450 at100 Hz. A detector voltage of 1600 V was used with a sol-vent delay of 10 min.
3. Results and discussion
One key aspect of this study was the availability of asub-sample of the neat Bouchard 65 cargo oil that couldbe compared to the hydrocarbon residues extracted fromWinsor Cove sediments. The neat cargo was collected fromthe forepeak of the barge on October 10, 1974 and receivedby John Farrington at the Woods Hole OceanographicInstitution on October 17th. It is amber colored, as itwas at the time of collection, and it had been stored atroom temperature in a clear glass jar in a cardboard boxsince 1974. The seal was intact on the jar and there wasvery little headspace when we opened it in 2004. TheGC–FID trace of the neat Bouchard 65 is typical of No.2 fuel oils with a boiling range of resolved n-alkanes from11 to 24 carbon numbers as well as resolved isoprenoids(farnesane, norpristane, pristane, and phytane) (Fig. 3a).The ratio of the isoprenoid branched alkanes to n-alkanes(Wade, 2005) and the distribution of naphthalenes andphenanthrenes, with the C2- and C3-naphthalenes beingthe most abundant PAHs (Reddy and Quinn, 2001) arealso both typical of No. 2 fuel oils (Fig. 4a).
We analyzed seven sediment cores comprising a total of38 individual samples. Briefly, we found oil residues in sixcores with maximum TPHs content as high as 8.7 mg g�1.In the following sections, we present the spatial, vertical,and oil composition trends found in Winsor Cove. Thissample set serves to re-examine the area of Winsor Covethat was originally sampled, but does not preclude the pos-sible persistence of additional oil in surrounding areas thatwere also contaminated in 1974.
3.1. Spatial trends in TPHs Content
The TPHs content decreased with distance from thewater (Fig. 2). For example, sediments from the core col-
lected in 2001 had TPHs content about four times greaterthan the core collected farther landward in 2002, and cores2005-III and 2005-IV, which were even farther landward,have relatively minimal TPHs content (Figs. 2 and 5).The maximum TPHs content at each location ranged from8.7 mg g�1 in the 2001 core to 0.25 mg g�1 in the 2005-IVcore (Fig. 2). This trend in TPHs content occurs over a dis-tance of a few meters and reflects similar spatial trends thatwere found in Wild Harbor (Peacock et al., 2005). It maybe a result of the initial oiling in which the areas closestto the water were the most heavily oiled or that the sedi-ment gets sandier with less peat farther from the water.No efforts to measure grain size in these samples were
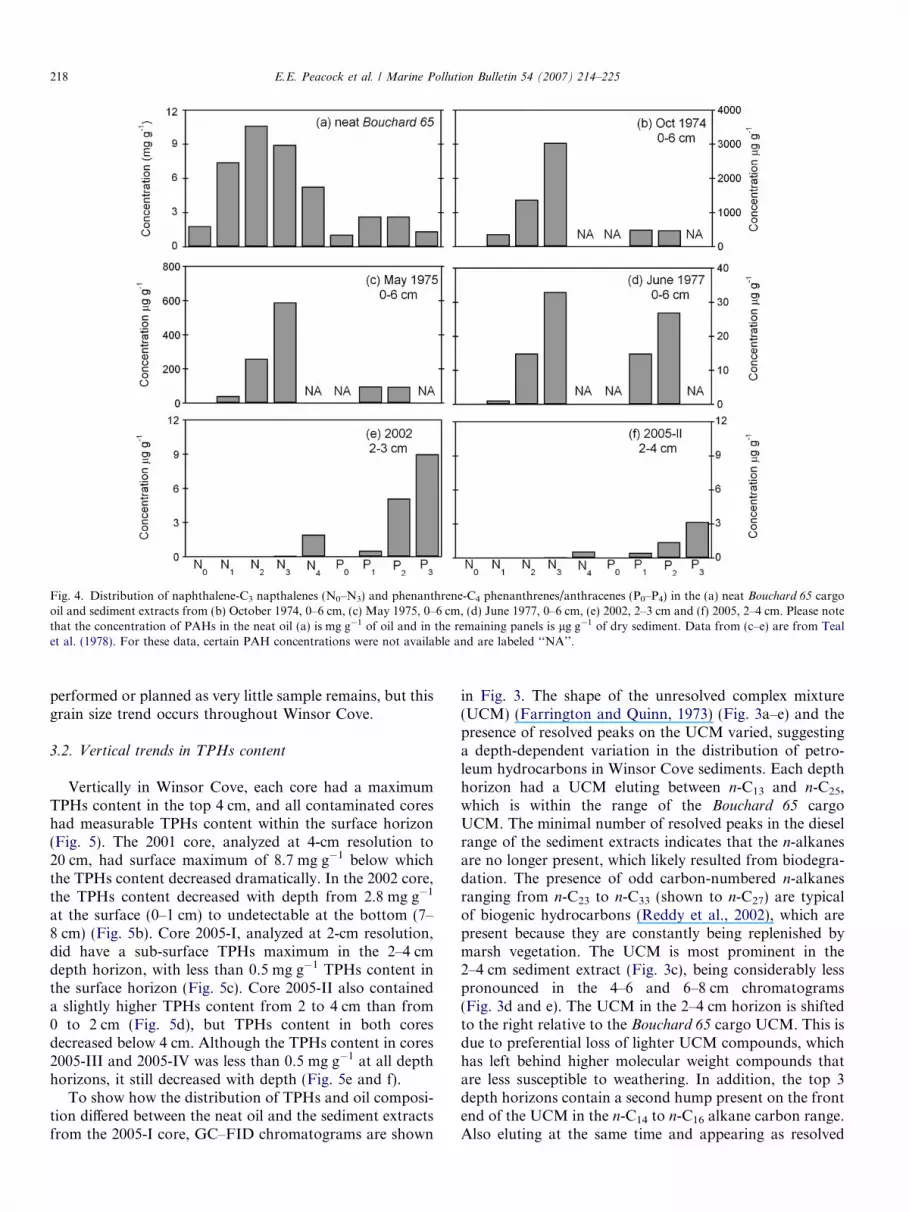
Fig. 4. Distribution of naphthalene-C3 napthalenes (N0–N3) and phenanthrene-C4 phenanthrenes/anthracenes (P0–P4) in the (a) neat Bouchard 65 cargooil and sediment extracts from (b) October 1974, 0–6 cm, (c) May 1975, 0–6 cm, (d) June 1977, 0–6 cm, (e) 2002, 2–3 cm and (f) 2005, 2–4 cm. Please notethat the concentration of PAHs in the neat oil (a) is mg g�1 of oil and in the remaining panels is lg g�1 of dry sediment. Data from (c–e) are from Tealet al. (1978). For these data, certain PAH concentrations were not available and are labeled ‘‘NA’’.
218 E.E. Peacock et al. / Marine Pollution Bulletin 54 (2007) 214–225
performed or planned as very little sample remains, but thisgrain size trend occurs throughout Winsor Cove.
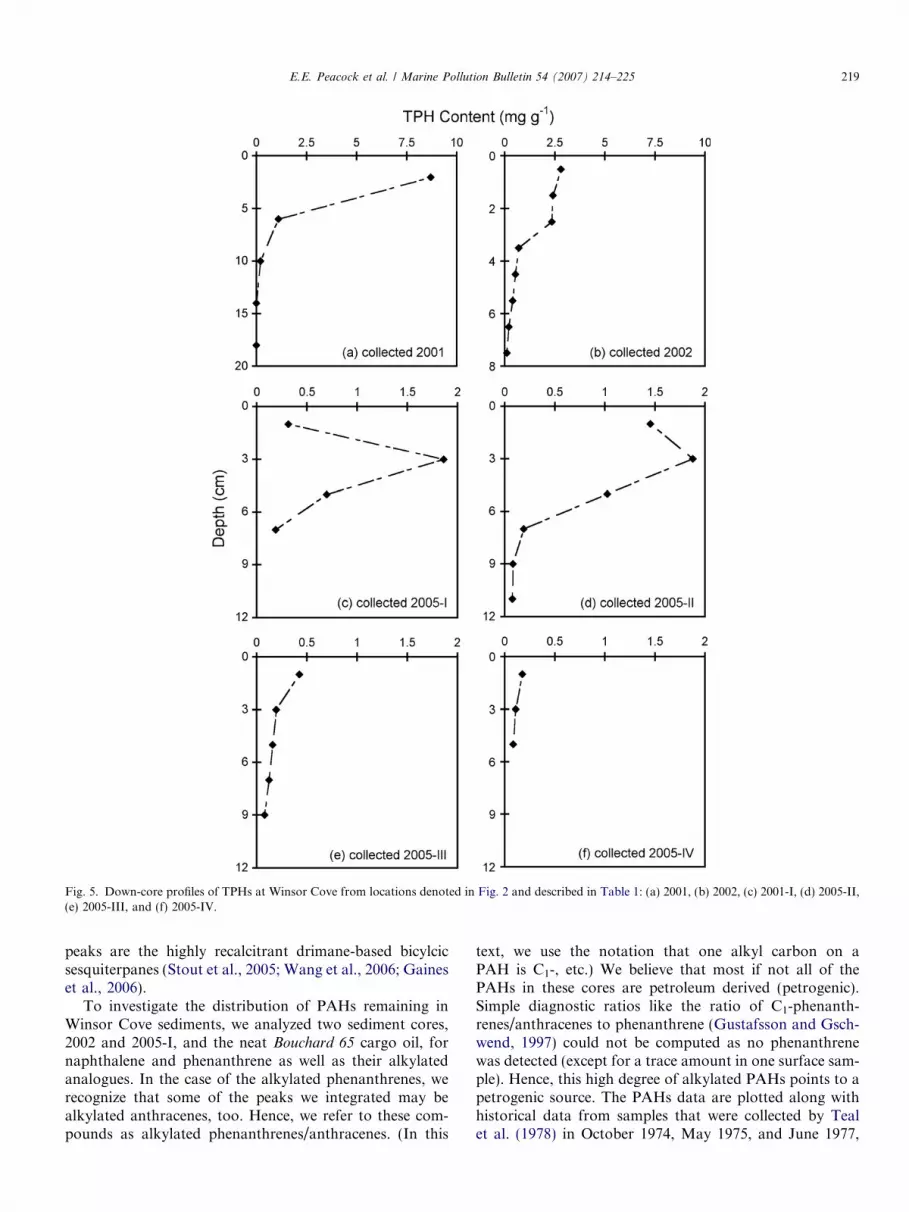
3.2. Vertical trends in TPHs content
Vertically in Winsor Cove, each core had a maximumTPHs content in the top 4 cm, and all contaminated coreshad measurable TPHs content within the surface horizon(Fig. 5). The 2001 core, analyzed at 4-cm resolution to20 cm, had surface maximum of 8.7 mg g�1 below whichthe TPHs content decreased dramatically. In the 2002 core,the TPHs content decreased with depth from 2.8 mg g�1
at the surface (0–1 cm) to undetectable at the bottom (7–8 cm) (Fig. 5b). Core 2005-I, analyzed at 2-cm resolution,did have a sub-surface TPHs maximum in the 2–4 cmdepth horizon, with less than 0.5 mg g�1 TPHs content inthe surface horizon (Fig. 5c). Core 2005-II also containeda slightly higher TPHs content from 2 to 4 cm than from0 to 2 cm (Fig. 5d), but TPHs content in both coresdecreased below 4 cm. Although the TPHs content in cores2005-III and 2005-IV was less than 0.5 mg g�1 at all depthhorizons, it still decreased with depth (Fig. 5e and f).
To show how the distribution of TPHs and oil composi-tion differed between the neat oil and the sediment extractsfrom the 2005-I core, GC–FID chromatograms are shown
in Fig. 3. The shape of the unresolved complex mixture(UCM) (Farrington and Quinn, 1973) (Fig. 3a–e) and thepresence of resolved peaks on the UCM varied, suggestinga depth-dependent variation in the distribution of petro-leum hydrocarbons in Winsor Cove sediments. Each depthhorizon had a UCM eluting between n-C13 and n-C25,which is within the range of the Bouchard 65 cargoUCM. The minimal number of resolved peaks in the dieselrange of the sediment extracts indicates that the n-alkanesare no longer present, which likely resulted from biodegra-dation. The presence of odd carbon-numbered n-alkanesranging from n-C23 to n-C33 (shown to n-C27) are typicalof biogenic hydrocarbons (Reddy et al., 2002), which arepresent because they are constantly being replenished bymarsh vegetation. The UCM is most prominent in the2–4 cm sediment extract (Fig. 3c), being considerably lesspronounced in the 4–6 and 6–8 cm chromatograms(Fig. 3d and e). The UCM in the 2–4 cm horizon is shiftedto the right relative to the Bouchard 65 cargo UCM. This isdue to preferential loss of lighter UCM compounds, whichhas left behind higher molecular weight compounds thatare less susceptible to weathering. In addition, the top 3depth horizons contain a second hump present on the frontend of the UCM in the n-C14 to n-C16 alkane carbon range.Also eluting at the same time and appearing as resolved
Fig. 5. Down-core profiles of TPHs at Winsor Cove from locations denoted in Fig. 2 and described in Table 1: (a) 2001, (b) 2002, (c) 2001-I, (d) 2005-II,(e) 2005-III, and (f) 2005-IV.
E.E. Peacock et al. / Marine Pollution Bulletin 54 (2007) 214–225 219
peaks are the highly recalcitrant drimane-based bicylcicsesquiterpanes (Stout et al., 2005; Wang et al., 2006; Gaineset al., 2006).
To investigate the distribution of PAHs remaining inWinsor Cove sediments, we analyzed two sediment cores,2002 and 2005-I, and the neat Bouchard 65 cargo oil, fornaphthalene and phenanthrene as well as their alkylatedanalogues. In the case of the alkylated phenanthrenes, werecognize that some of the peaks we integrated may bealkylated anthracenes, too. Hence, we refer to these com-pounds as alkylated phenanthrenes/anthracenes. (In this
text, we use the notation that one alkyl carbon on aPAH is C1-, etc.) We believe that most if not all of thePAHs in these cores are petroleum derived (petrogenic).Simple diagnostic ratios like the ratio of C1-phenanth-renes/anthracenes to phenanthrene (Gustafsson and Gsch-wend, 1997) could not be computed as no phenanthrenewas detected (except for a trace amount in one surface sam-ple). Hence, this high degree of alkylated PAHs points to apetrogenic source. The PAHs data are plotted along withhistorical data from samples that were collected by Tealet al. (1978) in October 1974, May 1975, and June 1977,
Tab
le2
Co
nce
ntr
atio
ns
of
PA
Hs
(ng
g�1)
andP
PA
Hs
(lg
g�1)
mea
sure
din
the
core
coll
ecte
din
2002
(see
Fig
.2)
PA
Hs
(ng
g�1)
0–1
cm1–
2cm
2–3
cm3–
4cm
4–5
cm5–
6cm
6–7
cm7–
8cm
Ori
gin
alo
il(m
gg�
1)
Nap
hth
alen
e(n
gg�
1)
nd
an
dn
dn
dn
dn
dn
dn
d1.
82C
1-N
aph
thal
enes
(ng
g�1)
nd
nd
nd
nd
nd
nd
nd
nd
7.42
C2-N
aph
thal
enes
(ng
g�1)
30n
dn
dn
dn
dn
dn
dn
d10
.8C
3-N
aph
thal
enes
(ng
g�1)
nd
2590
nd
nd
nd
nd
nd
8.93
C4-N
aph
thal
enes
(ng
g�1)
135
980
1940
375
160
435
390
435.
28P
hen
anth
ren
e(n
gg�
1)
nd
nd
nd
nd
nd
nd
nd
nd
1.08
C1-P
hen
anth
ren
es/a
nth
race
nes
(ng
g�1)
240
440
530
285
130
169
7326
2.65
C2-P
hen
anth
ren
es/a
nth
race
nes
(lg
g�1)
0.83
2.1
5.1
3.36
1.05
2.0
0.76
0.23
2.66
C3-P
hen
anth
ren
es/a
nth
race
nes
(lg
g�1)
2.62
5.76
9.0
6.66
2.36
3.12
0.99
0.44
1.3
PN
aph
thal
enes
(lg
g�1)
0.17
1.0
2.03
0.38
0.16
0.44
0.39
0.04
334
.3P
Ph
enan
thre
nes
/an
thra
cen
es(l
gg�
1)
3.69
8.3
14.6
10.3
3.54
5.29
1.82
0.69
67.
69P
Nap
hth
alen
esan
dp
hen
anth
ren
es/a
nth
race
nes
(lg
g�1)
3.85
9.3
16.7
10.7
3.7
5.72
2.21
0.73
941
.9R
atio
ofP
nap
hth
alen
estoP
ph
enan
thre
nes
/an
thra
cen
es0.
045
0.12
0.13
0.03
60.
045
0.08
20.
210.
061
4.45
TP
Hs
(mg
g�1)
2.8
2.3
2.2
0.6
0.4
0.3
0.1
0.05
–
aN
ot
det
ecte
d.
220 E.E. Peacock et al. / Marine Pollution Bulletin 54 (2007) 214–225
as well as the neat oil (Fig. 4a–f). Throughout this manu-script, we define
PPAHs as naphthalene to C4-naphtha-
lenes and phenanthrene to C3-phenanthrenes/anthracenes.(Please note that in Teal et al. (1978) C4-naphthalenes,phenanthrene, and C3-phenanthrenes are not listed). Alkyl-ated naphthalenes and phenanthrenes/anthracenes fromthe Bouchard 65 spill persisted in Winsor Cove in 2002and the 2005-I core and were detected in all depth horizonsthat were analyzed from 0 to 8 cm. The concentration ofP
PAHs, which for 2002 and 2005 included C3-phenanth-renes in addition to those measured by Teal et al. (1978),was as high as 16.7 lg g�1 in the 2–3 cm depth horizon in2002 (Table 2) and 5.8 lg g�1 in the 2–4 cm depth horizonin the 2005-I core (Table 3). In 2002, the
PPAHs increased
with depth to 3 cm while the TPHs content remained rela-tively constant. Below 3 cm, the
PPAHs decreased as the
TPHs content decreased (Table 2 and Fig. 5b). These differ-ences in trends between
PPAHs and TPHs could be the
result of compound specific vertical migration rates and/or biodegradation (White et al., 2005b). The ratio ofP
naphthalenes toP
phenanthrenes/anthracenes in thesediment extracts ranged from 0.036 to 0.63, which is sub-stantially different from the Bouchard 65 cargo oil whichhas a ratio of 4.45 (Tables 2 and 3, and Fig. 4) and pointsto how much more susceptible naphthalenes are to weath-ering than phenanthrenes/anthracenes.
One way to evaluate whether an ecosystem is negativelyaffected by contaminants is to use a series of guideline val-ues in which adverse effects do or do not frequently occur.For example, the effect range-low (ERL) was defined byLong et al. (1995) as the concentration of a certain contam-inant below which a sediment is not considered toxic asadverse effects to organisms occurred in less than 10% ofstudies in which concentrations fell below the respectiveERL. The effects range-median (ERM) are levels consid-ered toxic, since adverse effects to organisms occurred inmore than 75% of studies in which concentrations exceededthe respective ERM values. These guidelines were devel-oped by evaluating existing data and are intended asscreening tools in environmental assessments (Long et al.,1995). Since study sites vary widely in their distributionof contaminants, geomorphology, and ecology, the impli-cations of a given ERL or ERM could vary from site tosite. Nevertheless, the ERM for low molecular weight par-ent PAHs (two and three ring PAHs) is 3.16 lg g�1 (Longet al., 1995). Assuming that the biological response to par-ent and alkylated PAHs is similar, we used the ERM valueto evaluate the PAHs concentrations in Winsor Cove sed-iments. In the 2002 core, the sum of naphthalenes and phe-nanthrenes/anthracenes was greater than the ERM in thetop 6 cm (Table 2) and this also occurred from 2 to 6 cmbelow the surface in the 2005-I core (Table 3). This suggeststhat the PAHs persisting in Winsor Cove continue to neg-atively impact the marsh.
To determine how and when the weathering of the Bou-
chard 65 oil took place, it is helpful to compare the resultsto historical data (Teal et al., 1978). The distribution of
Fig. 6. Extracted ion chromatograms for C2-phenanthrenes/anthracenes(m/z 206) in (a) the Bouchard 65 cargo oil and (b) core 2005-I, 2–4 cm. Thecircles and arrows mark differences in the individual isomer distributionbetween the cargo oil and the oil extracted from sediments in 2005, likelyindicating preferential biodegradation of these specific isomers.
E.E. Peacock et al. / Marine Pollution Bulletin 54 (2007) 214–225 221
PAHs in sediments (0–6 cm) from immediately after the oilarrived in the marsh (Fig. 4b) resembled that of the cargoof the Bouchard 65 (Fig. 4a), but the less-substituted naph-thalenes showed early signs of preferential degradation.Within one year, the concentration of PAHs all decreasedby roughly a factor of five (Fig. 4c). In June 1977, twoand a half years after the marsh was contaminated, theconcentration of the naphthalenes had generally decreasedby two orders of magnitude, but the alkylated phenanth-renes/anthracenes only decreased half as much as the naph-thalenes (Fig. 4d). The distributions of PAHs in 2002 and2005 show that the over-all rate of degradation decreasedand that after almost three decades the alkylated phenanth-renes/anthracenes persist while with a few small exceptions,only the C4-naphthalenes are still measurable (Fig. 4e andf).
To investigate whether any biodegradation of thealkylated PAHs occurred, we examined the extracted ionchromatogram for the C2-phenanthrenes/anthracenes(m/z 206), in the neat Bouchard 65 oil and the 2–4 cm depthhorizon from the 2005-I core (Fig. 6). The extracted ionchromatograms of the sediment extracts showed littlevariation with depth, so only the most concentrated hori-zon is shown. We chose the C2-phenanthrenes/anthracenesbecause they are less susceptible to evaporation and water-washing than the C4-naphthalenes and C1-phenanthrenes/anthracenes. They also remain at measurable concentra-tions and any changes in their isomer distribution are per-haps the most likely indicators of microbial activity onthese compounds. Selective biodegradation of individualPAH isomers has been observed and documented in severalstudies (Budzinski et al., 1998; Diez et al., 2005; Wanget al., 1998). Biochemical processes associated with benthicorganisms can also influence the isomeric distribution ofalkylated phenanthrenes (Farrington et al., 1982a,b; Far-rington et al., 1986). In Winsor Cove, the C2-phenanth-renes/anthracenes experienced a preferential loss of twoprominent peaks notable in the difference between theextracted ion chromatograms from the Bouchard 65 and
sediment extract (Fig. 6a and b). By using the elution pro-file of the C2-phenanthrenes/anthracenes (m/z 206) for theNational Institute of Standards and Technology standardreference material (NIST SRM) 1650 described by Benneret al. (1995) and neat standards of 1,5-, 1,7-, and 3,6-dimethyl phenanthrene, we tentatively identified the twopeaks that were degraded to be 2,6- and 2,7-dimethyl phen-anthrene. These results are reasonable based on known aer-obic pathways for PAH degradation in which compounds
222 E.E. Peacock et al. / Marine Pollution Bulletin 54 (2007) 214–225
with non-alkylated vicinal carbons in the ring structuresare most susceptible for biological attack (NRC, 2003).As previously documented, this change in distributionwithin a group of isomers is attributed to biodegradation.It is noteworthy that this degree of biodegradation of oilin Winsor Cove over 32 years is comparable to thatachieved in laboratory experiments in 14 days (Wanget al., 1998). However, we do not know when this degrada-tion at Winsor Cove occurred. Archived sediments do notexist and original m/z 206 extracted ion chromatogramsfrom the 1970s are not available.
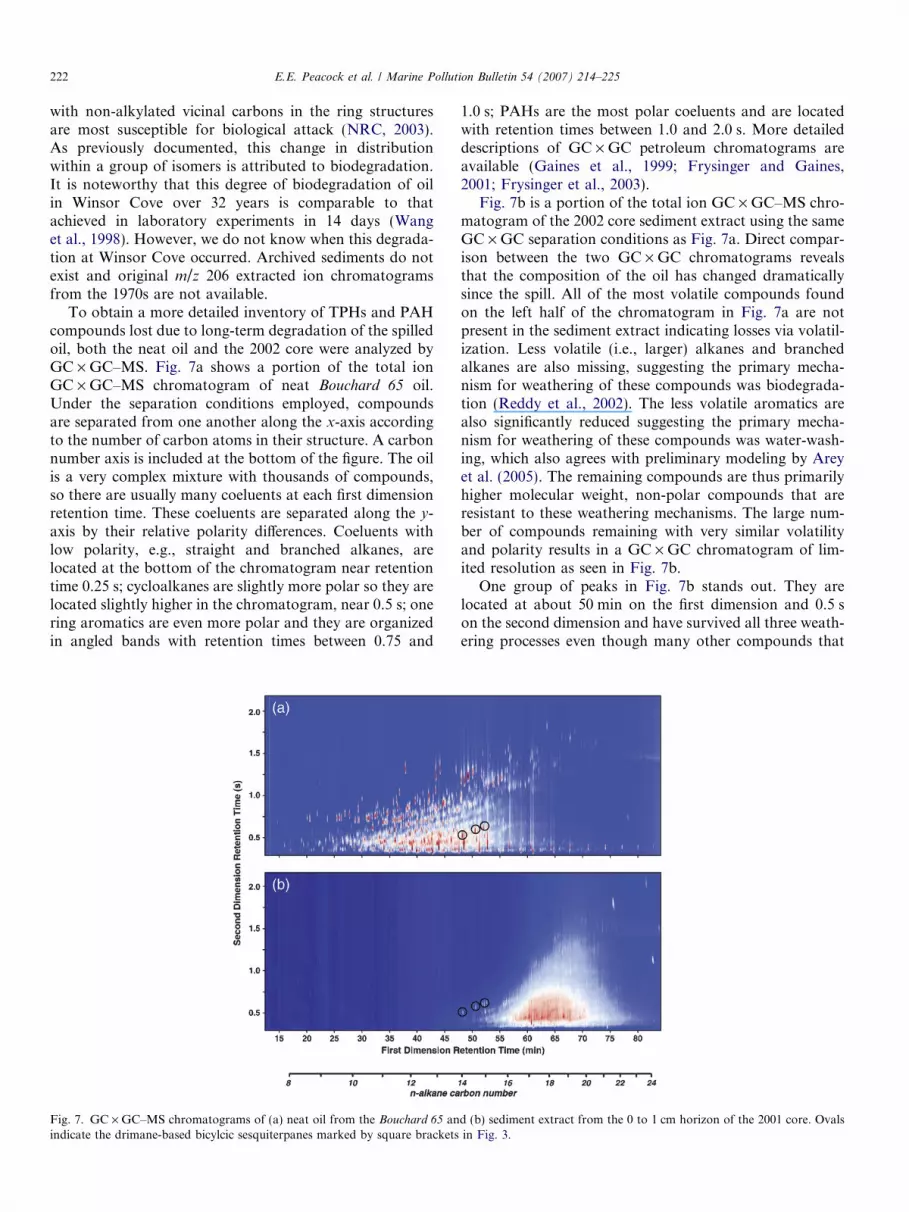
To obtain a more detailed inventory of TPHs and PAHcompounds lost due to long-term degradation of the spilledoil, both the neat oil and the 2002 core were analyzed byGC · GC–MS. Fig. 7a shows a portion of the total ionGC · GC–MS chromatogram of neat Bouchard 65 oil.Under the separation conditions employed, compoundsare separated from one another along the x-axis accordingto the number of carbon atoms in their structure. A carbonnumber axis is included at the bottom of the figure. The oilis a very complex mixture with thousands of compounds,so there are usually many coeluents at each first dimensionretention time. These coeluents are separated along the y-axis by their relative polarity differences. Coeluents withlow polarity, e.g., straight and branched alkanes, arelocated at the bottom of the chromatogram near retentiontime 0.25 s; cycloalkanes are slightly more polar so they arelocated slightly higher in the chromatogram, near 0.5 s; onering aromatics are even more polar and they are organizedin angled bands with retention times between 0.75 and
Fig. 7. GC · GC–MS chromatograms of (a) neat oil from the Bouchard 65 anindicate the drimane-based bicylcic sesquiterpanes marked by square brackets
1.0 s; PAHs are the most polar coeluents and are locatedwith retention times between 1.0 and 2.0 s. More detaileddescriptions of GC · GC petroleum chromatograms areavailable (Gaines et al., 1999; Frysinger and Gaines,2001; Frysinger et al., 2003).
Fig. 7b is a portion of the total ion GC · GC–MS chro-matogram of the 2002 core sediment extract using the sameGC · GC separation conditions as Fig. 7a. Direct compar-ison between the two GC · GC chromatograms revealsthat the composition of the oil has changed dramaticallysince the spill. All of the most volatile compounds foundon the left half of the chromatogram in Fig. 7a are notpresent in the sediment extract indicating losses via volatil-ization. Less volatile (i.e., larger) alkanes and branchedalkanes are also missing, suggesting the primary mecha-nism for weathering of these compounds was biodegrada-tion (Reddy et al., 2002). The less volatile aromatics arealso significantly reduced suggesting the primary mecha-nism for weathering of these compounds was water-wash-ing, which also agrees with preliminary modeling by Areyet al. (2005). The remaining compounds are thus primarilyhigher molecular weight, non-polar compounds that areresistant to these weathering mechanisms. The large num-ber of compounds remaining with very similar volatilityand polarity results in a GC · GC chromatogram of lim-ited resolution as seen in Fig. 7b.
One group of peaks in Fig. 7b stands out. They arelocated at about 50 min on the first dimension and 0.5 son the second dimension and have survived all three weath-ering processes even though many other compounds that
d (b) sediment extract from the 0 to 1 cm horizon of the 2001 core. Ovalsin Fig. 3.
Fig. 8. Photographs of Winsor Cove in (a) October 1974 and (b) July 2006. Arrows point to the same building in both pictures. The two-meter barindicates the size of the boulder. Photos were taken by (a) George Hampson and (b) Tom Kleindinst.
E.E. Peacock et al. / Marine Pollution Bulletin 54 (2007) 214–225 223
eluted nearby did not. These peaks are the drimane-basedbicyclic sesquiterpanes, also known as decalins, and areknown to be recalcitrant constituents of middle distillatefuels such as that spilled by the Bouchard 65 (Stout et al.,2005; Gaines et al., 2006; Wang et al., 2006). They werealso observed in the traditional GC–FID traces and aremarked with square brackets (Fig. 3b–e).
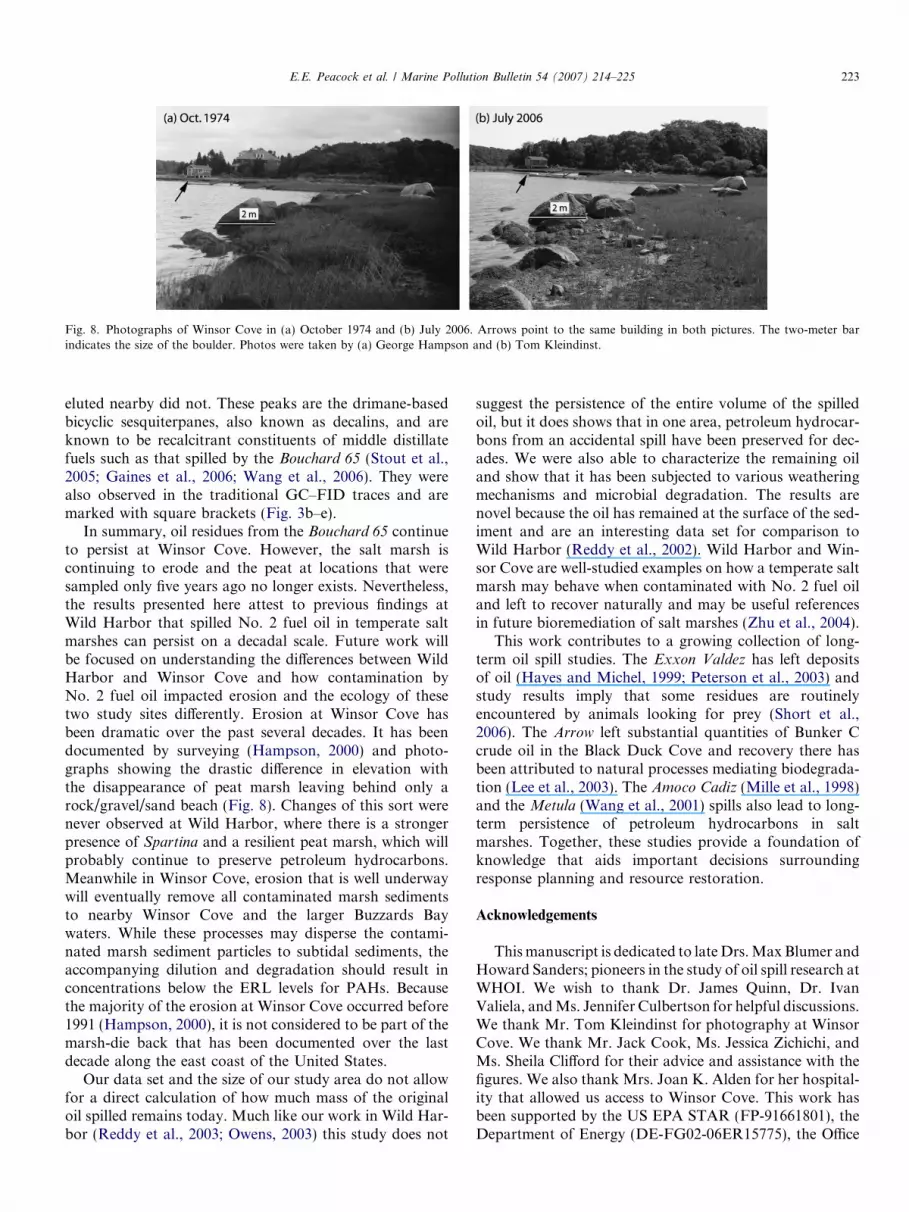
In summary, oil residues from the Bouchard 65 continueto persist at Winsor Cove. However, the salt marsh iscontinuing to erode and the peat at locations that weresampled only five years ago no longer exists. Nevertheless,the results presented here attest to previous findings atWild Harbor that spilled No. 2 fuel oil in temperate saltmarshes can persist on a decadal scale. Future work willbe focused on understanding the differences between WildHarbor and Winsor Cove and how contamination byNo. 2 fuel oil impacted erosion and the ecology of thesetwo study sites differently. Erosion at Winsor Cove hasbeen dramatic over the past several decades. It has beendocumented by surveying (Hampson, 2000) and photo-graphs showing the drastic difference in elevation withthe disappearance of peat marsh leaving behind only arock/gravel/sand beach (Fig. 8). Changes of this sort werenever observed at Wild Harbor, where there is a strongerpresence of Spartina and a resilient peat marsh, which willprobably continue to preserve petroleum hydrocarbons.Meanwhile in Winsor Cove, erosion that is well underwaywill eventually remove all contaminated marsh sedimentsto nearby Winsor Cove and the larger Buzzards Baywaters. While these processes may disperse the contami-nated marsh sediment particles to subtidal sediments, theaccompanying dilution and degradation should result inconcentrations below the ERL levels for PAHs. Becausethe majority of the erosion at Winsor Cove occurred before1991 (Hampson, 2000), it is not considered to be part of themarsh-die back that has been documented over the lastdecade along the east coast of the United States.
Our data set and the size of our study area do not allowfor a direct calculation of how much mass of the originaloil spilled remains today. Much like our work in Wild Har-bor (Reddy et al., 2003; Owens, 2003) this study does not
suggest the persistence of the entire volume of the spilledoil, but it does shows that in one area, petroleum hydrocar-bons from an accidental spill have been preserved for dec-ades. We were also able to characterize the remaining oiland show that it has been subjected to various weatheringmechanisms and microbial degradation. The results arenovel because the oil has remained at the surface of the sed-iment and are an interesting data set for comparison toWild Harbor (Reddy et al., 2002). Wild Harbor and Win-sor Cove are well-studied examples on how a temperate saltmarsh may behave when contaminated with No. 2 fuel oiland left to recover naturally and may be useful referencesin future bioremediation of salt marshes (Zhu et al., 2004).
This work contributes to a growing collection of long-term oil spill studies. The Exxon Valdez has left depositsof oil (Hayes and Michel, 1999; Peterson et al., 2003) andstudy results imply that some residues are routinelyencountered by animals looking for prey (Short et al.,2006). The Arrow left substantial quantities of Bunker Ccrude oil in the Black Duck Cove and recovery there hasbeen attributed to natural processes mediating biodegrada-tion (Lee et al., 2003). The Amoco Cadiz (Mille et al., 1998)and the Metula (Wang et al., 2001) spills also lead to long-term persistence of petroleum hydrocarbons in saltmarshes. Together, these studies provide a foundation ofknowledge that aids important decisions surroundingresponse planning and resource restoration.
Acknowledgements
This manuscript is dedicated to late Drs. Max Blumer andHoward Sanders; pioneers in the study of oil spill research atWHOI. We wish to thank Dr. James Quinn, Dr. IvanValiela, and Ms. Jennifer Culbertson for helpful discussions.We thank Mr. Tom Kleindinst for photography at WinsorCove. We thank Mr. Jack Cook, Ms. Jessica Zichichi, andMs. Sheila Clifford for their advice and assistance with thefigures. We also thank Mrs. Joan K. Alden for her hospital-ity that allowed us access to Winsor Cove. This work hasbeen supported by the US EPA STAR (FP-91661801), theDepartment of Energy (DE-FG02-06ER15775), the Office
224 E.E. Peacock et al. / Marine Pollution Bulletin 54 (2007) 214–225
of Naval Research Young Investigator Award (N00014-04-01-0029), the Island Foundation, the Hollis and ErmineLovell Charitable Foundation, and the Robert T. AlexanderTrust.
Anderson, C.M., LaBelle, R.P., 2000. Update of comparative occurrencerates for offshore oil spills. Spill Science and Technology Bulletin 6,303–321.
Arey, J.S., Nelson, R.K., Xu, L., Reddy, C.M., 2005. Using comprehen-sive two-dimensional gas chromatography retention indices to estimateenvironmental partitioning properties for a complete set of diesel fuelhydrocarbons. Analytical Chemistry 77, 7172–7182.
Baars, B.J., 2002. The wreckage of the oil tanker ‘Erika’ – human healthrisk assessment of beach cleaning, sunbathing and swimming. Toxi-cology Letters 128, 55–68.
Benner, B.A., Wise, S.A., Currie, L.A., Klouda, G.A., Klinedinst, D.B.,1995. Distinguishing the contributions of residential wood combustionand mobile source emissions using relative concentrations of dim-ethylphenanthrene isomers. Environmental Science and Technology29, 2382–2389.
Blumer, M., Sanders, H.L., Grassle, J.F., Hampson, G.R., 1971. A smalloil spill. Environment 13, 2–12.
Budzinski, H., Raymond, N., Nadalig, T., Gilewicz, M., Garrigues, P.,Bertrand, J.C., Caumette, P., 1998. Aerobic biodegradation ofalkylated aromatic hydrocarbons by a bacterial community. OrganicGeochemistry 28, 337–348.
Burns, K.A., Teal, J.M., 1979. The West Falmouth oil spill: hydrocarbonsin the salt marsh ecosystem. Estuarine and Coastal Marine Science 8,349–360.
Diez, S., Sabate, J., Vinas, M., Bayona, J.M., Solanas, A.M., Albaiges, J.,2005. The Prestige oil spill I. Biodegradation of a heavy fuel oil undersimulated conditions. Environmental Toxicology and Chemistry 24,2203–2217.
Edgar, G.J., Snell, H.L., Lougheed, L.W., 2003. Impacts of the Jessica oilspill: an introduction. Marine Pollution Bulletin 47, 273–275.
Farrington, J.W., Quinn, J.G., 1973. Petroleum hydrocarbons in Narra-gansett Bay: I. Survey of hydrocarbons in sediments and clams(Mercenaria mercenaria). Estuarine Coastal Marine Science 1, 71–79.
Farrington, J.W., Tripp, B.W., Teal, J.M., Mille, G., Tjessem, K., Davis,A.C., Livramento, J.B., Hayward, N.A., Frew, N.M., 1982a. Biogeo-chemistry of aromatic hydrocarbons in the benthos of microcosms.Toxicological and Environmental Chemistry 5, 331–346.
Gaines, R.B., Frysinger, G.S., Reddy, C.M., Nelson, R.K., 2006. Oil spillsource identification by comprehensive two-dimensional gas chroma-tography (GC · GC). In: Wang, Z., Stout, S. (Eds.), Oil SpillEnvironmental Forensics. Elsevier.
Gustafsson, O., Gschwend, P.M., 1997. Soot as a strong partition mediumfor polycyclic aromatic hydrocarbons in aquatic systems. MolecularMarkers in Environmental Geochemistry, 365–381.
Hampson, G.R., 2000. Destruction and recovery of the Winsor Cove,Cataumet, MA salt marsh from a #2 fuel oil spill: A 26 year history.Environment Cape Cod 3, 32–39.
Hampson, G.R., Moul, E.T., 1978. No. 2. Fuel oil spill in Bourne,Massachusetts: immediate assessment of the effects on marineinvertebrates and a 3-year study of growth and recovery of a saltmarsh. Journal of the Fisheries Research Board of Canada 35, 731–744.
Hayes, M.O., Michel, J., 1999. Factors determining the long-termpersistence of Exxon Valdez oil in gravel beaches. Marine PollutionBulletin 38, 92–101.
Lee, K., Prince, R.C., Greer, C.W., Doe, K.G., Wilson, J.E.H., Cobanli,S.E., Wohlgeschaffen, G.D., Alroumi, D., King, T., Tremblay, G.H.,2003. Composition and toxicity of residual bunker C fuel oil inintertidal sediments after 30 years. Spill Science and TechnologyBulletin 8, 187–199.
Long, E.R., Macdonald, D.D., Smith, S.L., Calder, F.D., 1995. Incidenceof adverse biological effects within ranges of chemical concentrationsin marine and estuarine sediments. Environmental Management 19,81–97.
Mille, G., Munoz, D., Jacquot, F., Rivet, L., Bertrand, J.C., 1998. TheAmoco Cadiz oil spill: evolution of petroleum hydrocarbons in the IleGrande salt marshes (Brittany) after a 13-year period. EstuarineCoastal and Shelf Science 47, 547–559.
National Research Council, 2003. Oil in the sea III: inputs, fates, andeffects. The National Academies Press, Washington, DC.
Owens, E.H., 2003. Comment on ‘‘The West Falmouth oil spill after thirtyyears: the persistence of petroleum hydrocarbons in marsh sediments’’.Environmental Science and Technology 37, 2020.
Peacock, E.E., Nelson, R.K., Solow, A.R., Warren, J.D., Baker, J.L.,Reddy, C.M., 2005. The West Falmouth oil spill: �100 kg of oil foundto persist decades later. Environmental Forensics 6, 273–281.
Peterson, C.H., Rice, S.D., Short, J.W., Esler, D., Bodkin, J.L., Ballachey,B.E., Irons, D.B., 2003. Long-term ecosystem response to the Exxon
Valdez oil spill. Science 302, 2082–2086.Reddy, C.M., 2004. Oil in our coastal back yard-spills on WHOI’s shores
set the stage for advances in mitigating and remediating oil spills.Oceanus 43, 30–35.
Reddy, C.M., Quinn, J.G., 2001. The North Cape oil spill: hydrocarbonsin Rhode Island coastal waters and Point Judith pond. MarineEnvironmental Research 52, 445–461.
Reddy, C.M., Eglinton, T.I., Hounshell, A., White, H.K., Xu, L., Gaines,R.B., Frysinger, G.S., 2002. The West Falmouth oil spill after thirtyyears: the persistence of petroleum hydrocarbons in marsh sediments.Environmental Science and Technology 36, 4754–4760.
Reddy, C.M., Eglinton, T.I., Hounshell, A., White, H.K., Xu, L., 2003.Response to comment on ‘‘The West Falmouth oil spill after thirtyyears: the persistence of petroleum hydrocarbons in marsh sediments’’.Environmental Science and Technology 37, 2021.
Short, J.W., Maselko, J.M., Lindeberg, M.R., Harris, P.M., Rice, S.D.,2006. Vertical distribution and probability of encountering intertidalExxon Valdez oil on shorelines of three embayments within PrinceWilliam Sound, Alaska. Environmental Science and Technology 40,3723–3729.
Slater, G.F., White, H.K., Eglinton, T.I., Reddy, C.M., 2005. Determi-nation of microbial carbon sources in petroleum contaminatedsediments using molecular 14C analysis. Environmental Science andTechnology 39, 2552–2558.
E.E. Peacock et al. / Marine Pollution Bulletin 54 (2007) 214–225 225
Teal, J.M., Burns, K.A., Farrington, J.W., 1978. Analyses of aromatichydrocarbons in intertidal sediments resulting from two spills of No. 2fuel oil in Buzzards Bay, Massachusetts. Journal of the FisheriesResearch Board of Canada 35, 510–520.
Wade, M.J., 2005. The use of isoprenoid ratios to calculate percentagemixing of different distillate fuels released to the environment.Environmental Forensics 6, 187–196.
Wang, Z.D., Fingas, M., Blenkinsopp, S., Sergy, G., Landriault, M.,Sigouin, L., Foght, J., Semple, K., Westlake, D.W.S., 1998. Compar-ison of oil composition changes due to biodegradation and physicalweathering in different oils. Journal of Chromatography A 809, 89–107.
Wang, Z.D., Fingas, M., Owens, E.H., Sigouin, L., Brown, C.E., 2001.Long-term fate and persistence of the spilled Metula oil in a marine saltmarsh environment – degradation of petroleum biomarkers. Journal ofChromatography A 926, 275–290.
Wang, Z.D., Stout, S.A., Fingas, M., 2006. Forensic fingerprinting ofbiomarkers for oil spill characterization and source identification.Environmental Forensics 7, 105–146.
White, H.K., Reddy, C.M., Eglinton, T.I., 2005a. Isotopic constraints onthe fate of petroleum residues sequestered in salt marsh sediments.Environmental Science and Technology 39, 2545–2551.
White, H.K., Xu, L., Lima, A.L.C., Eglinton, T.I., Reddy, C.M., 2005b.Abundance, composition, and vertical transport of PAHs inmarsh sediments. Environmental Science and Technology 39, 8273–8280.
Zhu, X., Venosa, A.D., Suidan, M.T., Lee, K., 2004. Guidelines for thebioremediation of oil-contaminated salt marshes. Report under acontract of the Office of Research and Development, US Environ-mental Protection Agency EPA/600/R-04/074.