TEMPORAL VARIATION IN BIRD AND RESOURCE ABUNDANCE ACROSS AN ELEVATIONAL GRADIENT IN HAWAII R.—Documentamos los patrones de disponibilidad de néctar y la abundancia de aves nectarívoras por cerca de tres años en nueve sitios de estudio a lo largo de un gradiente altitudinal de m en la isla de Hawai para investigar la relación entre la variación en los recursos y la abundancia de aves. La densidad de flores (flores ha–) y el contenido energético del néctar de la planta monodominante llamada Metrosideros polymorpha fueron medidos a lo largo del gradiente. Cuatro especies nectarívoras fueron capturadas mensualmente con redes de niebla y censadas cada tres meses mediante muestreos de distancia con puntos en transectos en cada sitio para examinar los patrones de densidad y abundancia relativa. Los picos de floración se asociaron con la temporada, pero no con la precipitación ni con la elevación. Las densidades de aves presentaron un pico en el invierno y la primavera de cada año en las elevaciones altas, pero los patrones fueron — 113 — e Auk 128(1):113 126, 2011 e American Ornithologists’ Union, 2011. Printed in USA. e Auk, Vol. , Number , pages . ISSN -, electronic ISSN -. by e American Ornithologists’ Union. All rights reserved. Please direct all requests for permission to photocopy or reproduce article content through the University of California Press’s Rights and Permissions website, http://www.ucpressjournals. com/reprintInfo.asp. DOI: ./auk.. Variación Temporal de la Abundancia de Aves y Recursos en un Gradiente Altitudinal en Hawai PATRICK J. HART, 1,4 BETHANY L. WOODWORTH, 2,5 R ICHARD J. C AMP , 1 K ATHRYN TURNER, 1 K ATHERINE MCCLURE, 1,6 K ATHERINE GOODALL, 1,7 CARLENE HENNEMAN, 1,8 CALEB S PIEGEL, 1,9 J AYMI LEBRUN, 1,10 ERIK TWEED, 1 AND MICHAEL SAMUEL 3 A.—We documented patterns of nectar availability and nectarivorous bird abundance over ~ years at nine study sites across an ,-m elevational gradient on Hawaii Island to investigate the relationship between resource variation and bird abundance. Flower density (flowers ha - ) and nectar energy content were measured across the gradient for the monodominant `Ōhi`a (Metrosideros polymorpha). Four nectarivorous bird species were captured monthly in mist nets and surveyed quarterly with point-transect distance sampling at each site to examine patterns of density and relative abundance. Flowering peaks were associated with season but not rainfall or elevation. Bird densities peaked in the winter and spring of each year at high elevations, but patterns were less clear at middle and low elevations. Variability in bird abundance was generally best modeled as a function of elevation, season, and flower density, but the strength of the latter effect varied with species. e low elevations had the greatest density of flowers but contained far fewer individuals of the two most strongly nectarivorous species. ere is little evidence of large-scale altitudinal movement of birds in response to `Ōhi`a flowering peaks. e loose relationship between nectar and bird abundance may be explained by a number of potential mechanisms, including () demographic constraints to movement; () nonlimiting nectar resources; and () the presence of an “ecological trap,” whereby birds are attracted by the high resource abundance of, but suffer increased mortality at, middle and low elevations as a result of disease. Received February , accepted October . 1 Hawai`i Cooperative Studies Unit, University of Hawai`i at Hilo, P.O. Box 44, Hawai`i National Park, Hawaii 96718, USA; 2 U.S. Geological Survey, Biological Resources Discipline, Pacific Island Ecosystems Research Center, Kilauea Field Station, P.O. Box 44, Hawai `i National Park, Hawaii 96718, USA; and 3 U.S. Geological Survey, Biological Resources Discipline, Wisconsin Cooperative Wildlife Research Unit, 204 Russell Labs, 1630 Linden Drive, Madison, Wisconsin 53706, USA 4 Present address: Department of Biology, University of Hawai`i at Hilo, 200 W. Kawili Street, Hilo, Hawaii 96720, USA. E-mail: [email protected]5 Present address: Department of Environmental Studies, University of New England, 213 DeCary Hall, 11 Hills Beach Road, Biddeford, Maine 04005, USA. 6 Present address: Department of Ecology and Evolutionary Biology, University of California at Santa Cruz, A350 Earth and Marine Sciences, Santa Cruz, California, USA. 7 Present address: School of Natural Resources and Environment, University of Michigan, 440 Church Street, Ann Arbor, Michigan 48109, USA. 8 Present address: 727 Western Avenue, Petaluma, California 94952, USA. 9 Present address: U.S. Fish and Wildlife Service, Migratory Birds, 300 Westgate Center Drive, Hadley, Massachusetts, USA. 10 Present address: Department of Fisheries and Wildlife, University of Missouri, 302 Anheuser-Busch Natural Resources Building, Columbia, Missouri 65211, USA. Key words: bird density, ecological trap, flower density, flower phenology, Hawaiian Honeycreeper, Metrosideros polymorpha, nectarivore.
Transcript
TEMPORAL VARIATION IN BIRD AND RESOURCE ABUNDANCE
ACROSS AN ELEVATIONAL GRADIENT IN HAWAII
R!"#$!%.—Documentamos los patrones de disponibilidad de néctar y la abundancia de aves nectarívoras por cerca de tres años en nueve sitios de estudio a lo largo de un gradiente altitudinal de &'(( m en la isla de Hawai para investigar la relación entre la variación en los recursos y la abundancia de aves. La densidad de flores (flores ha–&) y el contenido energético del néctar de la planta monodominante llamada Metrosideros polymorpha fueron medidos a lo largo del gradiente. Cuatro especies nectarívoras fueron capturadas mensualmente con redes de niebla y censadas cada tres meses mediante muestreos de distancia con puntos en transectos en cada sitio para examinar los patrones de densidad y abundancia relativa. Los picos de floración se asociaron con la temporada, pero no con la precipitación ni con la elevación. Las densidades de aves presentaron un pico en el invierno y la primavera de cada año en las elevaciones altas, pero los patrones fueron
— 113 —
!e Auk 128(1):113 126, 2011 )e American Ornithologists’ Union, 2011.
Printed in USA.
!e Auk, Vol. &*', Number &, pages &&+ !"#. ISSN (((,-'(+', electronic ISSN &-+'-,*.,. *(&& by )e American Ornithologists’ Union. All rights reserved. Please direct all requests for permission to photocopy or reproduce article content through the University of California Press’s Rights and Permissions website, http://www.ucpressjournals.com/reprintInfo.asp. DOI: &(.&.*./auk.*(&&.&((+&
Variación Temporal de la Abundancia de Aves y Recursos en un Gradiente Altitudinal en Hawai
PATRICK J. HART,1,4 BETHANY L. WOODWORTH,2,5 RICHARD J. CAMP,1 KATHRYN TURNER,1 KATHERINE MCCLURE,1,6 KATHERINE GOODALL,1,7 CARLENE HENNEMAN,1,8 CALEB SPIEGEL,1,9 JAYMI LEBRUN,1,10 ERIK TWEED,1 AND MICHAEL SAMUEL3
A/"01230.—We documented patterns of nectar availability and nectarivorous bird abundance over ~+ years at nine study sites across an &,'((-m elevational gradient on Hawaii Island to investigate the relationship between resource variation and bird abundance. Flower density (flowers ha4&) and nectar energy content were measured across the gradient for the monodominant `5hi`a (Metrosideros polymorpha). Four nectarivorous bird species were captured monthly in mist nets and surveyed quarterly with point-transect distance sampling at each site to examine patterns of density and relative abundance. Flowering peaks were associated with season but not rainfall or elevation. Bird densities peaked in the winter and spring of each year at high elevations, but patterns were less clear at middle and low elevations. Variability in bird abundance was generally best modeled as a function of elevation, season, and flower density, but the strength of the latter e6ect varied with species. )e low elevations had the greatest density of flowers but contained far fewer individuals of the two most strongly nectarivorous species. )ere is little evidence of large-scale altitudinal movement of birds in response to `5hi`a flowering peaks. )e loose relationship between nectar and bird abundance may be explained by a number of potential mechanisms, including (&) demographic constraints to movement; (*) nonlimiting nectar resources; and (+) the presence of an “ecological trap,” whereby birds are attracted by the high resource abundance of, but su6er increased mortality at, middle and low elevations as a result of disease. Received "# February $#"#, accepted $" October $#"#.
1Hawai`i Cooperative Studies Unit, University of Hawai`i at Hilo, P.O. Box 44, Hawai`i National Park, Hawaii 96718, USA;2U.S. Geological Survey, Biological Resources Discipline, Pacific Island Ecosystems Research Center, Kilauea Field Station,
P.O. Box 44, Hawai`i National Park, Hawaii 96718, USA; and3U.S. Geological Survey, Biological Resources Discipline, Wisconsin Cooperative Wildlife Research Unit,
204 Russell Labs, 1630 Linden Drive, Madison, Wisconsin 53706, USA
4Present address: Department of Biology, University of Hawai`i at Hilo, 200 W. Kawili Street, Hilo, Hawaii 96720, USA. E-mail: [email protected] address: Department of Environmental Studies, University of New England, 213 DeCary Hall, 11 Hills Beach Road, Biddeford, Maine 04005, USA.6Present address: Department of Ecology and Evolutionary Biology, University of California at Santa Cruz, A350 Earth and Marine Sciences, Santa Cruz, California, USA.7Present address: School of Natural Resources and Environment, University of Michigan, 440 Church Street, Ann Arbor, Michigan 48109, USA.8Present address: 727 Western Avenue, Petaluma, California 94952, USA.9Present address: U.S. Fish and Wildlife Service, Migratory Birds, 300 Westgate Center Drive, Hadley, Massachusetts, USA.10Present address: Department of Fisheries and Wildlife, University of Missouri, 302 Anheuser-Busch Natural Resources Building, Columbia, Missouri 65211, USA.
When the 7hi`a is in bloom over miles of country, the food sup-ply seems inexhaustible, but between the flowering periods it is limited, and often leads to a decided migration of the birds ei-ther from one district to another, or to di6erent elevations in the same district. (Perkins &-(+)
T8! 39%3!:0 0820 there is a strong general relationship be-tween resource availability and animal abundance has become widely accepted in ecology. Mobile organisms such as birds have been shown to track changes in a variety of resources, including arthropods, fruits, seeds, and nectar (reviewed in Wiens &-'-). Re-source variability a6ects local abundance on a broad scale through its influences on latitudinal migrations (Dingle and Drake *((;). Similarly, seasonal changes in resource abundance across eleva-tional gradients have been shown to be associated with altitudi-nal movements of birds across much smaller spatial scales (Stiles &-'', Loiselle and Blake &--&, Levey and Stiles &--*, Chaves-Campos et al. *((+).
Movement of individuals across the landscape strengthens the ecological linkage between habitats and may provide impor-tant ecological services such as seed dispersal and pollination. )is movement may also facilitate the persistence of populations when food availability is patchy in space or time or when organ-isms exist primarily within metapopulations (Hanski and Gilpin &--&). Conversely, movement may be detrimental to populations and the persistence of species when some of the individuals that move are known reservoirs of disease. Recent outbreaks of West Nile virus in migratory bird species in North America are an ex-ample of this on a large scale (Rappole and Hubálek *((+). Un-derstanding the ways in which resources and animal populations, especially those that are rare or in decline, vary within and among years across the landscape may thus be critical in designing e6ec-tive conservation plans (Johnson and Sherry *((&).
We examined nectar availability as a variable resource with the strong potential to drive movements of nectar-feeding birds across large spatial and temporal scales on the island of Hawaii. We focused on nectar resources and nectarivores because (&) nec-tarivores constitute a large proportion of both individuals and species within Hawaiian forest bird communities; (*) the den-sity of nectarivores is often limited by their food supplies (Car-penter &-;<); and (+) feeding territoriality is relatively rare, and Hawaiian nectarivores might therefore be expected to track nec-tar resources across the landscape in a more or less “ideal-free” manner. )e potential mass movement of some of the largest and most abundant of the remaining native Hawaiian forest verte-brates has great ecological implications for both the pollination of a variety of plant species and the spread of avian disease. )e lat-ter idea is particularly important because two native honeycreep-ers, the Amakihi (Hemignathus virens virens) and the Apapane
(Himatione sanguinea), have been shown to be the primary reser-voirs for mosquito-transmitted avian malaria (Plasmodium relic-tum; van Riper et al. &-'<). Past work has demonstrated a strong relationship between elevation and prevalence of avian malaria in Hawaiian forest birds (Warner &-<', van Riper et al. &-'<). Knowl-edge of the patterns of food availability and other factors that shape the structure and dynamics of avian communities in Ha-waii is critical if we are to understand the avian disease system, because of the great di6erences in susceptibility to disease both within and among species (van Riper et al. &-'<, Atkinson et al. &--.) as well as likely di6erences in seasonal movement patterns between species (Scott et al. &-'<).
Since Perkins’s (&-(+) observations, it has been widely believed that nectar-feeding birds closely track the flowering of 5hi`a (Met-rosideros polymorpha) in Hawaii (e.g., Baldwin &-.+, Carpenter and Macmillen &-'(, Scott et al. &-'<). However, recent studies at di6erent locations and smaller spatial scales than those described here have been rather equivocal in their support of this relationship (e.g., Carpenter &-';, Ralph and Fancy &--.). )e primary hypoth-esis that we address in the present study is that the abundance of nectar-consuming birds is related to spatial and temporal changes in nectar availability. )e main predictions are that (&) flower abun-dance of `5hi`a, the dominant tree in Hawaiian wet forests, peaks at di6erent times at di6erent elevations; and (*) there is a positive relationship between flower abundance and bird abundance in a given area over time. Alternatively, birds may not track the abun-dance of flowers because of life-history constraints (e.g., breeding or susceptibility to disease) or because nectar in flowers is generally not a limiting resource. To test these predictions, we explore pat-terns of both flower and bird abundance over a +-year period at nine locations across an &,'((-m elevational gradient. We then evaluate a set of models that incorporates both biotic and abiotic variables to explain these patterns. Our approach di6ers from past work on this system and other systems in a number of important ways. First, our study was conducted at a very large spatial scale, incorporating nearly the entire elevational range of both `5hi`a and the four bird species on Mauna Loa and Kilauea volcanoes. Second, we measured flower abundance at the level of flower density per unit area of land. And third, to improve confidence in the accuracy of our estimates of bird abundance, we used two methods concurrently to measure periodic changes in the number of birds.
METHODS
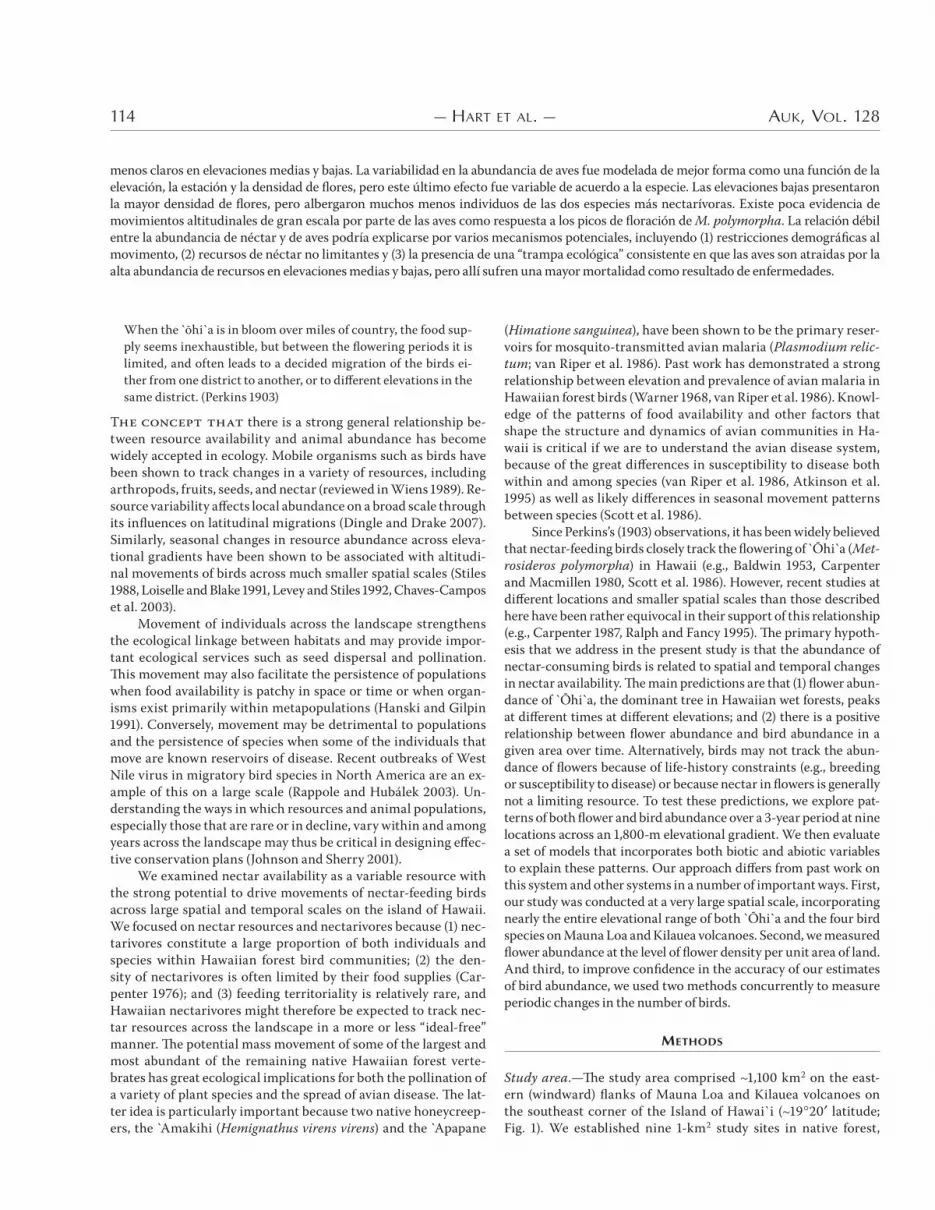
Study area.—)e study area comprised ~&,&(( km* on the east-ern (windward) flanks of Mauna Loa and Kilauea volcanoes on the southeast corner of the Island of Hawai`i (~&- *( latitude; Fig. &). We established nine &-km* study sites in native forest,
menos claros en elevaciones medias y bajas. La variabilidad en la abundancia de aves fue modelada de mejor forma como una función de la elevación, la estación y la densidad de flores, pero este último efecto fue variable de acuerdo a la especie. Las elevaciones bajas presentaron la mayor densidad de flores, pero albergaron muchos menos individuos de las dos especies más nectarívoras. Existe poca evidencia de movimientos altitudinales de gran escala por parte de las aves como respuesta a los picos de floración de M. polymorpha. La relación débil entre la abundancia de néctar y de aves podría explicarse por varios mecanismos potenciales, incluyendo (&) restricciones demográficas al movimento, (*) recursos de néctar no limitantes y (+) la presencia de una “trampa ecológica” consistente en que las aves son atraidas por la alta abundancia de recursos en elevaciones medias y bajas, pero allí sufren una mayor mortalidad como resultado de enfermedades.
12_Hart_10-031.indd 114 2/15/11 11:55:13 AM
JANUARY 2011 — BIRD AND RESOURCE VARIABILITY — 115
FIG. 1. Locations of nine 1-km2 study sites within three elevational categories on Kilauea and Mauna Loa volcanoes, Island of Hawai`i.
each containing five &-km-long transects spaced *(( m apart. )e study sites were distributed along an elevational gradient from *. to &,'(( m above sea level (a.s.l.) and were stratified into three elevational classes, with two replicates at high elevation ( &,<.( m a.s.l.), four replicates at middle elevation (&,(((–&,+(( m a.s.l.), and three at low elevation ( +(( m a.s.l.; Fig. &). )ese classes cor-respond to the three major disease “zones” identified by van Riper et al. (&-'<). More replicates were placed at middle elevations because birds were known to be least abundant there (and most abundant at high elevations). Disease transmission varies across the elevational gradient, driven primarily by seasonal patterns in abundance of the primary vector of avian malaria, the Southern House Mosquito (Culex quinquefasciatus). )ere is year-round, intense transmission among susceptible native birds at low eleva-tions, strongly seasonal transmission with periodic epizootics at
middle elevations, and very low transmission rates at high eleva-tions (Atkinson and LaPointe *((-).
Mean monthly temperatures ranged from *, C at low-elevation sites to ~&+ C at high-elevation sites. Because the study area spanned two active volcanoes, the substrate was relatively young basalt at all sites, ranging in age from &;( years BP to ~.,((( years BP (Wolfe and Morris &--<). All study plots were in aseasonal wet for-est (&,'(( mm–,,*(( mm annual rainfall) dominated by `5hi`a, the primary canopy tree in Hawaiian forests. )e understory at all sites except for two (at middle elevations) has been disturbed within the past several decades by feral pigs (Sus scrofa).
Study species.—)e four bird species examined in our study di6er in their degree of nectarivory. In `5hi`a-dominated forests, `I`iwi (Vestiaria coccinea) and Apapane spend approximately .(% and <(% of their foraging time, respectively, on 5hi`a flowers and
12_Hart_10-031.indd 115 2/15/11 11:55:15 AM
116 — HART ET AL. — AUK, VOL. 128
are considered true nectarivores, with the remainder of their di-ets being primarily foliage arthropods and, for I`iwi, other nectar sources when available (Fancy and Ralph &--;, &--'). Amakihi and Japanese White-eye (Zosterops japonicus) are both consid-ered generalists that, in addition to foliage arthropods and fruit, consume large quantities of nectar when it is available (Ralph and Noon &-'<). )ese birds might be expected to track nectar re-sources to some degree, given that nectar has far greater energy value than arthropods (Ford and Paton &-;.). In 5hi`a-dominated forests, there is sometimes little di6erence in the amount of time spent foraging on `5hi`a flowers among `I`iwi, Apapane, and Amakihi (P. Hart unpubl. data).
Bird abundance.—We used two complementary methods to quantify bird populations across the elevational gradient. Constant- e6ort mist netting provided a measure of relative abundance and provided data on breeding activity and productivity. Bird surveys (variable-circular-plot or point-transect methods, a form of dis-tance sampling; Reynolds et al. &-'(, Scott et al. &-'<) provided a means to estimate the density of our study species at each site and in each season. Each method has limitations (Karr &-'&, Remsen and Good &--<, Blake and Loiselle *((&), but by using them con-currently we aimed to get the best estimates of bird populations possible.
Mist netting was conducted monthly within a .(-ha subplot in each of the nine study areas, from January *((* through Decem-ber *((,, using &' to *, mist nets (&* = *.< m, +*-mm mesh). Nets were placed at a height of + to . m on galvanized metal poles, well below the upper canopy at all sites, which ranged from ~' m at low-elevation sites to ~*( m at some mid- and high-elevation sites. )e net height was suboptimal for capturing Apapane, which spend a large proportion of their time in the upper canopy, but was ade-quate for the other three species that make use of all canopy strata. Nets were operated for ~< h each day between (<+( and &,(( hours HST, for + to , days each month at each site. Each mist-net location had a matched pair of mist nets placed within &( m of each other, which were operated in alternate months to reduce the e6ects of net-shyness in birds. All captured birds were given federal bands and were aged and sexed using a combination of plumage, mor-phometrics, skull pneumatization, and breeding characters (Pyle &--;, U.S. Geological Survey unpubl. data). Breeding condition of captured birds was used to characterize breeding season for each elevation and species, and was determined by our assessment of the swelling of the cloacal protuberance in males and the development of a brood patch in females (Pyle &--;). Monthly changes in the rel-ative abundance of adults of all species were estimated by compar-ing mist-net capture rates (captures per net hour).
Bird populations were also quantified using point-transect distance sampling at all nine study sites. We conducted these sur-veys quarterly (once per season) at *. stations located *(( m apart throughout each &-km* study site, for a total of -(( counts per year at **. stations. Surveys were conducted between (.+( and &&(( hours. Each station was sampled for ' min. Observers recorded the time, species, detection type (heard, seen, or both), and hori-zontal distance from the station origin to the bird as exact con-tinuous distances. Estimates of cloud cover, rain, and wind speed were also recorded at each station.
Species-specific detection functions were modeled for all four species using DISTANCE, version ..(, release * ()omas et al.
*((<). Density estimates were calculated by post-stratifying data by season, year, and site from the global detection functions pooled across strata. Covariates included cloud cover, rain, wind speed, observer, season of survey, and year of survey. Akaike’s in-formation criterion (AIC; Akaike &-;+) was used to identify the best-approximating model of the data. )is model-selection cri-terion is based on the principle of parsimony and represents a tradeo6 between model fit and the number of parameters in the model (Burnham and Anderson *((*). Variances about the den-sity estimates were derived by bootstrap methods in DISTANCE from --- iterations ()omas et al. *((<).
Nectar availability.—We focused on nectar resources in 5hi a because -(% of the individual trees in most wet forests on the windward side of Hawai`i Island are this species (Hart *(&(). )e to-tal number of inflorescences per 5hi a tree was counted for .( ran-domly selected trees at each study site monthly, with one tree ( . cm diameter at breast height [dbh]) selected at each of .( stations set at &((-m intervals along the five &-km-long transects per study area. Estimates of flower abundance were then scaled up to density of flowers per hectare by multiplying the monthly mean number of flowers (for the .( randomly selected trees) by the density of 5hi`a trees at each site. `5hi`a tree density was estimated by counting all trees that were . cm dbh within each of *. nine-meter-radius plots set at *((-m intervals along the same five transects as above.
Because nectar availability and quality can vary with eleva-tion, we followed protocols developed by Carpenter (&-;<) to mea-sure nectar volume and calorie content in two inflorescences on each of &( randomly selected `5hi`a trees at two sites per eleva-tion across the gradient during spring and early summer *((,. We then used our estimates of inflorescence density to examine how energy (calories ha4&) available to birds may vary within and among sites. Because these estimates were derived from only two seasons during one year of the study, they were not incorporated into statistical models for bird abundance.Statistical Analyses
Modeling flower abundance.—To partition variance in flower abun-dance, we used generalized linear regression for repeated measures. We constructed models of flower abundance that were ranked with Akaike’s information criterion adjusted for sample size in an information-theoretic framework (AICc; Akaike &-;+, Burnham and Anderson *((*). )e models with AICc values * were con-sidered the best-approximating models, but we also considered models within * to , AICc units of the best-approximating models.
Although we did not sample the same trees repeatedly, we sam-pled the same sites repeatedly, and we expect flower counts to be se-rially autocorrelated within a site. For regression analysis to yield valid estimates of variance, observations must be independent. If positive autocorrelation structure is ignored, estimates of variance will be biased low (e.g., Little et al. *((*) and analyses will be more likely to detect weak or spurious relationships. For the most com-plex model structure that we considered, we compared AICc values of this model with no autocorrelation structure to versions with a first-order (AR[&]) and a compound symmetry (CS) autocorrelation structure (Keselman et al. &--', Guerin and Stroup *((().
We modeled log flower abundance with an identity link func-tion and a normal error distribution using PROC MIXED in SAS, version ' (SAS Institute, Cary, North Carolina). We examined the
12_Hart_10-031.indd 116 2/15/11 11:55:15 AM
JANUARY 2011 — BIRD AND RESOURCE VARIABILITY — 117
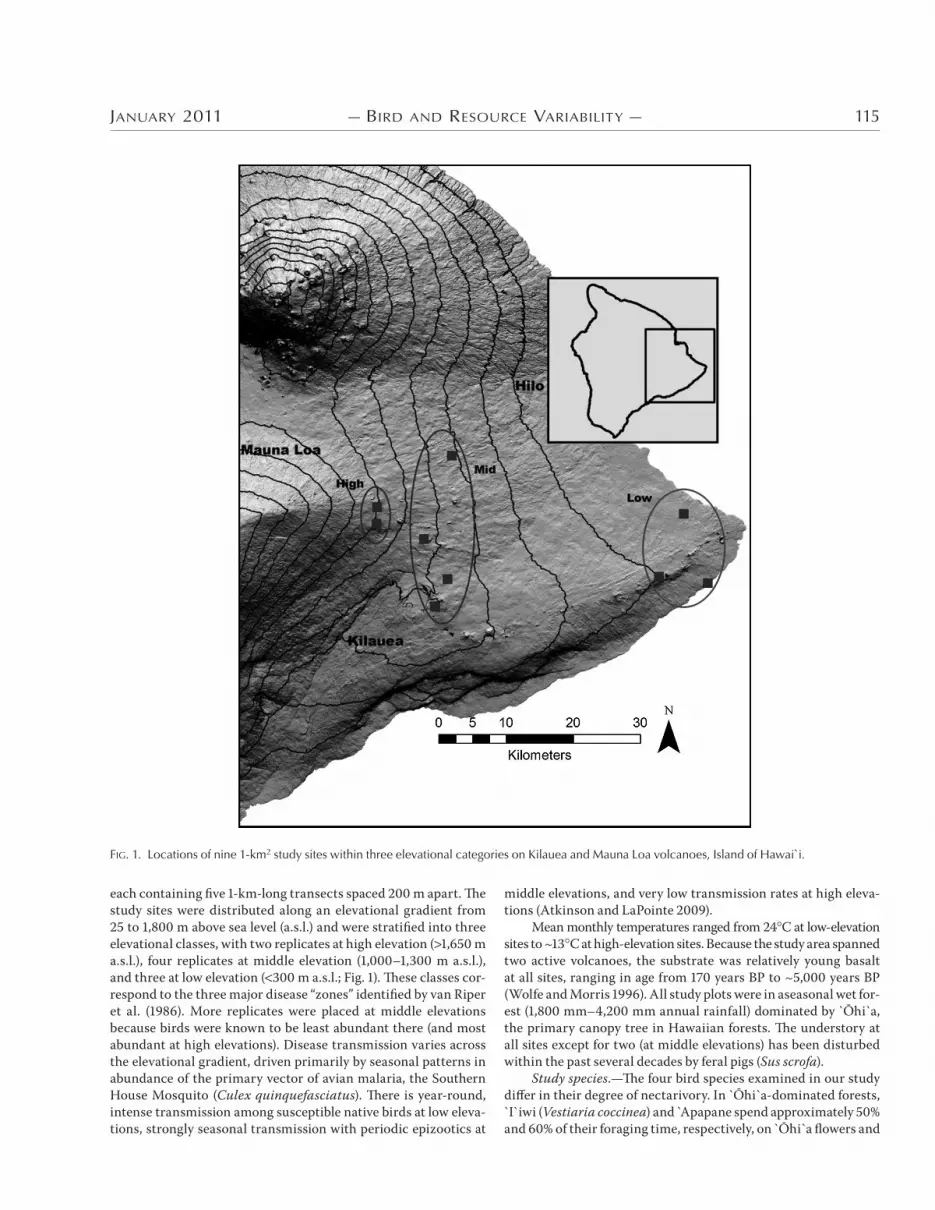
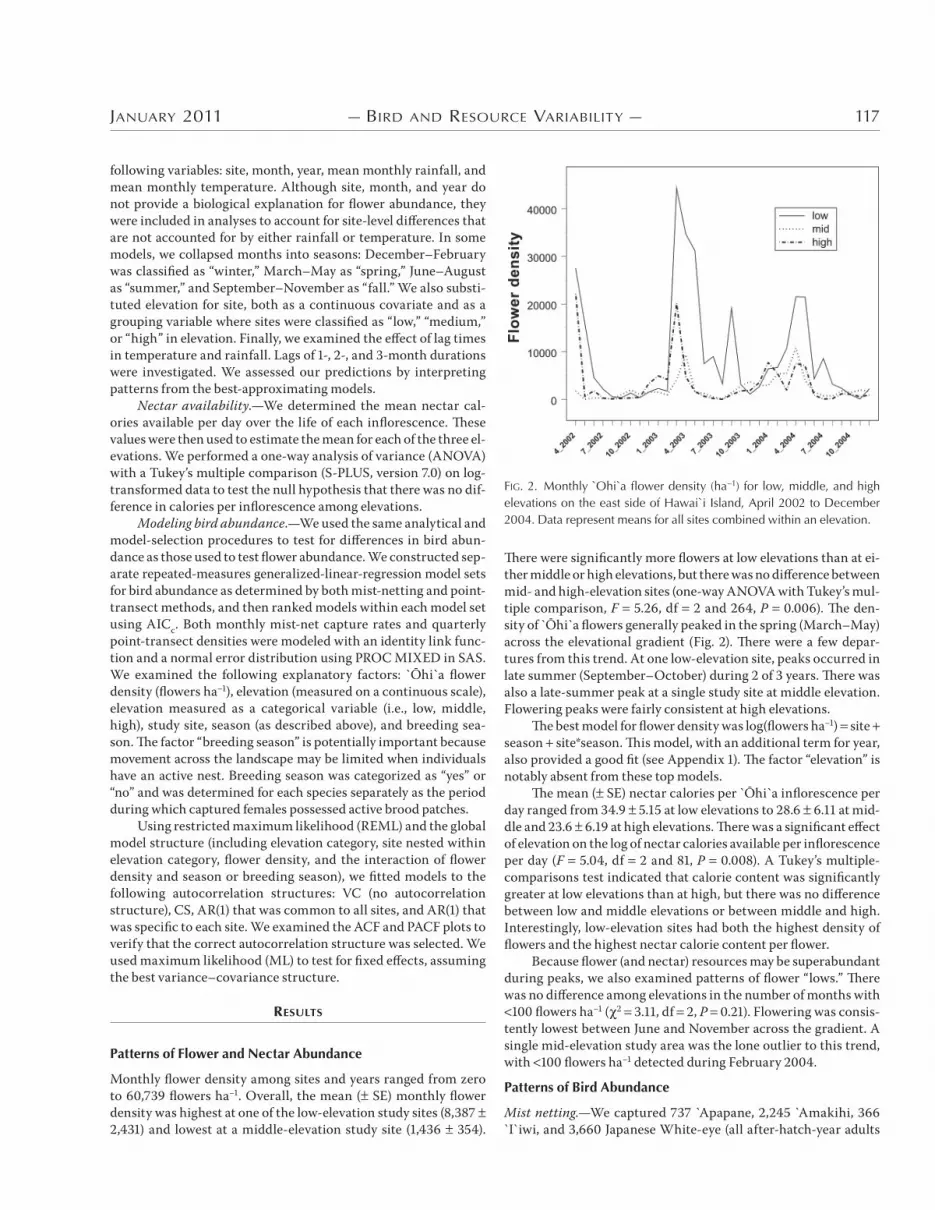
)ere were significantly more flowers at low elevations than at ei-ther middle or high elevations, but there was no di6erence between mid- and high-elevation sites (one-way ANOVA with Tukey’s mul-tiple comparison, F ..*<, df * and *<,, P (.((<). )e den-sity of 5hi`a flowers generally peaked in the spring (March–May) across the elevational gradient (Fig. *). )ere were a few depar-tures from this trend. At one low-elevation site, peaks occurred in late summer (September–October) during * of + years. )ere was also a late-summer peak at a single study site at middle elevation. Flowering peaks were fairly consistent at high elevations.
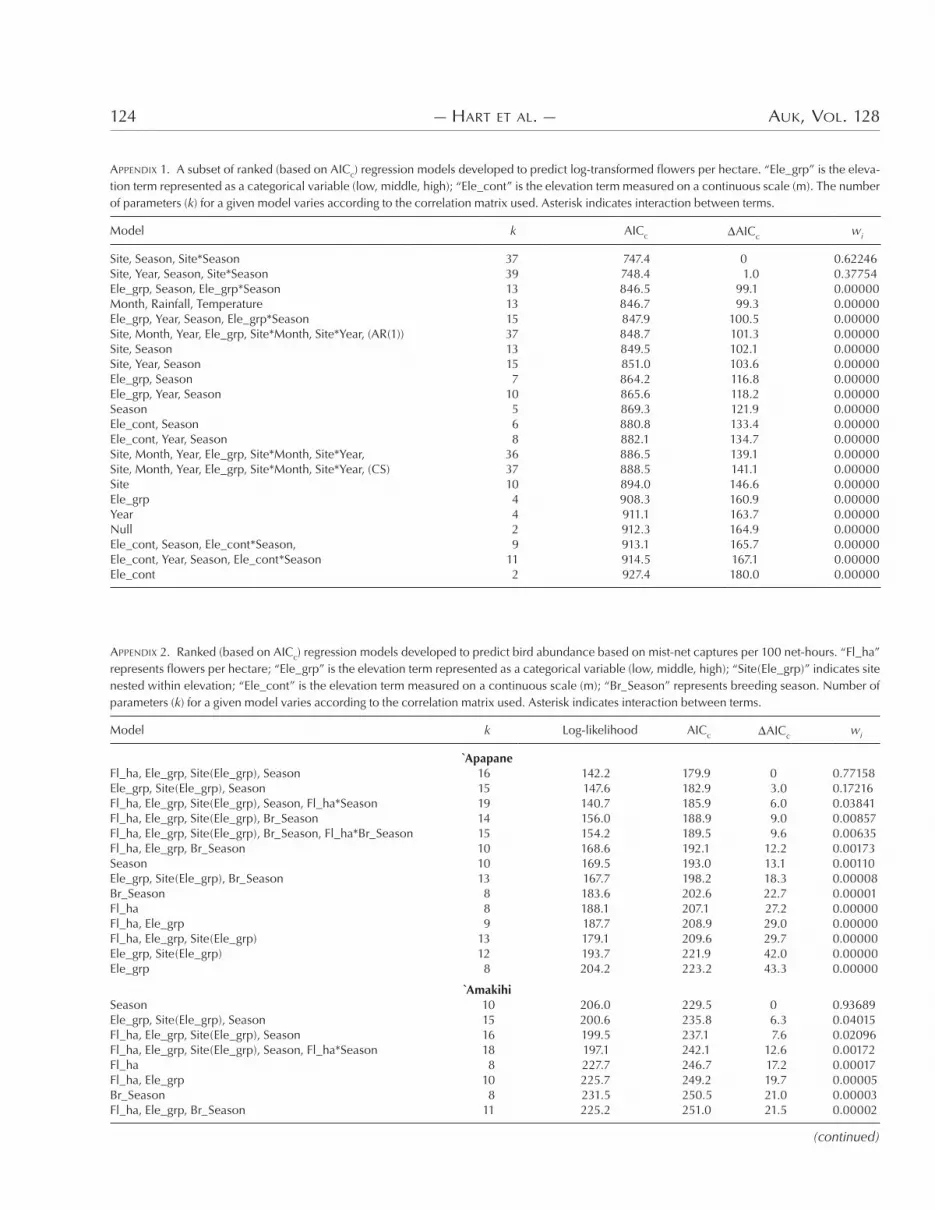
)e best model for flower density was log(flowers ha4&) site season site*season. )is model, with an additional term for year, also provided a good fit (see Appendix &). )e factor “elevation” is notably absent from these top models.
)e mean ( SE) nectar calories per `5hi`a inflorescence per day ranged from +,.- ..&. at low elevations to *'.< <.&& at mid-dle and *+.< <.&- at high elevations. )ere was a significant e6ect of elevation on the log of nectar calories available per inflorescence per day (F ..(,, df * and '&, P (.(('). A Tukey’s multiple-comparisons test indicated that calorie content was significantly greater at low elevations than at high, but there was no di6erence between low and middle elevations or between middle and high. Interestingly, low-elevation sites had both the highest density of flowers and the highest nectar calorie content per flower.
Because flower (and nectar) resources may be superabundant during peaks, we also examined patterns of flower “lows.” )ere was no di6erence among elevations in the number of months with
&(( flowers ha4& ( * +.&&, df *, P (.*&). Flowering was consis-tently lowest between June and November across the gradient. A single mid-elevation study area was the lone outlier to this trend, with &(( flowers ha4& detected during February *((,.Patterns of Bird Abundance
Mist netting.—We captured ;+; Apapane, *,*,. Amakihi, +<< `I`iwi, and +,<<( Japanese White-eye (all after-hatch-year adults
following variables: site, month, year, mean monthly rainfall, and mean monthly temperature. Although site, month, and year do not provide a biological explanation for flower abundance, they were included in analyses to account for site-level di6erences that are not accounted for by either rainfall or temperature. In some models, we collapsed months into seasons: December–February was classified as “winter,” March–May as “spring,” June–August as “summer,” and September–November as “fall.” We also substi-tuted elevation for site, both as a continuous covariate and as a grouping variable where sites were classified as “low,” “medium,” or “high” in elevation. Finally, we examined the e6ect of lag times in temperature and rainfall. Lags of &-, *-, and +-month durations were investigated. We assessed our predictions by interpreting patterns from the best-approximating models.
Nectar availability.—We determined the mean nectar cal-ories available per day over the life of each inflorescence. )ese values were then used to estimate the mean for each of the three el-evations. We performed a one-way analysis of variance (ANOVA) with a Tukey’s multiple comparison (S-PLUS, version ;.() on log-transformed data to test the null hypothesis that there was no dif-ference in calories per inflorescence among elevations.
Modeling bird abundance.—We used the same analytical and model-selection procedures to test for di6erences in bird abun-dance as those used to test flower abundance. We constructed sep-arate repeated-measures generalized-linear-regression model sets for bird abundance as determined by both mist-netting and point-transect methods, and then ranked models within each model set using AICc. Both monthly mist-net capture rates and quarterly point-transect densities were modeled with an identity link func-tion and a normal error distribution using PROC MIXED in SAS. We examined the following explanatory factors: `5hi`a flower density (flowers ha4&), elevation (measured on a continuous scale), elevation measured as a categorical variable (i.e., low, middle, high), study site, season (as described above), and breeding sea-son. )e factor “breeding season” is potentially important because movement across the landscape may be limited when individuals have an active nest. Breeding season was categorized as “yes” or “no” and was determined for each species separately as the period during which captured females possessed active brood patches.
Using restricted maximum likelihood (REML) and the global model structure (including elevation category, site nested within elevation category, flower density, and the interaction of flower density and season or breeding season), we fitted models to the following autocorrelation structures: VC (no autocorrelation structure), CS, AR(&) that was common to all sites, and AR(&) that was specific to each site. We examined the ACF and PACF plots to verify that the correct autocorrelation structure was selected. We used maximum likelihood (ML) to test for fixed e6ects, assuming the best variance–covariance structure.
RESULTS
Patterns of Flower and Nectar Abundance
Monthly flower density among sites and years ranged from zero to <(,;+- flowers ha4&. Overall, the mean ( SE) monthly flower density was highest at one of the low-elevation study sites (',+'; *,,+&) and lowest at a middle-elevation study site (&,,+< +.,).
FIG. 2. Monthly `Ohi`a flower density (ha!1) for low, middle, and high elevations on the east side of Hawai`i Island, April 2002 to December 2004. Data represent means for all sites combined within an elevation.
12_Hart_10-031.indd 117 2/15/11 11:55:18 AM
118 — HART ET AL. — AUK, VOL. 128
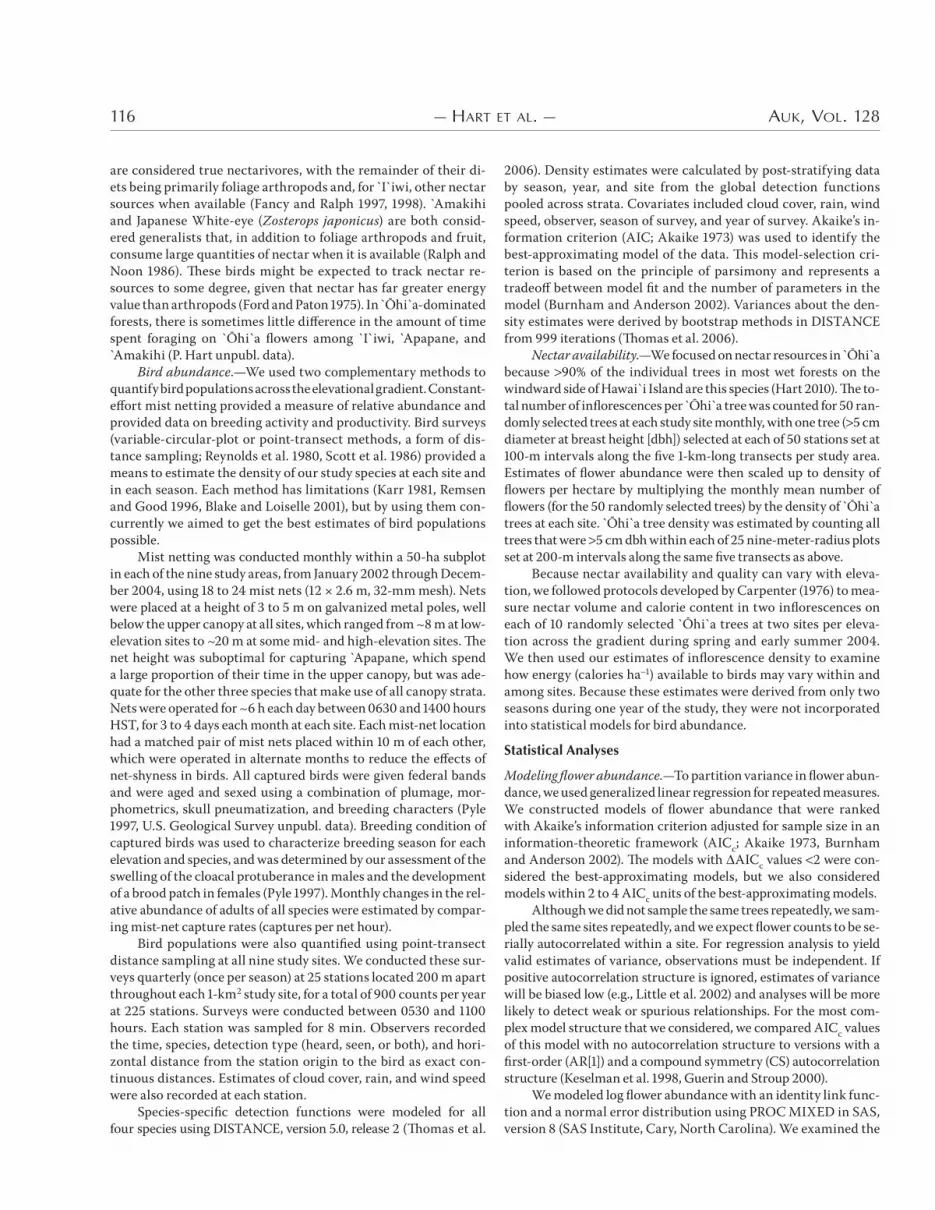
for each species) during -*,+-( mist-net hours. Japanese White-eye were the only species commonly captured at all study sites throughout the year. Apapane were also present at all study sites but were relatively rare at low-elevation sites. Amakihi were rarely captured (or detected in surveys) at three of four mid-elevation study areas but were generally abundant at all low- and high-el-evation sites. As expected, `I`iwi were primarily captured at the high-elevation study sites because of their susceptibility to mos-quito-borne disease at lower elevations ( &,+(( m).
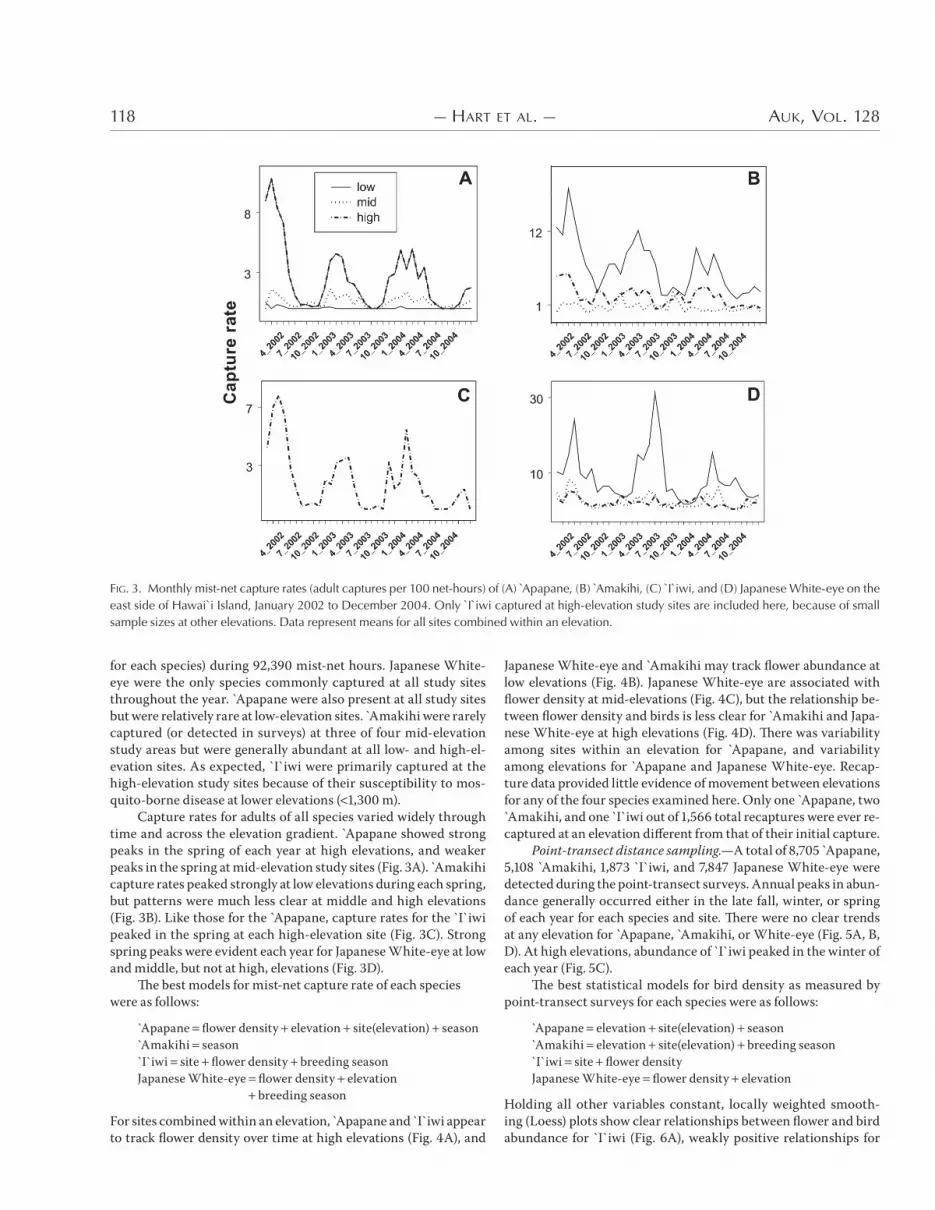
Capture rates for adults of all species varied widely through time and across the elevation gradient. Apapane showed strong peaks in the spring of each year at high elevations, and weaker peaks in the spring at mid-elevation study sites (Fig. +A). Amakihi capture rates peaked strongly at low elevations during each spring, but patterns were much less clear at middle and high elevations (Fig. +B). Like those for the Apapane, capture rates for the `I`iwi peaked in the spring at each high-elevation site (Fig. +C). Strong spring peaks were evident each year for Japanese White-eye at low and middle, but not at high, elevations (Fig. +D).
)e best models for mist-net capture rate of each species were as follows:
Apapane flower density elevation site(elevation) seasonAmakihi season`I`iwi site flower density breeding seasonJapanese White-eye flower density elevation
breeding season
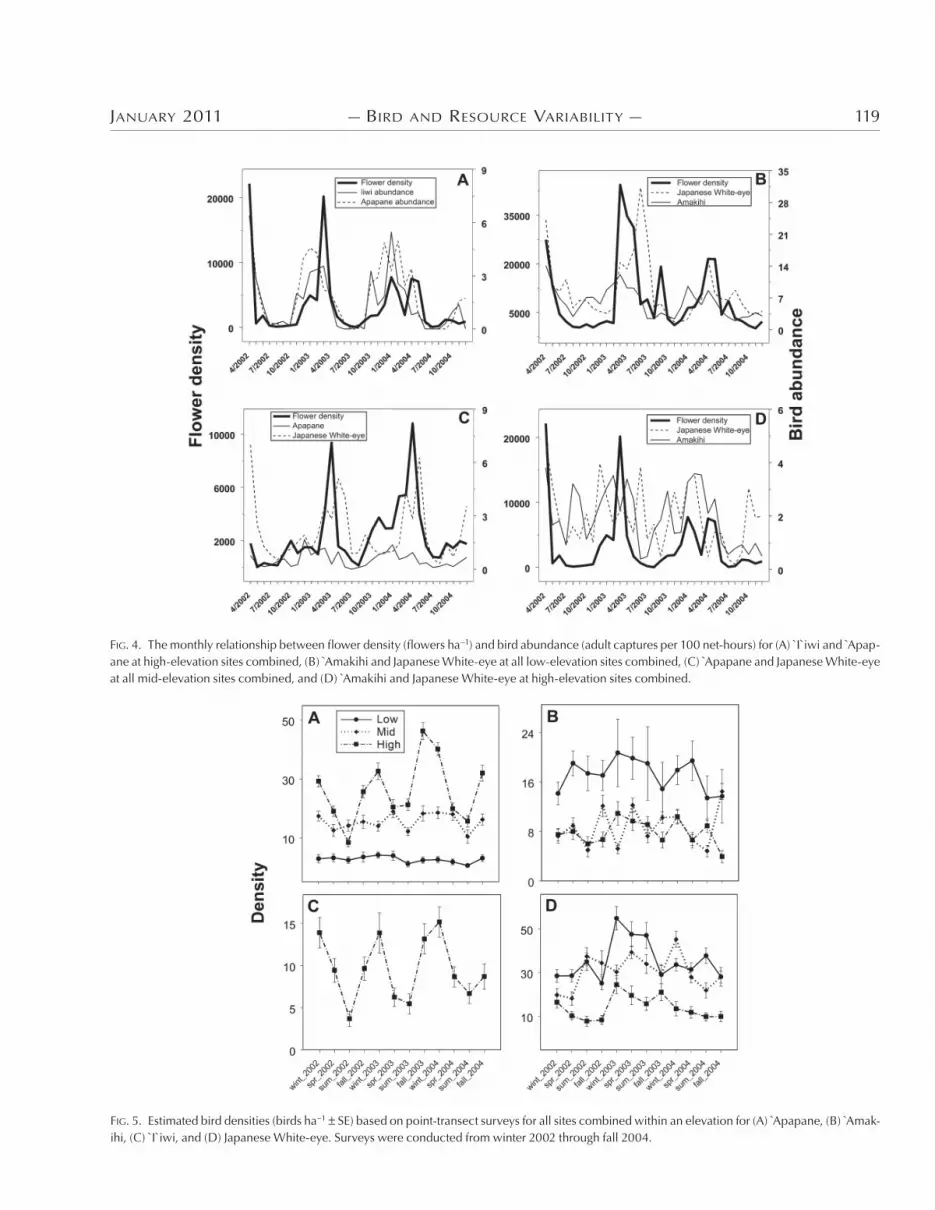
For sites combined within an elevation, Apapane and I`iwi appear to track flower density over time at high elevations (Fig. ,A), and
Japanese White-eye and Amakihi may track flower abundance at low elevations (Fig. ,B). Japanese White-eye are associated with flower density at mid-elevations (Fig. ,C), but the relationship be-tween flower density and birds is less clear for Amakihi and Japa-nese White-eye at high elevations (Fig. ,D). )ere was variability among sites within an elevation for Apapane, and variability among elevations for Apapane and Japanese White-eye. Recap-ture data provided little evidence of movement between elevations for any of the four species examined here. Only one Apapane, two Amakihi, and one I`iwi out of &,.<< total recaptures were ever re-
captured at an elevation di6erent from that of their initial capture.Point-transect distance sampling.—A total of ',;(. Apapane,
.,&(' Amakihi, &,';+ `I`iwi, and ;,',; Japanese White-eye were detected during the point-transect surveys. Annual peaks in abun-dance generally occurred either in the late fall, winter, or spring of each year for each species and site. )ere were no clear trends at any elevation for Apapane, Amakihi, or White-eye (Fig. .A, B, D). At high elevations, abundance of I`iwi peaked in the winter of each year (Fig. .C).
)e best statistical models for bird density as measured by point-transect surveys for each species were as follows:
Apapane elevation site(elevation) seasonAmakihi elevation site(elevation) breeding season
`I`iwi site flower densityJapanese White-eye flower density elevation
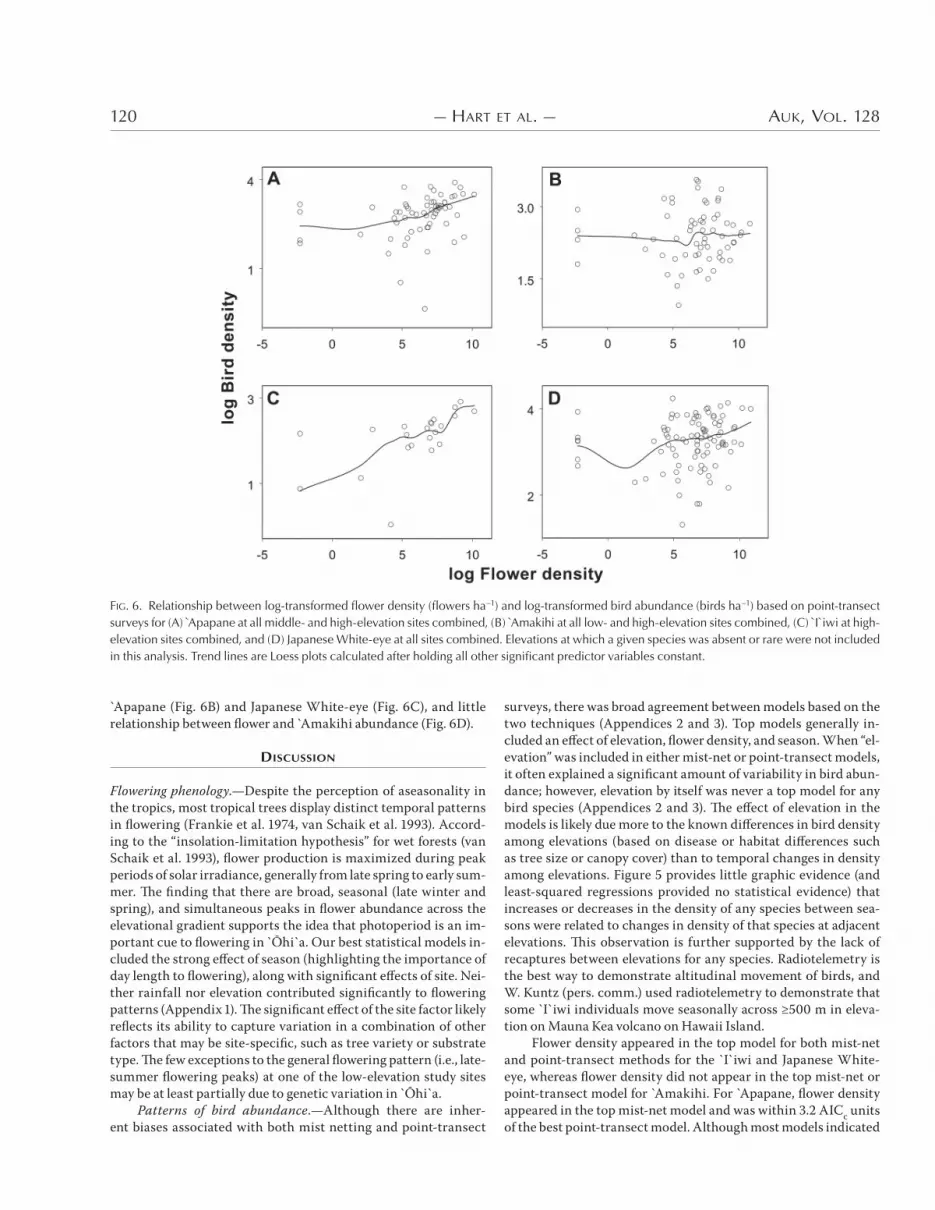
Holding all other variables constant, locally weighted smooth-ing (Loess) plots show clear relationships between flower and bird abundance for `I`iwi (Fig. <A), weakly positive relationships for
FIG. 3. Monthly mist-net capture rates (adult captures per 100 net-hours) of (A) Apapane, (B) Amakihi, (C) I`iwi, and (D) Japanese White-eye on the east side of Hawai`i Island, January 2002 to December 2004. Only `I`iwi captured at high-elevation study sites are included here, because of small sample sizes at other elevations. Data represent means for all sites combined within an elevation.
12_Hart_10-031.indd 118 2/15/11 11:55:20 AM
JANUARY 2011 — BIRD AND RESOURCE VARIABILITY — 119
FIG. 4. The monthly relationship between flower density (flowers ha!1) and bird abundance (adult captures per 100 net-hours) for (A) I`iwi and Apap-ane at high-elevation sites combined, (B) Amakihi and Japanese White-eye at all low-elevation sites combined, (C) Apapane and Japanese White-eye at all mid-elevation sites combined, and (D) Amakihi and Japanese White-eye at high-elevation sites combined.
FIG. 5. Estimated bird densities (birds ha!1 SE) based on point-transect surveys for all sites combined within an elevation for (A) Apapane, (B) Amak-ihi, (C) I`iwi, and (D) Japanese White-eye. Surveys were conducted from winter 2002 through fall 2004.
12_Hart_10-031.indd 119 2/15/11 11:55:23 AM
120 — HART ET AL. — AUK, VOL. 128
Apapane (Fig. <B) and Japanese White-eye (Fig. <C), and little relationship between flower and Amakihi abundance (Fig. <D).
DISCUSSION
Flowering phenology.—Despite the perception of aseasonality in the tropics, most tropical trees display distinct temporal patterns in flowering (Frankie et al. &-;,, van Schaik et al. &--+). Accord-ing to the “insolation-limitation hypothesis” for wet forests (van Schaik et al. &--+), flower production is maximized during peak periods of solar irradiance, generally from late spring to early sum-mer. )e finding that there are broad, seasonal (late winter and spring), and simultaneous peaks in flower abundance across the elevational gradient supports the idea that photoperiod is an im-portant cue to flowering in `5hi`a. Our best statistical models in-cluded the strong e6ect of season (highlighting the importance of day length to flowering), along with significant e6ects of site. Nei-ther rainfall nor elevation contributed significantly to flowering patterns (Appendix &). )e significant e6ect of the site factor likely reflects its ability to capture variation in a combination of other factors that may be site-specific, such as tree variety or substrate type. )e few exceptions to the general flowering pattern (i.e., late-summer flowering peaks) at one of the low-elevation study sites may be at least partially due to genetic variation in `5hi`a.
Patterns of bird abundance.—Although there are inher-ent biases associated with both mist netting and point-transect
surveys, there was broad agreement between models based on the two techniques (Appendices * and +). Top models generally in-cluded an e6ect of elevation, flower density, and season. When “el-evation” was included in either mist-net or point-transect models, it often explained a significant amount of variability in bird abun-dance; however, elevation by itself was never a top model for any bird species (Appendices * and +). )e e6ect of elevation in the models is likely due more to the known di6erences in bird density among elevations (based on disease or habitat di6erences such as tree size or canopy cover) than to temporal changes in density among elevations. Figure . provides little graphic evidence (and least-squared regressions provided no statistical evidence) that increases or decreases in the density of any species between sea-sons were related to changes in density of that species at adjacent elevations. )is observation is further supported by the lack of recaptures between elevations for any species. Radiotelemetry is the best way to demonstrate altitudinal movement of birds, and W. Kuntz (pers. comm.) used radiotelemetry to demonstrate that some `I`iwi individuals move seasonally across >.(( m in eleva-tion on Mauna Kea volcano on Hawaii Island.
Flower density appeared in the top model for both mist-net and point-transect methods for the `I`iwi and Japanese White-eye, whereas flower density did not appear in the top mist-net or point-transect model for Amakihi. For Apapane, flower density appeared in the top mist-net model and was within +.* AICc units of the best point-transect model. Although most models indicated
FIG. 6. Relationship between log-transformed flower density (flowers ha!1) and log-transformed bird abundance (birds ha!1) based on point-transect surveys for (A) Apapane at all middle- and high-elevation sites combined, (B) Amakihi at all low- and high-elevation sites combined, (C) I`iwi at high-elevation sites combined, and (D) Japanese White-eye at all sites combined. Elevations at which a given species was absent or rare were not included in this analysis. Trend lines are Loess plots calculated after holding all other significant predictor variables constant.
12_Hart_10-031.indd 120 2/15/11 11:55:24 AM
JANUARY 2011 — BIRD AND RESOURCE VARIABILITY — 121
that flower density played a role in variation in bird abundance, the e6ect of flower density on bird abundance was generally small. For example, the best point-transect model for I`iwi predicted an increase of &–+ birds ha4& as flowers increased from low to high density at the high-elevation study sites. Similarly, the best mist-net model for Apapane predicted an increase of ~& bird ha4& over the range of flower densities. Figures , and < also illustrate that this relationship may be relatively loose. For all species, there were months in which flower density was high but bird abundance low—or, perhaps more interestingly, bird abundance high but flower abundance low. Recent studies at di6erent locations and spatial scales in Hawaii have also been rather equivocal in their support of the relationship between bird and flower abundance. For example, the relationship between nectarivorous birds and flowers was shown to be highly variable between years (Carpen-ter &-';), study sites (Ralph and Fancy &--.), and species (Hess et al. *((&). At high-elevation wet forest on Maui, Berlin et al. (*((&) found no relationship between `5hi`a flowers and density of `I`iwi, Apapane, or Amakihi at the scale of “station,” but they did find a relationship at the scale of the entire study area.
)ere are at least three non-mutually-exclusive mechanisms that may explain the loose relationship between nectar-feeding birds and flower abundance. First, birds may be constrained from foraging optimally on variable nectar resources by numerous fac-tors. Second, disease and other anthropogenic disturbances are likely keeping populations below carrying capacity and nectar re-sources may no longer limit adults throughout much of the year. )ird, the current system may be viewed through the framework of an “ecological trap.”
Constraints to movement.—Most organisms are constrained from foraging in an otherwise ideal free way by factors such as territoriality, environmental tolerances, mobility, breeding, and imperfect knowledge of resource patterns. With the exception of breeding, none of these factors should generally have prevented birds in our study from tracking food availability across the land-scape to maximize their energy intake. All four bird species ex-hibit varying degrees of territoriality around the nest site, but with the possible exception of Amakihi (e.g., van Riper &-';), it is widely believed that movement is not constrained by territoriality outside of the nesting season.
)e nesting period (January–May) for nectarivores appears to be timed to coincide with peaks in `5hi`a bloom. If flowering peaks occur across the gradient at about the same time, birds can-not track these peaks, because they are constrained to remain with their nests. Could these birds then be following bloom during the period when they are not constrained by breeding? )e lack of re-captures between elevations does not support this idea. Also, we would have expected a significant interaction between breeding season and flower density in the models. )is interaction did not appear in any of the best models for all four species.
Nonlimiting nectar resources.—Animals generally travel less when food resources are abundant in their current habitat (Pyke et al. &-;;). Animals may also commonly switch to other food re-sources rather than travel to new areas when a particular resource becomes scarce. Most nectarivorous birds also utilize arthropods (Cotton *((;), especially during breeding periods, or have been known to switch from nectar to other carbohydrate sources or ar-thropods when nectar becomes scarce (Carpenter and Macmillen
&-'(, Paton &-'(). `5hi`a nectar is an essential element in the diet of the three honeycreeper species included in our study, but nectar is not the sole food for any species (Perkins &-(+). During periods of high flower abundance, nectar is likely a nonlimiting resource, which reduces the incentive to migrate. During periods of low `5hi`a flower abundance across the landscape, the birds may sometimes switch food resources rather than travel long dis-tances to find the rare patches of high flower density. At least six other midcanopy tree and shrub species that produce nectar are common throughout our windward Hawaii study sites. Although they account for only ~&(% of the trees present, they may serve to supplement nectarivore diets when `5hi`a nectar is scarce. In addition, arthropods contribute a significant (and variable) pro-portion of the diet of all species examined here. Although we did not sample arthropods or other nectar resources available to birds in the present study, future e6orts to model spatial and temporal changes in bird abundance would benefit from including all food sources available to birds.
Lowland forest as an ecological trap.—)e significant e6ects of elevation and flower density on bird abundance are consistent with the view that lower-elevation sites serve as ecological traps. Dwernychuk and Boag (&-;*) described an ecological trap as low-quality habitat for reproduction and survival that cannot sustain a population but is preferred over other available high-quality habi-tats. Ecological traps may occur when environmental change de-couples the cues that individuals use to assess habitat quality from the true quality of the environment (Dwernychuk and Boag &-;*, Gates and Gysel &-;'). An animal’s preference remains unchanged, but the positive outcome normally associated with a given cue is now reversed (Robertson and Hutto *((<). Mosquito-transmitted avian malaria primarily a6ects birds at low and middle eleva-tions in Hawaii (van Riper et al. &-'<). )is disease can cause high mortality in the `I`iwi (Atkinson et al. &--.) and variable rates of mortality in native Amakihi and Apapane (van Riper et al. &-'<). Some populations of Amakihi may even be evolving resistance to malaria (Woodworth et al. *((.). Only the introduced Japanese White-eye is generally considered resistant to infection by avian malaria. If these Hawaiian species assess habitat quality primar-ily through flower density, there is great potential that areas at low and middle elevations with high flower density (and higher nectar calorie content) may serve, currently and/or historically, as “eco-logical traps” for these birds, with infection with avian malaria, reduced probability of survival, and population decline being the negative outcomes of following flowering peaks to these areas. In this scenario, low-elevation forests in Hawaii may be the first known example of an ecological trap based on disease. Of course, the relevance of the ecological-trap model varies with species, de-pending on their mobility and susceptibility to disease.
)e movement of individuals in response to flowering may be a major factor in a handful of historical bird extinctions in Hawaii. In addition to the evolution of increased disease resistance (Wood-worth et al. *((., Atkinson and LaPointe *((-), the persistence of Hawaii’s remaining forest birds that follow resources across the landscape may require behavioral adaptations to the way they as-sess temporal changes in habitat quality. Kokko and Sutherland (*((&) discussed a number of behavioral processes that may “res-cue” a population from an ecological trap. In one scenario, indi-viduals may exhibit philopatric preferences, whereby they prefer
12_Hart_10-031.indd 121 2/15/11 11:55:24 AM
122 — HART ET AL. — AUK, VOL. 128
habitat with similar characteristics to that in which they were born. )is latter possibility may be particularly relevant to Ha-waii and may help explain the low density of mobile individuals in some areas with abundant resources. Individuals with innate tendencies to select habitat characteristic of low- and some mid-elevation areas with high levels of disease would decline (despite high food abundance), whereas populations would remain stable for birds at higher elevations. Along with demonstrated evolution of disease resistance, behavioral adaptations may play an impor-tant role in the persistence of Hawaii’s remaining forest birds.
ACKNOWLEDGMENTS
We thank Kamehameha Schools, Hawai`i Volcanoes National Park, and Hawai`i Division of Forestry and Wildlife for permis-sion to work on their properties. We thank our colleagues on the Biocomplexity of Introduced Avian Diseases in Hawai`i research group, particularly J. Ahumada, D. LaPointe, C. Atkinson, S. Jarvi, P. Banko, and D. Du6y, for critical insight and collaboration, and W. Steiner and D. Helweg for support. )is work would not have been possible without the help of many volunteer field assistants, and we are grateful for their hard work, patience, and ability to work long hours in the field under sometimes adverse conditions (in-cluding sharp lava, dense mosquitoes, tropical storms, deep earth cracks, and vandals). )is study was supported by National Science Foundation Grant DEB (('+-,, and by the U.S. Geological Survey Invasive Species and Wildlife and Terrestrial Resources programs.
LITERATURE CITED
A?2@?!, H. &-;+. Information theory and an extension of the maxi-mum likelihood principle. Pages *<;–*'& in International Sym-posium on Information )eory, *nd ed. (B. N. Petran and F. Csaki, Eds.). Akademiai Kiado, Budapest.
A0?@%"9%, C. T., 2%A D. A. L2P9@%0!. *((-. Ecology and patho-genicity of avian malaria and pox. Pages *+,–*.* in Conserva-tion Biology of Hawaiian Forest Birds: Implications for Island Avifauna (T. K. Pratt, C. T. Atkinson, P. Banko, J. Jacobi, and B. L. Woodworth, Eds.). Yale University Press, New York.
A0?@%"9%, C. T., K. L. W99A", R. J. D#"!?, L. S. S@B!9, 2%A W. M. I?9. &--.. Wildlife disease and conservation in Hawaii: Pathoge-nicity of avian malaria (Plasmodium relictum) in experimentally infected I`iwi (Vestiaria coccinea). Parasitology &&&:S.-–S<-.
B2BAC@%, P. H. &-.+. Annual cycle, environment, and evolution in the Hawaiian honeycreepers (Aves: Drepaniidae). University of California Publications in Zoology .*:*'.–+-'.
B!1B@%, K. E., J. C. S@$9%, T. K. P1200, J. R. K9C2B"?D, 2%A J. S. H20E@!BA. *((&. Akohekohe response to flower availability: Sea-sonal abundance, foraging, breeding, and molt. Pages *(*–*&* in Evolution, Ecology, Conservation, and Management of Hawaiian Birds: A Vanishing Avifauna (J. M. Scott, S. Conant, and C. van Riper III, Eds.). Studies in Avian Biology, no. **.
BB2?!, J. G., 2%A B. A. L9@"!BB!. *((&. Bird assemblages in second-growth and old-growth forests, Costa Rica: Perspectives from mist nests and point counts. Auk &&':+(,–+*<.
B#1%82$, K. P., 2%A D. R. A%A!1"9%. *((*. Model Selection and Multimodel Inference: A Practical Information-)eoretic Approach, *nd ed. Springer-Verlag, New York.
C21:!%0!1, F. L. &-;<. Plant–pollinator interactions in Hawaii: Pollination energetics of Metrosideros collina (Myrtaceae). Ecol-ogy .;:&&*.–&&,,.
C21:!%0!1, F. L. &-';. Food abundance and territoriality: To defend or not to defend? American Zoologist *;:+';–+--.
C21:!%0!1, F. L., 2%A R. E. M23M@BB!%. &-'(. Resource limita-tion, foraging strategies, and community structure in Hawaiian honeycreepers. Pages &&((–&&(, in Acta XVII Congressus Inter-nationalis Ornithologici (R. Nöhring, Ed.). Deutsche Ornitholo-gen-Gesellschaft, Berlin.
C82F!"-C2$:9", J., J. E. A1GF2B9, 2%A M. A12D2. *((+. Altitu-dinal movements and conservation of Bare-necked Umbrellabird Cephalopterus glabricollis of the Tillarán Mountains, Costa Rica. Bird Conservation International &+:,.–.'.
C9009%, P. A. *((;. Seasonal resource tracking by Amazonian hummingbirds. Ibis &,-:&+.–&,*.
D@%HB!, H., 2%A A. D12?!. *((;. What is migration? BioScience .;:&&+–&*&.
DC!1%D38#?, L. W., 2%A D. A. B92H. &-;*. Ducks nesting in asso-ciation with gulls—An ecological trap? Canadian Journal of Zool-ogy .(:..-–.<+.
F2%3D, S. G., 2%A C. J. R2B:8. &--;. Apapane (Himatione san-guinea). In )e Birds of North America, no. *-< (A. Poole and F. Gill, Eds.). Birds of North America, Philadelphia, and American Ornithologists’ Union, Washington, D.C.
F2%3D, S. G., 2%A C. J. R2B:8. &--'. `I`iwi (Vestiaria coccinea). In )e Birds of North America, no. +*; (A. Poole and F. Gill, Eds.). Birds of North America, Philadelphia, and American Ornitholo-gists’ Union, Washington, D.C.
F91A, H. A., 2%A D. C. P209%. &-;.. )e value of insects and nectar to honeyeaters. Emu ;<:'+–',.
F12%?@!, G. W., H. G. B2?!1, 2%A P. A. O:B!1. &-;,. Comparative phenological studies of trees in tropical wet and dry forests in the lowlands of Costa Rica. Journal of Ecology <*:''&–-&-.
F1!0C!BB, S. D., 2%A H. L. L#32", J1. &-;(. On territorial behavior and other factors influencing habitat distribution in birds. I. )e-oretical development. Acta Biotheoretica &-:&<–+<.
G20!", J. E., 2%A L. W. GD"!B. &-;'. Avian nest dispersion and fledg-ing success in field–forest ecotones. Ecology .-:';&–''+.
G#!1@%, L., 2%A W. W. S019#:. *(((. A simulation study to eval-uate PROC MIXED analysis of repeated measures data. Pro-ceedings of the &*th Annual Conference on Applied Statistics in Agriculture. Kansas State University, Manhattan.
H2%"?@, I., 2%A M. G@B:@%. &--&. Metapopulation dynamics: Brief history and conceptual domain. Biological Journal of the Linnean Society ,*:+–&<.
H210, P. J. *(&(. Tree growth and age in an ancient Hawaiian wet for-est: Vegetation dynamics at two spatial scales. Journal of Tropical Ecology *<:&–&&.
H!"", S. C., P. C. B2%?9, M. H. R!D%9BA", G. J. B1!%%!1, L. P. L2%@2C!, 2%A J. D. J239/@. *((&. Drepanidine movements in rela-tion to food availability in subalpine woodland on Mauna Kea, Hawaii. Pages &.,–&<+ in Evolution, Ecology, Conservation, and Management of Hawaiian Birds: A Vanishing Avifauna (J. M. Scott, S. Conant, and C. van Ripe1 III, Eds.). Studies in Avian Biology, no. **.
J98%"9%, M. D., 2%A T. W. S8!11D. *((&. E6ects of food availabil-ity on the distribution of migratory warblers among habitats in Jamaica. Journal of Animal Ecology ;(:.,<–.<(.
12_Hart_10-031.indd 122 2/15/11 11:55:25 AM
JANUARY 2011 — BIRD AND RESOURCE VARIABILITY — 123
K211, J. R. &-'&. Surveying birds with mist nets. Pages <*–<; in Esti-mating Numbers of Terrestrial Birds (C. J. Ralph and J. M. Scott, Eds.). Studies in Avian Biology, no. <.
K!"!B$2%, H. J., J. ABH@%2, R. K. K9C2B38#?, 2%A R. D. W9BE@%-H!1. &--'. A comparison of two approaches for selecting covariance structures in the analysis of repeated measurements. Communica-tions in Statistics: Simulation and Computation *;:.-&–<(,.
K9??9, H., 2%A W. J. S#08!1B2%A. *((&. Ecological traps in changing environments: Ecological and evolutionary conse-quences of a behaviorally mediated Allee e6ect. Evolutionary Ecology Research +:.+;–..&.
L!F!D, D. J., 2%A F. G. S0@B!". &--*. Evolutionary precursors of long-distance migration: Resource availability and movement patterns in Neotropical landbirds. American Naturalist &,(:,,;–,;<.
L@00B!, R. C., W. W. S019#:, 2%A R. J. F1!#%A. *((*. SAS for lin-ear models, ,th ed. SAS Institute, Cary, North Carolina.
L9@"!BB!, B. A., 2%A J. G. BB2?!. &--&. Temporal variation in birds and fruits along an elevational gradient in Costa Rica. Ecology ;*:&'(–&-+.
P209%, D. C. &-'(. )e importance of manna, honeydew and lerp in the diets of honeyeaters. Emu '(:*&+–**<.
P!1?@%", R. C. L. &-(+. Vertebrata. Pages +<.–,<< in Fauna Hawai-iensis, vol. &, part IV (D. Sharp, Ed.). University Press, Cambridge, United Kingdom.
PD?!, G. H., H. R. P#BB@2$, 2%A E. L. C821%9F. &-;;. Optimal foraging: A selective review of theory and tests. Quarterly Review of Biology .*:&+;–&.,.
PDB!, P. &--;. Identification Guide to North American Birds, Part I: Columbidae to Ploceidae. Slate Creek Press, Bolinas, California.
R2B:8, C. J., 2%A S. G. F2%3D. &--.. Demography and movements of Apapane and I`iwi in Hawaii. Condor -;:;*-–;,*.
R2B:8, C. J., 2%A B. R. N99%. &-'<. Foraging interactions of small Hawaiian forest birds. Pages &--*–*((< in Acta XIX Congressus Internationalis Ornithologici (H. Ouellet, Ed.). National Museum of Natural Sciences, University of Ottawa Press, Ottawa.
R2::9B!, J. H., 2%A Z. H#/IB!?. *((+. Migratory birds and West Nile virus. Journal of Applied Microbiology -,:,;–.'.
R!$"!%, J. V., J1., 2%A D. A. G99A. &--<. Misuse of data from mist-net captures to measure relative abundance in bird populations. Auk &&+:+'&–+-'.
R!D%9BA", R. T., J. M. S3900, 2%A R. A. N#""/2#$. &-'(. A vari-able circular-plot method for estimating bird numbers. Condor '*:+(-–+&+.
R9/!10"9%, B. A., 2%A R. L. H#009. *((<. A framework for under-standing ecological traps and an evaluation of existing evidence. Ecology ';:&(;.–&('..
S3900, J. M., S. M9#%02@%":1@%H, F. L. R2$"!D, 2%A C. B. K!:B!1. &-'<. Forest bird communities of the Hawaiian Islands: )eir dynamics, ecology, and conservation. Studies in Avian Biol-ogy, no. -.
S0@B!", F. G. &-''. Altitudinal movements of birds on the Caribbean slope of Costa Rica: Implications for conservation. Pages *,+–*.' in Tropical Rainforests: Diversity and Conservation (F. Almeda and C. M. Pringle, Eds.). California Academy of Sciences, San Francisco.
T89$2", L., J. L. L22?!, S. S01@%A/!1H, F. F. C. M21J#!", S. T. B#3?B2%A, D. L. B9138!1", D. R. A%A!1"9%, K. P. B#1%82$, S. L. H!AB!D, J. H. P9BB21A, 2%A 908!1". *((<. DISTANCE ..(. Release *. Research Unit for Wildlife Population Assessment, University of St. Andrews, St. Andrews, United Kingdom.
F2% R@:!1, C., III. &-';. Breeding ecology of the Hawaii Common Amakihi. Condor '-:'.–&(*.
F2% R@:!1, C., III, S. G. V2% R@:!1, M. L. G9EE, 2%A M. L2@1A. &-'<. )e epizootiology and ecological significance of malaria in Hawaiian landbirds. Ecological Monographs .<:+*;–+,,.
F2% S382@?, C. P., P. L. T!1/91H8, 2%A S. J. W1@H80. &--+. )e phenology of tropical forests: Adaptive significance and conse-quences for primary consumers. Annual Review of Ecology and Systematics *,:+.+–+;;.
W21%!1, R. E. &-<'. )e role of introduced diseases in the extinc-tion of the endemic Hawaiian avifauna. Condor ;(:&(&–&*(.
W@!%", J. A. &-'-. )e Ecology of Bird Communities, vol. *: Pro-cesses and Variations. Cambridge University Press, Cambridge, United Kingdom.
W99AC9108, B. L., C. T. A0?@%"9%, D. A. L2P9@%0!, P. J. H210, C. S. S:@!H!B, E. J. TC!!A, C. H!%%!$2%, J. L!B1#%, T. D!%-!00!, R. D!M90", 2%A 908!1". *((.. Host population persis-tence in the face of vector-borne diseases: Hawaii Amakihi and avian malaria. Proceedings of the National Academy of Sciences USA &(*:&.+&–&.+<.
W9BE!, E. W., 2%A J. M911@". &--<. Geologic Map of the Island of Hawai`i. U.S.G.S. Miscellaneous Investigations Series Map i-*.*,-A. U.S. Geological Survey, Washington, D.C.
Associate Editor: C. A. Lindell
12_Hart_10-031.indd 123 2/15/11 11:55:25 AM
124 — HART ET AL. — AUK, VOL. 128
APPENDIX 1. A subset of ranked (based on AICc) regression models developed to predict log-transformed flowers per hectare. “Ele_grp” is the eleva-tion term represented as a categorical variable (low, middle, high); “Ele_cont” is the elevation term measured on a continuous scale (m). The number of parameters (k) for a given model varies according to the correlation matrix used. Asterisk indicates interaction between terms.
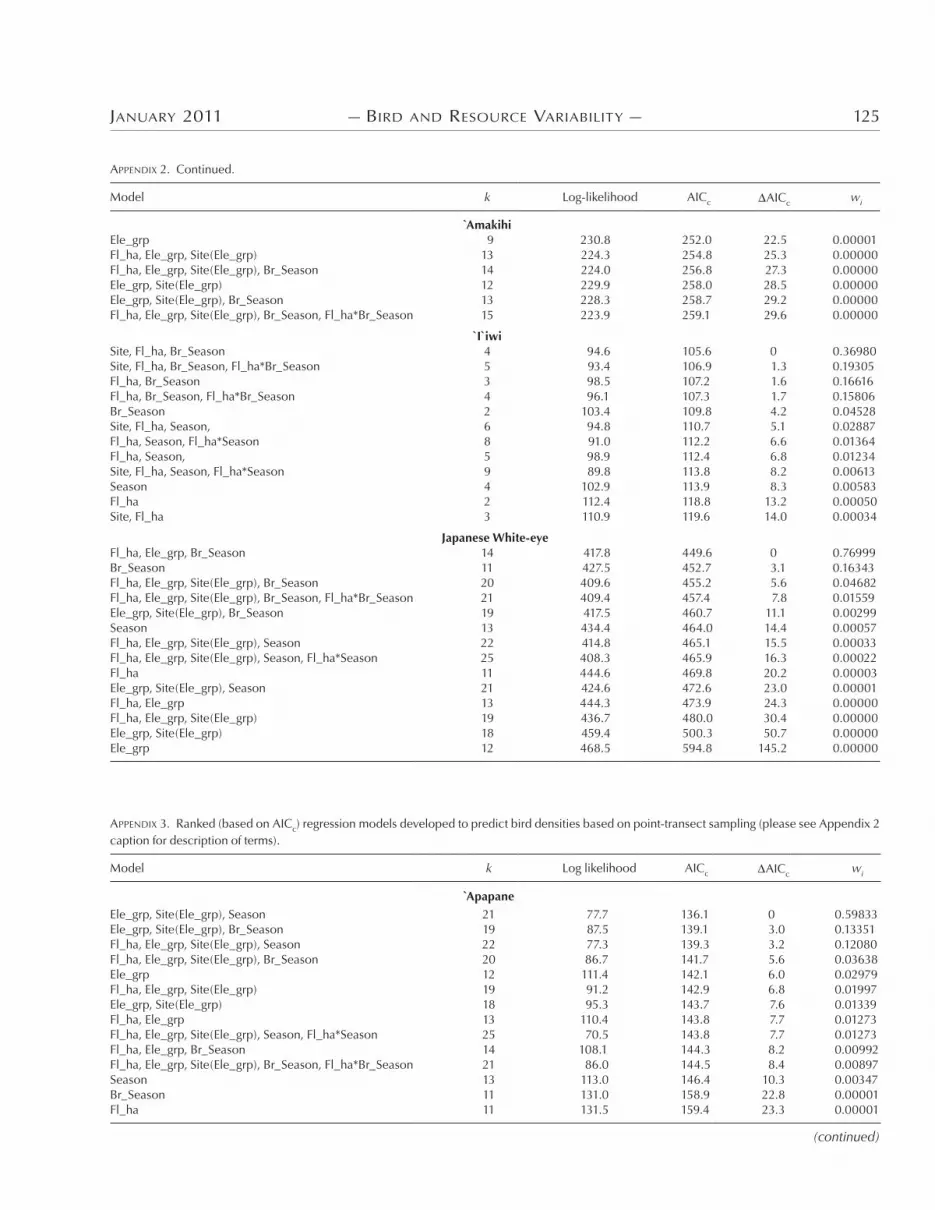
APPENDIX 2. Ranked (based on AICc) regression models developed to predict bird abundance based on mist-net captures per 100 net-hours. “Fl_ha” represents flowers per hectare; “Ele_grp” is the elevation term represented as a categorical variable (low, middle, high); “Site(Ele_grp)” indicates site nested within elevation; “Ele_cont” is the elevation term measured on a continuous scale (m); “Br_Season” represents breeding season. Number of parameters (k) for a given model varies according to the correlation matrix used. Asterisk indicates interaction between terms.
JANUARY 2011 — BIRD AND RESOURCE VARIABILITY — 125
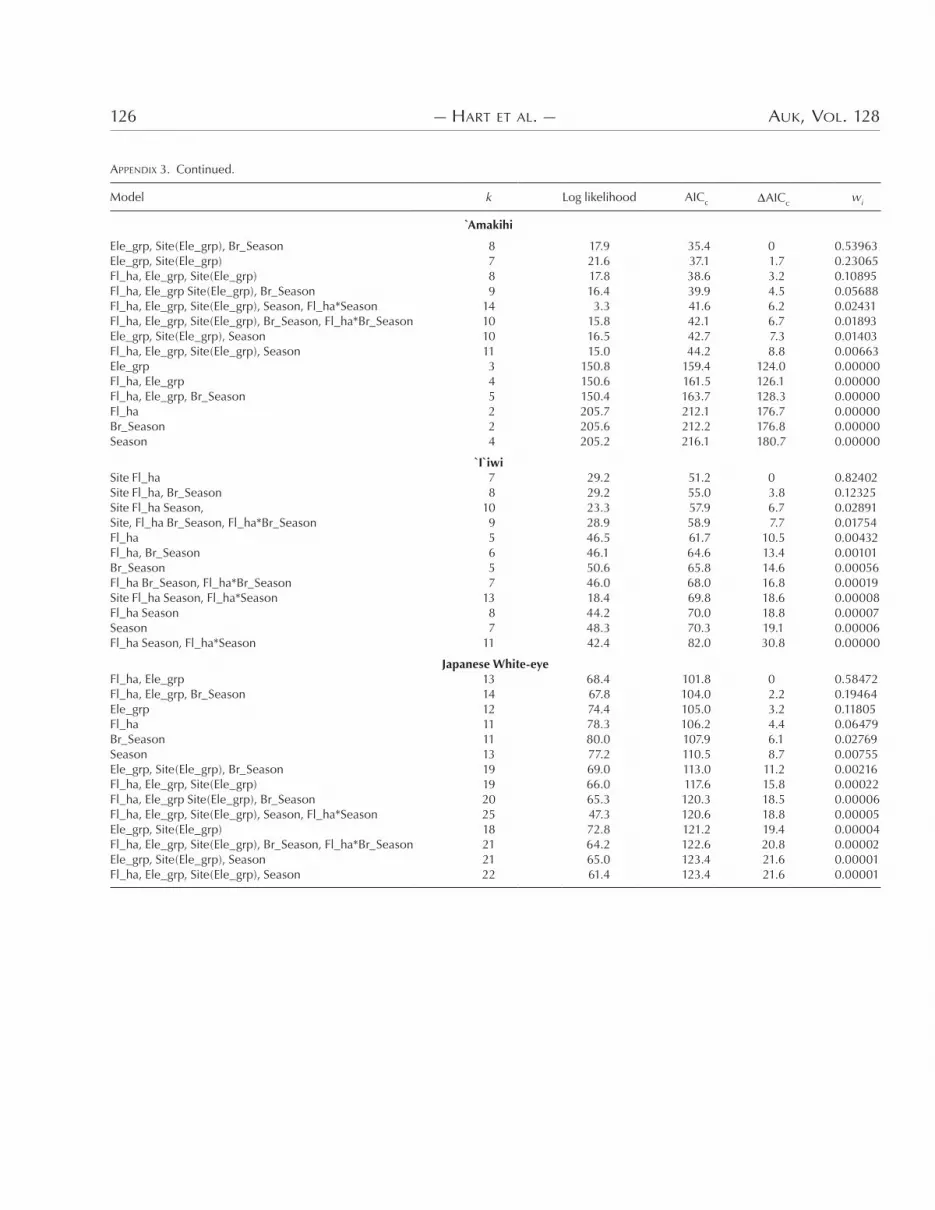
APPENDIX 3. Ranked (based on AICc) regression models developed to predict bird densities based on point-transect sampling (please see Appendix 2 caption for description of terms).