Page 1
Molecular Ecology (2011) 20, 342–356 doi: 10.1111/j.1365-294X.2010.04949.x
Replicated hybrid zones of Xiphophorus swordtails alongan elevational gradient
Z. W. CULUMBER,*† H. S . FISHER,* M. TOBLER,‡§ M. MATEOS,§ P. H. BARBER,–
M. D. SORENSON** and G. G. ROSENTHAL*†
*Texas A&M Department of Biology, 3258 TAMU, College Station, TX 77843-3258, USA, †Centro de Investigaciones
Cientıficas de las Huastecas ‘Aguazarca’, Calnali, Hidalgo, Mexico, ‡Department of Zoology, Oklahoma State University,
Stillwater, OK 74078, USA, §Department of Wildlife and Fisheries Sciences, Texas A&M University, College Station, TX
77843, USA, –Department of Ecology and Evolutionary Biology, University of California, Los Angeles, CA 90095, USA,
**Department of Biology, Boston University, Boston, MA 02215, USA
Corresponde
E-mail: zculu
Abstract
Natural hybrid zones provide opportunities to study a range of evolutionary phenomena
from speciation to the genetic basis of fitness-related traits. We show that widespread
hybridization has occurred between two neo-tropical stream fishes with partial
reproductive isolation. Phylogenetic analyses of mitochondrial sequence data showed
that the swordtail fish Xiphophorus birchmanni is monophyletic and that X. malinche is
part of an independent monophyletic clade with other species. Using informative single
nucleotide polymorphisms in one mitochondrial and three nuclear intron loci, we
genotyped 776 specimens collected from twenty-three sites along seven separate stream
reaches. Hybrid zones occurred in replicated fashion in all stream reaches along a
gradient from high to low elevation. Genotyping revealed substantial variation in
parental and hybrid frequencies among localities. Tests of FIS and linkage disequilib-
rium (LD) revealed generally low FIS and LD except in five populations where both
parental species and hybrids were found suggesting incomplete reproductive isolation.
In these locations, heterozygote deficiency and LD were high, which suggests either
selection against early generation hybrids or assortative mating. These data lay the
foundation to study the adaptive basis of the replicated hybrid zone structure and for
future integration of behaviour and genetics to determine the processes that lead to the
population genetic patterns observed in these hybrid zones.
Keywords: elevational gradient, introgression, linkage disequilibrium, local adaptation, Poecilii-
dae, population genetics
Received 10 June 2010; revision received 21 October 2010; accepted 2 November 2010
Introduction
Natural hybridization is an important evolutionary
mechanism in the diversification of both plants and
animals (Arnold 1997; Dowling & Secor 1997; Rieseberg
et al. 2003). The mixing of divergent genomes from differ-
ent parent taxa can generate new genetic combinations
leading to novel, transgressive phenotypes upon which
selection can act (Rieseberg et al. 1999; Bell & Travis
2005). As a result of the variation generated by hybridiza-
nce: Zachary W. Culumber, Fax: +1 979 845 2891;
[email protected]
tion, hybrid populations are subject to a broader range of
possible evolutionary trajectories (Guillaume & Whitlock
2007; Kalisz & Kramer 2008). The relative fitness of this
broad variety of new phenotypes ultimately determines
the stability and fate of hybrid zones (Barton & Hewitt
1985; Barton 2001; Burke & Arnold 2001).
Much research on hybridization focuses on effects of
intrinsic post-zygotic reproductive isolation, where
incompatibilities between genes from both parents
affect hybrid fitness reducing survivability or fertility
(for review see Burke & Arnold 2001). In such cases
with reduced hybrid fitness, hybrid zones can be stably
maintained by continual immigration of parental forms
� 2010 Blackwell Publishing Ltd
Page 2
HYBRID ZONES ALONG AN ELEVATIONAL GRADIENT 343
to the centre of the zone (Barton & Hewitt 1985). More
recent work, however, suggests that extrinsic post-
zygotic isolation, in which hybrid fitness is determined
by an interaction of hybrid genotype and the environment,
may be more common than previously thought (Schluter
2009; Schluter & Conte 2009; Johannesson et al. 2010). In
those cases, a hybrid zone can be maintained with neg-
ligible immigration of parental forms, and hybrids are
expected to be at least as fit as the parentals in inter-
mediate ecotonal habitats (‘bounded hybrid superiority’
model; Moore 1977). Since intrinsic isolating mecha-
nisms can be relatively easily assessed in the laboratory,
there is a wealth of data on genetic incompatibilities,
while environmentally dependent hybrid fitness
remains poorly understood (Wolf et al. 2010).
Environmental effects of hybridization can be studied
where different species adapt to local environmental
conditions (Kawecki & Ebert 2004), and closely related
species occupy proximate but environmentally distinct
habitats (Fuller et al. 2007; Tobler et al. 2008). Environ-
� 2010 Blackwell Publishing Ltd
mentally intermediate zones, where locally adapted spe-
cies may come in contact, may facilitate hybridization if
there is a breakdown in reproductive isolation. Accord-
ingly, natural hybrid zones commonly occur along gra-
dients of climatic and ecological variables (Yanchukov
et al. 2006; Nikula et al. 2008; Ruegg 2008). If selection
along environmental gradients is driving hybrid zone
formation and maintaining hybrid zone structure, as in
the model of ‘bounded hybrid superiority’, hybrid
zones with replicated structure should occur in inde-
pendent tributaries across the landscape wherever the
selective gradient occurs. Swordtail fish of the genus
Xiphophorus allow us to test this hypothesis in a natural
setting.
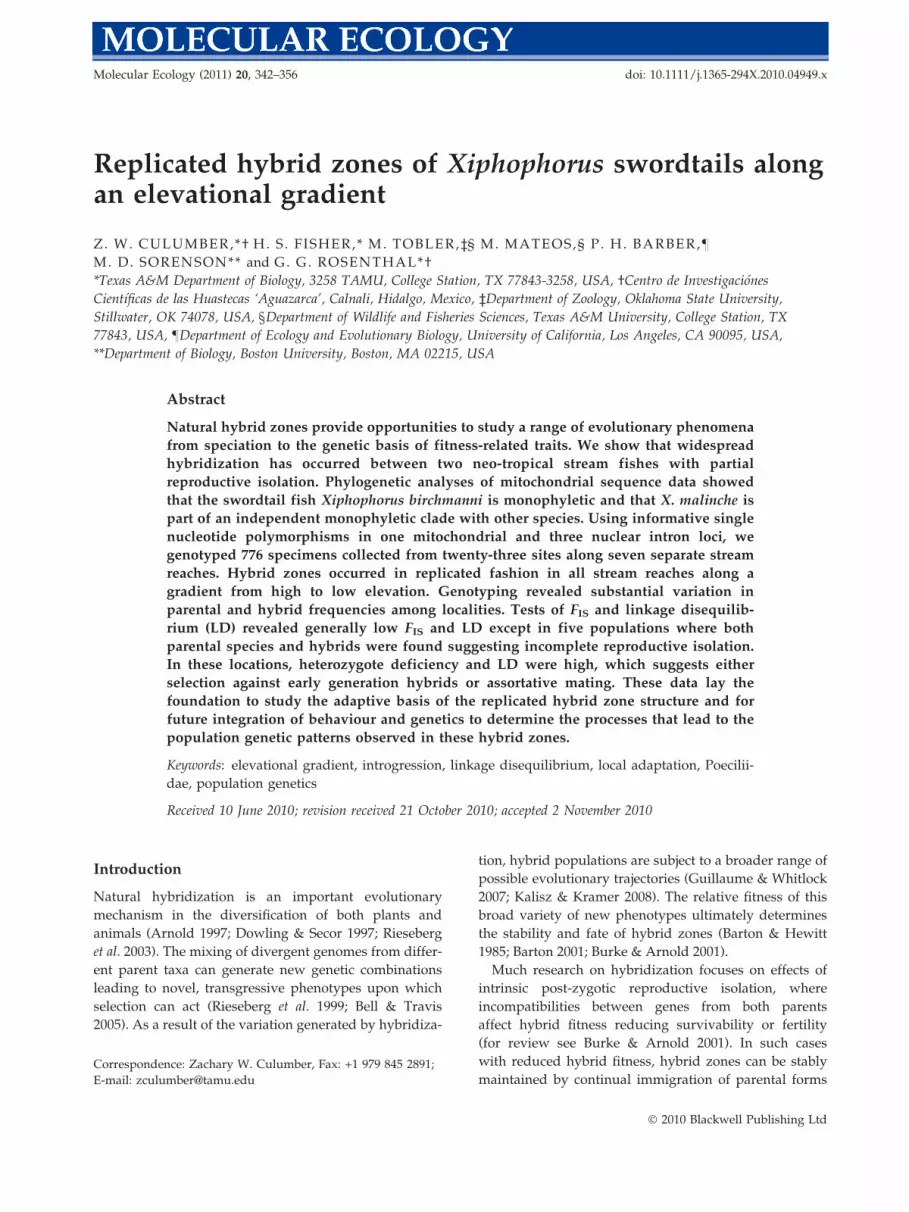
Xiphophorus birchmanni and X. malinche form natural
hybrids in the Sierra Madre Oriental of eastern Mexico
(Rosenthal et al. 2003). X. birchmanni and X. malinche are
members of the monophyletic, northern or Rıo Panuco
clade of swordtails (Fig. 1). Kallman & Kazianis (2006)
suggested that the northern swordtails diversified as a
Fig. 1 Strict consensus tree based on
analyses using three maximum-likeli-
hood (ML) models implemented in
PAUP. Bootstrap support values from ML
analyses (GRL-Garli, PAUP and RxM-
RAxML) and Bayesian posterior proba-
bilities (BYS-MRBAYES) from separate
analyses are shown for the nodes of
interest. Values not shown were below
50. Sequences from the present study
are highlighted in grey. XM2, the only
mitochondrial sequence observed in X.
cortezi, is shared with X. malinche.
Page 3
344 Z. W. CULUMBER ET AL.
result of the formation of the Sierra Madre Oriental of
eastern Mexico. Uplifting and subsequent folding of the
landscape produced isolated species endemic to small
geographic areas, like X. malinche, X. continens, X. mont-
ezumae, X. multilineatus and X. nigrensis (Rauchenberger
et al. 1990; Kallman & Kazianis 2006). Phylogenetic
hypotheses have differed somewhat in the placement of
X. birchmanni and X. malinche. Most phylogenetic analy-
ses including behavioural, morphological and randomly
amplified polymorphic DNA (RAPD) data have placed
them as sister species (Rauchenberger et al. 1990;
Borowsky et al. 1995; Marcus & McCune 1999; Morris et
al. 2001), while Meyer et al.’s (1994) phylogenetic
hypothesis based on sequence data from three loci
placed them as distant relatives within the clade.
Xiphophorus birchmanni and X. malinche differ in a num-
ber of morphological traits (Rauchenberger et al. 1990;
Rosenthal et al. 2003), most notably the lack of the sexu-
ally-dimorphic sword on the caudal fin in X. birchmanni,
which has been secondarily lost most likely due to a
reversal of female sexual preferences (Wong & Rosenthal
2006). The distributions of X. birchmanni and X. malinche
also differ. Xiphophorus malinche is typically found in
headwaters and highland streams, while X. birchmanni
are found at lower elevations (Rauchenberger et al. 1990;
Rosenthal et al. 2003; Gutierrez-Rodrıguez et al. 2008).
Xiphophorus birchmanni has a wider distribution overall
but borders the distribution of X. malinche in our study
area, and the two were previously documented in symp-
atry without mention of hybrids (Rauchenberger et al.
1990). Natural hybrids between these species have been
abundant in populations at least since the late 1990s
(Rosenthal et al. 2003). Morphological and electrophoretic
studies of specimens collected in 1997 revealed extensive
hybridization at intermediate elevations of the Rıo
Calnali with an upstream-to-downstream gradient from
malinche-type to birchmanni-type morphological and
isozyme traits (Rosenthal et al. 2003). The breakdown in
reproductive isolation in areas of parapatry may be facili-
tated by recent increases in organic pollution that
resulted in impaired ability to distinguish between spe-
cies-typical olfactory cues (Fisher et al. 2006).
In the present study we investigated the X. birchman-
ni–X. malinche hybrid zones with three primary objec-
tives: (i) To test whether the parental populations at
either end of the hybrid zone are indeed phylogeneti-
cally distinct X. birchmanni and X. malinche. (ii) To
develop informative SNP markers from DNA sequence
data. (iii) To test for an upstream to downstream gradi-
ent in genetic markers in multiple stream reaches. We
use phylogenetic analysis of mitochondrial sequence
data to demonstrate that X. birchmanni and X. malinche
form two distinct lineages found at opposite ends of an
elevational gradient. We further show that hybrids are
present in at least seven distinct stream reaches sepa-
rated by mountain ridges and that each hybrid zone is
characterized by elevational gradients in allele frequen-
cies. By analysing patterns of co-segregation in single
nucleotide polymorphism (SNP) markers designed from
mitochondrial and unlinked nuclear DNA loci, we
show substantial variation in population structure both
within and among stream reaches.
Methods
Sampling
We collected whole specimens or fin clips of X. malin-
che, X. birchmanni and their hybrids from 39 sites in the
states of Hidalgo, San Luis Potosi and Veracruz, Mexico
between 2003 and 2007 (Fig. 2, Table 1). Though col-
lecting occurred between 2003 and 2007, for each popu-
lation, samples from only one point in time were used
for SNP genotyping. At a few sites, samples were col-
lected in both 2003 and 2007, with the first sample used
for DNA sequencing and the second for SNP genotyp-
ing. As previous mark–recapture experiments found no
recaptures after 3 years (GGR and HSF, unpublished
data), it is unlikely we re-sampled any of the same indi-
viduals. Another northern swordtail, X. cortezi, was col-
lected from the Rıo Axtla due to past uncertainties over
its relationship with X. malinche (see sources above on
placement of X. birchmanni and X. malinche). For out-
group comparison, the more distantly related variable
platyfish, Xiphophorus variatus, was collected from the
Rıo Garces and the Rıo Venado. Tricaine methylsulfo-
nate (MS-222) was used to anesthetize fish for photo-
graphing or euthanize fish prior to preservation. For
genotyping, we either removed a small piece of the
upper portion of the caudal fin, or preserved the whole
fish. Tissues were stored in 70–95% ethanol.
DNA extraction, mtDNA and intron amplification andsequencing
Whole genomic DNA was extracted from fin clips with
a DNeasy tissue kit (Qiagen Inc.) according to the man-
ufacturer’s protocol. The mitochondrial control region
d-loop (CR) was amplified with polymerase chain reac-
tion (PCR) using primers CR-A and CR-E (Lee et al.
1995). Reaction conditions for 15 lL PCRs were as fol-
lows: 10· PCR Buffer, 2.5 mM MgCl2, 0.5 lM each F and
R primers, 1.5 lL dNTPs, 0.625 U Taq polymerase, 1 lL
genomic DNA (gDNA) at 20 ng ⁄ lL and ddH2O to
15 lL. A hot-start PCR was used for mtDNA. Briefly,
samples containing all of the above components except
Taq polymerase were placed in a thermocycler. A
touchdown thermocycler protocol was initiated but the
� 2010 Blackwell Publishing Ltd
Page 4
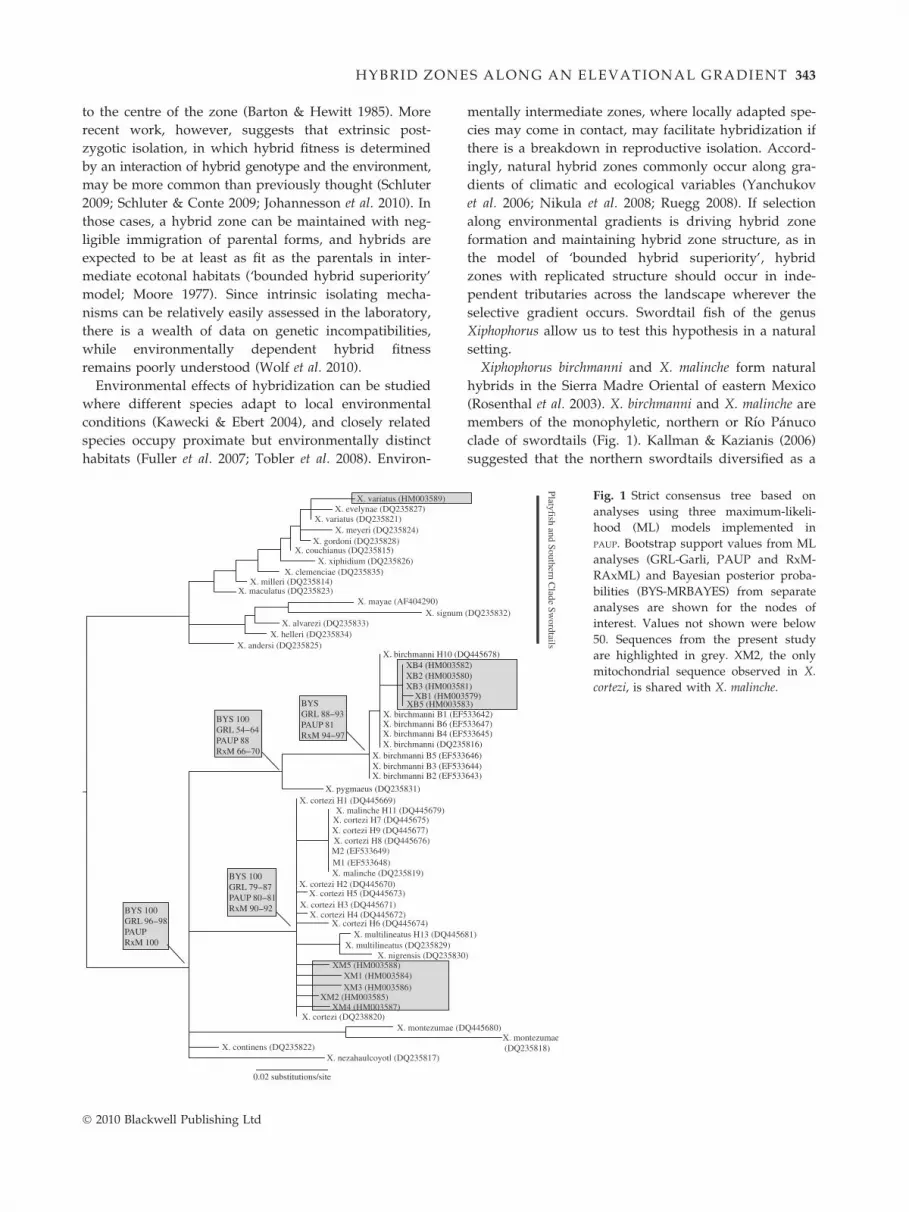
Fig. 2 Body shape variation in male
Xiphophorus from the Rio Calnali.
Depicted are mean residual principal
component scores (corrected for allo-
metric effects) and standard errors of
measurement for parental species, back-
crosses, and F2s. Note that backcrosses
cluster with parental species. The thin-
plate spline transformation grids show
shape variation along each principal
component axis.
HYBRID ZONES ALONG AN ELEVATIONAL GRADIENT 345
program was paused when it reached 80 �C at which
time Taq polymerase was added to each sample. The
program was resumed and consisted of the following:
94 �C for 7 min, 12 cycles of 94 �C for 15 s, 66–60 �C for
15 s decreasing by 0.5 �C each cycle, 72 �C for 1 min
followed by 28 cycles at 60 �C with a final extension
step at 72 �C for 7 min.
We amplified three nuclear introns that map to dis-
tinct genetic linkage groups in crosses of X. maculatus
and X. hellerii (Walter et al. 2004). DNA ligase 1 (LIG1;
linkage group VI), DNA polymerase beta (POLB; link-
age group XII), tumour protein 53 (TP53; linkage group
XIV). The same PCR conditions and touchdown proto-
col as above were used for introns except a hot-start
was not used. Following all PCRs of introns and
mtDNA, 2 lL of each sample was scored on a 2% aga-
rose gel to confirm amplification success and the
remaining volume was then sent for sequencing in both
forward and reverse directions at either High Through-
put Sequencing Solutions (University of Washington) or
the Nevada Genomics Center (University of Nevada –
Reno). All sequences were aligned in Sequencher 4.2 or
higher (Gene Codes Corp.) with further manual adjust-
ments made by eye.
Phylogenetic analyses
To reconstruct phylogenetic relationships among taxa,
we used all mtDNA haplotypes of X. birchmanni, X. ma-
linche, X. cortezi and X. variatus sequenced in this study,
as well as other homologous Xiphophorus sequences
downloaded from GenBank (accession nos: AF404290,
DQ235814–DQ235835, DQ445669–DQ445681, and
EF533642–EF533649). The monophyly of the northern
� 2010 Blackwell Publishing Ltd
swordtails, including X. birchmanni and X. malinche, is
well supported (Meyer et al. 1994; Borowsky et al. 1995;
Marcus & McCune 1999; Morris et al. 2001), so we used
all other Xiphophorus, the platyfish and the southern
clade swordtails, collectively as an outgroup. Sequences
downloaded from GenBank were trimmed such that
only the portion of sequence that overlapped with our
control region d-loop sequences was used. This resulted
in sequences that ranged from 417 to 446 bp in length
and 55 total sequences for phylogenetic reconstructions,
as there were multiple haplotypes for some species
(alignment submitted to TreeBase).
Phylogenetic analyses were conducted using maxi-
mum-likelihood (ML) and Bayesian inference. To deter-
mine the most appropriate model of DNA substitution
we used jModeltest V0.1.1 (Posada 2008), to evaluate 88
substitution models, under the Akaike Information Cri-
terion (AIC), corrected AIC(c), and Bayesian Informa-
tion Criterion (BIC). Models that accounted for 95% of
the weight for all three criteria (AIC, AICc and BIC)
included either a proportion of invariable sites (I), a
Gamma distribution for rate variation among sites
(G), or both, and several relative rates in the substitu-
tion matrix (TIM2 = 4; TrN = 3; TIM3 = 4, GTR = 6).
We used these models or the closest more complex
model available in ML analyses, including bootstrap,
using three different programs: (i) PAUP*4b10 (Swof-
ford 2001), in which parameters values were fixed to
those obtained with jModeltest (models: TIM2 + G,
TIM2 + I+G, TIM2 + I); (ii) RaxML 7.0.4 (Stamatakis
2006a,b; Stamatakis et al. 2008) with two different mod-
els (GTR+G and GTR+G+I) and number of bootstrap
replicates determined automatically, as implemented in
the CIPRES portal (http://www.phylo.org/); and (iii)
Page 5
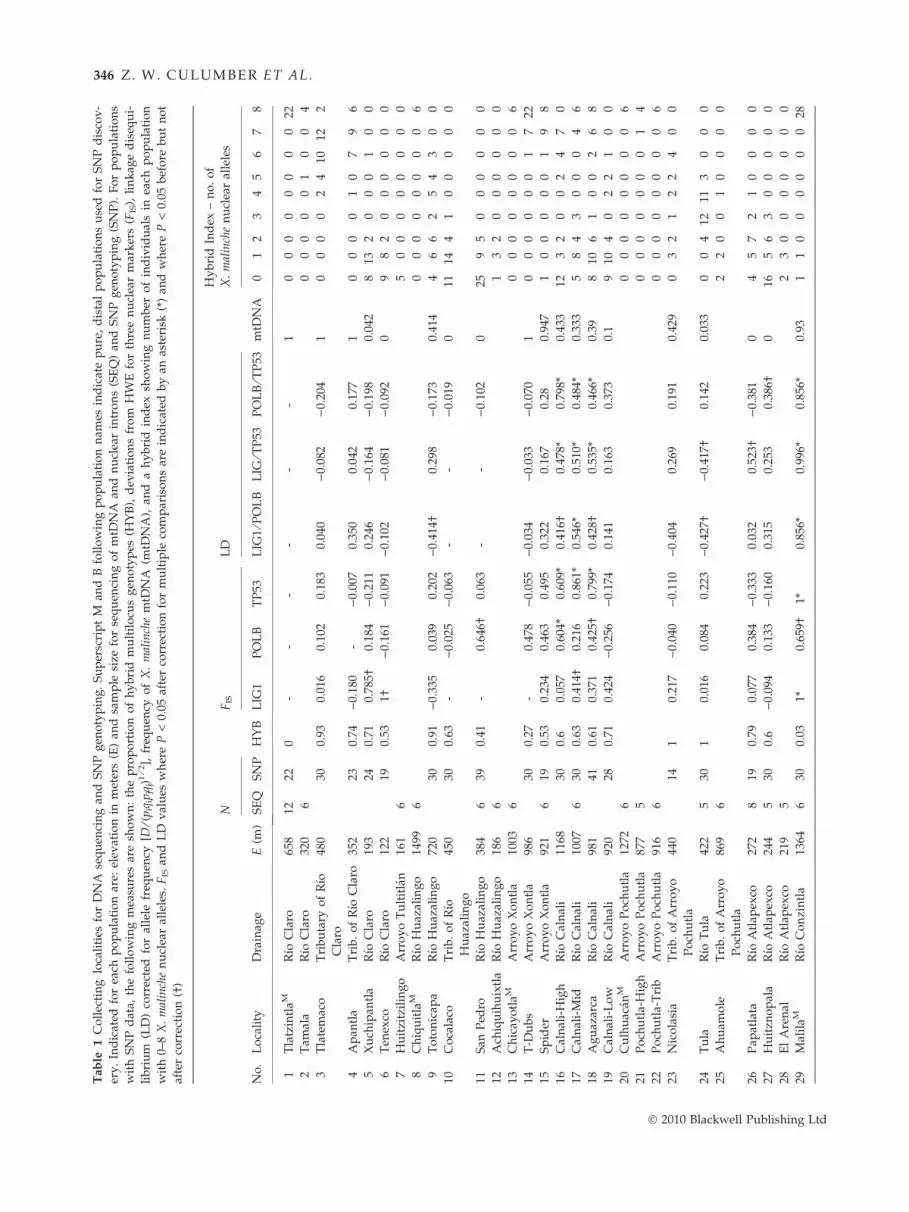
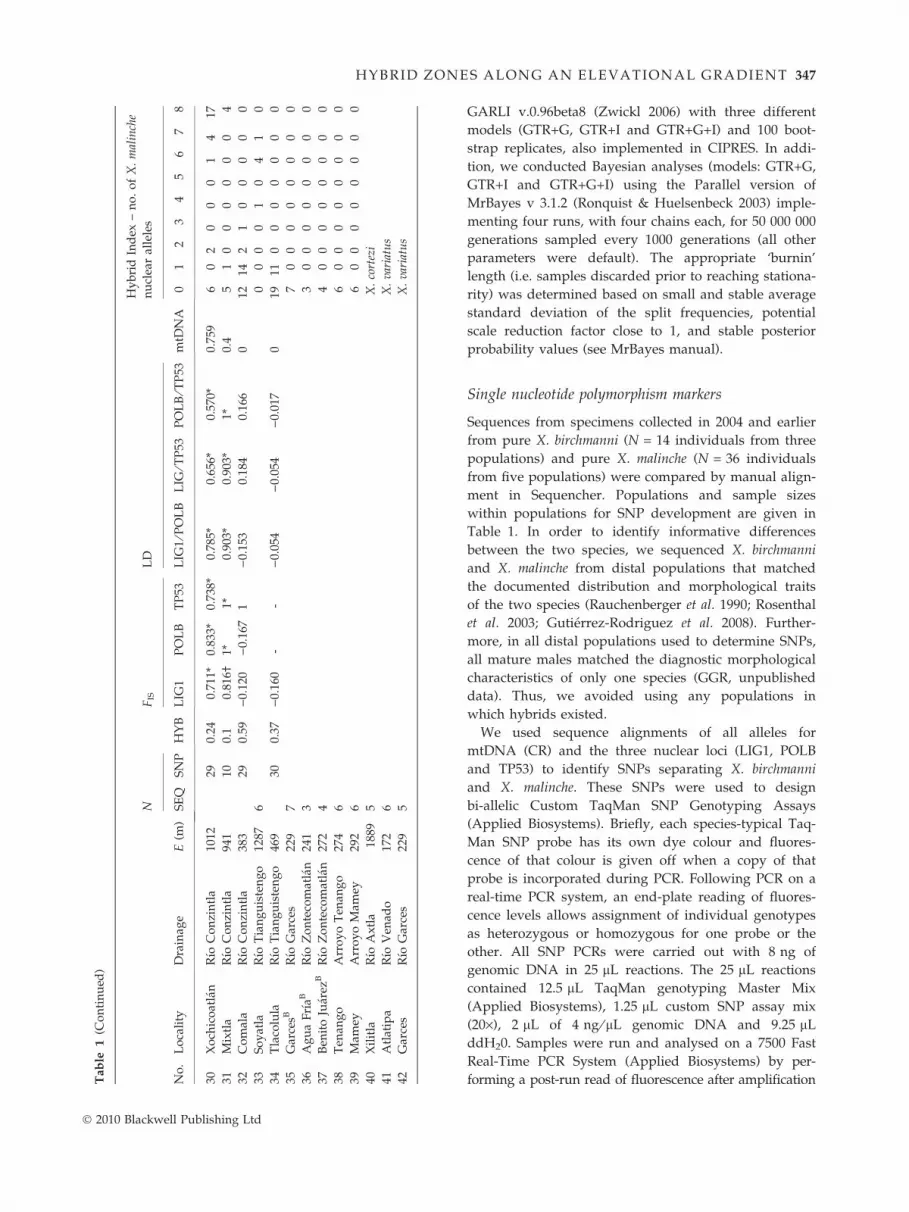
Ta
ble
1C
oll
ecti
ng
loca
liti
esfo
rD
NA
seq
uen
cin
gan
dS
NP
gen
oty
pin
g.
Su
per
scri
pt
Man
dB
foll
ow
ing
po
pu
lati
on
nam
esin
dic
ate
pu
re,
dis
tal
po
pu
lati
on
su
sed
for
SN
Pd
isco
v-
ery
.In
dic
ated
for
each
po
pu
lati
on
are:
elev
atio
nin
met
ers
(E)
and
sam
ple
size
for
seq
uen
cin
go
fm
tDN
Aan
dn
ucl
ear
intr
on
s(S
EQ
)an
dS
NP
gen
oty
pin
g(S
NP
).F
or
po
pu
lati
on
s
wit
hS
NP
dat
a,th
efo
llo
win
gm
easu
res
are
sho
wn
:th
ep
rop
ort
ion
of
hy
bri
dm
ult
ilo
cus
gen
oty
pes
(HY
B),
dev
iati
on
sfr
om
HW
Efo
rth
ree
nu
clea
rm
ark
ers
(FIS
),li
nk
age
dis
equ
i-
lib
riu
m(L
D)
corr
ecte
dfo
ral
lele
freq
uen
cy[D
⁄(p i
q ip j
q j)1
⁄2],
freq
uen
cyo
fX
.m
alin
che
mtD
NA
(mtD
NA
),an
da
hy
bri
din
dex
sho
win
gn
um
ber
of
ind
ivid
ual
sin
each
po
pu
lati
on
wit
h0–
8X
.m
alin
che
nu
clea
ral
lele
s.F
ISan
dL
Dv
alu
esw
her
eP
<0.
05af
ter
corr
ecti
on
for
mu
ltip
leco
mp
aris
on
sar
ein
dic
ated
by
anas
teri
sk(*
)an
dw
her
eP
<0.
05b
efo
reb
ut
no
t
afte
rco
rrec
tio
n(†
)
No
.L
oca
lity
Dra
inag
eE
(m)
N
HY
B
FIS
LD
mtD
NA
Hy
bri
dIn
dex
–n
o.
of
X.
mal
inch
en
ucl
ear
alle
les
SE
QS
NP
LIG
1P
OL
BT
P53
LIG
1⁄P
OL
BL
IG⁄T
P53
PO
LB
⁄TP
530
12
34
56
78
1T
latz
intl
aMR
ıoC
laro
658
1222
0-
--
--
-1
00
00
00
00
22
2T
amal
aR
ıoC
laro
320
60
00
00
10
04
3T
late
mac
oT
rib
uta
ryo
fR
ıo
Cla
ro
480
300.
930.
016
0.10
20.
183
0.04
0)
0.08
2)
0.20
41
00
00
24
1012
2
4A
pan
tla
Tri
b.
of
Rıo
Cla
ro35
223
0.74
)0.
180
-)
0.00
70.
350
0.04
20.
177
10
00
01
07
96
5X
uch
ipan
tla
Rıo
Cla
ro19
324
0.71
0.78
5†0.
184
)0.
211
0.24
6)
0.16
4)
0.19
80.
042
813
20
00
10
0
6T
enex
coR
ıoC
laro
122
190.
531†
)0.
161
)0.
091
)0.
102
)0.
081
)0.
092
09
82
00
00
00
7H
uit
zitz
ilin
go
Arr
oy
oT
ult
itla
n16
16
50
00
00
00
0
8C
hiq
uit
laM
Rıo
Hu
azal
ing
o14
996
00
00
00
00
6
9T
oto
nic
apa
Rıo
Hu
azal
ing
o72
030
0.91
)0.
335
0.03
90.
202
)0.
414†
0.29
8)
0.17
30.
414
46
62
54
30
0
10C
oca
laco
Tri
b.
of
Rıo
Hu
azal
ing
o
450
300.
63-
)0.
025
)0.
063
--
)0.
019
011
144
10
00
00
11S
anP
edro
Rıo
Hu
azal
ing
o38
46
390.
41-
0.64
6†0.
063
--
)0.
102
025
95
00
00
00
12A
chiq
uih
uix
tla
Rıo
Hu
azal
ing
o18
66
13
20
00
00
0
13C
hic
ayo
tlaM
Arr
oy
oX
on
tla
1003
60
00
00
00
06
14T
-Du
bs
Arr
oy
oX
on
tla
986
300.
27-
0.47
8)
0.05
5)
0.03
4)
0.03
3)
0.07
01
00
00
00
17
22
15S
pid
erA
rro
yo
Xo
ntl
a92
16
190.
530.
234
0.46
30.
495
0.32
20.
167
0.28
0.94
71
00
00
01
98
16C
aln
ali-
Hig
hR
ıoC
aln
ali
1168
300.
60.
057
0.60
4*0.
609*
0.41
6†0.
478*
0.79
8*0.
433
123
20
02
47
0
17C
aln
ali-
Mid
Rıo
Cal
nal
i10
076
300.
630.
414†
0.21
60.
861*
0.54
6*0.
510*
0.48
4*0.
333
58
43
00
04
6
18A
gu
azar
caR
ıoC
aln
ali
981
410.
610.
371
0.42
5†0.
799*
0.42
8†0.
535*
0.46
6*0.
398
106
10
02
68
19C
aln
ali-
Lo
wR
ıoC
aln
ali
920
280.
710.
424
)0.
256
)0.
174
0.14
10.
163
0.37
30.
19
104
02
21
00
20C
ulh
uac
anM
Arr
oy
oP
och
utl
a12
726
00
00
00
00
6
21P
och
utl
a-H
igh
Arr
oy
oP
och
utl
a87
75
00
00
00
01
4
22P
och
utl
a-T
rib
Arr
oy
oP
och
utl
a91
66
00
00
00
00
6
23N
ico
lasi
aT
rib
.o
fA
rro
yo
Po
chu
tla
440
141
0.21
7)
0.04
0)
0.11
0)
0.40
40.
269
0.19
10.
429
03
21
22
40
0
24T
ula
Rıo
Tu
la42
25
301
0.01
60.
084
0.22
3)
0.42
7†)
0.41
7†0.
142
0.03
30
04
1211
30
00
25A
hu
amo
leT
rib
.o
fA
rro
yo
Po
chu
tla
869
62
20
01
00
00
26P
apat
lata
Rıo
Atl
apex
co27
28
190.
790.
077
0.38
4)
0.33
30.
032
0.52
3†)
0.38
10
45
72
10
00
0
27H
uit
zno
pal
aR
ıoA
tlap
exco
244
530
0.6
)0.
094
0.13
3)
0.16
00.
315
0.25
30.
386†
016
56
30
00
00
28E
lA
ren
alR
ıoA
tlap
exco
219
52
30
00
00
00
29M
alil
aMR
ıoC
on
zin
tla
1364
630
0.03
1*0.
659†
1*0.
856*
0.99
6*0.
856*
0.93
11
00
00
00
28
346 Z. W. CULUMBER ET AL.
� 2010 Blackwell Publishing Ltd
Page 6
Ta
ble
1(C
on
tin
ued
)
No
.L
oca
lity
Dra
inag
eE
(m)
N
HY
B
FIS
LD
mtD
NA
Hy
bri
dIn
dex
–n
o.
of
X.
mal
inch
e
nu
clea
ral
lele
s
SE
QS
NP
LIG
1P
OL
BT
P53
LIG
1⁄P
OL
BL
IG⁄T
P53
PO
LB
⁄TP
530
12
34
56
78
30X
och
ico
atla
nR
ıoC
on
zin
tla
1012
290.
240.
711*
0.83
3*0.
738*
0.78
5*0.
656*
0.57
0*0.
759
60
20
00
14
17
31M
ixtl
aR
ıoC
on
zin
tla
941
100.
10.
816†
1*1*
0.90
3*0.
903*
1*0.
45
10
00
00
04
32C
om
ala
Rıo
Co
nzi
ntl
a38
329
0.59
)0.
120
)0.
167
1)
0.15
30.
184
0.16
60
1214
21
00
00
0
33S
oy
atla
Rıo
Tia
ng
uis
ten
go
1287
60
00
01
04
10
34T
laco
lula
Rıo
Tia
ng
uis
ten
go
469
300.
37)
0.16
0-
-)
0.05
4)
0.05
4)
0.01
70
1911
00
00
00
0
35G
arce
sBR
ıoG
arce
s22
97
70
00
00
00
0
36A
gu
aF
rıaB
Rıo
Zo
nte
com
atla
n24
13
30
00
00
00
0
37B
enit
oJu
arez
BR
ıoZ
on
teco
mat
lan
272
44
00
00
00
00
38T
enan
go
Arr
oy
oT
enan
go
274
66
00
00
00
00
39M
amey
Arr
oy
oM
amey
292
66
00
00
00
00
40X
ilit
laR
ıoA
xtl
a18
895
X.
cort
ezi
41A
tlat
ipa
Rıo
Ven
ado
172
6X
.va
riat
us
42G
arce
sR
ıoG
arce
s22
95
X.
vari
atu
s
HYBRID ZONES ALONG AN ELEVATIONAL GRADIENT 347
� 2010 Blackwell Publishing Ltd
GARLI v.0.96beta8 (Zwickl 2006) with three different
models (GTR+G, GTR+I and GTR+G+I) and 100 boot-
strap replicates, also implemented in CIPRES. In addi-
tion, we conducted Bayesian analyses (models: GTR+G,
GTR+I and GTR+G+I) using the Parallel version of
MrBayes v 3.1.2 (Ronquist & Huelsenbeck 2003) imple-
menting four runs, with four chains each, for 50 000 000
generations sampled every 1000 generations (all other
parameters were default). The appropriate ‘burnin’
length (i.e. samples discarded prior to reaching stationa-
rity) was determined based on small and stable average
standard deviation of the split frequencies, potential
scale reduction factor close to 1, and stable posterior
probability values (see MrBayes manual).
Single nucleotide polymorphism markers
Sequences from specimens collected in 2004 and earlier
from pure X. birchmanni (N = 14 individuals from three
populations) and pure X. malinche (N = 36 individuals
from five populations) were compared by manual align-
ment in Sequencher. Populations and sample sizes
within populations for SNP development are given in
Table 1. In order to identify informative differences
between the two species, we sequenced X. birchmanni
and X. malinche from distal populations that matched
the documented distribution and morphological traits
of the two species (Rauchenberger et al. 1990; Rosenthal
et al. 2003; Gutierrez-Rodriguez et al. 2008). Further-
more, in all distal populations used to determine SNPs,
all mature males matched the diagnostic morphological
characteristics of only one species (GGR, unpublished
data). Thus, we avoided using any populations in
which hybrids existed.
We used sequence alignments of all alleles for
mtDNA (CR) and the three nuclear loci (LIG1, POLB
and TP53) to identify SNPs separating X. birchmanni
and X. malinche. These SNPs were used to design
bi-allelic Custom TaqMan SNP Genotyping Assays
(Applied Biosystems). Briefly, each species-typical Taq-
Man SNP probe has its own dye colour and fluores-
cence of that colour is given off when a copy of that
probe is incorporated during PCR. Following PCR on a
real-time PCR system, an end-plate reading of fluores-
cence levels allows assignment of individual genotypes
as heterozygous or homozygous for one probe or the
other. All SNP PCRs were carried out with 8 ng of
genomic DNA in 25 lL reactions. The 25 lL reactions
contained 12.5 lL TaqMan genotyping Master Mix
(Applied Biosystems), 1.25 lL custom SNP assay mix
(20·), 2 lL of 4 ng ⁄ lL genomic DNA and 9.25 lL
ddH20. Samples were run and analysed on a 7500 Fast
Real-Time PCR System (Applied Biosystems) by per-
forming a post-run read of fluorescence after amplification
Page 7
348 Z. W. CULUMBER ET AL.
at 95 �C for 10 min followed by 40 cycles of 92 �C for
15 s and 60 �C for 1 min. All mtDNA and nuclear
intron sequences have been deposited on GenBank
under accession nos HM003579–HM003607.
Geometric morphometric analysis
To further confirm that our SNP discovery method pro-
duced informative markers, we conducted a geometric
morphometric analysis of mature males collected from
a population in the Rio Calnali, Calnali-Mid, where X.
malinche, X. birchmanni and hybrid multilocus SNP
genotypes are all found together. For the analysis, lat-
eral photographs were taken of all mature males for
which we had SNP genotypes. We digitized landmark
points on each image using the software program tps-
Dig (Rohlf 2004). Landmarks included the tip of the
upper jaw (i); the anterior (ii) and posterior (iii) junction
of the dorsal fin with the dorsal midline; the junction of
the caudal fin with the dorsal (iv) and ventral midline
(v); the anterior junction of the anal fin with the ventral
midline (vi); the bottom of the head where the opercu-
lum breaks away from the body outline (vii); the upper
edge of the operculum (viii), the upper (ix) and lower
(x) insertion of the pectoral fin; and the centre of the
eye (xi). We also included four semi-landmarks to esti-
mate the dimensions of the dorsal and caudal fin
(including the sword – an extension of the lower caudal
fin ray) by digitizing the length of the first and last fin
rays in both fins. To remove potential effects of differ-
ential fin expansion, x and y coordinates were standard-
ized for the dorsal and caudal fin (i.e. the location of
semi-landmarks only varied in the distance but not the
angle from other landmarks).
Based on the coordinates of the digitized landmarks,
a geometric morphometric analysis was performed (e.g.
see Zelditch et al. 2004 for an introduction to geometric
morphometric analyses). Landmark coordinates were
aligned using least-squares superimposition as imple-
mented in the program tpsRelw (Rohlf 2007) to remove
effects of translation, rotation, and scale. Based on the
aligned coordinates, we calculated centroid size and
partial warp scores with uniform components for each
individual (weight matrix). The weight matrix was sub-
jected to a principal component analysis based on a
covariance matrix to reduce the data to true dimension-
ality. Dimensions with eigenvalues >1 were retained as
shape variables. Unless otherwise stated, all statistical
analyses were performed using SPSS 17 (SPSS, Inc. 2008).
To test for phenotypic differentiation among parental
species, backcrosses, and F2 and later hybrid individu-
als, we used multivariate analyses of covariance (MANCO-
VA) to analyse body shape variation (seven principal
components accounting for over 77% of the total varia-
tion). Putative F1s are not included as none were
observed in this sample of individuals. Assumptions of
multivariate normal error and homogeneity of variances
and covariances were met for all analyses performed.
F-values were approximated using Wilks’ lambda and
effect strengths by use of partial eta squared (gp2). We
tested for effects of ‘centroid size’ to control for multi-
variate allometry and included genotype (parental X.
birchmanni, backcross X. birchmanni, F2 and later hybrid,
backcross X. malinche, or parental X. malinche) as a fac-
tor. The interaction term was not significant, so only
main effects were analysed (F28,300 = 1.345, P = 0.119).
Shape variation along the first two principal component
axes was visualized with thin-plate spline transforma-
tion grids using tpsRegr (Rohlf 2005).
To test for congruence between genotype categories
and phenotypes, we conducted a discriminant function
analysis (DFA) to determine the percentage of speci-
mens that could be correctly classified to the correct
genotype solely based on body shape. To facilitate the
DFA, we first removed the effect of allometry by using
the residuals of a preparatory MANCOVA. In this MANCO-
VA, the partial warp scores with uniform components
were used as dependent variables and centroid size as
a covariate.
Geographic structure of hybrid zones
To characterize elevational gradients in the geographic
distribution of each parental species and their hybrids,
we mapped the frequency of each species and hybrids
for each locality sampled. Individuals with any combi-
nation of both X. birchmanni- and X. malinche-typical
SNP markers (including those inferred from original
sequence data) were classified as hybrids. Estimates of
hybrid frequencies could be biased upwards, if SNPs
are not completely fixed within the two parental spe-
cies. However, estimates could also be biased down-
wards because some hybrid individuals will be
homozygous at all loci and erroneously classified as a
parental. We then conducted MANCOVA on allele frequen-
cies of all four markers. In the MANCOVA, we tested for
drainage and elevation effects on allele frequency and
tested the interaction terms (drainage*marker and eleva-
tion*marker). We further included a repeated measure
to test for differences in allele frequencies among the
four markers. The analysis included all 23 populations
sampled for SNP genotyping (Table 1).
Population genetic analyses
Deviations from Hardy–Weinberg equilibrium (HWE)
in a population can occur if individuals do not mate at
random, if there is gene flow into the population, or if
� 2010 Blackwell Publishing Ltd
Page 8
HYBRID ZONES ALONG AN ELEVATIONAL GRADIENT 349
there is strong selection (Hartl & Clark 2007). The
inbreeding coefficient, FIS, was used to measure devia-
tion from HWE proportions resulting from heterozygote
deficiency (f, Weir & Cockerham 1984) for each nuclear
SNP locus for all populations using GENEPOP V4 (Ray-
mond & Rousset 1995). If there is sufficient gene flow
among populations, connectivity is maintained and pre-
vents genetic differentiation among populations. To test
for genetic differentiation among populations, we calcu-
lated FST (h, Weir & Cockerham 1994) across the data
set and assessed significance using the log-likelihood
G-statistic in FSTAT (Goudet 1995; Goudet et al. 1996).
The estimate of h as implemented in FSTAT was also
used to calculate pairwise-FST values between neigh-
bouring localities within stream reaches.
In hybrid zones, high LD can represent recent or
ongoing hybridization, but can also be a sign of popula-
tion structure (Jiggins & Mallet 2000). Interspecific
crosses generate perfect linkage disequilibrium (LD) in
F1 offspring. If F1 offspring backcross and ⁄ or mate with
each other, this LD will then erode in each generation.
Selection, assortative mating, or continual immigration
of parental genotypes could maintain LD in a popula-
tion. We tested for LD among all pairwise comparisons
of nuclear SNP markers in each population according to
Hill (1974) which provides a method to estimate of dis-
equilibrium, D, and a test statistic that has an approxi-
mate v2 distribution. Values of D were divided by allele
frequency [D ⁄ (piqipjqj)1 ⁄ 2] to standardize LD estimates
across populations. We also calculated genotypic dis-
equilibrium for cases when phase is not known using
GENEPOP. All P-values were adjusted for multiple com-
parisons within populations.
Results
Phylogeny and SNP markers
Sequencing of 160 individuals (Table 1) for the mito-
chondrial control region d-loop produced 10 distinct
haplotypes among X. birchmanni, X. malinche, their puta-
tive hybrids and X. cortezi. The only haplotype observed
in X. cortezi (haplotype XM2; Fig. 1) was also observed
in putative X. birchmanni ⁄ X. malinche hybrids and is
mutationally intermediate among other X. malinche
haplotypes. As such, it was considered and designated
as a haplotype shared with X. malinche (incomplete line-
age sorting). There was one haplotype observed for
X. variatus. The optimal trees from all ML searches were
compared to one another and to the consensus tree from
two Bayesian analyses. The consensus tree from ML
analyses in PAUP implementing the three best-fit models
of sequence evolution is reported here along with boot-
strap support values from all ML analyses and posterior
� 2010 Blackwell Publishing Ltd
probabilities from MrBayes shown for nodes of interest
(Fig. 1). Here we are primarily concerned with the
relationships among X. birchmanni, X. malinche and
X. cortezi, thus support values for relevant nodes are
given. All runs gave strong support for monophyly of
the five X. birchmanni haplotypes sequenced in this
study along with all other previously sequenced X.
birchmanni haplotypes. All runs also placed X. malinche
together with X. cortezi, X. multilineatus and X. nigrensis.
There were five mitochondrial control region d-loop
haplotypes for X. birchmanni and four for X. malinche.
X. cortezi and X. malinche shared one haplotype,
accounting for the total of five haplotypes that clustered
with other X. malinche on the phylogenetic tree. The
majority of populations (19 of 27) contained only one
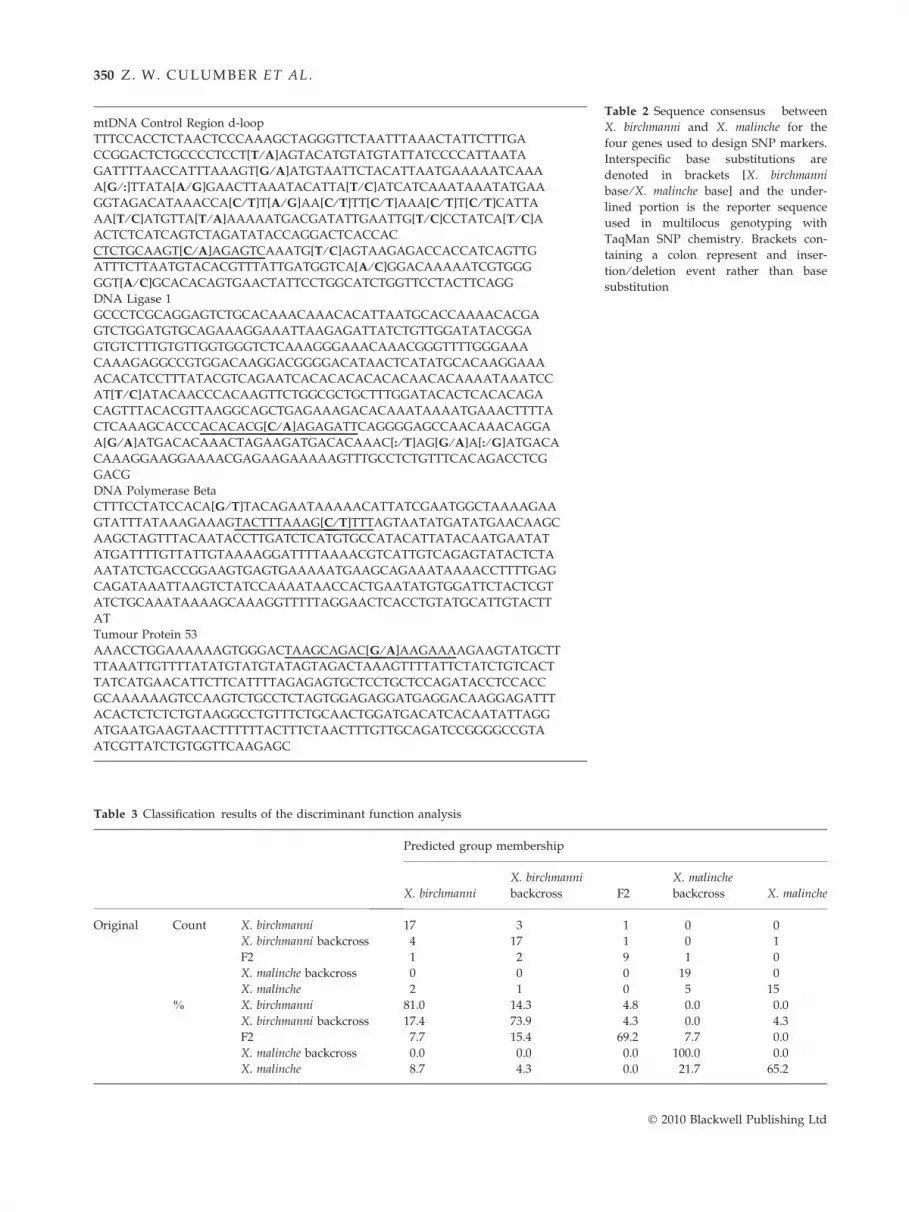
mtDNA control region haplotype. Both the mtDNA
control region d-loop and DNA ligase 1 exhibited an
accumulation of substitutions between the species, con-
sistent with historical divergence and more recent sec-
ondary contact and introgression (Table 2). Both the
polymerase beta and tumour protein 53 gene showed
fewer interspecific differences but contained informative
SNPs nonetheless. The complete consensus sequences
between X. birchmanni and X. malinche are shown in
Table 2 with interspecific SNPs in brackets and reporter
sequences for TaqMan SNP assays underlined.
Geometric morphometric analysis
Among 99 males, body shape was significantly influ-
enced by centroid size, indicating allometric effects
(F7,87 = 12.461, P < 0.001, gp2 = 0.501), and genotype
(F28,315.1 = 4.045, P < 0.001, gp2 = 0.242). Visualizing the
first two axes of shape variation indicates that back-
crosses cluster with the respective parental species, with
F2s intermediate between the two parental species
(Fig. 2). This is also indicated by the discriminant func-
tion analysis that assigned over 77% of the specimens
(compared to the expected 17% under a null hypothesis
of no pattern) to the correct genotype solely based on
geometric morphometric data (Table 3); misclassifica-
tions were relatively common between parentals and
backcrosses. Over 30% of F2 or later hybrids were mis-
classified, indicating overlap in morphospace occupa-
tion with other groups.
Replicated geographic structure
There were elevational clines in the distribution of each
species and hybrids, with X. malinche at high elevations,
X. birchmanni at low elevations and hybrids at interme-
diate elevations. These gradients were replicated across
stream reaches as demonstrated in the distribution of
multilocus genotypes (Figs. 3 and 4). MANCOVA on SNP
Page 9
Table 2 Sequence consensus between
X. birchmanni and X. malinche for the
four genes used to design SNP markers.
Interspecific base substitutions are
denoted in brackets [X. birchmanni
base ⁄ X. malinche base] and the under-
lined portion is the reporter sequence
used in multilocus genotyping with
TaqMan SNP chemistry. Brackets con-
taining a colon represent and inser-
tion ⁄ deletion event rather than base
substitution
mtDNA Control Region d-loop
TTTCCACCTCTAACTCCCAAAGCTAGGGTTCTAATTTAAACTATTCTTTGA
CCGGACTCTGCCCCTCCT[T ⁄ A]AGTACATGTATGTATTATCCCCATTAATA
GATTTTAACCATTTAAAGT[G ⁄ A]ATGTAATTCTACATTAATGAAAAATCAAA
A[G ⁄ :]TTATA[A ⁄ G]GAACTTAAATACATTA[T ⁄ C]ATCATCAAATAAATATGAA
GGTAGACATAAACCA[C ⁄ T]T[A ⁄ G]AA[C ⁄ T]TT[C ⁄ T]AAA[C ⁄ T]T[C ⁄ T]CATTA
AA[T ⁄ C]ATGTTA[T ⁄ A]AAAAATGACGATATTGAATTG[T ⁄ C]CCTATCA[T ⁄ C]A
ACTCTCATCAGTCTAGATATACCAGGACTCACCAC
CTCTGCAAGT[C ⁄ A]AGAGTCAAATG[T ⁄ C]AGTAAGAGACCACCATCAGTTG
ATTTCTTAATGTACACGTTTATTGATGGTCA[A ⁄ C]GGACAAAAATCGTGGG
GGT[A ⁄ C]GCACACAGTGAACTATTCCTGGCATCTGGTTCCTACTTCAGG
DNA Ligase 1
GCCCTCGCAGGAGTCTGCACAAACAAACACATTAATGCACCAAAACACGA
GTCTGGATGTGCAGAAAGGAAATTAAGAGATTATCTGTTGGATATACGGA
GTGTCTTTGTGTTGGTGGGTCTCAAAGGGAAACAAACGGGTTTTGGGAAA
CAAAGAGGCCGTGGACAAGGACGGGGACATAACTCATATGCACAAGGAAA
ACACATCCTTTATACGTCAGAATCACACACACACACAACACAAAATAAATCC
AT[T ⁄ C]ATACAACCCACAAGTTCTGGCGCTGCTTTGGATACACTCACACAGA
CAGTTTACACGTTAAGGCAGCTGAGAAAGACACAAATAAAATGAAACTTTTA
CTCAAAGCACCCACACACG[C ⁄ A]AGAGATTCAGGGGAGCCAACAAACAGGA
A[G ⁄ A]ATGACACAAACTAGAAGATGACACAAAC[: ⁄ T]AG[G ⁄ A]A[: ⁄ G]ATGACA
CAAAGGAAGGAAAACGAGAAGAAAAAGTTTGCCTCTGTTTCACAGACCTCG
GACG
DNA Polymerase Beta
CTTTCCTATCCACA[G ⁄ T]TACAGAATAAAAACATTATCGAATGGCTAAAAGAA
GTATTTATAAAGAAAGTACTTTAAAG[C ⁄ T]TTTAGTAATATGATATGAACAAGC
AAGCTAGTTTACAATACCTTGATCTCATGTGCCATACATTATACAATGAATAT
ATGATTTTGTTATTGTAAAAGGATTTTAAAACGTCATTGTCAGAGTATACTCTA
AATATCTGACCGGAAGTGAGTGAAAAATGAAGCAGAAATAAAACCTTTTGAG
CAGATAAATTAAGTCTATCCAAAATAACCACTGAATATGTGGATTCTACTCGT
ATCTGCAAATAAAAGCAAAGGTTTTTAGGAACTCACCTGTATGCATTGTACTT
AT
Tumour Protein 53
AAACCTGGAAAAAAGTGGGACTAAGCAGAC[G ⁄ A]AAGAAAAGAAGTATGCTT
TTAAATTGTTTTATATGTATGTATAGTAGACTAAAGTTTTATTCTATCTGTCACT
TATCATGAACATTCTTCATTTTAGAGAGTGCTCCTGCTCCAGATACCTCCACC
GCAAAAAAGTCCAAGTCTGCCTCTAGTGGAGAGGATGAGGACAAGGAGATTT
ACACTCTCTCTGTAAGGCCTGTTTCTGCAACTGGATGACATCACAATATTAGG
ATGAATGAAGTAACTTTTTTACTTTCTAACTTTGTTGCAGATCCGGGGCCGTA
ATCGTTATCTGTGGTTCAAGAGC
Table 3 Classification results of the discriminant function analysis
Predicted group membership
X. birchmanni
X. birchmanni
backcross F2
X. malinche
backcross X. malinche
Original Count X. birchmanni 17 3 1 0 0
X. birchmanni backcross 4 17 1 0 1
F2 1 2 9 1 0
X. malinche backcross 0 0 0 19 0
X. malinche 2 1 0 5 15
% X. birchmanni 81.0 14.3 4.8 0.0 0.0
X. birchmanni backcross 17.4 73.9 4.3 0.0 4.3
F2 7.7 15.4 69.2 7.7 0.0
X. malinche backcross 0.0 0.0 0.0 100.0 0.0
X. malinche 8.7 4.3 0.0 21.7 65.2
350 Z. W. CULUMBER ET AL.
� 2010 Blackwell Publishing Ltd
Page 10
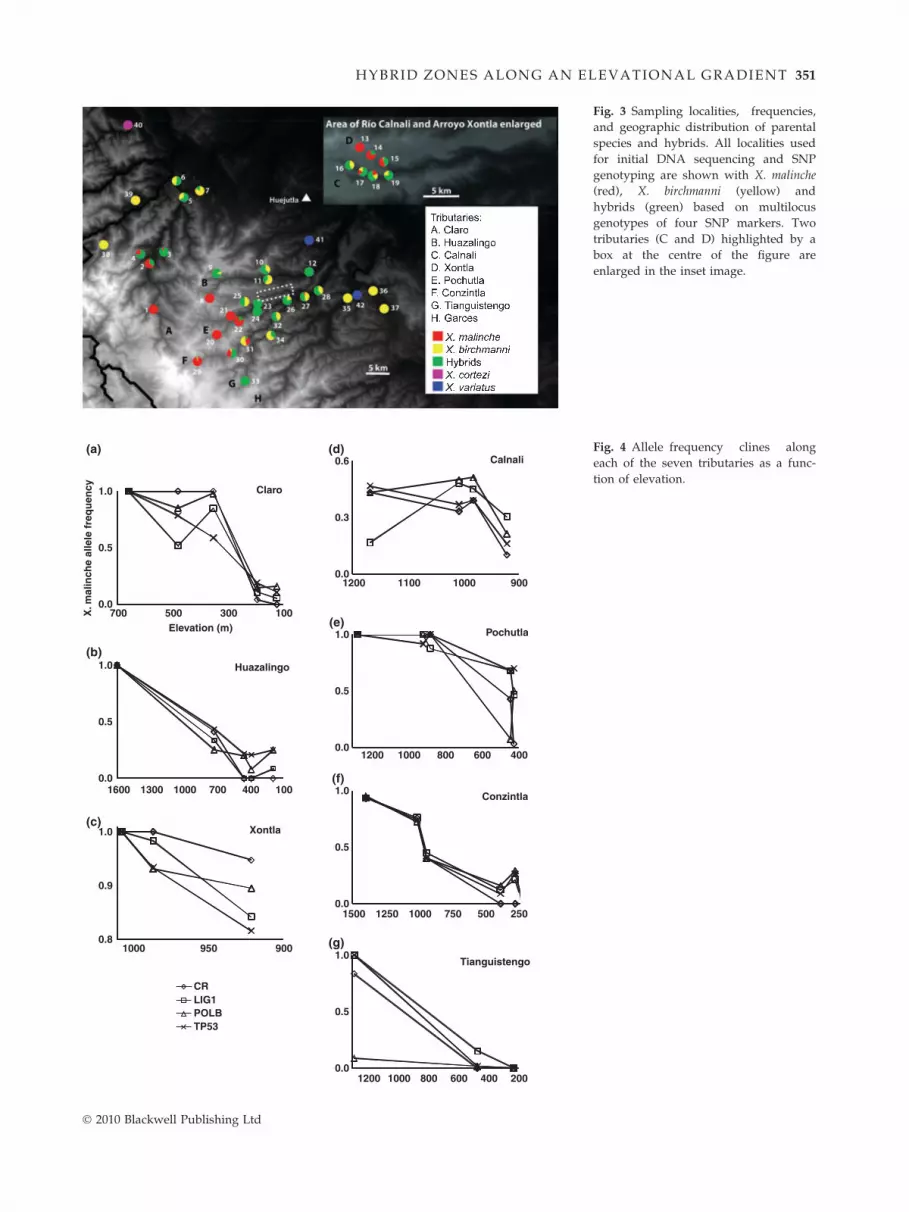
Fig. 3 Sampling localities, frequencies,
and geographic distribution of parental
species and hybrids. All localities used
for initial DNA sequencing and SNP
genotyping are shown with X. malinche
(red), X. birchmanni (yellow) and
hybrids (green) based on multilocus
genotypes of four SNP markers. Two
tributaries (C and D) highlighted by a
box at the centre of the figure are
enlarged in the inset image.
0.0
0.3
0.6
900100011001200
0.0
0.5
1.0
100300500700
0.0
0.5
1.0
40060080010001200
0.0
0.5
1.0
20040060080010001200
0.0
0.5
1.0
250500750100012501500
0.8
0.9
1.0
9009501000
CRLIG1POLBTP53
0.0
0.5
1.0
100400700100013001600
Claro
(a) (d)
(e)
(f)
(g)
(b)
(c)
Huazalingo
Xontla
Calnali
Pochutla
Conzintla
Tianguistengo
Elevation (m)
X. m
alin
che
alle
le f
req
uen
cy
Fig. 4 Allele frequency clines along
each of the seven tributaries as a func-
tion of elevation.
HYBRID ZONES ALONG AN ELEVATIONAL GRADIENT 351
� 2010 Blackwell Publishing Ltd
Page 11
Table 4 Pairwise FST values for each population and the next
closest sampling location within stream reaches. In many cases
low FST is likely correlated to the distance between sampling
sites and local geography (i.e. barriers to dispersal) as sam-
pling locations are not spaced evenly along stream reaches
Drainage ⁄ comparison FST
Rıo Calnali
Calnali-High Calnali-Mid 0.0541†
Calnali-Mid Aguazarca )0.0211†
352 Z. W. CULUMBER ET AL.
marker frequency revealed significant effects of both
elevation (F = 7.655, d.f. = 6, P = 0.001) and drainage
(F = 36.852, d.f. = 1, P < 0.001). There was a significant
interaction between drainage and marker (F = 2.278,
d.f. = 18, P = 0.013) but not between elevation and mar-
ker (F = 2.199, d.f. = 3, P = 0.101). There was no differ-
ence in patterns of allele frequency change among the
four markers (Wilk’s k = 0.635, F =2.487, d.f. = 3,
P = 0.106). Figure 4 shows allele frequency clines for all
SNP markers in seven stream reaches.
Aguazarca Calnali-low 0.0936
Rıo Claro
Tlatzintla Tlatemaco 0.3086*
Tlatemaco Apantla 0.1298*
Apantla Xuchipantla 0.6335*
Xuchipantla Tenexco )0.0129
Arroyo Pochutla
Nicolasia Tula 0.1227*
Tula Papatlatla 0.1723*
Rıo Conzintla
Malila Xochicoatlan 0.1064†
Xochicoatlan Mixtla 0.1641
Mixtla Comala 0.2064†
Xochicoatlan Comala 0.562*
Comala Papatlatla 0.0447†
Papatlatla Huitznopala 0.0106
Rıo Huazalingo
Totonicapa Cocalaco 0.1261*
Cocalaco San Pedro 0.0095
Arroyo Xontla
T-Dubs Spider 0.0435
*P < 0.05.†Significant before, but not after, correction for multiple tests.
SNP population genetics
The frequency of hybrids varied widely among locali-
ties, ranging from 0 to 0.93. The frequency of hybrid
multilocus genotypes for all populations (i.e. localities)
is given in Table 1 and depicted in Fig. 3. Hybrids
were found in 22 of the 23 localities sampled for SNP
genotyping. In these 22 localities population structure
falls along a continuum. Two populations were com-
posed entirely of hybrids. In 14 localities, one parent
species coexists with hybrids. In the remaining six pop-
ulations, both parent species and hybrids are found
together. It is in these populations where tests for devi-
ations in the distribution of SNP markers from Hardy–
Weinberg expectations produced significant results
(Table 1).
Linkage disequilibrium (D) was highly significant in
several populations (Table 1) and estimates of geno-
typic disequilibrium from GENEPOP produced the same
results as calculating Hill’s (1974) metric D (not shown).
In these populations, significant heterozygote deficiency
and linkage disequilibrium, potentially indicate some
degree of reproductive isolation between X. malinche, X.
birchmanni and hybrids. We observed highly significant
genetic differentiation among populations (h = 0.407;
P = 0.001). We further tested for differentiation among
populations within stream reaches along the upstream-
to-downstream gradients. FST in pairwise comparisons
of adjacent populations varied from 0 to 0.6335
(Table 4). Values reported as negative are effectively
zero, because FST can only be greater than or equal to
zero.
Discussion
Extensive hybridization was detected in seven separate
stream reaches with two main patterns emerging
throughout the hybrid zone. First, in each stream reach,
there was a distinct elevational gradient between X. ma-
linche upstream and X. birchmanni downstream. Second,
population structure varied widely among sites. At
some localities, there were low levels of introgressive
hybridization and others were composed completely of
hybrid individuals. By contrast, 6 of the 23 sampled
populations were highly structured into three groups:
hybrids and each of the two parent species. These pop-
ulation genetic patterns likely indicate sharp geographic
differences in the dynamics of hybridization and selec-
tion.
Phylogeny and SNP markers
Phylogenetic analysis of mitochondrial control region
d-loop sequences showed that X. birchmanni and X. ma-
linche are in distinct and well-supported clades. X. ma-
linche haplotypes were more closely related to those in
X. cortezi, X. multilineatus and X. nigrensis, but due to
limited data and ⁄ or incomplete lineage sorting, rela-
tionships among these species were not well-resolved.
Our results were consistent with previous mtDNA
analyses, in which these four species form a well-
supported clade that is distinct from a more distantly
related X. birchmanni (Meyer et al. 1994; Marcus &
McCune 1999). Earlier analyses based on nuclear
� 2010 Blackwell Publishing Ltd
Page 12
HYBRID ZONES ALONG AN ELEVATIONAL GRADIENT 353
allozymes and RAPDs but on only one or a few indi-
viduals or populations per taxon (Borowsky et al. 1995;
Morris et al. 2001) suggest a closer relationship
between X. birchmanni and X. malinche, perhaps reflect-
ing the effects of hybridization between these species.
Our results, however, indicated fixed differences
between pure populations of these species at several
nuclear loci. Sequencing and alignment of these
nuclear loci and mtDNA allowed us to identify infor-
mative SNPs that separate the two species. In addition
to our conservative approach selecting only distal pop-
ulations matching historical species distributions, and
only those populations where 100% of the observed
males matched diagnostic morphological traits of only
one species, geometric morphometric analyses sup-
ported the informative nature of the SNP markers. In a
large hybrid population containing X. birchmanni
parentals, X. malinche parentals and hybrids, paren-
tal genotypes had parental (pure species) morphology
as did their respective backcrosses while hybrid
(F2 and later individuals) had intermediate, hybrid
morphology.
Replicated geographic structure
One of the strengths of this system is the replication in
multiple stream reaches. Hybrid zones between these
species occur in at least seven separate streams along
similar ecological gradients. Gene flow among hybrid
zones and among X. malinche populations in stream
headwaters is impeded by high mountain ridges, long
upstream to downstream distances and geographic bar-
riers in some places. Thus, each hybrid zone likely repre-
sents an independent outcome of secondary contact due
to a shift towards higher elevation in X. birchmanni, per-
haps associated with Pleistocene climate change or more
recent anthropogenic effects, pushing X. malinche into
multiple high elevation refugia. Alternatively, as Kall-
man & Kazianis (2006) suggest, an ancestral form may
have been uplifted and populations isolated by folding
of mountain ridges resulting in the current distribution
of X. malinche. Though commonly touted as natural labo-
ratories, replicating studies of hybridization phenomena
is difficult. Nolte et al. (2009) demonstrated the utility of
such natural replication, testing for loci contributing to
reproductive isolation between two species of sculpin
(Cottus), in two independent hybrid zones. Even more
recently, a study of two independent hybrid zones of
cyprinid fish demonstrated the heterogeneity of out-
comes of hybridization within a species pair (Aboim et
al. 2010). Taking advantage of these and other replicated
hybrid zones – like the birchmanni–malinche hybrid zones
– should continue to provide even greater power in
studying evolutionary processes and patterns.
� 2010 Blackwell Publishing Ltd
In the birchmanni–malinche system, each hybrid zone
is characterized by an elevational gradient in the fre-
quency of parental and hybrid individuals and of indi-
vidual, species-diagnostic SNP allele frequencies. In
each stream reach, hybrid zones had clear geographic
structure, with X. malinche alleles being replaced along
an upstream-to-downstream gradient by X. birchmanni
alleles and with hybrids prevalent at intermediate ele-
vations. Analysis of SNP marker frequencies showed
significant effects of drainage and elevation. Mid-elevation
hybrid populations contained a preponderance of
backcross, F2 or later generation hybrid individuals,
whereas F1s were rare. Out of 760 individuals geno-
typed for one mtDNA and three nuclear loci, 13 had
genotypes consistent with first-generation hybrids.
However, only a few of those occurred in populations
where both parental forms are present, suggesting that
the majority of ‘F1’ fish were erroneously classified
backcross fish. The factors that maintain hybrid zone
structure in this system are not yet known as the data
here do not address fitness differences or allow for
explicit tests of among hybrid zone models. However,
the consistency of overall structure across all stream
reaches along the same elevation gradient suggests that
selection by the environment could play a role.
The hybrid zones in different stream reaches all
exhibited consistent upstream-to-downstream structure,
but there were differences among the zones. In the Rıo
Claro, X. malinche were found at much lower elevation
than observed in other stream reaches. This may reflect
differences in historical distributions of species or dif-
ferences in environmental conditions among stream
reaches. Most of the hybrid zones were bounded on
each end by pure populations of parental species, but
no pure X. malinche population is observed in the Rıo
Calnali and no pure populations of X. birchmanni occur
before the 60-m waterfall at Chahuaco. Hybrid popula-
tions were composed of hybrids and one parental (or
only hybrids) in some hybrid zones, while hybrids and
both parentals occur in sympatry in populations in
other hybrid zones. This heterogeneity could be a con-
sequence of any number of biotic or abiotic variables
such as differences in migration, historical frequency of
parentals, connectivity of populations and variation in
natural or sexual selection.
SNP population genetics
Heterozygote deficiency and LD were generally low in
most sampled populations. Low FIS and LD suggest
that hybrids are both viable and fertile and have back-
crossed extensively with the parental species; thus,
there is little evidence of reproductive isolation in most
locations. This is supported by a low frequency of F1s
Page 13
354 Z. W. CULUMBER ET AL.
and high frequencies of F2 (or later) and backcross indi-
viduals in almost all populations. By contrast, when
heterozygote deficiency and LD were observed, they
co-occurred in the same populations. Both parent
species coexist with hybrids in those populations that
deviate from HWE and have LD, with hybrids account-
ing for 10–61% of the population with the exception of
Calnali-high where only X. birchmanni and hybrids were
observed (Table 1). Genetic differentiation across all
populations was significant as expected, and FST
between populations within stream reaches was large
and significant in some but not all cases. However,
pairwise comparisons should be interpreted with cau-
tion because distance between populations is not con-
stant and may account for the large variation in
pairwise FST. It should be noted, however, that even
over distances as short as 200–300 m (22 m elevation)
there was significant differentiation in some cases even
in the absence of apparent physical barriers to migration.
As with overall geographic patterns, the extent to
which migration and selection from the biotic and abi-
otic environment play in shaping population-level pat-
terns is unknown. Deviations from HWE and LD could
be maintained by migration-selection balance such as in
a tension zone model (Gay et al. 2008; Reugg 2008) or if
hybrids are relatively fit compared to parentals, with
some degree of assortative mating in some populations,
as in hybrid superiority (Good et al. 2000). Studies of
mate choice have shown that X. birchmanni has strong
preferences for both visual and olfactory signals of their
own males over X. malinche males (Wong & Rosenthal
2006; Fisher et al. 2006). This may play a role in mating
patterns in structured populations with high FIS and
LD. Additionally, hybrids may have an advantage due
to sexual selection. Certain hybrid males are likely pre-
ferred by females because they have recombinant phe-
notypes not possible in pure species males (Fisher et al.
2009). Future work will be able to build on our current
understanding of the hybrid zones and the evolutionary
processes within them. Persistence of substantial fre-
quencies of parental fish in populations with no source
of pure parentals and a tendency for assortative mating
in X. birchmanni suggest that mating preferences could
play a role in population structure. However, measure-
ments of gene flow and fitness-related traits are neces-
sary to begin to weigh the relative contributions of
environmental selection to overall geographic structure
and the role behaviour, migration and selection in both
stream and population-level patterns in the hybrid zones.
The mechanisms by which population structure arises
and potentially leads to speciation in hybrid popula-
tions are not well understood. The breadth of pre-zygo-
tic and post-zygotic factors contributing to these
processes is rarely tested (but see Mendelson et al.
2007). However, it is the combination and interaction of
these various factors that determine the fate of hybrids,
population structure and, consequently, whether or not
speciation occurs (Bolnick 2009), making hybrid zones
useful study systems. The malinche–birchmanni hybrid
zones and molecular markers described here provide an
opportunity to test the effects of selection at different
points along the pre- to post-zygotic continuum.
Together, behavioural and molecular approaches in this
and other systems can better clarify the processes of
hybridization and hybrid speciation.
Acknowledgements
We would like to thank the federal government of Mexico for
collection permits. We thank Charles Criscione for comments
on the manuscript. We also thank the Texas A&M University
Brazos HPC cluster for computation for phylogenetic analyses
<http://brazos.tamu.edu>. Research was supported by
National Science Foundation grant IOS-0923825 to GGR. ZWC
was supported by National Science Foundation IGERT-0654377
in Applied Biodiversity Science at TAMU.
References
Aboim MA, Mavarez J, Bernatchez L, Coelho MM (2010)
Introgressive hybridization between two Iberian endemic
cyprinid fish: a comparison between two independent
hybrid zones. Journal of Evolutionary Biology, 23, 817–828.
Arnold ML (1997) Natural Hybridization and Evolution. Oxford
University Press, New York.
Barton NH (2001) The role of hybridization in evolution.
Molecular Ecology, 10, 551–568.
Barton NH, Hewitt GM (1985) Analysis of hybrid zones.
Annual Review of Ecology and Systematics, 16, 113–148.
Bell MA, Travis MP (2005) Hybridization, transgressive
segregation, genetic covariation, and adaptive radiation.
Trends in Ecology & Evolution, 20, 358–361.
Bolnick DI (2009) Hybridization and speciation in Centrarchids.
In: Centrarchid Fishes: Diversity, Biology and Conservation (ed
Cooke SJ and Philipp DP). pp. 39–69, Oxford University Press,
Oxford.
Borowsky RL, McClelland M, Cheng R, Welsh J (1995)
Arbitrarily primed DNA-Fingerprinting for phylogenetic
reconstruction in vertebrates - The Xiphophorus model.
Molecular Biology and Evolution, 12, 1022–1032.
Burke JM, Arnold ML (2001) Genetics and the fitness of
hybrids. Annual Review of Genetics, 35, 31–52.
Dowling TE, Secor CL (1997) The role of hybridization and
introgression in the diversification of animals. Annual Review
of Ecology and Systematics, 28, 593–619.
Fisher HS, Wong BBM, Rosenthal GG (2006) Alteration of the
chemical environment disrupts communication in a
freshwater fish. Proceedings of the Royal Society B-Biological
Sciences, 273, 1187–1193.
Fisher HS, Mascuch S, Rosenthal GG (2009) Multivariate male
traits misalign with multivariate female preferences in the
swordtail fish, Xiphophorus birchmanni. Animal Behaviour, 78,
265–269.
� 2010 Blackwell Publishing Ltd
Page 14
HYBRID ZONES ALONG AN ELEVATIONAL GRADIENT 355
Fuller RC, McGhee KE, Schrader M (2007) Speciation in
killifish and the role of salt tolerance. Journal of Evolutionary
Biology, 20, 1962–1975.
Gay L, Crochet PA, Bell DA, Lenormand T (2008) Comparing
clines on molecular and phenotypic traits in hybrid zones:
a window on tension zone models. Evolution, 62, 2789–
2806.
Good TP, Ellis JC, Annett CA, Pierotti R (2000) Bounded
hybrid superiority in an avian hybrid zone: effects of mate,
diet, and habitat choice. Evolution, 54, 1774–1783.
Goudet J (1995) FSTAT (Version 1.2): a computer program to
calculate F-statistics. Journal of Heredity, 86, 485–486.
Goudet J, Raymond M, de-Meeus T, Rousset F (1996) Testing
differentiation in diploid populations. Genetics, 144, 1933–
1940.
Guillaume F, Whitlock MC (2007) Effects of migration on the
genetic covariance matrix. Evolution, 61, 2398–2409.
Gutierrez-Rodriguez C, Shearer AE, Morris MR, de Queiroz K
(2008) Phylogeography and monophyly of the swordtail fish
species Xiphophorus birchmanni (Cyprinodontiformes,
Poeciliidae). Zoologica Scripta, 37, 129–139.
Hartl DL, Clark AG (2007) Principles of Population Genetics, 4th
edn. Sinauer Associates, Sunderland, MA.
Hill WG (1974) Estimation of linkage disequilibrium in random
mating populations. Heredity, 33, 229–239.
Jiggins CD, Mallet A (2000) Bimodal hybrid zones and
speciation. Trends in Ecology & Evolution, 15, 250–255.
Johannesson K, Panova M, Kemppainen P, Andre C, Rolan-
Alvarez E, Butlin RK (2010) Repeated evolution of
reproductive isolation in a marine snail: unveiling
mechanisms of speciation. Philosophical Transactions of the
Royal Society B-Biological Sciences, 365, 1735–1747.
Kalisz S, Kramer EM (2008) Variation and constraint in plant
evolution and development. Heredity, 100, 171–177.
Kallman KD, Kazianis S (2006) The genus Xiphophorus in
Mexico and Central America. Zebrafish, 3, 271–285.
Kawecki TJ, Ebert D (2004) Conceptual issues in local
adaptation. Ecology Letters, 7, 1225–1241.
Lee WJ, Conroy J, Hunting Howell W, Kocher TD (1995)
Structure and evolution of teleost mitochondrial control
regions. Journal of Molecular Evolution, 41, 54–66.
Marcus JM, McCune AR (1999) Ontogeny and phylogeny in
the northern swordtail clade of Xiphophorus. Systematic
Biology, 48, 491–522.
Mendelson TC, Imhoff VE, Venditti JJ (2007) The accumulation
of reproductive barriers during speciation: postmating
barriers in two behaviorally isolated species of darters
(percidae : etheostoma). Evolution, 61, 2596–2606.
Meyer A, Morrissey JM, Schartl M (1994) Recurrent origin of a
sexually selected trait in Xiphophorus fishes inferred from a
molecular phylogeny. Nature, 368, 539–542.
Moore WS (1977) Evaluation of narrow hybrid zones in
vertebrates. Quarterly Review of Biology, 52, 52263–52277.
Morris MR, de Queiroz K, Morizot DC (2001) Phylogenetic
relationships among populations of northern swordtails
(Xiphophorus) as inferred from allozyme data. Copeia, 1, 65–
81.
Nikula R, Strelkov P, Vainola R (2008) A broad transition zone
between an inner Baltic hybrid swarm and a pure North Sea
subspecies of Macoma balthica (Mollusca, Bivalvia). Molecular
Ecology, 17, 1505–1522.
� 2010 Blackwell Publishing Ltd
Nolte AW, Gompert Z, Buerkle CA (2009) Variable patterns of
introgression in two sculpin hybrid zones suggest that
genomic isolation differs among populations. Molecular
Ecology, 18, 2615–2627.
Posada D (2008) jModelTest: Phylogenetic model averaging.
Molecular Biology and Evolution, 25, 1253–1256.
Rauchenberger M, Kallman KD, Moritzot DC (1990)
Monophyly and geography of the Rio Panuco basin
swordtails (genus Xiphophorus) with descriptions of four new
species. American Museum Novitates, 2975, 1–41.
Raymond M, Rousset F (1995) GENEPOP (Version1.2) – popu-
lation-genetics software for exact tests and ecumenicism.
Journal of Heredity, 86, 248–249.
Rieseberg LH, Archer MA, Wayne RK (1999) Transgres-
sive segregation, adaptation and speciation. Heredity, 83,
363–372.
Rieseberg LH, Raymond O, Rosenthal DM, et al. (2003) Major
ecological transitions in wild sunflowers facilitated by
hybridization. Science, 301, 1211–1216.
Rohlf F (2004) tpsDig (ed. http://life.bio.sunysb.edu/morph/).
Rohlf F (2005) tpsRegr (ed. http://life.bio.sunysb.edu/morph/).
Rohlf F (2007) tpsRelw (ed. http://life.bio.sunysb.edu/morph/).
Ronquist F, Huelsenbeck JP (2003) MrBayes 3: Bayesian
phylogenetic inference under mixed models. Bioinformatics,
19, 1572–1574.
Rosenthal GG, De La Rosa Reyna XF, Kazianis S, Stephens MJ,
Morizot DC, Ryan MJ, Garcıa de Leon FJ (2003) Dissolution
of sexual signal complexes in a hybrid zone between the
swordtails Xiphophorus birchmanni and Xiphophorus malinche
(Poeciliidae). Copeia, 2, 299–307.
Ruegg K (2008) Genetic, morphological, and ecological
characterization of a hybrid zone that spans a migratory
divide. Evolution, 62, 452–466.
Schluter D (2009) Evidence for ecological speciation and its
alternative. Science, 323, 737–741.
Schluter D, Conte GL (2009) Genetics and ecological speciation.
Proceedings of the National Academy of Sciences of the United
States of America, 106, 9955–9962.
Stamatakis A (2006a) Phylogenetic models of rate heterogeneity:
a high performance computing perspective. Proceedings of
20th IEEE ⁄ ACM International Parallel and Distributed
Processing Symposium (IPDPS2006), High Performance
Computational Biology Workshop. Rhodos, Greece.
Stamatakis A (2006b) RAxML-VI-HPC: maximum likelihood-
based phylogenetic analyses with thousands of taxa and
mixed models. Bioinformatics, 22, 2688–2690.
Stamatakis A, Hoover P, Rougemont J (2008) A Rapid
Bootstrap Algorithm for the RAxML Web Servers. Systematic
Biology, 57, 758–771.
Swofford DL (2001) PAUP*: Phylogenetic Analysis Using
Parsimony (*and Other Methods). Version 4. Sinauer
Associates, Sunderland, MA.
Tobler M, DeWitt TJ, Schlupp I, de Leon FJG, Herrmann R,
Feulner PGD, Tiedemann R, Plath M (2008) Toxic hydrogen
sulfide and dark caves: phenotypic and genetic divergence
across two abiotic environmental gradients in Poecilia
mexicana. Evolution, 62, 2643–2659.
Walter RB, Rains JD, Russell JE, et al. (2004) A microsatellite
genetic linkage map for Xiphophorus. Genetics, 168, 363–372.
Weir BS, Cockerham CC (1984) Estimating F-Statistics for the
analysis of population-structure. Evolution, 38, 1358–1370.
Page 15
356 Z. W. CULUMBER ET AL.
Wolf JBW, Lindell J, Backstrom N (2010) Speciation genetics:
current status and evolving approaches Introduction.
Philosophical Transactions of the Royal Society B-Biological
Sciences, 365, 1717–1733.
Wong BBM, Rosenthal GG (2006) Female disdain for swords in
a swordtail fish. American Naturalist, 167, 136–140.
Yanchukov A, Hofman S, Szymura JM, Mezhzherin SV (2006)
Hybridization of Bombina bombina and B. variegata (Anura,
Discoglossidae) at a sharp ecotone in western Ukraine:
comparisons across transects and over time. Evolution, 60,
583–600.
Zelditch M, Swiderski D, Sheets H, Fink W (2004) Geometric
Morphometrics for Biologists. Elsevier Academic Press,
Amsterdam.
Zwickl DJ (2006) Genetic Algorithm Approaches for the
Phylogenetic Analysis of Large Biological Sequence Datasets
Under the Maximum Likelihood Criterion. The University of
Texas at Austin, Austin, TX.
Z.C. is interested in mechanisms maintaining genetic variation
in natural populations, particularly pertaining to the evolution-
ary genetics of mate choice and sexual selection. H.F.’s
research focuses on the evolution of reproductive traits that are
shaped by sexual selection and are pivotal to the formation
and dissolution of species boundaries. M.T. works on ecologi-
cal and evolutionary effects of environmental variation on
populations particularly as it pertains to adaptation and specia-
tion. M.M. currently focuses on understanding the evolution of
insect-bacteria associations and phylogeography of freshwater
organisms. P.B.’s research focuses on marine connectivity and
the evolution of marine biodiversity and the application of this
information to the development of more effective marine man-
agement policies. M.S. has longstanding interests in the appli-
cation of molecular genetic data to questions in evolutionary
ecology. G.R.’s research centers around the evolution and
mechanisms of mate choice.
� 2010 Blackwell Publishing Ltd