Environmental effects on distributions of culturable soil oligotrophic bacteria along an elevational gradient in the Chihuahuan Desert James H. Campbell * , John C. Zak, Randall M. Jeter, Richard E. Strauss Department of Biological Sciences, Texas Tech University, Box 43131, Lubbock, TX 79409, USA article info Article history: Received 5 September 2012 Received in revised form 6 September 2013 Accepted 26 September 2013 Available online Keywords: Big Bend National Park Chihuahuan Desert Culture-dependent microbiology Oligotroph Soil chemistry abstract Oligotrophic bacteria have been isolated from many habitats, yet environmental regulation of their distributions in soil has not been elucidated. To address the issue of environmental influence upon oligotrophic distributions, Chihuahuan Desert soils were sampled from five sites along an elevational and vegetational gradient within Big Bend National Park during January and August of 2002 and 2003. Soils were diluted and plated on oligotrophic media, and plates were incubated at 15, 25, 35, 45 and 60 C. Additionally, measurements of soil organic matter, pH, moisture, extractable nitrate, extractable ammonium and microbial biomass carbon were collected for each sample to relate oligotrophic bacterial distributions to soil nutrient and edaphic characteristics. Analysis of variance indicated significant site, season, incubation-temperature and interaction effects on total oligotroph numbers. Canonical corre- spondence analysis and multiple regressions indicated that all soil-chemistry variables significantly influenced discrete morphologies of oligotrophs. Oligotroph distributions were most congruent with soil-chemistry variation in three sites, whereas oligotrophic diversity in two sites did not adhere closely to measured environmental variables. While vegetation type may structure oligotroph communities at the two mid-elevational sites, abiotic constraints are drivers in low-desert sites. Ó 2013 Elsevier Ltd. All rights reserved. 1. Introduction Microbial growth in stressful environments has been of interest for decades. Because many natural environments are nutrient limited (Morita, 1988), this was among the first stressors to be investigated. Microbes capable of metabolism at low concentra- tions of carbon are known as oligotrophs, oligophiles or oligo- carbophiles. The literature is replete with studies of oligotrophs and descriptions of oligotrophic environments, but many questions concerning the ecological significance of oligotrophy remain un- resolved. Of particular importance and confusion is the actual definition of oligotrophy (Schut et al., 1997). Some researchers clearly demarcate the maximum carbon content that will allow growth of oligotrophs on synthetic media, whereas others contend oligotrophs are able to divide in “weak” or “poor” media but not in “rich” media and gradients of microbial responses to environ- mental carbon levels have been proposed. Obligately oligotrophic bacteria (Ishida and Kadota, 1981; Ohta and Hattori, 1983) should be unable to divide (or grow poorly) once an upper threshold of carbon is encountered, whereas copiotrophs (Poindexter, 1981) divide only at relatively high nutrient concentrations. Facultative oligotrophs (Akagi et al., 1980) have been reported to grow across a wide gradient of available carbon. However, studies have not attempted to link oligotroph distributions to soil nutrients and edaphic patterns. Oligotrophic bacteria have been isolated from marine environ- ments (Emiliani, 1984), freshwater (Cho and Giovannoni, 2004), soils (Whang and Hattori, 1988), clinical materials (Tada et al., 1995) and ultrapure water (Kulakov et al., 2002). Studies of oligotrophs in the environment have expanded our knowledge of environmental microbiology directly, and use of dilute media has resulted in the cultivation of novel species (Davis et al., 2005). However, our un- derstanding of oligotroph biology is limited. Very few studies have described distributions of oligotrophs relative to abiotic factors other than carbon availability. Moreover, most distributional studies of oligotrophic bacteria have been conducted in aquatic environments. Akagi et al. (1977) reported a high correlation be- tween abundance of oligotrophs and sample depth in the Pacific Ocean. In addition, numbers of oligotrophs greatly exceeded numbers of copiotrophs and increased as carbohydrate levels decreased (Akagi et al., 1977). Yanagita et al. (1978) surveyed both freshwater and marine environments in Japan and determined that * Corresponding author. Present address: Department of Natural Sciences, Northwest Missouri State University, 800 University Drive, Maryville, MO 64468- 6001, USA. Tel.: þ1 660 562 1196. E-mail address: [email protected](J.H. Campbell). Contents lists available at ScienceDirect Journal of Arid Environments journal homepage: www.elsevier.com/locate/jaridenv 0140-1963/$ e see front matter Ó 2013 Elsevier Ltd. All rights reserved. http://dx.doi.org/10.1016/j.jaridenv.2013.09.006 Journal of Arid Environments 99 (2013) 41e50
Transcript
Environmental effects on distributions of culturable soil oligotrophicbacteria along an elevational gradient in the Chihuahuan Desert
James H. Campbell*, John C. Zak, Randall M. Jeter, Richard E. StraussDepartment of Biological Sciences, Texas Tech University, Box 43131, Lubbock, TX 79409, USA
a r t i c l e i n f o
Article history:Received 5 September 2012Received in revised form6 September 2013Accepted 26 September 2013Available online
Keywords:Big Bend National ParkChihuahuan DesertCulture-dependent microbiologyOligotrophSoil chemistry
a b s t r a c t
Oligotrophic bacteria have been isolated from many habitats, yet environmental regulation of theirdistributions in soil has not been elucidated. To address the issue of environmental influence uponoligotrophic distributions, Chihuahuan Desert soils were sampled from five sites along an elevational andvegetational gradient within Big Bend National Park during January and August of 2002 and 2003. Soilswere diluted and plated on oligotrophic media, and plates were incubated at 15, 25, 35, 45 and 60 !C.Additionally, measurements of soil organic matter, pH, moisture, extractable nitrate, extractableammonium and microbial biomass carbon were collected for each sample to relate oligotrophic bacterialdistributions to soil nutrient and edaphic characteristics. Analysis of variance indicated significant site,season, incubation-temperature and interaction effects on total oligotroph numbers. Canonical corre-spondence analysis and multiple regressions indicated that all soil-chemistry variables significantlyinfluenced discrete morphologies of oligotrophs. Oligotroph distributions were most congruent withsoil-chemistry variation in three sites, whereas oligotrophic diversity in two sites did not adhere closelyto measured environmental variables. While vegetation type may structure oligotroph communities atthe two mid-elevational sites, abiotic constraints are drivers in low-desert sites.
! 2013 Elsevier Ltd. All rights reserved.
1. Introduction
Microbial growth in stressful environments has been of interestfor decades. Because many natural environments are nutrientlimited (Morita, 1988), this was among the first stressors to beinvestigated. Microbes capable of metabolism at low concentra-tions of carbon are known as oligotrophs, oligophiles or oligo-carbophiles. The literature is repletewith studies of oligotrophs anddescriptions of oligotrophic environments, but many questionsconcerning the ecological significance of oligotrophy remain un-resolved. Of particular importance and confusion is the actualdefinition of oligotrophy (Schut et al., 1997). Some researchersclearly demarcate the maximum carbon content that will allowgrowth of oligotrophs on synthetic media, whereas others contendoligotrophs are able to divide in “weak” or “poor” media but not in“rich” media and gradients of microbial responses to environ-mental carbon levels have been proposed. Obligately oligotrophicbacteria (Ishida and Kadota, 1981; Ohta and Hattori, 1983) should
be unable to divide (or grow poorly) once an upper threshold ofcarbon is encountered, whereas copiotrophs (Poindexter, 1981)divide only at relatively high nutrient concentrations. Facultativeoligotrophs (Akagi et al., 1980) have been reported to grow across awide gradient of available carbon. However, studies have notattempted to link oligotroph distributions to soil nutrients andedaphic patterns.
Oligotrophic bacteria have been isolated from marine environ-ments (Emiliani, 1984), freshwater (Cho and Giovannoni, 2004),soils (Whang and Hattori, 1988), clinical materials (Tada et al., 1995)and ultrapure water (Kulakov et al., 2002). Studies of oligotrophs inthe environment have expanded our knowledge of environmentalmicrobiology directly, and use of dilute media has resulted in thecultivation of novel species (Davis et al., 2005). However, our un-derstanding of oligotroph biology is limited. Very few studies havedescribed distributions of oligotrophs relative to abiotic factorsother than carbon availability. Moreover, most distributionalstudies of oligotrophic bacteria have been conducted in aquaticenvironments. Akagi et al. (1977) reported a high correlation be-tween abundance of oligotrophs and sample depth in the PacificOcean. In addition, numbers of oligotrophs greatly exceedednumbers of copiotrophs and increased as carbohydrate levelsdecreased (Akagi et al., 1977). Yanagita et al. (1978) surveyed bothfreshwater and marine environments in Japan and determined that
* Corresponding author. Present address: Department of Natural Sciences,Northwest Missouri State University, 800 University Drive, Maryville, MO 64468-6001, USA. Tel.: "1 660 562 1196.
nitrate and dissolved organic nitrogen limited numbers of fresh-water oligotrophs, whereas nitrate levels limited marine bacteria.Emiliani (1984) collected extensive abiotic data from a river systemand found oligotroph distributions to be positively correlated withindividual environmental factors, such as water flow rate, hydro-metric level, amount of suspended solids, turbidity, temperature,conductivity, phosphate levels, primary production, water trans-parency and pH. However, studies of soil oligotrophs have notattempted to link distributions to environmental gradients.
Bacterial cells contain a significant portion of global carbon,nitrogen and phosphorus (Whitman et al., 1998). Moreover, it isincreasingly clear that oligotrophs are common among environ-mental bacteria (Watve et al., 2000), and a better understanding oftheir distributions in nutrient-limited environments is needed.Elucidation of linkages between oligotrophic bacteria and globalnutrient cycling will become more important in the face of globalclimate change (Zak, 2005). Therefore, the goal of this study was todetermine correspondence of culturable oligotrophic bacteria to asuite of environmental parameters in an arid landscape wherecarbon input is limiting and low soil moisture reduces carbonavailability. To quantify these linkages, plate counts of oligotrophicbacterial morphotypes on dilute media were compared to mea-surements of soil organic matter, pH, extractable ammonium,extractable nitrate and soil moisture along an elevational gradientin the Chihuahuan Desert. Although bacterial morphotypes cannotdirectly resolve responses of taxonomic groups to environmentalgradients, use of morphotypes (Palumbo et al., 1994) can providesuitable spatial and temporal metrics of the culturable bacterialcommunity.
2. Materials and methods
2.1. Study site
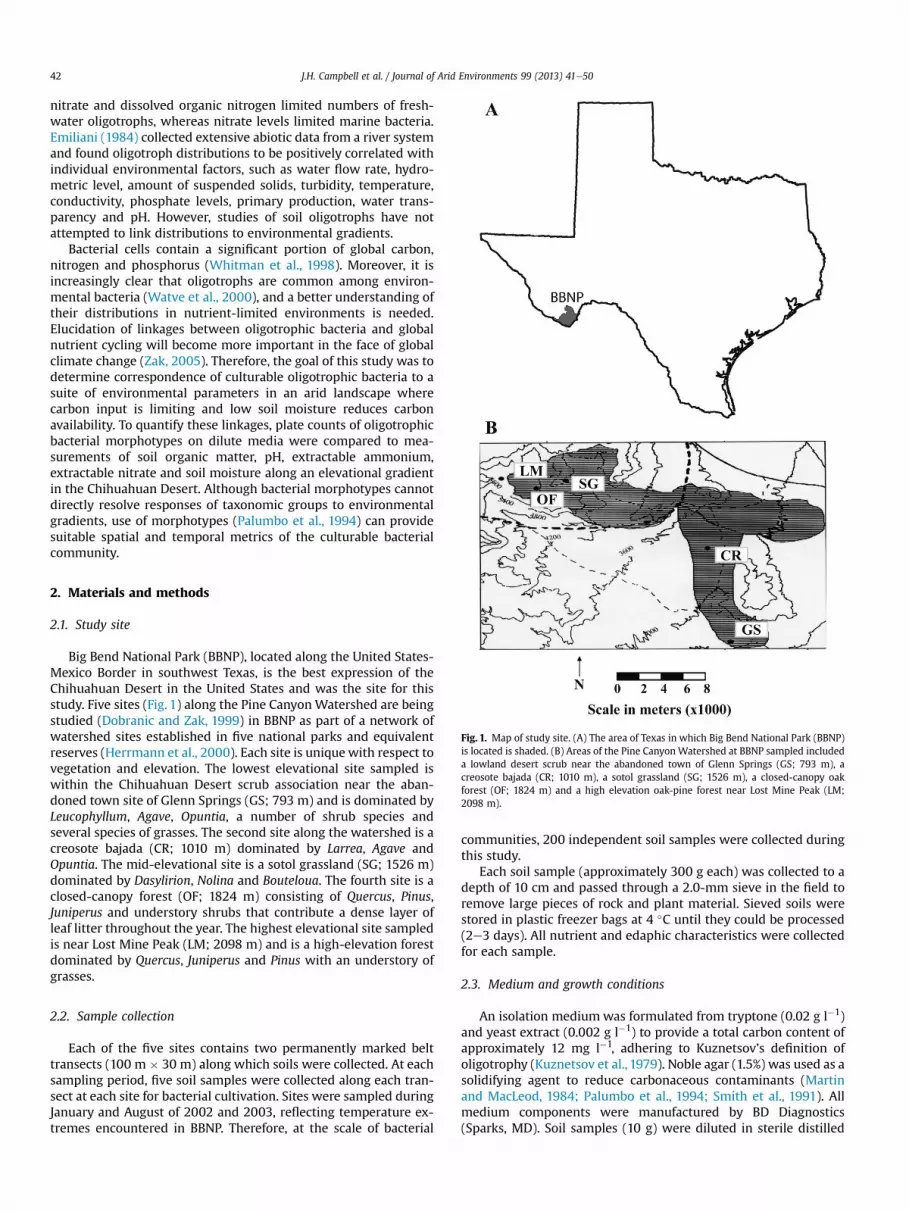
Big Bend National Park (BBNP), located along the United States-Mexico Border in southwest Texas, is the best expression of theChihuahuan Desert in the United States and was the site for thisstudy. Five sites (Fig. 1) along the Pine CanyonWatershed are beingstudied (Dobranic and Zak, 1999) in BBNP as part of a network ofwatershed sites established in five national parks and equivalentreserves (Herrmann et al., 2000). Each site is uniquewith respect tovegetation and elevation. The lowest elevational site sampled iswithin the Chihuahuan Desert scrub association near the aban-doned town site of Glenn Springs (GS; 793 m) and is dominated byLeucophyllum, Agave, Opuntia, a number of shrub species andseveral species of grasses. The second site along the watershed is acreosote bajada (CR; 1010 m) dominated by Larrea, Agave andOpuntia. The mid-elevational site is a sotol grassland (SG; 1526 m)dominated by Dasylirion, Nolina and Bouteloua. The fourth site is aclosed-canopy forest (OF; 1824 m) consisting of Quercus, Pinus,Juniperus and understory shrubs that contribute a dense layer ofleaf litter throughout the year. The highest elevational site sampledis near Lost Mine Peak (LM; 2098 m) and is a high-elevation forestdominated by Quercus, Juniperus and Pinus with an understory ofgrasses.
2.2. Sample collection
Each of the five sites contains two permanently marked belttransects (100 m # 30 m) along which soils were collected. At eachsampling period, five soil samples were collected along each tran-sect at each site for bacterial cultivation. Sites were sampled duringJanuary and August of 2002 and 2003, reflecting temperature ex-tremes encountered in BBNP. Therefore, at the scale of bacterial
communities, 200 independent soil samples were collected duringthis study.
Each soil sample (approximately 300 g each) was collected to adepth of 10 cm and passed through a 2.0-mm sieve in the field toremove large pieces of rock and plant material. Sieved soils werestored in plastic freezer bags at 4 !C until they could be processed(2e3 days). All nutrient and edaphic characteristics were collectedfor each sample.
2.3. Medium and growth conditions
An isolation mediumwas formulated from tryptone (0.02 g l$1)and yeast extract (0.002 g l$1) to provide a total carbon content ofapproximately 12 mg l$1, adhering to Kuznetsov’s definition ofoligotrophy (Kuznetsov et al., 1979). Noble agar (1.5%) was used as asolidifying agent to reduce carbonaceous contaminants (Martinand MacLeod, 1984; Palumbo et al., 1994; Smith et al., 1991). Allmedium components were manufactured by BD Diagnostics(Sparks, MD). Soil samples (10 g) were diluted in sterile distilled
Fig. 1. Map of study site. (A) The area of Texas in which Big Bend National Park (BBNP)is located is shaded. (B) Areas of the Pine CanyonWatershed at BBNP sampled includeda lowland desert scrub near the abandoned town of Glenn Springs (GS; 793 m), acreosote bajada (CR; 1010 m), a sotol grassland (SG; 1526 m), a closed-canopy oakforest (OF; 1824 m) and a high elevation oak-pine forest near Lost Mine Peak (LM;2098 m).
J.H. Campbell et al. / Journal of Arid Environments 99 (2013) 41e5042
H2O, and 0.1-ml aliquots were spread onto 10 plates to give a 10$5
final dilution. Duplicate plates were incubated at 15, 25, 35, 45 or60 !C to represent the range of soil temperatures encounteredalong the Pine CanyonWatershed (Table S1). Plates were incubatedfor approximately six weeks, at which time they were countedmanually with a darkfield Quebec colony counter (Reichert Scien-tific Instruments; Buffalo, NY). Discrete morphologies (Table 1) ofthe colonies were scored separately. Although several plates hadcolonies beyond the commonly accepted range of 30e300, the di-lutions were not altered in order to ensure comparable counts(Davis et al., 2005; Meiklejohn, 1957). In total, 2000 plates wereinoculated and counted during the course of the study.
2.4. Soil chemistry
Microbial biomass carbon (MBC) was determined using thechloroform fumigation technique (Vance et al., 1987). The amountof microbial carbon was determined using a spectrophotometer at280 nm (Spectronic Instruments; Rochester, NY) using the proce-dure of Nunan et al. (1998). A 5e10 g oven-dried subsample (60 !Cfor 3 days) was combusted at 450 !C to determine mass loss onignition, representing SOM percentage (Sollins et al., 1999; VanMiegroet, 1995). Extractable ammoniumenitrogen %NH4
" $ N&was eluted from the soil matrix with 2.0 M KCl (Van Miegroet,1995). Ammonium concentration was determined using standardcolorimetric procedures (Miller and Keeny, 1982; Van Miegroet,1995). Extractable levels of nitrateenitrogen %NO3
$ $ N& in soilsamples were measured with ion-specific probes by A&L PlainsLaboratories (Lubbock, TX). Soil moisture (%M) was determinedafter oven-drying a subsample at 60 !C for 24e48 h. Soil pH wasmeasured from a 2:1 paste in distilled water (Robertson et al., 1999)with an Orion pH probe (ATI Orion; Boston, MA) at roomtemperature.
2.5. Statistical analyses
Mean counts of individual morphologies appearing on replicateplates for each sample were used in all analyses. Levene’s test (SPSSRelease 9.0.0; SPSS, Inc.; Chicago, IL) indicated that variances wereheterogeneous (p < 0.001). Therefore, a Matlab (R12; The Math-Works; Natick, MA) function was written to perform an iterated,
randomly permuted (Anderson and ter Braak, 2003) three-wayanalysis of variance (ANOVA) of the total counts of each sampleto elucidate effects of site, season and incubation temperature onnumbers of culturable oligotrophs. Because observed colony countswere tested against a non-theoretical distribution of randomizedresiduals of colony counts from the same data set, the effects ofheterogeneous variances were nullified. Additionally, a three-wayANOVA was performed (SPSS) to determine Games-Howell posthoc groups of sites, seasons and temperatures for colony counts.
Canonical Correspondence Analyses (CCA) were used (CANOCO4.5; Microcomputer Power; Ithaca, NY) to discern effects of soilchemistry on culturable oligotroph morphologies. Individual colo-nial morphologies were entered as species, while soil-chemistrymeasurements were entered as environmental data. Site, seasonand temperature designations were used as Supplementary data,allowing colonial morphologies to be constrained only by observedsoil chemistry. Data were neither weighted nor transformed, andMonte Carlo permutation tests (default value of 499 permutations)were used for forward selection of significant environmental vari-ables. Triplots depicting all morphologies, significant soil-chemistry variables and all supplementary variables were createdin CanoDraw 4.0 (Microcomputer Power; Ithaca, NY). This allowedthe seasonal and incubation temperatures to be “floated” ontotriplots to show correspondence to environmental fluctuationswithout implying relative significance.
Multiple orthogonal linear regressionswere performed (Matlab)using individual colonial morphologies regressed against all soil-chemistry measurements. Because it is possible for a bacterium toexhibit linear or quadratic responses to variables, both were tested.Linear responses were tested using the observed soil-chemistrymeasurements, while quadratic responses were tested by sub-tracting the grand mean of that variable from each observation andsubsequently squaring this difference [(x $ x)2] to provide a non-correlated, quadratic adjustment of each variable. Significance foreach partial coefficient was determined by comparison with itsstandard error (significant when [jbj $ 2(SE)] > 0).
All Matlab functions and scripts used for ANOVAs andregressions are available online (http://www.faculty.biol.ttu.edu/Strauss/Matlab/Matlab.htm).
3. Results
Bacterial morphotypes were used as groupings in this study, asopposed to taxonomic identifications, allowing a more intensesampling scale thanwould have been possible if isolates were to beidentified using biochemistry or sequencing of 16S rRNA genes(Haldeman and Amy, 1993; Palumbo et al., 1996). Because somemorphologies could contain multiple taxa, particularly those thatwere observed most frequently, this approach assumes that taxacomprising bacterial morphotypes were stable across sites, seasonsand incubation temperatures. Studies of oligotrophs in these sitesusing specialized media and denaturing gradient gel electropho-resis of 16S rRNA genes have been conducted and were presentedelsewhere (Clark et al., 2009).
3.1. Broad effects of environment on culturable oligotrophs
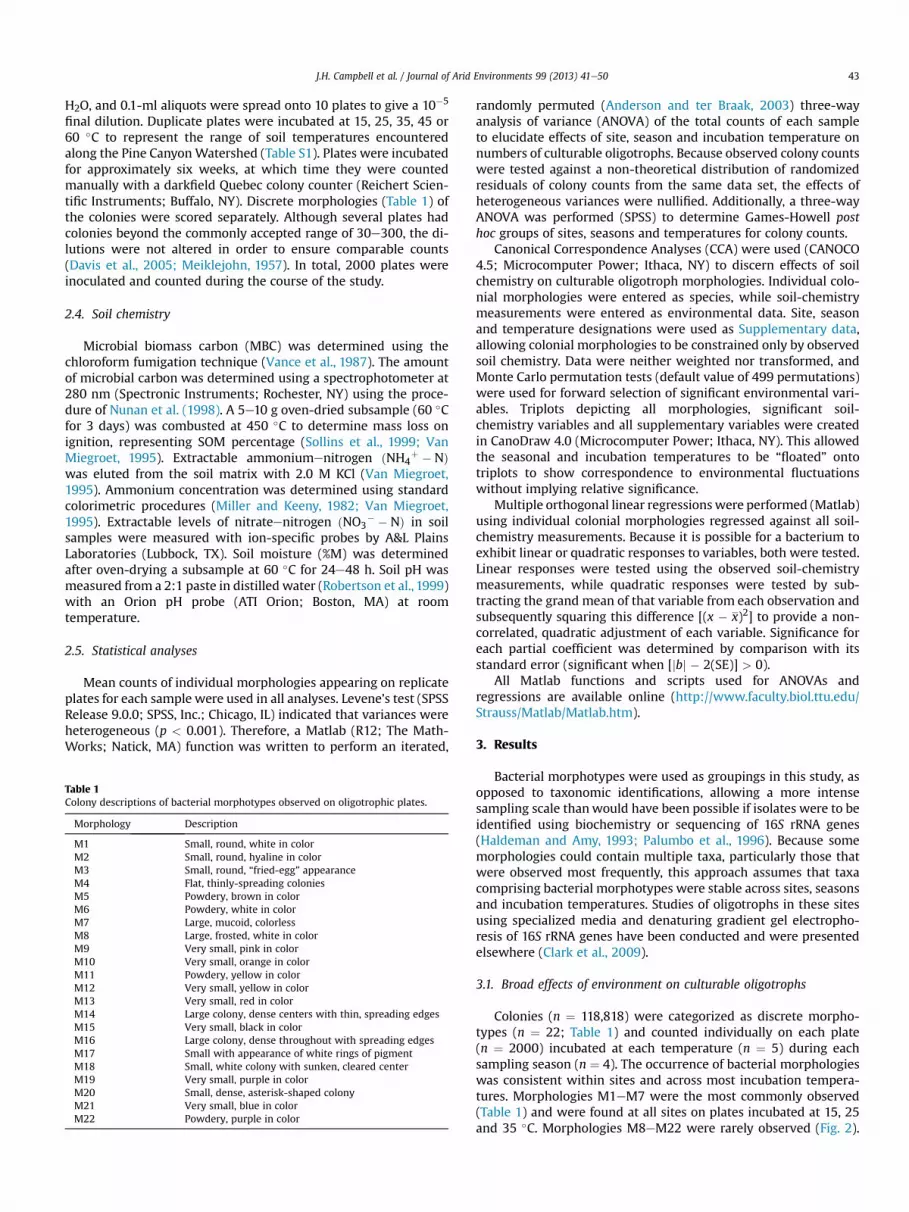
Colonies (n ' 118,818) were categorized as discrete morpho-types (n ' 22; Table 1) and counted individually on each plate(n ' 2000) incubated at each temperature (n ' 5) during eachsampling season (n ' 4). The occurrence of bacterial morphologieswas consistent within sites and across most incubation tempera-tures. Morphologies M1eM7 were the most commonly observed(Table 1) and were found at all sites on plates incubated at 15, 25and 35 !C. Morphologies M8eM22 were rarely observed (Fig. 2).
Table 1Colony descriptions of bacterial morphotypes observed on oligotrophic plates.
Morphology Description
M1 Small, round, white in colorM2 Small, round, hyaline in colorM3 Small, round, “fried-egg” appearanceM4 Flat, thinly-spreading coloniesM5 Powdery, brown in colorM6 Powdery, white in colorM7 Large, mucoid, colorlessM8 Large, frosted, white in colorM9 Very small, pink in colorM10 Very small, orange in colorM11 Powdery, yellow in colorM12 Very small, yellow in colorM13 Very small, red in colorM14 Large colony, dense centers with thin, spreading edgesM15 Very small, black in colorM16 Large colony, dense throughout with spreading edgesM17 Small with appearance of white rings of pigmentM18 Small, white colony with sunken, cleared centerM19 Very small, purple in colorM20 Small, dense, asterisk-shaped colonyM21 Very small, blue in colorM22 Powdery, purple in color
J.H. Campbell et al. / Journal of Arid Environments 99 (2013) 41e50 43
Morphology M3 was found in low quantities from the GS, CR, SGand LM sites but was not detected in any OF samples or 45 !C in-cubations. Plates incubated at 60 !C produced several colonialmorphologies for the GS, CR and LM soils, but showed no growthfrom OF soils. Dilutions of soils from SG incubated at 60 !C sup-ported growth of all morphologies except M3.
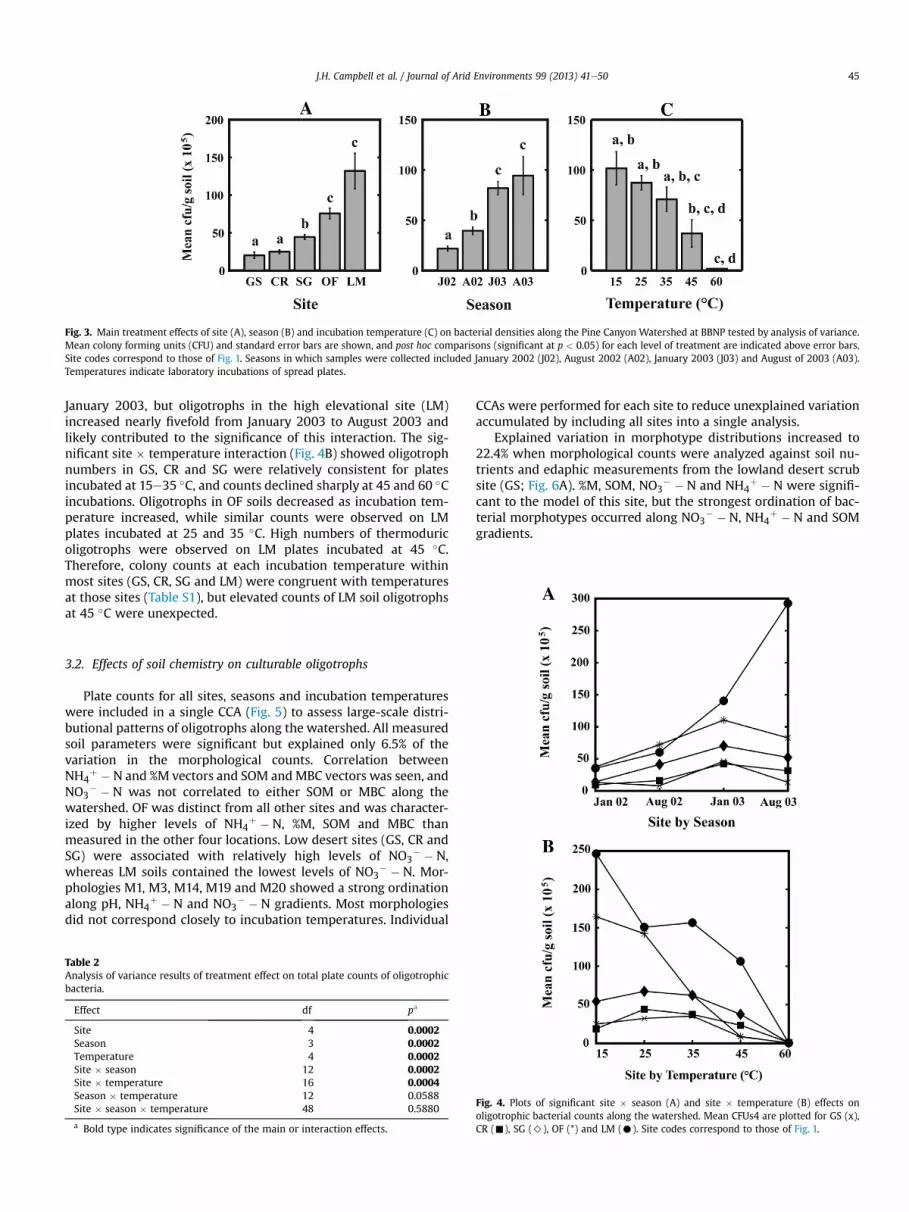
Mean colony forming units (CFUs) increased with elevation(Fig. 3A). The low desert sites GS and CR formed a homogeneousgroup, SG was distinct from all other sites and the high-elevationOF and LM sites formed a homogeneous group. August samplingperiods exhibited greater bacterial numbers than January sam-plings for both years (Fig. 3B). Seasonal post hoc groups indicatedthat both January and August of 2002 were significantly differentfrom all other sampling periods, while January and August of 2003
formed a homogeneous group. Numbers of culturable oligotrophswere also strongly influenced by incubation temperature (Fig. 3C),and CFUs decreased as incubation temperature increased. Effects oftemperature treatments overlapped extensively, and numbers ofmorphologies observed in response to incubation temperatureappeared to be more variable than site or seasonal effects. Ananalysis of homogeneous subsets indicated assignment of 15e35 !Cto one group and 45e60 !C incubation temperatures to a secondgroup with 90.5% consistency.
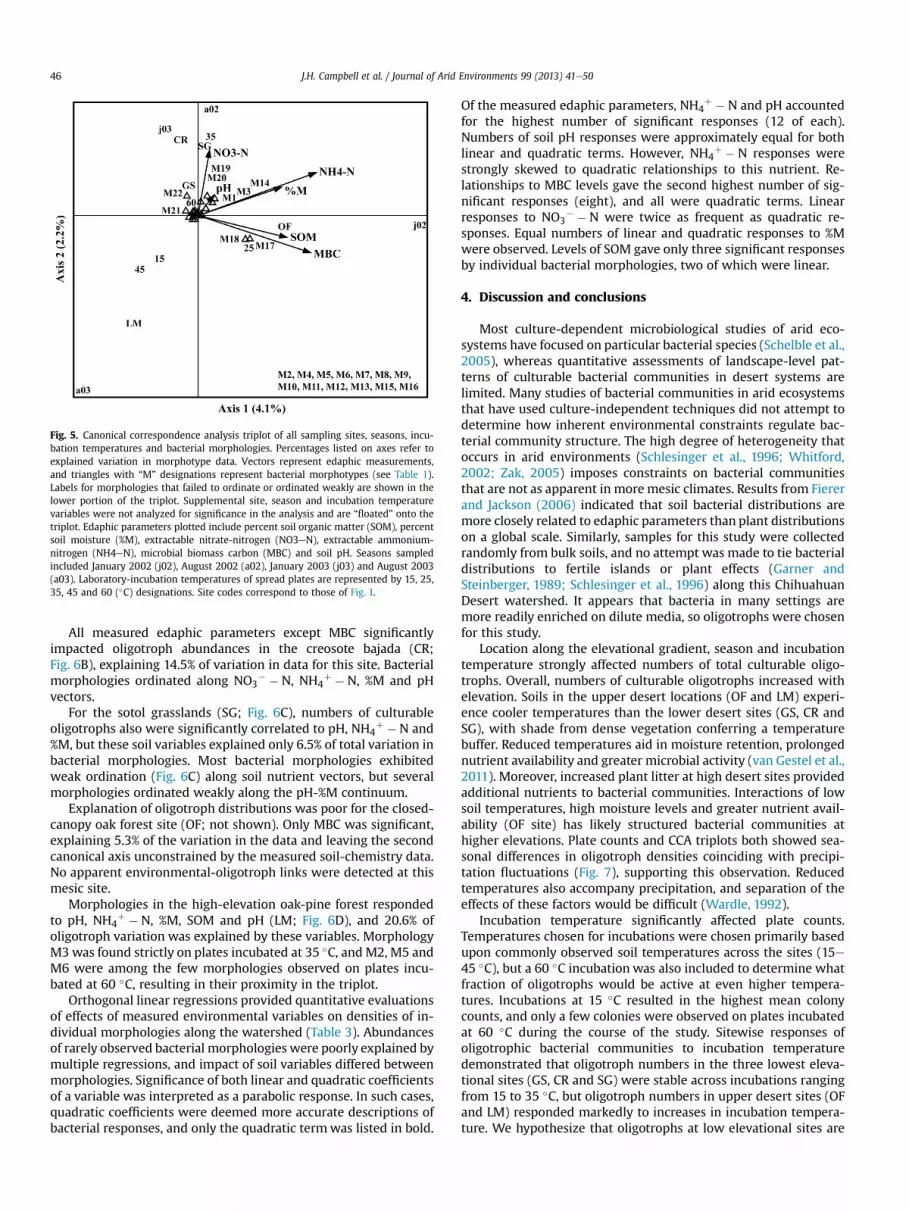
Site # season and site # temperature interactions significantlyimpacted culturable oligotroph numbers (Table 2). The significantsite # season interaction (Fig. 4A) demonstrated consistency inoligotroph counts between the GSeCR and SGeOF sites. Numbersof culturable oligotrophs within GS, CR, SG and OF peaked during
Fig. 2. Counts of bacterial morphologies observed from soils of all sites and individual sites along the Pine Canyon Watershed. Summed counts of all sampling seasons and in-cubation temperatures are shown. Site codes correspond to those of Fig. 1.
J.H. Campbell et al. / Journal of Arid Environments 99 (2013) 41e5044
January 2003, but oligotrophs in the high elevational site (LM)increased nearly fivefold from January 2003 to August 2003 andlikely contributed to the significance of this interaction. The sig-nificant site # temperature interaction (Fig. 4B) showed oligotrophnumbers in GS, CR and SG were relatively consistent for platesincubated at 15e35 !C, and counts declined sharply at 45 and 60 !Cincubations. Oligotrophs in OF soils decreased as incubation tem-perature increased, while similar counts were observed on LMplates incubated at 25 and 35 !C. High numbers of thermoduricoligotrophs were observed on LM plates incubated at 45 !C.Therefore, colony counts at each incubation temperature withinmost sites (GS, CR, SG and LM) were congruent with temperaturesat those sites (Table S1), but elevated counts of LM soil oligotrophsat 45 !C were unexpected.
3.2. Effects of soil chemistry on culturable oligotrophs
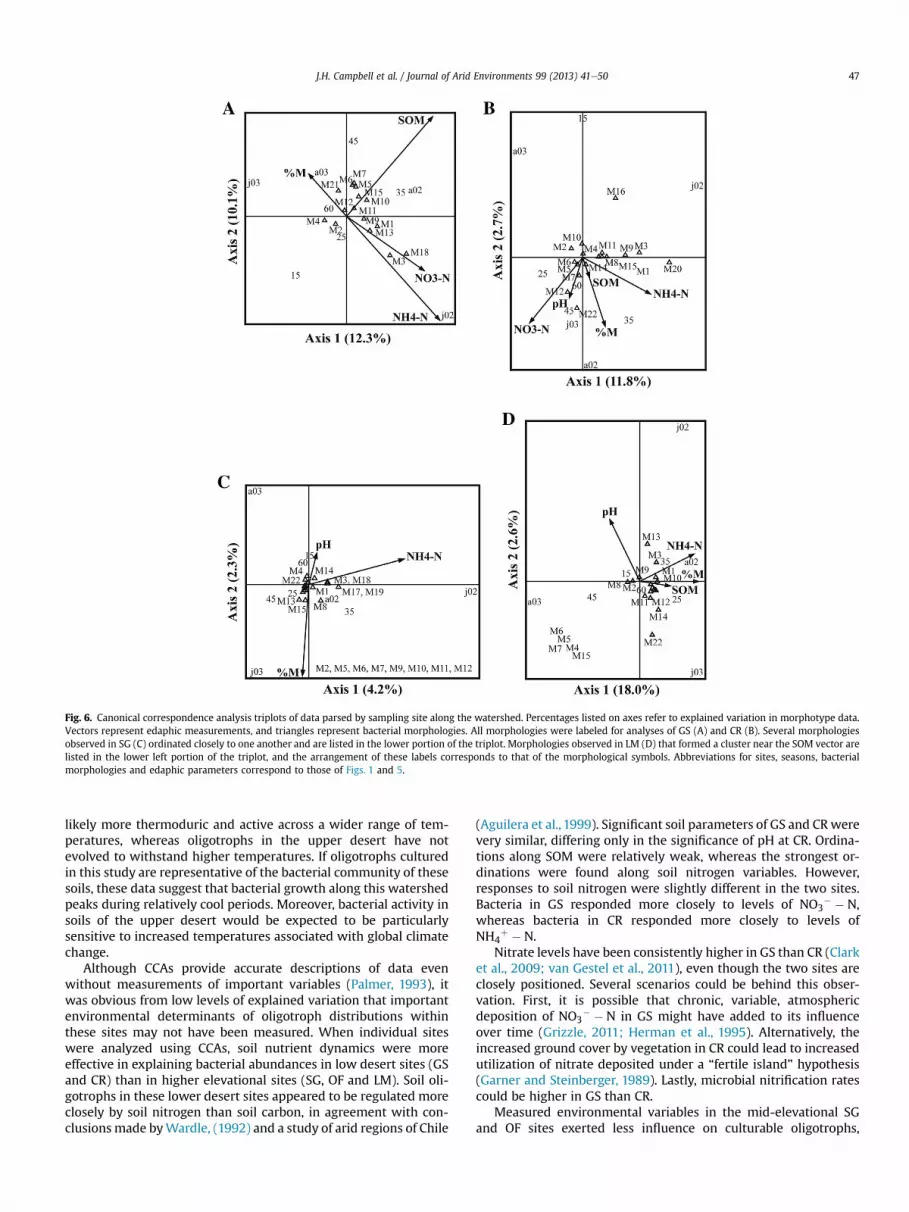
Plate counts for all sites, seasons and incubation temperatureswere included in a single CCA (Fig. 5) to assess large-scale distri-butional patterns of oligotrophs along the watershed. All measuredsoil parameters were significant but explained only 6.5% of thevariation in the morphological counts. Correlation betweenNH4
" $ N and %M vectors and SOM andMBC vectors was seen, andNO3
$ $ N was not correlated to either SOM or MBC along thewatershed. OF was distinct from all other sites and was character-ized by higher levels of NH4
" $ N, %M, SOM and MBC thanmeasured in the other four locations. Low desert sites (GS, CR andSG) were associated with relatively high levels of NO3
$ $ N,whereas LM soils contained the lowest levels of NO3
$ $ N. Mor-phologies M1, M3, M14, M19 and M20 showed a strong ordinationalong pH, NH4
" $ N and NO3$ $ N gradients. Most morphologies
did not correspond closely to incubation temperatures. Individual
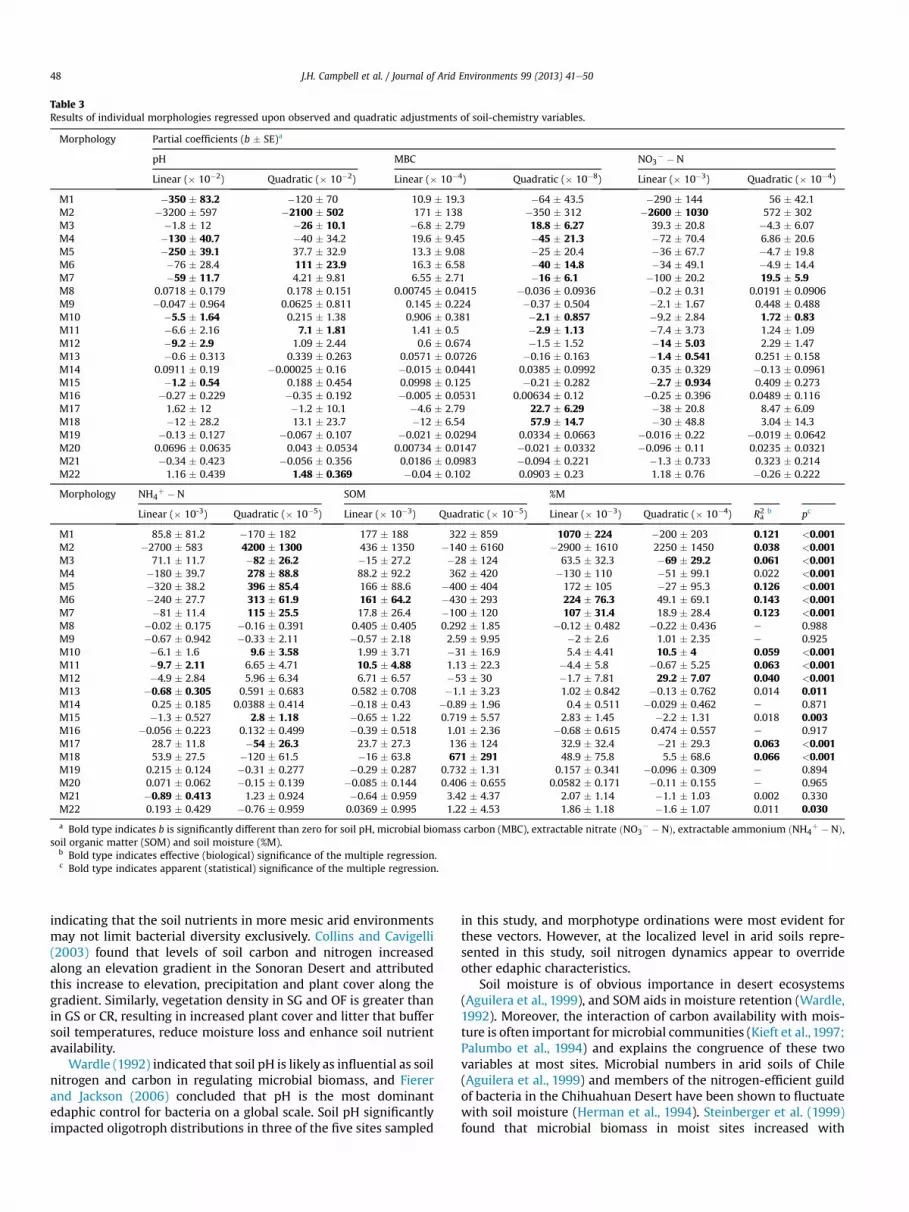
CCAs were performed for each site to reduce unexplained variationaccumulated by including all sites into a single analysis.
Explained variation in morphotype distributions increased to22.4% when morphological counts were analyzed against soil nu-trients and edaphic measurements from the lowland desert scrubsite (GS; Fig. 6A). %M, SOM, NO3
$ $ N and NH4" $ N were signifi-
cant to the model of this site, but the strongest ordination of bac-terial morphotypes occurred along NO3
$ $ N, NH4" $ N and SOM
gradients.
Fig. 3. Main treatment effects of site (A), season (B) and incubation temperature (C) on bacterial densities along the Pine Canyon Watershed at BBNP tested by analysis of variance.Mean colony forming units (CFU) and standard error bars are shown, and post hoc comparisons (significant at p < 0.05) for each level of treatment are indicated above error bars.Site codes correspond to those of Fig. 1. Seasons in which samples were collected included January 2002 (J02), August 2002 (A02), January 2003 (J03) and August of 2003 (A03).Temperatures indicate laboratory incubations of spread plates.
Table 2Analysis of variance results of treatment effect on total plate counts of oligotrophicbacteria.
Effect df pa
Site 4 0.0002Season 3 0.0002Temperature 4 0.0002Site # season 12 0.0002Site # temperature 16 0.0004Season # temperature 12 0.0588Site # season # temperature 48 0.5880
a Bold type indicates significance of the main or interaction effects.
Fig. 4. Plots of significant site # season (A) and site # temperature (B) effects onoligotrophic bacterial counts along the watershed. Mean CFUs4 are plotted for GS (x),CR (-), SG (>), OF (*) and LM (C). Site codes correspond to those of Fig. 1.
J.H. Campbell et al. / Journal of Arid Environments 99 (2013) 41e50 45
All measured edaphic parameters except MBC significantlyimpacted oligotroph abundances in the creosote bajada (CR;Fig. 6B), explaining 14.5% of variation in data for this site. Bacterialmorphologies ordinated along NO3
$ $ N, NH4" $ N, %M and pH
vectors.For the sotol grasslands (SG; Fig. 6C), numbers of culturable
oligotrophs also were significantly correlated to pH, NH4" $ N and
%M, but these soil variables explained only 6.5% of total variation inbacterial morphologies. Most bacterial morphologies exhibitedweak ordination (Fig. 6C) along soil nutrient vectors, but severalmorphologies ordinated weakly along the pH-%M continuum.
Explanation of oligotroph distributions was poor for the closed-canopy oak forest site (OF; not shown). Only MBC was significant,explaining 5.3% of the variation in the data and leaving the secondcanonical axis unconstrained by the measured soil-chemistry data.No apparent environmental-oligotroph links were detected at thismesic site.
Morphologies in the high-elevation oak-pine forest respondedto pH, NH4
" $ N, %M, SOM and pH (LM; Fig. 6D), and 20.6% ofoligotroph variation was explained by these variables. MorphologyM3was found strictly on plates incubated at 35 !C, andM2, M5 andM6 were among the few morphologies observed on plates incu-bated at 60 !C, resulting in their proximity in the triplot.
Orthogonal linear regressions provided quantitative evaluationsof effects of measured environmental variables on densities of in-dividual morphologies along the watershed (Table 3). Abundancesof rarely observed bacterial morphologies were poorly explained bymultiple regressions, and impact of soil variables differed betweenmorphologies. Significance of both linear and quadratic coefficientsof a variable was interpreted as a parabolic response. In such cases,quadratic coefficients were deemed more accurate descriptions ofbacterial responses, and only the quadratic termwas listed in bold.
Of the measured edaphic parameters, NH4" $ N and pH accounted
for the highest number of significant responses (12 of each).Numbers of soil pH responses were approximately equal for bothlinear and quadratic terms. However, NH4
" $ N responses werestrongly skewed to quadratic relationships to this nutrient. Re-lationships to MBC levels gave the second highest number of sig-nificant responses (eight), and all were quadratic terms. Linearresponses to NO3
$ $ N were twice as frequent as quadratic re-sponses. Equal numbers of linear and quadratic responses to %Mwere observed. Levels of SOM gave only three significant responsesby individual bacterial morphologies, two of which were linear.
4. Discussion and conclusions
Most culture-dependent microbiological studies of arid eco-systems have focused on particular bacterial species (Schelble et al.,2005), whereas quantitative assessments of landscape-level pat-terns of culturable bacterial communities in desert systems arelimited. Many studies of bacterial communities in arid ecosystemsthat have used culture-independent techniques did not attempt todetermine how inherent environmental constraints regulate bac-terial community structure. The high degree of heterogeneity thatoccurs in arid environments (Schlesinger et al., 1996; Whitford,2002; Zak, 2005) imposes constraints on bacterial communitiesthat are not as apparent in more mesic climates. Results from Fiererand Jackson (2006) indicated that soil bacterial distributions aremore closely related to edaphic parameters than plant distributionson a global scale. Similarly, samples for this study were collectedrandomly from bulk soils, and no attempt was made to tie bacterialdistributions to fertile islands or plant effects (Garner andSteinberger, 1989; Schlesinger et al., 1996) along this ChihuahuanDesert watershed. It appears that bacteria in many settings aremore readily enriched on dilute media, so oligotrophs were chosenfor this study.
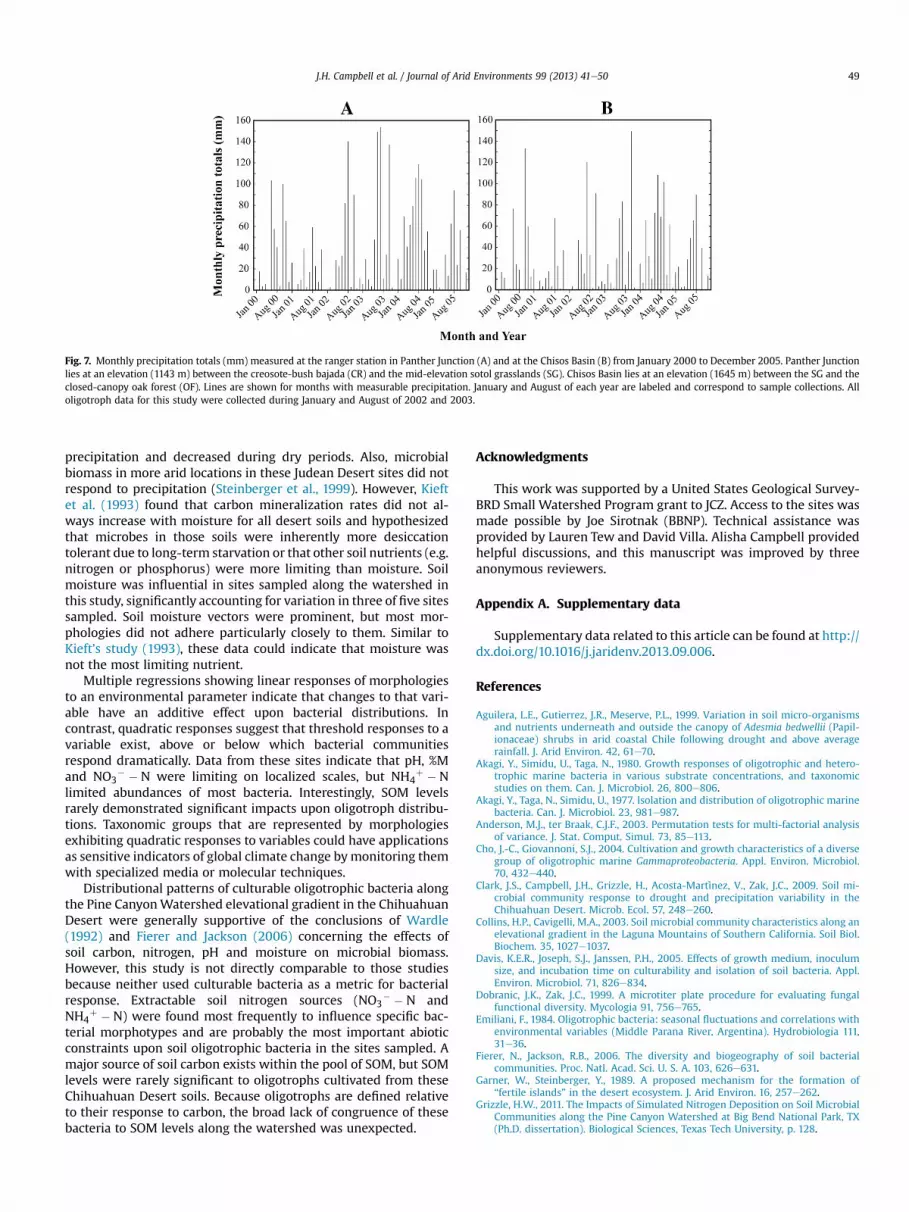
Location along the elevational gradient, season and incubationtemperature strongly affected numbers of total culturable oligo-trophs. Overall, numbers of culturable oligotrophs increased withelevation. Soils in the upper desert locations (OF and LM) experi-ence cooler temperatures than the lower desert sites (GS, CR andSG), with shade from dense vegetation conferring a temperaturebuffer. Reduced temperatures aid in moisture retention, prolongednutrient availability and greater microbial activity (van Gestel et al.,2011). Moreover, increased plant litter at high desert sites providedadditional nutrients to bacterial communities. Interactions of lowsoil temperatures, high moisture levels and greater nutrient avail-ability (OF site) has likely structured bacterial communities athigher elevations. Plate counts and CCA triplots both showed sea-sonal differences in oligotroph densities coinciding with precipi-tation fluctuations (Fig. 7), supporting this observation. Reducedtemperatures also accompany precipitation, and separation of theeffects of these factors would be difficult (Wardle, 1992).
Incubation temperature significantly affected plate counts.Temperatures chosen for incubations were chosen primarily basedupon commonly observed soil temperatures across the sites (15e45 !C), but a 60 !C incubation was also included to determine whatfraction of oligotrophs would be active at even higher tempera-tures. Incubations at 15 !C resulted in the highest mean colonycounts, and only a few colonies were observed on plates incubatedat 60 !C during the course of the study. Sitewise responses ofoligotrophic bacterial communities to incubation temperaturedemonstrated that oligotroph numbers in the three lowest eleva-tional sites (GS, CR and SG) were stable across incubations rangingfrom 15 to 35 !C, but oligotroph numbers in upper desert sites (OFand LM) responded markedly to increases in incubation tempera-ture. We hypothesize that oligotrophs at low elevational sites are
Fig. 5. Canonical correspondence analysis triplot of all sampling sites, seasons, incu-bation temperatures and bacterial morphologies. Percentages listed on axes refer toexplained variation in morphotype data. Vectors represent edaphic measurements,and triangles with “M” designations represent bacterial morphotypes (see Table 1).Labels for morphologies that failed to ordinate or ordinated weakly are shown in thelower portion of the triplot. Supplemental site, season and incubation temperaturevariables were not analyzed for significance in the analysis and are “floated” onto thetriplot. Edaphic parameters plotted include percent soil organic matter (SOM), percentsoil moisture (%M), extractable nitrate-nitrogen (NO3eN), extractable ammonium-nitrogen (NH4eN), microbial biomass carbon (MBC) and soil pH. Seasons sampledincluded January 2002 (j02), August 2002 (a02), January 2003 (j03) and August 2003(a03). Laboratory-incubation temperatures of spread plates are represented by 15, 25,35, 45 and 60 (!C) designations. Site codes correspond to those of Fig. 1.
J.H. Campbell et al. / Journal of Arid Environments 99 (2013) 41e5046
likely more thermoduric and active across a wider range of tem-peratures, whereas oligotrophs in the upper desert have notevolved to withstand higher temperatures. If oligotrophs culturedin this study are representative of the bacterial community of thesesoils, these data suggest that bacterial growth along this watershedpeaks during relatively cool periods. Moreover, bacterial activity insoils of the upper desert would be expected to be particularlysensitive to increased temperatures associated with global climatechange.
Although CCAs provide accurate descriptions of data evenwithout measurements of important variables (Palmer, 1993), itwas obvious from low levels of explained variation that importantenvironmental determinants of oligotroph distributions withinthese sites may not have been measured. When individual siteswere analyzed using CCAs, soil nutrient dynamics were moreeffective in explaining bacterial abundances in low desert sites (GSand CR) than in higher elevational sites (SG, OF and LM). Soil oli-gotrophs in these lower desert sites appeared to be regulated moreclosely by soil nitrogen than soil carbon, in agreement with con-clusionsmade byWardle, (1992) and a study of arid regions of Chile
(Aguilera et al., 1999). Significant soil parameters of GS and CRwerevery similar, differing only in the significance of pH at CR. Ordina-tions along SOM were relatively weak, whereas the strongest or-dinations were found along soil nitrogen variables. However,responses to soil nitrogen were slightly different in the two sites.Bacteria in GS responded more closely to levels of NO3
$ $ N,whereas bacteria in CR responded more closely to levels ofNH4
" $ N.Nitrate levels have been consistently higher in GS than CR (Clark
et al., 2009; van Gestel et al., 2011), even though the two sites areclosely positioned. Several scenarios could be behind this obser-vation. First, it is possible that chronic, variable, atmosphericdeposition of NO3
$ $ N in GS might have added to its influenceover time (Grizzle, 2011; Herman et al., 1995). Alternatively, theincreased ground cover by vegetation in CR could lead to increasedutilization of nitrate deposited under a “fertile island” hypothesis(Garner and Steinberger, 1989). Lastly, microbial nitrification ratescould be higher in GS than CR.
Measured environmental variables in the mid-elevational SGand OF sites exerted less influence on culturable oligotrophs,
Fig. 6. Canonical correspondence analysis triplots of data parsed by sampling site along the watershed. Percentages listed on axes refer to explained variation in morphotype data.Vectors represent edaphic measurements, and triangles represent bacterial morphologies. All morphologies were labeled for analyses of GS (A) and CR (B). Several morphologiesobserved in SG (C) ordinated closely to one another and are listed in the lower portion of the triplot. Morphologies observed in LM (D) that formed a cluster near the SOM vector arelisted in the lower left portion of the triplot, and the arrangement of these labels corresponds to that of the morphological symbols. Abbreviations for sites, seasons, bacterialmorphologies and edaphic parameters correspond to those of Figs. 1 and 5.
J.H. Campbell et al. / Journal of Arid Environments 99 (2013) 41e50 47
indicating that the soil nutrients in more mesic arid environmentsmay not limit bacterial diversity exclusively. Collins and Cavigelli(2003) found that levels of soil carbon and nitrogen increasedalong an elevation gradient in the Sonoran Desert and attributedthis increase to elevation, precipitation and plant cover along thegradient. Similarly, vegetation density in SG and OF is greater thanin GS or CR, resulting in increased plant cover and litter that buffersoil temperatures, reduce moisture loss and enhance soil nutrientavailability.
Wardle (1992) indicated that soil pH is likely as influential as soilnitrogen and carbon in regulating microbial biomass, and Fiererand Jackson (2006) concluded that pH is the most dominantedaphic control for bacteria on a global scale. Soil pH significantlyimpacted oligotroph distributions in three of the five sites sampled
in this study, and morphotype ordinations were most evident forthese vectors. However, at the localized level in arid soils repre-sented in this study, soil nitrogen dynamics appear to overrideother edaphic characteristics.
Soil moisture is of obvious importance in desert ecosystems(Aguilera et al., 1999), and SOM aids in moisture retention (Wardle,1992). Moreover, the interaction of carbon availability with mois-ture is often important for microbial communities (Kieft et al., 1997;Palumbo et al., 1994) and explains the congruence of these twovariables at most sites. Microbial numbers in arid soils of Chile(Aguilera et al., 1999) and members of the nitrogen-efficient guildof bacteria in the Chihuahuan Desert have been shown to fluctuatewith soil moisture (Herman et al., 1994). Steinberger et al. (1999)found that microbial biomass in moist sites increased with
Table 3Results of individual morphologies regressed upon observed and quadratic adjustments of soil-chemistry variables.
Morphology Partial coefficients (b ( SE)a
pH MBC NO3$ $ N
Linear (# 10$2) Quadratic (# 10$2) Linear (# 10$4) Quadratic (# 10$8) Linear (# 10$3) Quadratic (# 10$4)
soil organic matter (SOM) and soil moisture (%M).b Bold type indicates effective (biological) significance of the multiple regression.c Bold type indicates apparent (statistical) significance of the multiple regression.
J.H. Campbell et al. / Journal of Arid Environments 99 (2013) 41e5048
precipitation and decreased during dry periods. Also, microbialbiomass in more arid locations in these Judean Desert sites did notrespond to precipitation (Steinberger et al., 1999). However, Kieftet al. (1993) found that carbon mineralization rates did not al-ways increase with moisture for all desert soils and hypothesizedthat microbes in those soils were inherently more desiccationtolerant due to long-term starvation or that other soil nutrients (e.g.nitrogen or phosphorus) were more limiting than moisture. Soilmoisture was influential in sites sampled along the watershed inthis study, significantly accounting for variation in three of five sitessampled. Soil moisture vectors were prominent, but most mor-phologies did not adhere particularly closely to them. Similar toKieft’s study (1993), these data could indicate that moisture wasnot the most limiting nutrient.
Multiple regressions showing linear responses of morphologiesto an environmental parameter indicate that changes to that vari-able have an additive effect upon bacterial distributions. Incontrast, quadratic responses suggest that threshold responses to avariable exist, above or below which bacterial communitiesrespond dramatically. Data from these sites indicate that pH, %Mand NO3
$ $ N were limiting on localized scales, but NH4" $ N
limited abundances of most bacteria. Interestingly, SOM levelsrarely demonstrated significant impacts upon oligotroph distribu-tions. Taxonomic groups that are represented by morphologiesexhibiting quadratic responses to variables could have applicationsas sensitive indicators of global climate change bymonitoring themwith specialized media or molecular techniques.
Distributional patterns of culturable oligotrophic bacteria alongthe Pine CanyonWatershed elevational gradient in the ChihuahuanDesert were generally supportive of the conclusions of Wardle(1992) and Fierer and Jackson (2006) concerning the effects ofsoil carbon, nitrogen, pH and moisture on microbial biomass.However, this study is not directly comparable to those studiesbecause neither used culturable bacteria as a metric for bacterialresponse. Extractable soil nitrogen sources (NO3
$ $ N andNH4
" $ N) were found most frequently to influence specific bac-terial morphotypes and are probably the most important abioticconstraints upon soil oligotrophic bacteria in the sites sampled. Amajor source of soil carbon exists within the pool of SOM, but SOMlevels were rarely significant to oligotrophs cultivated from theseChihuahuan Desert soils. Because oligotrophs are defined relativeto their response to carbon, the broad lack of congruence of thesebacteria to SOM levels along the watershed was unexpected.
Acknowledgments
This work was supported by a United States Geological Survey-BRD Small Watershed Program grant to JCZ. Access to the sites wasmade possible by Joe Sirotnak (BBNP). Technical assistance wasprovided by Lauren Tew and David Villa. Alisha Campbell providedhelpful discussions, and this manuscript was improved by threeanonymous reviewers.
Appendix A. Supplementary data
Supplementary data related to this article can be found at http://dx.doi.org/10.1016/j.jaridenv.2013.09.006.
References
Aguilera, L.E., Gutierrez, J.R., Meserve, P.L., 1999. Variation in soil micro-organismsand nutrients underneath and outside the canopy of Adesmia bedwellii (Papil-ionaceae) shrubs in arid coastal Chile following drought and above averagerainfall. J. Arid Environ. 42, 61e70.
Akagi, Y., Simidu, U., Taga, N., 1980. Growth responses of oligotrophic and hetero-trophic marine bacteria in various substrate concentrations, and taxonomicstudies on them. Can. J. Microbiol. 26, 800e806.
Akagi, Y., Taga, N., Simidu, U., 1977. Isolation and distribution of oligotrophic marinebacteria. Can. J. Microbiol. 23, 981e987.
Anderson, M.J., ter Braak, C.J.F., 2003. Permutation tests for multi-factorial analysisof variance. J. Stat. Comput. Simul. 73, 85e113.
Cho, J.-C., Giovannoni, S.J., 2004. Cultivation and growth characteristics of a diversegroup of oligotrophic marine Gammaproteobacteria. Appl. Environ. Microbiol.70, 432e440.
Clark, J.S., Campbell, J.H., Grizzle, H., Acosta-Martìnez, V., Zak, J.C., 2009. Soil mi-crobial community response to drought and precipitation variability in theChihuahuan Desert. Microb. Ecol. 57, 248e260.
Collins, H.P., Cavigelli, M.A., 2003. Soil microbial community characteristics along anelevational gradient in the Laguna Mountains of Southern California. Soil Biol.Biochem. 35, 1027e1037.
Davis, K.E.R., Joseph, S.J., Janssen, P.H., 2005. Effects of growth medium, inoculumsize, and incubation time on culturability and isolation of soil bacteria. Appl.Environ. Microbiol. 71, 826e834.
Dobranic, J.K., Zak, J.C., 1999. A microtiter plate procedure for evaluating fungalfunctional diversity. Mycologia 91, 756e765.
Emiliani, F., 1984. Oligotrophic bacteria: seasonal fluctuations and correlations withenvironmental variables (Middle Parana River, Argentina). Hydrobiologia 111,31e36.
Fierer, N., Jackson, R.B., 2006. The diversity and biogeography of soil bacterialcommunities. Proc. Natl. Acad. Sci. U. S. A. 103, 626e631.
Garner, W., Steinberger, Y., 1989. A proposed mechanism for the formation of“fertile islands” in the desert ecosystem. J. Arid Environ. 16, 257e262.
Grizzle, H.W., 2011. The Impacts of Simulated Nitrogen Deposition on Soil MicrobialCommunities along the Pine Canyon Watershed at Big Bend National Park, TX(Ph.D. dissertation). Biological Sciences, Texas Tech University, p. 128.
Fig. 7. Monthly precipitation totals (mm) measured at the ranger station in Panther Junction (A) and at the Chisos Basin (B) from January 2000 to December 2005. Panther Junctionlies at an elevation (1143 m) between the creosote-bush bajada (CR) and the mid-elevation sotol grasslands (SG). Chisos Basin lies at an elevation (1645 m) between the SG and theclosed-canopy oak forest (OF). Lines are shown for months with measurable precipitation. January and August of each year are labeled and correspond to sample collections. Alloligotroph data for this study were collected during January and August of 2002 and 2003.
J.H. Campbell et al. / Journal of Arid Environments 99 (2013) 41e50 49
Haldeman, D.L., Amy, P.S., 1993. Diversity within a colony morphotype: implicationsfor ecological research. Appl. Environ. Microbiol. 59, 933e935.
Herman, R.P., Provencio, K., Torrez, R., Seager, G.M., 1994. Seasonal and spatialpopulation dynamics of the nitrogen-efficient guild in a desert bajada grass-land. Appl. Environ. Microbiol. 60, 1160e1165.
Herman, R.P., Provencio, K.R., Herrera-Matos, J., Torrez, R.J., 1995. Resource islandspredict the distribution of heterotrophic bacteria in Chihuahuan Desert soils.Appl. Environ. Microbiol. 61, 1816e1821.
Herrmann, R., Stottlermyer, R., Zak, J.C., Edmonds, R.L., Miergroet, H.V., 2000.Biogeochemical effects of global change on U.S. national parks. J. Am. WaterResour. Assoc. 36, 337e346.
Ishida, Y., Kadota, H., 1981. Growth patterns and substrate requirements of naturallyoccurring obligate oligotrophs. Microb. Ecol. 7, 123e130.
Kieft, T.L., Amy, P.S., Brockman, F.J., Fredrickson, J.K., Bjornstad, B.N., Rosacker, L.L.,1993. Microbial abundance and activities in relation to water potential in thevadose zones of arid and semiarid sites. Microb. Ecol. 26, 59e78.
Martin, P., MacLeod, R.A., 1984. Observations on the distinction between oligotro-phic and eutrophic marine bacteria. Appl. Environ. Microbiol. 47, 1017e1022.
Meiklejohn, J., 1957. Numbers of bacteria and actinomycetes in a Kenya soil. J. SoilSci. 8, 240e247.
Miller, R.H., Keeny, D.R., 1982. Methods of Soil Analysis Part 2: Chemical andMicrobiological Properties. American Society of Agronomy and Soil ScienceSociety of America, Madison, WI.
Morita, R.Y., 1988. Bioavailability of energy and its relationship to growth andstarvation survival in nature. Can. J. Microbiol. 34, 436e441.
Nunan, N., Morgan, M.A., Herlihy, M., 1998. Ultraviolet absorbance (280 nm) ofcompounds released from soil during chloroform fumigation as an estimate ofthe microbial biomass. Soil Biol. Biochem. 30, 1599e1603.
Ohta, H., Hattori, T., 1983. Agromonas oligotrophica gen. nov., sp. nov., a nitrogen-fixing oligotrophic bacterium. Antonie Leeuwenhoek 49, 429e446.
Palmer, M.W., 1993. Putting things in even better order: the advantages of canonicalcorrespondence analysis. Ecology 74, 2215e2230.
Palumbo, A.V., McCarthy, J.F., Parker, A., Pfiffner, S., Colwell, F.S., Phelps, T.J., 1994.Potential for microbial growth in arid subsurface sediments. Appl. Biochem.Biotechnol. 45/46, 823e834.
Palumbo, A.V., Zhang, C., Liu, S., Scarborough, S.P., Pfiffner, S.M., Phelps, T.J., 1996.Influence of media on measurement of bacterial populations in the subsurface.Appl. Biochem. Biotechnol. 57/58, 905e914.
Poindexter, J.S., 1981. Oligotrophy: fast and famine existence. Adv. Microb. Ecol. 5,63e89.
Robertson, G.P., Sollins, P., Boyd, G.E., Lajitha, K., 1999. Exchangeable ions, pH, andcation exchange capacity. In: Robertson, G.P., Coleman, D.C., Bledsoe, C.S.,Sollins, P. (Eds.), Standard Soil Methods for Long-term Ecological Research.Oxford University Press, New York, NY, pp. 106e114.
Schelble, R.T., McDonald, G.D., Hall, J.A., Nealson, K.H., 2005. Community structurecomparison using FAME analysis of desert varnish and soil, Mojave Desert,California. Geomicrobiol. J. 22, 353e360.
Schlesinger, W.H., Raikes, J.A., Hartley, A.E., Cross, A.F., 1996. On the spatial patternof soil nutrients in desert ecosystems. Ecology 77, 364e374.
Schut, F., Prins, R.A., Gottschal, J.C., 1997. Oligotrophy and pelagic marine bacteria:facts and fiction. Aquat. Microb. Ecol. 12, 177e202.
Smith, R.L., Pelley, J.W., Jeter, R.M., 1991. Characterization of lip expression in Sal-monella typhimurium: analysis of lip::lac operon fusions. J. Gen. Microbiol. 137,2307e2312.
Sollins, P., Glassman, C., Paul, E.A., Swanston, C., Lajitha, K., Heil, J.W., Elliot, E.T.,1999. Soil carbon and nitrogen: pools and fractions. In: Robertson, G.P.,Coleman, D.C., Bledsoe, C.S., Sollins, P. (Eds.), Standard Soil Methods for Long-term Ecological Research. Oxford University Press, New York, NY, pp. 89e105.
Steinberger, Y., Zelles, L., Bai, Q.Y., 1999. Phospholipid fatty acid profiles as indicatorsfor the microbial community in soils along a climatic transect in the JudeanDesert. Biol. Fertil. Soils 28, 292e300.
Tada, Y., Ihmori, M., Yamaguchi, J., 1995. Oligotrophic bacteria isolated from clinicalmaterials. J. Clin. Microbiol. 33, 493e494.
van Gestel, N.C., Schwilk, D.W., Tissue, D.T., Zak, J.C., 2011. Reductions in daily soiltemperature variability increase soil microbial biomass C and decrease soil Navailability in the Chihuahuan Desert: potential implications for ecosystem Cand N fluxes. Global Change Biol. 17, 3564e3576.
Van Miegroet, H., 1995. Inorganic nitrogen determined by laboratory and field ex-tractions of two forest soils. Soil Sci. Soc. Am. J. 59, 549e553.
Vance, E.D., Brookes, P.C., Jenkinson, D.S., 1987. An extraction method for measuringsoil microbial biomass C. Soil Biol. Biochem. 19, 703e707.
Wardle, D.A., 1992. A comparative assessment of factors which influence microbialbiomass carbon and nitrogen levels in soil. Biol. Rev. 67, 321e358.
Watve, M., Shejval, V., Sonawane, C., Rahalkar, M., Matapurkar, A., Shouche, Y.,Patole, M., Phadnis, N., Champhenkar, A., Damle, K., Karandikar, S.,Kshirsagar, V., Jog, M., 2000. The “K” selected oligophilic bacteria: a key touncultured diversity? Curr. Sci. 78, 1535e1542.
Whang, K., Hattori, T., 1988. Oligotrophic bacteria from rendzina forest soil. AntonieLeeuwenhoek 54, 19e36.
Whitford, W.G., 2002. Ecology of Desert Systems. Academic Press, London.Whitman, W.B., Coleman, D.C., Wiebe, W.J., 1998. Prokaryotes: the unseen majority.
Proc. Natl. Acad. Sci. U. S. A. 95, 6578e6583.Yanagita, T., Ichikawa, T., Tsuji, T., Kamata, Y., Ito, K., Sasaki, M., 1978. Two trophic
groups of bacteria, oligotrophs and eutrophs: their distributions in fresh andsea water areas in the central northern Japan. J. Gen. Appl. Microbiol. 24, 59e88.
Zak, J., 2005. Fungal communities of desert ecosystems: links to climate change. In:Dighton, J., White, J.F., Oudemans, P. (Eds.), The Fungal Community: Its Orga-nization and Role in the Ecosystem, third ed. CRC Press, Boca Raton, FL,pp. 659e681.
J.H. Campbell et al. / Journal of Arid Environments 99 (2013) 41e5050
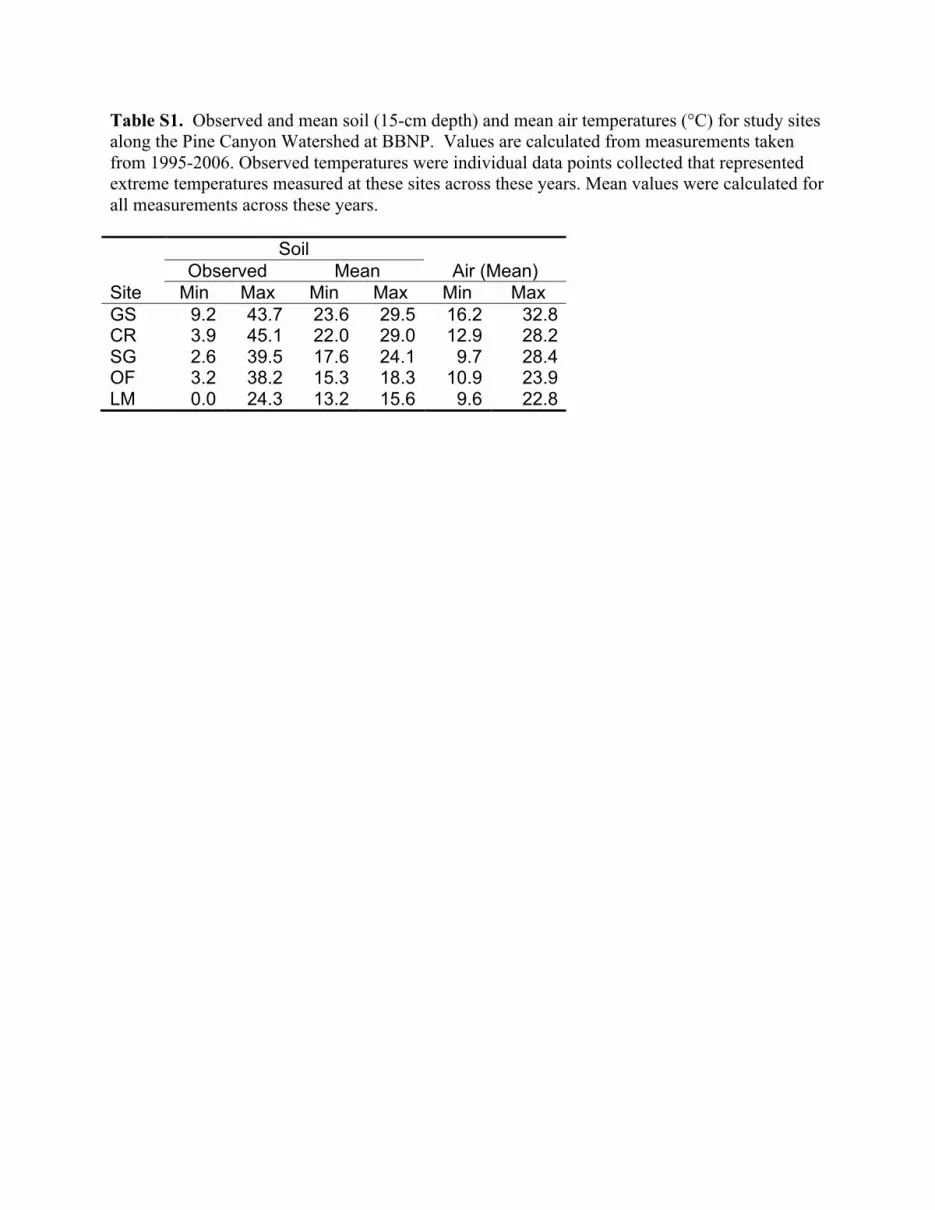
Table S1. Observed and mean soil (15-cm depth) and mean air temperatures (°C) for study sites along the Pine Canyon Watershed at BBNP. Values are calculated from measurements taken from 1995-2006. Observed temperatures were individual data points collected that represented extreme temperatures measured at these sites across these years. Mean values were calculated for all measurements across these years. Soil Observed Mean Air (Mean) Site Min Max Min Max Min Max GS 9.2 43.7 23.6 29.5 16.2 32.8 CR 3.9 45.1 22.0 29.0 12.9 28.2 SG 2.6 39.5 17.6 24.1 9.7 28.4 OF 3.2 38.2 15.3 18.3 10.9 23.9 LM 0.0 24.3 13.2 15.6 9.6 22.8