This article was downloaded by: [UZH Hauptbibliothek / Zentralbibliothek Zürich] On: 12 December 2013, At: 05:07 Publisher: Taylor & Francis Informa Ltd Registered in England and Wales Registered Number: 1072954 Registered office: Mortimer House, 37-41 Mortimer Street, London W1T 3JH, UK Plant Ecology & Diversity Publication details, including instructions for authors and subscription information: http://www.tandfonline.com/loi/tped20 Diversity patterns of ferns along elevational gradients in Andean tropical forests Laura Salazar a , Jürgen Homeier a , Michael Kessler b , Stefan Abrahamczyk bc , Marcus Lehnert de , Thorsten Krömer f & Jürgen Kluge g a Albrecht von Haller Institute of Plant Sciences, Georg August University of Göttingen, Göttingen, Germany b Institute of Systematic Botany, University of Zurich, Zurich, Switzerland c Institute of Systematic Botany and Mycology, Ludwig Maximillian University of Munich, Munich, Germany d State Museum for Natural History, Am Löwentor, Stuttgart, Germany e Nees Institute for Plant Biodiversity, Rheinische Friedrich-Wilhelm University of Bonn, Bonn, Germany f Centre for Tropical Studies, University of Veracruz, Interior de la Ex-hacienda Lucas Martín, Veracruz, Mexico g Faculty of Geography, Philipps University of Marburg, Marburg, Germany Published online: 11 Dec 2013. To cite this article: Laura Salazar, Jürgen Homeier, Michael Kessler, Stefan Abrahamczyk, Marcus Lehnert, Thorsten Krömer & Jürgen Kluge , Plant Ecology & Diversity (2013): Diversity patterns of ferns along elevational gradients in Andean tropical forests, Plant Ecology & Diversity, DOI: 10.1080/17550874.2013.843036 To link to this article: http://dx.doi.org/10.1080/17550874.2013.843036 PLEASE SCROLL DOWN FOR ARTICLE Taylor & Francis makes every effort to ensure the accuracy of all the information (the “Content”) contained in the publications on our platform. However, Taylor & Francis, our agents, and our licensors make no representations or warranties whatsoever as to the accuracy, completeness, or suitability for any purpose of the Content. Any opinions and views expressed in this publication are the opinions and views of the authors, and are not the views of or endorsed by Taylor & Francis. The accuracy of the Content should not be relied upon and should be independently verified with primary sources of information. Taylor and Francis shall not be liable for any losses, actions, claims, proceedings, demands, costs, expenses, damages, and other liabilities whatsoever or howsoever caused arising directly or indirectly in connection with, in relation to or arising out of the use of the Content. This article may be used for research, teaching, and private study purposes. Any substantial or systematic reproduction, redistribution, reselling, loan, sub-licensing, systematic supply, or distribution in any form to anyone is expressly forbidden. Terms & Conditions of access and use can be found at http:// www.tandfonline.com/page/terms-and-conditions
Transcript
This article was downloaded by: [UZH Hauptbibliothek / Zentralbibliothek Zürich]On: 12 December 2013, At: 05:07Publisher: Taylor & FrancisInforma Ltd Registered in England and Wales Registered Number: 1072954 Registered office: MortimerHouse, 37-41 Mortimer Street, London W1T 3JH, UK
Plant Ecology & DiversityPublication details, including instructions for authors and subscription information:http://www.tandfonline.com/loi/tped20
Diversity patterns of ferns along elevationalgradients in Andean tropical forestsLaura Salazara, Jürgen Homeiera, Michael Kesslerb, Stefan Abrahamczykbc, MarcusLehnertde, Thorsten Krömerf & Jürgen Klugeg
a Albrecht von Haller Institute of Plant Sciences, Georg August University of Göttingen,Göttingen, Germanyb Institute of Systematic Botany, University of Zurich, Zurich, Switzerlandc Institute of Systematic Botany and Mycology, Ludwig Maximillian University of Munich,Munich, Germanyd State Museum for Natural History, Am Löwentor, Stuttgart, Germanye Nees Institute for Plant Biodiversity, Rheinische Friedrich-Wilhelm University of Bonn,Bonn, Germanyf Centre for Tropical Studies, University of Veracruz, Interior de la Ex-hacienda LucasMartín, Veracruz, Mexicog Faculty of Geography, Philipps University of Marburg, Marburg, GermanyPublished online: 11 Dec 2013.
To cite this article: Laura Salazar, Jürgen Homeier, Michael Kessler, Stefan Abrahamczyk, Marcus Lehnert, ThorstenKrömer & Jürgen Kluge , Plant Ecology & Diversity (2013): Diversity patterns of ferns along elevational gradients in Andeantropical forests, Plant Ecology & Diversity, DOI: 10.1080/17550874.2013.843036
To link to this article: http://dx.doi.org/10.1080/17550874.2013.843036
PLEASE SCROLL DOWN FOR ARTICLE
Taylor & Francis makes every effort to ensure the accuracy of all the information (the “Content”) containedin the publications on our platform. However, Taylor & Francis, our agents, and our licensors make norepresentations or warranties whatsoever as to the accuracy, completeness, or suitability for any purpose ofthe Content. Any opinions and views expressed in this publication are the opinions and views of the authors,and are not the views of or endorsed by Taylor & Francis. The accuracy of the Content should not be reliedupon and should be independently verified with primary sources of information. Taylor and Francis shallnot be liable for any losses, actions, claims, proceedings, demands, costs, expenses, damages, and otherliabilities whatsoever or howsoever caused arising directly or indirectly in connection with, in relation to orarising out of the use of the Content.
This article may be used for research, teaching, and private study purposes. Any substantial or systematicreproduction, redistribution, reselling, loan, sub-licensing, systematic supply, or distribution in anyform to anyone is expressly forbidden. Terms & Conditions of access and use can be found at http://www.tandfonline.com/page/terms-and-conditions
Diversity patterns of ferns along elevational gradients in Andean tropical forests
Laura Salazara, Jürgen Homeiera, Michael Kesslerb, Stefan Abrahamczykb,c, Marcus Lehnertd,e, Thorsten Krömerf
and Jürgen Klugeg*aAlbrecht von Haller Institute of Plant Sciences, Georg August University of Göttingen, Göttingen, Germany; bInstitute of SystematicBotany, University of Zurich, Zurich, Switzerland; cInstitute of Systematic Botany and Mycology, Ludwig Maximillian University ofMunich, Munich, Germany; dState Museum for Natural History, Am Löwentor, Stuttgart, Germany; eNees Institute for Plant Biodiversity,Rheinische Friedrich-Wilhelm University of Bonn, Bonn, Germany; fCentre for Tropical Studies, University of Veracruz, Interior de la Ex-hacienda Lucas Martín, Veracruz, Mexico; gFaculty of Geography, Philipps University of Marburg, Marburg, Germany
(Received 31 January 2013; accepted 6 September 2013)
Background: Biodiversity is perceived to decline from lowlands towards mountain peaks and away from the Equatortowards the Poles, but supporting data for most groups of organisms are lacking, especially at the local scale.Aims: Elevational gradients of fern species richness in tropical forest habitats were analysed to test the hypotheses that fernspecies composition patterns were similar between elevational gradients, that total species richness of complete elevationalgradients gradually declined due to changing climatic conditions with increasing distance from the Equator, and that theelevation of highest species richness gradually declined with increasing latitude.Methods: We used plot-based elevational fern species richness surveys compiled from recent field work and own publishedstudies, between 18° N and 18° S along the Andean mountain range, and compared the transects of patterns of speciesrichness and composition, and distribution of taxa.Results: Taxonomic composition was highly similar among tropical regions. Elevational richness patterns were symme-trically hump-shaped and overall richness was virtually equal along most of the tropical latitudinal gradient. In contrast, thesubtropical localities at the edges of our study area, ca. 18° N and 18° S, showed strikingly different patterns from those inthe tropical zone.Conclusions: Within the tropics, there appears to be no latitudinal diversity gradient of ferns at the local scale. We suggestthat, in tropical habitats, species richness of ferns at the local scale is limited by the number of species that can co-occur andthat the available niche space is saturated.
The latitudinal gradient of increasing species richness acrossmost taxa from the Arctic regions towards the tropics is, ona coarse scale, one of the best documented patterns inecology, but the causes determining these patterns are stillbeing discussed (Rohde 1992; Rosenzweig 1995; Gastonand Blackburn 2000; Hillebrand 2004; Ricklefs 2007). Inaddition, patterns of species richness along elevational gra-dients have also recently received considerable attention(e.g., Sanders et al. 2003; Bhattarai et al. 2004; Klugeet al. 2006; Kessler et al. 2011) because they form a naturalexperimental setting along which environmental conditions(e.g., dry to wet, warm to cold) change steeply withinrelatively short horizontal distances (few tens of km).Relative to the latitudinal gradients from the Equator tothe North and South Poles, elevational gradients have theadvantage that they are not strongly influenced by dispersallimitation (due to shorter distances) and that they can bereplicated (Lomolino 2001).
While the diversity of trees in neotropical forests(Gentry 1988, 1995) is outstanding, most plant species inneotropical forests belong to herbaceous (both terrestrial
and epiphytic) life forms (Gentry and Dodson 1987; Ibisch1996; Balslev et al. 1998). While trees have been the focusof tropical forest research, they are known to presentmethodological sampling problems due to their largesize, often low population densities and difficulties inidentifying species, and are unsuitable for answering allthe questions in tropical ecology (e.g., Jones et al. 2008).As a result, numerous researchers have focused on otherlife forms to study diversity patterns, ecology and biogeo-graphy in tropical forests (e.g., Poulsen and Pendry 1995;Tuomisto et al. 1995; Kluge et al. 2008; Kessler et al.2011; Willinghöfer et al. 2012).
Ferns and lycophytes (henceforth called ferns for sim-plicity) are globally distributed, with a total of ca. 11,000species (Smith et al. 2006), and are most diverse in tropi-cal montane forests (Moran 2004; Kreft et al. 2010;Kessler et al. 2011). In humid tropical forests, ferns areamong the most abundant and diverse plant groups, mak-ing up 6.5–25% of the vascular plant flora at local scales(0.01–1 ha) (Whitmore et al. 1985; Ibisch 1996; Balslevet al. 1998; Linares-Palomino et al. 2009). Numerousstudies have shown that fern species richness commonly
displays a hump-shaped richness pattern with a peak atmid-elevations (Kessler 2000, 2001a, 2001b; Hemp 2001,2002; Bhattarai et al. 2004; Krömer et al. 2005; Klugeet al. 2006, 2008). A global analysis recently showed thatthis was especially true for extensive tropical elevationalgradients, i.e., those ranging from the lowlands up to thetimberline (Kessler et al. 2011).
However, little is known about the diversity of ferns atregional scales within the tropics. Thus, it is unknown iffern species richness peaks around the Equator or if itremains relatively constant within the tropical realm. Inthe neotropics, for example, previous studies have shownthat fern species richness at the local scale was similaralong elevational gradients in Costa Rica (10° N) andBolivia (18° S) (Kessler 2001c; Kluge et al. 2006), butquantitative comparisons from mountains close to theEquator are lacking. The only available data on a nationalscale have shown that Ecuador harbours about 1400 fernspecies, although it is the smallest of the Andean countries(Jørgensen and León-Yánez 1999; Ulloa Ulloa and Neill2005; Neill and Ulloa Ulloa 2011). This is admittedly notan unambiguous measure for regional richness values, buta comparison with other Andean countries shows that thisoverall richness is exceptionally high (Peru, 1200 species;Smith et al. 2005; Bolivia, 1163 species; Soria-Auza andKessler 2007). As a result, one might expect that local ferndiversity should peak in Ecuador.
For Ecuador, the highest concentration of fern speciesis assumed to be in cloud forests between 1500 m and3000 m (Navarrete 2001). However, the few detailedstudies in Ecuador concerning study localities inOyacachi (ca. 3200 m), Quijos (ca. 1700 m) and AltoAguarico (ca. 300 m) (Øllgaard and Navarrete 2000)used a transect method which cannot be compared withother quantitative studies of fern diversity. Furthermore,data from the transect at Pichincha (Kessler et al. 2011) areonly published in fragments. Another detailed study inPodocarpus National Park (Kessler et al. 2009a, 2009b;Mandl et al. 2010), where species richness declines moreor less linearly with elevation between 1000 m and3000 m, is not comparable with other regions due to theunique geology and ecology of that area.
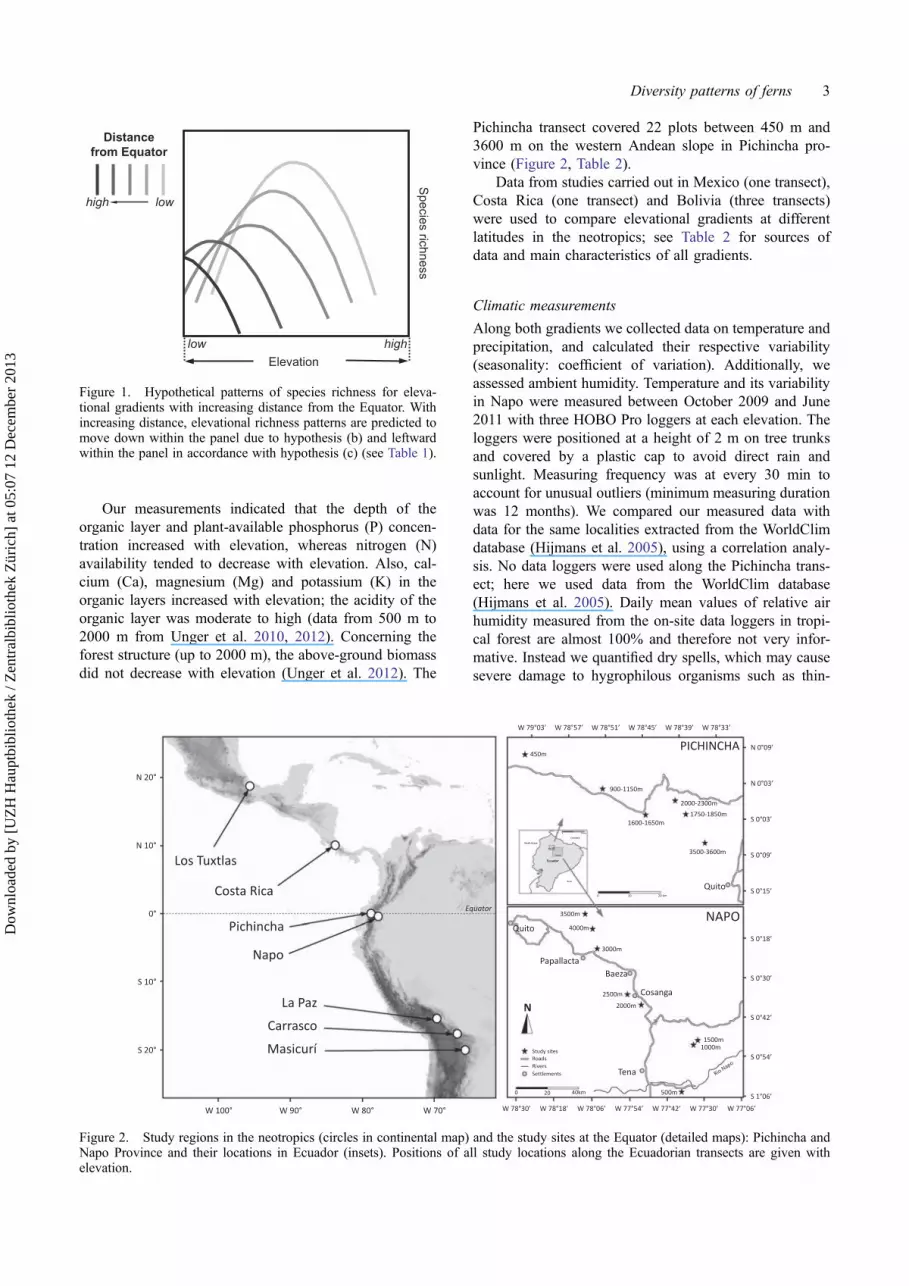
In the present study, we established the first plot-basedfern transects at the Equator in the Napo province on theeastern (Amazonian) slope of the Andes and at Pichinchaon the western (Pacific) slope. The Napo transect presentsentirely new data, whereas the Pichincha transect wasalready included in part in a comparative analysis byKessler et al. (2011), but is reported here for the firsttime in its entirety. In this study, we first evaluated theelevational patterns of species richness of terrestrial andepiphytic fern species along both elevational gradients andrelated these patterns to climatic variables (temperature,relative humidity and rainfall) to assess their relativeimportance in relation to fern richness patterns. Second,we examined our results within the context of comparabledata from other neotropical elevational gradients betweenMexico and Bolivia.
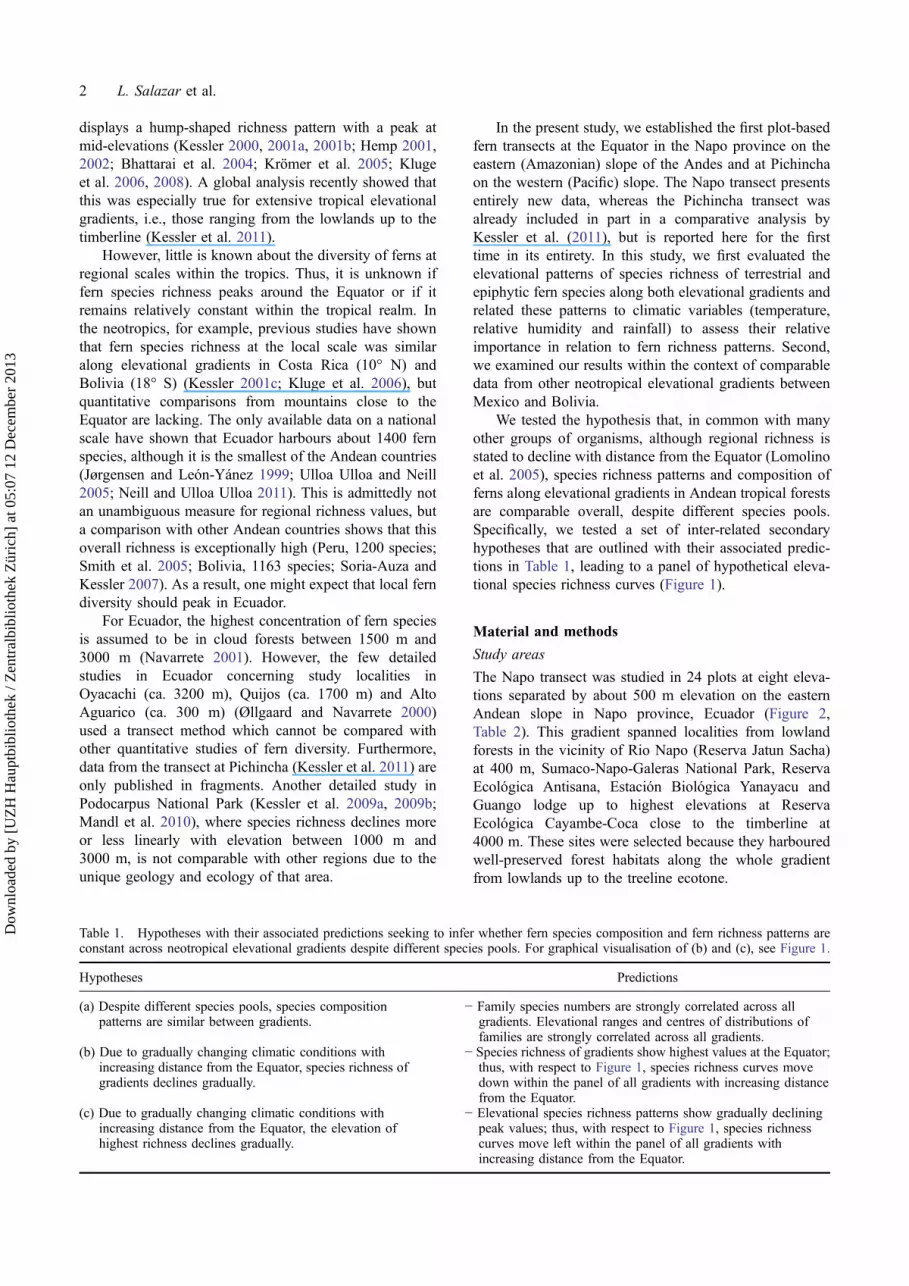
We tested the hypothesis that, in common with manyother groups of organisms, although regional richness isstated to decline with distance from the Equator (Lomolinoet al. 2005), species richness patterns and composition offerns along elevational gradients in Andean tropical forestsare comparable overall, despite different species pools.Specifically, we tested a set of inter-related secondaryhypotheses that are outlined with their associated predic-tions in Table 1, leading to a panel of hypothetical eleva-tional species richness curves (Figure 1).
Material and methods
Study areas
The Napo transect was studied in 24 plots at eight eleva-tions separated by about 500 m elevation on the easternAndean slope in Napo province, Ecuador (Figure 2,Table 2). This gradient spanned localities from lowlandforests in the vicinity of Rio Napo (Reserva Jatun Sacha)at 400 m, Sumaco-Napo-Galeras National Park, ReservaEcológica Antisana, Estación Biológica Yanayacu andGuango lodge up to highest elevations at ReservaEcológica Cayambe-Coca close to the timberline at4000 m. These sites were selected because they harbouredwell-preserved forest habitats along the whole gradientfrom lowlands up to the treeline ecotone.
Table 1. Hypotheses with their associated predictions seeking to infer whether fern species composition and fern richness patterns areconstant across neotropical elevational gradients despite different species pools. For graphical visualisation of (b) and (c), see Figure 1.
Hypotheses Predictions
(a) Despite different species pools, species compositionpatterns are similar between gradients.
− Family species numbers are strongly correlated across allgradients. Elevational ranges and centres of distributions offamilies are strongly correlated across all gradients.
(b) Due to gradually changing climatic conditions withincreasing distance from the Equator, species richness ofgradients declines gradually.
− Species richness of gradients show highest values at the Equator;thus, with respect to Figure 1, species richness curves movedown within the panel of all gradients with increasing distancefrom the Equator.
(c) Due to gradually changing climatic conditions withincreasing distance from the Equator, the elevation ofhighest richness declines gradually.
− Elevational species richness patterns show gradually decliningpeak values; thus, with respect to Figure 1, species richnesscurves move left within the panel of all gradients withincreasing distance from the Equator.
Our measurements indicated that the depth of theorganic layer and plant-available phosphorus (P) concen-tration increased with elevation, whereas nitrogen (N)availability tended to decrease with elevation. Also, cal-cium (Ca), magnesium (Mg) and potassium (K) in theorganic layers increased with elevation; the acidity of theorganic layer was moderate to high (data from 500 m to2000 m from Unger et al. 2010, 2012). Concerning theforest structure (up to 2000 m), the above-ground biomassdid not decrease with elevation (Unger et al. 2012). The
Pichincha transect covered 22 plots between 450 m and3600 m on the western Andean slope in Pichincha pro-vince (Figure 2, Table 2).
Data from studies carried out in Mexico (one transect),Costa Rica (one transect) and Bolivia (three transects)were used to compare elevational gradients at differentlatitudes in the neotropics; see Table 2 for sources ofdata and main characteristics of all gradients.
Climatic measurements
Along both gradients we collected data on temperature andprecipitation, and calculated their respective variability(seasonality: coefficient of variation). Additionally, weassessed ambient humidity. Temperature and its variabilityin Napo were measured between October 2009 and June2011 with three HOBO Pro loggers at each elevation. Theloggers were positioned at a height of 2 m on tree trunksand covered by a plastic cap to avoid direct rain andsunlight. Measuring frequency was at every 30 min toaccount for unusual outliers (minimum measuring durationwas 12 months). We compared our measured data withdata for the same localities extracted from the WorldClimdatabase (Hijmans et al. 2005), using a correlation analy-sis. No data loggers were used along the Pichincha trans-ect; here we used data from the WorldClim database(Hijmans et al. 2005). Daily mean values of relative airhumidity measured from the on-site data loggers in tropi-cal forest are almost 100% and therefore not very infor-mative. Instead we quantified dry spells, which may causesevere damage to hygrophilous organisms such as thin-
0°
N 10°
N 20°
S 10°
S 20°
W 100° W 90° W 70°W 80°
N 0°03’
N 0°09’
S 0°03’
S 0°15’
S 0°18’
S 0°30’
S 0°42’
S 1°06’
W 78°30’
S 0°54’
W 78°18’ W 78°06’ W 77°54’ W 77°42’ W 77°06’W 77°30’
W 79°03’ W 78°57’ W 78°51’ W 78°45’ W 78°33’W 78°39’
S 0°09’
Figure 2. Study regions in the neotropics (circles in continental map) and the study sites at the Equator (detailed maps): Pichincha andNapo Province and their locations in Ecuador (insets). Positions of all study locations along the Ecuadorian transects are given withelevation.
Elevation
Distancefrom Equator
low
high
Species richness
low
high
Figure 1. Hypothetical patterns of species richness for eleva-tional gradients with increasing distance from the Equator. Withincreasing distance, elevational richness patterns are predicted tomove down within the panel due to hypothesis (b) and leftwardwithin the panel in accordance with hypothesis (c) (see Table 1).
structured filmy ferns (Hymenophyllaceae). We expressedthe relative frequency of values below 60, 70 and 80%relative humidity as a Humidity Index (HI). For Pichinchano such data were available and so, as in previous compar-able studies (e.g., Kluge et al. 2006), we used the esti-mated cover of bryophytes on trunks and branches in eachplot as a proxy for humidity (Karger et al. 2012).Precipitation values along both gradients were compiledfrom the WorldClim database (Hijmans et al. 2005). Thisdatabase provides interpolated climate surfaces at a spatialresolution of 1 km2 from a time range from at least 50years, although use of such interpolated data has beencriticised because they may not reflect true conditions(e.g. Killeen et al. 2007). Long-term on-site measurementsare clearly ideal, but these type of data were not availablefor our study region. We are, however, fairly confidentabout their accuracy because, in the context of a previousstudy in Costa Rica, we were able to directly comparelong-term data from meteorological stations withWorldClim data (see Figure 3 in Krömer et al. 2013).Although differing slightly in the total amount of precipi-tation, the elevational trend in that study was almost iden-tical for on-site and WorldClim data.
Vegetation sampling
Along the Napo transect, fern diversity was sampled inthree permanent plots of 400 m2 at each elevation, resultingin a total of 24 plots, whereas along the Pichincha transect,we inventoried 22 plots of identical size at irregular inter-vals between 450 m and 3600 m. A plot size of 400 m2 haspreviously been used for surveys of local fern diversity(e.g., Kessler 2001b; Kluge et al. 2006), not only becauseit is large enough to be representative, but also because it issmall enough to be ecologically homogeneous and to allowrapid and efficient surveys (Kessler and Bach 1999). Allplots were placed in representative stands of forest, avoid-ing special geomorphological features such as deep valleys
and exposed ridges, as well as canopy gaps. We collectedspecies separately for terrestrial and epiphytic ferns. Canopyand high trunk epiphytes were recorded using binocularsand collecting poles, and by searching recently fallen treesand branches within the plot or adjacent locations(Gradstein et al. 2003). For every species we counted thenumber of individuals. All species were collected for iden-tification at the herbarium of the Pontificia UniversidadCatólica del Ecuador (QCA) and by specialists for difficultgroups. Family delimitation followed Smith et al. (2006).
Data analyses
To assess the relationship between climatic variables andthe distribution of species richness, we used multiple lin-ear regression models. The best model was chosen byinspection of the Akaike Information Criterion (AIC).Since the number of observations in our study (‘plots’) islow with respect to the number of parameters (‘variables’),we chose the bias-corrected form AICc (Burnham andAnderson 2002):
AICc ¼ AIC þ ð2kð<I>k<=I>þ 1ÞÞ=ð<I>n<=I>� k � 1Þ
where n is the number of observations and k is the numberof parameters in the model. With increasing n, AICcasymptotically converges to AIC.
The model with the lowest AICc value may be assignedthe ‘best model’. However, differences in the AICc values(Δi) between nested models are often small and the exclusiveacceptance of a single model may lead to wrong conclusionsabout the performance of the parameters (Wagenmakersand Farrell 2004). Models with Δi < 2 have substantialsupport and models with Δi > 4 should definitely beexcluded (Burnham and Anderson 2002). Based on Δi,the Akaike weight wi quantifies the plausibility that agiven model i is actually better than the next model withinthe set of all models. With these weights we assessed the
Table 2. Location and data source of the seven elevational gradients along the latitudinal gradient in the New World included in thisstudy. TK, Thorsten Krömer; JK, Jürgen Kluge; LS, Laura Salazar; SA, Stefan Abrahamczyk; MK, Michael Kessler.
Locality AbbreviationElevation sampling
range (m) CoordinatesData source and date of
collection
Mexico, Los Tuxtlas, Veracruz TUXT 140–1675 95°12’–95°04’ W18°32’–18°35’ N
TK 2005–2006(unpublished)
Costa Rica, Braulio Carrillo National Parkand Cerro de la Muerte
CR 100–3400 83°41’–67°55’ W9°33’–10°24’ N
JK 2001–2002; Kluge &Kessler (2005)
Northeast Ecuador, Jatun Sacha toOyacachi, Napo
NAPO 500–4000 78°05’–77°36’ W0°14’–1°04’ S
LS, SA 2011 (this study)
Northwest Ecuador, Felipe Carrillo Puertoto Volcán Pichincha, Pichincha
PICH 450–3600 78°35’–79°05’ W0°07’ N–0°08’ S
LS, SA 2011 (this study)
Northern Bolivia, Pilón Lajas to Cotapata,La Paz
LAPAZ 350–3500 67°07’–67°54’ W15°05’–16°18’ S
MK et al., Jun–Nov 1997(unpublished)
Central Bolivia, Carrasco National Park,Cochabamba
CARR 200–3750 83°44’–83°41’ W16°11’–16°17’ S
MK et al. 1996–1997;Kessler (2001c)
Central Bolivia, Masicurí Valley, Santa Cruz MASI 500–2450 63°42’–63°54’ W18°40’–19°03’ S
relative importance of all variables across all models bysumming the weights of all competing models includingthe respective variables (Burnham and Anderson 2002);the sums for the variables were then compared. We reportthe best models for all species and separately for life forms,as well as the sums of wi of all parameters within signifi-cant models with Δi < 4 (‘model averaging’; see Burnhamand Anderson 2002). For all models, we report on thestandardised coefficients and their P value for all variableswhich entered the respective model, because they areinformative about the influence of each variable withinthe model, as well on adjusted R2, P, AICc, ΔAICc andmodel weight wi.
Multimodel inference and model averaging were car-ried out with package MuMIn (Barton 2010) within thestatistical platform R (R Development Core Team 2011).
Since, for example, Costa Rica and Bolivia share lessthan 40% of their fern species (Kluge and Kessler 2005),we tested whether gradients were similar with respect to
their family and genus composition despite real differentspecies pools. We compared the gradients if they differed inspecies richness within the same fern families and if differ-ent families occupied different ranges along the elevationgradient, expressed by their centres of distribution (= eleva-tion of highest richness), and if these patterns were similaracross families. To assess these floristic and compositionalsimilarities between all pairs of elevational transects alongthe latitudinal gradient on the basis of family richness anddistribution, we compared(i) the numbers of species in eachfamily in every pair of transects by applying Pearson’s R(i.e., R is high when the same fern families are species-richor species-poor respectively in both compared transects) and(ii) the elevations of maximum species richness likewise(i.e., R is high when the same fern families show similarelevations of maximum species richness). The elevation ofmaximum species richness for a particular family wasassessed by locally weighted scatterplot smoothing (loessmodels). A loess model fits a non-parametric curve to a
(a)
(b)
(c)
0
5
10
15
20
25
30T
empe
ratu
re (
°C)
Tem
pera
ture
(°C
)
500m 1000m 1500m 2000m 2500m 3500m 4000m
30
40
50
60
70
80
90
100
Rel
. air
hum
. (%
)
500m
Time
1000m 1500m 2000m 2500m 3500m 4000m
(d) (e)
0 1000 2000 3000 4000
0
5
10
15
20
25
30
Elevation (m)
0 1000 2000 3000 4000
60
70
80
90
100
Elevation (m)
0 1000 2000 3000 4000
Elevation (m)
Hum
idity
Inde
x
0
1000
2000
3000
4000
5000
Pre
cipi
tatio
n (m
m)
Figure 3. Environmental variables along the Napo and Pichincha elevational gradients. Course of (a) temperature and (b) relative airhumidity from selected data loggers at each elevational step, based on values from 30-min intervals. (c) Elevational lapse of mean annualtemperature, lapse rate is 5.6°K km−1 (circles and continuous line, Napo; triangles and dashed line, Pichincha); trend lines fitted by linearmodels with both R2 > 0.98, P < 0.001. (d) Humidity Index based on values for relative air humidity (%) shown in (b); for further detailsof calculation see text; since there are only five data points, polynomial trendline indicated R2 = 0.54, but not significantly. (e) Meanannual precipitation (mm) along the elevational gradient for each plot obtained from the WorldClim data bank (Hijmans et al. 2005). For(c) and (e) circles and continuous line, Napo; triangles and dashed line, Pichincha; polynomial trendlines with both R2 > 0.92, P < 0.001.
point cloud to demonstrate their main characteristics; forexample, in our case, the maximum. The elevation, wherethe loess curve of a particular family richness peaks wastaken as its centre of distribution.
Results
Climate variables
Along the Napo transect, temperature declined with eleva-tion, at a lapse rate of 5.6°K km−1 (Figures 3a and 3c),fitting well to the WorldClim data (R = 0.98, P < 0.001).The variability of temperature showed a unimodal patternwith elevation: it was lowest at medium elevations andincreased towards the upper and lower ends of the gradient(Figure 3c). Likewise, relative air humidity showed thestrongest influence of dry spells towards both ends of thegradient (Figure 3b). Accordingly, our Humidity Indexshowed a unimodal relation with elevation (Figure 3d).Highest rainfall values occurred between 1000 m and2000 m, just below the condensation layer (Figure 3e).
Along the Pichincha transect, temperature showed vir-tually the same pattern as on the Napo transect (Figure 3c),whereas rainfall values were considerably lower andlacked a pronounced hump at low elevation comparedwith the Napo gradient (Figure 3e).
Species richness
Along the Napo transect, we found a total of 91 terrestrialfern species in 34 genera and 20 families (see full speciesdata table in the Supplementary online material). The mostabundant species were Diplazium costale (Sw.) C. Presl,Cyclodium trianae (Mett.) A.R. Sm. and Maxonia apiifo-lia (Sw.) C. Chr. For terrestrial taxa, the families withhighest numbers of species were Dryopteridaceae with16, Cyatheaceae with 13 and Woodsiaceae with eightspecies. The largest fern genus was Cyathea with 11species, followed by Thelypteris and Diplazium with
eight species each. Dryopteridaceae and Thelypteridaceaewere found along the entire elevational gradient from500 m to 4000 m, while most of the other families showedelevational preferences. This was especially the case forLindsaeaceae, Metaxyaceae, Ophioglossaceae andSchizaeaceae. Among the epiphytic species, we foundabout 259 species distributed in 49 genera and 21 familiesbased on preliminary identifications and sorting to mor-phospecies. The most species-rich families werePolypodiaceae (90 spp., mainly from the former familyGrammitidaceae) and Dryopteridaceae (77 spp., mainlyElaphoglossum with 68 spp.).
Along the Pichincha transect, we recorded 164 terres-trial species distributed in 44 genera and 24 families,whereas we found 155 epiphytic species in 30 generaand 9 families (see full species data table in theSupplementary online material). The most species-richfamilies were Dryopteridaceae (39 spp.) and Cyatheaceae(19 spp.) among the terrestrials, and Polypodiaceae andDryopteridaceae among the epiphytes. The most species-rich genera were Elaphoglossum and Cyathea forterrestrials and Elaphoglossum and Asplenium forepiphytes.
Along the Napo transect, species richness of all, ter-restrial and epiphytic species showed clear hump-shapedpatterns with elevation (Figure 4a), with peaks at about2000 m, where a total of up to 70 species per plot werefound for all species combined. Along the Pichincha trans-ect all species and the epiphytes showed very similarpatterns to the Napo transect, whereas the terrestrial fernsshowed more variable numbers with a less pronouncedpeak at about 1000 m (Figure 4b).
Species richness and climate variables
Relating the patterns of species richness of both the Napo(Table 3a) and the Pichincha transect (Table 3b) to climatevariables, we found that all climatic variables were important
0 1000 2000 3000 4000
0
20
40
60
80
(a) NAPO
Elevation (m)
Spe
cies
ric
hnes
s
0 1000 2000 3000 4000
R² = 0.71***R² = 0.44**R² = 0.80***
(b) PICHINCHA
Elevation (m)
Figure 4. Species richness along the study elevational gradient in Napo province, Ecuador (a). Species richness along the elevationalgradients in Pichincha province, Ecuador (b), based on data from Kessler et al. (2011). Different symbols and trend lines (quadraticmodels) as well as R2 values of model fit are given for all species and major life forms (terrestrials and epiphytes).
but to variable extents. The explained variances (R2) of thebest models for all species ranged between 66% for Napoand 83% for Pichincha (P < 0.001). Across all models, thevariability of temperature and precipitation had better infor-mation value along both gradients than the respective rawvalues (variable importance due to model averaging equal orclose to 1); in Napo humidity considerably added explana-tory power to the models. With respect to life form, in Napothe terrestrials and in Pichincha the epiphytes showed clearerpatterns than the respective other life forms.
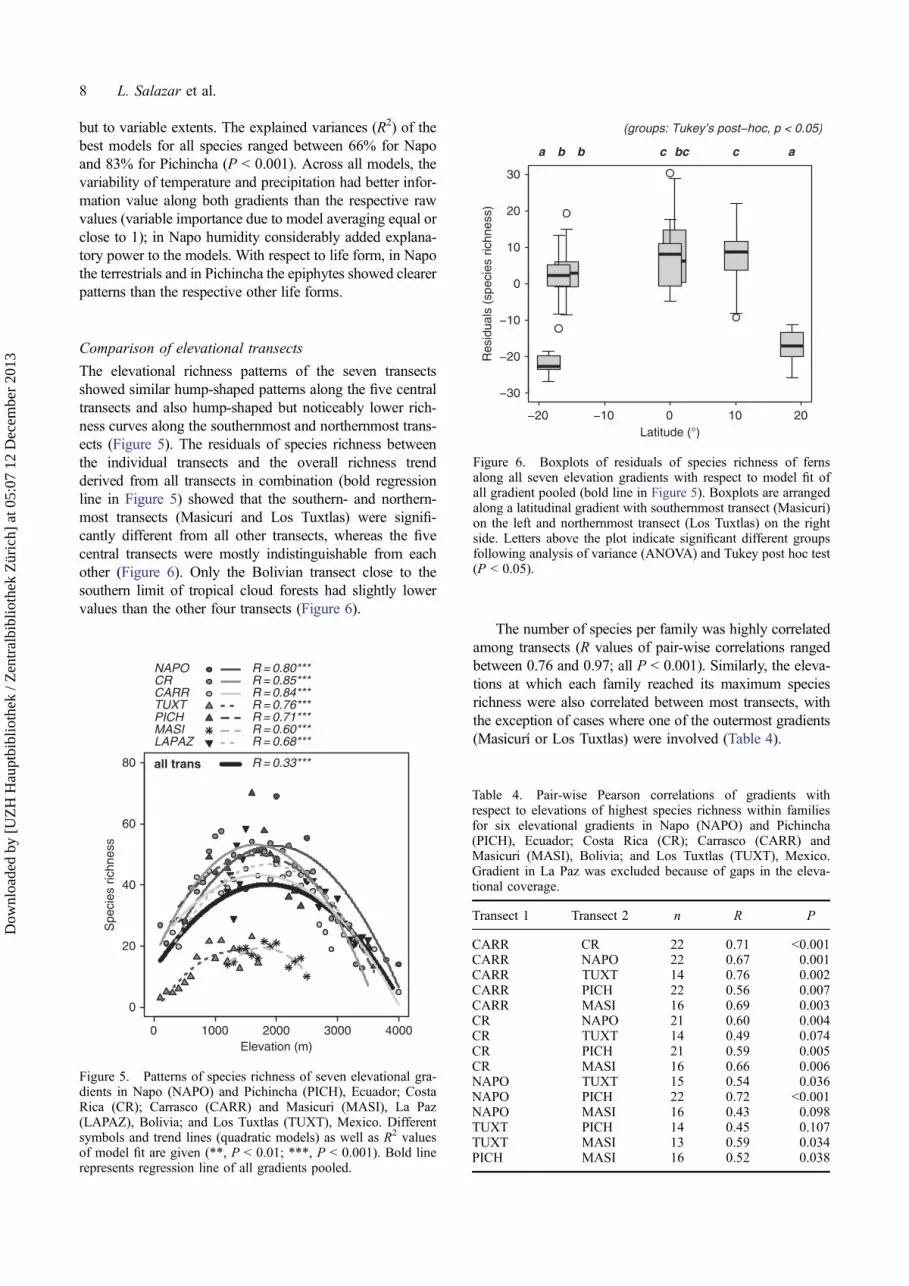
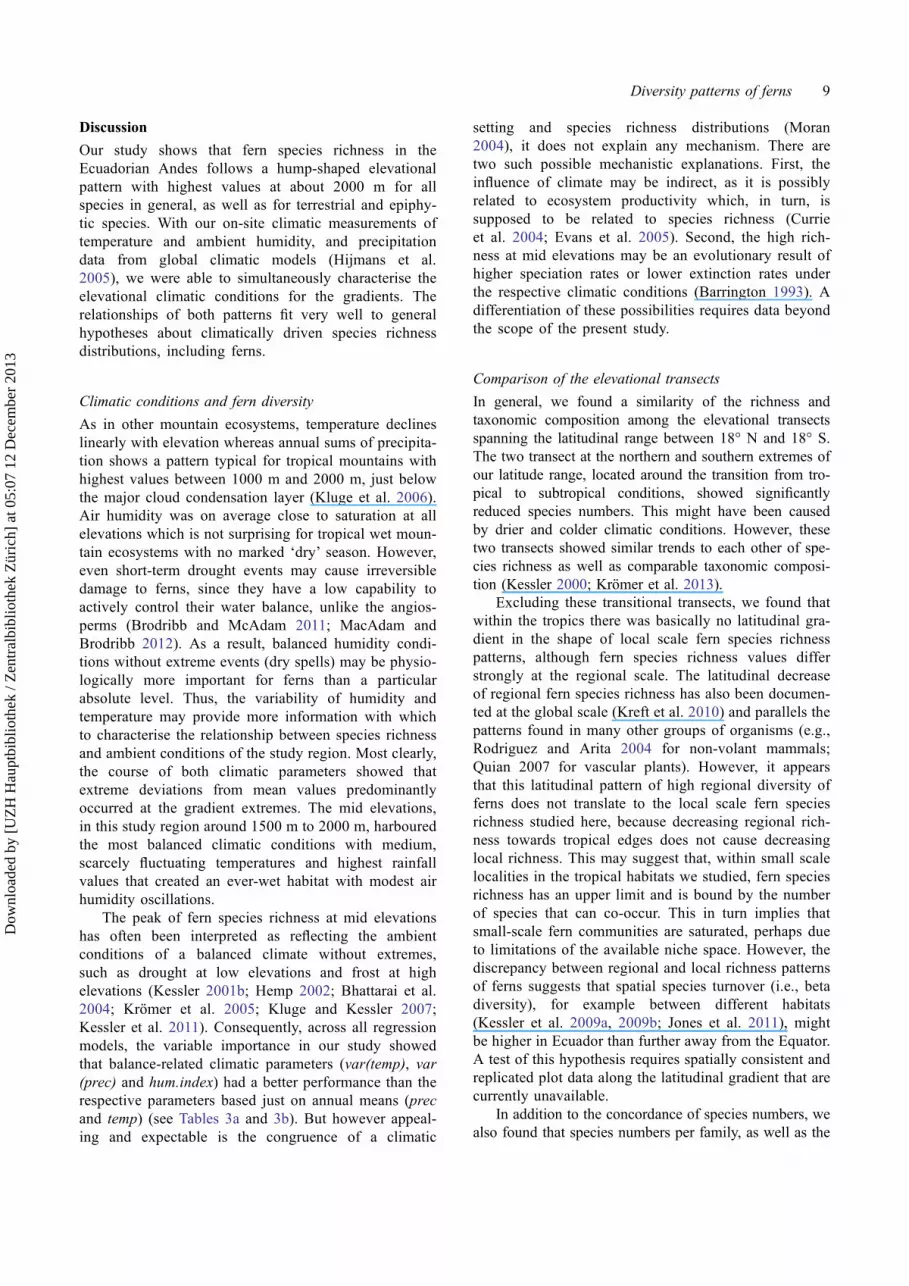
Comparison of elevational transects
The elevational richness patterns of the seven transectsshowed similar hump-shaped patterns along the five centraltransects and also hump-shaped but noticeably lower rich-ness curves along the southernmost and northernmost trans-ects (Figure 5). The residuals of species richness betweenthe individual transects and the overall richness trendderived from all transects in combination (bold regressionline in Figure 5) showed that the southern- and northern-most transects (Masicurí and Los Tuxtlas) were signifi-cantly different from all other transects, whereas the fivecentral transects were mostly indistinguishable from eachother (Figure 6). Only the Bolivian transect close to thesouthern limit of tropical cloud forests had slightly lowervalues than the other four transects (Figure 6).
The number of species per family was highly correlatedamong transects (R values of pair-wise correlations rangedbetween 0.76 and 0.97; all P < 0.001). Similarly, the eleva-tions at which each family reached its maximum speciesrichness were also correlated between most transects, withthe exception of cases where one of the outermost gradients(Masicurí or Los Tuxtlas) were involved (Table 4).
Figure 5. Patterns of species richness of seven elevational gra-dients in Napo (NAPO) and Pichincha (PICH), Ecuador; CostaRica (CR); Carrasco (CARR) and Masicuri (MASI), La Paz(LAPAZ), Bolivia; and Los Tuxtlas (TUXT), Mexico. Differentsymbols and trend lines (quadratic models) as well as R2 valuesof model fit are given (**, P < 0.01; ***, P < 0.001). Bold linerepresents regression line of all gradients pooled.
−20 −10 0 10 20
−30
−20
−10
0
10
20
30
a b b c bc c a
Res
idua
ls (
spec
ies
richn
ess)
Latitude (°)
(groups: Tukey’s post−hoc, p < 0.05)
Figure 6. Boxplots of residuals of species richness of fernsalong all seven elevation gradients with respect to model fit ofall gradient pooled (bold line in Figure 5). Boxplots are arrangedalong a latitudinal gradient with southernmost transect (Masicurí)on the left and northernmost transect (Los Tuxtlas) on the rightside. Letters above the plot indicate significant different groupsfollowing analysis of variance (ANOVA) and Tukey post hoc test(P < 0.05).
Table 4. Pair-wise Pearson correlations of gradients withrespect to elevations of highest species richness within familiesfor six elevational gradients in Napo (NAPO) and Pichincha(PICH), Ecuador; Costa Rica (CR); Carrasco (CARR) andMasicuri (MASI), Bolivia; and Los Tuxtlas (TUXT), Mexico.Gradient in La Paz was excluded because of gaps in the eleva-tional coverage.
Our study shows that fern species richness in theEcuadorian Andes follows a hump-shaped elevationalpattern with highest values at about 2000 m for allspecies in general, as well as for terrestrial and epiphy-tic species. With our on-site climatic measurements oftemperature and ambient humidity, and precipitationdata from global climatic models (Hijmans et al.2005), we were able to simultaneously characterise theelevational climatic conditions for the gradients. Therelationships of both patterns fit very well to generalhypotheses about climatically driven species richnessdistributions, including ferns.
Climatic conditions and fern diversity
As in other mountain ecosystems, temperature declineslinearly with elevation whereas annual sums of precipita-tion shows a pattern typical for tropical mountains withhighest values between 1000 m and 2000 m, just belowthe major cloud condensation layer (Kluge et al. 2006).Air humidity was on average close to saturation at allelevations which is not surprising for tropical wet moun-tain ecosystems with no marked ‘dry’ season. However,even short-term drought events may cause irreversibledamage to ferns, since they have a low capability toactively control their water balance, unlike the angios-perms (Brodribb and McAdam 2011; MacAdam andBrodribb 2012). As a result, balanced humidity condi-tions without extreme events (dry spells) may be physio-logically more important for ferns than a particularabsolute level. Thus, the variability of humidity andtemperature may provide more information with whichto characterise the relationship between species richnessand ambient conditions of the study region. Most clearly,the course of both climatic parameters showed thatextreme deviations from mean values predominantlyoccurred at the gradient extremes. The mid elevations,in this study region around 1500 m to 2000 m, harbouredthe most balanced climatic conditions with medium,scarcely fluctuating temperatures and highest rainfallvalues that created an ever-wet habitat with modest airhumidity oscillations.
The peak of fern species richness at mid elevationshas often been interpreted as reflecting the ambientconditions of a balanced climate without extremes,such as drought at low elevations and frost at highelevations (Kessler 2001b; Hemp 2002; Bhattarai et al.2004; Krömer et al. 2005; Kluge and Kessler 2007;Kessler et al. 2011). Consequently, across all regressionmodels, the variable importance in our study showedthat balance-related climatic parameters (var(temp), var(prec) and hum.index) had a better performance than therespective parameters based just on annual means (precand temp) (see Tables 3a and 3b). But however appeal-ing and expectable is the congruence of a climatic
setting and species richness distributions (Moran2004), it does not explain any mechanism. There aretwo such possible mechanistic explanations. First, theinfluence of climate may be indirect, as it is possiblyrelated to ecosystem productivity which, in turn, issupposed to be related to species richness (Currieet al. 2004; Evans et al. 2005). Second, the high rich-ness at mid elevations may be an evolutionary result ofhigher speciation rates or lower extinction rates underthe respective climatic conditions (Barrington 1993). Adifferentiation of these possibilities requires data beyondthe scope of the present study.
Comparison of the elevational transects
In general, we found a similarity of the richness andtaxonomic composition among the elevational transectsspanning the latitudinal range between 18° N and 18° S.The two transect at the northern and southern extremes ofour latitude range, located around the transition from tro-pical to subtropical conditions, showed significantlyreduced species numbers. This might have been causedby drier and colder climatic conditions. However, thesetwo transects showed similar trends to each other of spe-cies richness as well as comparable taxonomic composi-tion (Kessler 2000; Krömer et al. 2013).
Excluding these transitional transects, we found thatwithin the tropics there was basically no latitudinal gra-dient in the shape of local scale fern species richnesspatterns, although fern species richness values differstrongly at the regional scale. The latitudinal decreaseof regional fern species richness has also been documen-ted at the global scale (Kreft et al. 2010) and parallels thepatterns found in many other groups of organisms (e.g.,Rodriguez and Arita 2004 for non-volant mammals;Quian 2007 for vascular plants). However, it appearsthat this latitudinal pattern of high regional diversity offerns does not translate to the local scale fern speciesrichness studied here, because decreasing regional rich-ness towards tropical edges does not cause decreasinglocal richness. This may suggest that, within small scalelocalities in the tropical habitats we studied, fern speciesrichness has an upper limit and is bound by the numberof species that can co-occur. This in turn implies thatsmall-scale fern communities are saturated, perhaps dueto limitations of the available niche space. However, thediscrepancy between regional and local richness patternsof ferns suggests that spatial species turnover (i.e., betadiversity), for example between different habitats(Kessler et al. 2009a, 2009b; Jones et al. 2011), mightbe higher in Ecuador than further away from the Equator.A test of this hypothesis requires spatially consistent andreplicated plot data along the latitudinal gradient that arecurrently unavailable.
In addition to the concordance of species numbers, wealso found that species numbers per family, as well as the
elevations at which individual families reached their max-imum diversity, largely coincided between transects. Thispattern has recently also been found by Girardin et al.(2013) for forest trees in Ecuador, Peru and Bolivia, andin general for vascular plants by Grau et al. (2012) indifferent localities across the Pyrenean and Catalonianmountains (both Iberian Peninsula). Within our study, inall transects the most species rich families arePolypodiaceae and Dryopteridaceae, which together com-prised about half the total species richness along eachstudy gradient, usually followed by the filmy ferns(Hymenophyllaceae). Given that all these groups displaydistinct morphological features, which reflect certain eco-logical adaptations like shape and structure of leaves ordensity of scale indumentum (Kluge and Kessler 2007),and considering the high dispersal ability of ferns(Barrington 1993), it is not surprising that taxonomiccomposition reflects common patterns of ferns in tropicalmontane forests. Such pattern are upheld across conti-nents, with transects in Bolivia and Borneo showing ahigh degree of concordance (Kessler et al. 2001). Similarpatterns of ‘family niches’ are also found among treesacross the tropics and suggest that different major taxahave different abilities to develop and maintain species(Ricklefs and Renner 2012).
Conclusions
We found that local fern communities at the local scaleshow a high degree of similarity within mountain forestsof the neotropics and possibly more generally. This simi-larity concerns both the richness and the taxonomic com-position of the assemblages and shows no latitudinal trendwithin the tropical realm. It is at the transition to thesubtropical regions that the latitudinal decline of speciesrichness and changes in taxonomic composition becomeapparent.
AcknowledgementsWe thank D. Torres, L. Cotugno, R. Güdel, E. Gortaire,W. Santillán, W. Pérez and people from the local communitiesfor their invaluable help, support and enthusiasm during thefieldtrips, Guango lodge for allowing us to work in their privateforest, and B. León, M. Sundue and A. Smith for their assistancein species identification. We are grateful for the institutionalsupport of Ministerio del Ambiente of Ecuador (MAE) and forthe permit to carry out this study, and to the staff at the herbariumQCA (Pontificia Universidad Católica del Ecuador). This studywas funded by the Schweizer Nationalfonds (SNF) and theGerman Academic Exchange Service (DAAD). We gratefullyacknowledge the correction of our wording and grammar byGuy Atchison.
Notes on contributorsLaura Salazar is interested in the ecology and conservation offerns in Ecuador and their diversity along elevational gradients.
Jürgen Homeier is a plant ecologist interested in the performanceof tropical plants along environmental gradients.
Michael Kessler is interested in the diversity and biogeographyof tropical montane plant and animal communities, with a specialfocus on ferns.
Stefan Abrahamczyk is interested in diversity patterns and plant–animal interactions, especially of hummingbirds.
Marcus Lehnert is interested in plants systematics, biogeographyand DNA barcoding, with a focus on cryptogams.
Thorsten Krömer is interested in diversity, ecology, systematicsand conservation of vascular epiphytes, with a special focus onBolivia and Mexico.
Jürgen Kluge is a biogeographer interested in the spatial patternsof plant distributions, especially along tropical elevationalgradients.
ReferencesBalslev H, Valencia R, Paz y Miño G, Christensen H, Nielsen I.
1998. Species count of vascular plants in one hectare ofhumid lowland forest in Amazonian Ecuador. In: DallmeierF, Comiskey JA, editors. Forest biodiversity in North,Central and South America, and the Caribbean: researchand monitoring. Paris (France): UNESCO. p. 585–594.
Barrington SD. 1993. Ecological and historical factors in fernbiogeography. Journal of Biogeography 20:275–280.
Barton K. 2010. MuMIn: multi-model inference R package,version 0.12.2. Available online at http://r-forge.r-project.org/projects/mumin/ (accessed 23 August 2013).
Bhattarai KR, Vetaas OR, Grytnes JA. 2004. Fern species rich-ness along a central Himalayan elevational gradient, Nepal.Journal of Biogeography 31:389–400.
Brodribb TJ, McAdam SAM. 2011. Passive origins of stomatalcontrol in vascular plants. Science 331:582–585.
Burnham KP, Anderson DR. 2002. Model selection and multi-model inference. A practical information-theoretic approach.New York (NY): Springer.
Currie DJ, Mittelbach GG, Cornell HV, Field R, Guégan JF,Hawkins BA, Kaufman DM, Kerr JT, Oberdorff T, O’BrienE, et al. 2004. Predictions and tests of climate-based hypoth-eses of broad-scale variation in taxonomic richness. EcologyLetters 7:1121–1134.
Evans KL, Warren PH, Gaston KJ. 2005. Species-energy rela-tionships at the macroecological scale: a review of themechanisms. Biological Reviews 80:1–25.
Frahm JP, Gradstein SR. 1991. An altitudinal zonation of tropicalrain forests using bryophytes. Journal of Biogeography18:669–678.
Gaston KJ, Blackburn TM. 2000. Pattern and process in macro-ecology. London (UK): Blackwell.
Gentry AH. 1988. Changes in plant community diversity andfloristic composition on environmental and geographicalgradients. Annals of the Missouri Botanical Garden75:1–34.
Gentry AH. 1995. Patterns of diversity and floristic compositionin neotropical montane forests. In: Churchill SP, Balslev H,Forero E,Luteyn JL, editors. Biodiversity and conservationof neotropical montane forests. New York (NY): The NewYork Botanical Garden. p. 103–126.
Gentry AH, Dodson CH. 1987. Contribution of nontrees tospecies richness of a tropical rain forest. Biotropica19:149–156.
Girardin CAJ, Farfan-Rios W, Garcia K, Feeley KJ, JørgensenPM, Araujo Murakami A, Pérez LC, Seidel R, Paniagua N,Fuentes Claros A, et al. 2014. Spatial patterns of above-ground structure, biomass and composition in a network ofsix Andean elevation transects. Plant Ecology andDiversity, (online early).
Gradstein SR, Nadkarni NM, Krömer T, Holz I, Nöske N. 2003.A protocol for rapid and representative sampling of vascularand non-vascular epiphyte diversity of tropical rain forests.Selbyana 24:105–111.
Grau O, Ninota JM, Ferré A, Font X, Grytnes J-A. 2012.Altitudinal species richness patterns of vascular plants inthe south-eastern Pyrenees and nearby mountains ofCatalonia. Plant Ecology and Diversity 5:115–126.
Hemp A. 2001. Ecology of the pteridophytes on the southernslopes of Mt. Kilimanjaro. Part II: Habitat selection. PlantBiology 3:493–523.
Hemp A. 2002. Ecology of the pteridophytes on the southernslopes of Mt. Kilimanjaro-I. Altitudinal distribution. PlantEcology 159:211–239.
Hijmans RJ, Cameron SE, Parra JL, Jones PG, Jarvis A. 2005.Very high resolution interpolated climate surfaces for globalland areas. International Journal of Climatology 25:1965–1978.
Hillebrand H. 2004. On the generality of the latitudinal diversitygradient. American Naturalist 163:192–211.
Jones MM, Szyska B, Kessler M. 2011. Microhabitat partitioningpromotes plant diversity in a mid-elevation tropical montaneforest. Global Ecology and Biogeography 20:558–569.
Jones MM, Tuomisto H, Olivas PC. 2008. Differences in thedegree of environmental control on large and small tropicalplants: just a sampling effect? Journal of Ecology 96:367–377.
Jørgensen PM, León-Yánez S. 1999. Catalogue of the vascularplants of Ecuador. Monographs in Systematic Botany of theMissouri Botanical Garden 75:1–1181.
Karger DN, Kluge J, Abrahamczyk S, Salazar L, Homeier J,Lehnert M, Amoroso VB, Kessler M. 2012. Bryophytecover of trees as proxy for air humidity in the tropics.Ecological Indicators 20:277–281.
Kessler M. 2000. Elevational gradients in species richness andendemism of selected plant groups in the central BolivianAndes. Plant Ecology 149:181–193.
Kessler M. 2001a. Maximum plant community endemism atintermediate intensities of anthropogenic disturbance inBolivia montane forest. Conservation Biology 15:634–641.
Kessler M. 2001b. Pteridophyte species richness in Andean forestsin Bolivia. Biodiversity and Conservation 10:1473–1495.
Kessler M. 2001c. Patterns of diversity and range size of selectedplant groups along an elevational transect in the BolivianAndes. Biodervisity and Conservation 10:1897–1920.
Kessler M, Bach K. 1999. Using indicator groups for vegetationclassification in species-rich Neotropical forests.Phytocoenologia 29:485–502.
Kessler M, Kluge J, Hemp A, Ohlemüller R. 2011. A globalcomparative analysis of elevational species richness patternsof ferns. Global Ecology and Biogeography 20:868–880.
Kessler M, Lehnert M. 2009a. Do ridge habitats contribute topteridophyte diversity in tropical montane forests? A casestudy from southeastern Ecuador. Journal of Plant Research122:421–428.
Kessler M, Lehnert M. 2009b. Are ridge habitats special sites forendemic plants in tropical montane rain forests? A case studyof pteridophytes in Ecuador. Folia Geobotanica 44:387–398.
Kessler M, Parris BS, Kessler E. 2001. A comparison of thetropical montane pteridophyte floras of Mount Kinabalu,Borneo, and Parque Nacional Carrasco, Bolivia. Journal ofBiogeography 28:611–622.
Killeen TJ, Douglas M, Consiglio T, Jørgenen PM, Mejia J.2007. Dry spots and wet spots in the Andean hotspot.Journal of Biogeography 34:1357–1373.
Kluge J, Bach K, Kessler M. 2008. Elevational distribution andzonation of tropical pteridophyte assemblages in Costa Rica.Basic and Applied Ecology 9:35–43.
Kluge J, Kessler M. 2005. Inventory of pteridophytes along anelevational transect in Braulio Carrillo National Park, LaSelva Biological Station and Cerro de la Muerte, CostaRica. Brenesia 63–64:11–34.
Kluge J, Kessler M. 2007. Morphological characteristics of fernassemblages along an elevational gradient: patterns andcauses. Ecotropica 13:27–43.
Kluge J, Kessler M, Dunn RR. 2006. What drives elevationalpatterns of diversity? A test of geometric constraints, climateand species pool effects for pteridophytes on an elevationalgradient in Costa Rica. Global Ecology and Biogeography15:358–371.
Kreft H, Jetz W, Mutke J, Barthlott W. 2010. Contrasting envir-onmental and regional effects on global pteridophyte andseed plant diversity. Ecography 33:408–419.
Krömer T, Acebey A, Kluge J, Kessler M. 2013. Effects ofaltitude and climate in determining elevational plant speciesrichness patterns: a case study from Los Tuxtlas, Mexico.Flora 208:197–210.
Krömer T, Kessler M, Gradstein SR, Acebey A. 2005. Diversitypatterns of vascular epiphytes along an altitudinal gradient inthe Andes. Journal of Biogeography 32:1799–1809.
Linares-Palomino R, Cardona V, Hennig EI, Hensen I, HoffmannD, Lendzion J, Soto D, Herzog SK, Kessler M. 2009. Non-woody life-form contribution to vascular plant species rich-ness in a tropical American forest. Plant Ecology 201:87–99.
Lomolino MV. 2001. Elevational gradients of species-diversity:historical and prospective views. Global Ecology andBiogeography 10:3–13.
Mandl N, Lehnert M, Kessler M, Gradstein SR. 2010. A compar-ison of alpha and beta diversity patterns of ferns, bryophytesand macrolichens in tropical montane forests of southernEcuador. Biodiversity and Conservation 19:2359–2369.
McAdam SAM, Brodribb TJ. 2012. Stomatal innovation and therise of seed plants. Ecology Letters 15:1–8.
Moran RC. 2004. A Natural History of Ferns. Portland (OR):Timber Press.
Navarrete H. 2001. Helechos comunes de la Amazonía BajaEcuatoriana. Quito (Ecuador): Editorial Simbioe.
Neill DA, Ulloa Ulloa C. 2011. Adiciones a la flora del Ecuador:Segundo Suplemento, 2005–2010. Quito (Ecuador):Fundación Jatun Sacha.
Poulsen AD, Pendry CA. 1995. Inventories of ground herbs atthree altitudes on Bukit Belalong, Brunei, Borneo.Biodiversity and Conservation 4:745–757.
Qian H, Ricklefs RE. 2007. A latitudinal gradient in large-scalebeta diversity for vascular plants in North America. EcologyLetters 10:737–744.
Øllgaard J, Navarrete H. 2000. Riqueza de especies de pterido-fitas en los valles de los ríos Oyacachi, Quijos y AltoAguarico. In: DIVA, editores. Oyacachi – La gente y labiodiversidad. Centro para la Investigación de la DiversidadCultural y Biológica de los Bosques Pluviales Andinos.Ecuador: Dinamarca y Ediciones Abya Yala. p. 74–79.
R Development Core Team. 2011. R: A language and environ-ment for statistical computing. Vienna (Austria): RFoundation for Statistical Computing. Available online athttp://www.Rproject.org.
Ricklefs RE. 2007. Estimating diversification rates from phylo-genetic information. Trends in Ecology and Evolution22:601–610.
Ricklefs RE, Renner SS. 2012. Global correlations in tropicaltree species richness and abundance reject neutrality. Science335:464–467.
Rodríguez P, Arita HT. 2004. Beta diversity and latitude in NorthAmerican mammals: testing the hypothesis of covariation.Ecography 27:547–556.
Diversity patterns of ferns 11
Dow
nloa
ded
by [
UZ
H H
aupt
bibl
ioth
ek /
Zen
tral
bibl
ioth
ek Z
üric
h] a
t 05:
07 1
2 D
ecem
ber
2013
Rohde K. 1992. Latitudinal gradients in species diversity: thesearch for the primary cause. Oikos 65:514–527.
Rosenzweig ML. 1995. Species diversity in space and time.Cambridge (MA): Cambridge University Press.
Sanders NJ, Moss J, Wagner D. 2003. Patterns of ant speciesrichness along elevational gradients in an arid ecosystem.Global Ecology and Biogeography 12:93–102.
Smith AR, León B, Tuomisto H, van der Werff H, Moran RC,Lehnert M, Kessler M. 2005. New records of pteridophytesfor the Flora of Peru. Sida 21:2321–2341.
Smith AR, Pryer KM, Schuettpelz E, Korall P, Schneider H, WolfPG. 2006. A classification for extant ferns. Taxon55:705–731.
Soria-Auza RW, Kessler M. 2007. Estado del conocimiento yconservación de los helechos y plantas afines en Bolivia.Ecología en Bolivia 42:148–156.
Tuomisto H, Ruokolainen K, Kalliola R, Lia A, Danjoy W,Rodriguez Z. 1995. Dissecting Amazonian Biodiversity.Science 269:63–66.
Turkheimer FE, Hinz R, Cunningham VJ. 2003. On the undecid-ability among kinetic models: from model selection to modelaveraging. Journal of Cerebral Blood Flow & Metabolism23:490–498.
Ulloa Ulloa C, Neill DA. 2005. Cinco años de adiciones a la floradel Ecuador: 1999–2004. Loja (Ecuador): EditorialUniversidad Técnica Particular de Loja.
Unger M, Homeier J, Leuschner C. 2012. Effects of soilchemistry on tropical forest biomass and productivity atdifferent elevations in the equatorial Andes. Oecologia170:263–274.
Unger M, Leuschner C, Homeier J. 2010. Variability of indicesof macronutrient availability in soils at different spatial scalesalong an elevation transect in tropical moist forests(Ecuador). Plant Soil 336:443–458.
WagenmakersEJ, Farrell S. 2004.AICmodel selection usingAkaikeweights. Psychonomic Bulletin and Review 11:192–196.
Whitmore TC, Peralta R, Brown K. 1985. Total species count ina Costa Rican rain forest. Journal of Tropical Ecology1:375–378.
Willinghöfer S, Cicuzza D, Kessler M. 2012. Elevational diver-sity of terrestrial rainforest herbs: when the whole is less thanthe sum of its parts. Plant Ecology 213:407–418.
Wolf JHD. 1993. Diversity patterns and biomass of epiphyticbryophytes and lichens along an altitudinal gradient in thenorthern Andes. Annals of the Missouri Botanical Garden80:928–960.


![[Diversity of ferns and lycophytes from Reserve Natural Punta Lara, Buenos Aires, Argentina]](https://static.documents.page/doc/80x56/6351af635c21d80fde0a9972/diversity-of-ferns-and-lycophytes-from-reserve-natural-punta-lara-buenos-aires.jpg)


