Page 1
Temporal patterns in Saturnidae (silk moth) and Sphingidae(hawk moth) assemblages in protected forests of centralUgandaPerpetra Akite1,2, Richard J. Telford2, Paul Waring3, Anne M. Akol1 & Vigdis Vandvik2
1Department of Biological Sciences, Makerere University, Kampala, Uganda2Department of Biology, University of Bergen, Bergen, Norway3Windall View, Werrington, Peterborough, UK
Keywords
Compositional change, extinction debt, forest
degradation, Lepidoptera, matrix
intensification, resampling, species decline.
Correspondence
Perpetra Akite, Department of Biological
Sciences, Makerere University, P.O. Box 7062
Kampala, Uganda.
Tel: +256 772 902633;
Fax: +256 414 531061;
E-mail: [email protected]
Funding Information
The research was funded by the Norwegian
Research Council FRIMUF programme
through the MATRIX project (# 184912) and
supported by the University of
Bergen�Makerere University Collaboration.
Received: 20 December 2014; Revised: 2
March 2015; Accepted: 5 March 2015
doi: 10.1002/ece3.1477
Abstract
Forest-dependent biodiversity is threatened throughout the tropics by habitat
loss and land-use intensification of the matrix habitats. We resampled historic
data on two moth families, known to play central roles in many ecosystem pro-
cesses, to evaluate temporal changes in species richness and community struc-
ture in three protected forests in central Uganda in a rapidly changing matrix.
Our results show some significant declines in the moth species richness and the
relative abundance and richness of forest-dependent species over the last 20–40 years. The observed changes in species richness and composition among dif-
ferent forests, ecological types, and moth groups highlight the need to repeat-
edly monitor biodiversity even within protected and relatively intact forests.
Introduction
For terrestrial ecosystems, the most important driver for
biodiversity change in the last 50 years has been land cover
change (e.g., Sala et al. 2000; Fahrig 2003; Foley et al. 2005;
MEA 2005). In some regions, less than 10% of the original
vegetation remains after clearance for agriculture and other
purposes (Saunders et al. 1991). Tropical forests are among
the habitats experiencing the highest loss rates. In addition
to the area loss per se, deforestation has resulted in frag-
mentation of once-continuous forests; the resulting frag-
ments are now surrounded by a matrix of other land-uses
(Fahrig and Merriam 1994).
Species vulnerability to forest area loss and fragmenta-
tion is strongly affected by their ability to use these
matrix landscapes (Gascon et al. 1999). Different species
perceive the matrix differently: what is inhospitable to
one may be habitable to another and what is a barrier to
one may be easily traversed by another (Bowler and Ben-
ton 2005; Eycott et al. 2012). Consequently, ecological
patterns and processes within patches may also be influ-
enced by the nature of the surrounding matrix landscape
(Ricketts 2001; Vandermeer and Carvajal 2001; Prugh
et al. 2008) particularly in species exhibiting a metapopu-
lation structure (Hanski 1998).
Species response to landscape changes is influenced by
key ecological and life-history attributes such as longevity,
reproductive rates, body size, trophic specialization, and
dispersal ability. These traits directly determine changes
in abundance and mediate extinction risk (Pimm et al.
ª 2015 The Authors. Ecology and Evolution published by John Wiley & Sons Ltd.
This is an open access article under the terms of the Creative Commons Attribution License, which permits use,
distribution and reproduction in any medium, provided the original work is properly cited.
1
Page 2
1993). Identifying how species with different traits are dif-
ferentially affected by landscape change allows insight into
shifts in communities or guild composition beyond sim-
ple changes in species richness (Williams et al. 2010).
One way to understand the mechanisms that determine
the structure of communities is through the comparison
of species diversity at different spatial and temporal scales
in different ecological and biogeographical settings (Fuka-
mi and Wardle 2005). Temporal patterns of biodiversity
have received much less attention than spatial ones (Ma-
gurran et al. 2010). Such comparisons are important in
developing and planning conservation program (e.g., Kre-
men et al. 2007) and provide a vital tool for management
of wildlife (Turner et al. 2003).
Insects make an enormous contribution to diversity
and ecosystem functions (Lewinsohn et al. 2005) but
knowledge of population changes in insects lags behind
that of vertebrates and vascular plants (Thomas et al.
2004). Despite their importance for many critical eco-
logical functions, unparalleled contribution to biodiver-
sity, and their potential use in conservation planning,
long-term ecological studies of invertebrates are extre-
mely scarce (Kremen et al. 1993). For Lepidoptera, data
on population size fluctuations and associated changes
at community level are available for many temperate
ecosystems but much less is known about their dynam-
ics in the humid and seasonal tropics (e.g., Schulze and
Fiedler 2003). Moths play a central role in many ecosys-
tem processes as prey, herbivores, and pollinators (Jan-
zen 1987; Barlow and Woiwod 1989). Saturnidae (Silk
moths) and Sphingidae (Hawk moths) are two of the
most species-rich families of moths in the tropics (Jan-
zen 1984). They can be rapidly surveyed, identified and
are relatively well documented, thus well placed to act
as indicator groups. Members of the two families have
differing life histories and feeding habits. Tropical Sph-
ingidae are long-lived with a few exceptions, mate
repeatedly, lay a few eggs per host plant and oviposit
through adult life (e.g., Haber and Frankie 1989). They
are accomplished fliers with migratory tendencies
in some taxa. In contrast, Saturnidae have short non
feeding flight periods, lasting less than 10 days, mate
once and lay many eggs. They are often associated with
undisturbed forest habitats. Caterpillars of Saturnidae
often select older leaves and are usually found in
crowns of adult trees or woody vines, while Sphingidae
are less particular about plant age and commonly feed
on young leaves (Janzen 1984). These factors make it
likely that Sphingidae are typically better dispersers and
less habitat specific than Saturnidae.
Most Ugandan forests and their matrix landscape have
undergone considerable changes in recent decades (Obua
et al. 2010). Many forests have been lost, but some are
well protected and have experienced little structural and
tree compositional change in recent decades (e.g., Bulafu
et al. 2013). Our study aims to resample historical data
on moth communities to give insights on the long-term
ecological integrity of these protected forests in rapidly
changing matrix landscapes. Based on the literature sum-
marized above, we test the predictions that (1) moth spe-
cies richness has declined over time; (2) forest-dependent
species are more affected than the generalist species; and
(3) Saturnidae will have declined more rapidly than Sph-
ingidae.
Materials and Methods
Study areas
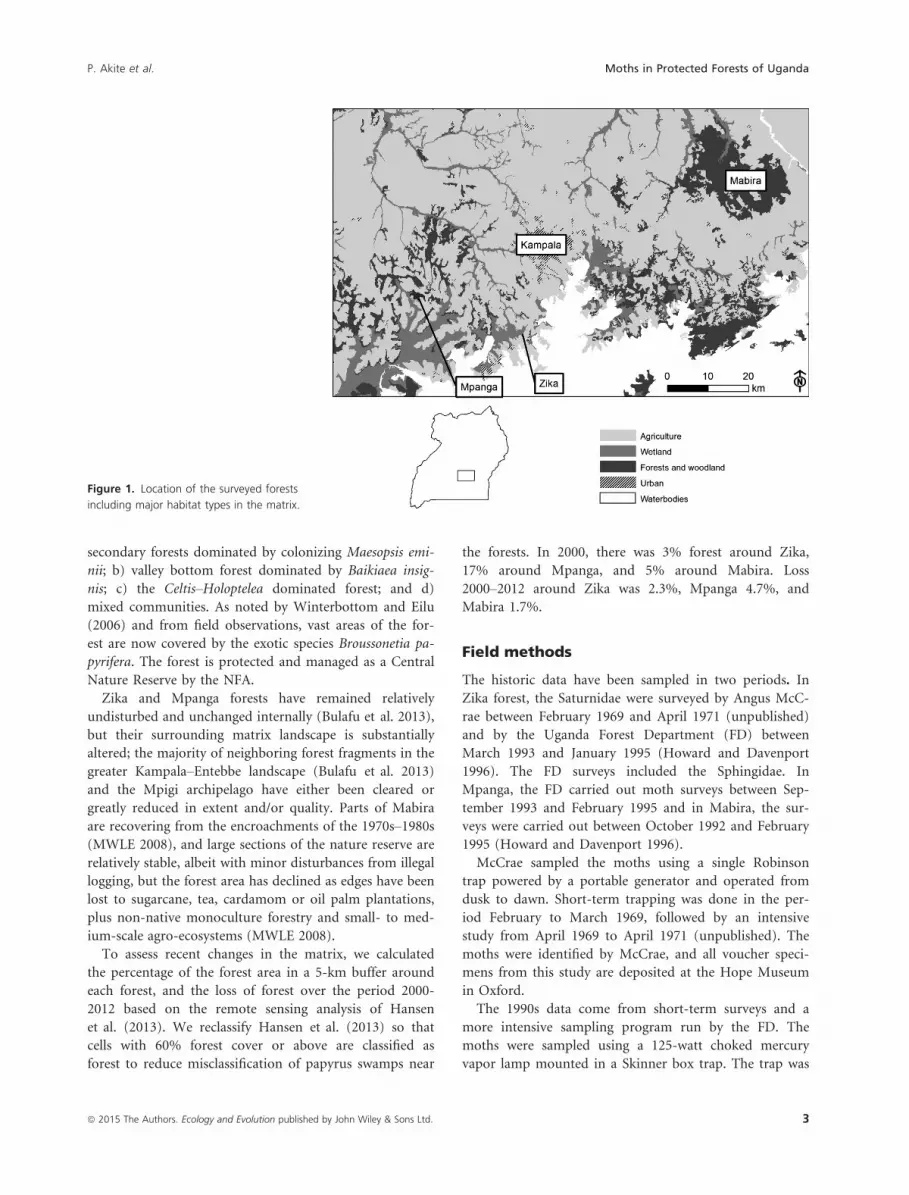
The study was conducted in three protected forests in
central Uganda: Zika, Mpanga, and Mabira (Fig. 1).
These forests are near Lake Victoria, in the wettest dis-
tricts of central Uganda where mean annual rainfall
ranges from 1200 to 1600 mm and mean annual tempera-
ture is 28°C (MWLE 2002). They lie within an elevational
range of 1070 – 1340 m asl.
Study sites
Zika (0°070N, 32°310E) covers an area of 0.13 km2. The
forest is part of a narrow sinuous strip of lakeside forests
skirting the extensive grass and papyrus swamps of Waiya
Bay, a sheltered inlet of Lake Victoria. Buxton (1952) rec-
ognized three zones in the forest: a) permanent swamp
forest dominated by Mitragyna stipulosa, Erythrina excelsa,
and Voacanga obtusa; b) raised wet forest dominated by
Pseudospondias microcarpa, Parkia filicoidea, and Maca-
ranga monandra; c) raised seasonal forest dominated by
Lovoa brownie, Maesopsis eminii, and Piptadenia africana.
The forest has been under the jurisdiction of the Uganda
Virus Research Institute since 1960.
Mpanga (0°150N, 32°180E) covers an area of 4.53 km2.
It is a remnant tropical, medium altitude, moist ever-
green, and swamp forest comprised of a) swamp – per-
manently flooded or water logged Mitragyna–Phoenixassociations; b) the slopes with Celtis–Aningeria associa-
tions; and c) main forest dominated by Pseudospondias
microcarpa, Erythrina excelsa, Canarium schweinfurthii,
and Entandrophragma angolense (Buxton 1952). The for-
est was gazetted as a nature reserve in 1950 and is under
the jurisdiction of the National Forestry Authority (NFA).
Mabira (0°240–0°350N, 32°520–33°070E) covers an area
of 306 km2, the largest block of moist semi-deciduous
forest remaining in central Uganda (Carswell 1986). The
reserve is considered to be a secondary forest and Howard
(1991) described four major types within this a) younger
2 ª 2015 The Authors. Ecology and Evolution published by John Wiley & Sons Ltd.
Moths in Protected Forests of Uganda P. Akite et al.
Page 3
secondary forests dominated by colonizing Maesopsis emi-
nii; b) valley bottom forest dominated by Baikiaea insig-
nis; c) the Celtis–Holoptelea dominated forest; and d)
mixed communities. As noted by Winterbottom and Eilu
(2006) and from field observations, vast areas of the for-
est are now covered by the exotic species Broussonetia pa-
pyrifera. The forest is protected and managed as a Central
Nature Reserve by the NFA.
Zika and Mpanga forests have remained relatively
undisturbed and unchanged internally (Bulafu et al. 2013),
but their surrounding matrix landscape is substantially
altered; the majority of neighboring forest fragments in the
greater Kampala–Entebbe landscape (Bulafu et al. 2013)
and the Mpigi archipelago have either been cleared or
greatly reduced in extent and/or quality. Parts of Mabira
are recovering from the encroachments of the 1970s–1980s(MWLE 2008), and large sections of the nature reserve are
relatively stable, albeit with minor disturbances from illegal
logging, but the forest area has declined as edges have been
lost to sugarcane, tea, cardamom or oil palm plantations,
plus non-native monoculture forestry and small- to med-
ium-scale agro-ecosystems (MWLE 2008).
To assess recent changes in the matrix, we calculated
the percentage of the forest area in a 5-km buffer around
each forest, and the loss of forest over the period 2000-
2012 based on the remote sensing analysis of Hansen
et al. (2013). We reclassify Hansen et al. (2013) so that
cells with 60% forest cover or above are classified as
forest to reduce misclassification of papyrus swamps near
the forests. In 2000, there was 3% forest around Zika,
17% around Mpanga, and 5% around Mabira. Loss
2000–2012 around Zika was 2.3%, Mpanga 4.7%, and
Mabira 1.7%.
Field methods
The historic data have been sampled in two periods. In
Zika forest, the Saturnidae were surveyed by Angus McC-
rae between February 1969 and April 1971 (unpublished)
and by the Uganda Forest Department (FD) between
March 1993 and January 1995 (Howard and Davenport
1996). The FD surveys included the Sphingidae. In
Mpanga, the FD carried out moth surveys between Sep-
tember 1993 and February 1995 and in Mabira, the sur-
veys were carried out between October 1992 and February
1995 (Howard and Davenport 1996).
McCrae sampled the moths using a single Robinson
trap powered by a portable generator and operated from
dusk to dawn. Short-term trapping was done in the per-
iod February to March 1969, followed by an intensive
study from April 1969 to April 1971 (unpublished). The
moths were identified by McCrae, and all voucher speci-
mens from this study are deposited at the Hope Museum
in Oxford.
The 1990s data come from short-term surveys and a
more intensive sampling program run by the FD. The
moths were sampled using a 125-watt choked mercury
vapor lamp mounted in a Skinner box trap. The trap was
Figure 1. Location of the surveyed forests
including major habitat types in the matrix.
ª 2015 The Authors. Ecology and Evolution published by John Wiley & Sons Ltd. 3
P. Akite et al. Moths in Protected Forests of Uganda
Page 4
powered by a portable generator and operated from dusk
to dawn. The FD surveys were conducted to be as similar
as possible to the earlier study by McCrae. All moths were
identified by Peter Howard in consultation with McCrae,
and voucher specimens are deposited at the Makerere
University Zoology Museum. Howard and Davenport
(1996) give detailed findings of sampling in each forest,
including dates, captures per night, and total trap nights.
The resampling data were collected for the two moth
families in the three forests from September 2010 through
March 2011. Traps were placed away from the edge by at
least (≥100 m) except in the much smaller Zika forest
where traps were placed in the center of the forest. We
surveyed the same localities as Howard and Davenport
(1996) and trap locations remained the same throughout
the entire survey. In Zika, sampling was carried out in
the periods 3–11 January then 13–23 February 2011; in
Mpanga, sampling was carried out in the periods 15–29December 2010 then 13–23 February 2011; and in Mabira,
sampling was carried out in the period 9 September – 10
December 2010. Sampling was carried out using a
portable light-trap consisting of a 15-watt actinic tube
(Sylvania blacklight F 15 w/BLB–TB) run on a portable
car battery (32 amps) and a net and was run from dusk
to dawn. Actinic traps are known to be highly effective
and minimize cross attraction of moths between sampled
habitats (Muirhead-Thomson 1991; Schulze and Fiedler
2003). Each morning, special attention was given to
searching the area around the trap for any moths that
had been attracted to the light, but had not entered
the trap; individuals of the target families were hand-
collected.
Specimens of the two families were first photographed
at the trap, and then, representative samples collected and
dried in envelopes. Voucher specimens were examined
and identified (where possible) with reference to Pinhey
(1972) and D’Abrera (1986), and the reference collections
from the FD surveys. Clarification was sought for some
species by checking the extensive collections of A. McCrae
at The Hope Museum (Oxford, UK) and the collections
at The Natural History Museum London (NHM). Some
of the Sphingidae were identified by Ian Kitching.
Data combination and species classification
The sampling effort differed between the sampling peri-
ods. The 1970s and 1990s species lists are extensive – a
large fraction of the species that occurred in (and possibly
around) these forests were probably recorded. To achieve
meaningful comparisons, subsets of data from the 1970s
and 1990s were extracted which covered only the same
portion of the year as the 2010s surveys (Table 1). These
are referred to as the 1970, 1990, and 2010 data hereafter.
Howard and Davenport (1996) describe the ecological
habitat preferences of all species they observed based
on prior knowledge of their ecology (Carcasson 1976).
Habitat preferences include: F) forest-dependent species
restricted to closed-canopy forest habitats; f.) forest
nondependent species not infrequently recorded in
closed-canopy forest, but also encountered in a variety of
forest edge, degraded forest, and woodland habitats; G)
nonforest species characteristic of open habitats such as
grassland, open savannah, and arid habitats; and W)
widespread species, generalist that occur in a variety of
forest and nonforest habitats.
Data analysis
Trap data were pooled for each of the two moth families
in each forest per sampling period. We calculated the
exponent of the bias-corrected Shannon index (Chao and
Shen 2003) for each sample period, called the “effective
number of species” of the community (Hill 1973). This
index converges rapidly with little bias even for small
samples (Magurran 2004).
The observed number of species is a misleading indica-
tion of species richness because of the difficulty of obtain-
ing a complete inventory of species-rich communities
(Price et al. 1995). Individual-based rarefaction curves
were therefore used to evaluate the effectiveness of sam-
pling and for comparison of species accumulation curves
following Gotelli and Colwell (2001). For the statistical
comparison of the accumulation curves, we calculated the
rarefied number of species and the 95% confidence inter-
val using bootstrap resampling with replacement using
EstimateS Version 9.1.0 (Colwell 2006).
The proportion of the total moth fauna belonging to
each ecological habitat preference types was calculated
based on abundance and presence/absence data. We per-
formed a chi-square test for homogeneity to check
whether the observed differences in richness and abun-
dances of the different ecotypes over time within the two
moth families are significant. Data were analyzed using
the statistical program R (v. 2.13.1, R Core Team 2013).
Results
The combined dataset consists of 3687 individuals (54
species) of Saturnidae and 1041 individuals (49 species)
of Sphingidae across the three forests. The number of
moths differed with effort between sampling periods, but
the mean numbers of individuals per trap night are gen-
erally comparable across the sampling periods (Table 1).
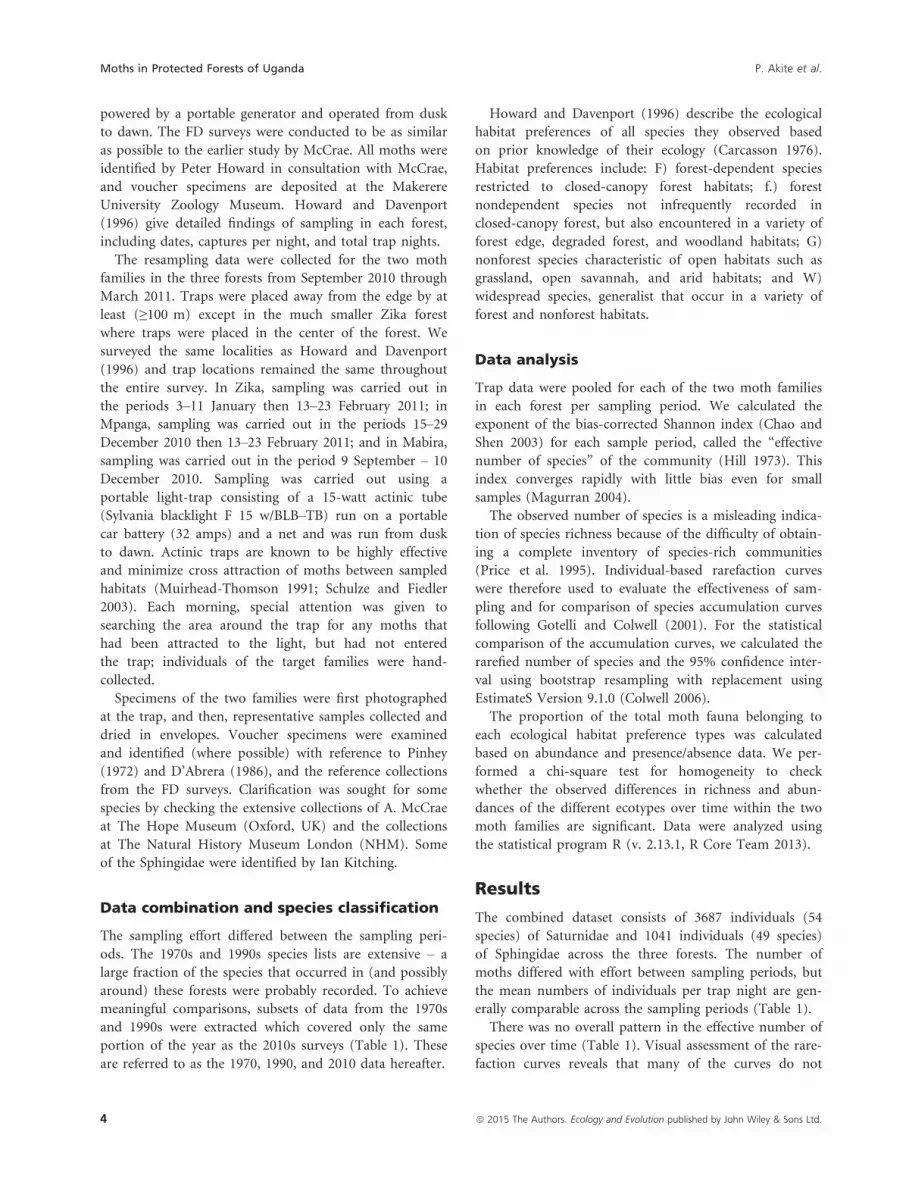
There was no overall pattern in the effective number of
species over time (Table 1). Visual assessment of the rare-
faction curves reveals that many of the curves do not
4 ª 2015 The Authors. Ecology and Evolution published by John Wiley & Sons Ltd.
Moths in Protected Forests of Uganda P. Akite et al.
Page 5
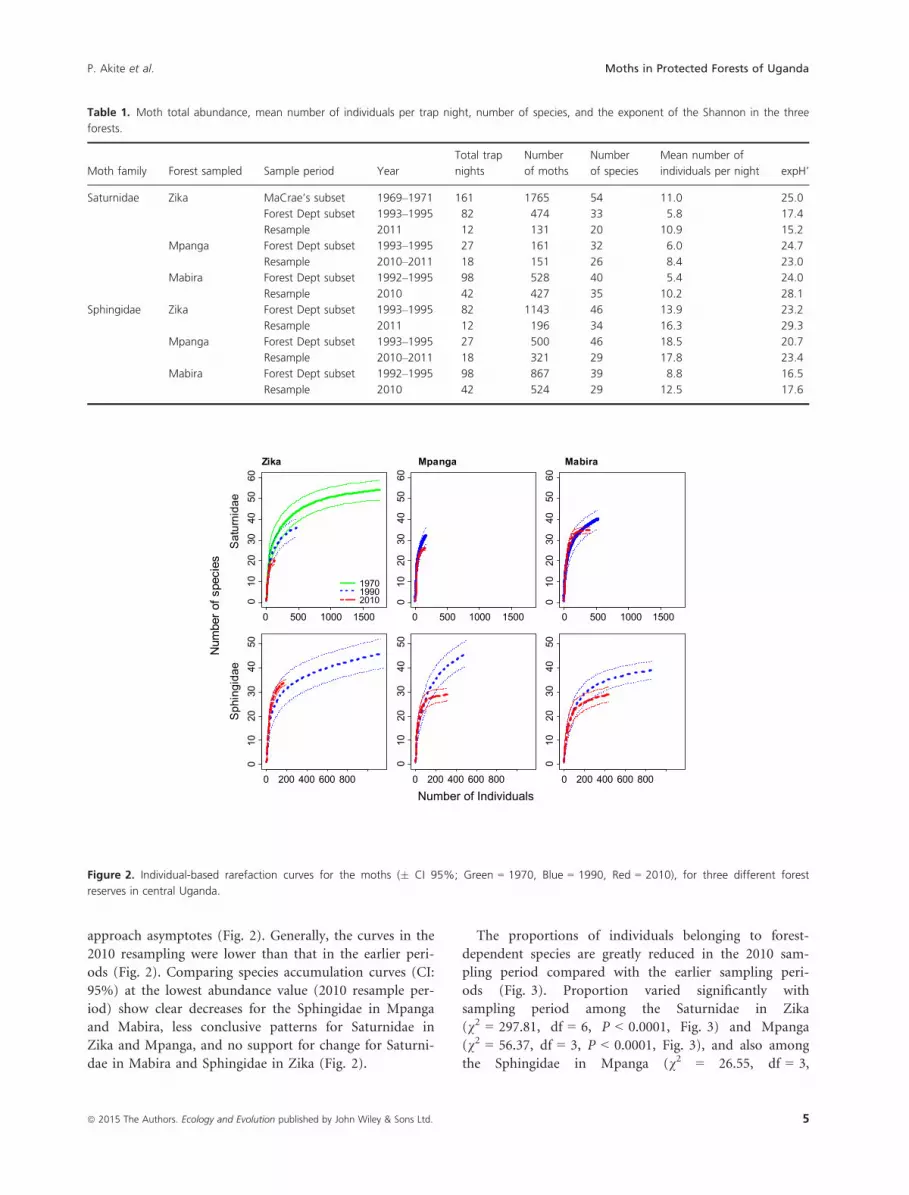
approach asymptotes (Fig. 2). Generally, the curves in the
2010 resampling were lower than that in the earlier peri-
ods (Fig. 2). Comparing species accumulation curves (CI:
95%) at the lowest abundance value (2010 resample per-
iod) show clear decreases for the Sphingidae in Mpanga
and Mabira, less conclusive patterns for Saturnidae in
Zika and Mpanga, and no support for change for Saturni-
dae in Mabira and Sphingidae in Zika (Fig. 2).
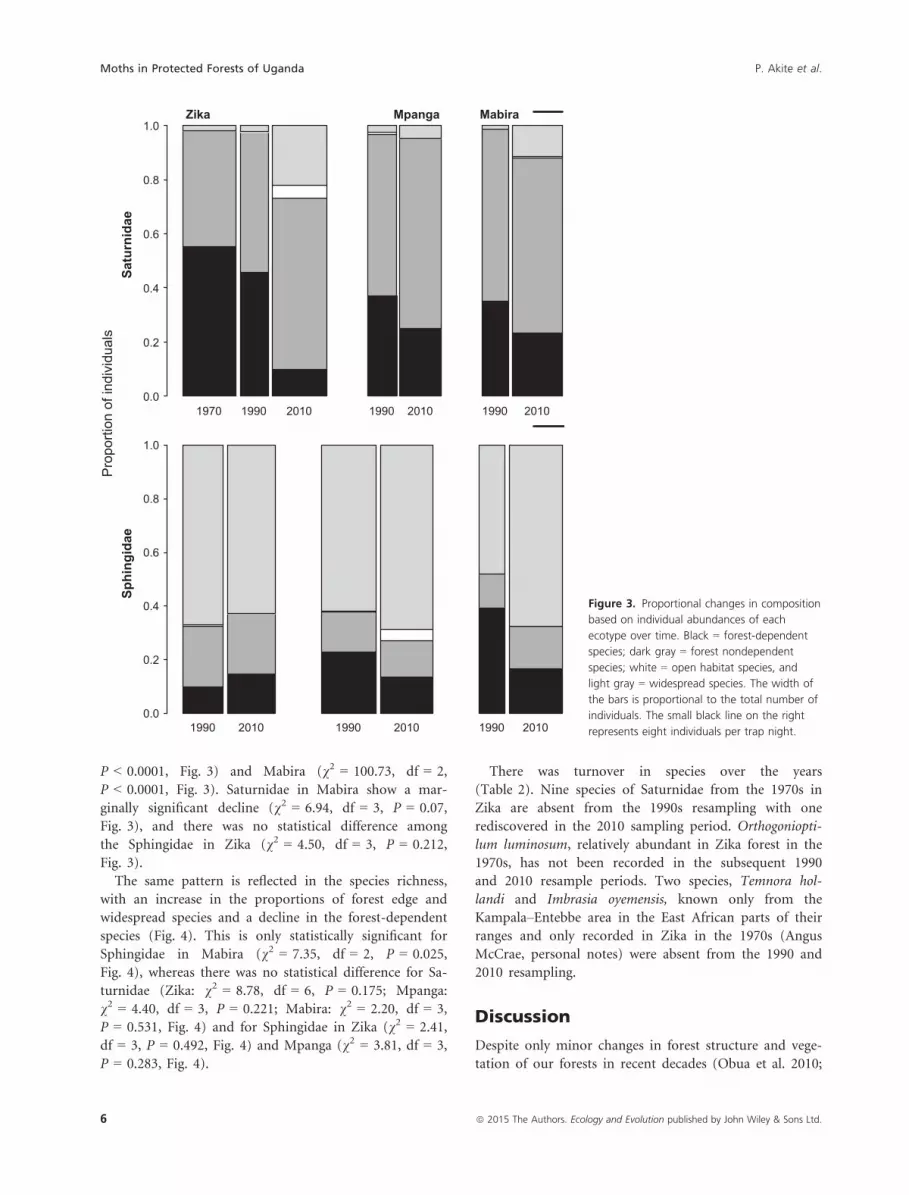
The proportions of individuals belonging to forest-
dependent species are greatly reduced in the 2010 sam-
pling period compared with the earlier sampling peri-
ods (Fig. 3). Proportion varied significantly with
sampling period among the Saturnidae in Zika
(v2 = 297.81, df = 6, P < 0.0001, Fig. 3) and Mpanga
(v2 = 56.37, df = 3, P < 0.0001, Fig. 3), and also among
the Sphingidae in Mpanga (v2 = 26.55, df = 3,
Table 1. Moth total abundance, mean number of individuals per trap night, number of species, and the exponent of the Shannon in the three
forests.
Moth family Forest sampled Sample period Year
Total trap
nights
Number
of moths
Number
of species
Mean number of
individuals per night expH’
Saturnidae Zika MaCrae’s subset 1969–1971 161 1765 54 11.0 25.0
Forest Dept subset 1993–1995 82 474 33 5.8 17.4
Resample 2011 12 131 20 10.9 15.2
Mpanga Forest Dept subset 1993–1995 27 161 32 6.0 24.7
Resample 2010–2011 18 151 26 8.4 23.0
Mabira Forest Dept subset 1992–1995 98 528 40 5.4 24.0
Resample 2010 42 427 35 10.2 28.1
Sphingidae Zika Forest Dept subset 1993–1995 82 1143 46 13.9 23.2
Resample 2011 12 196 34 16.3 29.3
Mpanga Forest Dept subset 1993–1995 27 500 46 18.5 20.7
Resample 2010–2011 18 321 29 17.8 23.4
Mabira Forest Dept subset 1992–1995 98 867 39 8.8 16.5
Resample 2010 42 524 29 12.5 17.6
0 500 1000 1500
010
2030
4050
60
Zika
197019902010
0 500 1000 1500
010
2030
4050
60
Mpanga
0 500 1000 1500
010
2030
4050
60
Mabira
0 200 400 600 800
010
2030
4050
0 200 400 600 800
010
2030
4050
0 200 400 600 800
010
2030
4050
Number of Individuals
Num
ber o
f spe
cies
Sat
urni
dae
Sph
ingi
dae
Figure 2. Individual-based rarefaction curves for the moths (� CI 95%; Green = 1970, Blue = 1990, Red = 2010), for three different forest
reserves in central Uganda.
ª 2015 The Authors. Ecology and Evolution published by John Wiley & Sons Ltd. 5
P. Akite et al. Moths in Protected Forests of Uganda
Page 6
P < 0.0001, Fig. 3) and Mabira (v2 = 100.73, df = 2,
P < 0.0001, Fig. 3). Saturnidae in Mabira show a mar-
ginally significant decline (v2 = 6.94, df = 3, P = 0.07,
Fig. 3), and there was no statistical difference among
the Sphingidae in Zika (v2 = 4.50, df = 3, P = 0.212,
Fig. 3).
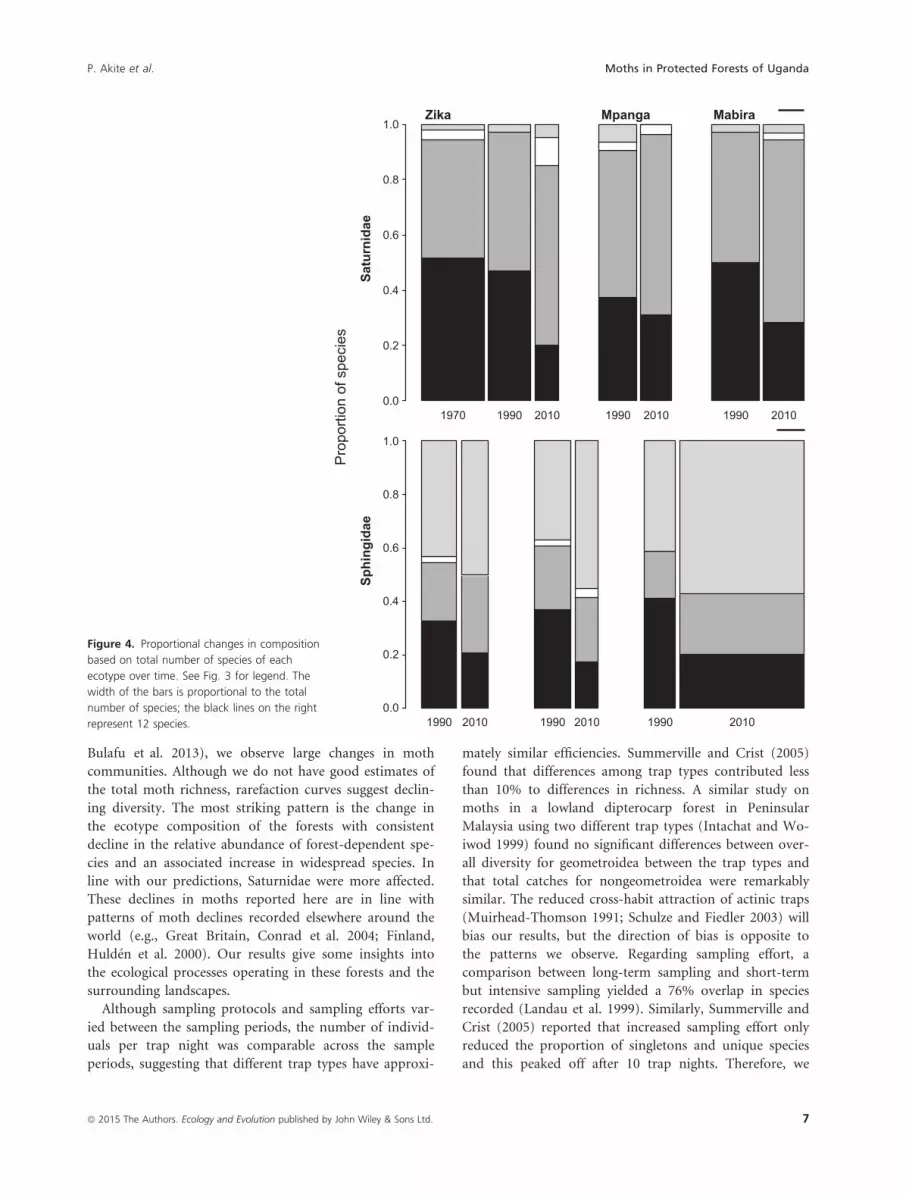
The same pattern is reflected in the species richness,
with an increase in the proportions of forest edge and
widespread species and a decline in the forest-dependent
species (Fig. 4). This is only statistically significant for
Sphingidae in Mabira (v2 = 7.35, df = 2, P = 0.025,
Fig. 4), whereas there was no statistical difference for Sa-
turnidae (Zika: v2 = 8.78, df = 6, P = 0.175; Mpanga:
v2 = 4.40, df = 3, P = 0.221; Mabira: v2 = 2.20, df = 3,
P = 0.531, Fig. 4) and for Sphingidae in Zika (v2 = 2.41,
df = 3, P = 0.492, Fig. 4) and Mpanga (v2 = 3.81, df = 3,
P = 0.283, Fig. 4).
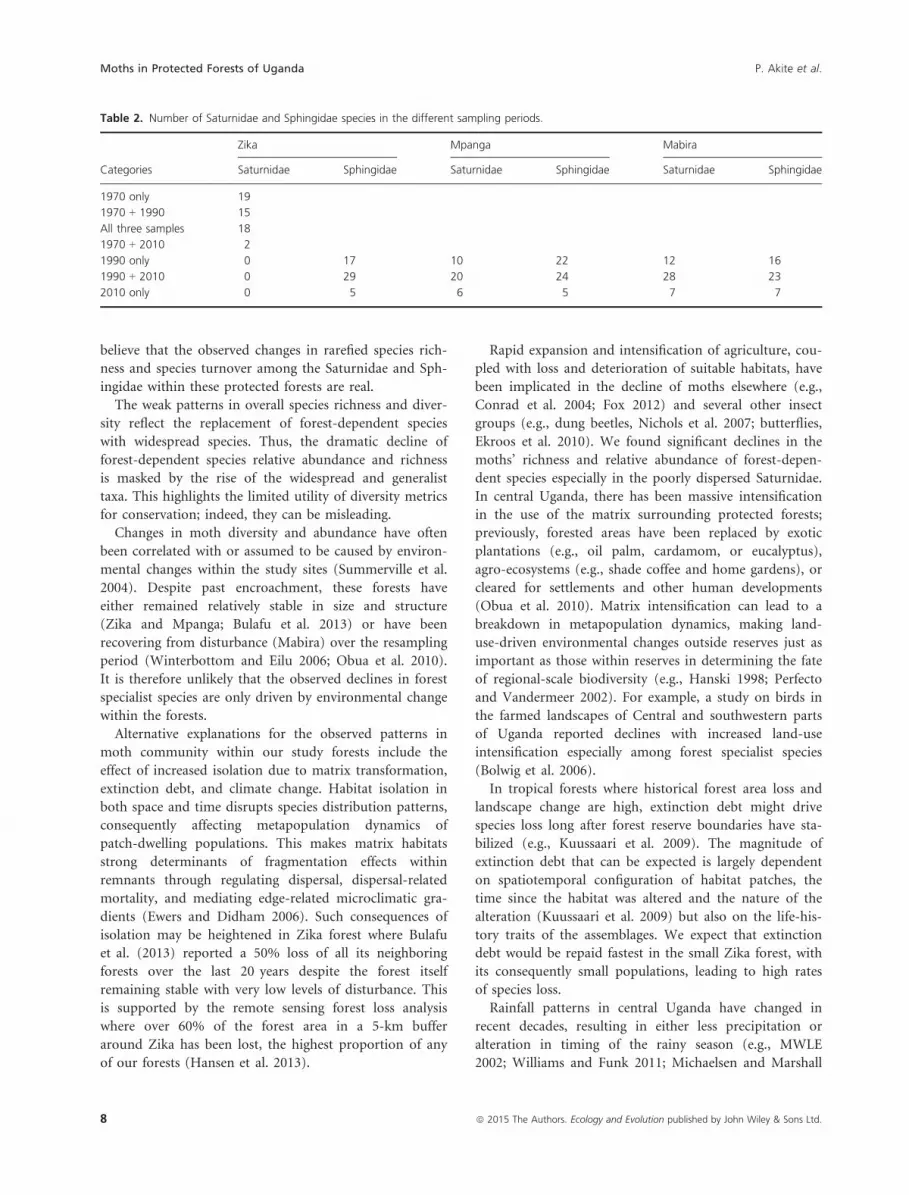
There was turnover in species over the years
(Table 2). Nine species of Saturnidae from the 1970s in
Zika are absent from the 1990s resampling with one
rediscovered in the 2010 sampling period. Orthogoniopti-
lum luminosum, relatively abundant in Zika forest in the
1970s, has not been recorded in the subsequent 1990
and 2010 resample periods. Two species, Temnora hol-
landi and Imbrasia oyemensis, known only from the
Kampala–Entebbe area in the East African parts of their
ranges and only recorded in Zika in the 1970s (Angus
McCrae, personal notes) were absent from the 1990 and
2010 resampling.
Discussion
Despite only minor changes in forest structure and vege-
tation of our forests in recent decades (Obua et al. 2010;
1970 1990 2010 1990 2010 1990 20100.0
0.2
0.4
0.6
0.8
1.0Zika Mpanga Mabira
Saturnidae
1990 2010 1990 2010 1990 20100.0
0.2
0.4
0.6
0.8
1.0
Sphingidae
Pro
porti
on o
f ind
ivid
uals
Figure 3. Proportional changes in composition
based on individual abundances of each
ecotype over time. Black = forest-dependent
species; dark gray = forest nondependent
species; white = open habitat species, and
light gray = widespread species. The width of
the bars is proportional to the total number of
individuals. The small black line on the right
represents eight individuals per trap night.
6 ª 2015 The Authors. Ecology and Evolution published by John Wiley & Sons Ltd.
Moths in Protected Forests of Uganda P. Akite et al.
Page 7
Bulafu et al. 2013), we observe large changes in moth
communities. Although we do not have good estimates of
the total moth richness, rarefaction curves suggest declin-
ing diversity. The most striking pattern is the change in
the ecotype composition of the forests with consistent
decline in the relative abundance of forest-dependent spe-
cies and an associated increase in widespread species. In
line with our predictions, Saturnidae were more affected.
These declines in moths reported here are in line with
patterns of moth declines recorded elsewhere around the
world (e.g., Great Britain, Conrad et al. 2004; Finland,
Huld�en et al. 2000). Our results give some insights into
the ecological processes operating in these forests and the
surrounding landscapes.
Although sampling protocols and sampling efforts var-
ied between the sampling periods, the number of individ-
uals per trap night was comparable across the sample
periods, suggesting that different trap types have approxi-
mately similar efficiencies. Summerville and Crist (2005)
found that differences among trap types contributed less
than 10% to differences in richness. A similar study on
moths in a lowland dipterocarp forest in Peninsular
Malaysia using two different trap types (Intachat and Wo-
iwod 1999) found no significant differences between over-
all diversity for geometroidea between the trap types and
that total catches for nongeometroidea were remarkably
similar. The reduced cross-habit attraction of actinic traps
(Muirhead-Thomson 1991; Schulze and Fiedler 2003) will
bias our results, but the direction of bias is opposite to
the patterns we observe. Regarding sampling effort, a
comparison between long-term sampling and short-term
but intensive sampling yielded a 76% overlap in species
recorded (Landau et al. 1999). Similarly, Summerville and
Crist (2005) reported that increased sampling effort only
reduced the proportion of singletons and unique species
and this peaked off after 10 trap nights. Therefore, we
1970 1990 2010 1990 2010 1990 20100.0
0.2
0.4
0.6
0.8
1.0Zika Mpanga Mabira
Saturnidae
1990 2010 1990 2010 1990 20100.0
0.2
0.4
0.6
0.8
1.0
Sphingidae
Pro
porti
on o
f spe
cies
Figure 4. Proportional changes in composition
based on total number of species of each
ecotype over time. See Fig. 3 for legend. The
width of the bars is proportional to the total
number of species; the black lines on the right
represent 12 species.
ª 2015 The Authors. Ecology and Evolution published by John Wiley & Sons Ltd. 7
P. Akite et al. Moths in Protected Forests of Uganda
Page 8
believe that the observed changes in rarefied species rich-
ness and species turnover among the Saturnidae and Sph-
ingidae within these protected forests are real.
The weak patterns in overall species richness and diver-
sity reflect the replacement of forest-dependent species
with widespread species. Thus, the dramatic decline of
forest-dependent species relative abundance and richness
is masked by the rise of the widespread and generalist
taxa. This highlights the limited utility of diversity metrics
for conservation; indeed, they can be misleading.
Changes in moth diversity and abundance have often
been correlated with or assumed to be caused by environ-
mental changes within the study sites (Summerville et al.
2004). Despite past encroachment, these forests have
either remained relatively stable in size and structure
(Zika and Mpanga; Bulafu et al. 2013) or have been
recovering from disturbance (Mabira) over the resampling
period (Winterbottom and Eilu 2006; Obua et al. 2010).
It is therefore unlikely that the observed declines in forest
specialist species are only driven by environmental change
within the forests.
Alternative explanations for the observed patterns in
moth community within our study forests include the
effect of increased isolation due to matrix transformation,
extinction debt, and climate change. Habitat isolation in
both space and time disrupts species distribution patterns,
consequently affecting metapopulation dynamics of
patch-dwelling populations. This makes matrix habitats
strong determinants of fragmentation effects within
remnants through regulating dispersal, dispersal-related
mortality, and mediating edge-related microclimatic gra-
dients (Ewers and Didham 2006). Such consequences of
isolation may be heightened in Zika forest where Bulafu
et al. (2013) reported a 50% loss of all its neighboring
forests over the last 20 years despite the forest itself
remaining stable with very low levels of disturbance. This
is supported by the remote sensing forest loss analysis
where over 60% of the forest area in a 5-km buffer
around Zika has been lost, the highest proportion of any
of our forests (Hansen et al. 2013).
Rapid expansion and intensification of agriculture, cou-
pled with loss and deterioration of suitable habitats, have
been implicated in the decline of moths elsewhere (e.g.,
Conrad et al. 2004; Fox 2012) and several other insect
groups (e.g., dung beetles, Nichols et al. 2007; butterflies,
Ekroos et al. 2010). We found significant declines in the
moths’ richness and relative abundance of forest-depen-
dent species especially in the poorly dispersed Saturnidae.
In central Uganda, there has been massive intensification
in the use of the matrix surrounding protected forests;
previously, forested areas have been replaced by exotic
plantations (e.g., oil palm, cardamom, or eucalyptus),
agro-ecosystems (e.g., shade coffee and home gardens), or
cleared for settlements and other human developments
(Obua et al. 2010). Matrix intensification can lead to a
breakdown in metapopulation dynamics, making land-
use-driven environmental changes outside reserves just as
important as those within reserves in determining the fate
of regional-scale biodiversity (e.g., Hanski 1998; Perfecto
and Vandermeer 2002). For example, a study on birds in
the farmed landscapes of Central and southwestern parts
of Uganda reported declines with increased land-use
intensification especially among forest specialist species
(Bolwig et al. 2006).
In tropical forests where historical forest area loss and
landscape change are high, extinction debt might drive
species loss long after forest reserve boundaries have sta-
bilized (e.g., Kuussaari et al. 2009). The magnitude of
extinction debt that can be expected is largely dependent
on spatiotemporal configuration of habitat patches, the
time since the habitat was altered and the nature of the
alteration (Kuussaari et al. 2009) but also on the life-his-
tory traits of the assemblages. We expect that extinction
debt would be repaid fastest in the small Zika forest, with
its consequently small populations, leading to high rates
of species loss.
Rainfall patterns in central Uganda have changed in
recent decades, resulting in either less precipitation or
alteration in timing of the rainy season (e.g., MWLE
2002; Williams and Funk 2011; Michaelsen and Marshall
Table 2. Number of Saturnidae and Sphingidae species in the different sampling periods.
Categories
Zika Mpanga Mabira
Saturnidae Sphingidae Saturnidae Sphingidae Saturnidae Sphingidae
1970 only 19
1970 + 1990 15
All three samples 18
1970 + 2010 2
1990 only 0 17 10 22 12 16
1990 + 2010 0 29 20 24 28 23
2010 only 0 5 6 5 7 7
8 ª 2015 The Authors. Ecology and Evolution published by John Wiley & Sons Ltd.
Moths in Protected Forests of Uganda P. Akite et al.
Page 9
2012). This would affect adult moth emergence, often
triggered by rainfall signaling larval food availability. Pro-
nounced fluctuations in the abundance of individual spe-
cies or entire guilds of moths over seasons are reported to
be frequent (e.g., Fiedler and Schulze 2004). Climate
effects have been reported in Britain and northwestern
Europe, where substantial decreases in the overall abun-
dance of macro-moths and populations of many wide-
spread species have been attributed to habitat loss in
combination with climate change (Conrad et al. 2006;
Fox 2012).
Compositional change in ecological types
In general, habitat specialists are more susceptible to hab-
itat loss and degradation than generalists (e.g., €Ockinger
et al. 2010). In the earlier sampling periods, forest-depen-
dent species especially those associated with woody plants
were prevalent and abundant (McCrae unpublished,
Howard and Davenport 1996). Our 2010 data are charac-
terized by species that have wider ranges and do not need
good quality forests to survive.
The observed declines in forest-dependent species vs.
increases in forest edge and widespread species within our
study forests are indicative of the ability of nonspecialist
species to utilize a much broader range of habitats across
the landscape compared to the specialist species that
require intact and less disturbed habitats for their sur-
vival. In a connected landscape, forest-dependent species
may benefit from reinforcement between fragments as a
result of metapopulation dynamics rescuing species from
imminent extinction (Nee and May 1992; Hanski 1998).
The severity of deforestation in our study area will clearly
reduce the opportunities for forest-dependent species to
cope with the changes in their environment.
Kitching et al. (2000) and Usher and Keiller (1998)
both note that forest specialist moths tend to be monoph-
agous and feed on woody plants, trees, and vines, whereas
moths that favor disturbed sites are often polyphagous,
feeding on herbaceous and weedy food plants. This could
potentially account for some of the variability in our data.
Individual species’ responses can thus be interpreted
through their guild membership – as forests are lost or
altered, monophagous (forest specialist) species are more
likely to decline or go locally extinct than those that are
polyphagous (i.e., generalist, Holloway and Hebert 1979).
Several previously common forest-dependent species were
absent from subsequent resampling periods (e.g., Imbrasia
anthina), while forest edge and widespread species (e.g.,
Cirina forda and Imbrasia anna) became more common.
The Parasol tree, (Polyscias fulva) which is a larval food
plant for Imbrasia anthina, is now scarcely found in its
natural habitat within our study forests as result of unsus-
tainable harvesting for making drums (Omeja et al. 2005;
Were 2010), and this species of moth was missing in the
2010 resample period. Imbrasia anna which feeds on sev-
eral members of the Arecaceae family had larger popula-
tions in our dataset and has a wide geographic range
compared to Imbrasia oyemensis which is a forest-depen-
dent species that only feeds on Entandrophragma ango-
lense – an IUCN red listed tree species. However, a
shortage of trait data for most species of tropical Africa,
especially larval host plants, hinders our inferences in this
regard.
Saturnidae and Sphingidae
We found steeper declines among the Saturnidae than the
Sphingidae. This is in accordance with our expectations
based on the lifestyle and dispersal ability of the two fami-
lies. Saturnidae caterpillars tend to feed on older leaves and
are often found in the crowns of trees, whereas the Sphingi-
dae tend not to be particular about plant age and com-
monly feed on younger leaves (Holloway and Hebert 1979;
Bernays and Janzen 1988). This predisposes Saturnidae to
greater impacts from habitat disturbance and especially
when mature trees and woody vines are continuously taken
out of their ecosystems (Basset 1992; Kitching et al. 2000).
Conclusions
Our results show some significant change in the moth
communities in the target forests in the last 20–40 years.
This highlights the need to repeatedly monitor biodiver-
sity even within protected and relatively intact forests.
Our findings together with similar patterns reported for
trees (Bulafu et al. 2013) in similar habitat settings indi-
cate a worrying reduction in the capacity of protected for-
ests in central Uganda to maintain biodiversity. Matrix
intensification around our forests appears to have reduced
the capacity of the landscape to buffer and support popu-
lations in protected forests. Removal of any functional
groups will alter the ecological integrity of these forests.
In our case, if an important fraction or entire guilds of
species are lost (e.g., forest-dependent species as our data
suggest), detrimental effects on ecological services medi-
ated by these moths could become apparent. Protected
forests are linked ecologically to their surrounding habi-
tats, and failure to stem broad-scale loss and degradation
of such habitats could sharply increase the likelihood of
serious biodiversity declines.
Acknowledgments
We are grateful to Hugh Rowell for reading the manu-
script drafts; Darren Mann and James Hogan at the Hope
ª 2015 The Authors. Ecology and Evolution published by John Wiley & Sons Ltd. 9
P. Akite et al. Moths in Protected Forests of Uganda
Page 10
Museum, Oxford, for help accessing Angus McCrae’s field
notes and moth collections; Ian Kitching of Natural His-
tory Museum, London (NHM), for identifying difficult
Sphingidae; Alessandro Giusti of NHM for locating all
the relevant collections; and Janet McCrae for hosting PA
in Oxford, Amy Eycott for processing remote sensing data
and commenting on the manuscript, and four anonymous
reviewers for their comments on earlier versions of this
manuscript. The research was funded by the Norwegian
Research Council FRIMUF programme through the
MATRIX project (# 184912) and supported by the Uni-
versity of Bergen–Makerere University Collaboration.
Conflict of Interest
None declared.
References
Barlow, H. S., and I. P. Woiwod. 1989. Moth diversity of a
tropical forest in Peninsular Malaysia. J. Trop. Ecol. 5:37–
50.
Basset, Y. 1992. Host specificity of arboreal and free-living
insect herbivores in rain forests. Biol. J. Linn. Soc. 47:115–133.
Bernays, E. A., and D. H. Janzen. 1988. Saturniid and
Sphingid caterpillars: two ways to eat leaves. Ecology
69:1153–1160.Bolwig, S., D. Pomeroy, H. Tushabe, and D. Mushabe. 2006.
Crops, trees, and birds: biodiversity change under
agricultural intensification in Uganda’s farmed landscapes.
Danish J. Geogr. 106:115–130.
Bowler, D. E., and T. G. Benton. 2005. Causes and consequences
of animal dispersal strategies: relating individual behaviour to
spatial dynamics. Biol. Rev. 80:205–225.Bulafu, C., D. Baranga, P. Mucunguzi, R. J. Telford, and V.
Vandvik. 2013. Massive structural and compositional
changes over two decades in forest fragments near Kampala,
Uganda. Ecol. Evol. 3:3804–3823.Buxton, A. P. 1952. Observations on the diurnal behaviour of
the redtail monkey (Cercopithecus ascanius schmidti Matschie)
in a small forest in Uganda. J. Anim. Ecol. 21:25–58.
Carcasson, R. H. 1976. Revised catalogue of the African
Sphingidae (Lepidoptera) with descriptions of the East
African species, pp. 148. E.W. Classey, Oxon, UK.
Carswell, M.. 1986. Birds of the Kampala area (Scopus special
supplement), pp 89. Ornithological Sub-committee, EANHS,
Nairobi, Kenya.
Chao, A., and T.-J. Shen. 2003. Nonparametric estimation of
Shannon’s index of diversity when there are unseen species
in sample. Environ. Ecol. Stat. 10:429–443.Colwell, R. K. 2006. EstimateS: statistical estimation of species
richness and shared species from samples. Version 9.1.0.
http://viceroy.eeb.uconn.edu/estimates/.
Conrad, K., I. Woiwod, M. Parsons, R. Fox, and M. Warren.
2004. Long-term population trends in widespread British
moths. J. Insect Conserv. 8:119–136.Conrad, K. F., M. S. Warren, R. Fox, M. S. Parsons, and I. P.
Woiwood. 2006. Rapid declines of common, widespread
British moths provide evidence of an insect biodiversity
crisis. Biol. Conserv. 132:279–291.
D’Abrera, B. 1986. Sphingidae Mundi: hawk moths of the
world. E.W Classey, Oxon, UK.
Ekroos, J., J. Heli€ol€a, and M. Kuussaari. 2010. Homogenization
of lepidopteran communities in intensively cultivated
agricultural landscapes. J. Appl. Ecol. 47:459–467.Ewers, R. M., and R. K. Didham. 2006. Confounding factors
in the detection of species responses to habitat
fragmentation. Biol. Rev. 81:117–142.
Eycott, A., G. Stewart, L. Buyung-Ali, D. Bowler, K. Watts,
and A. Pullin. 2012. A meta-analysis on the impact of
different matrix structures on species movement rates.
Landscape Ecol. 27:1263–1278.
Fahrig, L. 2003. Effects of Habitat Fragmentation on
Biodiversity. Annu. Rev. Ecol. Evol. Syst. 34:487–515.
Fahrig, L., and G. Merriam. 1994. Conservation of Fragmented
Population. Conserv. Biol. 8:50–59.
Fiedler, K., and C. H. Schulze. 2004. Forest modification
affects diversity (but not dynamics) of speciose tropical
pyraloid moth communities. Biotropica 36:615–627.Foley, J. A., R. DeFries, G. P. Asner, C. Barford, G. Bonan, S.
R. Carpenter, et al. 2005. Global consequences of land use.
Science 309:570–574.
Fox, R. 2012. The decline of moths in Great Britain: a review
of possible causes. Insect Conserv. Divers. 6:5–19.
Fukami, T., and D. A. Wardle. 2005. Long-term ecological
dynamics: reciprocal insights from natural and
anthropogenic gradients. Proc. R. Soc. B Biol. Sci. 272:2105–2115.
Gascon, C., T. E. Lovejoy, R. O. Bierregaard, J. R. Malcolm, P.
C. Stouffer, H. L. Vasconcelos, et al. 1999. Matrix habitat
and species richness in tropical forest remnants. Biol.
Conserv. 91:223–229.Gotelli, N. J., and R. K. Colwell. 2001. Quantifying
biodiversity: procedures and pitfalls in the
measurement and comparison of species richness. Ecol.
Lett. 4:379–391.Haber, W., and G. Frankie. 1989. A tropical hawkmoth
community: Costa Rican dry forest Sphingidae. Biotropica
21:155–172.
Hansen, M. C., P. V. Potapov, R. Moore, M. Hancher, S. A.
Turubanova, A. Tyukavina, et al. 2013. High-Resolution
Global Maps of 21st-Century Forest Cover Change. Science
342:850–853.
Hanski, I. 1998. Metapopulation dynamics. Nature 396:41–49.Hill, M. O. 1973. Diversity and evenness: a unifying notation
and its consequences. Ecology 54:427–432.
10 ª 2015 The Authors. Ecology and Evolution published by John Wiley & Sons Ltd.
Moths in Protected Forests of Uganda P. Akite et al.
Page 11
Holloway, J. D., and P. D. N. Hebert. 1979. Ecological and
taxonomic trends in macrolepidopteran host plant selection.
Biol. J. Linn. Soc. 11:229–251.Howard, P. 1991. Nature conservation in Uganda’s tropical
forest reserves. IUCN, Gland, Switzerland and Cambridge,
UK.
Howard, P. C., and T. R. B. Davenport. 1996. Forest
biodiversity reports. Uganda Forest Department, Kampala,
Uganda.
Huld�en, L., A. Albrecht, J. It€amies, P. Malinen, and J.
Wettenhovi. 2000. Atlas of Finnish macrolepidoptera.
Lepidopterological Society of Finland, Finnish Museum of
Natural History, Helsinki.
Intachat, J., and I. P. Woiwod. 1999. Trap design for
monitoring moth biodiversity in tropical rainforests. Bull.
Entomol. Res. 89:153–163.Janzen, D. H. 1984. Two ways to be a tropical big moth: Santa
Rosa Saturnidae and Sphingidae. Oxf. Surv. Evol. Biol. 1:85–140.
Janzen, D. H. 1987. Insect diversity of a Costa Rican dry
forest: why keep it, and how? Biol. J. Linn. Soc. 30:343–356.
Kitching, R. L., A. G. Orr, L. Thalib, H. Mitchell, M. S.
Hopkins, and A. W. Graham. 2000. Moth assemblages as
indicators of environmental quality in remnants of upland
Australian rain forest. J. Appl. Ecol. 37:284–297.
Kremen, C., R. K. Colwell, T. L. Erwin, D. D. Murphy, R. F.
Noss, and M. A. Sanjayan. 1993. Terrestrial arthropod
assemblages: their use in conservation planning. Conserv.
Biol. 7:796–808.
Kremen, C., N. M. Williams, M. A. Aizen, B. Gemmill-Herren,
G. LeBuhn, R. Minckley, et al. 2007. Pollination and other
ecosystem services produced by mobile organisms: a
conceptual framework for the effects of land-use change.
Ecol. Lett. 10:299–314.Kuussaari, M., R. Bommarco, R. K. Heikkinen, A. Helm, J.
Krauss, R. Lindborg, et al. 2009. Extinction debt: a challenge
for biodiversity conservation. Trends Ecol. Evol. 24:564–571.
Landau, D., D. Prowell, and C. E. Carlton. 1999. Intensive
versus long-term sampling to assess lepidopteran diversity in
a southern mixed mesophytic forest. Ann. Entomol. Soc.
Am. 92:435–441.Lewinsohn, T. M., A. V. L. Freitas, and P. I. Prado. 2005.
Conservation of terrestrial invertebrates and their habitats in
Brazil. Conserv. Biol. 19:640–645.
Magurran, A. E.. 2004. Measuring biological diversity.
Blackwell Publishing, Oxford, UK.
Magurran, A. E., S. R. Baillie, S. T. Buckland, J. M. Dick, E.
M. Scott, R. I. Smith, et al. 2010. Long-term datasets in
biodiversity research and monitoring: assessing change in
ecological communities through time. Trends Ecol. Evol.,
25:574–582.Michaelsen, F. C. J., and M. Marshall. 2012. Mapping recent
decadal climate variations in precipitation and temperature
across eastern Africa and the Sahel, chap. 14 of Remote
Sensing of Drought: Innovative Monitoring Approaches.
ftp://chg.geog. ucsb.edu/pub/pubs/
mapping_decadal_variations.pdf.
Millennium Ecosystem Assessment. 2005. Ecosystems and
human well–being: biodiversity synthesis. World Resources
Institute, Washington.
Ministry of Water Lands and Environment. 2002. Department
of meteorology: “Uganda Initial National Communication
to the United Nations Framework Convention on Climate
Change”. Ministry of Water, Lands and Environment,
Kampala, Uganda.
Ministry of Water Lands and Environment. 2008. Mabira
forest management plan. Draft report Ministry of Water
Lands and Environment, Kampala, Uganda.
Muirhead-Thomson, R. C. 1991. Trap responses of flying
insects: the influence of trap design on capture efficiency.
Academic Press, London.
Nee, S., and R. M. May. 1992. Dynamics of metapopulations:
habitat destruction and competitive coexistence. J. Anim.
Ecol. 61:37–40.Nichols, E., T. Larsen, S. Spector, A. L. Davis, F. Escobar,
M. Favila, et al. 2007. Global dung beetle response to
tropical forest modification and fragmentation: a
quantitative literature review and meta-analysis. Biol.
Conserv. 137:1–19.
Obua, J., J. G. Agea, and J. J. Ogwal. 2010. Status of forests in
Uganda. Afr. J. Ecol. 48:853–859.
Ockinger, E., O. Schweiger, T. O. Crist, D. M. Debinski, J.
Krauss, M. Kuussaari, et al. 2010. Life-history traits predict
species responses to habitat area and isolation – A cross
continental synthesis. Ecol. Lett. 13:969–979.
Omeja, P., J. Obua, and A. B. Cunningham. 2005. Demand
and Supply of Wood for Drum Making in central Uganda.
Int. Forest Rev. 7:21–26.Perfecto, I., and J. Vandermeer. 2002. Quality of
Agroecological Matrix in a Tropical Montane Landscape:
ants in Coffee Plantations in Southern Mexico. Conserv.
Biol. 16:174–182.Pimm, S. L., J. Diamond, T. M. Reed, G. J. Russell, and J.
Verner. 1993. Times to extinction for small populations of
large birds. Proc. Natl Acad. Sci. 90:10871–10875.Pinhey, E. C. G. 1972. Emperor moths of South and South-
Central Africa. C. Struik, Cape Town, South Africa.
Price, P. W., I. R. Diniz, H. C. Morais, and E. S. A. Marques.
1995. The abundance of insect herbivore species in the
tropics: the high local richness of rare species. Biotropica
27:468–478.Prugh, L. R., K. E. Hodges, A. R. E. Sinclair, and J. S.
Brashares. 2008. Effect of habitat area and isolation on
fragmented animal populations. Proc. Natl Acad. Sci.
105:20770–20775.R Development Core Team. 2013. R: A language and
environment for statistical computing. R Foundation for
Statistical Computing, Vienna, Austria.
ª 2015 The Authors. Ecology and Evolution published by John Wiley & Sons Ltd. 11
P. Akite et al. Moths in Protected Forests of Uganda
Page 12
Ricketts, T. H. 2001. The matrix matters: effective isolation in
fragmented landscapes. Am. Nat. 158:87–99.
Sala, O. E., F. S. III Chapin, J. J. Armesto, E. Berlow, J.
Bloomfield, R. Dirzo, et al. 2000. Global biodiversity scenarios
for the year 2100. Science 287:1770–1774.Saunders, D. A., R. J. Hobbs, and C. R. Margules. 1991.
Biological consequences of ecosystem fragmentation: a
review. Conserv. Biol. 5:18–32.Schulze, C. H., and K. Fiedler. 2003. Vertical and temporal
diversity of a species rich moth taxon in Borneo. Pp. 69–85 inV. N. Y. Basset, S. Miller and R. L. Kitching, eds. Arthropods
of tropical forests: spatio-temporal dynamics and resource use
in the canopy. Cambridge University Press, UK.
Summerville, K. S., and T. O. Crist. 2005. Temporal patterns
of species accumulation in a survey of Lepidoptera in a
beech-maple forest. Biodivers. Conserv. 14:3393–3406.Summerville, K. S., L. M. Ritter, and T. O. Crist. 2004. Forest
moth taxa as indicators of lepidopteran richness and habitat
disturbance: a preliminary assessment. Biol. Conserv. 116:9–18.
Thomas, J. A., M. G. Telfer, D. B. Roy, C. D. Preston, J. J. D.
GreenwooD, J. Asher, et al. 2004. Comparative losses of
British butterflies, birds, and plants and the global
extinction crisis. Science 303:1879–1881.
Turner, M. G., S. T. Collins, A. E. Lugo, J. J. Magnuson, T. S.
Rupp, and F. J. Swanson. 2003. Disturbance dynamics and
ecological response: the contribution of long-term ecological
research. Bioscience 53:46–56.
Usher, M. B., and S. W. J. Keiller. 1998. The macrolepidoptera
of farm woodlands: determinants of diversity and
community structure. Biodivers. Conserv. 7:725–748.Vandermeer, J., and R. Carvajal. 2001. Metapopulation
dynamics and the quality of the matrix. Am. Nat. 158:211–
220.
Were, L. M., 2010. Population structure of drum making tree
species: The population structure of drum making tree
species: A case study of Mpanga Forest Reserve, VDM
publishing, Uganda. pp 52.
Williams, A. P., and C. Funk. 2011. A westward extension of
the warm pool leads to a westward extension of the
Walker circulation, drying eastern Africa. Clim. Dyn.
37:2417–2435.Williams, N. M., E. E. Crone, T. A. H. Roulston, R. L.
Minckley, L. Packer, and S. G. Potts. 2010. Ecological and
life-history traits predict bee species responses to
environmental disturbances. Biol. Conserv. 143:2280–2291.Winterbottom, B., and G. Eilu, 2006. Uganda biodiversity and
tropical forest assessment. Final report. http://
www.vub.ac.be/klimostoolkit/sites/default/files/documents/
uganda_biodiversity_assessment_usaid.pdf.
12 ª 2015 The Authors. Ecology and Evolution published by John Wiley & Sons Ltd.
Moths in Protected Forests of Uganda P. Akite et al.