Supporting Information Reddy et al. 10.1073/pnas.1101242108 SI Text Background on Isobaric Gas-Tight (IGT) Samplers. Fig. S1A shows a photograph of an IGTsampler, which is constructed of chemically inert titanium and designed for gas-tight collection of fluids at pressures to 450 bar and temperatures in excess of 400 °C (1). A thermocouple attached to the snorkel inlet allows real-time monitoring of fluid temperature. The sampler is 45-cm long with- out the snorkel and weighs 15 kg in air and 8.4 kg in seawater. Filling the 150-mL sample volume requires approximately 90 s. Real-time communication is accomplished through an inductively coupled link (2). Recovery of Gas and Oil from the IGTs. Fig. S1B shows a schematic of the system used to collect and separate the gas and oil from the IGTs. The sampler content was expelled into the separation reservoir where degassing of liquid oil and water occurred. Oil and water remained in the separation reservoir while the gas was diverted into submerged 10-LTedlar bags. As the Tedlar bag inflated, water was displaced from the tank and collected in a graduated cylinder. The gas-to-oil ratio (GOR) was calculated from the volume of gas (corrected for the hydrostatic head of the displacement tank) and oil collected. The uncertainty of the measurement is 2%. Because each sampler required more than one Tedlar bag to collect all of the gas released during the separation step, the Tedlar bags for a given sampler were attached to a custom- made stainless steel manifold to chemically and isotopically equilibrate the bags, eliminating any fractionation effects that may have occurred during depressurization and withdrawal. Results from MW-1 and MW-2 Gas and Oil Analysis. We characterized the gas and oil in MW-1 and MW-2 with numerous techniques (Table S1). Here, we discuss what was analyzed and how it was analyzed. If not presented elsewhere, we comment on the results. We considered three categories: bulk, compound class, and molecular-level. For some of these categories, stable carbon and hydrogen isotope measurements were performed. I. Bulk. i. Density was measured directly on the oil fraction at 22 °C, and the American Petroleum Institute (API) gravity was estimated from the density. ii. Analysis of the oil fraction for carbon, hydrogen, nitrogen, and sulfur content was performed by Midwest Microlabs, Inc. iii. Percent saturated and aromatic hydrocarbons from n-C 5þ was calculated by combining results of GC–flame ionization detec- tion (FID) (n-C 5 to n-C 10 ) and GC×GC-FID for n-C 10þ (Figs. S2 and S3)(3). Polar hydrocarbon content was deter- mined from the analysis of the oil by GeoMark Research, Inc., for the C 15þ fraction and normalized to the whole oil based on GC analysis, GC×GC analysis, and high-temperature simu- lated distillation. The isotopic composition of the saturated and aromatic hydrocarbons for n-C 15þ was performed by Geo- Mark Research, Inc. High-temperature simulated distillation by GC was performed on the GC-amenable fraction of the MW-1 oil. This analysis revealed that, on a nonpolar capillary column, 15, 25, 50, and 75% of the mass elutes before the n-C 9 , n-C 11 , n-C 18 , and n-C 30 saturated alkanes, respectively (Triton Analytics). II. Compound class. i. Compound class abundance was calculated from GC-FID and GC×GC-FID analyses. GC-FID data was used for the carbon range up to n-C 10 . Using appropriate first- and second-dimen- sion constraints for each compound class, GC×GC-FID was used to calculate compound class abundance for the n-C 10 to n-C 38 elution window (3). III. Molecular-level. i. The analyses of gas released from the IGTs and their carbon isotope values were performed by Isotech Laboratories. Hydrogen isotope analysis was done at the Woods Hole Oceanographic Institution (WHOI). Butanes and pentanes were observed in both the gas and oil fractions of MW-1 and MW-2. Isotope values for butanes and pentanes were measured in the gas fraction only. ii. Individual compounds in the oil were measured by GC-FID, GC-MS, GC×GC-FID, and comprehensive two-dimensional gas chromatography with time-of-flight mass spectrometry (GC×GC-MS) (Table S2) (4–6). The analyses described above indicate the oil was light (40° API), sweet (<0.5% sulfur), with a high saturated hydrocarbon content (Table 1 and Table S1). There is no evidence of biode- gradation based on the high abundance of n-alkanes (Figs. S2 and S3; Tables S1 and S2). Contamination Avoidance Program for Water Sampling on the Research Vessel (R/V) Endeavor Cruise 478 (June 2010). Because oil was frequently on the sea surface during this cruise, we developed a comprehensive contamination avoidance program. Our goals were to (i) minimize any oil contact with sampling equipment, the vessel, or personnel; (ii) isolate areas of high probability of oiling; and (iii) decontaminate immediately. These steps included segregating the deck of the research vessel into “hot,”“warm,” and “cold” zones, which demanded redirecting the foot traffic of the vessel. The hot zone was limited to only several members of the science crew where contact with oil was highest, mainly when deploying and recovering sampling gear. The warm zone was a transition zone where boots and other gear used in the hot zone stayed behind and were exchanged for “clean” footwear. The cold zone was the rest of the vessel. High traffic areas of the deck were covered with sorbent padding, which was replaced one to two times a day. Gloves, sorbent pads, and other potentially contaminated materials were placed in special disposal barrels. Routine water sampling followed a standard protocol. First, we used Go-Flo bottles, which employ a unique design intended to reduce contamination from surface oil by opening hydrostatically beneath the sea surface. They are deployed in a “closed” position and are set to “open” by hydrostatic release at 10-m depth. Before this cruise, we reconditioned 12 Go-Flos by reducing any materi- als that would either contribute petroleum hydrocarbons or other organic compounds as well as sorb hydrocarbons. For example, we coated the inside of each bottle with a Teflon spray. Before deployment and recovery of the rosette, the sea surface was “cleaned” with Dawn dish detergent with a garden hose via an aspirator. Once the water samples were collected, they were passed hand-to-hand from the hot zone through a passageway to a warm zone. The Go-Flo bottles and the rest of the rosette were vigorously scrubbed with a solution of Dawn and then rinsed with fresh water. Reddy et al. www.pnas.org/cgi/doi/10.1073/pnas.1101242108 1 of 9
Transcript
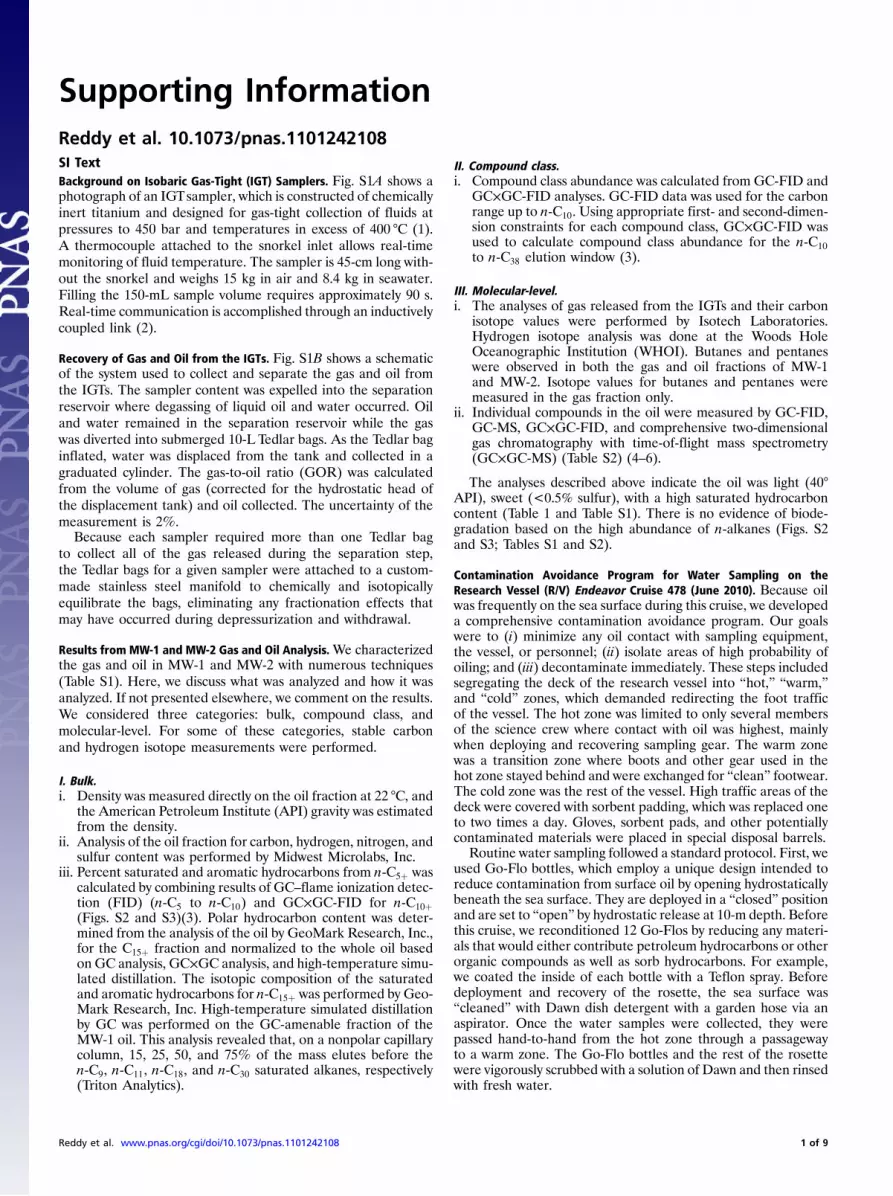
Supporting InformationReddy et al. 10.1073/pnas.1101242108SI TextBackground on Isobaric Gas-Tight (IGT) Samplers. Fig. S1A shows aphotograph of an IGTsampler, which is constructed of chemicallyinert titanium and designed for gas-tight collection of fluids atpressures to 450 bar and temperatures in excess of 400 °C (1).A thermocouple attached to the snorkel inlet allows real-timemonitoring of fluid temperature. The sampler is 45-cm long with-out the snorkel and weighs 15 kg in air and 8.4 kg in seawater.Filling the 150-mL sample volume requires approximately 90 s.Real-time communication is accomplished through an inductivelycoupled link (2).
Recovery of Gas and Oil from the IGTs. Fig. S1B shows a schematicof the system used to collect and separate the gas and oil fromthe IGTs. The sampler content was expelled into the separationreservoir where degassing of liquid oil and water occurred. Oiland water remained in the separation reservoir while the gaswas diverted into submerged 10-L Tedlar bags. As the Tedlar baginflated, water was displaced from the tank and collected in agraduated cylinder. The gas-to-oil ratio (GOR) was calculatedfrom the volume of gas (corrected for the hydrostatic head ofthe displacement tank) and oil collected. The uncertainty of themeasurement is 2%.
Because each sampler required more than one Tedlar bagto collect all of the gas released during the separation step,the Tedlar bags for a given sampler were attached to a custom-made stainless steel manifold to chemically and isotopicallyequilibrate the bags, eliminating any fractionation effects thatmay have occurred during depressurization and withdrawal.
Results from MW-1 and MW-2 Gas and Oil Analysis.We characterizedthe gas and oil in MW-1 and MW-2 with numerous techniques(Table S1). Here, we discuss what was analyzed and how it wasanalyzed. If not presented elsewhere, we comment on the results.We considered three categories: bulk, compound class, andmolecular-level. For some of these categories, stable carbonand hydrogen isotope measurements were performed.
I. Bulk.i. Density was measured directly on the oil fraction at 22 °C, and
the American Petroleum Institute (API) gravity was estimatedfrom the density.
ii. Analysis of the oil fraction for carbon, hydrogen, nitrogen, andsulfur content was performed by Midwest Microlabs, Inc.
iii. Percent saturated and aromatic hydrocarbons from n-C5þ wascalculated by combining results of GC–flame ionization detec-tion (FID) (n-C5 to n-C10) and GC×GC-FID for n-C10þ(Figs. S2 and S3)(3). Polar hydrocarbon content was deter-mined from the analysis of the oil by GeoMark Research, Inc.,for the C15þ fraction and normalized to the whole oil basedon GC analysis, GC×GC analysis, and high-temperature simu-lated distillation. The isotopic composition of the saturatedand aromatic hydrocarbons for n-C15þ was performed by Geo-Mark Research, Inc. High-temperature simulated distillationby GC was performed on the GC-amenable fraction of theMW-1 oil. This analysis revealed that, on a nonpolar capillarycolumn, 15, 25, 50, and 75% of the mass elutes before then-C9, n-C11, n-C18, and n-C30 saturated alkanes, respectively(Triton Analytics).
II. Compound class.i. Compound class abundance was calculated from GC-FID and
GC×GC-FID analyses. GC-FID data was used for the carbonrange up to n-C10. Using appropriate first- and second-dimen-sion constraints for each compound class, GC×GC-FID wasused to calculate compound class abundance for the n-C10
to n-C38 elution window (3).
III. Molecular-level.i. The analyses of gas released from the IGTs and their carbon
isotope values were performed by Isotech Laboratories.Hydrogen isotope analysis was done at the Woods HoleOceanographic Institution (WHOI). Butanes and pentaneswere observed in both the gas and oil fractions of MW-1and MW-2. Isotope values for butanes and pentanes weremeasured in the gas fraction only.
ii. Individual compounds in the oil were measured by GC-FID,GC-MS, GC×GC-FID, and comprehensive two-dimensionalgas chromatography with time-of-flight mass spectrometry(GC×GC-MS) (Table S2) (4–6).
The analyses described above indicate the oil was light (40°API), sweet (<0.5% sulfur), with a high saturated hydrocarboncontent (Table 1 and Table S1). There is no evidence of biode-gradation based on the high abundance of n-alkanes (Figs. S2and S3; Tables S1 and S2).
Contamination Avoidance Program for Water Sampling on theResearch Vessel (R/V) Endeavor Cruise 478 (June 2010). Because oilwas frequently on the sea surface during this cruise, we developeda comprehensive contamination avoidance program. Our goalswere to (i) minimize any oil contact with sampling equipment,the vessel, or personnel; (ii) isolate areas of high probability ofoiling; and (iii) decontaminate immediately. These steps includedsegregating the deck of the research vessel into “hot,” “warm,”and “cold” zones, which demanded redirecting the foot trafficof the vessel. The hot zone was limited to only several membersof the science crew where contact with oil was highest, mainlywhen deploying and recovering sampling gear. The warm zonewas a transition zone where boots and other gear used in thehot zone stayed behind and were exchanged for “clean” footwear.The cold zone was the rest of the vessel. High traffic areas of thedeck were covered with sorbent padding, which was replaced oneto two times a day. Gloves, sorbent pads, and other potentiallycontaminated materials were placed in special disposal barrels.
Routine water sampling followed a standard protocol. First, weused Go-Flo bottles, which employ a unique design intended toreduce contamination from surface oil by opening hydrostaticallybeneath the sea surface. They are deployed in a “closed” positionand are set to “open” by hydrostatic release at 10-m depth. Beforethis cruise, we reconditioned 12 Go-Flos by reducing any materi-als that would either contribute petroleum hydrocarbons or otherorganic compounds as well as sorb hydrocarbons. For example,we coated the inside of each bottle with a Teflon spray. Beforedeployment and recovery of the rosette, the sea surface was“cleaned” with Dawn dish detergent with a garden hose via anaspirator. Once the water samples were collected, they werepassed hand-to-hand from the hot zone through a passagewayto a warm zone. The Go-Flo bottles and the rest of the rosettewere vigorously scrubbed with a solution of Dawn and then rinsedwith fresh water.
Reddy et al. www.pnas.org/cgi/doi/10.1073/pnas.1101242108 1 of 9
Several times on the cruise after cleaning the Go-Flo bottles,10 L of deionized water were poured into a randomly selectedbottle. After ten minutes, water blanks were collected for volatileand semivolatile organic compound analysis. The bottle was thencleaned again before deployment.
Aqueous Solubility. “Aqueous solubility” refers to the subcooledliquid aqueous solubility, Saqi (mol L−1). This is the aqueoussolubility of a hypothetical pure liquid of solute i, which is distinctfrom the real solubility if the system is a solid at the temperatureof interest. Hydrocarbons are expected to partition from theliquid oil phase into the aqueous phase according to theirsubcooled liquid aqueous solubilities multiplied by their molefraction in the oil phase, assuming Raoult’s law (7).
Approximate solubility values for methane, ethane, and pro-pane at 5 °C and 100 bar were interpolated from measuredmethane, ethane, and butane solubilities reported by Dhimaet al. (8) and Kim et al. (9) at varying temperatures and pressures.Solubility values for benzene, toluene, xylenes, n-propylbenzene,
trimethylbenzenes, naphthalene, C1-naphthalenes, fluorene, phe-nanthrene, pyrene, fluoranthene, benz[a]anthracene were takenfrom previously published compilations of (subcooled) liquidaqueous solubility at 25 °C and 1 bar (7, 10). Solubility valuesfor the remaining compounds were estimated based on the knownvalues of analogous compounds modified by fragment contribu-tions reported by Myrdal et al. (11). Aqueous solubility values forbenzene and larger hydrocarbons were assumed to be negligiblyaffected by the high pressures (100–150 bar) of the deep watercolumn, based on the findings of Sawamura et al. (12); hence,solubility data measured at 1 bar were used for these compounds.Additionally, aqueous solubility values for benzene and largerhydrocarbons were not adjusted to ambient temperature (5 °C),because the relevant physical property data are not available formost compounds and because this is considered likely to be asmall correction. Aqueous solubility values were not correctedfor salinity, which was considered a small adjustment that wouldaffect all hydrocarbon compounds similarly (7).
1. Seewald JS, Doherty KW, Hammar TR, Liberatore SP (2002) A new gas-tight isobaricsampler for hydrothermal fluids. Deep-Sea Res Part I 49:189–196.
2. Bradley AM, Tivey MK, Liberatore SP, Duester AR (1995) Development and testingof thermocouple/thermistor array packages formonitoring temperature at hydrother-mal vent sites. EOS 76: F4211.
3. Ventura GT, Raghuraman B, Mullins OC, Nelson RK, Reddy CM (2010) Chemicalcompound class oil fingerprinting techniques using comprehensive two-dimensionalgas chromatography (GC×GC). Org Geochem 41:1026–1035.
4. Nelson RK, et al. (2006) Tracking the weathering of an oil spill with comprehensivetwo-dimensional gas chromatography. Environ Forensics 7:33–44.
5. Farwell C, et al. (2009) Weathering and the fallout plume of heavy oil from strongpetroleum seeps near Coal Oil Point, CA. Environ Sci Technol 43:3542–3548.
6. Lemkau KL, et al. (2010) The M/V Cosco Busan Spill: Source identification andshort-term fate. Mar Pollut Bull 60:2123–2129.
8. Dhima A, de Hemptinne JC, Moracchini G (1998) Solubility of light hydrocarbonsand their mixtures in pure water under high pressure. Fluid Phase Equilib 145:129–150.
9. Kim YS, Ryu SK, Yang SO, Lee CS (2003) Liquid water-hydrate equilibrium measure-ments and unified predictions of hydrate-containing phase equilibria for methane,ethane, propane, and their mixtures. Ind Eng Chem Res 42:2409–2414.
10. Arey JS, Nelson RK, Xu L, Reddy CM (2005) Using comprehensive two-dimensional gaschromatography retention indices to estimate environmental partitioning propertiesfor a complete set of diesel fuel hydrocarbons. Anal Chem 77: 7172–7182.
11. Myrdal PB, Manka AM, Yalkowsky SH (1995) AQUAFAC 3: Aqueous functional groupactivity coefficients; application to the estimation of aqueous solubility. Chemosphere30:1619–1637.
12. Sawamura S, Kitamura K, and Taniguchi Y (1989) Effect of pressure on the solubilitiesof benzene and alkylbenzenes in water. J Phys Chem93:4931–4935.
Fig. S1. Images of (A) IGT sampler and (B) schematic of system used to collect and separate the contents of the IGTs.
Reddy et al. www.pnas.org/cgi/doi/10.1073/pnas.1101242108 2 of 9
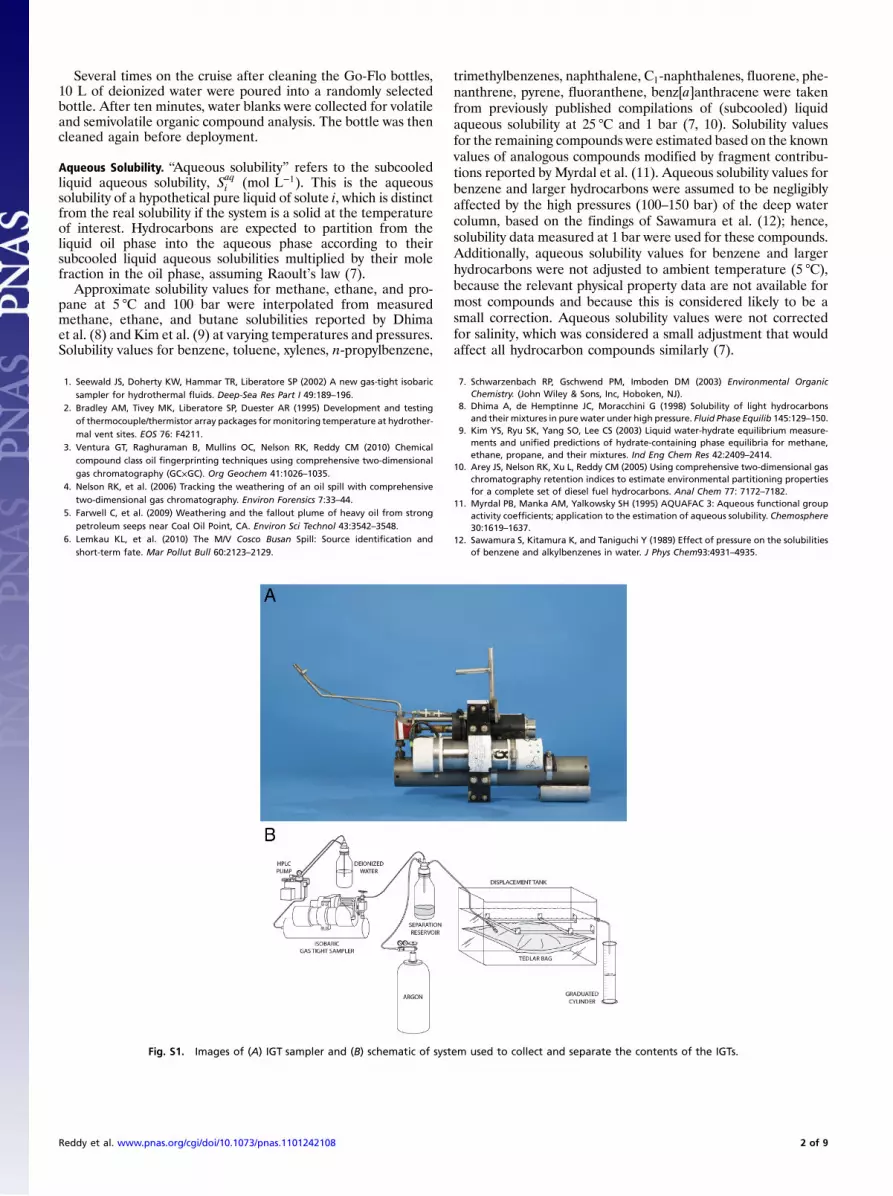
Fig. S2. GC-FID chromatogram of the oil fraction from MW-1. On the x axis, time has been converted to n-alkane carbon number. Compounds identifiedinclude benzene, toluene, ethylbenzene, as well as m-, p-, and o-xylenes.
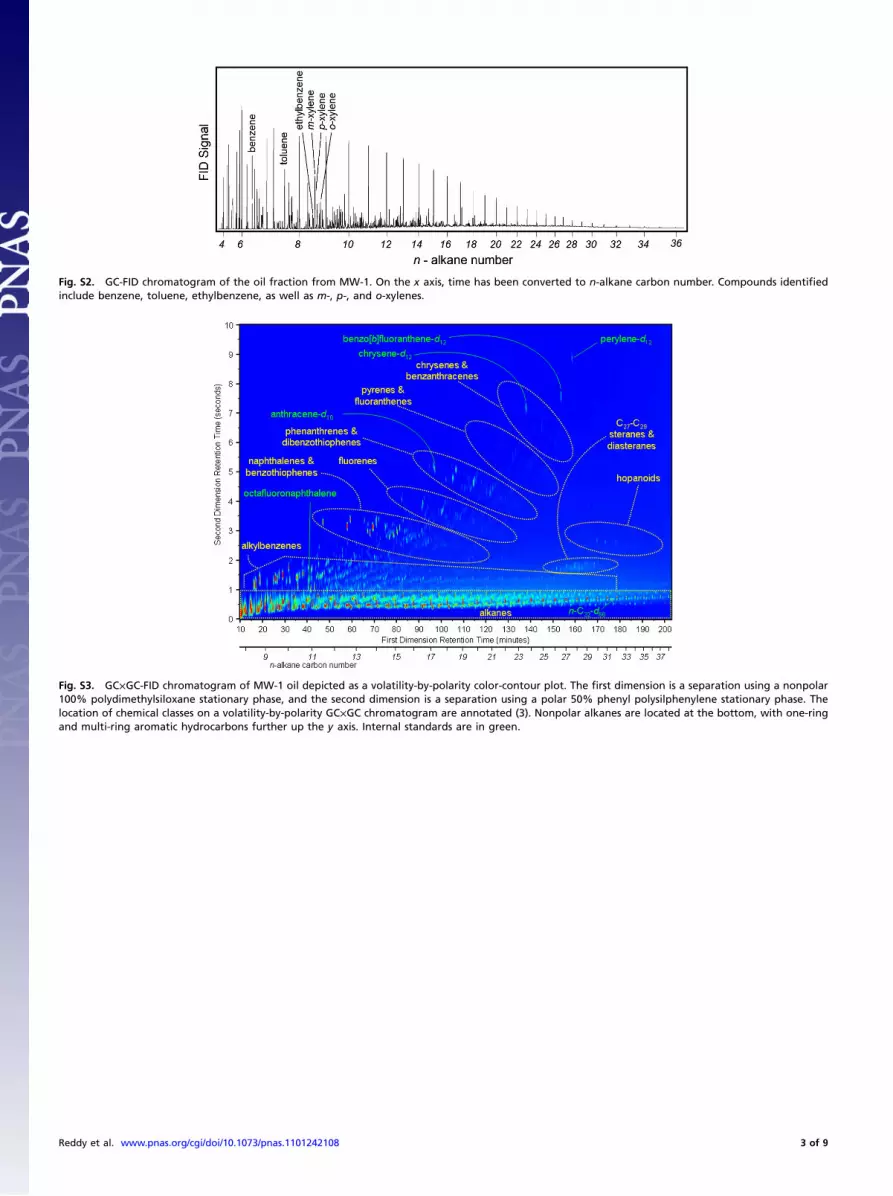
Fig. S3. GC×GC-FID chromatogram of MW-1 oil depicted as a volatility-by-polarity color-contour plot. The first dimension is a separation using a nonpolar100% polydimethylsiloxane stationary phase, and the second dimension is a separation using a polar 50% phenyl polysilphenylene stationary phase. Thelocation of chemical classes on a volatility-by-polarity GC×GC chromatogram are annotated (3). Nonpolar alkanes are located at the bottom, with one-ringand multi-ring aromatic hydrocarbons further up the y axis. Internal standards are in green.
Reddy et al. www.pnas.org/cgi/doi/10.1073/pnas.1101242108 3 of 9
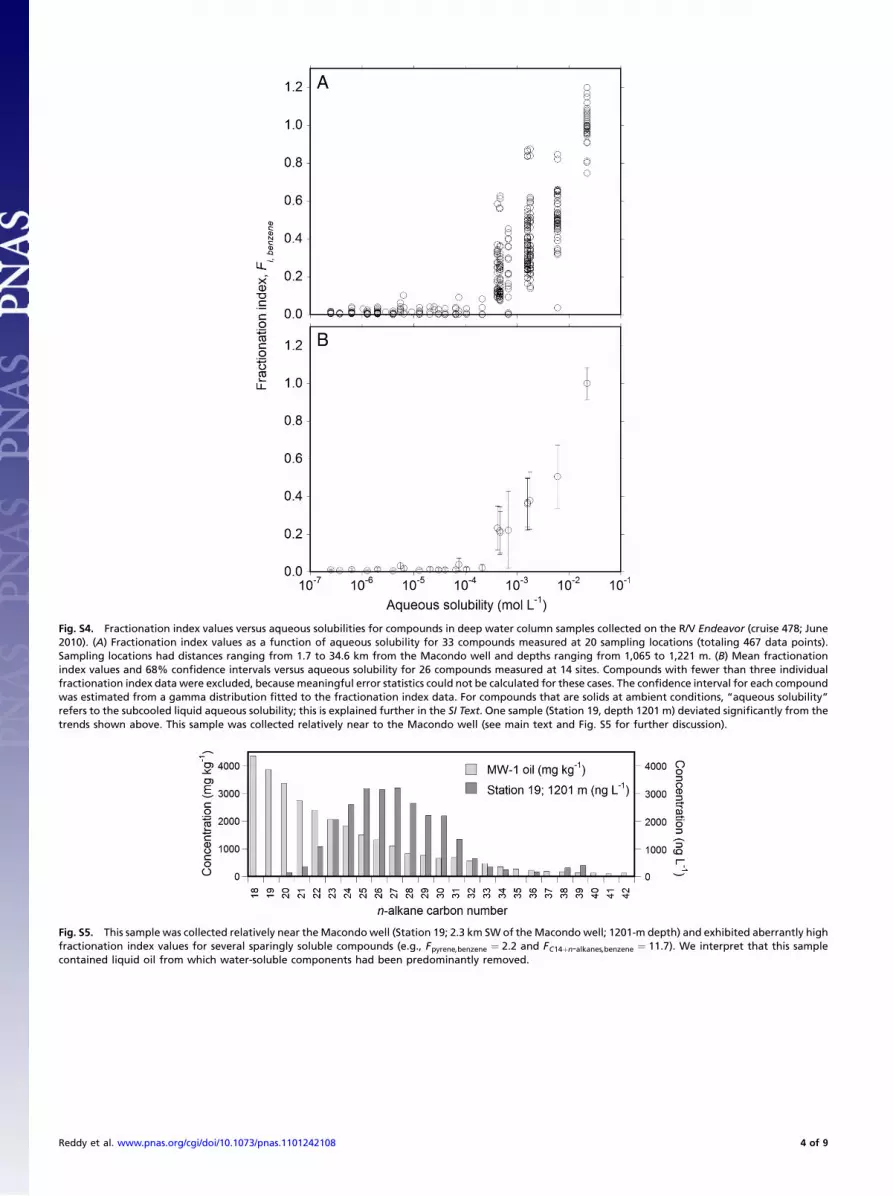
Fig. S4. Fractionation index values versus aqueous solubilities for compounds in deep water column samples collected on the R/V Endeavor (cruise 478; June2010). (A) Fractionation index values as a function of aqueous solubility for 33 compounds measured at 20 sampling locations (totaling 467 data points).Sampling locations had distances ranging from 1.7 to 34.6 km from the Macondo well and depths ranging from 1,065 to 1,221 m. (B) Mean fractionationindex values and 68% confidence intervals versus aqueous solubility for 26 compounds measured at 14 sites. Compounds with fewer than three individualfractionation index data were excluded, because meaningful error statistics could not be calculated for these cases. The confidence interval for each compoundwas estimated from a gamma distribution fitted to the fractionation index data. For compounds that are solids at ambient conditions, “aqueous solubility”refers to the subcooled liquid aqueous solubility; this is explained further in the SI Text. One sample (Station 19, depth 1201 m) deviated significantly from thetrends shown above. This sample was collected relatively near to the Macondo well (see main text and Fig. S5 for further discussion).
Fig. S5. This sample was collected relatively near theMacondo well (Station 19; 2.3 km SWof the Macondo well; 1201-m depth) and exhibited aberrantly highfractionation index values for several sparingly soluble compounds (e.g., Fpyrene;benzene ¼ 2.2 and FC14þn-alkanes;benzene ¼ 11.7). We interpret that this samplecontained liquid oil from which water-soluble components had been predominantly removed.
Reddy et al. www.pnas.org/cgi/doi/10.1073/pnas.1101242108 4 of 9
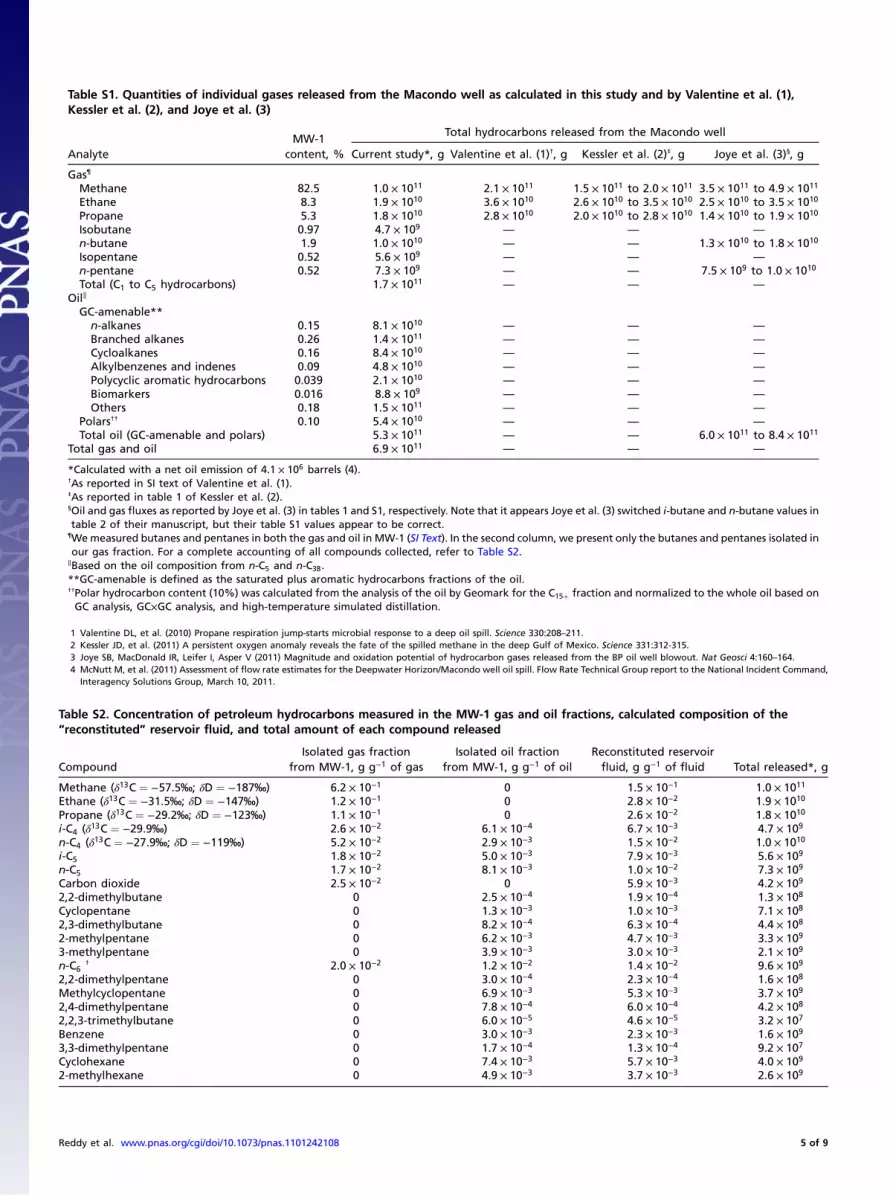
Table S1. Quantities of individual gases released from the Macondo well as calculated in this study and by Valentine et al. (1),Kessler et al. (2), and Joye et al. (3)
AnalyteMW-1
content, %
Total hydrocarbons released from the Macondo well
Current study*, g Valentine et al. (1)†, g Kessler et al. (2)‡, g Joye et al. (3)§, g
*Calculated with a net oil emission of 4.1 × 10⁶ barrels (4).†As reported in SI text of Valentine et al. (1).‡As reported in table 1 of Kessler et al. (2).§Oil and gas fluxes as reported by Joye et al. (3) in tables 1 and S1, respectively. Note that it appears Joye et al. (3) switched i-butane and n-butane values intable 2 of their manuscript, but their table S1 values appear to be correct.
¶We measured butanes and pentanes in both the gas and oil in MW-1 (SI Text). In the second column, we present only the butanes and pentanes isolated inour gas fraction. For a complete accounting of all compounds collected, refer to Table S2.
∥Based on the oil composition from n-C5 and n-C38.**GC-amenable is defined as the saturated plus aromatic hydrocarbons fractions of the oil.††Polar hydrocarbon content (10%) was calculated from the analysis of the oil by Geomark for the C15þ fraction and normalized to the whole oil based onGC analysis, GC×GC analysis, and high-temperature simulated distillation.
1 Valentine DL, et al. (2010) Propane respiration jump-starts microbial response to a deep oil spill. Science 330:208–211.2 Kessler JD, et al. (2011) A persistent oxygen anomaly reveals the fate of the spilled methane in the deep Gulf of Mexico. Science 331:312-315.3 Joye SB, MacDonald IR, Leifer I, Asper V (2011) Magnitude and oxidation potential of hydrocarbon gases released from the BP oil well blowout. Nat Geosci 4:160–164.4 McNutt M, et al. (2011) Assessment of flow rate estimates for the Deepwater Horizon/Macondo well oil spill. Flow Rate Technical Group report to the National Incident Command,
Interagency Solutions Group, March 10, 2011.
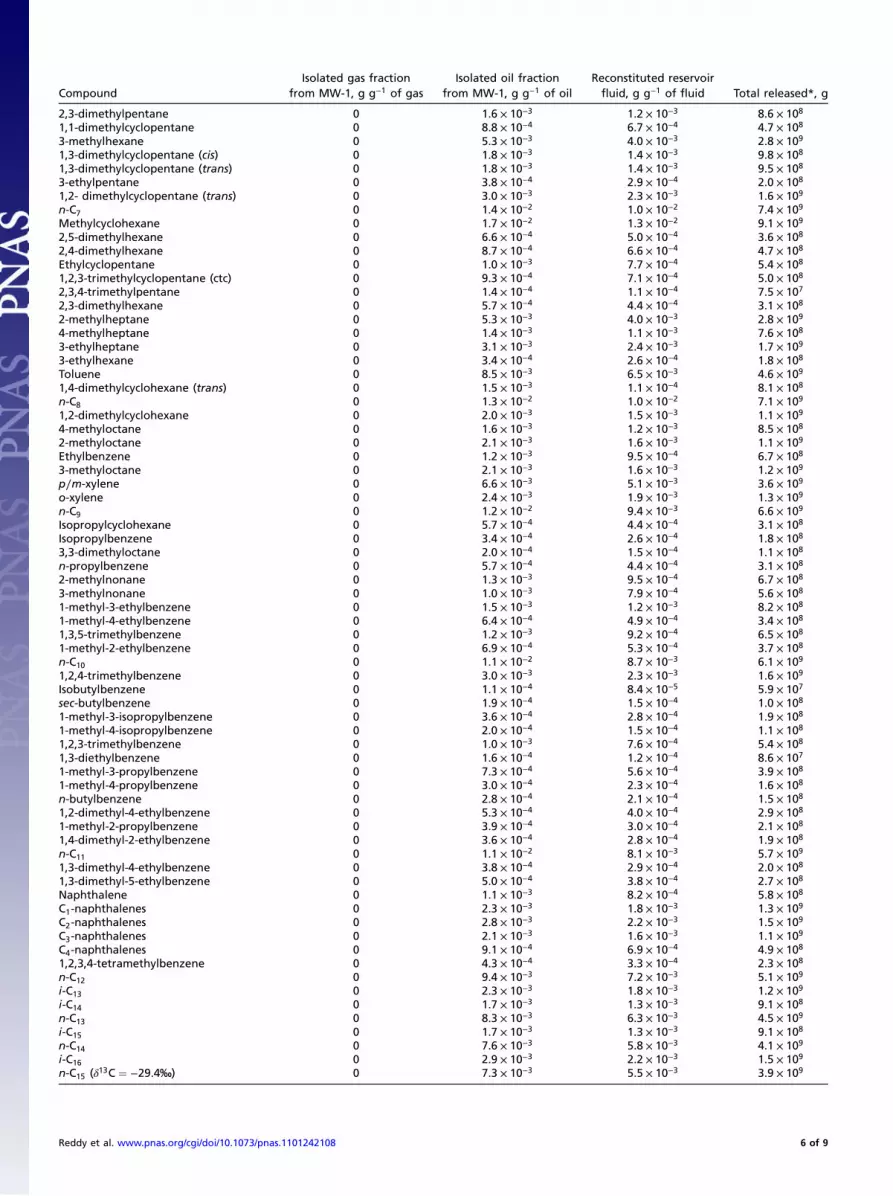
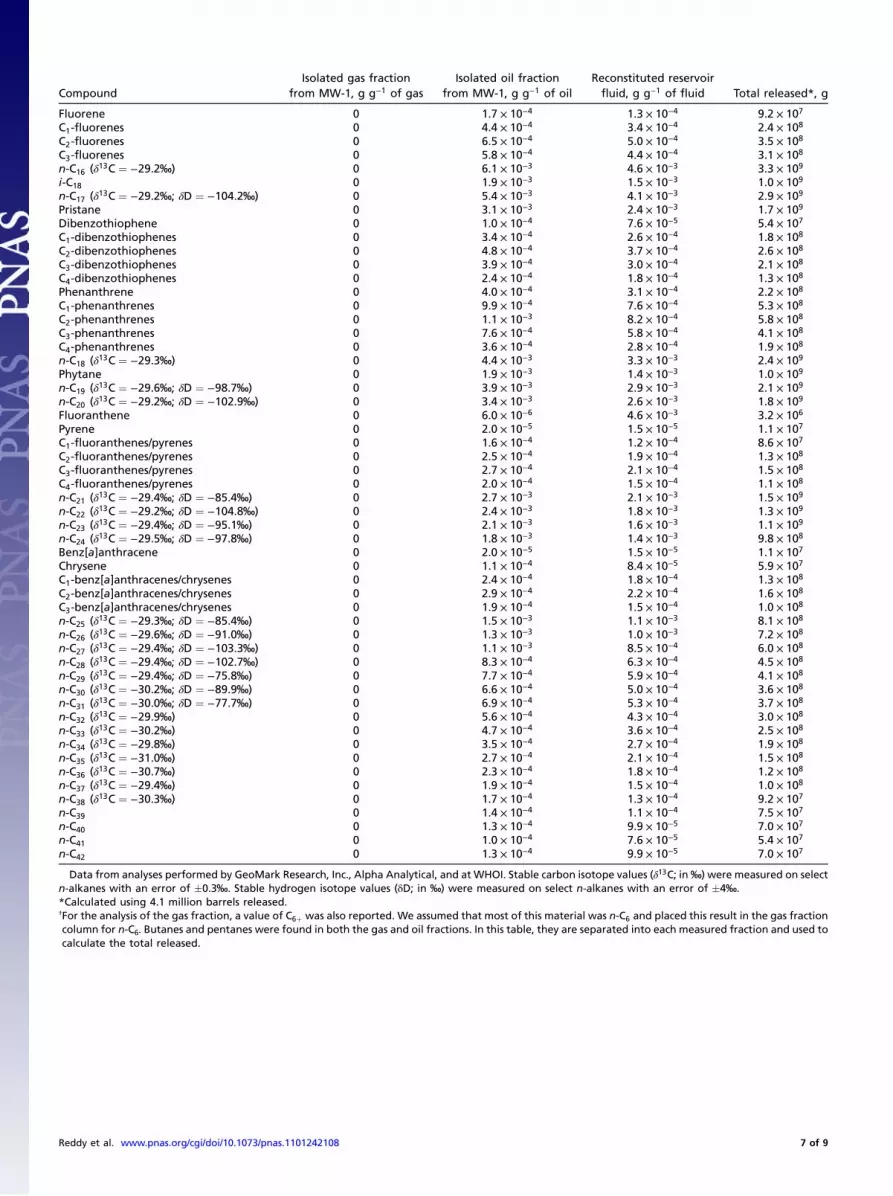
Table S2. Concentration of petroleum hydrocarbons measured in the MW-1 gas and oil fractions, calculated composition of the“reconstituted” reservoir fluid, and total amount of each compound released
CompoundIsolated gas fraction
from MW-1, g g−1 of gasIsolated oil fraction
from MW-1, g g−1 of oilReconstituted reservoirfluid, g g−1 of fluid Total released*, g
Data from analyses performed by GeoMark Research, Inc., Alpha Analytical, and at WHOI. Stable carbon isotope values (δ13C; in‰) were measured on selectn-alkanes with an error of �0.3‰. Stable hydrogen isotope values (δD; in ‰) were measured on select n-alkanes with an error of �4‰.*Calculated using 4.1 million barrels released.†For the analysis of the gas fraction, a value of C6þ was also reported. We assumed that most of this material was n-C6 and placed this result in the gas fractioncolumn for n-C6. Butanes and pentanes were found in both the gas and oil fractions. In this table, they are separated into each measured fraction and used tocalculate the total released.
Reddy et al. www.pnas.org/cgi/doi/10.1073/pnas.1101242108 7 of 9
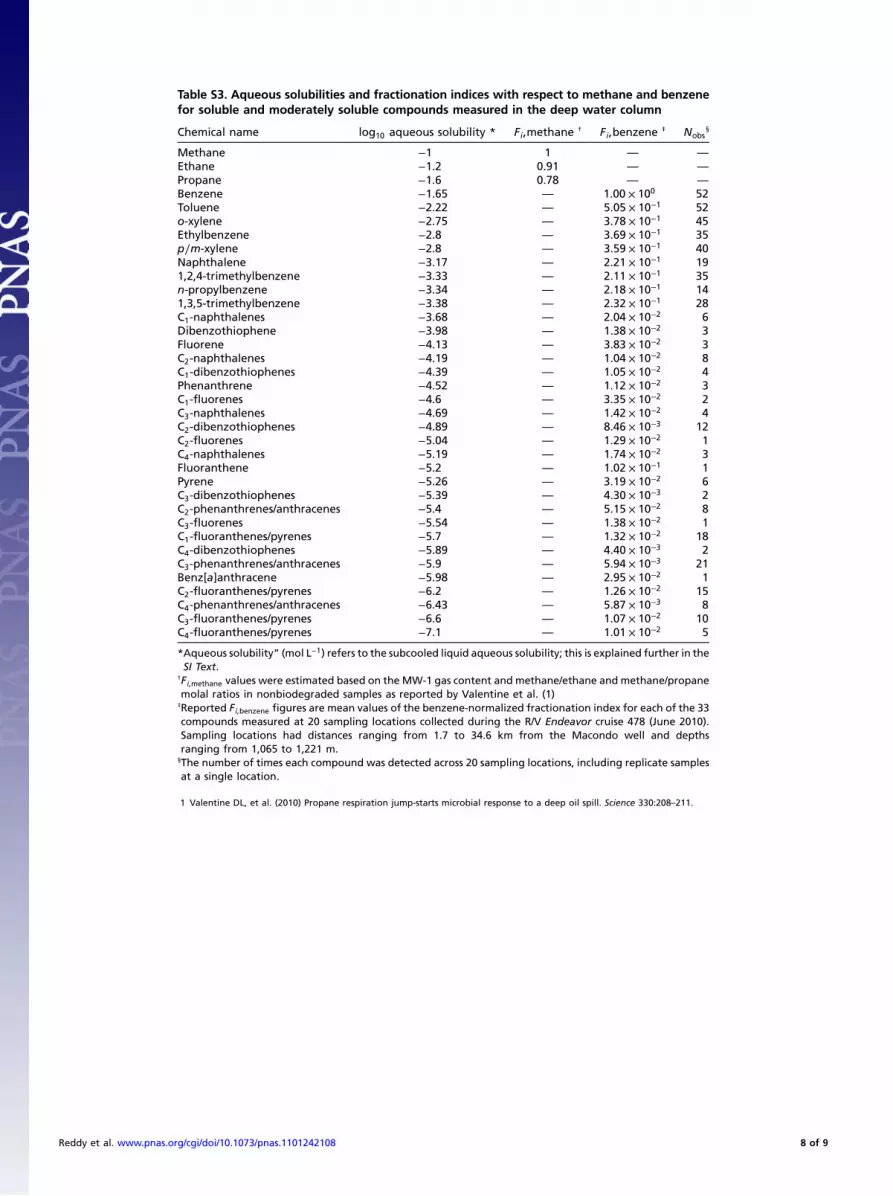
Table S3. Aqueous solubilities and fractionation indices with respect to methane and benzenefor soluble and moderately soluble compounds measured in the deep water column
Chemical name log10 aqueous solubility * Fi;methane † Fi;benzene‡ Nobs
*Aqueous solubility” (mol L−1) refers to the subcooled liquid aqueous solubility; this is explained further in theSI Text.
†Fi;methane values were estimated based on the MW-1 gas content and methane/ethane and methane/propanemolal ratios in nonbiodegraded samples as reported by Valentine et al. (1)
‡Reported Fi;benzene figures are mean values of the benzene-normalized fractionation index for each of the 33compounds measured at 20 sampling locations collected during the R/V Endeavor cruise 478 (June 2010).Sampling locations had distances ranging from 1.7 to 34.6 km from the Macondo well and depthsranging from 1,065 to 1,221 m.
§The number of times each compound was detected across 20 sampling locations, including replicate samplesat a single location.
1 Valentine DL, et al. (2010) Propane respiration jump-starts microbial response to a deep oil spill. Science 330:208–211.
Reddy et al. www.pnas.org/cgi/doi/10.1073/pnas.1101242108 8 of 9
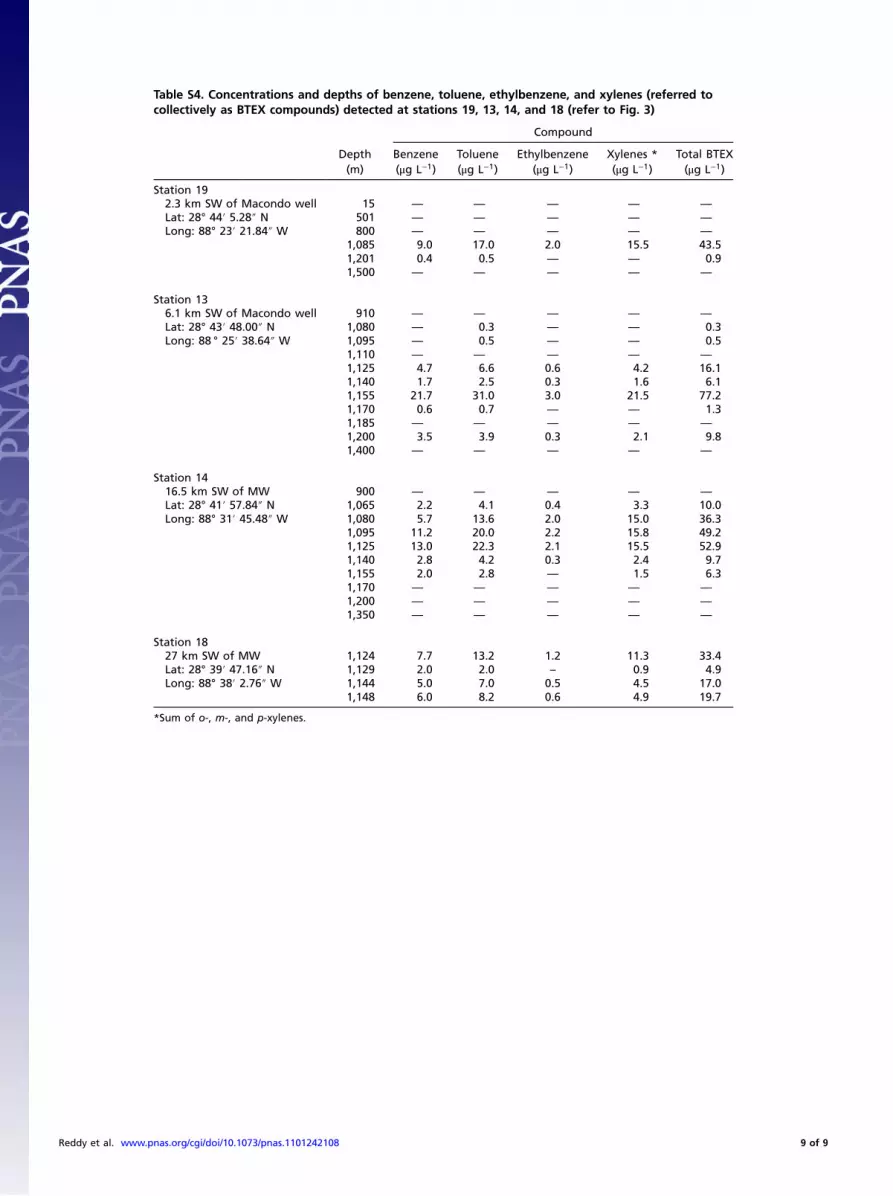
Table S4. Concentrations and depths of benzene, toluene, ethylbenzene, and xylenes (referred tocollectively as BTEX compounds) detected at stations 19, 13, 14, and 18 (refer to Fig. 3)


![[IJET-V2I3_1P5] Authors: DK Poorna Chandra, ST Aarthy M Vinay Kumar Reddy, C Harshavardhan Reddy](https://static.documents.page/doc/80x56/6360a9649998b8646c0eec77/ijet-v2i31p5-authors-dk-poorna-chandra-st-aarthy-m-vinay-kumar-reddy-c-harshavardhan.jpg)


