50
Victorian Community Profiles: 2016 Census Papua New Guinea-born
| Date post: | 28-Nov-2023 |
| Category: |
Documents |
| Upload: | khangminh22 |
| View: | 0 times |
| Download: | 0 times |
Victorian Community Profiles: 2016 Census
Papua New Guinea-born
CONTENTS
AcknowledgementsNotes on the data
Tables
1 Distribution within Australia of Papua New Guinea-born: 2016, 2011
2 Number of Papua New Guinea-born by Top Twenty Local Government Areas and their Major Suburbs, Victoria: 2016
3 Number of Papua New Guinea-born by Top Twenty Local Government Areas, Victoria: 2016, 2011
4 Year of Arrival of Papua New Guinea-born and Total Victorian Overseas-born: 2016
5 Year of Arrival by Top Twenty Local Government Areas, Papua New Guinea-born, Victoria: 2016
6 Age Groups of Papua New Guinea-born and the Total Victorian Population: 2016, 2011
7 Total Persons Identified with English Ancestry by Top Twenty Local Government Areas, Victoria: 2016, 2011
8 Country of Birth (Top Twenty plus Australia) of Persons of English Ancestry, Victoria: 2016, 2011
9 Languages Spoken at Home (Top Twenty), Papua New Guinea-born and the Total Victorian Population: 2016, 2011.
10 Languages Spoken at Home (Top 3) by Top Twenty Local Government Areas, Papua New Guinea-born, Victoria, 2016
11 Proficiency in Spoken English, Papua New Guinea-born, Victoria: 2016, 2011
12 Proficiency in Spoken English by Top Twenty Local Government Areas, Papua New Guinea-born, Victoria: 2016
13 Religious Affiliation (Top Twenty), Papua New Guinea-born and the Total Victorian Population: 2016, 2011
14 Religious Affiliation (Top Three) by Top Twenty Local Government Areas, Papua New Guinea-born, Victoria: 2016
15 Type of Internet Connection, Papua New Guinea-born and the Total Victorian Population: 2016, 2011
16 Type of Internet Connection by Top Ten Local Government Areas, Papua New Guinea-born, Victoria: 2016
17 Highest Level of Educational Attainment, Papua New Guinea-born and Total Victoria: 2016, 2011
18 Highest Level of Educational Attainment by Top Ten Local Government Areas, Papua New Guinea-born, Victoria: 2016
19 Labour Force Participation, Papua New Guinea-born and Total Victoria: 2016, 2011
20 Labour Force Participation by Top Ten Local Government Areas, Papua New Guinea-born, Victoria: 2016
21 Occupation of Papua New Guinea-born and Total Victoria: 2016, 2011
22 Occupation by Top Ten Local Government Areas, Papua New Guinea-born, Victoria: 2016
23 Industry of Employment, Papua New Guinea-born and Total Victoria: 2016, 2011
24 Industry of Employment by Top Ten Local Government Areas, Papua New Guinea-born, Victoria: 2016
25 Voluntary Work, Papua New Guinea-born and Total Victoria: 2016, 2011
26 Voluntary Work by Top Ten Local Government Areas, Papua New Guinea-born, Victoria: 2016
27 Total Personal Income (Weekly), Papua New Guinea-born and Total Victoria: 2016
28 Total Personal Income (Weekly) by Top Ten Local Government Areas, Papua New Guinea-born, Victoria: 2016
29 Housing Tenure Type, Papua New Guinea-born and the Total Victorian Population: 2016, 2011
30 Housing Tenure Type by Top Ten Local Government Areas, Papua New Guinea-born, Victoria: 2016
31 Family Composition, Papua New Guinea-born and the Total Victorian Population: 2016, 2011
32 Citizenship Status, Papua New Guinea-born and the Total Victorian Population: 2016
33 Citizenship Status by Top Ten Local Government Areas, Papua New Guinea-born: 2016, 2011
34 Core Activity Need for Assistance, Papua New Guinea-born and the Total Victorian Population: 2016, 2011
35 Core Activity Need for Assistance by Top Ten Local Government Areas, Papua New Guinea-born, Victoria: 2016
36 Usual Address Five Years Ago by Top Ten Local Government Areas, Papua New Guinea-born and Total Victoria: 2016
Figures and Maps
Figure 1 - Geographic Distribution of Papua New Guinea-born in Metropolitan Local Government Areas, Victoria: 2016
Figure 2 - Age and Gender Distribution of Papua New Guinea-born and of the Total Victorian Population: 2016, 2011(including tables on age in five year groups, and sex distribution, persons and percentage)
Map 1 - Victoria State, Local Government Areas and Regional Advisory Councils Regions, 2016
Map 2 - Metropolitan Melbourne, Local Government Areas and Regional Advisory Councils Regions, 2016
Acknowledgements
The Multicultural Affairs and Social Cohesion Division, Department of Premier and Cabinet, would like to acknowledge the valuable contribution made by the Australian Bureau of Statistics in the preparation of thisreport. The report is based on data from the 2016, 2011 and 2006 Census of Population and Housing. TheCensus provides the the Australian community, including planners and policy makers, with a detailed source of information about the composition of Australian society and how it has changed over time.
© The State of Victoria, Department of Premier and Cabinet 2018
ISBN 987-1-92551-84-6 Online (pdf)
Accessibility
Disclaimer
Source of data in this publication
Australian Bureau of Statistics, Census of Population and Housing, 2016, 2011 and 2006.
Images by: Artificial Studios (Jorge de Araugo)
This work is licensed under a Creative Commons Attribution 4.0 international licence. You are free to re-use the work under that licence, on the condition that you credit the State of Victoria (Department of Premier and Cabinet) as author. This license does not apply to any images or branding, including the Victorian Coat of Arms and the Victorian logo. To view a copy of this license, visit http: creativecommons.org/licenses/by/4.0/
If you would like to receive this publication in an alternative format, please email the Multicultural Affairs and Social Cohesion Division, Department of Premier and Cabinet, on [email protected]. This document is available in PDF format on the internet at www.multicultural.vic.gov.au.
This publication has been prepared with data and terminology supplied by the Australian Bureau of Statistics only for the purpose of disseminating information for the benefit of the public. No warranty is given as to the accuracy, reliability, currency or completeness of the information. The State of Victoria accepts no liability for any loss or damage that may be incurred by any person from the use, interpretation or reliance on the information provided.
Notes on the Data
Confidentiality and Introduced Random Error
Local Government Areas and new ABS Geography
The counts and totals in summary tables are subjected to small adjustments. These adjustments may cause the sum of rows or columns to differ by small amounts from table totals. The counts are adjusted independently in a controlled manner, so the same information is adjusted by the same amount. However, tables at higher geographic levels may not be equal to the sum of the tables for the component geographic units.
Many classifications used in ABS statistics have an uneven distribution of data throughout their categories. For example, the number of people who are Anglican or born in Italy is quite large (3,101,185 and 174,042 respectively in 2016), while the number of people who are Buddhist or born in Chile (563,674 and 26,086 respectively in 2016), is relatively small. When religion is cross-classified with country of birth, the number in the table cell who are Anglican and who were born in Italy could be small, and the number of Buddhists born in Chile even smaller. These small numbers increase the risk of identifying individuals in the statistics.
These notes relate to the Birthplace Community Profiles, and detail some important considerations regarding the classifications used and comparability issues between Census years. For more general information about what is collected in the Census and the meaning of various categories, please see the Australian Bureau of Statistics (ABS) Census Dictionary, 2016, Catalogue No. 2901.0 on the ABS Website www.abs.gov.au, which also contains the other publications mentioned in these notes.
Even when variables are more evenly distributed in the classifications, the problem still occurs. The more detailed the classifications, and the more of them that are applied in constructing a table, the greater the incidence of very small cells.
Care is taken in the specification of tables to minimise the risk of identifying individuals. In addition, a technique has been developed to randomly adjust cell values. Random adjustment of the data is considered to be the most satisfactory technique for avoiding the release of identifiable Census data. When the technique is applied, all cells are slightly adjusted to prevent any identifiable data being exposed. These adjustments result in small introduced random errors. However, the information value of the table as a whole is not impaired. The technique allows very large tables to be produced even though they contain numbers of very small cells.
It is not possible to determine which individual figures have been affected by random error adjustments, but the small variance which may be associated with derived totals can, for the most part, be ignored.
No reliance should be placed on small cells as they are impacted by random adjustment, respondent and processing errors.
Many different classifications are used in Census tables and the tables are produced for a variety of geographical areas. The effect of the introduced random error is minimised if the statistic required is found direct from a tabulation rather than from aggregating more finely classified data. Similarly, rather than aggregating data from small areas to obtain statistics about a larger standard geographic area, published data for the larger area should be used wherever possible.
When calculating proportions, percentages or ratios from cross-classified or small area tables, the random error introduced can be ignored except when very small cells are involved, in which case the impact on percentages and ratios can be significant.
The Local Government Area (LGA) is part of the Non-ABS Structure of the ASGS and the ABS will continue to support LGAs with the data it currently provides. There were no boundary changes between Local Government Areas (LGAs) in Victoria between 2011 and 2016.
Census variables
Country of Birth of Person
Some country name changes from 2011 to 2016:2011 2016Former Yugoslav Republic of Macedonia (FYROM) FYR of MacedoniaMyanmar, The Republic of the Union of MyanmarBolivia, Plurinational State of BoliviaVenezuela, Bolivarian Republic of Venezuela
Indigenous Status
Year of Arrival
Ancestry
Age
Language Spoken at Home
Proficiency in Spoken English
Religious Affiliation
The following describes Census topics presented in this publication. (Please refer to the Census Dictionary, 2016 ).
This variable indicates in which country a person was born and is coded using the Standard Australian Classification of Countries (SACC), 2016 , Catalogue No. 1269.0. Change of names of countries between censuses should be noted when making time series comparisons. Examples are provided below:
This provides responses of persons who identified themselves as being of Australian Aboriginal and/or Torres Strait Islander origin.
This states for persons born overseas, the year they first arrived in Australia with the intention of staying for at least one year. The variable Country of Birth of Person is the basis for determining if a person was born in Australia or overseas. The year 2016 refers to the period from 1st January 2016 to 9th August 2016 only.
Ancestry is coded using the Australian Standard Classification of Cultural and Ethnic Groups (ASCCEG), 2016 , Catalogue No.1249.0. There are two ancestry variables, First and Second Response, because respondents to the Census are asked to report up to two ancestries. Respondents do not have the option of ranking their answers to the ancestry question, so where a respondent reports two ancestries, those two ancestries have equal standing. The two ancestry variables are combined into one variable Ancestry Multi-Response, or Total Responses as used in this publication.
This contains a person's age, and is collected for each person. Age is calculated from date of birth, however if this is not provided, stated age will be used. If neither is provided, age is imputed.
This records responses to the Census question “Does the person speak a language other than English at home?”, and is coded using the Australian Standard Classification of Languages (ASCL), 2016 , Catalogue No. 1267.0. This question allows for one answer only.
This variable classifies their self-assessed proficiency in spoken English for each person who speaks a language other than English at home.
Religions are coded using the Australian Standard Classification of Religions Groups (ASCRG), 2016 , Catalogue No. 1266.0. The variable records a person’s religious affiliation. Answering this Census question is optional.
Dwelling Internet Connection
Level of Highest Educational Attainment
Labour Force Status
Occupation
Industry of Employment
Voluntary Work
Total Personal Income (Weekly)This indicates the total income that the person usually receives each week.
Tenure Type
Family Composition
CitizenshipThis records whether a person has Australian citizenship.
Core Activity Need for Assistance
Occupation is coded using the Australian and New Zealand Standard Classification of Occupations (ANZSCO), 2013, Version 1.2 , Catalogue No. 1220.0. The Occupation code assigned to a response is based on the occupation title and tasks of the main job held during the week prior to Census night.
Industry of Employment is coded using the Australian and New Zealand Standard Industrial Classification (ANZSIC), 2006 Revision 2.0 , Catalogue No. 1292.0.
This variable records people who spent time doing unpaid voluntary work through an organisation or group, in the twelve months prior to Census Night. It excludes work done as part of paid employment; if main reason is to qualify for Government benefit, obtain an educational qualification or due to a community work order: and in a family business
This variable records whether any member of the household accesses the internet from the dwelling, through a desktop/laptop computer, mobile or smart phone, tablet, music or video player, gaming console, smart TV or any other devices. It also includes accessing through any type of connection, for example, ADSL, fibre, cable, wireless, satellite and mobile broadband (3G/4G).
This variable combines ”Non-School Qualification: Level of Education” and “Highest Year of School Completed” to produce a single measure of a person's overall level of educational attainment, whether it be a school or non-school qualification.
This variable records, for the week prior to Census night, a person's labour force status. The category, “Employed, away from work” also includes persons who stated they worked but who did not state their number of hours worked.
This describes whether a dwelling is owned, being purchased or rented. Dwellings occupied under a life tenure scheme can be considered as being owned.
Family Composition classifies families into different types. When classifying families into different types, information about temporarily absent family members is used.
No provision has been made in Family Composition to classify family members outside the family nucleus. For example, in a family which contains a couple and their dependent children, plus a parent of one of the couple, the latter would be recorded as an “Other related individual”. Identification of such persons within a family is done by means of “Relationship in household” data.
This measures the number of people with a profound or severe disability. People with a profound or severe disability are defined as those people needing help or assistance in one or more of the three core activity areas of self-care, mobility and communication because of a disability, long term health condition (lasting six months or more) or old age.
Usual Address 5 years ago
Abbreviations
nfd Not further definednec Not elsewhere classifiedna Not available or Not applicableAlia AustraliaVic VictoriaCOB Country of BirthOSB Overseas-bornLOTE Language other than EnglishLGA Local Government AreaMESC Main English-speaking CountriesNMESC Non-Main English-speaking Countries
Category names have been shortened where they do not fit within the columns or rows in the tables in this publication. The commonly used abbreviations include:
This is derived from the mark box answer to the question on the 2016 Census form which asks, “Where did the person usually live five years ago (at 9 August 2011)?”. This variable shows migration patterns when used with the “Usual Address Census Night Indicator”, “Usual Address One Year Ago Indicator” and “Place of usual residence” data.
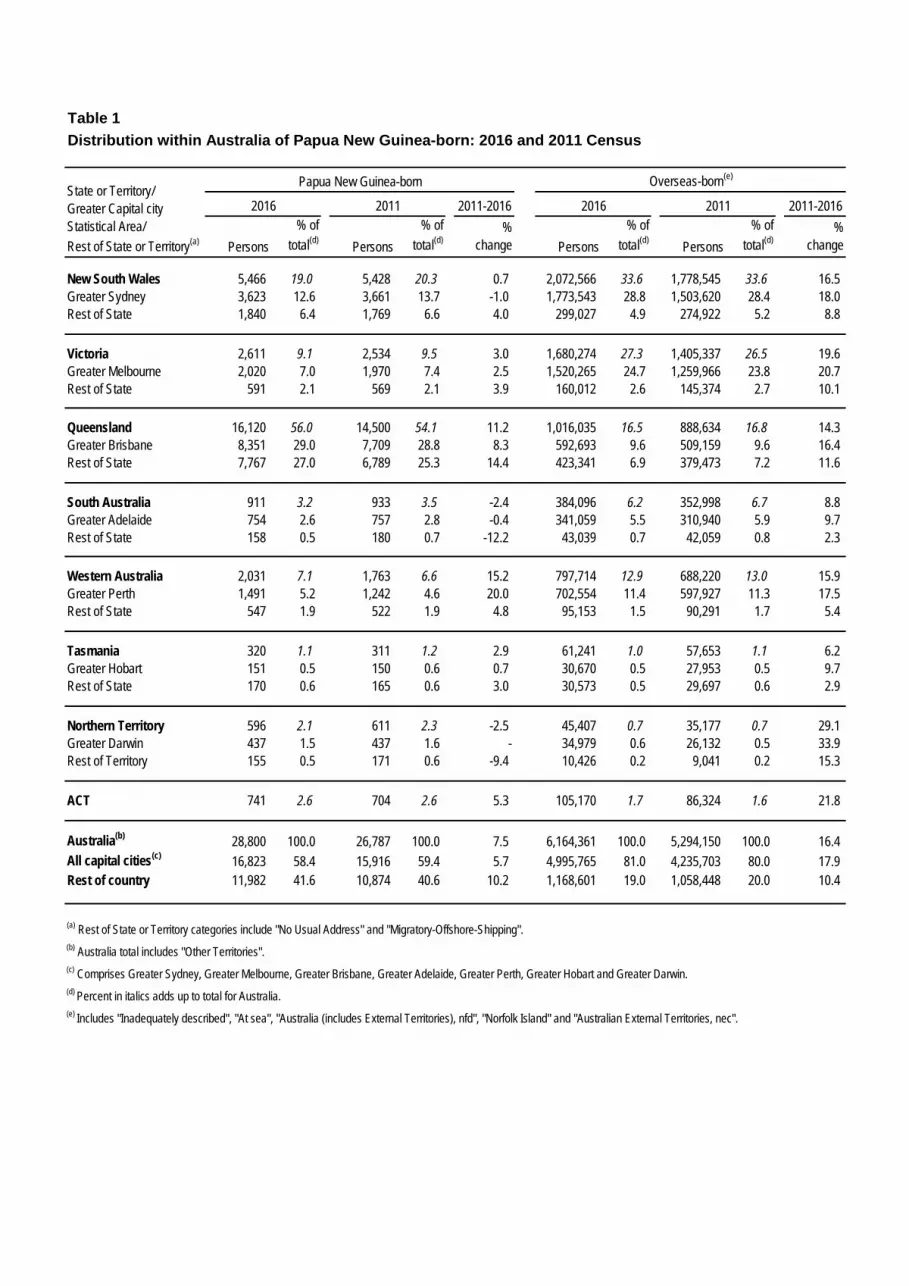
Table 1Distribution within Australia of Papua New Guinea-born: 2016 and 2011 Census
2011-2016 2011-2016
Persons% of
total(d) Persons% of
total(d)%
change Persons% of
total(d) Persons% of
total(d)%
change
New South Wales 5,466 19.0 5,428 20.3 0.7 2,072,566 33.6 1,778,545 33.6 16.5Greater Sydney 3,623 12.6 3,661 13.7 -1.0 1,773,543 28.8 1,503,620 28.4 18.0Rest of State 1,840 6.4 1,769 6.6 4.0 299,027 4.9 274,922 5.2 8.8
Victoria 2,611 9.1 2,534 9.5 3.0 1,680,274 27.3 1,405,337 26.5 19.6Greater Melbourne 2,020 7.0 1,970 7.4 2.5 1,520,265 24.7 1,259,966 23.8 20.7Rest of State 591 2.1 569 2.1 3.9 160,012 2.6 145,374 2.7 10.1
Queensland 16,120 56.0 14,500 54.1 11.2 1,016,035 16.5 888,634 16.8 14.3Greater Brisbane 8,351 29.0 7,709 28.8 8.3 592,693 9.6 509,159 9.6 16.4Rest of State 7,767 27.0 6,789 25.3 14.4 423,341 6.9 379,473 7.2 11.6
South Australia 911 3.2 933 3.5 -2.4 384,096 6.2 352,998 6.7 8.8Greater Adelaide 754 2.6 757 2.8 -0.4 341,059 5.5 310,940 5.9 9.7Rest of State 158 0.5 180 0.7 -12.2 43,039 0.7 42,059 0.8 2.3
Western Australia 2,031 7.1 1,763 6.6 15.2 797,714 12.9 688,220 13.0 15.9Greater Perth 1,491 5.2 1,242 4.6 20.0 702,554 11.4 597,927 11.3 17.5Rest of State 547 1.9 522 1.9 4.8 95,153 1.5 90,291 1.7 5.4
Tasmania 320 1.1 311 1.2 2.9 61,241 1.0 57,653 1.1 6.2Greater Hobart 151 0.5 150 0.6 0.7 30,670 0.5 27,953 0.5 9.7Rest of State 170 0.6 165 0.6 3.0 30,573 0.5 29,697 0.6 2.9
Northern Territory 596 2.1 611 2.3 -2.5 45,407 0.7 35,177 0.7 29.1Greater Darwin 437 1.5 437 1.6 - 34,979 0.6 26,132 0.5 33.9Rest of Territory 155 0.5 171 0.6 -9.4 10,426 0.2 9,041 0.2 15.3
ACT 741 2.6 704 2.6 5.3 105,170 1.7 86,324 1.6 21.8
Australia(b) 28,800 100.0 26,787 100.0 7.5 6,164,361 100.0 5,294,150 100.0 16.4All capital cities(c) 16,823 58.4 15,916 59.4 5.7 4,995,765 81.0 4,235,703 80.0 17.9Rest of country 11,982 41.6 10,874 40.6 10.2 1,168,601 19.0 1,058,448 20.0 10.4
(a) Rest of State or Territory categories include "No Usual Address" and "Migratory-Offshore-Shipping".(b) Australia total includes "Other Territories".(c) Comprises Greater Sydney, Greater Melbourne, Greater Brisbane, Greater Adelaide, Greater Perth, Greater Hobart and Greater Darwin.(d) Percent in italics adds up to total for Australia.(e) Includes "Inadequately described", "At sea", "Australia (includes External Territories), nfd", "Norfolk Island" and "Australian External Territories, nec".
State or Territory/Greater Capital city Statistical Area/Rest of State or Territory(a)
Papua New Guinea-born
2016 2011
Overseas-born(e)
2016 2011
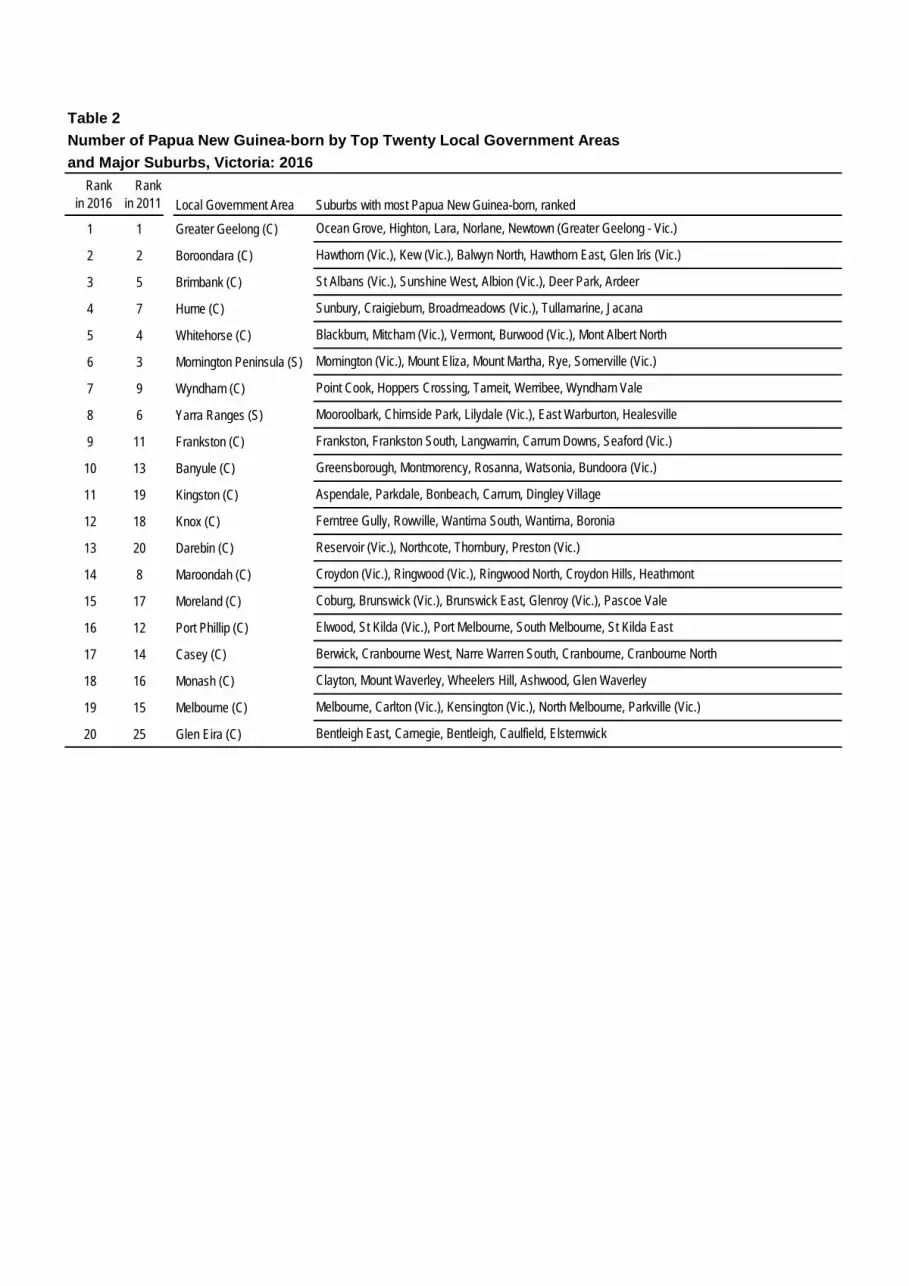
Table 2Number of Papua New Guinea-born by Top Twenty Local Government Areasand Major Suburbs, Victoria: 2016
Rank in 2016
Rank in 2011 Local Government Area Suburbs with most Papua New Guinea-born, ranked
1 1 Greater Geelong (C)
2 2 Boroondara (C)
3 5 Brimbank (C)
4 7 Hume (C)
5 4 Whitehorse (C)
6 3 Mornington Peninsula (S)
7 9 Wyndham (C)
8 6 Yarra Ranges (S)
9 11 Frankston (C)
10 13 Banyule (C)
11 19 Kingston (C)
12 18 Knox (C)
13 20 Darebin (C)
14 8 Maroondah (C)
15 17 Moreland (C)
16 12 Port Phillip (C)
17 14 Casey (C)
18 16 Monash (C)
19 15 Melbourne (C)
20 25 Glen Eira (C)
Point Cook, Hoppers Crossing, Tarneit, Werribee, Wyndham Vale
Mooroolbark, Chirnside Park, Lilydale (Vic.), East Warburton, Healesville
Frankston, Frankston South, Langwarrin, Carrum Downs, Seaford (Vic.)
Greensborough, Montmorency, Rosanna, Watsonia, Bundoora (Vic.)
Ocean Grove, Highton, Lara, Norlane, Newtown (Greater Geelong - Vic.)
Hawthorn (Vic.), Kew (Vic.), Balwyn North, Hawthorn East, Glen Iris (Vic.)
St Albans (Vic.), Sunshine West, Albion (Vic.), Deer Park, Ardeer
Sunbury, Craigieburn, Broadmeadows (Vic.), Tullamarine, Jacana
Blackburn, Mitcham (Vic.), Vermont, Burwood (Vic.), Mont Albert North
Mornington (Vic.), Mount Eliza, Mount Martha, Rye, Somerville (Vic.)
Aspendale, Parkdale, Bonbeach, Carrum, Dingley Village
Ferntree Gully, Rowville, Wantirna South, Wantirna, Boronia
Reservoir (Vic.), Northcote, Thornbury, Preston (Vic.)
Croydon (Vic.), Ringwood (Vic.), Ringwood North, Croydon Hills, Heathmont
Coburg, Brunswick (Vic.), Brunswick East, Glenroy (Vic.), Pascoe Vale
Elwood, St Kilda (Vic.), Port Melbourne, South Melbourne, St Kilda East
Berwick, Cranbourne West, Narre Warren South, Cranbourne, Cranbourne North
Clayton, Mount Waverley, Wheelers Hill, Ashwood, Glen Waverley
Melbourne, Carlton (Vic.), Kensington (Vic.), North Melbourne, Parkville (Vic.)
Bentleigh East, Carnegie, Bentleigh, Caulfield, Elsternwick
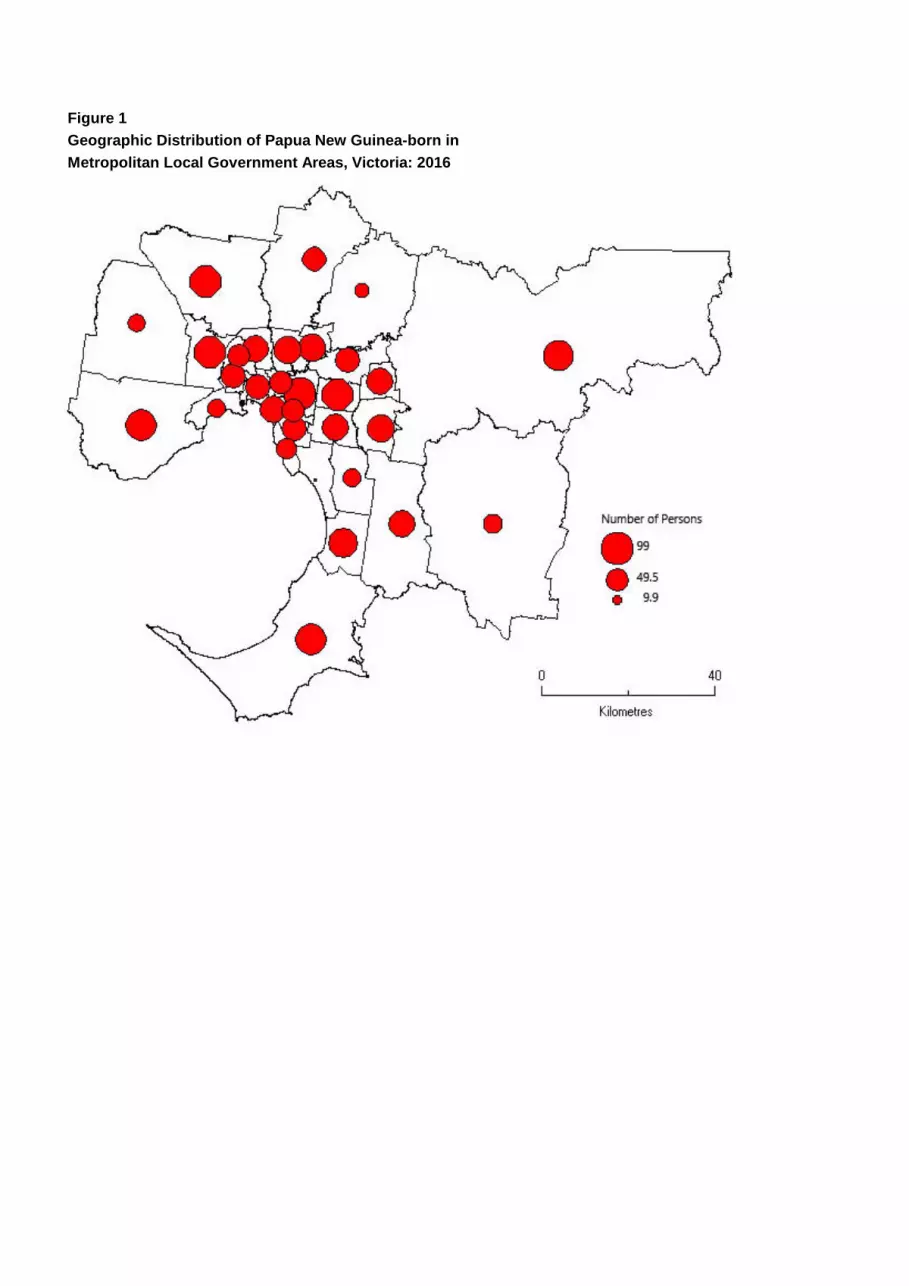
Figure 1Geographic Distribution of Papua New Guinea-born inMetropolitan Local Government Areas, Victoria: 2016
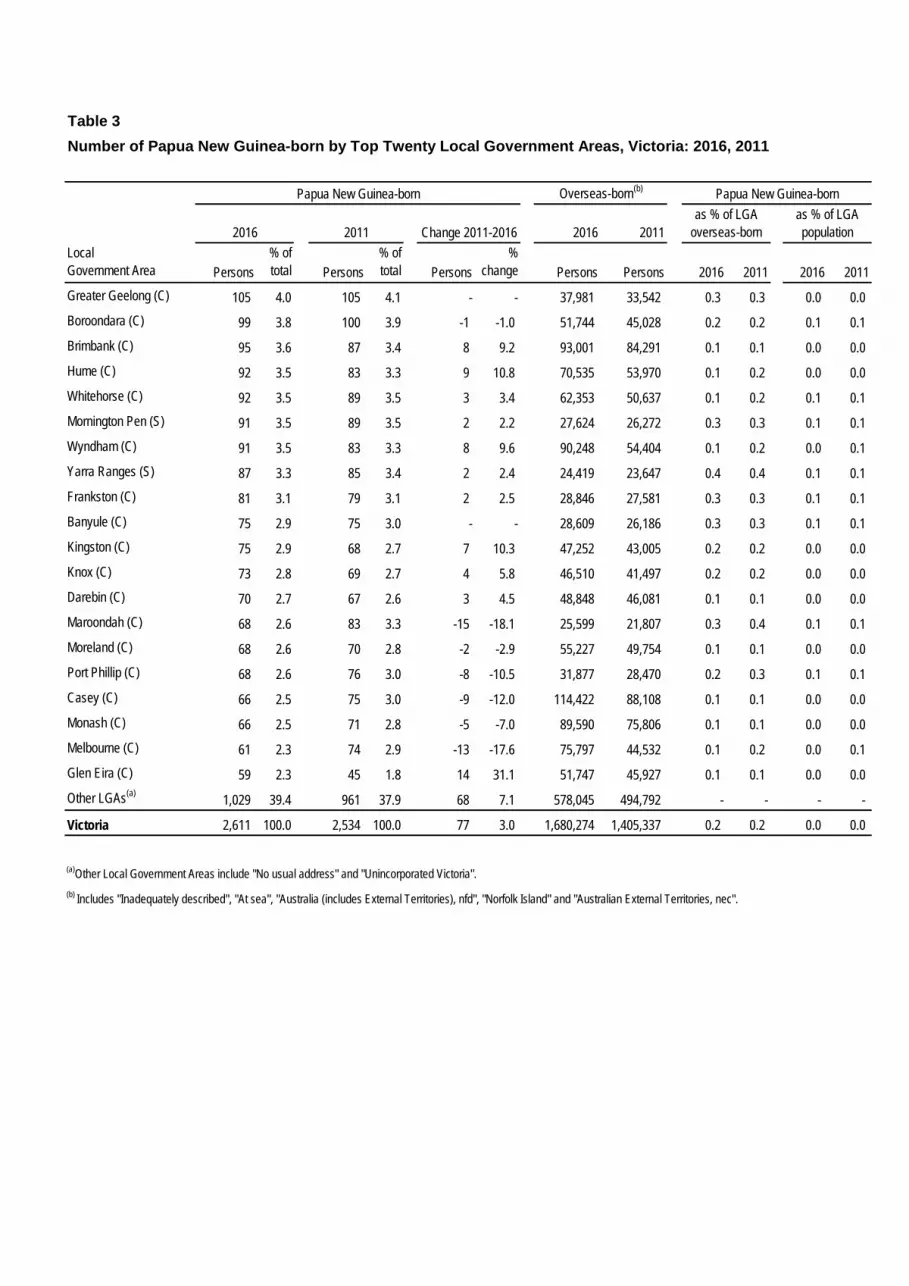
Table 3Number of Papua New Guinea-born by Top Twenty Local Government Areas, Victoria: 2016, 2011
2016 2011Local Government Area Persons
% of total Persons
% of total Persons
% change Persons Persons 2016 2011 2016 2011
Greater Geelong (C) 105 4.0 105 4.1 - - 37,981 33,542 0.3 0.3 0.0 0.0 Boroondara (C) 99 3.8 100 3.9 -1 -1.0 51,744 45,028 0.2 0.2 0.1 0.1 Brimbank (C) 95 3.6 87 3.4 8 9.2 93,001 84,291 0.1 0.1 0.0 0.0 Hume (C) 92 3.5 83 3.3 9 10.8 70,535 53,970 0.1 0.2 0.0 0.0 Whitehorse (C) 92 3.5 89 3.5 3 3.4 62,353 50,637 0.1 0.2 0.1 0.1 Mornington Pen (S) 91 3.5 89 3.5 2 2.2 27,624 26,272 0.3 0.3 0.1 0.1 Wyndham (C) 91 3.5 83 3.3 8 9.6 90,248 54,404 0.1 0.2 0.0 0.1 Yarra Ranges (S) 87 3.3 85 3.4 2 2.4 24,419 23,647 0.4 0.4 0.1 0.1 Frankston (C) 81 3.1 79 3.1 2 2.5 28,846 27,581 0.3 0.3 0.1 0.1 Banyule (C) 75 2.9 75 3.0 - - 28,609 26,186 0.3 0.3 0.1 0.1 Kingston (C) 75 2.9 68 2.7 7 10.3 47,252 43,005 0.2 0.2 0.0 0.0 Knox (C) 73 2.8 69 2.7 4 5.8 46,510 41,497 0.2 0.2 0.0 0.0 Darebin (C) 70 2.7 67 2.6 3 4.5 48,848 46,081 0.1 0.1 0.0 0.0 Maroondah (C) 68 2.6 83 3.3 -15 -18.1 25,599 21,807 0.3 0.4 0.1 0.1 Moreland (C) 68 2.6 70 2.8 -2 -2.9 55,227 49,754 0.1 0.1 0.0 0.0 Port Phillip (C) 68 2.6 76 3.0 -8 -10.5 31,877 28,470 0.2 0.3 0.1 0.1 Casey (C) 66 2.5 75 3.0 -9 -12.0 114,422 88,108 0.1 0.1 0.0 0.0 Monash (C) 66 2.5 71 2.8 -5 -7.0 89,590 75,806 0.1 0.1 0.0 0.0 Melbourne (C) 61 2.3 74 2.9 -13 -17.6 75,797 44,532 0.1 0.2 0.0 0.1 Glen Eira (C) 59 2.3 45 1.8 14 31.1 51,747 45,927 0.1 0.1 0.0 0.0 Other LGAs(a) 1,029 39.4 961 37.9 68 7.1 578,045 494,792 - - - -
Victoria 2,611 100.0 2,534 100.0 77 3.0 1,680,274 1,405,337 0.2 0.2 0.0 0.0
(a)Other Local Government Areas include "No usual address" and "Unincorporated Victoria".(b) Includes "Inadequately described", "At sea", "Australia (includes External Territories), nfd", "Norfolk Island" and "Australian External Territories, nec".
Papua New Guinea-bornas % of LGA
overseas-bornas % of LGApopulation
Papua New Guinea-born Overseas-born(b)
2016 2011 Change 2011-2016
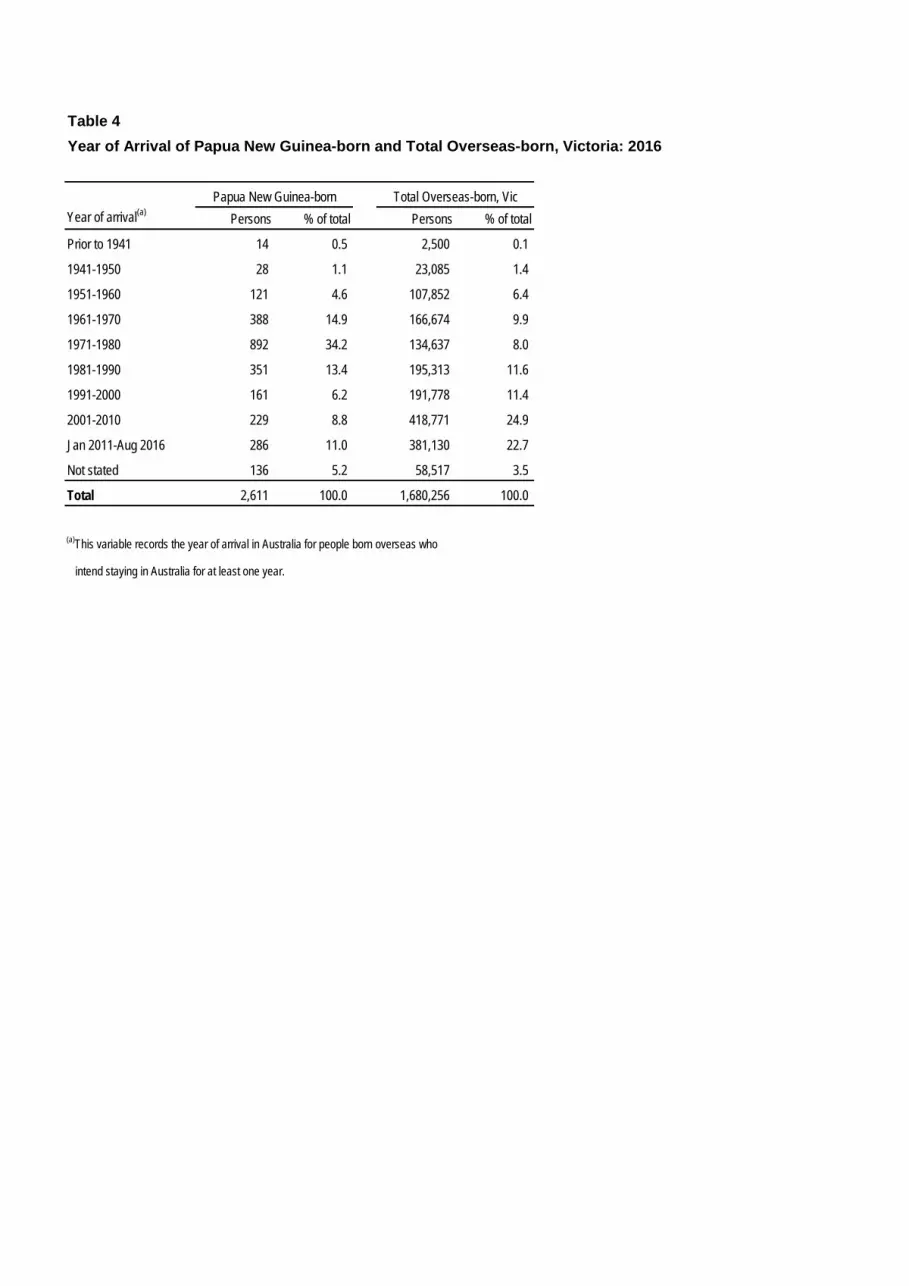
Table 4Year of Arrival of Papua New Guinea-born and Total Overseas-born, Victoria: 2016
Year of arrival(a) Persons % of total Persons % of total
Prior to 1941 14 0.5 2,500 0.1
1941-1950 28 1.1 23,085 1.4
1951-1960 121 4.6 107,852 6.4
1961-1970 388 14.9 166,674 9.9
1971-1980 892 34.2 134,637 8.0
1981-1990 351 13.4 195,313 11.6
1991-2000 161 6.2 191,778 11.4
2001-2010 229 8.8 418,771 24.9
Jan 2011-Aug 2016 286 11.0 381,130 22.7
Not stated 136 5.2 58,517 3.5
Total 2,611 100.0 1,680,256 100.0
(a)This variable records the year of arrival in Australia for people born overseas who
intend staying in Australia for at least one year.
Papua New Guinea-born Total Overseas-born, Vic
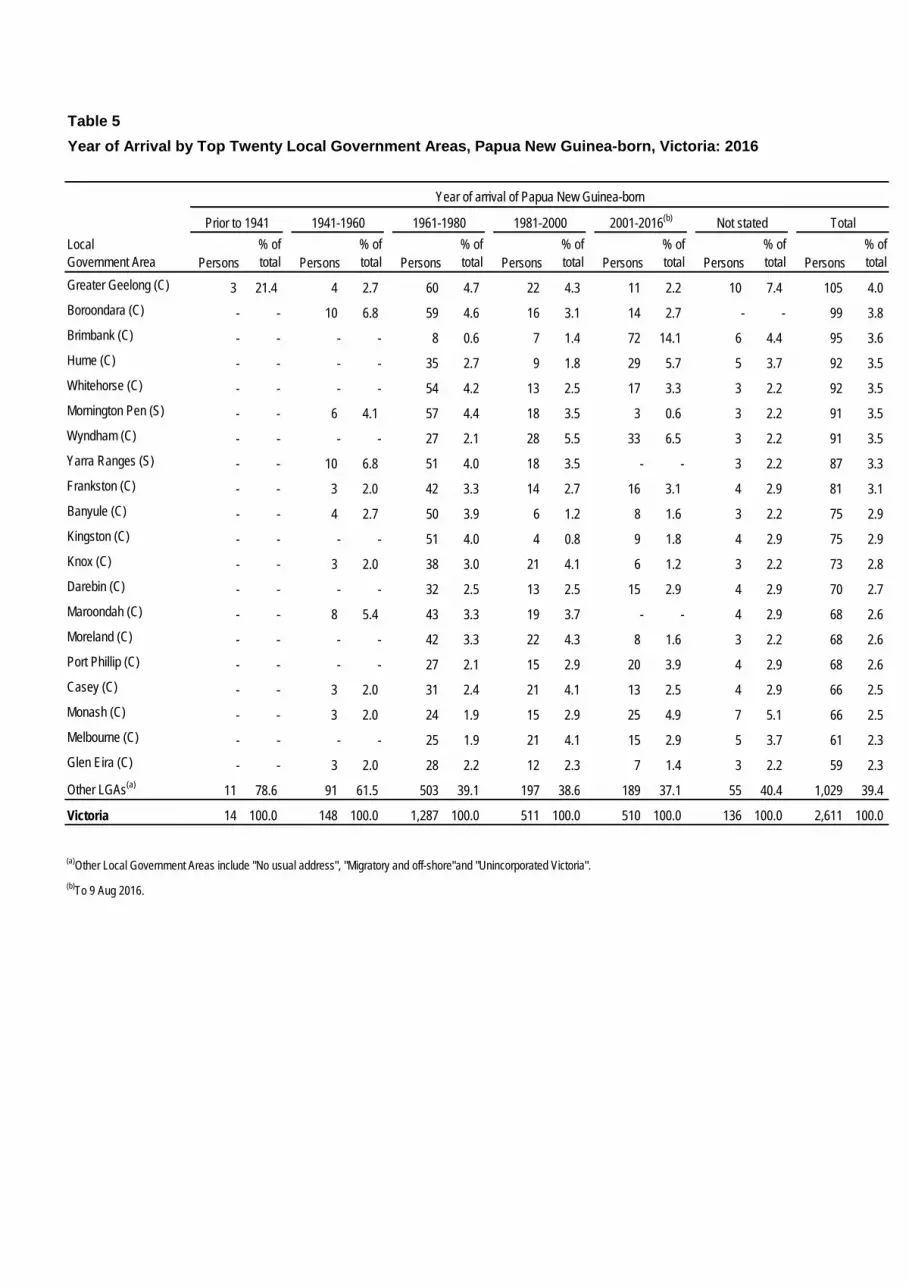
Table 5Year of Arrival by Top Twenty Local Government Areas, Papua New Guinea-born, Victoria: 2016
Local Government Area Persons
% of total Persons
% of total Persons
% of total Persons
% of total Persons
% of total Persons
% of total Persons
% of total
Greater Geelong (C) 3 21.4 4 2.7 60 4.7 22 4.3 11 2.2 10 7.4 105 4.0Boroondara (C) - - 10 6.8 59 4.6 16 3.1 14 2.7 - - 99 3.8Brimbank (C) - - - - 8 0.6 7 1.4 72 14.1 6 4.4 95 3.6Hume (C) - - - - 35 2.7 9 1.8 29 5.7 5 3.7 92 3.5Whitehorse (C) - - - - 54 4.2 13 2.5 17 3.3 3 2.2 92 3.5Mornington Pen (S) - - 6 4.1 57 4.4 18 3.5 3 0.6 3 2.2 91 3.5Wyndham (C) - - - - 27 2.1 28 5.5 33 6.5 3 2.2 91 3.5Yarra Ranges (S) - - 10 6.8 51 4.0 18 3.5 - - 3 2.2 87 3.3Frankston (C) - - 3 2.0 42 3.3 14 2.7 16 3.1 4 2.9 81 3.1Banyule (C) - - 4 2.7 50 3.9 6 1.2 8 1.6 3 2.2 75 2.9Kingston (C) - - - - 51 4.0 4 0.8 9 1.8 4 2.9 75 2.9Knox (C) - - 3 2.0 38 3.0 21 4.1 6 1.2 3 2.2 73 2.8Darebin (C) - - - - 32 2.5 13 2.5 15 2.9 4 2.9 70 2.7Maroondah (C) - - 8 5.4 43 3.3 19 3.7 - - 4 2.9 68 2.6Moreland (C) - - - - 42 3.3 22 4.3 8 1.6 3 2.2 68 2.6Port Phillip (C) - - - - 27 2.1 15 2.9 20 3.9 4 2.9 68 2.6Casey (C) - - 3 2.0 31 2.4 21 4.1 13 2.5 4 2.9 66 2.5Monash (C) - - 3 2.0 24 1.9 15 2.9 25 4.9 7 5.1 66 2.5Melbourne (C) - - - - 25 1.9 21 4.1 15 2.9 5 3.7 61 2.3Glen Eira (C) - - 3 2.0 28 2.2 12 2.3 7 1.4 3 2.2 59 2.3
Other LGAs(a) 11 78.6 91 61.5 503 39.1 197 38.6 189 37.1 55 40.4 1,029 39.4
Victoria 14 100.0 148 100.0 1,287 100.0 511 100.0 510 100.0 136 100.0 2,611 100.0
(a)Other Local Government Areas include "No usual address", "Migratory and off-shore"and "Unincorporated Victoria".(b)To 9 Aug 2016.
Not stated Total
Year of arrival of Papua New Guinea-born
Prior to 1941 1941-1960 1961-1980 1981-2000 2001-2016(b)
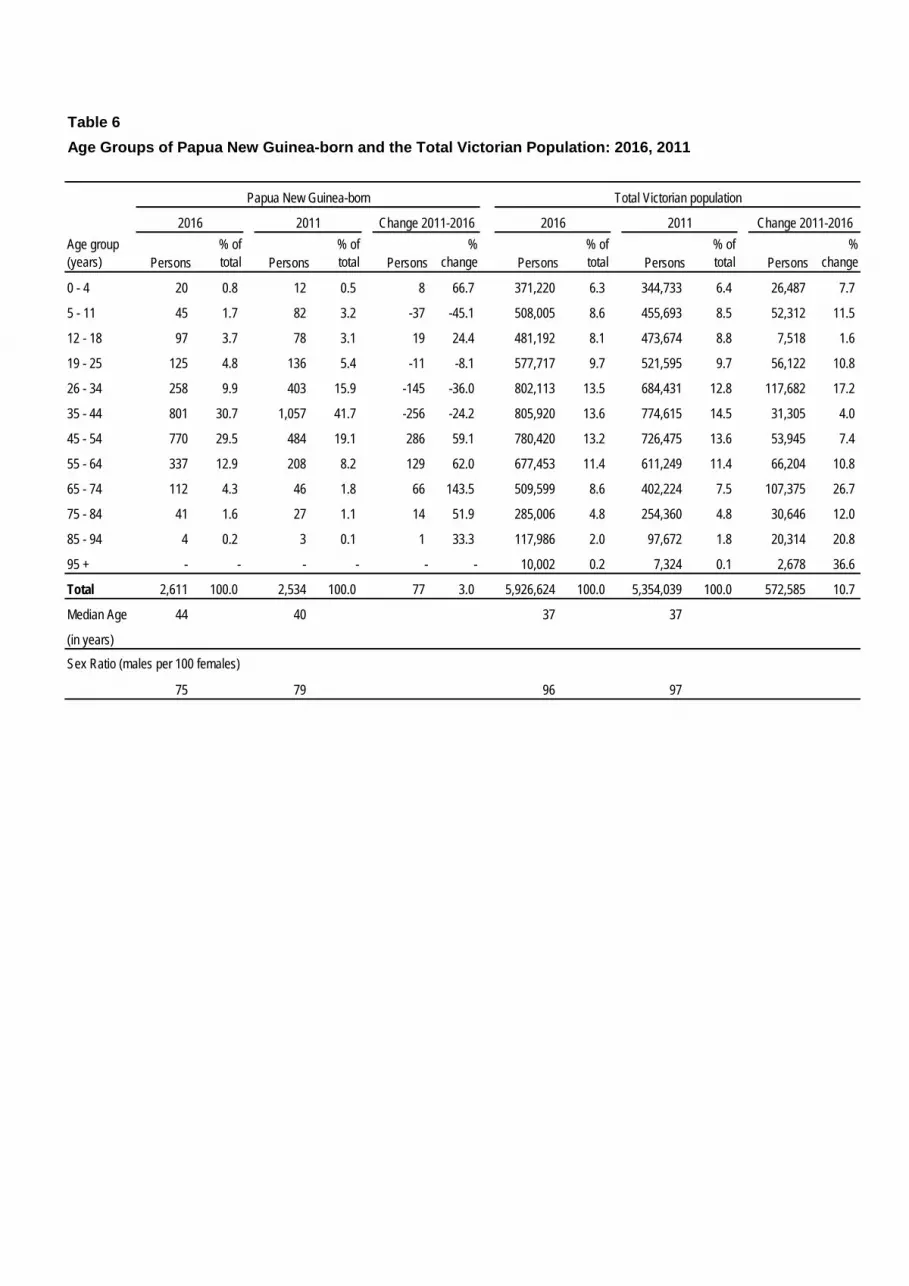
Table 6Age Groups of Papua New Guinea-born and the Total Victorian Population: 2016, 2011
Age group(years) Persons
% of total Persons
% of total Persons
%change Persons
% of total Persons
% of total Persons
%change
0 - 4 20 0.8 12 0.5 8 66.7 371,220 6.3 344,733 6.4 26,487 7.7
5 - 11 45 1.7 82 3.2 -37 -45.1 508,005 8.6 455,693 8.5 52,312 11.5
12 - 18 97 3.7 78 3.1 19 24.4 481,192 8.1 473,674 8.8 7,518 1.6
19 - 25 125 4.8 136 5.4 -11 -8.1 577,717 9.7 521,595 9.7 56,122 10.8
26 - 34 258 9.9 403 15.9 -145 -36.0 802,113 13.5 684,431 12.8 117,682 17.2
35 - 44 801 30.7 1,057 41.7 -256 -24.2 805,920 13.6 774,615 14.5 31,305 4.0
45 - 54 770 29.5 484 19.1 286 59.1 780,420 13.2 726,475 13.6 53,945 7.4
55 - 64 337 12.9 208 8.2 129 62.0 677,453 11.4 611,249 11.4 66,204 10.8
65 - 74 112 4.3 46 1.8 66 143.5 509,599 8.6 402,224 7.5 107,375 26.7
75 - 84 41 1.6 27 1.1 14 51.9 285,006 4.8 254,360 4.8 30,646 12.0
85 - 94 4 0.2 3 0.1 1 33.3 117,986 2.0 97,672 1.8 20,314 20.8
95 + - - - - - - 10,002 0.2 7,324 0.1 2,678 36.6
Total 2,611 100.0 2,534 100.0 77 3.0 5,926,624 100.0 5,354,039 100.0 572,585 10.7
Median Age 44 40 37 37
(in years)
Sex Ratio (males per 100 females)
75 79 96 97
Papua New Guinea-born Total Victorian population
2016 2011 Change 2011-2016 Change 2011-20162016 2011
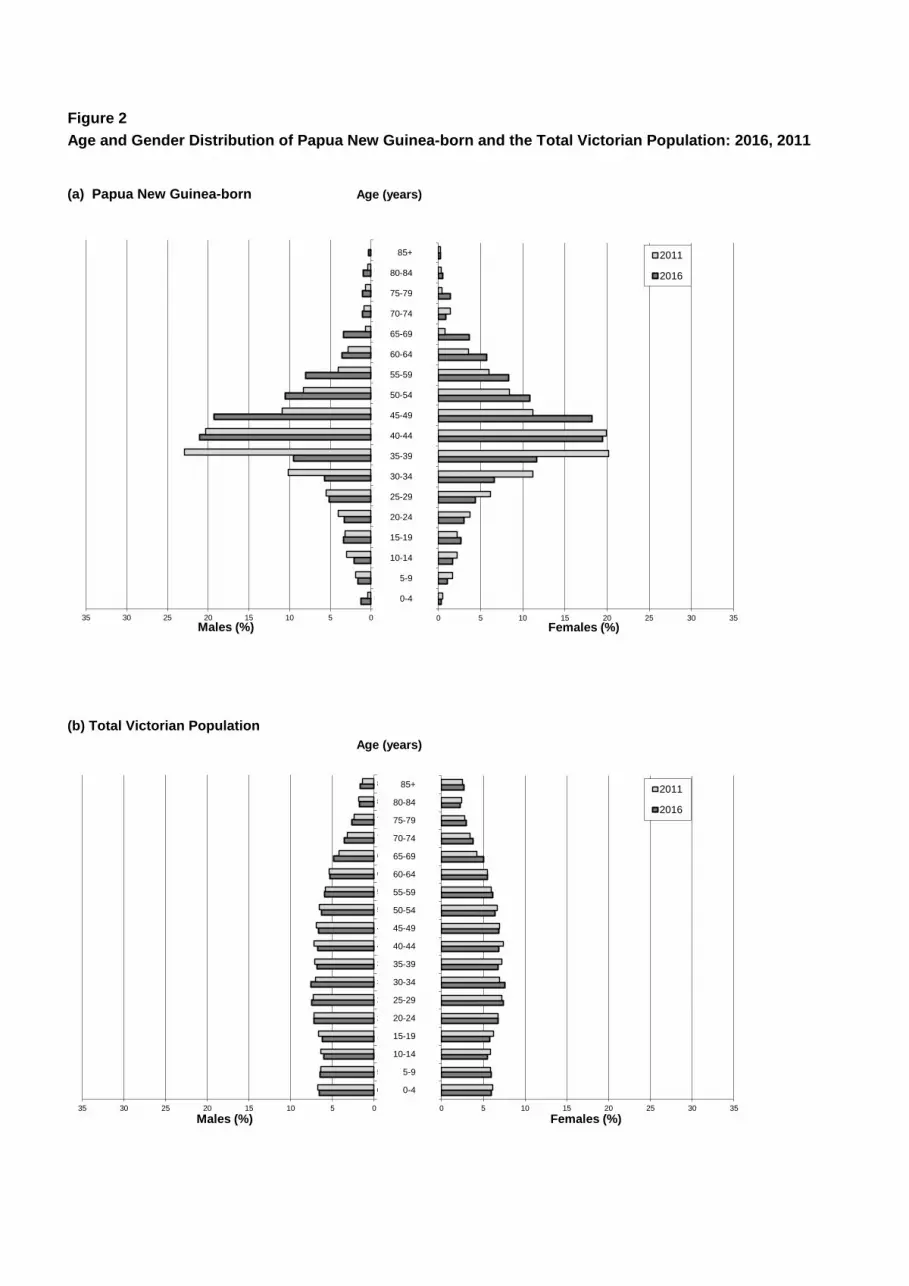
Figure 2Age and Gender Distribution of Papua New Guinea-born and the Total Victorian Population: 2016, 2011
(a) Papua New Guinea-born
same as for (a)
(b) Total Victorian Population
Age (years)
Age (years)
05101520253035
0-4
5-9
10-14
15-19
20-24
25-29
30-34
35-39
40-44
45-49
50-54
55-59
60-64
65-69
70-74
75-79
80-84
85+
Males (%) 0 5 10 15 20 25 30 35
0-4
5-9
10-14
15-19
20-24
25-29
30-34
35-39
40-44
45-49
50-54
55-59
60-64
65-69
70-74
75-79
80-84
85+
Females (%)
2011
2016
05101520253035
0-4
5-9
10-14
15-19
20-24
25-29
30-34
35-39
40-44
45-49
50-54
55-59
60-64
65-69
70-74
75-79
80-84
85+
Males (%) 0 5 10 15 20 25 30 35
0-4
5-9
10-14
15-19
20-24
25-29
30-34
35-39
40-44
45-49
50-54
55-59
60-64
65-69
70-74
75-79
80-84
85+
Females (%)
2011
2016
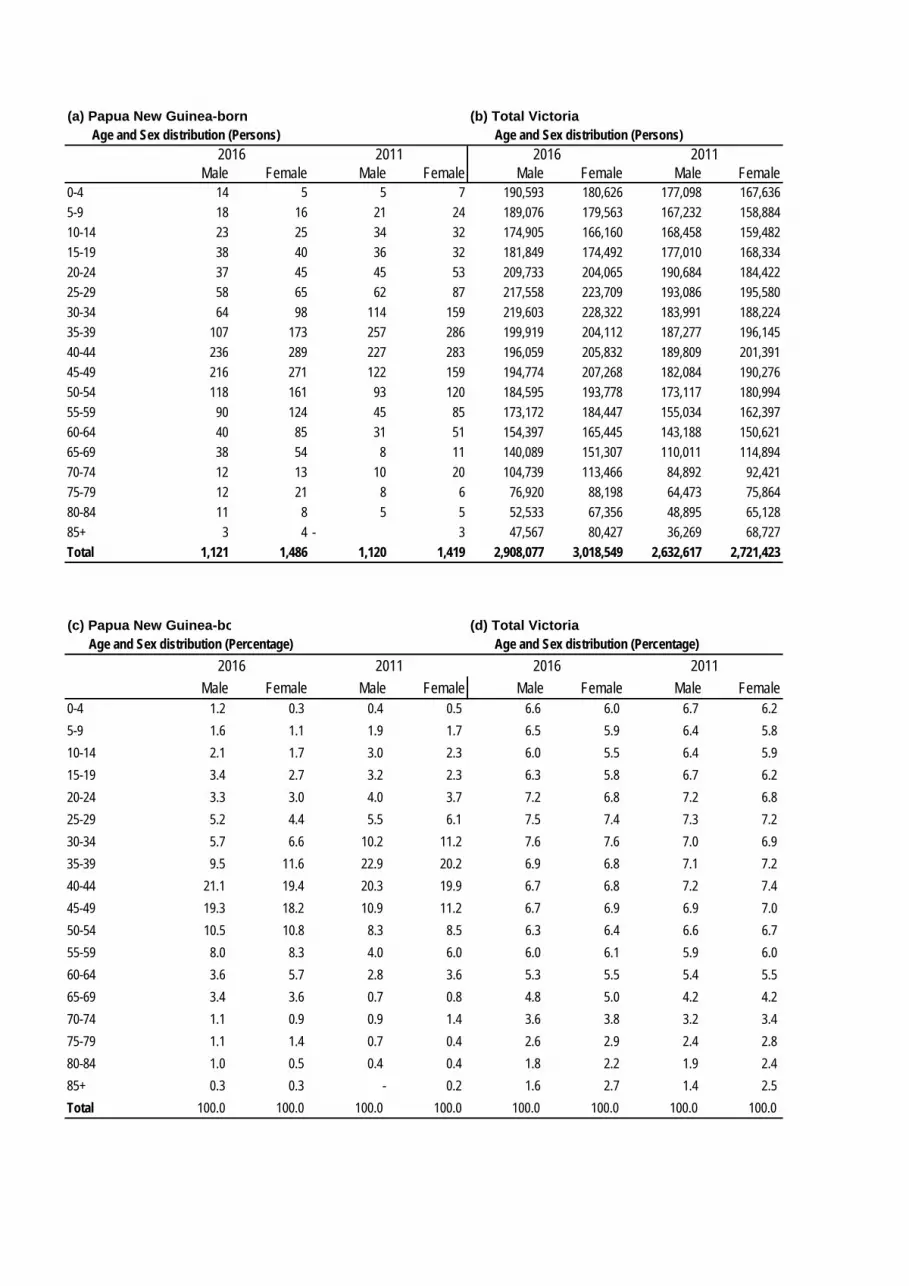
Age and Sex distribution (Persons) Age and Sex distribution (Persons)
Male Female Male Female Male Female Male Female0-4 14 5 5 7 190,593 180,626 177,098 167,6365-9 18 16 21 24 189,076 179,563 167,232 158,88410-14 23 25 34 32 174,905 166,160 168,458 159,48215-19 38 40 36 32 181,849 174,492 177,010 168,33420-24 37 45 45 53 209,733 204,065 190,684 184,42225-29 58 65 62 87 217,558 223,709 193,086 195,58030-34 64 98 114 159 219,603 228,322 183,991 188,22435-39 107 173 257 286 199,919 204,112 187,277 196,14540-44 236 289 227 283 196,059 205,832 189,809 201,39145-49 216 271 122 159 194,774 207,268 182,084 190,27650-54 118 161 93 120 184,595 193,778 173,117 180,99455-59 90 124 45 85 173,172 184,447 155,034 162,39760-64 40 85 31 51 154,397 165,445 143,188 150,62165-69 38 54 8 11 140,089 151,307 110,011 114,89470-74 12 13 10 20 104,739 113,466 84,892 92,42175-79 12 21 8 6 76,920 88,198 64,473 75,86480-84 11 8 5 5 52,533 67,356 48,895 65,12885+ 3 4 - 3 47,567 80,427 36,269 68,727Total 1,121 1,486 1,120 1,419 2,908,077 3,018,549 2,632,617 2,721,423
Age and Sex distribution (Percentage) Age and Sex distribution (Percentage)
Male Female Male Female Male Female Male Female0-4 1.2 0.3 0.4 0.5 6.6 6.0 6.7 6.25-9 1.6 1.1 1.9 1.7 6.5 5.9 6.4 5.810-14 2.1 1.7 3.0 2.3 6.0 5.5 6.4 5.915-19 3.4 2.7 3.2 2.3 6.3 5.8 6.7 6.220-24 3.3 3.0 4.0 3.7 7.2 6.8 7.2 6.825-29 5.2 4.4 5.5 6.1 7.5 7.4 7.3 7.230-34 5.7 6.6 10.2 11.2 7.6 7.6 7.0 6.935-39 9.5 11.6 22.9 20.2 6.9 6.8 7.1 7.240-44 21.1 19.4 20.3 19.9 6.7 6.8 7.2 7.445-49 19.3 18.2 10.9 11.2 6.7 6.9 6.9 7.050-54 10.5 10.8 8.3 8.5 6.3 6.4 6.6 6.755-59 8.0 8.3 4.0 6.0 6.0 6.1 5.9 6.060-64 3.6 5.7 2.8 3.6 5.3 5.5 5.4 5.565-69 3.4 3.6 0.7 0.8 4.8 5.0 4.2 4.270-74 1.1 0.9 0.9 1.4 3.6 3.8 3.2 3.475-79 1.1 1.4 0.7 0.4 2.6 2.9 2.4 2.880-84 1.0 0.5 0.4 0.4 1.8 2.2 1.9 2.485+ 0.3 0.3 - 0.2 1.6 2.7 1.4 2.5Total 100.0 100.0 100.0 100.0 100.0 100.0 100.0 100.0
(b) Total Victoria
2016 2011
2016 2011
(d) Total Victoria
(a) Papua New Guinea-born
2016 2011
(c) Papua New Guinea-bo
2016 2011
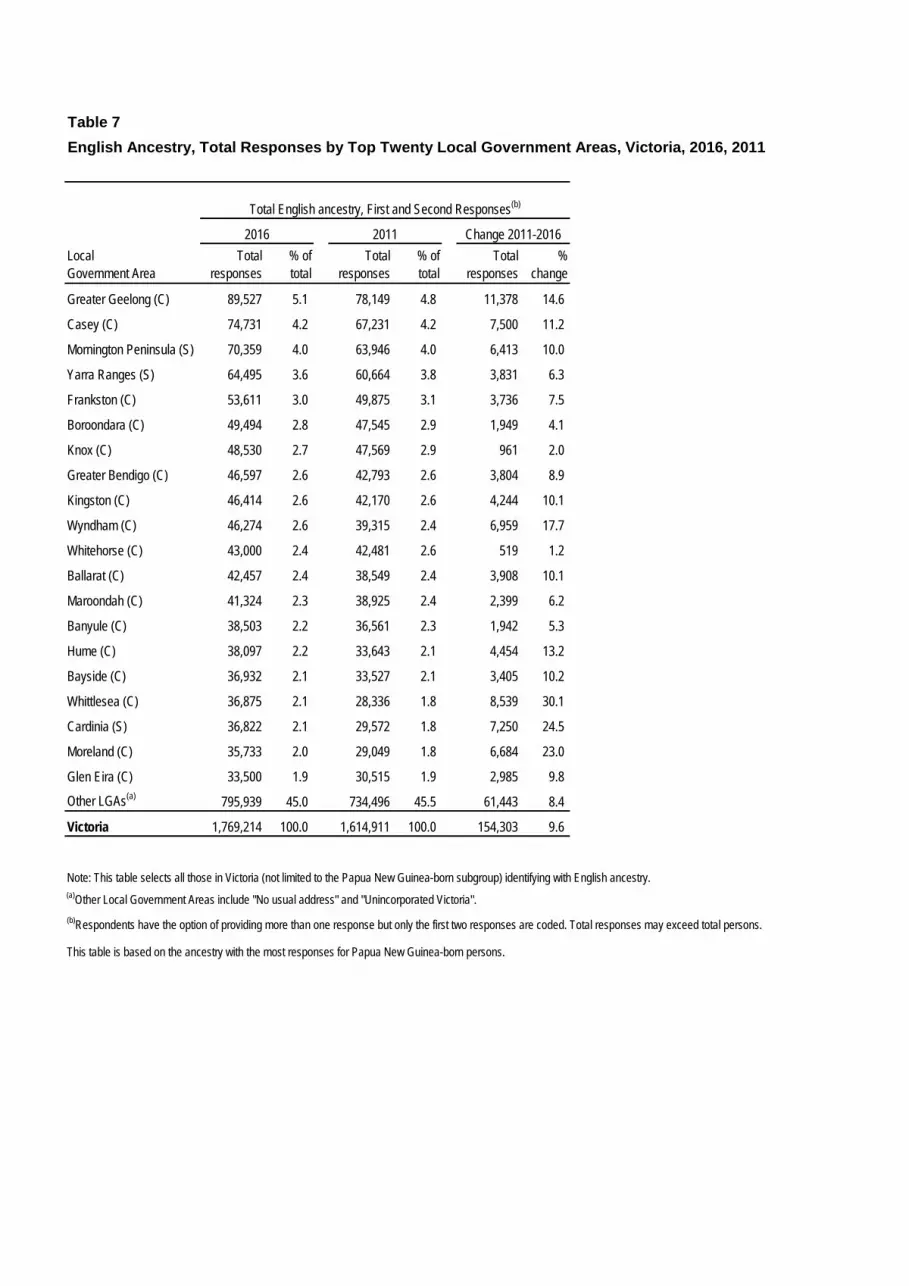
Table 7English Ancestry, Total Responses by Top Twenty Local Government Areas, Victoria, 2016, 2011
Local Government Area
Total responses
% oftotal
Total responses
% oftotal
Total responses
%change
Greater Geelong (C) 89,527 5.1 78,149 4.8 11,378 14.6
Casey (C) 74,731 4.2 67,231 4.2 7,500 11.2
Mornington Peninsula (S) 70,359 4.0 63,946 4.0 6,413 10.0
Yarra Ranges (S) 64,495 3.6 60,664 3.8 3,831 6.3
Frankston (C) 53,611 3.0 49,875 3.1 3,736 7.5
Boroondara (C) 49,494 2.8 47,545 2.9 1,949 4.1
Knox (C) 48,530 2.7 47,569 2.9 961 2.0
Greater Bendigo (C) 46,597 2.6 42,793 2.6 3,804 8.9
Kingston (C) 46,414 2.6 42,170 2.6 4,244 10.1
Wyndham (C) 46,274 2.6 39,315 2.4 6,959 17.7
Whitehorse (C) 43,000 2.4 42,481 2.6 519 1.2
Ballarat (C) 42,457 2.4 38,549 2.4 3,908 10.1
Maroondah (C) 41,324 2.3 38,925 2.4 2,399 6.2
Banyule (C) 38,503 2.2 36,561 2.3 1,942 5.3
Hume (C) 38,097 2.2 33,643 2.1 4,454 13.2
Bayside (C) 36,932 2.1 33,527 2.1 3,405 10.2
Whittlesea (C) 36,875 2.1 28,336 1.8 8,539 30.1
Cardinia (S) 36,822 2.1 29,572 1.8 7,250 24.5
Moreland (C) 35,733 2.0 29,049 1.8 6,684 23.0
Glen Eira (C) 33,500 1.9 30,515 1.9 2,985 9.8
Other LGAs(a) 795,939 45.0 734,496 45.5 61,443 8.4
Victoria 1,769,214 100.0 1,614,911 100.0 154,303 9.6
Note: This table selects all those in Victoria (not limited to the Papua New Guinea-born subgroup) identifying with English ancestry.(a)Other Local Government Areas include "No usual address" and "Unincorporated Victoria".(b)Respondents have the option of providing more than one response but only the first two responses are coded. Total responses may exceed total persons.
This table is based on the ancestry with the most responses for Papua New Guinea-born persons.
2016 2011 Change 2011-2016
Total English ancestry, First and Second Responses(b)
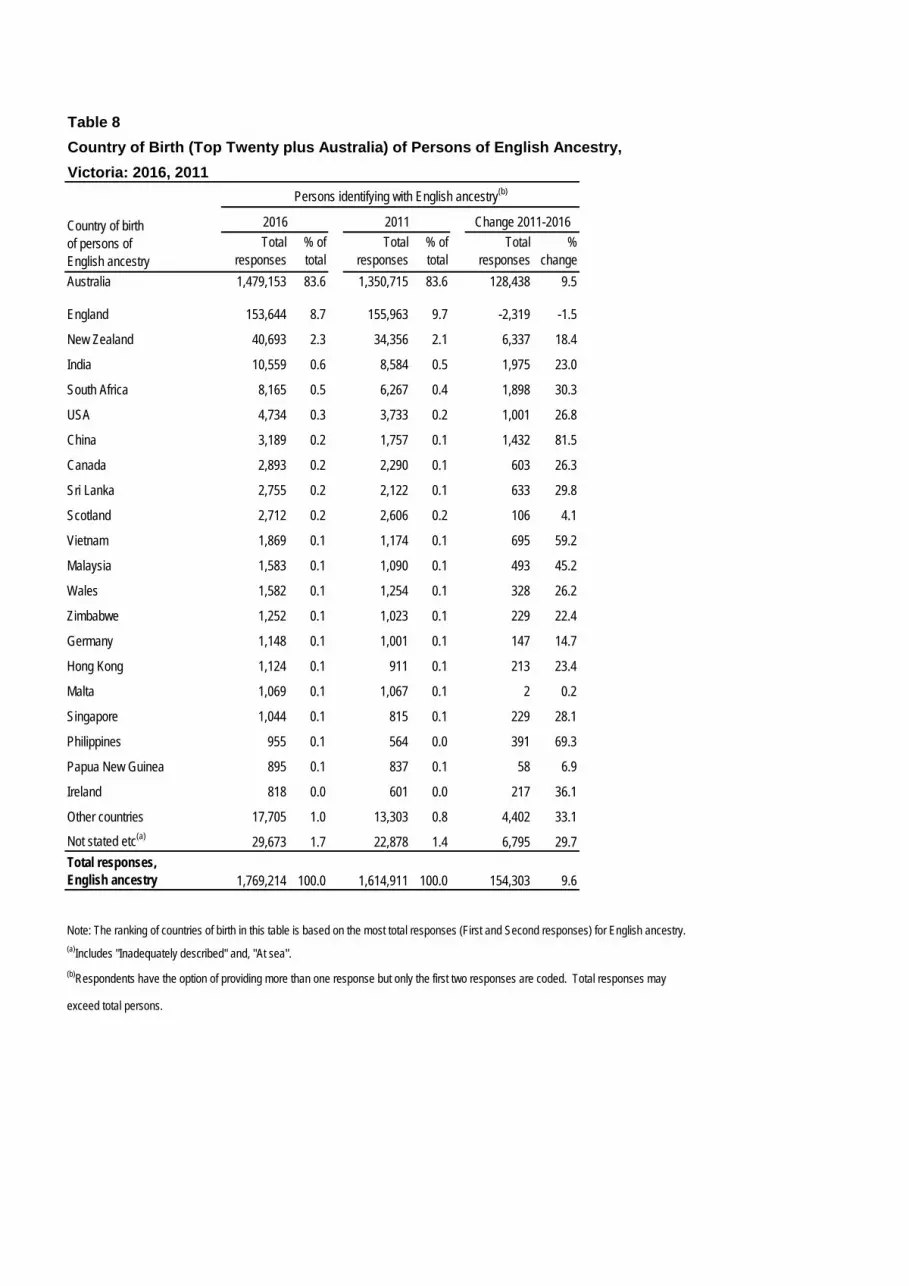
Table 8Country of Birth (Top Twenty plus Australia) of Persons of English Ancestry,Victoria: 2016, 2011
Total responses
% oftotal
Total responses
% of total
Total responses
%change
Australia 1,479,153 83.6 1,350,715 83.6 128,438 9.5
England 153,644 8.7 155,963 9.7 -2,319 -1.5
New Zealand 40,693 2.3 34,356 2.1 6,337 18.4
India 10,559 0.6 8,584 0.5 1,975 23.0
South Africa 8,165 0.5 6,267 0.4 1,898 30.3
USA 4,734 0.3 3,733 0.2 1,001 26.8
China 3,189 0.2 1,757 0.1 1,432 81.5
Canada 2,893 0.2 2,290 0.1 603 26.3
Sri Lanka 2,755 0.2 2,122 0.1 633 29.8
Scotland 2,712 0.2 2,606 0.2 106 4.1
Vietnam 1,869 0.1 1,174 0.1 695 59.2
Malaysia 1,583 0.1 1,090 0.1 493 45.2
Wales 1,582 0.1 1,254 0.1 328 26.2
Zimbabwe 1,252 0.1 1,023 0.1 229 22.4
Germany 1,148 0.1 1,001 0.1 147 14.7
Hong Kong 1,124 0.1 911 0.1 213 23.4
Malta 1,069 0.1 1,067 0.1 2 0.2
Singapore 1,044 0.1 815 0.1 229 28.1
Philippines 955 0.1 564 0.0 391 69.3
Papua New Guinea 895 0.1 837 0.1 58 6.9
Ireland 818 0.0 601 0.0 217 36.1
Other countries 17,705 1.0 13,303 0.8 4,402 33.1
Not stated etc(a) 29,673 1.7 22,878 1.4 6,795 29.7Total responses, English ancestry 1,769,214 100.0 1,614,911 100.0 154,303 9.6
Note: The ranking of countries of birth in this table is based on the most total responses (First and Second responses) for English ancestry.(a)Includes "Inadequately described" and, "At sea".(b)Respondents have the option of providing more than one response but only the first two responses are coded. Total responses may
exceed total persons.
Country of birth of persons of English ancestry
Persons identifying with English ancestry(b)
2016 2011 Change 2011-2016
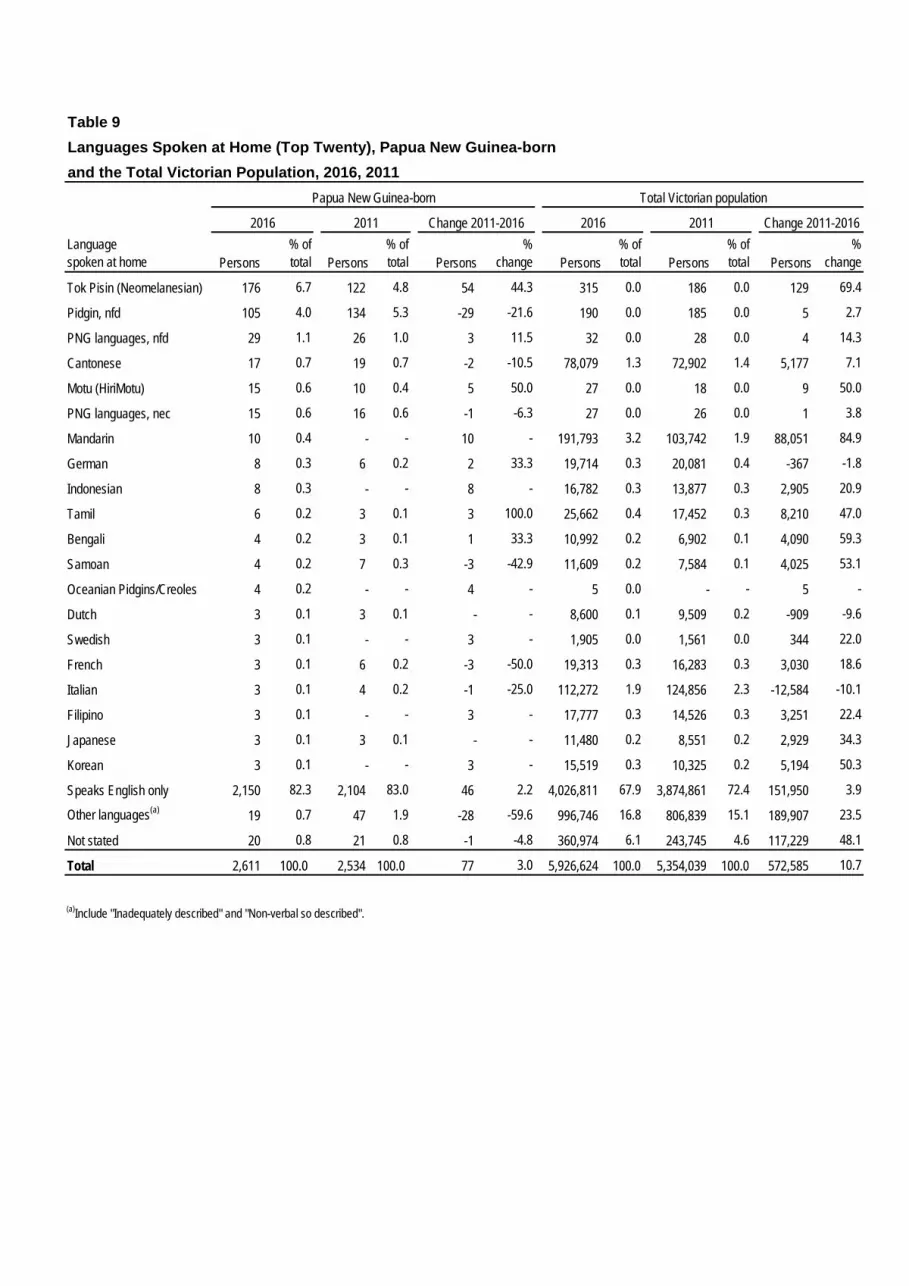
Table 9Languages Spoken at Home (Top Twenty), Papua New Guinea-bornand the Total Victorian Population, 2016, 2011
Languagespoken at home Persons
% of total Persons
% of total Persons
% change Persons
% of total Persons
% of total Persons
%change
Tok Pisin (Neomelanesian) 176 6.7 122 4.8 54 44.3 315 0.0 186 0.0 129 69.4
Pidgin, nfd 105 4.0 134 5.3 -29 -21.6 190 0.0 185 0.0 5 2.7
PNG languages, nfd 29 1.1 26 1.0 3 11.5 32 0.0 28 0.0 4 14.3
Cantonese 17 0.7 19 0.7 -2 -10.5 78,079 1.3 72,902 1.4 5,177 7.1
Motu (HiriMotu) 15 0.6 10 0.4 5 50.0 27 0.0 18 0.0 9 50.0
PNG languages, nec 15 0.6 16 0.6 -1 -6.3 27 0.0 26 0.0 1 3.8
Mandarin 10 0.4 - - 10 - 191,793 3.2 103,742 1.9 88,051 84.9
German 8 0.3 6 0.2 2 33.3 19,714 0.3 20,081 0.4 -367 -1.8
Indonesian 8 0.3 - - 8 - 16,782 0.3 13,877 0.3 2,905 20.9
Tamil 6 0.2 3 0.1 3 100.0 25,662 0.4 17,452 0.3 8,210 47.0
Bengali 4 0.2 3 0.1 1 33.3 10,992 0.2 6,902 0.1 4,090 59.3
Samoan 4 0.2 7 0.3 -3 -42.9 11,609 0.2 7,584 0.1 4,025 53.1
Oceanian Pidgins/Creoles 4 0.2 - - 4 - 5 0.0 - - 5 -
Dutch 3 0.1 3 0.1 - - 8,600 0.1 9,509 0.2 -909 -9.6
Swedish 3 0.1 - - 3 - 1,905 0.0 1,561 0.0 344 22.0
French 3 0.1 6 0.2 -3 -50.0 19,313 0.3 16,283 0.3 3,030 18.6
Italian 3 0.1 4 0.2 -1 -25.0 112,272 1.9 124,856 2.3 -12,584 -10.1
Filipino 3 0.1 - - 3 - 17,777 0.3 14,526 0.3 3,251 22.4
Japanese 3 0.1 3 0.1 - - 11,480 0.2 8,551 0.2 2,929 34.3
Korean 3 0.1 - - 3 - 15,519 0.3 10,325 0.2 5,194 50.3
Speaks English only 2,150 82.3 2,104 83.0 46 2.2 4,026,811 67.9 3,874,861 72.4 151,950 3.9
Other languages(a) 19 0.7 47 1.9 -28 -59.6 996,746 16.8 806,839 15.1 189,907 23.5
Not stated 20 0.8 21 0.8 -1 -4.8 360,974 6.1 243,745 4.6 117,229 48.1
Total 2,611 100.0 2,534 100.0 77 3.0 5,926,624 100.0 5,354,039 100.0 572,585 10.7
(a)Include "Inadequately described" and "Non-verbal so described".
Papua New Guinea-born Total Victorian population
2016 2011 Change 2011-2016 2016 2011 Change 2011-2016
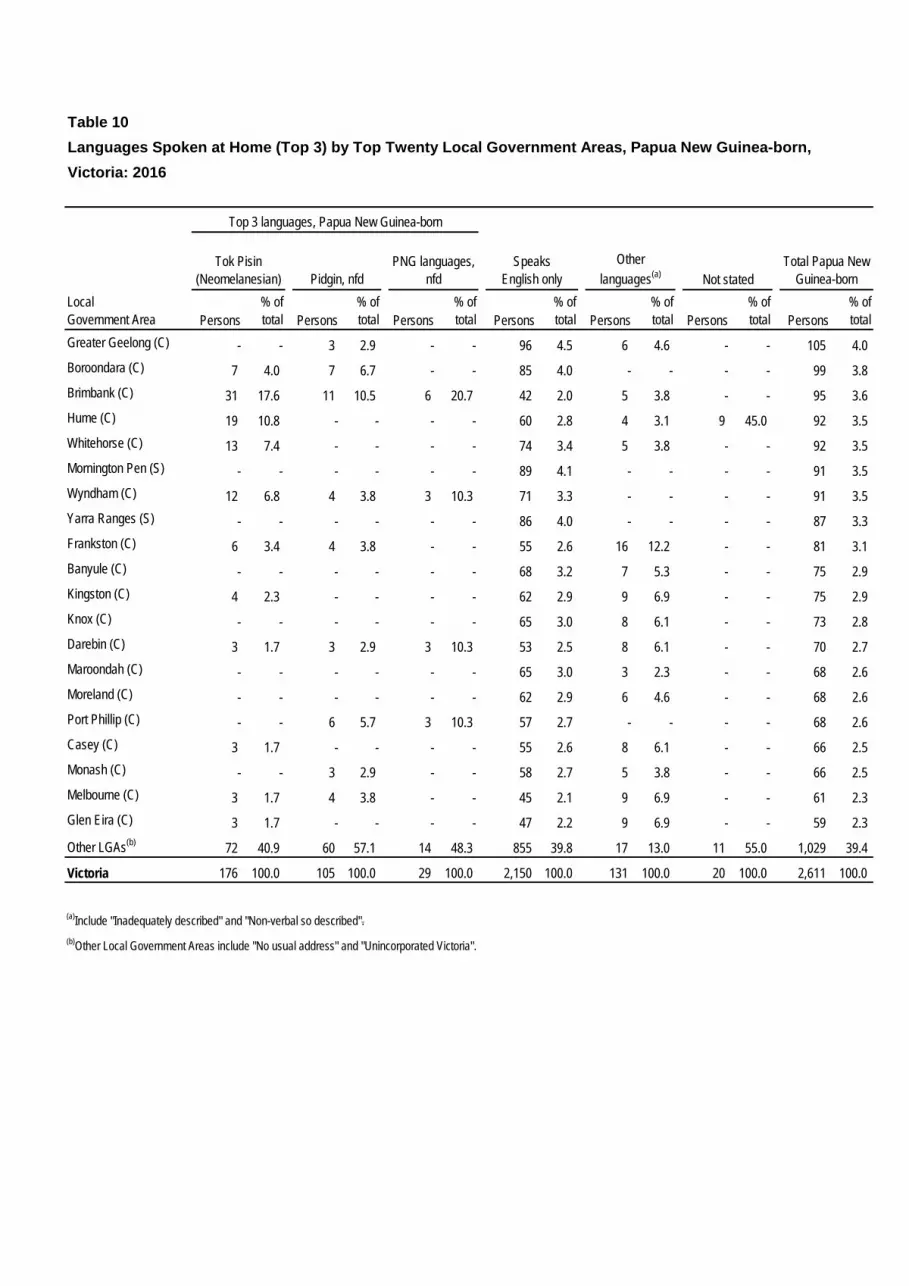
Table 10Languages Spoken at Home (Top 3) by Top Twenty Local Government Areas, Papua New Guinea-born, Victoria: 2016
LocalGovernment Area Persons
% of total Persons
% of total Persons
% of total Persons
% of total Persons
% of total Persons
% of total Persons
% of total
Greater Geelong (C) - - 3 2.9 - - 96 4.5 6 4.6 - - 105 4.0Boroondara (C) 7 4.0 7 6.7 - - 85 4.0 - - - - 99 3.8Brimbank (C) 31 17.6 11 10.5 6 20.7 42 2.0 5 3.8 - - 95 3.6Hume (C) 19 10.8 - - - - 60 2.8 4 3.1 9 45.0 92 3.5Whitehorse (C) 13 7.4 - - - - 74 3.4 5 3.8 - - 92 3.5Mornington Pen (S) - - - - - - 89 4.1 - - - - 91 3.5Wyndham (C) 12 6.8 4 3.8 3 10.3 71 3.3 - - - - 91 3.5Yarra Ranges (S) - - - - - - 86 4.0 - - - - 87 3.3Frankston (C) 6 3.4 4 3.8 - - 55 2.6 16 12.2 - - 81 3.1Banyule (C) - - - - - - 68 3.2 7 5.3 - - 75 2.9Kingston (C) 4 2.3 - - - - 62 2.9 9 6.9 - - 75 2.9Knox (C) - - - - - - 65 3.0 8 6.1 - - 73 2.8Darebin (C) 3 1.7 3 2.9 3 10.3 53 2.5 8 6.1 - - 70 2.7Maroondah (C) - - - - - - 65 3.0 3 2.3 - - 68 2.6Moreland (C) - - - - - - 62 2.9 6 4.6 - - 68 2.6Port Phillip (C) - - 6 5.7 3 10.3 57 2.7 - - - - 68 2.6Casey (C) 3 1.7 - - - - 55 2.6 8 6.1 - - 66 2.5Monash (C) - - 3 2.9 - - 58 2.7 5 3.8 - - 66 2.5Melbourne (C) 3 1.7 4 3.8 - - 45 2.1 9 6.9 - - 61 2.3Glen Eira (C) 3 1.7 - - - - 47 2.2 9 6.9 - - 59 2.3
Other LGAs(b) 72 40.9 60 57.1 14 48.3 855 39.8 17 13.0 11 55.0 1,029 39.4
Victoria 176 100.0 105 100.0 29 100.0 2,150 100.0 131 100.0 20 100.0 2,611 100.0
(a)Include "Inadequately described" and "Non-verbal so described".(b)Other Local Government Areas include "No usual address" and "Unincorporated Victoria".
Total Papua New Guinea-born
Top 3 languages, Papua New Guinea-born
Tok Pisin (Neomelanesian) Pidgin, nfd
PNG languages, nfd Not stated
SpeaksEnglish only
Otherlanguages(a)
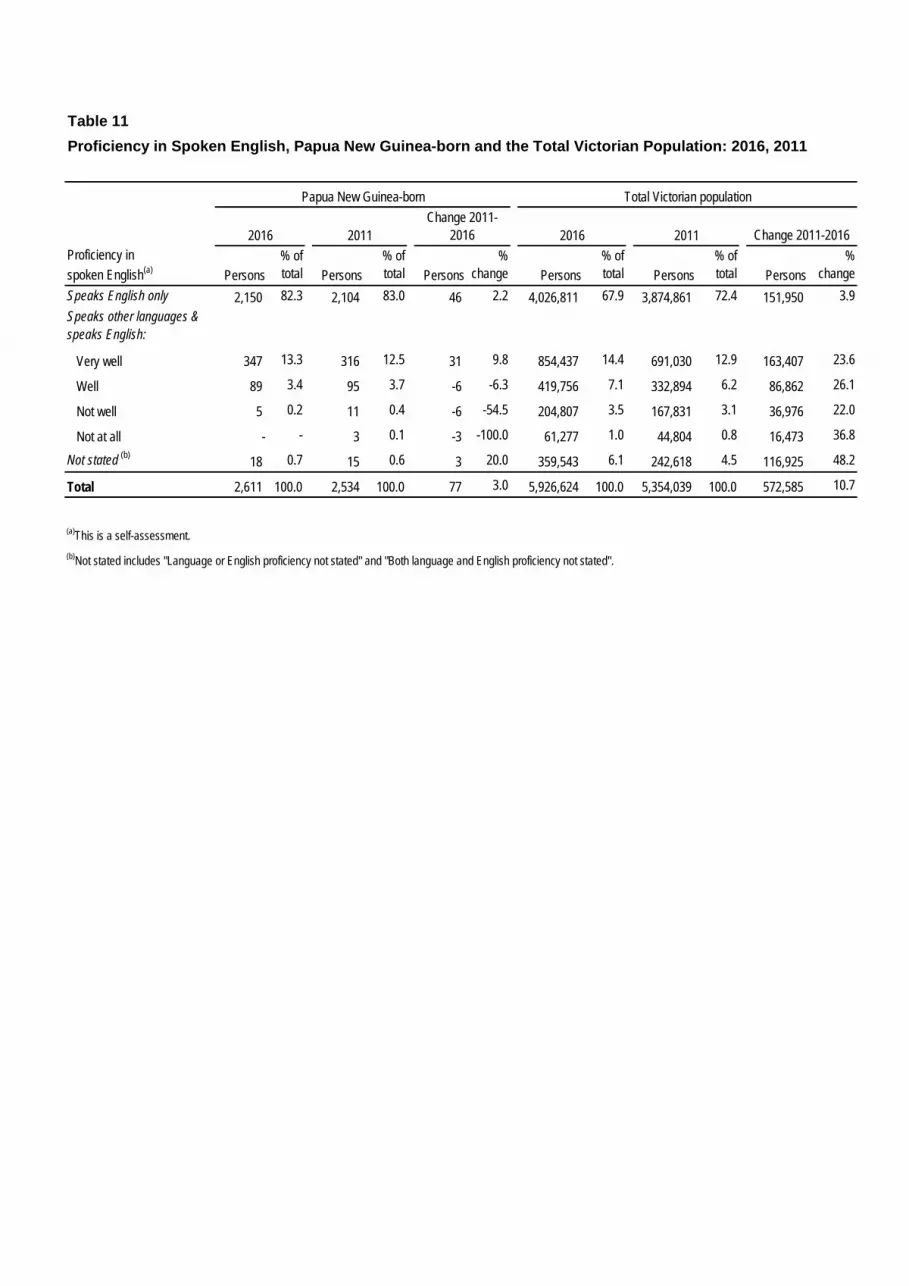
Table 11Proficiency in Spoken English, Papua New Guinea-born and the Total Victorian Population: 2016, 2011
Persons% of total Persons
% of total Persons
% change Persons
% of total Persons
% of total Persons
%change
Speaks English only 2,150 82.3 2,104 83.0 46 2.2 4,026,811 67.9 3,874,861 72.4 151,950 3.9 Speaks other languages & speaks English:
Very well 347 13.3 316 12.5 31 9.8 854,437 14.4 691,030 12.9 163,407 23.6
Well 89 3.4 95 3.7 -6 -6.3 419,756 7.1 332,894 6.2 86,862 26.1
Not well 5 0.2 11 0.4 -6 -54.5 204,807 3.5 167,831 3.1 36,976 22.0
Not at all - - 3 0.1 -3 -100.0 61,277 1.0 44,804 0.8 16,473 36.8
Not stated (b) 18 0.7 15 0.6 3 20.0 359,543 6.1 242,618 4.5 116,925 48.2
Total 2,611 100.0 2,534 100.0 77 3.0 5,926,624 100.0 5,354,039 100.0 572,585 10.7
(a)This is a self-assessment. (b)Not stated includes "Language or English proficiency not stated" and "Both language and English proficiency not stated".
Papua New Guinea-born Total Victorian population
2011 Change 2011-2016Proficiency in spoken English(a)
20162016 2011Change 2011-
2016
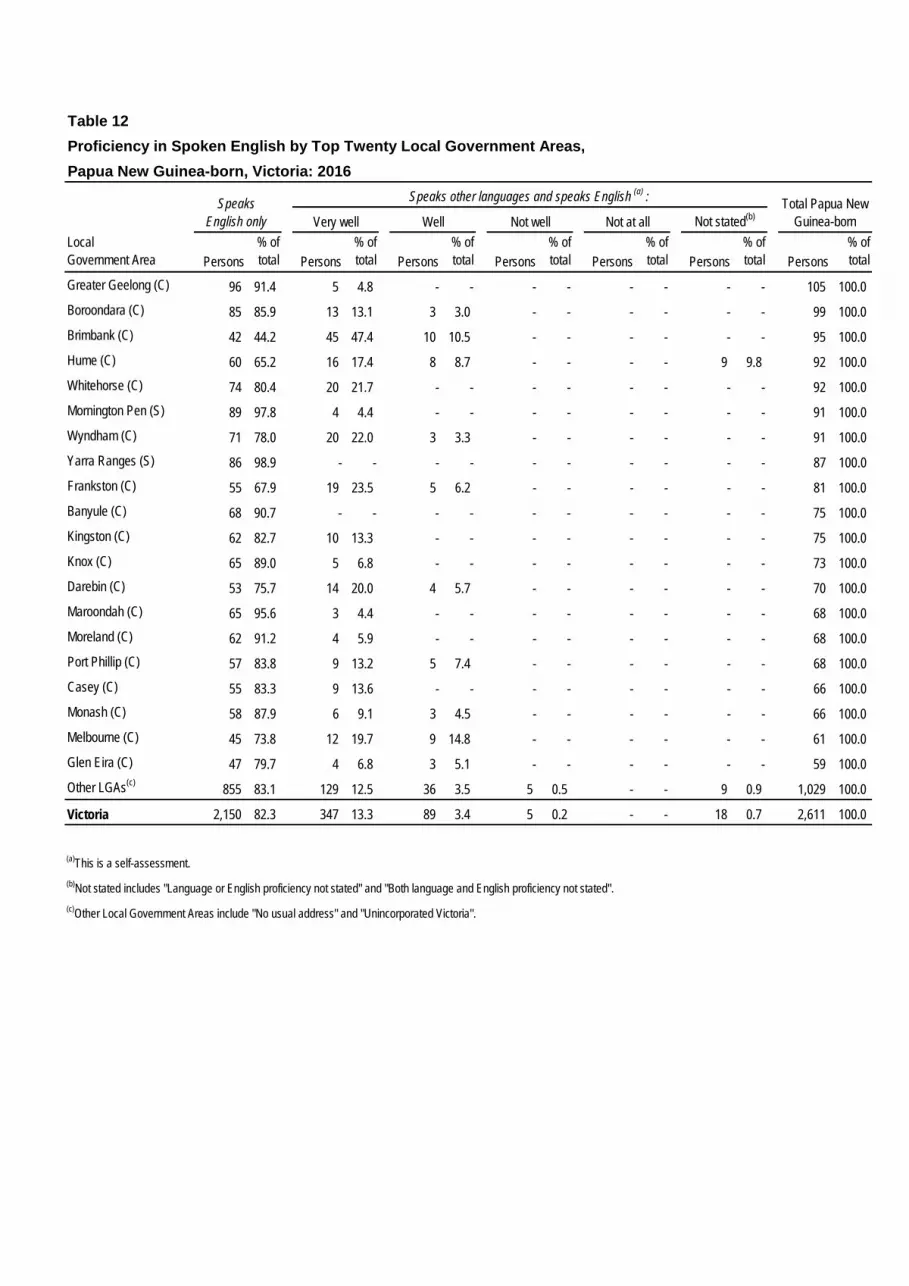
Table 12Proficiency in Spoken English by Top Twenty Local Government Areas,Papua New Guinea-born, Victoria: 2016
LocalGovernment Area Persons
% of total Persons
% of total Persons
% of total Persons
% of total Persons
% of total Persons
% of total Persons
% of total
Greater Geelong (C) 96 91.4 5 4.8 - - - - - - - - 105 100.0Boroondara (C) 85 85.9 13 13.1 3 3.0 - - - - - - 99 100.0Brimbank (C) 42 44.2 45 47.4 10 10.5 - - - - - - 95 100.0Hume (C) 60 65.2 16 17.4 8 8.7 - - - - 9 9.8 92 100.0Whitehorse (C) 74 80.4 20 21.7 - - - - - - - - 92 100.0Mornington Pen (S) 89 97.8 4 4.4 - - - - - - - - 91 100.0Wyndham (C) 71 78.0 20 22.0 3 3.3 - - - - - - 91 100.0Yarra Ranges (S) 86 98.9 - - - - - - - - - - 87 100.0Frankston (C) 55 67.9 19 23.5 5 6.2 - - - - - - 81 100.0Banyule (C) 68 90.7 - - - - - - - - - - 75 100.0Kingston (C) 62 82.7 10 13.3 - - - - - - - - 75 100.0Knox (C) 65 89.0 5 6.8 - - - - - - - - 73 100.0Darebin (C) 53 75.7 14 20.0 4 5.7 - - - - - - 70 100.0Maroondah (C) 65 95.6 3 4.4 - - - - - - - - 68 100.0Moreland (C) 62 91.2 4 5.9 - - - - - - - - 68 100.0Port Phillip (C) 57 83.8 9 13.2 5 7.4 - - - - - - 68 100.0Casey (C) 55 83.3 9 13.6 - - - - - - - - 66 100.0Monash (C) 58 87.9 6 9.1 3 4.5 - - - - - - 66 100.0Melbourne (C) 45 73.8 12 19.7 9 14.8 - - - - - - 61 100.0Glen Eira (C) 47 79.7 4 6.8 3 5.1 - - - - - - 59 100.0Other LGAs(c) 855 83.1 129 12.5 36 3.5 5 0.5 - - 9 0.9 1,029 100.0
Victoria 2,150 82.3 347 13.3 89 3.4 5 0.2 - - 18 0.7 2,611 100.0
(a)This is a self-assessment. (b)Not stated includes "Language or English proficiency not stated" and "Both language and English proficiency not stated".(c)Other Local Government Areas include "No usual address" and "Unincorporated Victoria".
Total Papua New Guinea-born
Speaks English only
Speaks other languages and speaks English (a) :
Very well Well Not well Not at all Not stated(b)
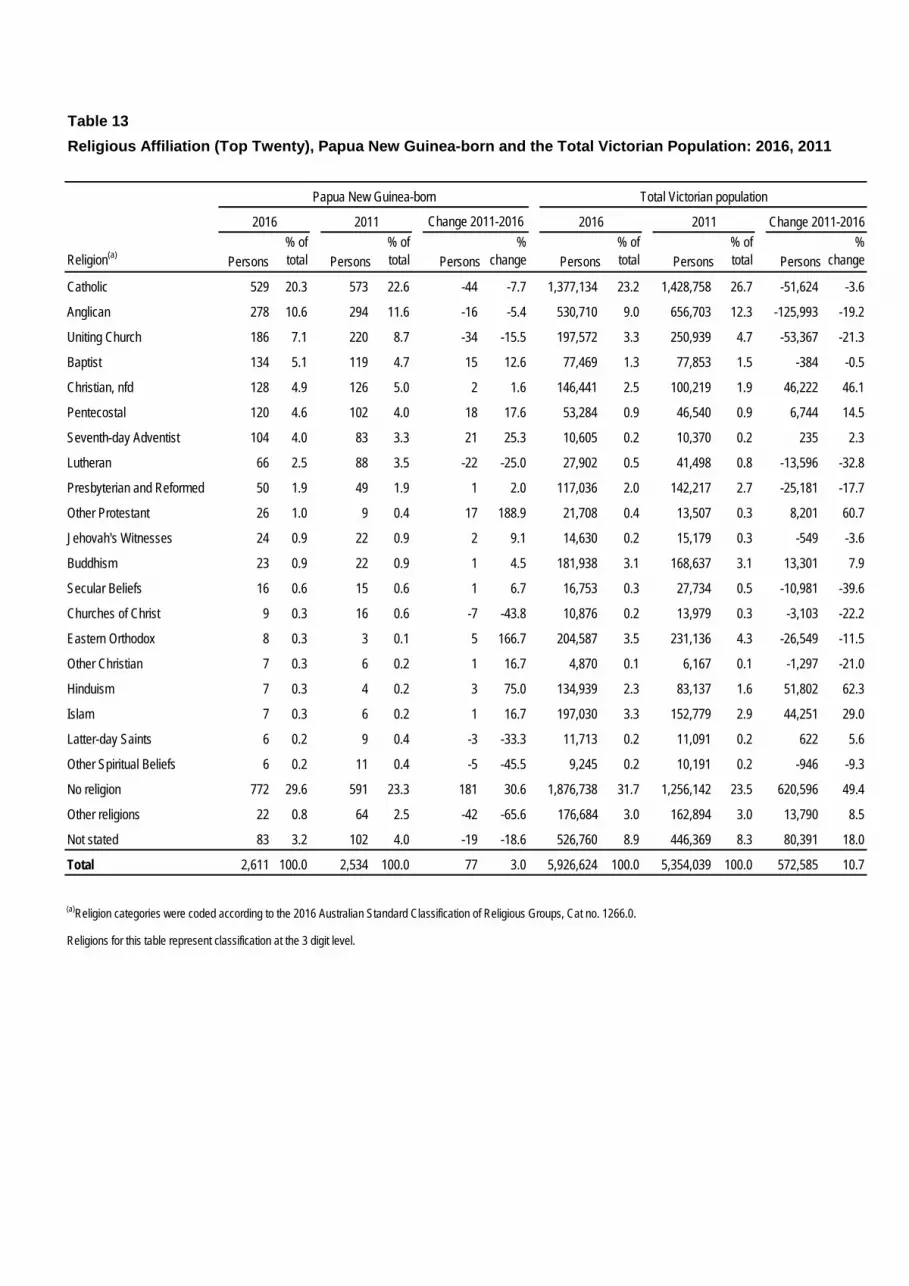
Table 13Religious Affiliation (Top Twenty), Papua New Guinea-born and the Total Victorian Population: 2016, 2011
Religion(a) Persons% of total Persons
% of total Persons
% change Persons
% of total Persons
% of total Persons
%change
Catholic 529 20.3 573 22.6 -44 -7.7 1,377,134 23.2 1,428,758 26.7 -51,624 -3.6
Anglican 278 10.6 294 11.6 -16 -5.4 530,710 9.0 656,703 12.3 -125,993 -19.2
Uniting Church 186 7.1 220 8.7 -34 -15.5 197,572 3.3 250,939 4.7 -53,367 -21.3
Baptist 134 5.1 119 4.7 15 12.6 77,469 1.3 77,853 1.5 -384 -0.5
Christian, nfd 128 4.9 126 5.0 2 1.6 146,441 2.5 100,219 1.9 46,222 46.1
Pentecostal 120 4.6 102 4.0 18 17.6 53,284 0.9 46,540 0.9 6,744 14.5
Seventh-day Adventist 104 4.0 83 3.3 21 25.3 10,605 0.2 10,370 0.2 235 2.3
Lutheran 66 2.5 88 3.5 -22 -25.0 27,902 0.5 41,498 0.8 -13,596 -32.8
Presbyterian and Reformed 50 1.9 49 1.9 1 2.0 117,036 2.0 142,217 2.7 -25,181 -17.7
Other Protestant 26 1.0 9 0.4 17 188.9 21,708 0.4 13,507 0.3 8,201 60.7
Jehovah's Witnesses 24 0.9 22 0.9 2 9.1 14,630 0.2 15,179 0.3 -549 -3.6
Buddhism 23 0.9 22 0.9 1 4.5 181,938 3.1 168,637 3.1 13,301 7.9
Secular Beliefs 16 0.6 15 0.6 1 6.7 16,753 0.3 27,734 0.5 -10,981 -39.6
Churches of Christ 9 0.3 16 0.6 -7 -43.8 10,876 0.2 13,979 0.3 -3,103 -22.2
Eastern Orthodox 8 0.3 3 0.1 5 166.7 204,587 3.5 231,136 4.3 -26,549 -11.5
Other Christian 7 0.3 6 0.2 1 16.7 4,870 0.1 6,167 0.1 -1,297 -21.0
Hinduism 7 0.3 4 0.2 3 75.0 134,939 2.3 83,137 1.6 51,802 62.3
Islam 7 0.3 6 0.2 1 16.7 197,030 3.3 152,779 2.9 44,251 29.0
Latter-day Saints 6 0.2 9 0.4 -3 -33.3 11,713 0.2 11,091 0.2 622 5.6
Other Spiritual Beliefs 6 0.2 11 0.4 -5 -45.5 9,245 0.2 10,191 0.2 -946 -9.3
No religion 772 29.6 591 23.3 181 30.6 1,876,738 31.7 1,256,142 23.5 620,596 49.4
Other religions 22 0.8 64 2.5 -42 -65.6 176,684 3.0 162,894 3.0 13,790 8.5
Not stated 83 3.2 102 4.0 -19 -18.6 526,760 8.9 446,369 8.3 80,391 18.0
Total 2,611 100.0 2,534 100.0 77 3.0 5,926,624 100.0 5,354,039 100.0 572,585 10.7
(a)Religion categories were coded according to the 2016 Australian Standard Classification of Religious Groups, Cat no. 1266.0.
Religions for this table represent classification at the 3 digit level.
Papua New Guinea-born Total Victorian population
2016 2011 Change 2011-2016 2016 2011 Change 2011-2016
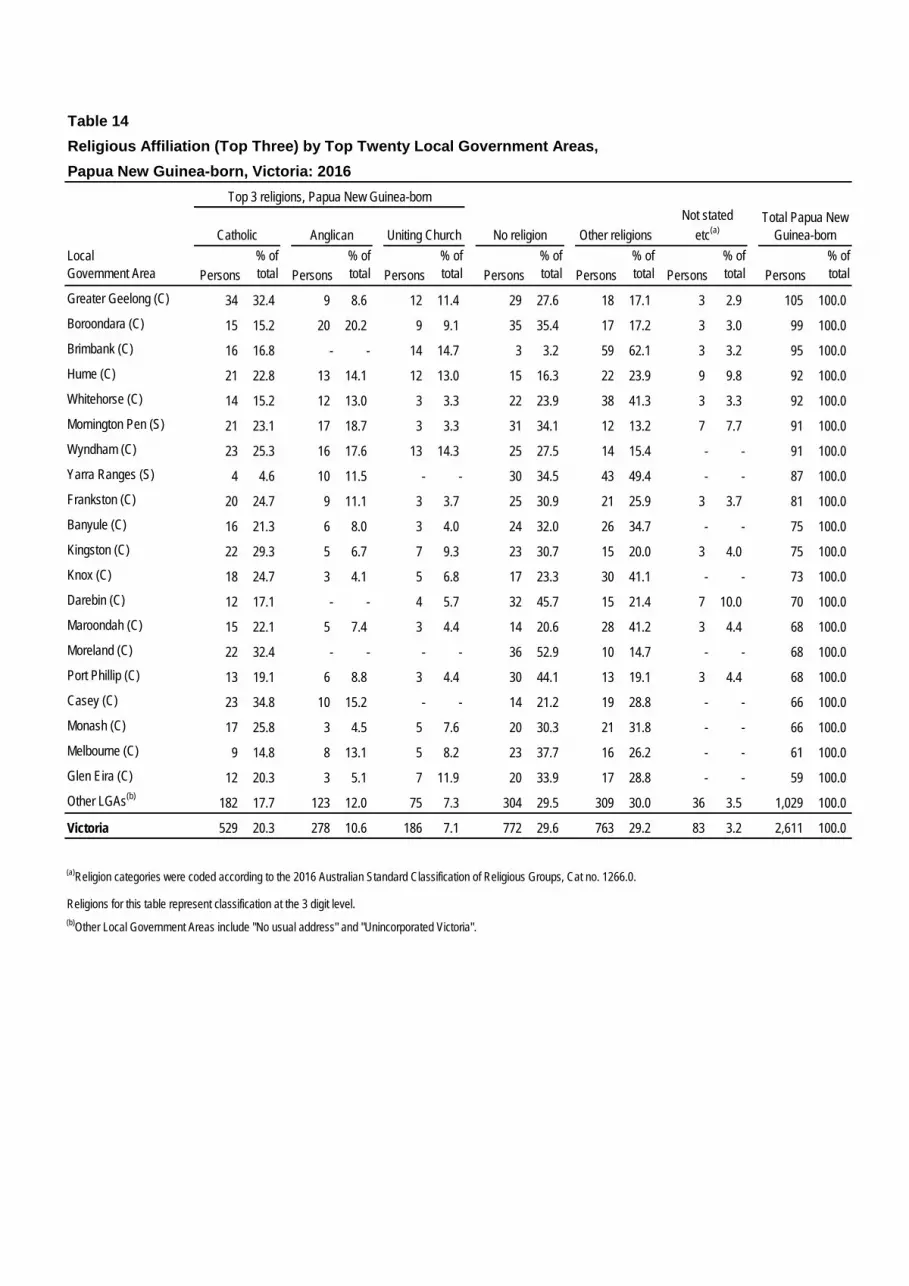
Table 14Religious Affiliation (Top Three) by Top Twenty Local Government Areas,Papua New Guinea-born, Victoria: 2016
LocalGovernment Area Persons
% of total Persons
% of total Persons
% of total Persons
% of total Persons
% of total Persons
% of total Persons
% of total
Greater Geelong (C) 34 32.4 9 8.6 12 11.4 29 27.6 18 17.1 3 2.9 105 100.0Boroondara (C) 15 15.2 20 20.2 9 9.1 35 35.4 17 17.2 3 3.0 99 100.0Brimbank (C) 16 16.8 - - 14 14.7 3 3.2 59 62.1 3 3.2 95 100.0Hume (C) 21 22.8 13 14.1 12 13.0 15 16.3 22 23.9 9 9.8 92 100.0Whitehorse (C) 14 15.2 12 13.0 3 3.3 22 23.9 38 41.3 3 3.3 92 100.0Mornington Pen (S) 21 23.1 17 18.7 3 3.3 31 34.1 12 13.2 7 7.7 91 100.0Wyndham (C) 23 25.3 16 17.6 13 14.3 25 27.5 14 15.4 - - 91 100.0Yarra Ranges (S) 4 4.6 10 11.5 - - 30 34.5 43 49.4 - - 87 100.0Frankston (C) 20 24.7 9 11.1 3 3.7 25 30.9 21 25.9 3 3.7 81 100.0Banyule (C) 16 21.3 6 8.0 3 4.0 24 32.0 26 34.7 - - 75 100.0Kingston (C) 22 29.3 5 6.7 7 9.3 23 30.7 15 20.0 3 4.0 75 100.0Knox (C) 18 24.7 3 4.1 5 6.8 17 23.3 30 41.1 - - 73 100.0Darebin (C) 12 17.1 - - 4 5.7 32 45.7 15 21.4 7 10.0 70 100.0Maroondah (C) 15 22.1 5 7.4 3 4.4 14 20.6 28 41.2 3 4.4 68 100.0Moreland (C) 22 32.4 - - - - 36 52.9 10 14.7 - - 68 100.0Port Phillip (C) 13 19.1 6 8.8 3 4.4 30 44.1 13 19.1 3 4.4 68 100.0Casey (C) 23 34.8 10 15.2 - - 14 21.2 19 28.8 - - 66 100.0Monash (C) 17 25.8 3 4.5 5 7.6 20 30.3 21 31.8 - - 66 100.0Melbourne (C) 9 14.8 8 13.1 5 8.2 23 37.7 16 26.2 - - 61 100.0Glen Eira (C) 12 20.3 3 5.1 7 11.9 20 33.9 17 28.8 - - 59 100.0Other LGAs(b) 182 17.7 123 12.0 75 7.3 304 29.5 309 30.0 36 3.5 1,029 100.0
Victoria 529 20.3 278 10.6 186 7.1 772 29.6 763 29.2 83 3.2 2,611 100.0
(a)Religion categories were coded according to the 2016 Australian Standard Classification of Religious Groups, Cat no. 1266.0.
Religions for this table represent classification at the 3 digit level.(b)Other Local Government Areas include "No usual address" and "Unincorporated Victoria".
Total Papua New Guinea-born
Top 3 religions, Papua New Guinea-born
Catholic Anglican Uniting Church No religion Other religionsNot stated
etc(a)
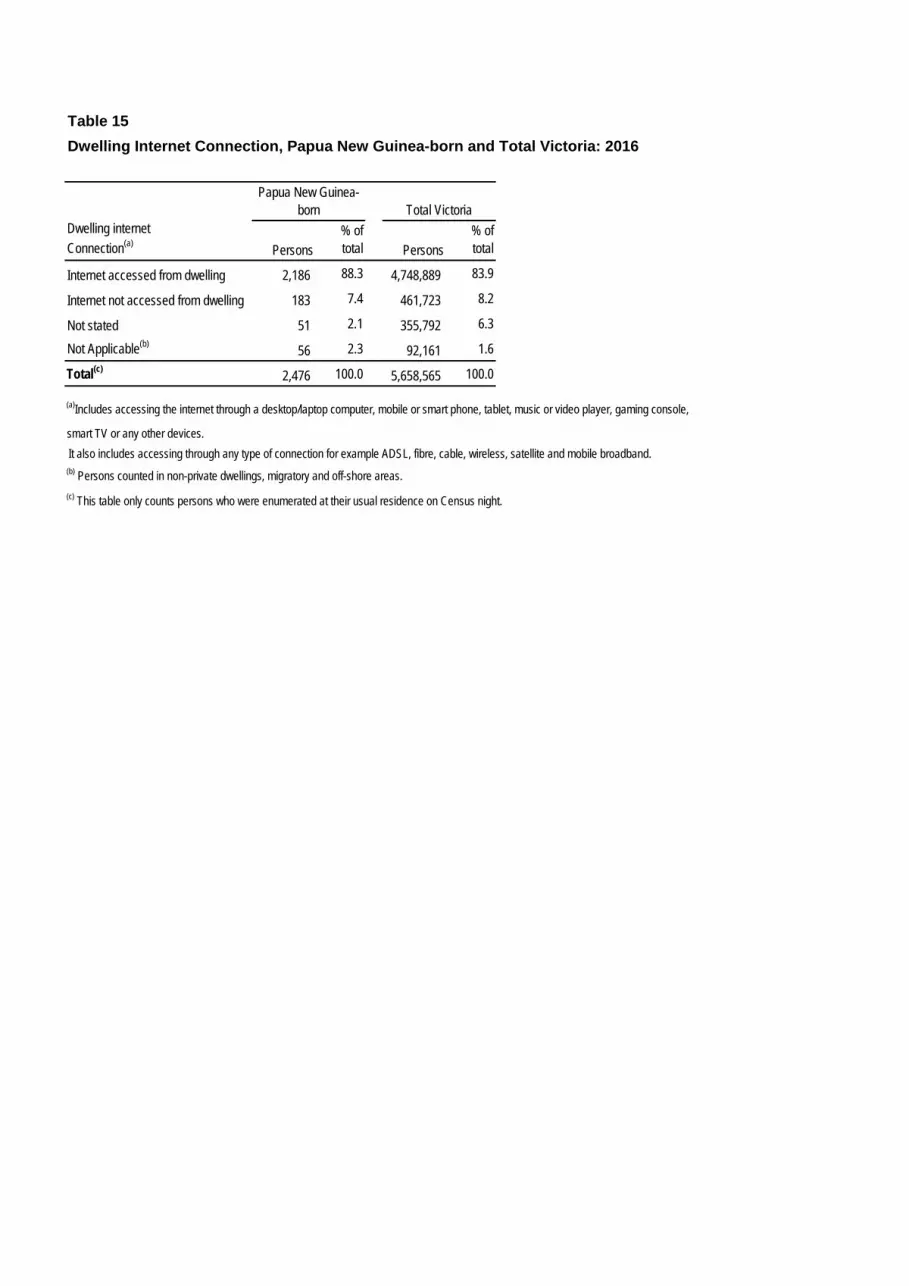
Table 15Dwelling Internet Connection, Papua New Guinea-born and Total Victoria: 2016
Dwelling internetConnection(a) Persons
% of total Persons
% of total
Internet accessed from dwelling 2,186 88.3 4,748,889 83.9
Internet not accessed from dwelling 183 7.4 461,723 8.2
Not stated 51 2.1 355,792 6.3
Not Applicable(b) 56 2.3 92,161 1.6
Total(c) 2,476 100.0 5,658,565 100.0
(a)Includes accessing the internet through a desktop/laptop computer, mobile or smart phone, tablet, music or video player, gaming console,
smart TV or any other devices. It also includes accessing through any type of connection for example ADSL, fibre, cable, wireless, satellite and mobile broadband.(b) Persons counted in non-private dwellings, migratory and off-shore areas.(c) This table only counts persons who were enumerated at their usual residence on Census night.
Papua New Guinea-born Total Victoria
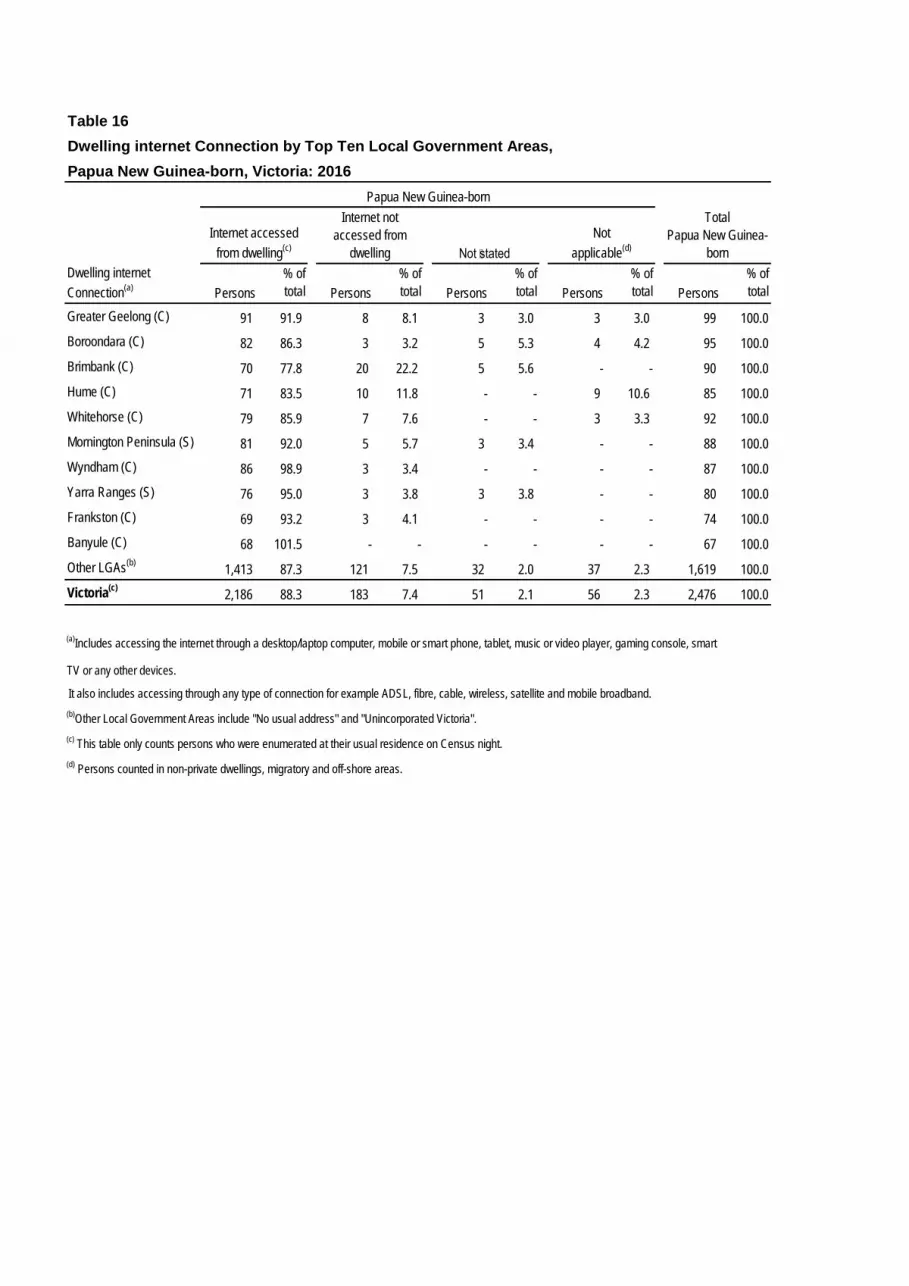
Table 16Dwelling internet Connection by Top Ten Local Government Areas,Papua New Guinea-born, Victoria: 2016
Persons% oftotal Persons
% oftotal Persons
% oftotal Persons
% oftotal Persons
% oftotal
Greater Geelong (C) 91 91.9 8 8.1 3 3.0 3 3.0 99 100.0Boroondara (C) 82 86.3 3 3.2 5 5.3 4 4.2 95 100.0Brimbank (C) 70 77.8 20 22.2 5 5.6 - - 90 100.0Hume (C) 71 83.5 10 11.8 - - 9 10.6 85 100.0Whitehorse (C) 79 85.9 7 7.6 - - 3 3.3 92 100.0Mornington Peninsula (S) 81 92.0 5 5.7 3 3.4 - - 88 100.0Wyndham (C) 86 98.9 3 3.4 - - - - 87 100.0Yarra Ranges (S) 76 95.0 3 3.8 3 3.8 - - 80 100.0Frankston (C) 69 93.2 3 4.1 - - - - 74 100.0Banyule (C) 68 101.5 - - - - - - 67 100.0Other LGAs(b) 1,413 87.3 121 7.5 32 2.0 37 2.3 1,619 100.0Victoria(c) 2,186 88.3 183 7.4 51 2.1 56 2.3 2,476 100.0
(a)Includes accessing the internet through a desktop/laptop computer, mobile or smart phone, tablet, music or video player, gaming console, smart
TV or any other devices. It also includes accessing through any type of connection for example ADSL, fibre, cable, wireless, satellite and mobile broadband.(b)Other Local Government Areas include "No usual address" and "Unincorporated Victoria".(c) This table only counts persons who were enumerated at their usual residence on Census night.(d) Persons counted in non-private dwellings, migratory and off-shore areas.
Not statedNot
applicable(d)
Papua New Guinea-bornTotal
Papua New Guinea-born
Dwelling internetConnection(a)
Internet accessed from dwelling(c)
Internet not accessed from
dwelling
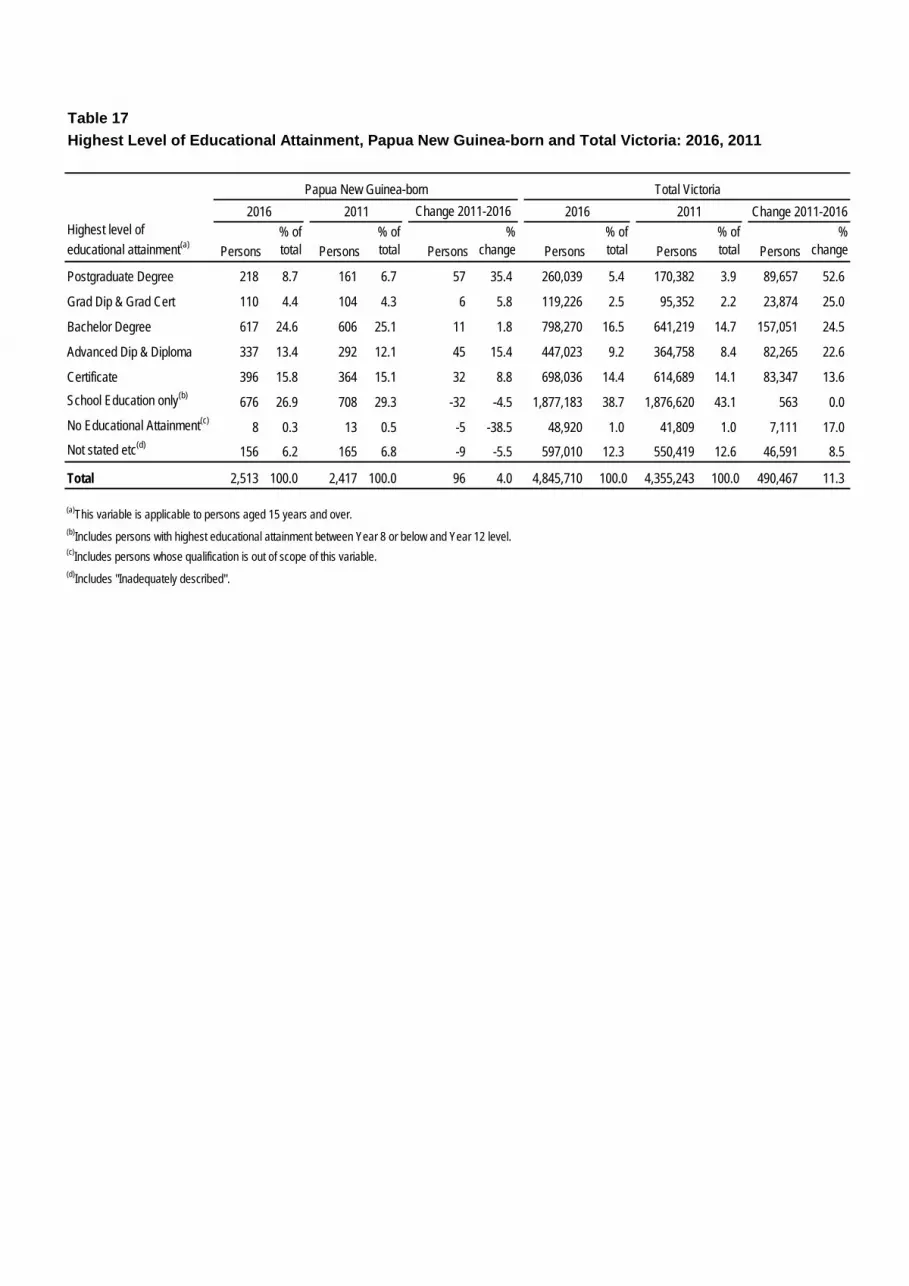
Table 17Highest Level of Educational Attainment, Papua New Guinea-born and Total Victoria: 2016, 2011
Highest level ofeducational attainment(a) Persons
% of total Persons
% of total Persons
% change Persons
% of total Persons
% of total Persons
%change
Postgraduate Degree 218 8.7 161 6.7 57 35.4 260,039 5.4 170,382 3.9 89,657 52.6
Grad Dip & Grad Cert 110 4.4 104 4.3 6 5.8 119,226 2.5 95,352 2.2 23,874 25.0
Bachelor Degree 617 24.6 606 25.1 11 1.8 798,270 16.5 641,219 14.7 157,051 24.5
Advanced Dip & Diploma 337 13.4 292 12.1 45 15.4 447,023 9.2 364,758 8.4 82,265 22.6
Certificate 396 15.8 364 15.1 32 8.8 698,036 14.4 614,689 14.1 83,347 13.6School Education only(b) 676 26.9 708 29.3 -32 -4.5 1,877,183 38.7 1,876,620 43.1 563 0.0No Educational Attainment(c) 8 0.3 13 0.5 -5 -38.5 48,920 1.0 41,809 1.0 7,111 17.0Not stated etc(d) 156 6.2 165 6.8 -9 -5.5 597,010 12.3 550,419 12.6 46,591 8.5
Total 2,513 100.0 2,417 100.0 96 4.0 4,845,710 100.0 4,355,243 100.0 490,467 11.3
(a)This variable is applicable to persons aged 15 years and over.(b)Includes persons with highest educational attainment between Year 8 or below and Year 12 level.(c)Includes persons whose qualification is out of scope of this variable.(d)Includes "Inadequately described".
Papua New Guinea-born Total Victoria2016 2011 Change 2011-2016 2016 2011 Change 2011-2016
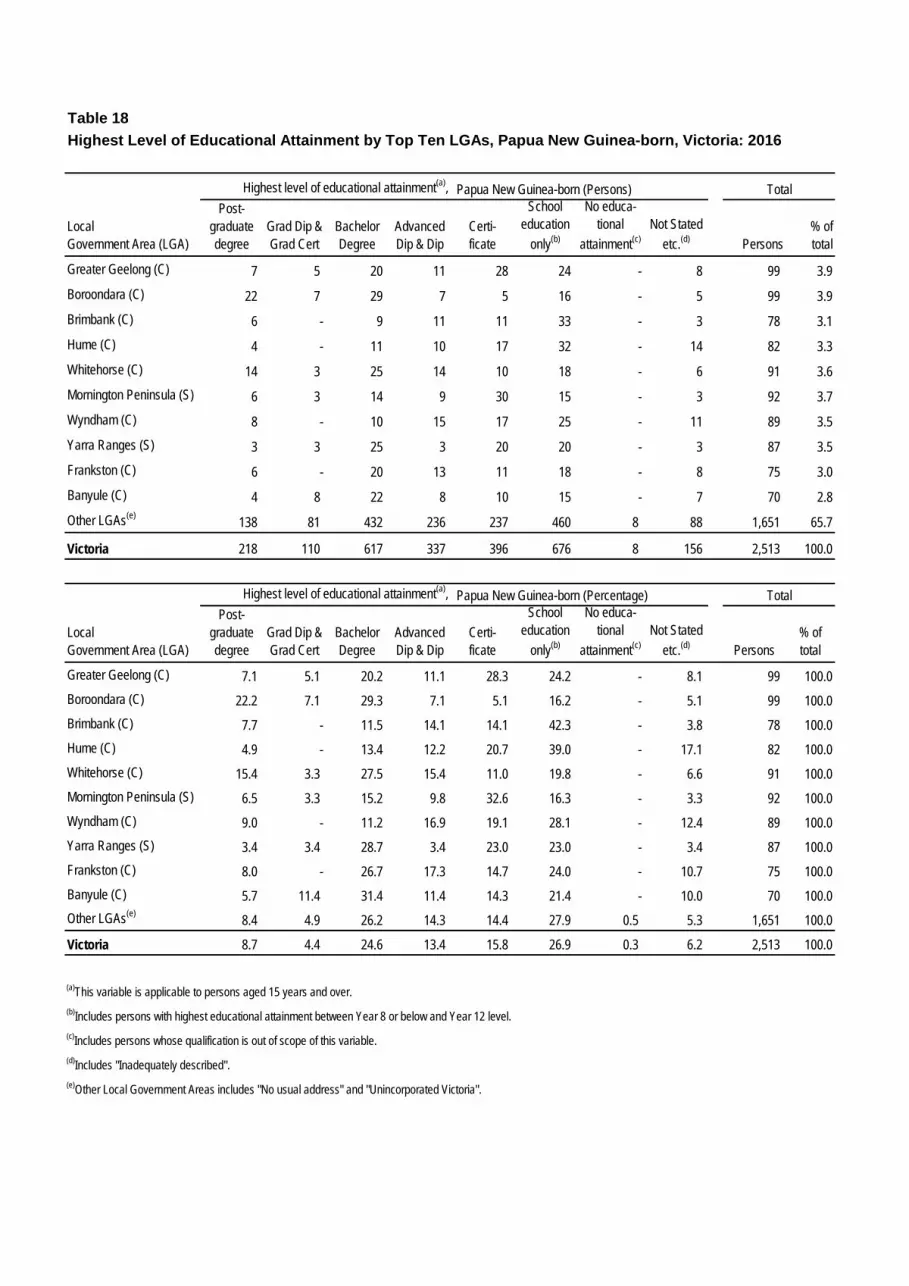
Table 18Highest Level of Educational Attainment by Top Ten LGAs, Papua New Guinea-born, Victoria: 2016
Highest level of educational attainment(a), Papua New Guinea-born (Persons)
LocalGovernment Area (LGA)
Post-graduate degree
Grad Dip & Grad Cert
Bachelor Degree
Advanced Dip & Dip
Certi-ficate
School education
only(b)
No educa-tional
attainment(c)Not Stated
etc.(d) Persons% oftotal
Greater Geelong (C) 7 5 20 11 28 24 - 8 99 3.9Boroondara (C) 22 7 29 7 5 16 - 5 99 3.9Brimbank (C) 6 - 9 11 11 33 - 3 78 3.1Hume (C) 4 - 11 10 17 32 - 14 82 3.3Whitehorse (C) 14 3 25 14 10 18 - 6 91 3.6Mornington Peninsula (S) 6 3 14 9 30 15 - 3 92 3.7Wyndham (C) 8 - 10 15 17 25 - 11 89 3.5Yarra Ranges (S) 3 3 25 3 20 20 - 3 87 3.5Frankston (C) 6 - 20 13 11 18 - 8 75 3.0Banyule (C) 4 8 22 8 10 15 - 7 70 2.8Other LGAs(e) 138 81 432 236 237 460 8 88 1,651 65.7
Victoria 218 110 617 337 396 676 8 156 2,513 100.0
Highest level of educational attainment(a), Papua New Guinea-born (Percentage)
LocalGovernment Area (LGA)
Post-graduate degree
Grad Dip & Grad Cert
Bachelor Degree
Advanced Dip & Dip
Certi-ficate
School education
only(b)
No educa-tional
attainment(c)Not Stated
etc.(d) Persons% oftotal
Greater Geelong (C) 7.1 5.1 20.2 11.1 28.3 24.2 - 8.1 99 100.0Boroondara (C) 22.2 7.1 29.3 7.1 5.1 16.2 - 5.1 99 100.0Brimbank (C) 7.7 - 11.5 14.1 14.1 42.3 - 3.8 78 100.0Hume (C) 4.9 - 13.4 12.2 20.7 39.0 - 17.1 82 100.0Whitehorse (C) 15.4 3.3 27.5 15.4 11.0 19.8 - 6.6 91 100.0Mornington Peninsula (S) 6.5 3.3 15.2 9.8 32.6 16.3 - 3.3 92 100.0Wyndham (C) 9.0 - 11.2 16.9 19.1 28.1 - 12.4 89 100.0Yarra Ranges (S) 3.4 3.4 28.7 3.4 23.0 23.0 - 3.4 87 100.0Frankston (C) 8.0 - 26.7 17.3 14.7 24.0 - 10.7 75 100.0Banyule (C) 5.7 11.4 31.4 11.4 14.3 21.4 - 10.0 70 100.0Other LGAs(e) 8.4 4.9 26.2 14.3 14.4 27.9 0.5 5.3 1,651 100.0
Victoria 8.7 4.4 24.6 13.4 15.8 26.9 0.3 6.2 2,513 100.0
(a)This variable is applicable to persons aged 15 years and over.(b)Includes persons with highest educational attainment between Year 8 or below and Year 12 level.(c)Includes persons whose qualification is out of scope of this variable.(d)Includes "Inadequately described".(e)Other Local Government Areas includes "No usual address" and "Unincorporated Victoria".
Total
Total
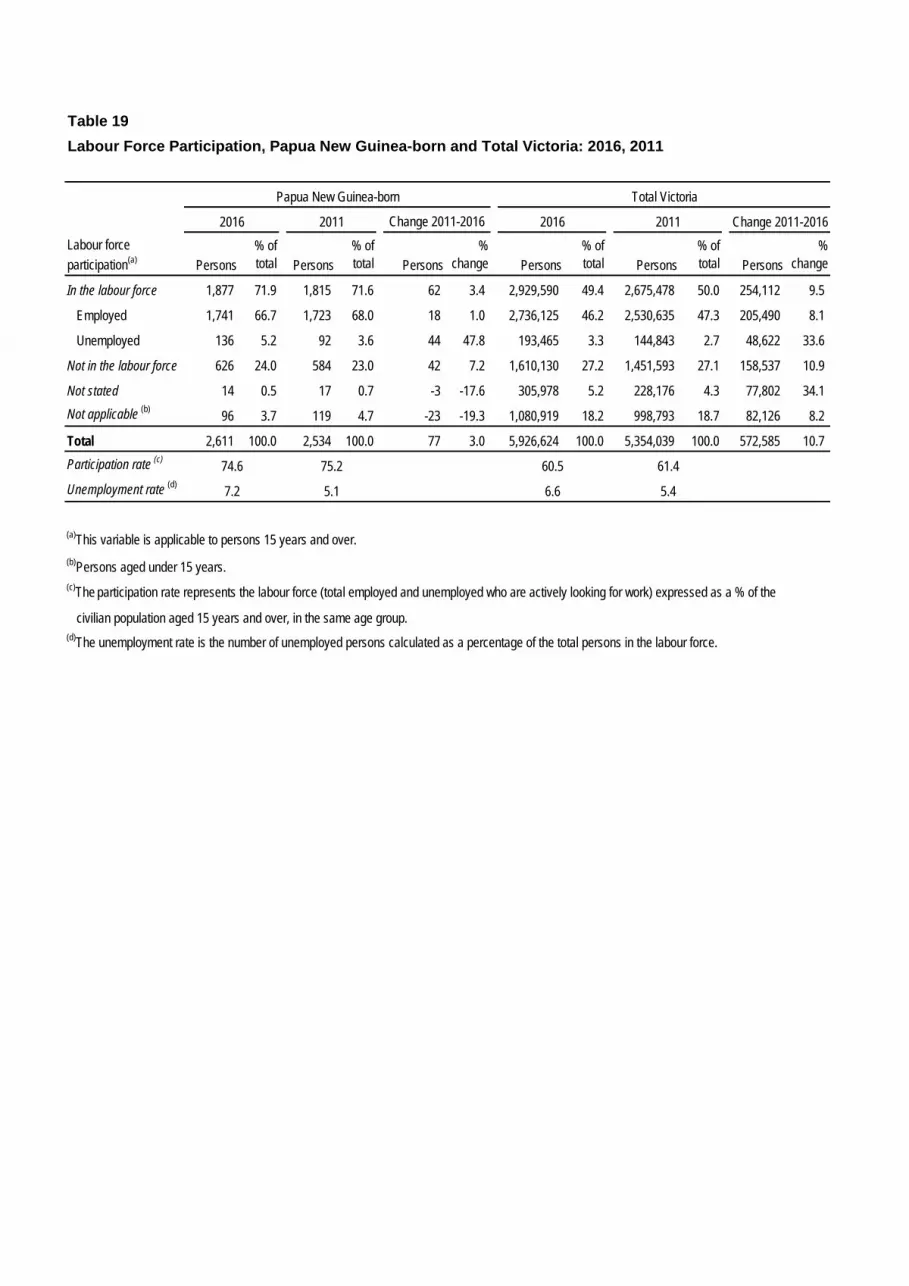
Table 19Labour Force Participation, Papua New Guinea-born and Total Victoria: 2016, 2011
Persons% of total Persons
% of total Persons
% change Persons
% of total Persons
% of total Persons
%change
In the labour force 1,877 71.9 1,815 71.6 62 3.4 2,929,590 49.4 2,675,478 50.0 254,112 9.5
Employed 1,741 66.7 1,723 68.0 18 1.0 2,736,125 46.2 2,530,635 47.3 205,490 8.1
Unemployed 136 5.2 92 3.6 44 47.8 193,465 3.3 144,843 2.7 48,622 33.6
Not in the labour force 626 24.0 584 23.0 42 7.2 1,610,130 27.2 1,451,593 27.1 158,537 10.9
Not stated 14 0.5 17 0.7 -3 -17.6 305,978 5.2 228,176 4.3 77,802 34.1Not applicable (b) 96 3.7 119 4.7 -23 -19.3 1,080,919 18.2 998,793 18.7 82,126 8.2
Total 2,611 100.0 2,534 100.0 77 3.0 5,926,624 100.0 5,354,039 100.0 572,585 10.7Participation rate (c)
Unemployment rate (d)
(a)This variable is applicable to persons 15 years and over. (b)Persons aged under 15 years. (c)The participation rate represents the labour force (total employed and unemployed who are actively looking for work) expressed as a % of the
civilian population aged 15 years and over, in the same age group.(d)The unemployment rate is the number of unemployed persons calculated as a percentage of the total persons in the labour force.
Labour force participation(a)
74.6 75.2 60.5 61.4
5.47.2 5.1 6.6
Papua New Guinea-born Total Victoria
2016 2011 Change 2011-2016 2016 2011 Change 2011-2016
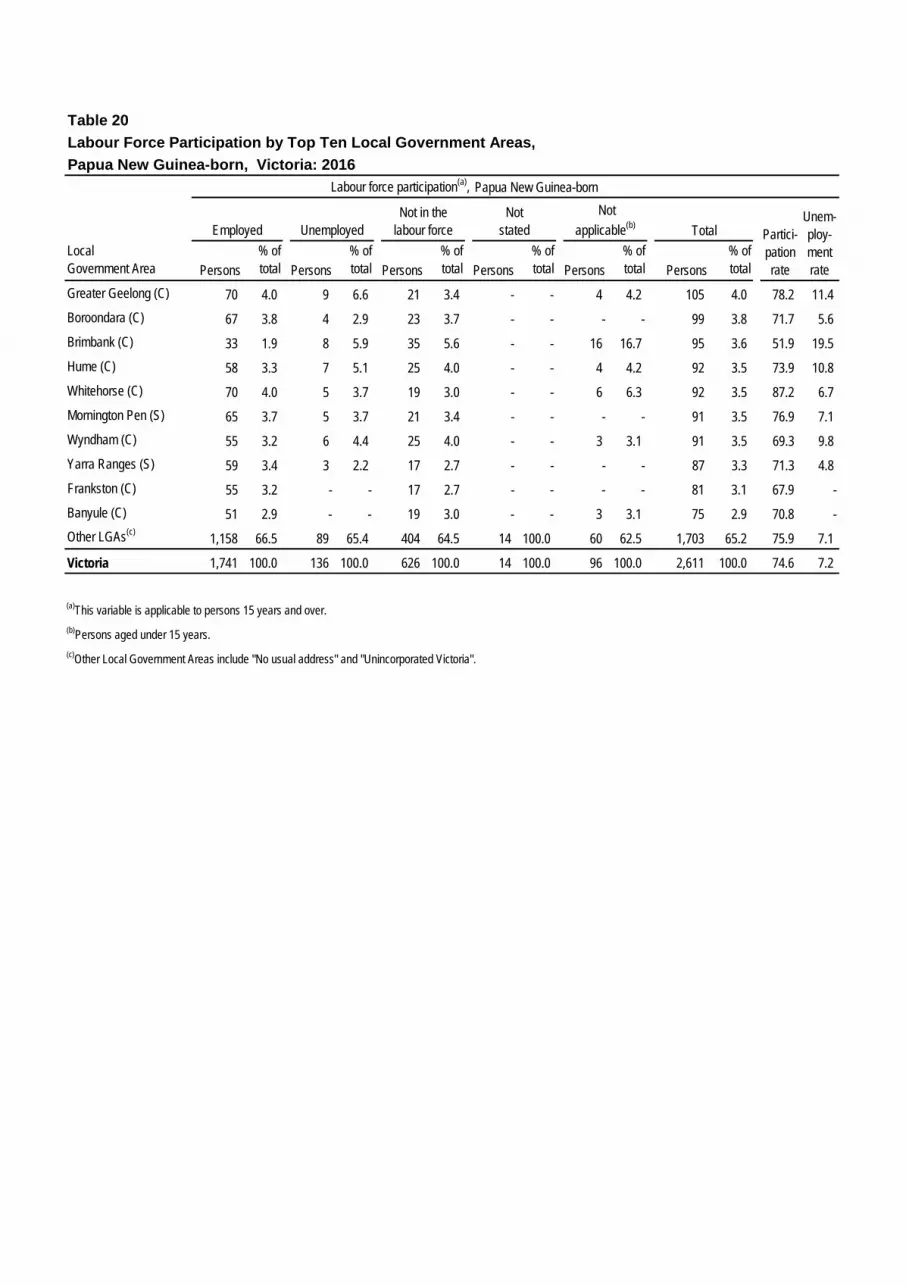
Table 20Labour Force Participation by Top Ten Local Government Areas,Papua New Guinea-born, Victoria: 2016
Papua New Guinea-born
LocalGovernment Area Persons
% of total Persons
% of total Persons
% of total Persons
% of total Persons
% of total Persons
% of total
Greater Geelong (C) 70 4.0 9 6.6 21 3.4 - - 4 4.2 105 4.0 78.2 11.4Boroondara (C) 67 3.8 4 2.9 23 3.7 - - - - 99 3.8 71.7 5.6Brimbank (C) 33 1.9 8 5.9 35 5.6 - - 16 16.7 95 3.6 51.9 19.5Hume (C) 58 3.3 7 5.1 25 4.0 - - 4 4.2 92 3.5 73.9 10.8Whitehorse (C) 70 4.0 5 3.7 19 3.0 - - 6 6.3 92 3.5 87.2 6.7Mornington Pen (S) 65 3.7 5 3.7 21 3.4 - - - - 91 3.5 76.9 7.1Wyndham (C) 55 3.2 6 4.4 25 4.0 - - 3 3.1 91 3.5 69.3 9.8Yarra Ranges (S) 59 3.4 3 2.2 17 2.7 - - - - 87 3.3 71.3 4.8Frankston (C) 55 3.2 - - 17 2.7 - - - - 81 3.1 67.9 -Banyule (C) 51 2.9 - - 19 3.0 - - 3 3.1 75 2.9 70.8 -Other LGAs(c) 1,158 66.5 89 65.4 404 64.5 14 100.0 60 62.5 1,703 65.2 75.9 7.1
Victoria 1,741 100.0 136 100.0 626 100.0 14 100.0 96 100.0 2,611 100.0 74.6 7.2
(a)This variable is applicable to persons 15 years and over. (b)Persons aged under 15 years.(c)Other Local Government Areas include "No usual address" and "Unincorporated Victoria".
Total Partici-pation rate
Unem-ploy-mentrate
Labour force participation(a),
Employed UnemployedNot in the
labour forceNot
stated Not
applicable(b)
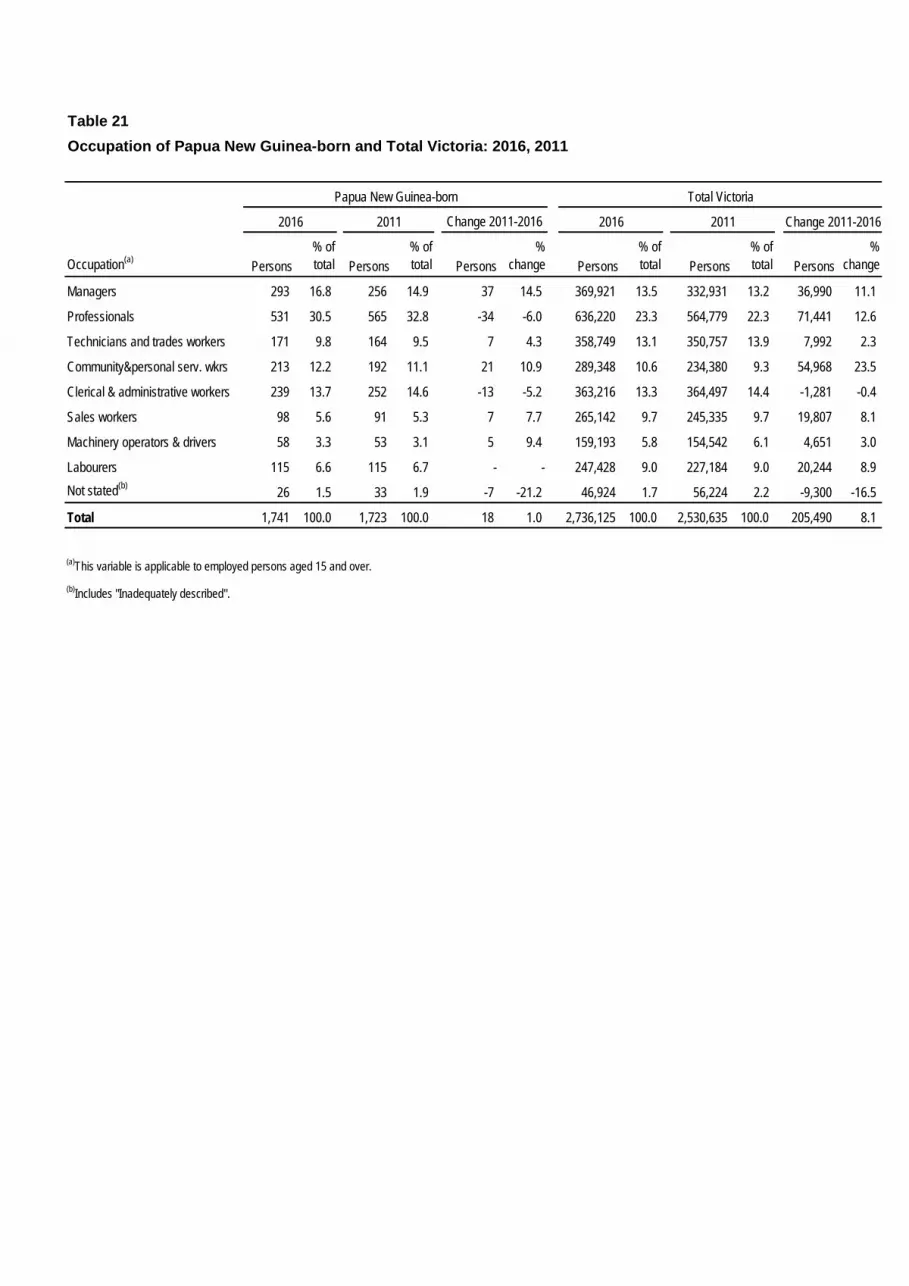
Table 21Occupation of Papua New Guinea-born and Total Victoria: 2016, 2011
Occupation(a) Persons% of total Persons
% of total Persons
% change Persons
% of total Persons
% of total Persons
%change
Managers 293 16.8 256 14.9 37 14.5 369,921 13.5 332,931 13.2 36,990 11.1
Professionals 531 30.5 565 32.8 -34 -6.0 636,220 23.3 564,779 22.3 71,441 12.6
Technicians and trades workers 171 9.8 164 9.5 7 4.3 358,749 13.1 350,757 13.9 7,992 2.3
Community&personal serv. wkrs 213 12.2 192 11.1 21 10.9 289,348 10.6 234,380 9.3 54,968 23.5
Clerical & administrative workers 239 13.7 252 14.6 -13 -5.2 363,216 13.3 364,497 14.4 -1,281 -0.4
Sales workers 98 5.6 91 5.3 7 7.7 265,142 9.7 245,335 9.7 19,807 8.1
Machinery operators & drivers 58 3.3 53 3.1 5 9.4 159,193 5.8 154,542 6.1 4,651 3.0
Labourers 115 6.6 115 6.7 - - 247,428 9.0 227,184 9.0 20,244 8.9Not stated(b) 26 1.5 33 1.9 -7 -21.2 46,924 1.7 56,224 2.2 -9,300 -16.5
Total 1,741 100.0 1,723 100.0 18 1.0 2,736,125 100.0 2,530,635 100.0 205,490 8.1
(a)This variable is applicable to employed persons aged 15 and over.(b)Includes "Inadequately described".
Papua New Guinea-born Total Victoria
2016 2011 Change 2011-2016 2016 2011 Change 2011-2016
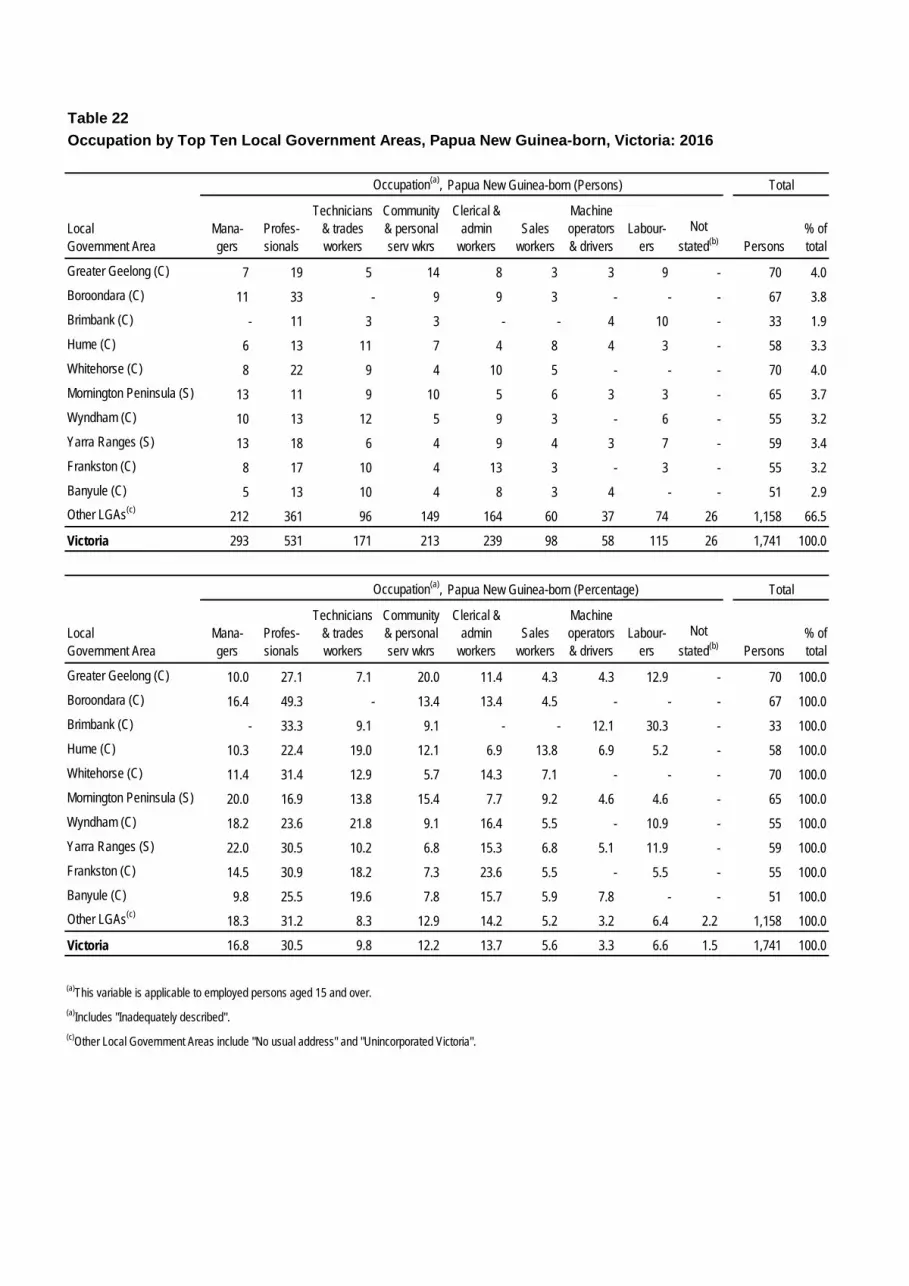
Table 22Occupation by Top Ten Local Government Areas, Papua New Guinea-born, Victoria: 2016
Papua New Guinea-born (Persons)
LocalGovernment Area
Mana-gers
Profes-sionals
Technicians& tradesworkers
Community& personalserv wkrs
Clerical &admin
workersSales
workers
Machineoperators& drivers
Labour-ers
Not stated(b) Persons
% of total
Greater Geelong (C) 7 19 5 14 8 3 3 9 - 70 4.0Boroondara (C) 11 33 - 9 9 3 - - - 67 3.8Brimbank (C) - 11 3 3 - - 4 10 - 33 1.9Hume (C) 6 13 11 7 4 8 4 3 - 58 3.3Whitehorse (C) 8 22 9 4 10 5 - - - 70 4.0Mornington Peninsula (S) 13 11 9 10 5 6 3 3 - 65 3.7Wyndham (C) 10 13 12 5 9 3 - 6 - 55 3.2Yarra Ranges (S) 13 18 6 4 9 4 3 7 - 59 3.4Frankston (C) 8 17 10 4 13 3 - 3 - 55 3.2Banyule (C) 5 13 10 4 8 3 4 - - 51 2.9Other LGAs(c) 212 361 96 149 164 60 37 74 26 1,158 66.5
Victoria 293 531 171 213 239 98 58 115 26 1,741 100.0
Papua New Guinea-born (Percentage)
LocalGovernment Area
Mana-gers
Profes-sionals
Technicians& tradesworkers
Community& personalserv wkrs
Clerical &admin
workersSales
workers
Machineoperators& drivers
Labour-ers
Not stated(b) Persons
% of total
Greater Geelong (C) 10.0 27.1 7.1 20.0 11.4 4.3 4.3 12.9 - 70 100.0Boroondara (C) 16.4 49.3 - 13.4 13.4 4.5 - - - 67 100.0Brimbank (C) - 33.3 9.1 9.1 - - 12.1 30.3 - 33 100.0Hume (C) 10.3 22.4 19.0 12.1 6.9 13.8 6.9 5.2 - 58 100.0Whitehorse (C) 11.4 31.4 12.9 5.7 14.3 7.1 - - - 70 100.0Mornington Peninsula (S) 20.0 16.9 13.8 15.4 7.7 9.2 4.6 4.6 - 65 100.0Wyndham (C) 18.2 23.6 21.8 9.1 16.4 5.5 - 10.9 - 55 100.0Yarra Ranges (S) 22.0 30.5 10.2 6.8 15.3 6.8 5.1 11.9 - 59 100.0Frankston (C) 14.5 30.9 18.2 7.3 23.6 5.5 - 5.5 - 55 100.0Banyule (C) 9.8 25.5 19.6 7.8 15.7 5.9 7.8 - - 51 100.0Other LGAs(c) 18.3 31.2 8.3 12.9 14.2 5.2 3.2 6.4 2.2 1,158 100.0
Victoria 16.8 30.5 9.8 12.2 13.7 5.6 3.3 6.6 1.5 1,741 100.0
(a)This variable is applicable to employed persons aged 15 and over.(a)Includes "Inadequately described".(c)Other Local Government Areas include "No usual address" and "Unincorporated Victoria".
TotalOccupation(a),
Occupation(a), Total
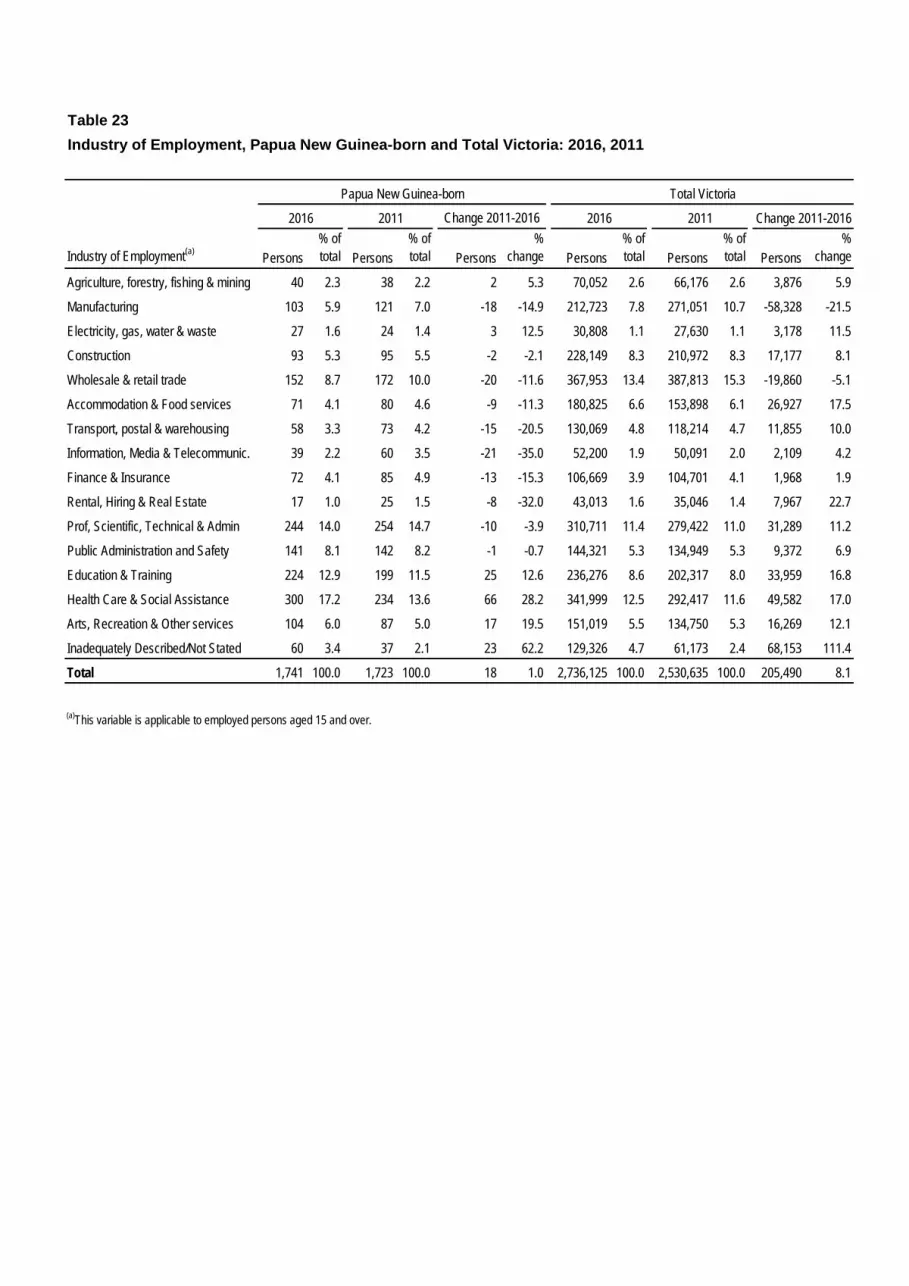
Table 23Industry of Employment, Papua New Guinea-born and Total Victoria: 2016, 2011
Industry of Employment(a) Persons% of total Persons
% of total Persons
% change Persons
% of total Persons
% of total Persons
%change
Agriculture, forestry, fishing & mining 40 2.3 38 2.2 2 5.3 70,052 2.6 66,176 2.6 3,876 5.9
Manufacturing 103 5.9 121 7.0 -18 -14.9 212,723 7.8 271,051 10.7 -58,328 -21.5
Electricity, gas, water & waste 27 1.6 24 1.4 3 12.5 30,808 1.1 27,630 1.1 3,178 11.5
Construction 93 5.3 95 5.5 -2 -2.1 228,149 8.3 210,972 8.3 17,177 8.1
Wholesale & retail trade 152 8.7 172 10.0 -20 -11.6 367,953 13.4 387,813 15.3 -19,860 -5.1
Accommodation & Food services 71 4.1 80 4.6 -9 -11.3 180,825 6.6 153,898 6.1 26,927 17.5
Transport, postal & warehousing 58 3.3 73 4.2 -15 -20.5 130,069 4.8 118,214 4.7 11,855 10.0
Information, Media & Telecommunic. 39 2.2 60 3.5 -21 -35.0 52,200 1.9 50,091 2.0 2,109 4.2
Finance & Insurance 72 4.1 85 4.9 -13 -15.3 106,669 3.9 104,701 4.1 1,968 1.9
Rental, Hiring & Real Estate 17 1.0 25 1.5 -8 -32.0 43,013 1.6 35,046 1.4 7,967 22.7
Prof, Scientific, Technical & Admin 244 14.0 254 14.7 -10 -3.9 310,711 11.4 279,422 11.0 31,289 11.2
Public Administration and Safety 141 8.1 142 8.2 -1 -0.7 144,321 5.3 134,949 5.3 9,372 6.9
Education & Training 224 12.9 199 11.5 25 12.6 236,276 8.6 202,317 8.0 33,959 16.8
Health Care & Social Assistance 300 17.2 234 13.6 66 28.2 341,999 12.5 292,417 11.6 49,582 17.0
Arts, Recreation & Other services 104 6.0 87 5.0 17 19.5 151,019 5.5 134,750 5.3 16,269 12.1
Inadequately Described/Not Stated 60 3.4 37 2.1 23 62.2 129,326 4.7 61,173 2.4 68,153 111.4
Total 1,741 100.0 1,723 100.0 18 1.0 2,736,125 100.0 2,530,635 100.0 205,490 8.1
(a)This variable is applicable to employed persons aged 15 and over.
Papua New Guinea-born Total Victoria
2016 2011 Change 2011-2016 2016 2011 Change 2011-2016
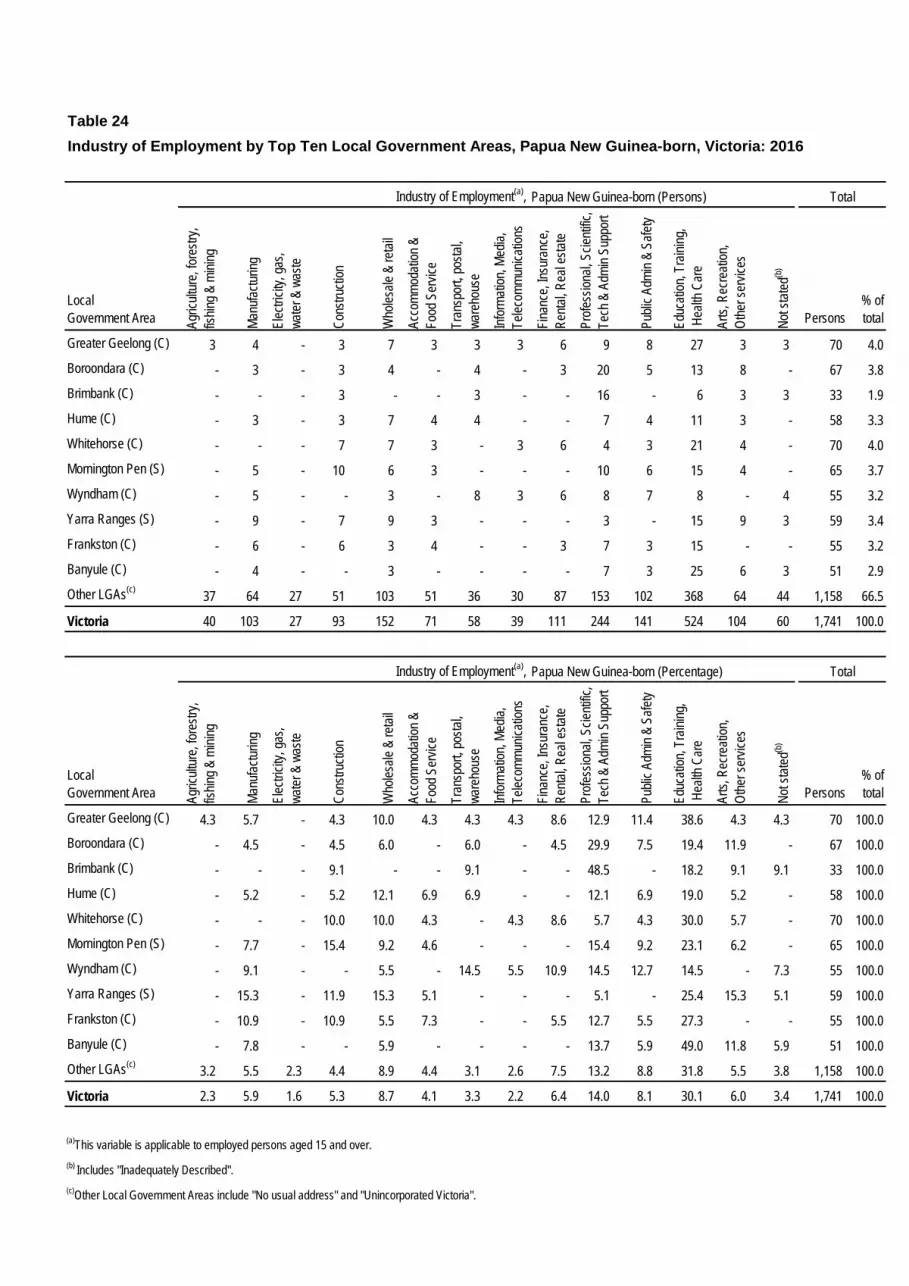
Table 24Industry of Employment by Top Ten Local Government Areas, Papua New Guinea-born, Victoria: 2016
Papua New Guinea-born (Persons)
LocalGovernment Area Ag
ricult
ure,
fores
try,
fishin
g & m
ining
Manu
factur
ing
Elec
tricity
, gas
, wa
ter &
was
te
Cons
tructi
on
Who
lesale
& re
tail
Acco
mmod
ation
&
Food
Ser
vice
Tran
spor
t, pos
tal,
ware
hous
e
Infor
matio
n, Me
dia,
Telec
ommu
nicati
ons
Finan
ce, In
sura
nce,
Renta
l, Rea
l esta
te
Profe
ssion
al, S
cienti
fic,
Tech
& A
dmin
Supp
ort
Publi
c Adm
in &
Safet
y
Educ
ation
, Tra
ining
, H
ealth
Car
e
Arts,
Rec
reati
on,
Othe
r ser
vices
Not s
tated
(b)
Persons% of total
Greater Geelong (C) 3 4 - 3 7 3 3 3 6 9 8 27 3 3 70 4.0Boroondara (C) - 3 - 3 4 - 4 - 3 20 5 13 8 - 67 3.8Brimbank (C) - - - 3 - - 3 - - 16 - 6 3 3 33 1.9Hume (C) - 3 - 3 7 4 4 - - 7 4 11 3 - 58 3.3Whitehorse (C) - - - 7 7 3 - 3 6 4 3 21 4 - 70 4.0Mornington Pen (S) - 5 - 10 6 3 - - - 10 6 15 4 - 65 3.7Wyndham (C) - 5 - - 3 - 8 3 6 8 7 8 - 4 55 3.2Yarra Ranges (S) - 9 - 7 9 3 - - - 3 - 15 9 3 59 3.4Frankston (C) - 6 - 6 3 4 - - 3 7 3 15 - - 55 3.2Banyule (C) - 4 - - 3 - - - - 7 3 25 6 3 51 2.9Other LGAs(c) 37 64 27 51 103 51 36 30 87 153 102 368 64 44 1,158 66.5
Victoria 40 103 27 93 152 71 58 39 111 244 141 524 104 60 1,741 100.0
Papua New Guinea-born (Percentage)
LocalGovernment Area Ag
ricult
ure,
fores
try,
fishin
g & m
ining
Manu
factur
ing
Elec
tricity
, gas
, wa
ter &
was
te
Cons
tructi
on
Who
lesale
& re
tail
Acco
mmod
ation
&
Food
Ser
vice
Tran
spor
t, pos
tal,
ware
hous
e
Infor
matio
n, Me
dia,
Telec
ommu
nicati
ons
Finan
ce, In
sura
nce,
Renta
l, Rea
l esta
te
Profe
ssion
al, S
cienti
fic,
Tech
& A
dmin
Supp
ort
Publi
c Adm
in &
Safet
y
Educ
ation
, Tra
ining
, H
ealth
Car
e
Arts,
Rec
reati
on,
Othe
r ser
vices
Not s
tated
(b)
Persons% of total
Greater Geelong (C) 4.3 5.7 - 4.3 10.0 4.3 4.3 4.3 8.6 12.9 11.4 38.6 4.3 4.3 70 100.0Boroondara (C) - 4.5 - 4.5 6.0 - 6.0 - 4.5 29.9 7.5 19.4 11.9 - 67 100.0Brimbank (C) - - - 9.1 - - 9.1 - - 48.5 - 18.2 9.1 9.1 33 100.0Hume (C) - 5.2 - 5.2 12.1 6.9 6.9 - - 12.1 6.9 19.0 5.2 - 58 100.0Whitehorse (C) - - - 10.0 10.0 4.3 - 4.3 8.6 5.7 4.3 30.0 5.7 - 70 100.0Mornington Pen (S) - 7.7 - 15.4 9.2 4.6 - - - 15.4 9.2 23.1 6.2 - 65 100.0Wyndham (C) - 9.1 - - 5.5 - 14.5 5.5 10.9 14.5 12.7 14.5 - 7.3 55 100.0Yarra Ranges (S) - 15.3 - 11.9 15.3 5.1 - - - 5.1 - 25.4 15.3 5.1 59 100.0Frankston (C) - 10.9 - 10.9 5.5 7.3 - - 5.5 12.7 5.5 27.3 - - 55 100.0Banyule (C) - 7.8 - - 5.9 - - - - 13.7 5.9 49.0 11.8 5.9 51 100.0Other LGAs(c) 3.2 5.5 2.3 4.4 8.9 4.4 3.1 2.6 7.5 13.2 8.8 31.8 5.5 3.8 1,158 100.0
Victoria 2.3 5.9 1.6 5.3 8.7 4.1 3.3 2.2 6.4 14.0 8.1 30.1 6.0 3.4 1,741 100.0
(a)This variable is applicable to employed persons aged 15 and over.(b) Includes "Inadequately Described".(c)Other Local Government Areas include "No usual address" and "Unincorporated Victoria".
Industry of Employment(a), Total
Industry of Employment(a), Total
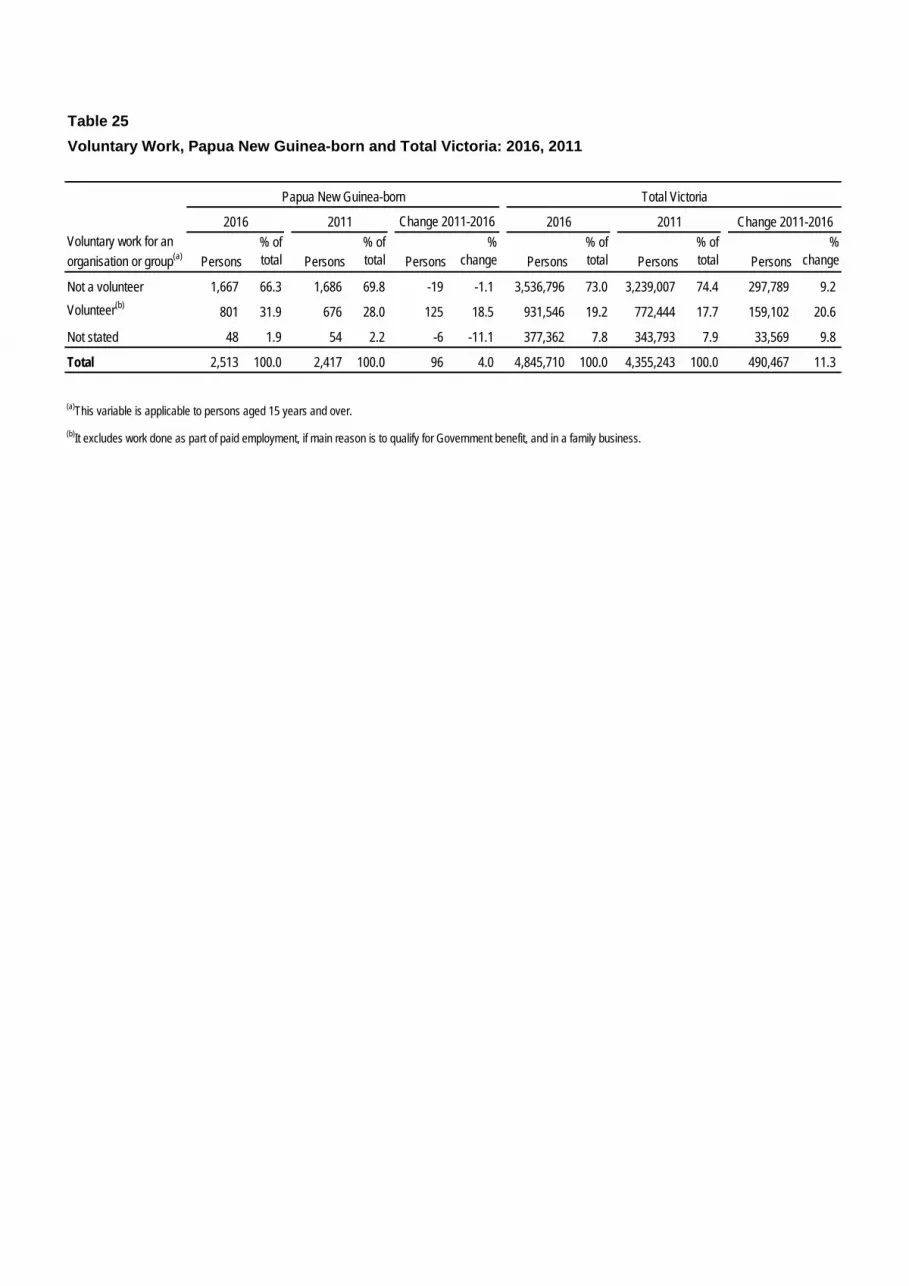
Table 25Voluntary Work, Papua New Guinea-born and Total Victoria: 2016, 2011
Persons% of total Persons
% of total Persons
% change Persons
% of total Persons
% of total Persons
%change
Not a volunteer 1,667 66.3 1,686 69.8 -19 -1.1 3,536,796 73.0 3,239,007 74.4 297,789 9.2Volunteer(b) 801 31.9 676 28.0 125 18.5 931,546 19.2 772,444 17.7 159,102 20.6
Not stated 48 1.9 54 2.2 -6 -11.1 377,362 7.8 343,793 7.9 33,569 9.8
Total 2,513 100.0 2,417 100.0 96 4.0 4,845,710 100.0 4,355,243 100.0 490,467 11.3
(a)This variable is applicable to persons aged 15 years and over.(b)It excludes work done as part of paid employment, if main reason is to qualify for Government benefit, and in a family business.
Voluntary work for anorganisation or group(a)
Papua New Guinea-born Total Victoria
2016 2011 Change 2011-2016 2016 2011 Change 2011-2016
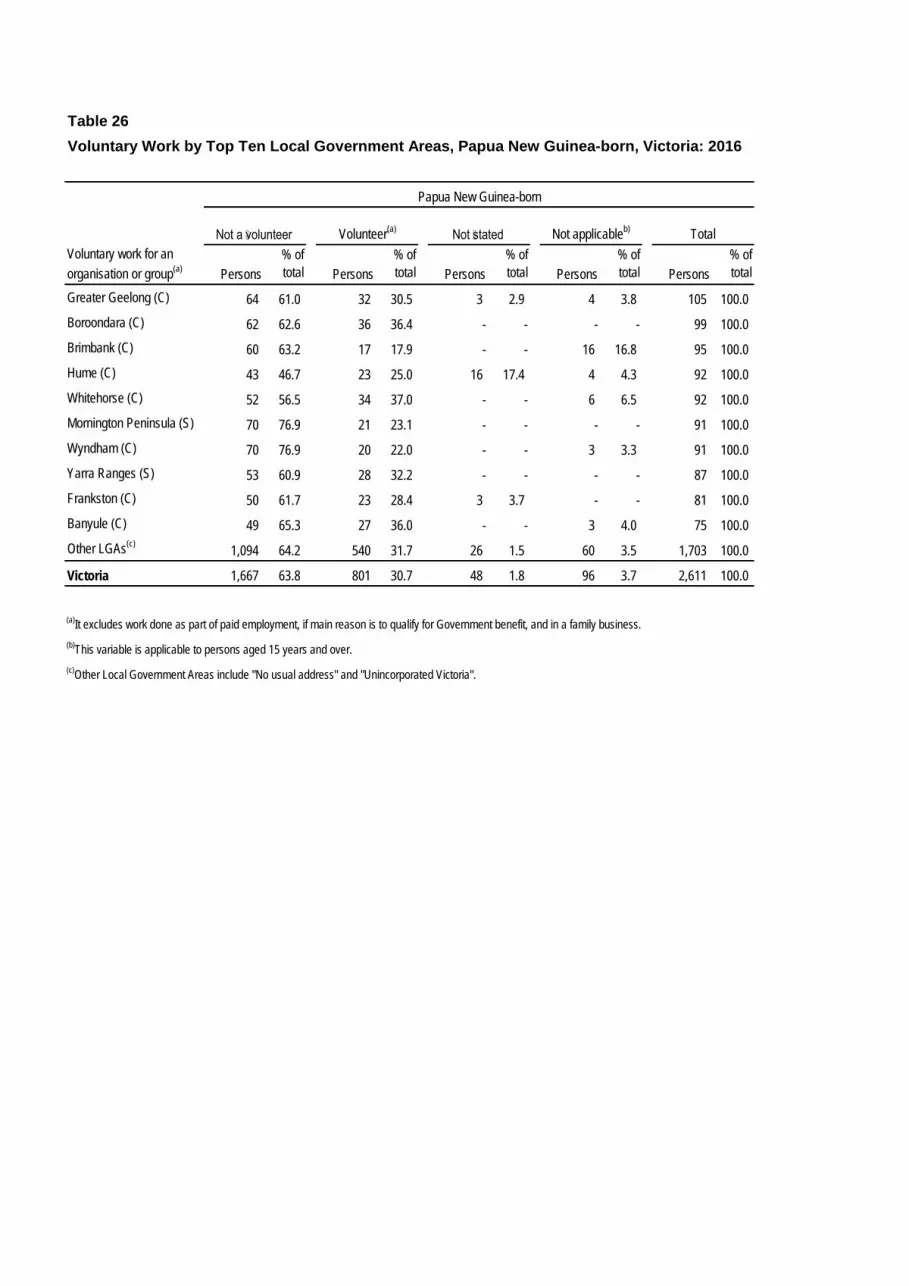
Table 26Voluntary Work by Top Ten Local Government Areas, Papua New Guinea-born, Victoria: 2016
Persons% oftotal Persons
% oftotal Persons
% oftotal Persons
% oftotal Persons
% oftotal
Greater Geelong (C) 64 61.0 32 30.5 3 2.9 4 3.8 105 100.0Boroondara (C) 62 62.6 36 36.4 - - - - 99 100.0Brimbank (C) 60 63.2 17 17.9 - - 16 16.8 95 100.0Hume (C) 43 46.7 23 25.0 16 17.4 4 4.3 92 100.0Whitehorse (C) 52 56.5 34 37.0 - - 6 6.5 92 100.0Mornington Peninsula (S) 70 76.9 21 23.1 - - - - 91 100.0Wyndham (C) 70 76.9 20 22.0 - - 3 3.3 91 100.0Yarra Ranges (S) 53 60.9 28 32.2 - - - - 87 100.0Frankston (C) 50 61.7 23 28.4 3 3.7 - - 81 100.0Banyule (C) 49 65.3 27 36.0 - - 3 4.0 75 100.0Other LGAs(c) 1,094 64.2 540 31.7 26 1.5 60 3.5 1,703 100.0
Victoria 1,667 63.8 801 30.7 48 1.8 96 3.7 2,611 100.0
(a)It excludes work done as part of paid employment, if main reason is to qualify for Government benefit, and in a family business.(b)This variable is applicable to persons aged 15 years and over.(c)Other Local Government Areas include "No usual address" and "Unincorporated Victoria".
Total
Papua New Guinea-born
Voluntary work for anorganisation or group(a)
Not a volunteer Volunteer(a) Not stated Not applicableb)
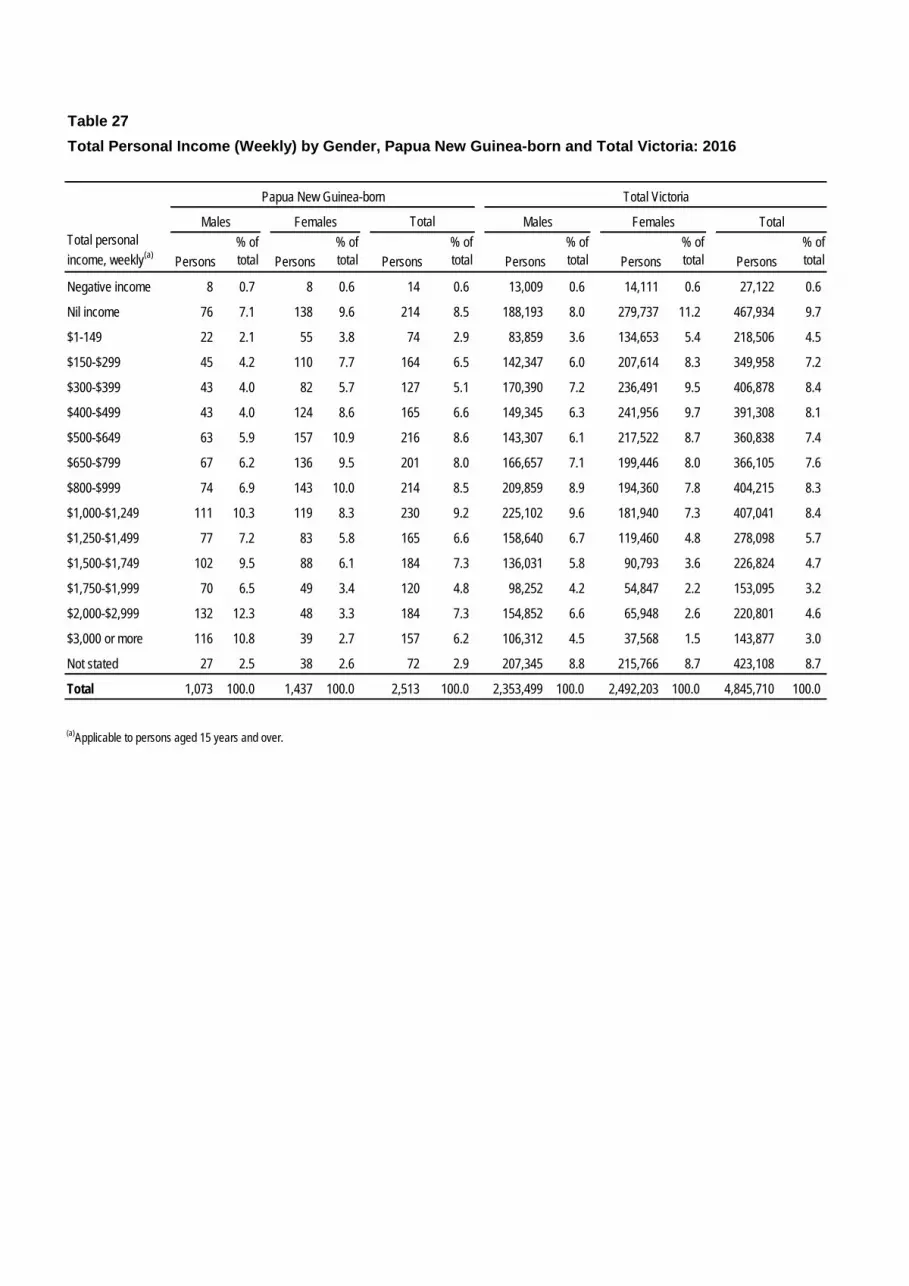
Table 27Total Personal Income (Weekly) by Gender, Papua New Guinea-born and Total Victoria: 2016
Total personal income, weekly(a) Persons
% of total Persons
% of total Persons
% of total Persons
% of total Persons
% of total Persons
% of total
Negative income 8 0.7 8 0.6 14 0.6 13,009 0.6 14,111 0.6 27,122 0.6
Nil income 76 7.1 138 9.6 214 8.5 188,193 8.0 279,737 11.2 467,934 9.7
$1-149 22 2.1 55 3.8 74 2.9 83,859 3.6 134,653 5.4 218,506 4.5
$150-$299 45 4.2 110 7.7 164 6.5 142,347 6.0 207,614 8.3 349,958 7.2
$300-$399 43 4.0 82 5.7 127 5.1 170,390 7.2 236,491 9.5 406,878 8.4
$400-$499 43 4.0 124 8.6 165 6.6 149,345 6.3 241,956 9.7 391,308 8.1
$500-$649 63 5.9 157 10.9 216 8.6 143,307 6.1 217,522 8.7 360,838 7.4
$650-$799 67 6.2 136 9.5 201 8.0 166,657 7.1 199,446 8.0 366,105 7.6
$800-$999 74 6.9 143 10.0 214 8.5 209,859 8.9 194,360 7.8 404,215 8.3
$1,000-$1,249 111 10.3 119 8.3 230 9.2 225,102 9.6 181,940 7.3 407,041 8.4
$1,250-$1,499 77 7.2 83 5.8 165 6.6 158,640 6.7 119,460 4.8 278,098 5.7
$1,500-$1,749 102 9.5 88 6.1 184 7.3 136,031 5.8 90,793 3.6 226,824 4.7
$1,750-$1,999 70 6.5 49 3.4 120 4.8 98,252 4.2 54,847 2.2 153,095 3.2
$2,000-$2,999 132 12.3 48 3.3 184 7.3 154,852 6.6 65,948 2.6 220,801 4.6
$3,000 or more 116 10.8 39 2.7 157 6.2 106,312 4.5 37,568 1.5 143,877 3.0
Not stated 27 2.5 38 2.6 72 2.9 207,345 8.8 215,766 8.7 423,108 8.7
Total 1,073 100.0 1,437 100.0 2,513 100.0 2,353,499 100.0 2,492,203 100.0 4,845,710 100.0
(a)Applicable to persons aged 15 years and over.
Papua New Guinea-born Total Victoria
Males Females Total Males Females Total
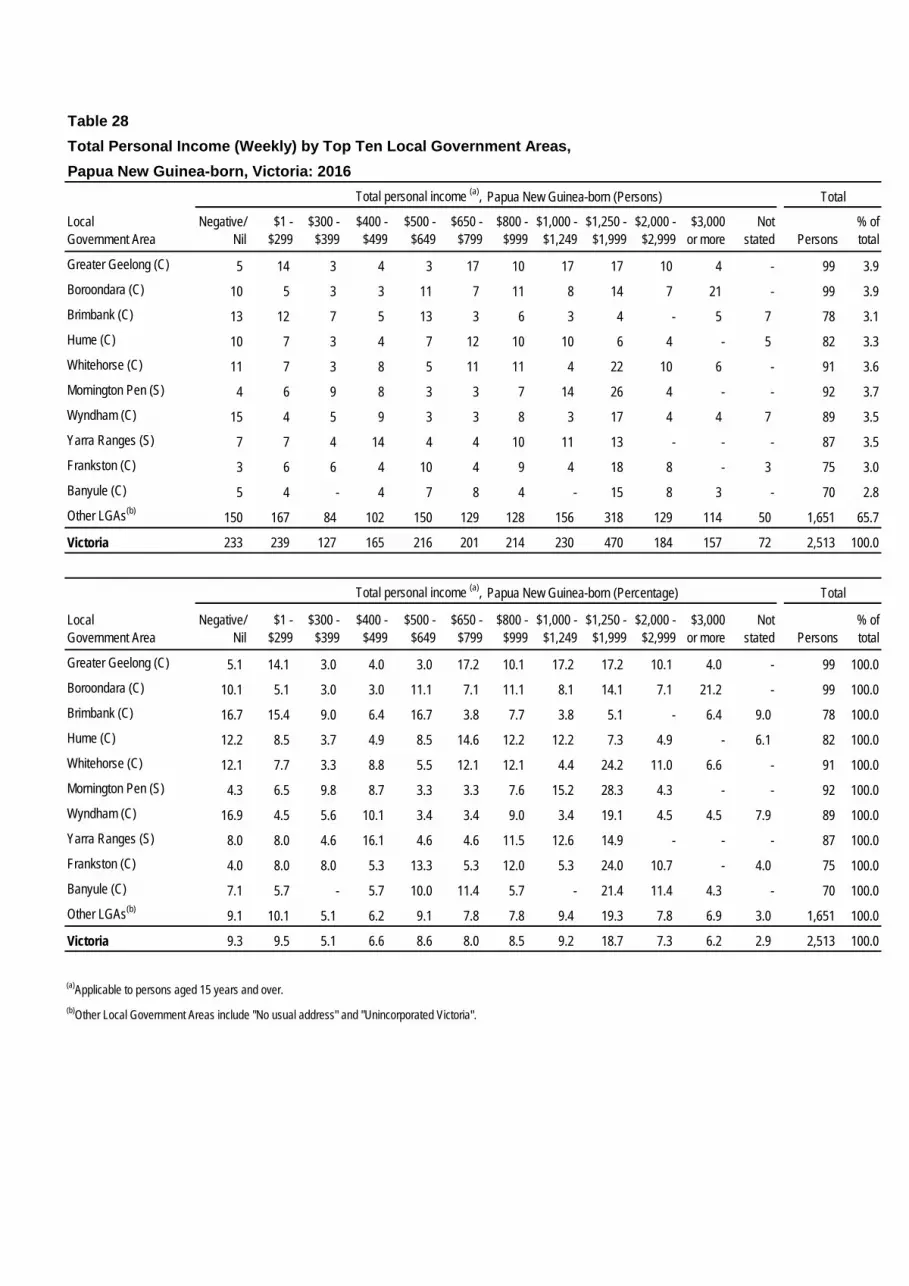
Table 28Total Personal Income (Weekly) by Top Ten Local Government Areas,Papua New Guinea-born, Victoria: 2016
Papua New Guinea-born (Persons)
Local Government Area
Negative/Nil
$1 - $299
$300 - $399
$400 - $499
$500 - $649
$650 - $799
$800 - $999
$1,000 - $1,249
$1,250 - $1,999
$2,000 - $2,999
$3,000 or more
Notstated Persons
% of total
Greater Geelong (C) 5 14 3 4 3 17 10 17 17 10 4 - 99 3.9Boroondara (C) 10 5 3 3 11 7 11 8 14 7 21 - 99 3.9Brimbank (C) 13 12 7 5 13 3 6 3 4 - 5 7 78 3.1Hume (C) 10 7 3 4 7 12 10 10 6 4 - 5 82 3.3Whitehorse (C) 11 7 3 8 5 11 11 4 22 10 6 - 91 3.6Mornington Pen (S) 4 6 9 8 3 3 7 14 26 4 - - 92 3.7Wyndham (C) 15 4 5 9 3 3 8 3 17 4 4 7 89 3.5Yarra Ranges (S) 7 7 4 14 4 4 10 11 13 - - - 87 3.5Frankston (C) 3 6 6 4 10 4 9 4 18 8 - 3 75 3.0Banyule (C) 5 4 - 4 7 8 4 - 15 8 3 - 70 2.8Other LGAs(b) 150 167 84 102 150 129 128 156 318 129 114 50 1,651 65.7
Victoria 233 239 127 165 216 201 214 230 470 184 157 72 2,513 100.0
Papua New Guinea-born (Percentage)
Local Government Area
Negative/Nil
$1 - $299
$300 - $399
$400 - $499
$500 - $649
$650 - $799
$800 - $999
$1,000 - $1,249
$1,250 - $1,999
$2,000 - $2,999
$3,000 or more
Notstated Persons
% of total
Greater Geelong (C) 5.1 14.1 3.0 4.0 3.0 17.2 10.1 17.2 17.2 10.1 4.0 - 99 100.0Boroondara (C) 10.1 5.1 3.0 3.0 11.1 7.1 11.1 8.1 14.1 7.1 21.2 - 99 100.0Brimbank (C) 16.7 15.4 9.0 6.4 16.7 3.8 7.7 3.8 5.1 - 6.4 9.0 78 100.0Hume (C) 12.2 8.5 3.7 4.9 8.5 14.6 12.2 12.2 7.3 4.9 - 6.1 82 100.0Whitehorse (C) 12.1 7.7 3.3 8.8 5.5 12.1 12.1 4.4 24.2 11.0 6.6 - 91 100.0Mornington Pen (S) 4.3 6.5 9.8 8.7 3.3 3.3 7.6 15.2 28.3 4.3 - - 92 100.0Wyndham (C) 16.9 4.5 5.6 10.1 3.4 3.4 9.0 3.4 19.1 4.5 4.5 7.9 89 100.0Yarra Ranges (S) 8.0 8.0 4.6 16.1 4.6 4.6 11.5 12.6 14.9 - - - 87 100.0Frankston (C) 4.0 8.0 8.0 5.3 13.3 5.3 12.0 5.3 24.0 10.7 - 4.0 75 100.0Banyule (C) 7.1 5.7 - 5.7 10.0 11.4 5.7 - 21.4 11.4 4.3 - 70 100.0Other LGAs(b) 9.1 10.1 5.1 6.2 9.1 7.8 7.8 9.4 19.3 7.8 6.9 3.0 1,651 100.0
Victoria 9.3 9.5 5.1 6.6 8.6 8.0 8.5 9.2 18.7 7.3 6.2 2.9 2,513 100.0
(a)Applicable to persons aged 15 years and over.(b)Other Local Government Areas include "No usual address" and "Unincorporated Victoria".
TotalTotal personal income (a),
Total personal income (a), Total
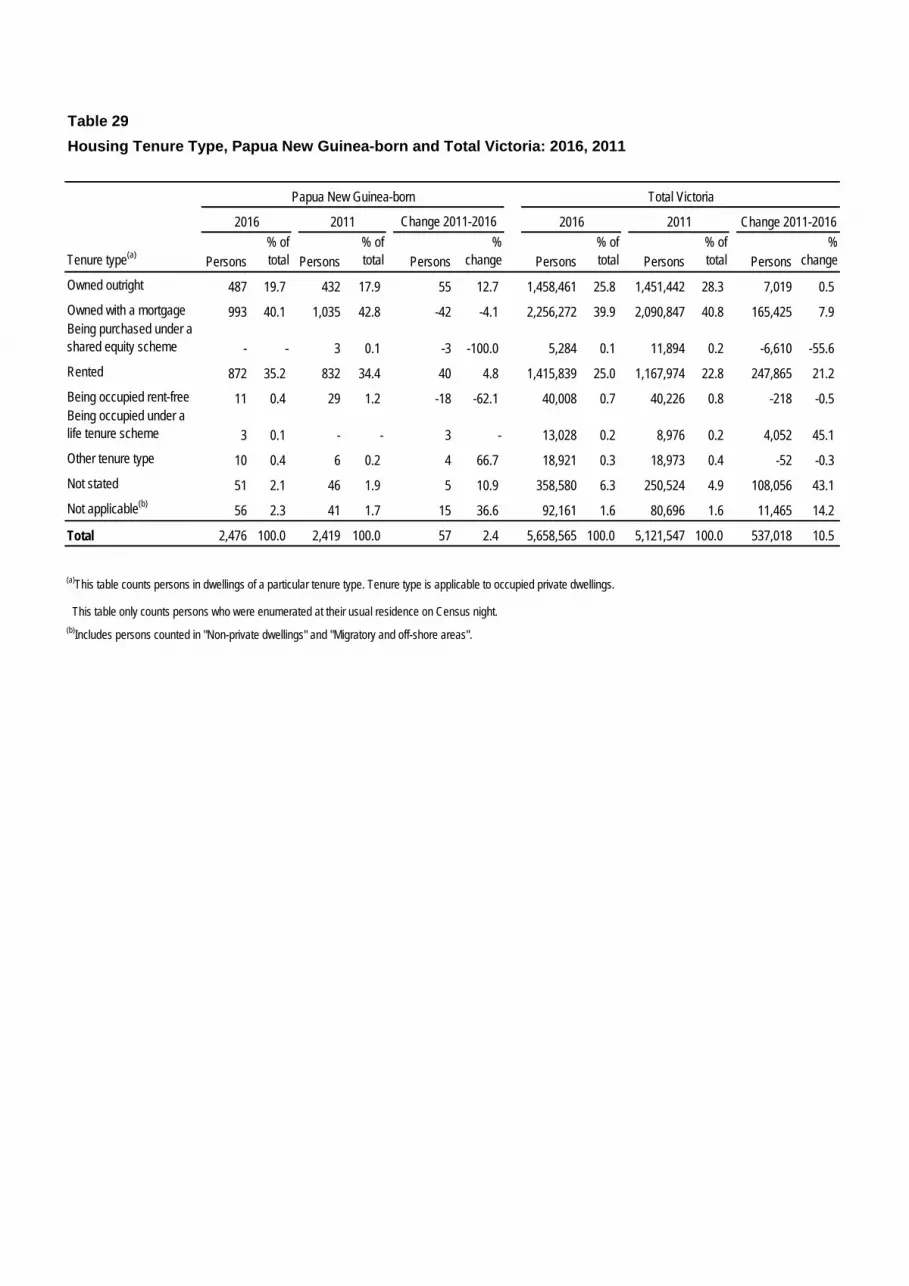
Table 29Housing Tenure Type, Papua New Guinea-born and Total Victoria: 2016, 2011
Tenure type(a) Persons% of total Persons
% of total Persons
% change Persons
% of total Persons
% of total Persons
%change
Owned outright 487 19.7 432 17.9 55 12.7 1,458,461 25.8 1,451,442 28.3 7,019 0.5Owned with a mortgage 993 40.1 1,035 42.8 -42 -4.1 2,256,272 39.9 2,090,847 40.8 165,425 7.9Being purchased under a shared equity scheme - - 3 0.1 -3 -100.0 5,284 0.1 11,894 0.2 -6,610 -55.6 Rented 872 35.2 832 34.4 40 4.8 1,415,839 25.0 1,167,974 22.8 247,865 21.2Being occupied rent-free 11 0.4 29 1.2 -18 -62.1 40,008 0.7 40,226 0.8 -218 -0.5 Being occupied under a life tenure scheme 3 0.1 - - 3 - 13,028 0.2 8,976 0.2 4,052 45.1Other tenure type 10 0.4 6 0.2 4 66.7 18,921 0.3 18,973 0.4 -52 -0.3 Not stated 51 2.1 46 1.9 5 10.9 358,580 6.3 250,524 4.9 108,056 43.1Not applicable(b) 56 2.3 41 1.7 15 36.6 92,161 1.6 80,696 1.6 11,465 14.2
Total 2,476 100.0 2,419 100.0 57 2.4 5,658,565 100.0 5,121,547 100.0 537,018 10.5
(a)This table counts persons in dwellings of a particular tenure type. Tenure type is applicable to occupied private dwellings.
This table only counts persons who were enumerated at their usual residence on Census night.(b)Includes persons counted in "Non-private dwellings" and "Migratory and off-shore areas".
Papua New Guinea-born Total Victoria
2016 2011 Change 2011-2016 2016 2011 Change 2011-2016
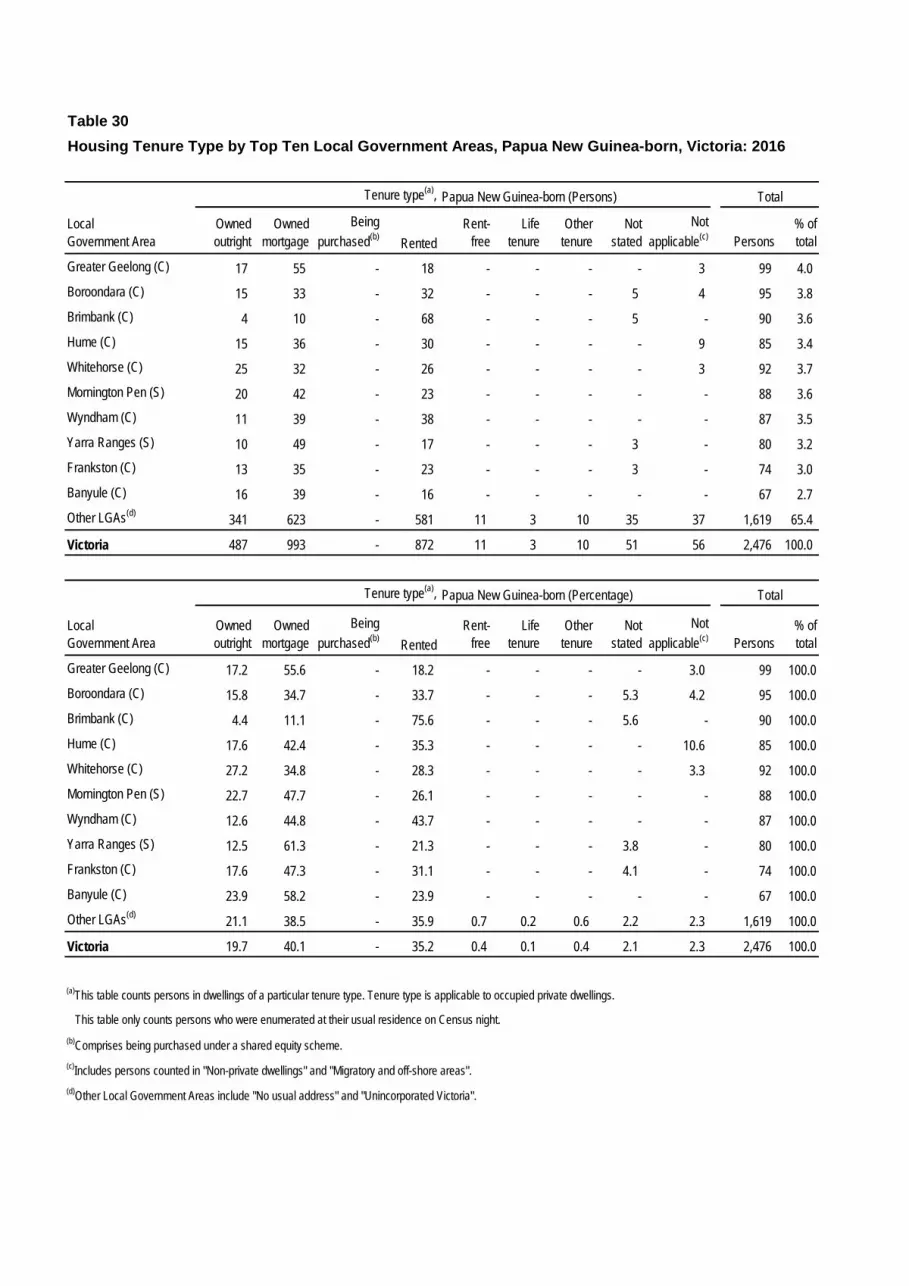
Table 30Housing Tenure Type by Top Ten Local Government Areas, Papua New Guinea-born, Victoria: 2016
Tenure type(a), Papua New Guinea-born (Persons)
Local Government Area
Ownedoutright
Ownedmortgage
Being purchased(b) Rented
Rent-free
Life tenure
Other tenure
Not stated
Not applicable(c) Persons
% of total
Greater Geelong (C) 17 55 - 18 - - - - 3 99 4.0 Boroondara (C) 15 33 - 32 - - - 5 4 95 3.8 Brimbank (C) 4 10 - 68 - - - 5 - 90 3.6 Hume (C) 15 36 - 30 - - - - 9 85 3.4 Whitehorse (C) 25 32 - 26 - - - - 3 92 3.7 Mornington Pen (S) 20 42 - 23 - - - - - 88 3.6 Wyndham (C) 11 39 - 38 - - - - - 87 3.5 Yarra Ranges (S) 10 49 - 17 - - - 3 - 80 3.2 Frankston (C) 13 35 - 23 - - - 3 - 74 3.0 Banyule (C) 16 39 - 16 - - - - - 67 2.7 Other LGAs(d) 341 623 - 581 11 3 10 35 37 1,619 65.4
Victoria 487 993 - 872 11 3 10 51 56 2,476 100.0
Tenure type(a), Papua New Guinea-born (Percentage)
Local Government Area
Ownedoutright
Ownedmortgage
Being purchased(b) Rented
Rent-free
Life tenure
Other tenure
Not stated
Not applicable(c) Persons
% of total
Greater Geelong (C) 17.2 55.6 - 18.2 - - - - 3.0 99 100.0Boroondara (C) 15.8 34.7 - 33.7 - - - 5.3 4.2 95 100.0Brimbank (C) 4.4 11.1 - 75.6 - - - 5.6 - 90 100.0Hume (C) 17.6 42.4 - 35.3 - - - - 10.6 85 100.0Whitehorse (C) 27.2 34.8 - 28.3 - - - - 3.3 92 100.0Mornington Pen (S) 22.7 47.7 - 26.1 - - - - - 88 100.0Wyndham (C) 12.6 44.8 - 43.7 - - - - - 87 100.0Yarra Ranges (S) 12.5 61.3 - 21.3 - - - 3.8 - 80 100.0Frankston (C) 17.6 47.3 - 31.1 - - - 4.1 - 74 100.0Banyule (C) 23.9 58.2 - 23.9 - - - - - 67 100.0Other LGAs(d) 21.1 38.5 - 35.9 0.7 0.2 0.6 2.2 2.3 1,619 100.0
Victoria 19.7 40.1 - 35.2 0.4 0.1 0.4 2.1 2.3 2,476 100.0
(a)This table counts persons in dwellings of a particular tenure type. Tenure type is applicable to occupied private dwellings.
This table only counts persons who were enumerated at their usual residence on Census night.(b)Comprises being purchased under a shared equity scheme.(c)Includes persons counted in "Non-private dwellings" and "Migratory and off-shore areas".(d)Other Local Government Areas include "No usual address" and "Unincorporated Victoria".
Total
Total
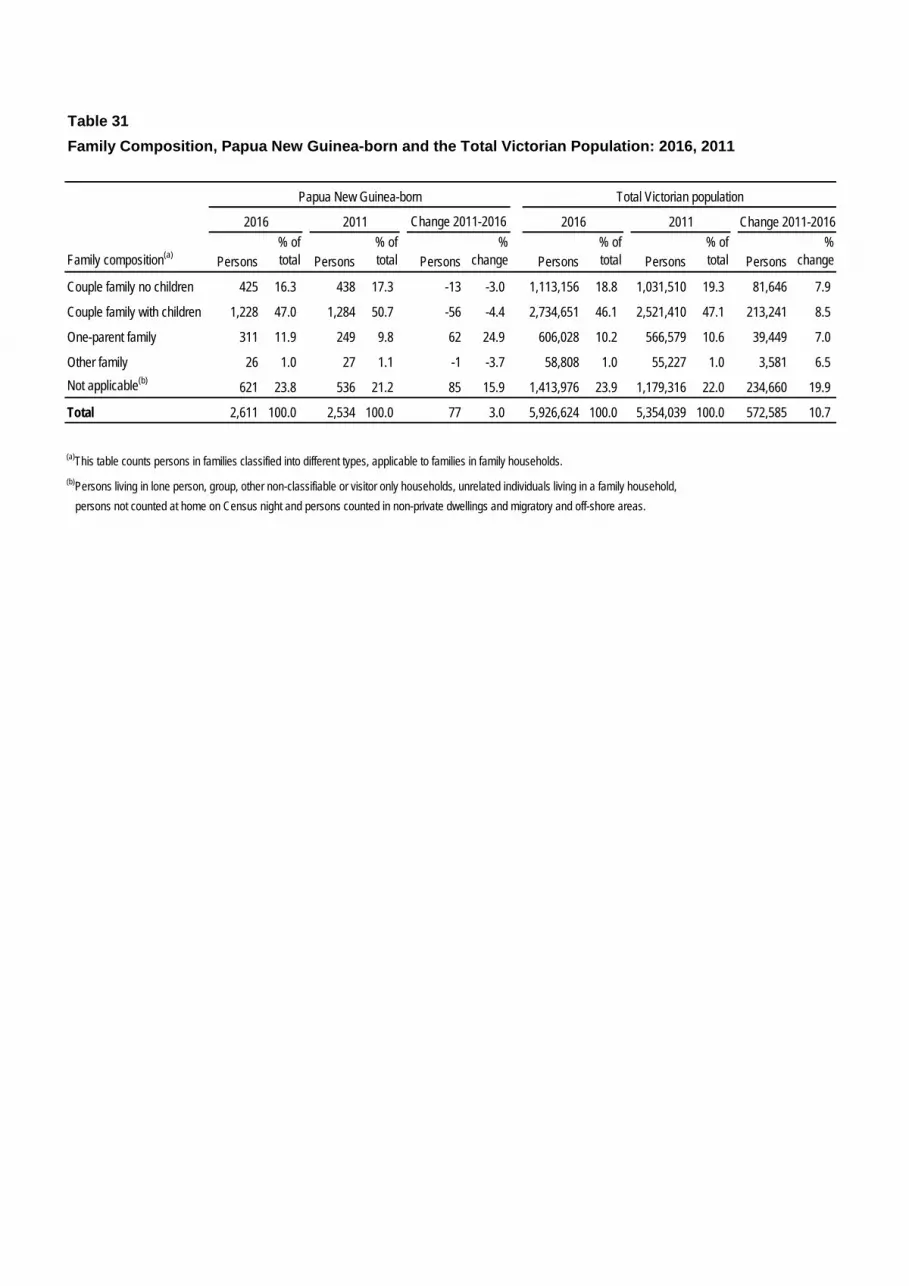
Table 31Family Composition, Papua New Guinea-born and the Total Victorian Population: 2016, 2011
Family composition(a) Persons% of total Persons
% of total Persons
% change Persons
% of total Persons
% of total Persons
%change
Couple family no children 425 16.3 438 17.3 -13 -3.0 1,113,156 18.8 1,031,510 19.3 81,646 7.9
Couple family with children 1,228 47.0 1,284 50.7 -56 -4.4 2,734,651 46.1 2,521,410 47.1 213,241 8.5
One-parent family 311 11.9 249 9.8 62 24.9 606,028 10.2 566,579 10.6 39,449 7.0
Other family 26 1.0 27 1.1 -1 -3.7 58,808 1.0 55,227 1.0 3,581 6.5Not applicable(b) 621 23.8 536 21.2 85 15.9 1,413,976 23.9 1,179,316 22.0 234,660 19.9
Total 2,611 100.0 2,534 100.0 77 3.0 5,926,624 100.0 5,354,039 100.0 572,585 10.7
(a)This table counts persons in families classified into different types, applicable to families in family households.(b)Persons living in lone person, group, other non-classifiable or visitor only households, unrelated individuals living in a family household, persons not counted at home on Census night and persons counted in non-private dwellings and migratory and off-shore areas.
Papua New Guinea-born Total Victorian population
2016 2011 Change 2011-2016 2016 2011 Change 2011-2016
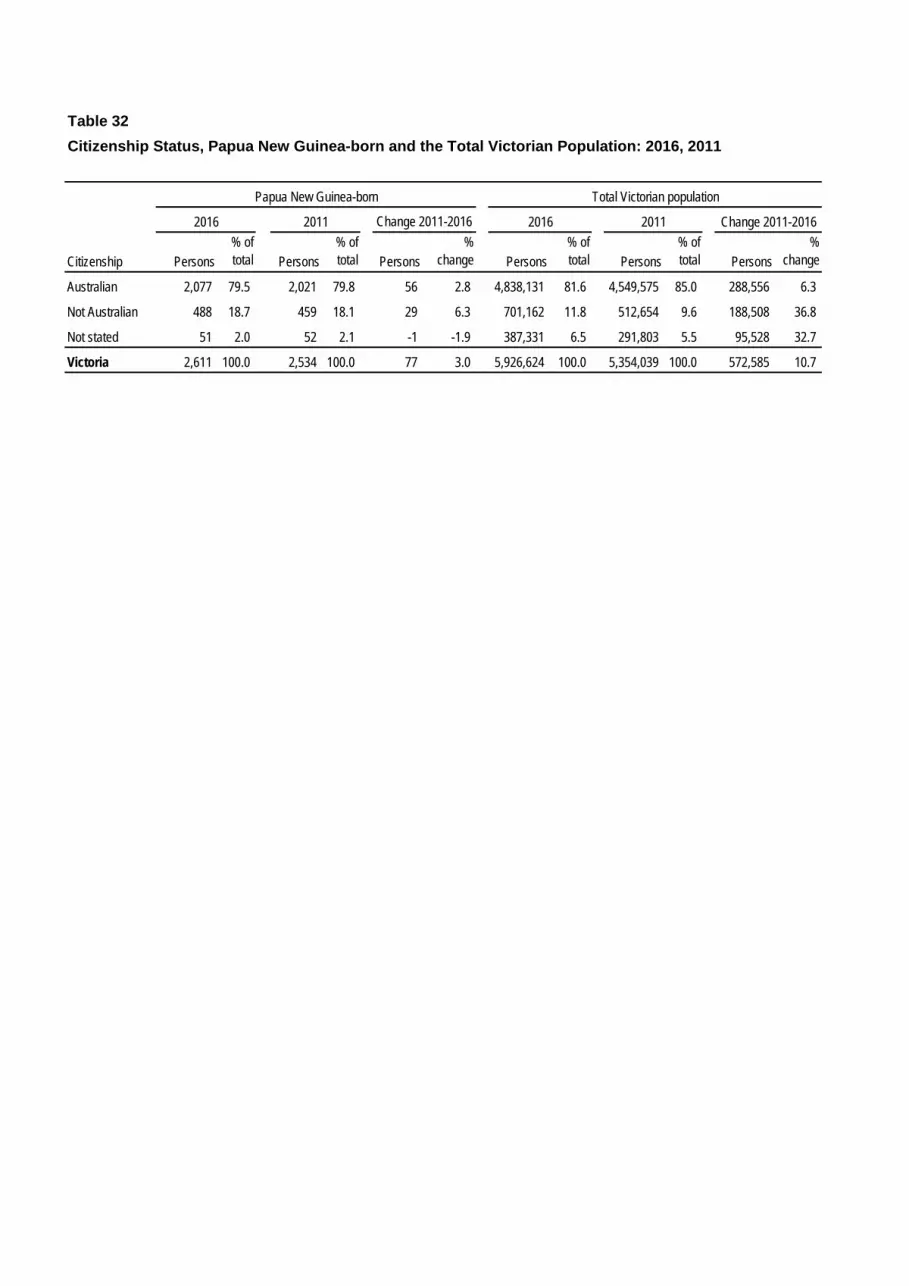
Table 32Citizenship Status, Papua New Guinea-born and the Total Victorian Population: 2016, 2011
Citizenship Persons% of total Persons
% of total Persons
% change Persons
% of total Persons
% of total Persons
%change
Australian 2,077 79.5 2,021 79.8 56 2.8 4,838,131 81.6 4,549,575 85.0 288,556 6.3
Not Australian 488 18.7 459 18.1 29 6.3 701,162 11.8 512,654 9.6 188,508 36.8
Not stated 51 2.0 52 2.1 -1 -1.9 387,331 6.5 291,803 5.5 95,528 32.7
Victoria 2,611 100.0 2,534 100.0 77 3.0 5,926,624 100.0 5,354,039 100.0 572,585 10.7
Papua New Guinea-born Total Victorian population
2016 2011 Change 2011-2016 2016 2011 Change 2011-2016
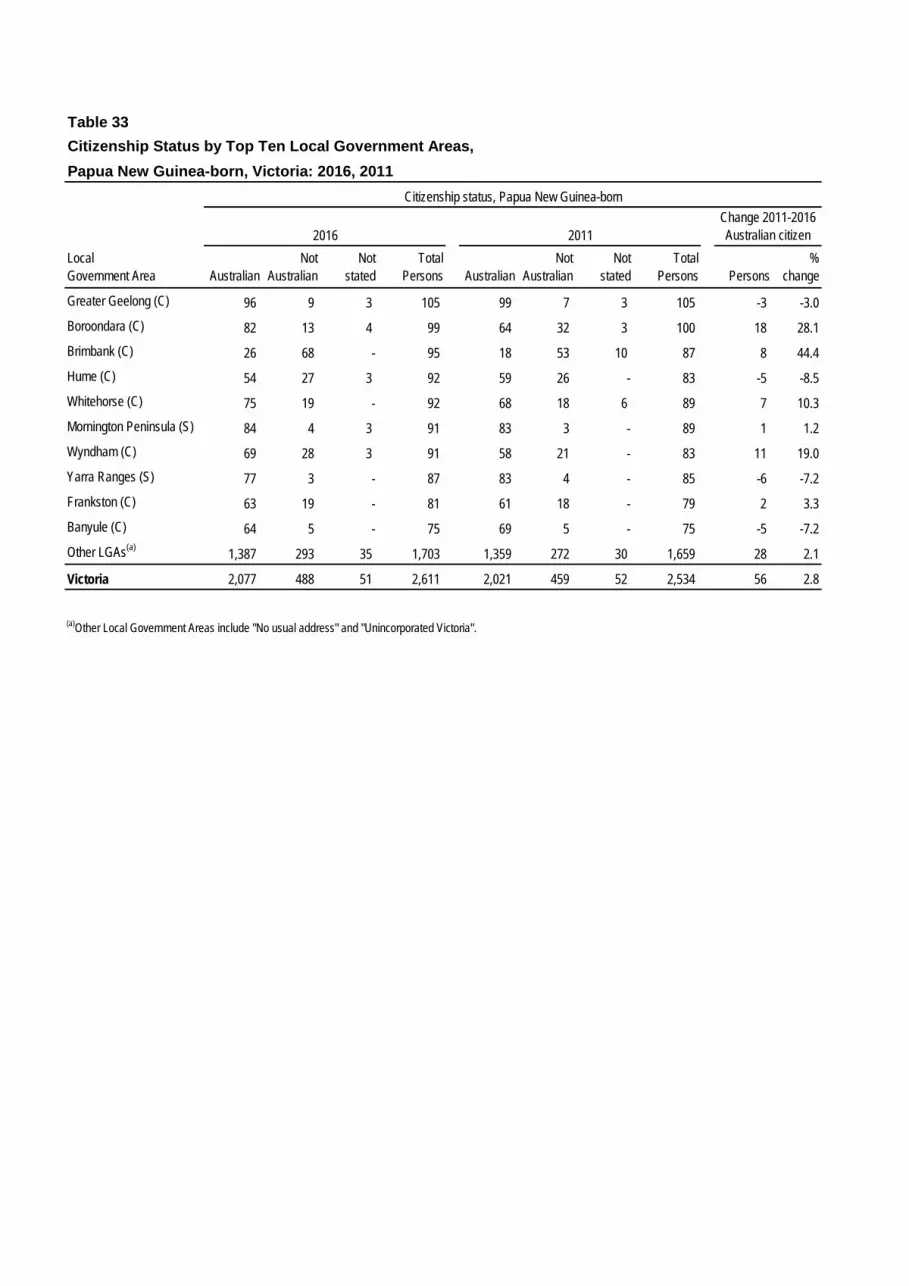
Table 33Citizenship Status by Top Ten Local Government Areas,Papua New Guinea-born, Victoria: 2016, 2011
Local Government Area Australian
Not Australian
Not stated
Total Persons Australian
Not Australian
Not stated
Total Persons Persons
%change
Greater Geelong (C) 96 9 3 105 99 7 3 105 -3 -3.0Boroondara (C) 82 13 4 99 64 32 3 100 18 28.1Brimbank (C) 26 68 - 95 18 53 10 87 8 44.4Hume (C) 54 27 3 92 59 26 - 83 -5 -8.5Whitehorse (C) 75 19 - 92 68 18 6 89 7 10.3Mornington Peninsula (S) 84 4 3 91 83 3 - 89 1 1.2Wyndham (C) 69 28 3 91 58 21 - 83 11 19.0Yarra Ranges (S) 77 3 - 87 83 4 - 85 -6 -7.2Frankston (C) 63 19 - 81 61 18 - 79 2 3.3Banyule (C) 64 5 - 75 69 5 - 75 -5 -7.2Other LGAs(a) 1,387 293 35 1,703 1,359 272 30 1,659 28 2.1
Victoria 2,077 488 51 2,611 2,021 459 52 2,534 56 2.8
(a)Other Local Government Areas include "No usual address" and "Unincorporated Victoria".
Change 2011-2016Australian citizen2016 2011
Citizenship status, Papua New Guinea-born
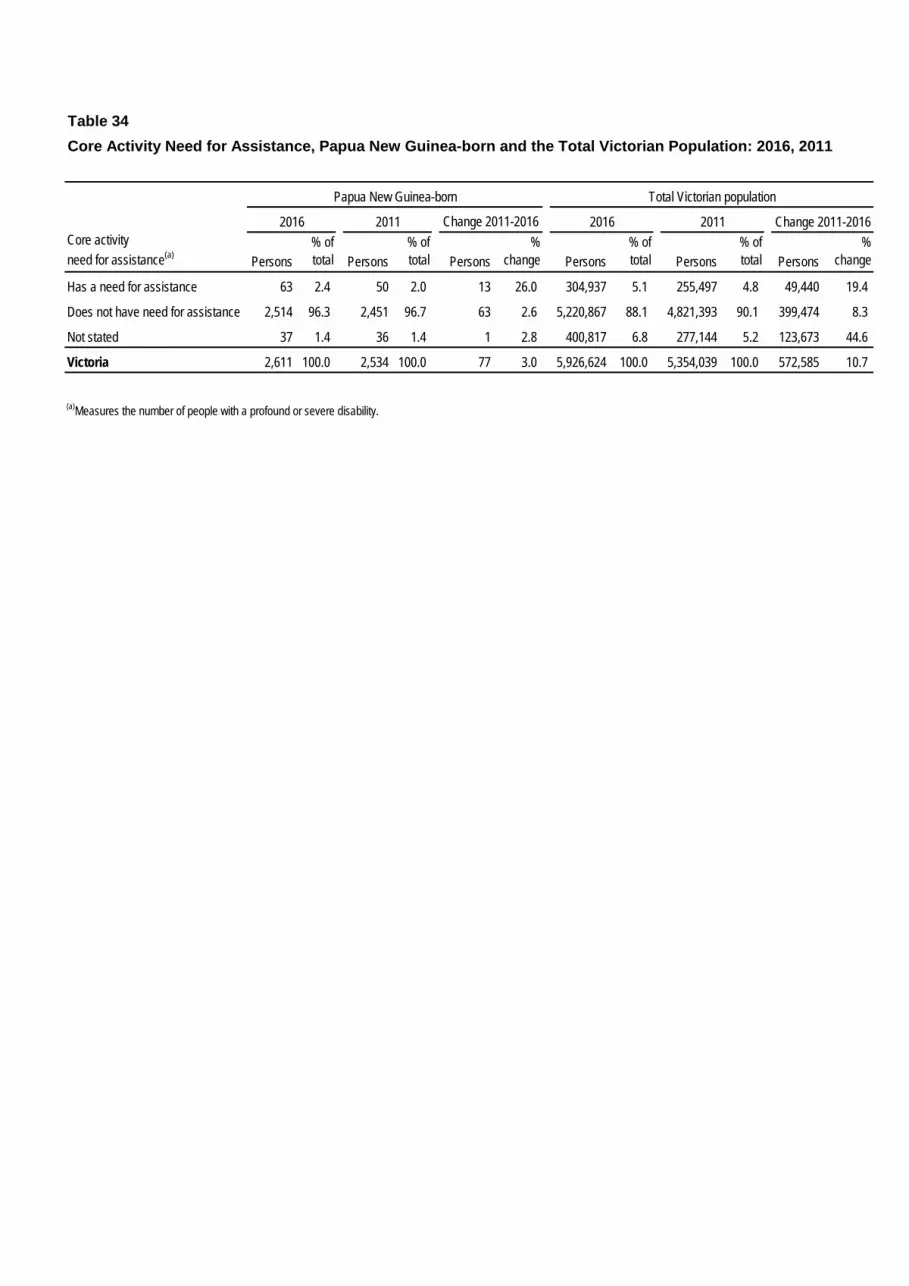
Table 34Core Activity Need for Assistance, Papua New Guinea-born and the Total Victorian Population: 2016, 2011
Core activity need for assistance(a) Persons
% of total Persons
% of total Persons
% change Persons
% of total Persons
% of total Persons
%change
Has a need for assistance 63 2.4 50 2.0 13 26.0 304,937 5.1 255,497 4.8 49,440 19.4
Does not have need for assistance 2,514 96.3 2,451 96.7 63 2.6 5,220,867 88.1 4,821,393 90.1 399,474 8.3
Not stated 37 1.4 36 1.4 1 2.8 400,817 6.8 277,144 5.2 123,673 44.6
Victoria 2,611 100.0 2,534 100.0 77 3.0 5,926,624 100.0 5,354,039 100.0 572,585 10.7
(a)Measures the number of people with a profound or severe disability.
Papua New Guinea-born Total Victorian population
2016 2011 Change 2011-2016 2016 2011 Change 2011-2016
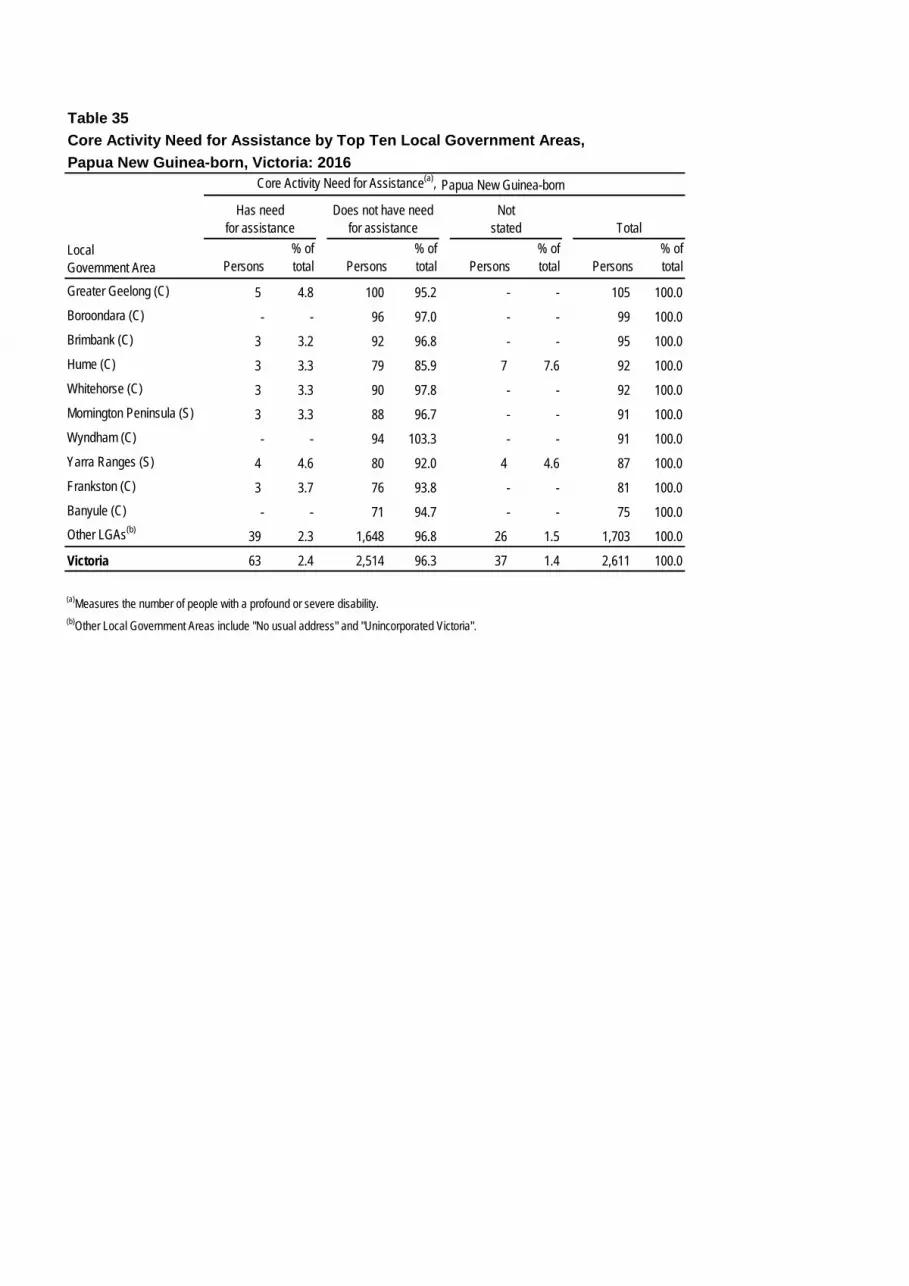
Table 35Core Activity Need for Assistance by Top Ten Local Government Areas,Papua New Guinea-born, Victoria: 2016
Core Activity Need for Assistance(a),
Persons% oftotal Persons
% oftotal Persons
% oftotal Persons
% oftotal
Greater Geelong (C) 5 4.8 100 95.2 - - 105 100.0Boroondara (C) - - 96 97.0 - - 99 100.0Brimbank (C) 3 3.2 92 96.8 - - 95 100.0Hume (C) 3 3.3 79 85.9 7 7.6 92 100.0Whitehorse (C) 3 3.3 90 97.8 - - 92 100.0Mornington Peninsula (S) 3 3.3 88 96.7 - - 91 100.0Wyndham (C) - - 94 103.3 - - 91 100.0Yarra Ranges (S) 4 4.6 80 92.0 4 4.6 87 100.0Frankston (C) 3 3.7 76 93.8 - - 81 100.0Banyule (C) - - 71 94.7 - - 75 100.0Other LGAs(b) 39 2.3 1,648 96.8 26 1.5 1,703 100.0
Victoria 63 2.4 2,514 96.3 37 1.4 2,611 100.0
(a)Measures the number of people with a profound or severe disability.(b)Other Local Government Areas include "No usual address" and "Unincorporated Victoria".
Papua New Guinea-born
Local Government Area
Has need for assistance
Does not have need for assistance
Not stated Total
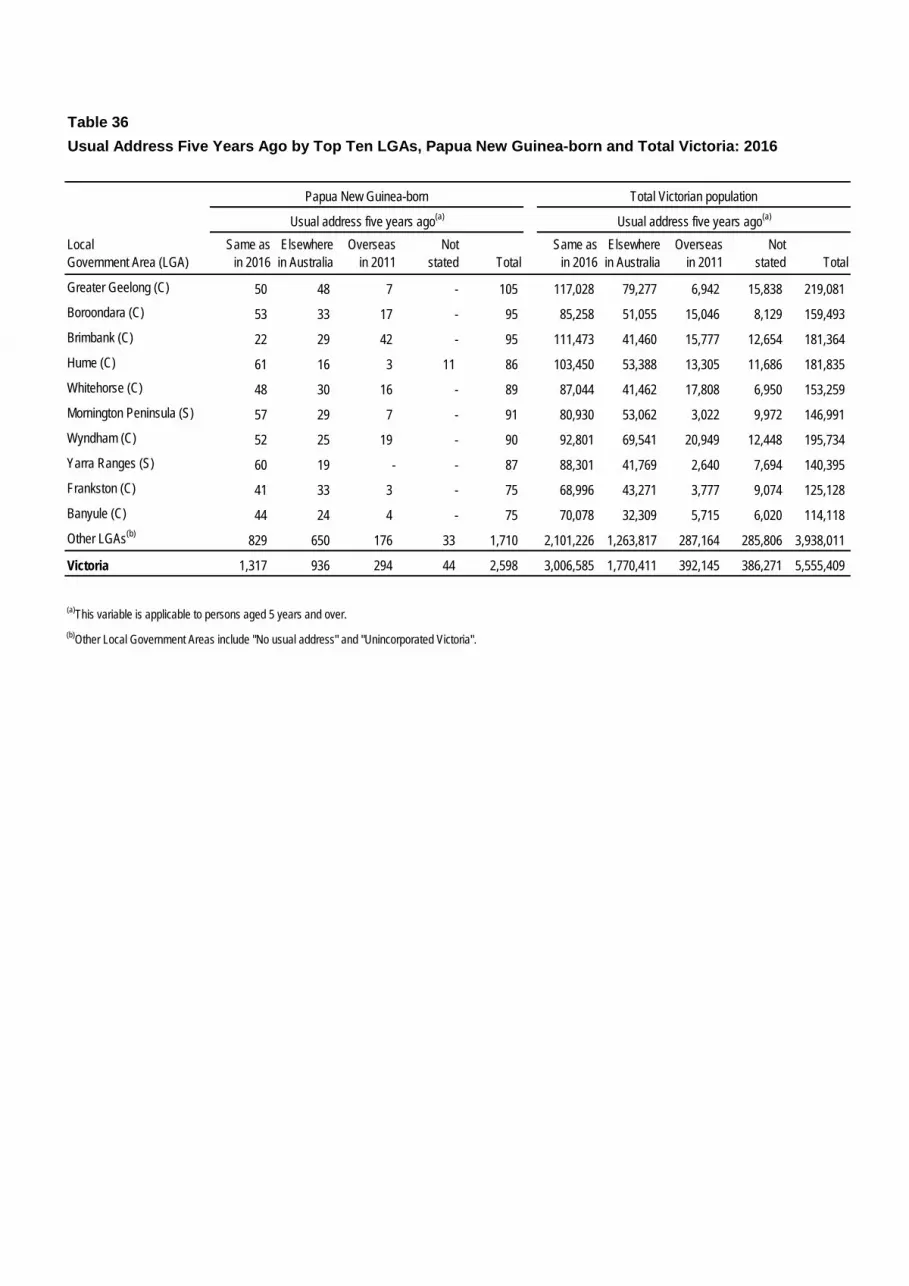
Table 36Usual Address Five Years Ago by Top Ten LGAs, Papua New Guinea-born and Total Victoria: 2016
Local Government Area (LGA)
Same as in 2016
Elsewherein Australia
Overseasin 2011
Notstated Total
Same as in 2016
Elsewherein Australia
Overseasin 2011
Notstated Total
Greater Geelong (C) 50 48 7 - 105 117,028 79,277 6,942 15,838 219,081Boroondara (C) 53 33 17 - 95 85,258 51,055 15,046 8,129 159,493Brimbank (C) 22 29 42 - 95 111,473 41,460 15,777 12,654 181,364Hume (C) 61 16 3 11 86 103,450 53,388 13,305 11,686 181,835Whitehorse (C) 48 30 16 - 89 87,044 41,462 17,808 6,950 153,259Mornington Peninsula (S) 57 29 7 - 91 80,930 53,062 3,022 9,972 146,991Wyndham (C) 52 25 19 - 90 92,801 69,541 20,949 12,448 195,734Yarra Ranges (S) 60 19 - - 87 88,301 41,769 2,640 7,694 140,395Frankston (C) 41 33 3 - 75 68,996 43,271 3,777 9,074 125,128Banyule (C) 44 24 4 - 75 70,078 32,309 5,715 6,020 114,118Other LGAs(b) 829 650 176 33 1,710 2,101,226 1,263,817 287,164 285,806 3,938,011
Victoria 1,317 936 294 44 2,598 3,006,585 1,770,411 392,145 386,271 5,555,409
(a)This variable is applicable to persons aged 5 years and over.(b)Other Local Government Areas include "No usual address" and "Unincorporated Victoria".
Papua New Guinea-born
Usual address five years ago(a) Usual address five years ago(a)
Total Victorian population
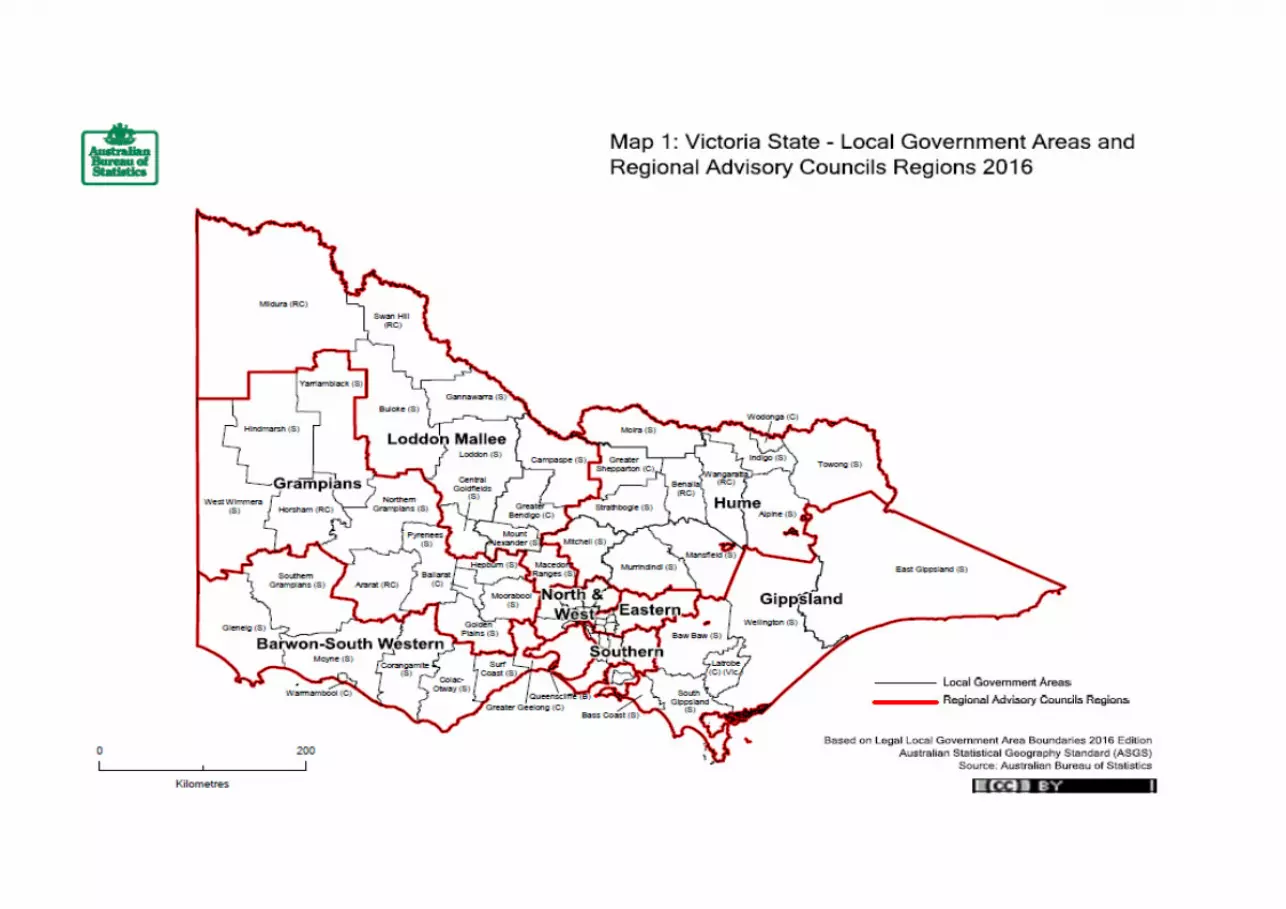
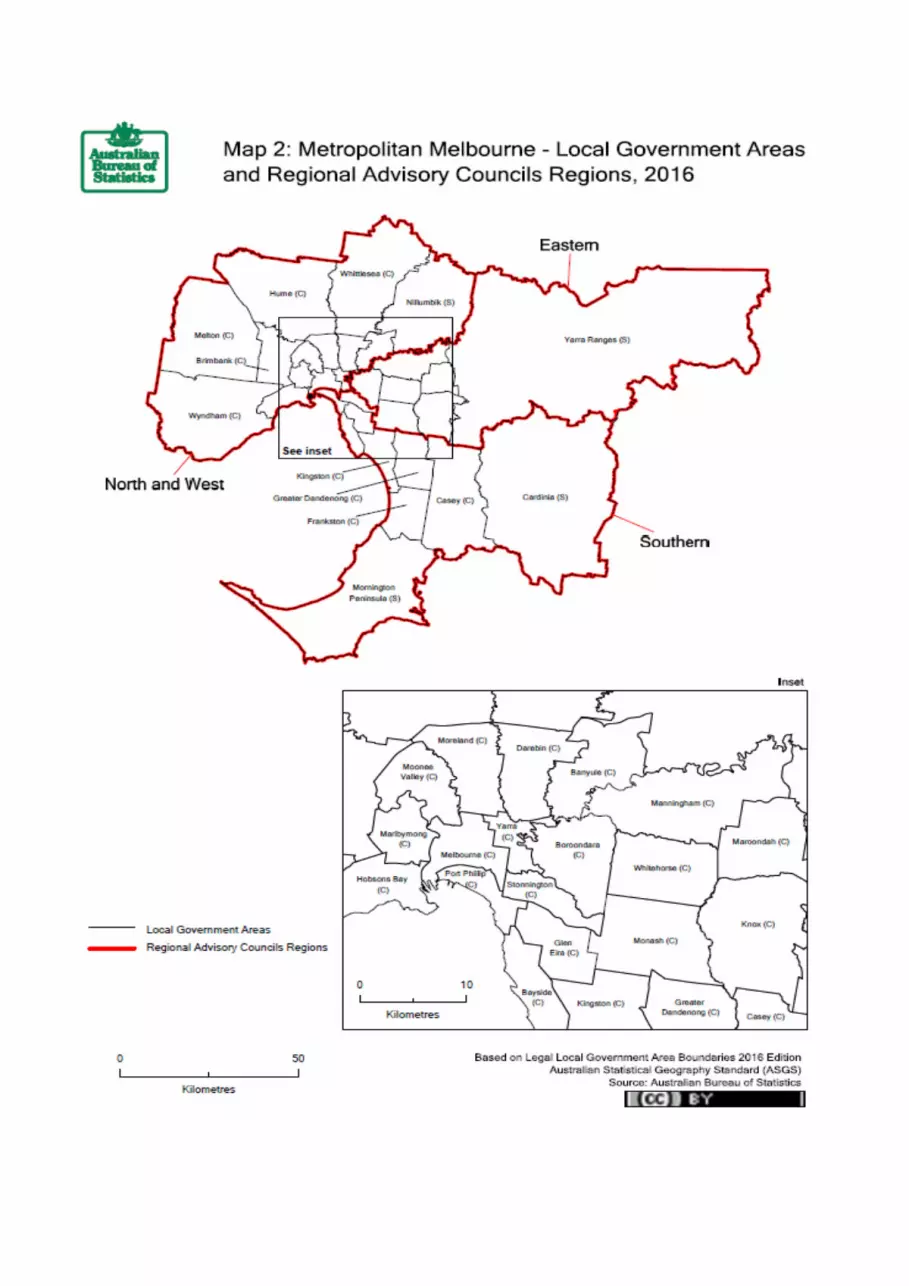
© The State of Victoria, Department of Premier and Cabinet 2018 ISBN 978-1-925551-84-6 Online (pdf)
ACCESSIBILITY
If you would like to receive this publication in an alternative format, please contact the Multicultural Affairs and Social Cohesion Division of the Department of Premier and Cabinet Victoria on [email protected].
This publication is only available in PDF format on the internet at www.multicultural.vic.gov.au.
Images by Artificial Studios – Jorge de Araujo, except for front cover middle photo


