Jutrnal of TropicalForest Science a(1): l5 - 36 MORTALITY FUNCTIONS FOR NORTH QUEENSI-AND RAIN FORESTS J. I{" Vanclay Unit of Forestry, Royal Vetninary and Agricultural University, Thoruald,sensaej 57 DK-IB7I, Fredniksbng, Dmmark fuceiued February .1990 VANCI-AY' J.K 1991. Mortality functions for north Queensland rain forests. Subjective aNod grouping oftropical rainforestspeciesforgrowthprediction may be unreliable because l) there may be hundreds of species, many comparatively uncommon, the ecology of which may not be well known, Z) species within the same genus ,rrray have significantly different growth patterns, and 3) growth rate may not provide a reliable indication of mortality. Growth models can retain the species identity of each simulated tree, but some aggregation is necessaryto enable estimation of increment and mortality functions. An objective approach aggregated 100 rain forest tree speciesinto ten groups to enable efficient estimation of mortality functiohs. This strategy provided better predictions than a previous subjective grouping. Annual survival probabilities were predicted from tree size, stand density and site quality using a logistic equarion fitted by maximum likelihood estimation. Additional species with insufficient data for analysis were subjectively assigned to these ten equations. Several strategies were investigated; the best approach for these species seemed to be to employ the equation which served the greatest number of species. The increment pattern did not provide a good basis for assigning such species to equations, and this suggests that different groupings may be necessary to model the various components of tree growth. Key words: Mortality functions - rain forest - species grouping - prediction - 'ival Introduction The prediction of mortality is essential in growth and yield models for natural forests. It may be acceptable to assume negligible mortality in intensively managed industrial plantations, but such an assumption would be untenable in tropical rain forests. Many methods for predicting mortality have been developed for even aged monospecific stands, but most are not suited for modelling rain forest Stands. Stand density approaches (Reineke 1933, Yoda et at. 1963) indicate only the residual stocking and give no indication of survival of ind.ividuals. Individual tree competition approaches including threshold incremenr (Newnham 1964) and limiting competition methods (Mitchell 1969) fail to accounr for mortality not induced by competition (e.g. pests, diseases,cyclones). Hamilton (1974, 1980) proposed the use of logistic functions to predicr survival rarher rhan mortality, and Hamilton and Edwards (1976) presenred a robust function which predicts survival from tree size and stand densiw. A significant correlation often exists between diameter increment during the previous period and survival during the subsequent period, and several l5
Transcript
Jutrnal of TropicalForest Science a(1): l5 - 36
MORTALITY FUNCTIONS FOR NORTH QUEENSI-ANDRAIN FORESTS
J. I{" Vanclay
Unit of Forestry, Royal Vetninary and Agricultural University, Thoruald,sensaej 57 DK-IB7I,Fredniksbng, Dmmark
fuceiued February .1990
VANCI-AY' J.K 1991. Mortality functions for north Queensland rain forests.Subjective aNod grouping oftropical rainforestspeciesforgrowthprediction maybe unreliable because l) there may be hundreds of species, many comparativelyuncommon, the ecology of which may not be well known, Z) species within thesame genus ,rrray have significantly different growth patterns, and 3) growth ratemay not provide a reliable indication of mortality. Growth models can retain thespecies identity of each simulated tree, but some aggregation is necessary to enableestimation of increment and mortality functions. An objective approachaggregated 100 rain forest tree species into ten groups to enable efficient estimationof mortality functiohs. This strategy provided better predictions than a previoussubjective grouping. Annual survival probabilities were predicted from tree size,stand density and site quality using a logistic equarion fitted by maximumlikelihood estimation. Additional species with insufficient data for analysis weresubjectively assigned to these ten equations. Several strategies were investigated;the best approach for these species seemed to be to employ the equation whichserved the greatest number of species. The increment pattern did not provide agood basis for assigning such species to equations, and this suggests that differentgroupings may be necessary to model the various components of tree growth.
The prediction of mortality is essential in growth and yield models fornatural forests. It may be acceptable to assume negligible mortality inintensively managed industrial plantations, but such an assumption wouldbe untenable in tropical rain forests.
Many methods for predicting mortality have been developed for even agedmonospecific stands, but most are not suited for modelling rain forest Stands.Stand density approaches (Reineke 1933, Yoda et at. 1963) indicate only theresidual stocking and give no indication of survival of ind.ividuals. Individualtree competition approaches including threshold incremenr (Newnham 1964)and limiting competition methods (Mitchell 1969) fail to accounr for mortalitynot induced by competition (e.g. pests, diseases, cyclones). Hamilton (1974,1980) proposed the use of logistic functions to predicr survival rarher rhanmortality, and Hamilton and Edwards (1976) presenred a robust functionwhich predicts survival from tree size and stand densiw.
A significant correlation often exists between diameter increment duringthe previous period and survival during the subsequent period, and several
l 5
Jm,mal of TropicalForest Sci,ence 4(l): 15 - 36
researchers have employed past diameter increment for predicting survival(Buchman 1979, Ek & Monserud L979, Hann 1980, Buchman et al. 1983, WanRazali 1988). However, observed diameter increments from the previous periodare not generally available from inventory data or for long term predictions.Predicted rather than actual diameter increments could be used, but Monserud(1976) demonstrated that the observed and predicted diameter incrementsproduce different parameter estimates. The correlation between predictedincrement and survival is not as strong as for observed increments, and offerslittle advantage over the basic variables of tree size and stand density.
Tropical rain forests are characterized by large numbers of tree species withdiverse growth habits. Although some of these species are widely distributed,others occur infrequently and data from which to develop growth models maybe sparse. The rain forests of north Queensland are no exception. Of the 400tree species recognized on a series of permanent sample plots, the most common\Vo of tree species contribute 50% of the available growth data, while the leastfrequent 50Vo of species contribute a mere \Vo of the data.
This poses unique problems for growth model development. It is impracticalto develop mortality functions for each individual tree species, because of thelarge number of functions that would be required, and the paucity of data formany species inhibis the development of reliable relationships. Thus forefficient estimation of mortality functions, it is desirable to aggregate species intoseveral groups. This reduces the number of functions required to a moremanageable number, and avoids the requirement for specific equations forspecies with few data. Such groupings need not form the basis for growthmodelling, as simulation models can retain the individual identity of all species(Vanclay & Preston 1989), but are necessary for the estimation of incrementand mortality functions. Ideally, species should be grouped on a priori grounds,and tests performed to justif the validity of such groupings. This may bepossible in temperate forests where there are few species and their ecology iswell documented, but is unrealistic in tropical moist forests where there arehundreds of species, many of which are not well known. Taxonomy (family orgenus) may not provide a good guide to growth habit (Swaine & Whitmore 1988,Vanclay 1991), and other methods based on size at maturity, successionalstatus, et cetera may be rather subjective. Mortality may be dependent upon treesize and stand density, so grouping based on average mortality may be spe-cific to the data set used. Not only is it diflicult to resolve which species tocombine, but it is not clear how many groups are required. Meldahl et aI. (1985),Leech et al. (1991) and Vanclay (1991) have examined procedures to resolvethese questions. Meldahl et at (1985) argued that the grouping should reflectthe dynamics of growth, and this could be best expressed through thecoefficients of a regression equation on diameter increment. They attemptedcluster analysis on these coefficients, but found that reasonable results could beobtained only when the regression analysis was constrained to a single explana-tory variable. Their best results were obtained using the basal area of treeslarger than the current tree as the explanatory variable. Cluster analysis was
l 6
Joum.al of Tropical Fmest Science4( I ) : 15 - 86
weighted by the inverse of the significance level of slope parameter, andprovided twenty clusters from 110 species-type equationr. The number of dataassigned to each cluster varied greatly, "nd th; outcome was subjectively
.aai1st9a to provide the final grouping. The adequacy of final groups wis tested
by fitting a multiparameter linear function "ttd examining th. total (acrossclusters) residual sums of squares, on the assumption that a bettergroupingwould result in a better fit. Whilst the method provide a grouping o1 simitaielements, it did not provide a unique solution.
Leech et aL ( l99l ) used a Behrens-Fisher analogue of Hotelling's T2 togroup 27 species for volume equation estimation. They used u poty"omialequation to predict tree volume (V) from tree diameter (D) for uee i:
V - boi * b,,D + br.Dz + ... b,,,D"
Then, representing the vector of coefficients as
u', = [bo,, b,,, br,, ... b,,11,
Hotelling's Tz between rwo species i and j can be defined as
d,,t = (",-\)'S-t (u,-ur)
where S-r is the combined covariance matrix of regression coefficients forspecies i and j- By calculating all possible combinations
-u ry--"tric matrix with
zero diagonal elements can be formed. Principal coordinate analysis (Gower1966) was usedto_ group species on the basisof tnismarrix. Leech
'etaL (lggl)
concluded that the technique should only be used when the order of thepolynomial and the sign of the highest term were the same for each of the twoindividual species equations. The method was also computationally intensive.
Vanclay (1991) devised an objective means to aggregare 227 rp..i., into 4lgroups to enable efficient estimation of diameter incie-ent functions for agrowth model of tropical rain forest in north Queensland. His approach in-volved:
- Ranking species in order of increasing number of observations, withthe miscellaneous group assigned lowest rank;
- 4*i8ning the species of highest rank the founding species of group l;- For each species in decreasing order of rank, .otrdicting pairwir! F-t..twith all founding species of higher rank. If the incoming species was sig-nificantly different (p<0.01) from all existing foundingrp.ii"r, irbecamethe founding species of a new group. Species not sigiidcantly differentfrom all founding species remained ungiouped;
- After identifing all founding speciei, those species remaining un-grouped were compared, in order of rank, with all existing groups,and grouped with the most similar group. Similarity was dEteiminedas that grouping which led to the smallesi increase in residual sum squa-res when the incoming species was amalgamated with the group. These
t 7
Jurrnal of TropicalFmest Science 4(1): l5 - 36
comparisons were made with the whole group, not just the founding
species.Thil approach overcomes many of the difficulties associated with the
alternatiu.i dir.nssed above, and is computationally efficient. Instead of a
comparison of all possible pairs, initial comparisons are made between species
with many data, reliable parameter estimates and homogeneous variance.
Species with few data are only later compared with one of these major groups.
ItalsoavoidsLeech's etal. (1991) needto arbitrarilyselect a subset of themore
numerous species to define the groups. This selection is by no means intuitive
as in Vancliy's (1991) study the species ranked 186 with only 13 observations
initiated a new group. This approach provided an objective basis for aggregat-
irg species, but there is, unfortunately, no guarantee that the outcome is
optimal. However, it provided an efficient, objective and repeatable means to
combine many species into a manageable number of groups for modelling the
diameter increment of tropical rain forests.The present study seeks to apply this approach to estimate mortality
functions. The basis for grouping is the similarity of regression equations
predicting mortality from tree size and stand density. Sunrival rates cannot
t. calculated for many species for which no deaths have been observed, and
this study also examines strategies for assigning these species to equations.
Data
The present study concerns the tropical rain forests of northeast
Queenslind. These forests have been managed for conservation and timber
production for more than 80 y (Just l99l), and prior to their recent inclusion
bn the World Heritage List, provided a sustained yield of veneer and sawlogs of
60,000 ,f yt (Preston & Vanclay 1988). The Queensland Department of
Forestry (1983) research programme provided a database of 250 permanent
sample plots with a measurement history of up to 40 y. These plots sample virgin,
logged and silviculturally treated forests.Permanent sample plots range in size from 0.04 to 0.5 ha, and have been
frequently remeasured (Vanclay 1990). All trees exceeding l0 cm dbh ldiameterouei bark at breast height (1.3 m) or above buttressingl were measured for
diameter and assessed for merchantability.Pairs of remeasurements were selected from the database to attain intewals
between remeasurements of approximately five years, which did not sPan any
logging or silvicultural activity. A data file was created for input to the statistical
p*k"g. GLIM (Payne 1986), and contained 70,871 observations of survival
derived from 30,523 individual trees (some trees were measured more than
twice). The file also contained records of tree species and dbh, and stand and
site variables such as stand basal are^, site quality and soil tyPe. Site quality
for each plot was estimated using Vanclay's (1989b) equation 13. Any plots for
which the estimated site quality exceeded the range 0 to 10, or for which the
variance of the estimated site quality exceeded 2, were rejected and omitted
from the analysis. Reasonable estimates of site quality were obtained for 212
plots, which provided the present database.
l 8
Joum.al of TrapicalFmest Science4(l): 15 - 36
Species identity is recorded in the database as a three character mnemonic(the Forest Research Branch code) for the great majority of species, but a fewtrees of indeterminate identity were identified only ai miscellaneous. However,correct species identification is often difficult in these forests, and routineresource inventory procedures record only the standard trade name (SAAl_983), using a subset of the mnemonics known as the Harvesting and Marketing(H&M) code. Although the H&M code retains rhe correctldentity of ,rortspecies, several members of a genus may share a common code, as may membersof more than one genus with similar timber characteristics. There are alsoadditional non-commercial species simply labelled miscellaneous. As thepresent study was to develop mortality functions to project temporaryinventory plotsfor yield prediction (Vancl ay &Preston lgSg); it ilas appropriateto use the H&M codes. Three hundred of the FRB.codes in the-data wereconverted into 238 H&M codes for analysis, and the remaining 100 with noH&M equivalent were grouped as miscellaneous.
The resulting data set contained many species with so few observations thatmeaningful analyses could not be attempted. Thus the data set was partitionedinto two parts. The main data set to b. used for establishing thl mortalitymodels comprised 64,446 observations on the 100 species ior which morethan five deaths had been recorded in the data. T'fr. auxillary data setcontained the remainder (6,425) of the observations which would Le used roallocate these less common 139 species to the established mortality functions.
Method
The probability that a tree survives may be modelled as a binary responseusing generalized linear regression fitted by maximum likelihood andadjusted to account for the varying periods of observation. The link function(Aitkin et al. l98g) implied is
I p,,, -l
r = L o g l r r * ILr + p'n _J
where n is the linear predictor, t is the number of years benueen remeasurements
1"d p is the pr_obability of any individual tree surviuirg for t years. This hasthe propertyof mapping p[0,1] onto (..", -). GLIM (p"y". lgfi6) enables suchgeneralized linear regression to be performed without explicitly transformingthe data, and this enables individual tree observations to be used, withsurvival coded as a discrete (0,1) variable which has a binomial b(rl,ptl,)distribution.
_ Various prediction functions were investigated for several species withabundant data. Tree size was found to be the rnost important variable, and wasaccommodated in the model using diameter and relitive status. Relative sraruswas expressed as the relative position on the cumulative basal area distribution(i.a. the biggest tree in the stand has RS=0, and the smallest tree has RS=l).Survival of some species was. significantly correlated with site qualiry andstand basal ^tea, but preliminary trials indicated that the inclusion of these
l 9
Joumalof TropicalFmest Sciencea(l): l5 - 36 20
variables in the model did not improve the final grouping. Although
overtopping basal area (i.e. basal area per hectare of trees larger than the
present tree) was found to be significant in predicting diameter increments(Vanclay 1989b, l99l), it was not significantly correlated with sumival. Thus
the basis for grouping was the logistic function:
p = [ l + e - l - r
nwhere Y= F" + p,Log (DBH) + p2DBH * FrK'
and where P is the annual probability of survival, DBH is diameter (cm dbh),
RS is relative status of the tree, calculated as overtopping basal area divided by
the total plot basal area (thus 0 implies dominant trees, I implies suPPressed
trees), andp, at. parameters tobeestimated. Inclusion of additionalvariables
in the model at this stage provided an inferior grouping. This is consistent
with findings by Meldahl et aL (1985) that simple models provided a better
basis for aggregation.The following two stage procedure was used to aggregate species into
groups for the estimation of equation ( I ) .- Species were ranked by amount of data (in descending order by number
of obsewed deaths, then by sunivals);- The species of highest rank became the founding species of group l;- For each species in decreasing order of rank, pairwise tests were made with
one or more founding species of higher rank, using the likelihood ratio
test statistic (Aitkin et a/. 1989):
7u= -2 t(p,) - (p)) (2)
where ,(F) is the log likelihood and l, has an asymptotic 2gz distribution if
the omitted terms from the model actually have zero regression coeffi-
cients. If the incoming species was significantly different (P<0.01) from
all existing founding species, it became the founding species of a new
group. Species which were not significantly different from one or more
founding species remained ungrouped at this stage. Thus the first stage
identified a subset of species, the founding species, each of which was
significantly different from all other species within the subset;The second stage compared all remaining species (those not in the found-
ing subset) with each of the groups formed by the founding species, and
combined these with the most similar group. The ungrouped species
were compared in order of rank, and similarity was determined as that
grouping which led to the smallest decrease in likelihood when the in-
coming species was amalgamated with the group. These comparisons
were made with the whole group, not just the founding species.
Stage I involves many pairwise tests; in the present study about 150 tests were
required. Thus the probability of a type I error is quite high (P=l-(l-0.01)r50 =
( l )
Jmlmnl of TrapicalForest Scimce4(l): l5 - 36
0.78).However, stage I merely identifies the founding species; the assignmentof the remaining species to these groups is performed in itrg" 2. MeldJhl et al.(1985) and Leec}r et aL (1991) avoided this large number of tists by using clusteranalysis to aggregate species on the basis of individual species re[ressionequations. Whilst this method avoids the problem of the iarg. p--b., ofpairwise tests, it creates other problems, and both studiei resorted tosubjective assignment of species to complete their analyses.
Because some species exhibit non-homogeneour r"d"rrce, stage Z may resultin the aggregation of species which differ significantly. Conside. that a *remain-itg" species may exhibit a survival pattern similar to but significantly differentfrom one founding species with small variance, whilst another foundingspecies with a different survival pattern may not differ significantly becauseof its greater variance. Stage 2 will ignore the non-homogeneous variance andgroup "remainitg"
species with the most similar founding species irrespectiveof significance tests (which assume homogeneous variance). Whettter or not thisis an appropriate strategy is largely a question of personal preference. However,the method remains an objective and repeatable "ppro".h.
Following grouping, the inclusion of additional covariates was examined.Site quality (Vanclay 1989b) and stand basal area were significant for somegroups, and were included. Thus the final model was:
p = [l * " -{0,+F,Log(DBH)+prDBH+FrRs3+posQ+prBA+p"Log(BA))
]-r (3)
A non-linear resPonse with basal area was detected for nuo groups. Thesegroups indicated optimum survival at stand basal areas of 16 ana gS nf har forgroups 2 and 7 respectively, well within the range observed for the species group(t55 and 5-86 nf har respectively). For some individual species, sremsassessed as unmerchantable had exhibited a lower survival. However,merchantability was found not to have a significant correlation with any of thegrouped data. Logging and treatment seemed to have no effect on mortalityin the residual stand. Soil type was also examined but contributed noimprovement to the model. Some data were drawn from experiments whichincluded planted trees which may not have occurred naruially at rhat site.However, including a variable to account for these planted stems contributed nosignificant improvement to the model. It app.a.s that the survival of under-planted stems in the rain forest, after attaininlg l0 crn dbhob, is not greatlydifferent to that of natural regeneration.
Results
Primary grouping
The first stage of the analysis identified ten species, each with significantly(P<0.01) different survival patterns, and the slcond srage aggregated theremaining species to form ten groups (Appendix) . Tht g.""p numberingreflects the amount of data available for the founding specieJ"f tn. gro.rp, .rd
2r
Joumal of TropicalForest Scimce 4(1): 15 - 36
in no way implies any silvicultural preference or average survival rate. The
resulting groups reflect similarity of survival pattern (aiz parameter estimates
for Equation 1) , and do not necessarily have any other ecological significance.
Pionelr and gap colonizing species are not confined to a single group, but occur
in several groups (e.g. Acacia, Alphitonia, Dendrocnide and Omalanthus occur in
Groups 1,4,5, 6 and 8). Group I contains both pioneer and shade tolerant
(e.g. Acacia and Myristica) species. However, this analysis of mortality
appeared to differentiate successional status more strongly than did a similar
analysis of diameter increment patterns (Vanclay 199f ). The analysis also
indicates thar taxonomy may not provide a rational basis for aggregating
species for modelling. For examplq, Polyscias munayi and P. australiana are
founding species with significantly different survival patterns (P<0.01), and
members of the Elaeocarpus genus are found in five different groups. Thus it
should not be assumed that all species within a rain forest genus exhibit the
The identification of ten groups in stage I of the analysis indicates that the
five groups previously employed (Vanclay 1989a)- are insufficient, and that the
4l groups used for predicting diameter increment (Vanclay l99f ) are
unnecessary for predicting mortality. This result is confirmed by standard
statistical tests. Table I reports test statistics (1, from Equation 2 with
asymptoticyz distribution) to allow comparisons of various aggregations. These
sratistics have been summarized by standardizing (Equation 2) the difference in
log likelihood from fitting Equation I to the present (Appendix) and alternative
groupings. Alternatives included five groups used in previous studies (QDF
1985, Vanclay 1989a), rhe 4l groups used to predict diameter increment
(Vanclay 1991), and groups based on average mortality classes (Table l). Such
groups based on average mortality classes of standard width (e.g. lVo classes)
provided better results than classes of variable width designed to
accommodate equal numbers of species or equal amounts of data. Positive test
statistics in Table I indicate that the present approach was superior to the
alternative, whilst negative statistic$ indicate the alternative provided a better
fit.Table I indicates that the present grouping provides a better fit to the
mortality data than do the previous five growth groups (QDF 1985,
Jrumal of Tropical Fmest Sciencea( I ) : 1.5 - 36
0 50 100 150 200Diameter (crz dbhob)
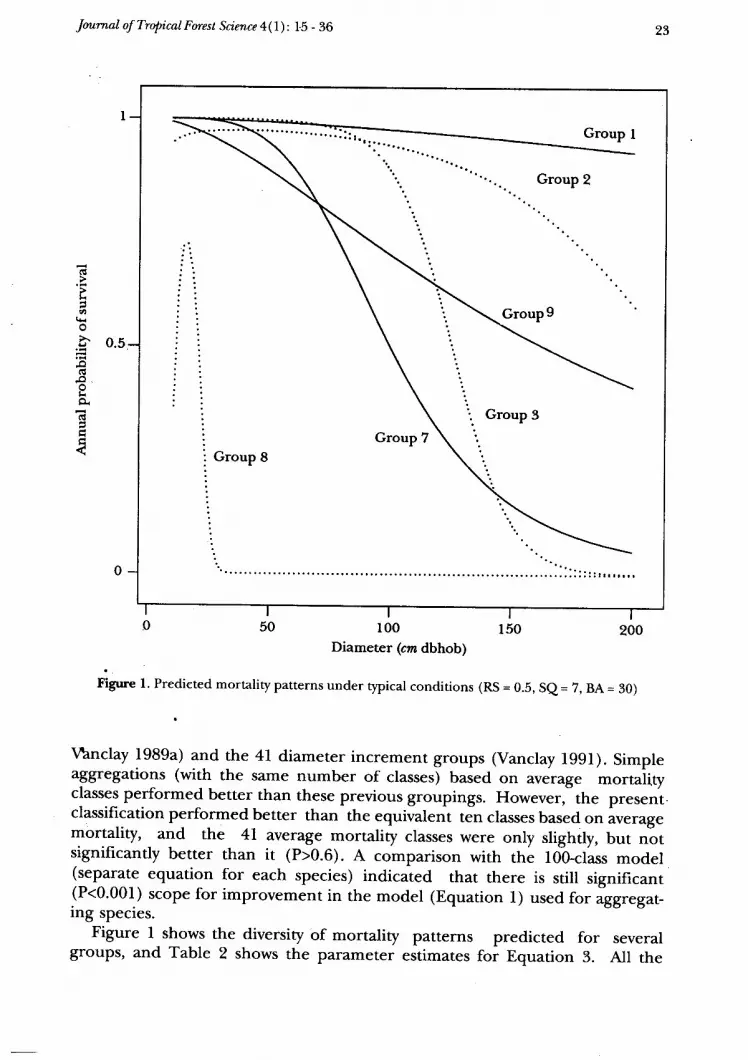
Figure l. Predieted mortality patterns under typical conditions (RS = 0.b, Se = Z, BA = 30)
\Anclay 1989a) and the 4l diameter increment groups (Vanclay fggl). Simpleaggregations (with the same number of classes) based on average -ortuiiryclasses performed better than these previous groupings. However, the present.classification performed better than the equivalent ten classes based o1 iu.rug.mortality, and the 4l average mortality classes were only slightly, but notsignificantly better than it (b0.6). A comparison with the l0b-class model(separate equation for each species) indicated that there is still significant(P<0.001) scope for improvement in the model (Equation l) used for iggr.gut-ing species.
Figure I shows the diversity of mortality patterns predicted for severalgroups' and Table 2 shows the parameter estimates foi Equation 3. All the
23
G
tr
rh
o.f 0.5
Gp .ot<9.
trtr
Ju,m,al of TropicalForest Scimce 4(l): 15 - 36
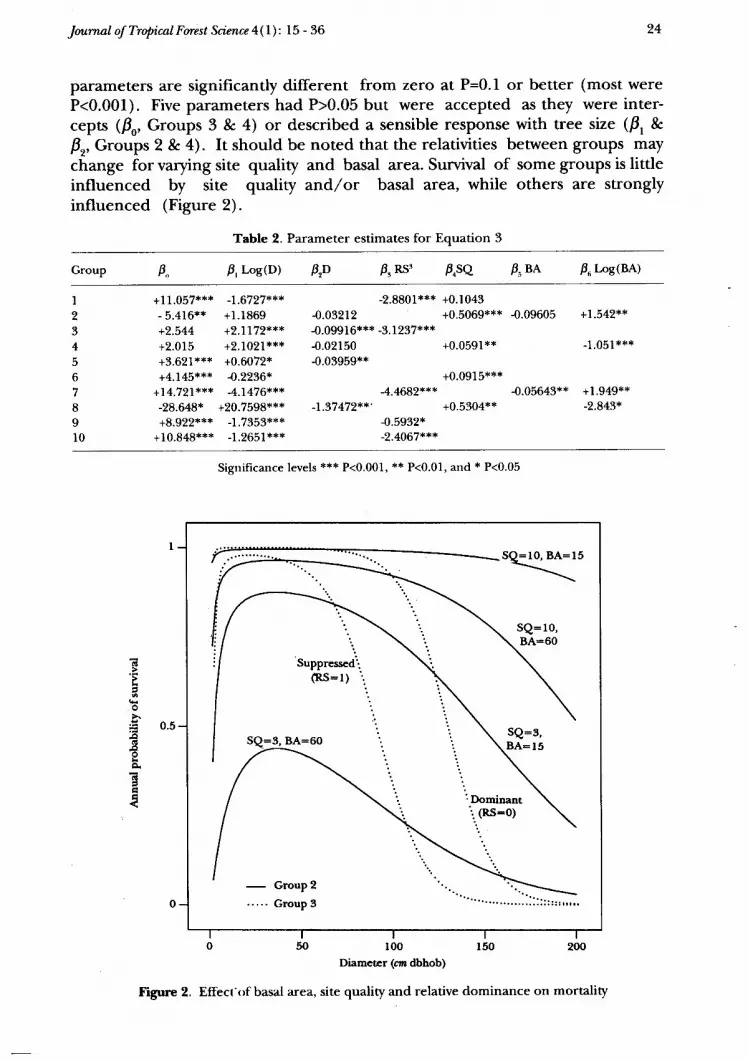
parameters are significantly different from zero at P=0.1 or better (most wereP<0.001) . Five parameters had P>0.05 but were accepted as they were inter-cepts (Po, Groups 3 e q or described a sensible response with tree size (F, ep* Groups 2 & 4). It should be noted that the relativities betrveen groups may
change forvarying site quality and basal area. Survival of some groups is littleinfluenced by site quality and/ or basal area, while others are stronglyinfluenced (Figure 2).
Table 2. Parameter estimates for Equation 3
24
Group F,, F, Log(o; F,D P, K' p.SQ p" BA ft Log(BA)
Significance levels 'r'*'t' P<0.001, ** P<0.01, and * P<0.05
0 50 lo0 150 200
Diametcr (an dbhob)
Figure 2. Effect'of basal area, site quality and relative dominance on mortality
Joum.al of TropicalForest Scimce 4(l): l5 - 36
Secondary grruping
Many species found in these rain forests may not occur on permanent sampleplots in sufficient numbers to enable reasonable estimates of mortality to bemade, even where the forests are well sampled. These species must still beassigned to equations if the growth of the forest is to be simulated, and someobjective procedure for assigning these to prediction equations is desirable.Taxonomy does not provide a reliable guide, and the ecological characteristicsof these less common species may not be established. Possible approaches forallocating these species to equations include combining:
- on the basis of its increment group;- on the basis of its average mortality;- with the group containing the greatest number of species;- with the group containing the miscellaneous species; or- subjectively according to appearance, habit or taxonomy.
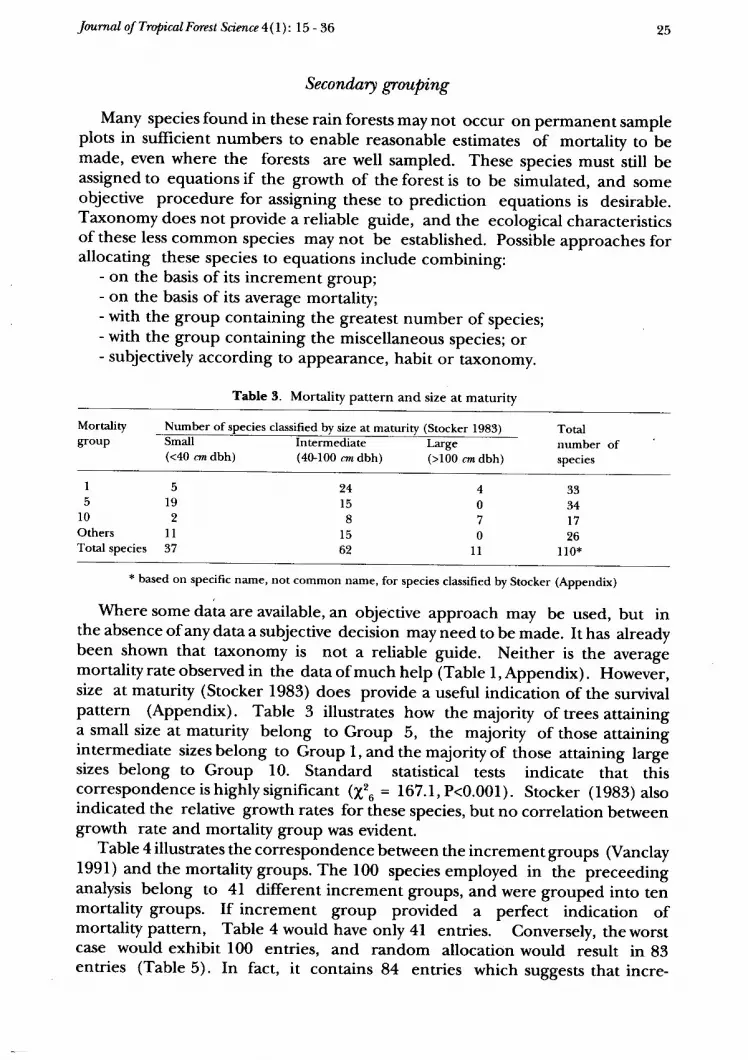
Table 3. Mortality pattern and size at maturity
25
Mortalitygroup Small
(<40 az dbh)Intermediate(4G100 crz dbh)
Large(>100 cmdbh)
Totalnumber ofspecies
Number of species classified by size at marurity (Stocker 1983)
II
l 0OthersTotal species
c
192
l l37
24l 58
l 562
40I
0l l
3334t 726
I l 0 *
* based on specific narne , not common name, for species classified by Stocker (Appendix)
Where some data are available, an objective approach may be used, but inthe absence of any dataa subjective decision may need to be made. It has alreadybeen shown that taxonomy is not a reliable guide. Neither is the averagemortality rate observed in the data of much help (Table l, Appendi*). However,size at maturity (Stocker lg83) does provide a useful indication of the survivalpattern (Appendix). Table 3 illustrates how the majority of trees attaininga small size at maturity belong to Group 5, the majority of those attainingintermediate sizesbelong to Group l,andthemajorityof those attaining largesizes belong to Group 10. Standard statistical tests indicate that ttiiscorrespondenceishighlysignificant (X2u = 167.l,P<0.001). Stocker (1983) alsoindicated the relative growth rates for these species, but no correlation betweengrowth rate and mortality group was evident.
Table 4 illustrates the correspondence between the increment groups (Vanclay1991) and the mortality groups. The 100 species employed in the preceedinganalysis belong to 4I different increment groups, and were grouped into tenmortality groups. If increment group provided v perfect indication ofmortality pattern, Table 4 would have only 4l entries. Conversely, the worstcase would exhibit 100 entries, and random allocation would result in 83entries (Table 5). In fact, it contains 84 entries which suggests that incre-
Joumal of Tropical Fmest Sci,mce 4( 1): l5 - 36
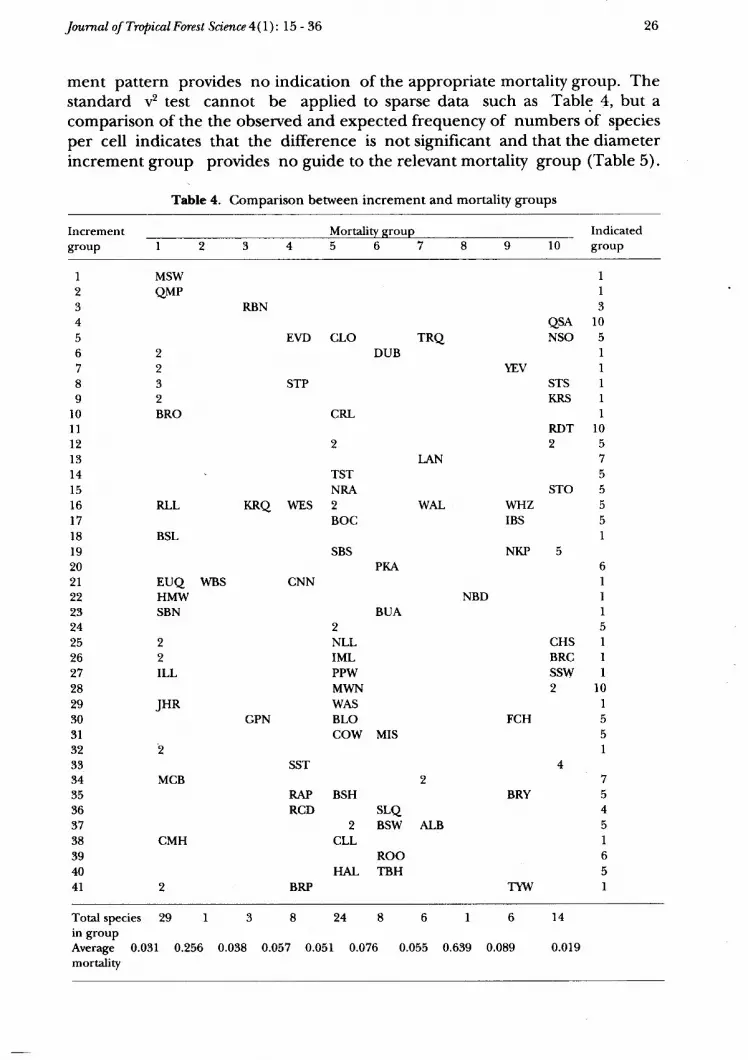
ment pattern provides no indication of the appropriate mortality group. Thestandard v2 test cannot be applied to sparse data such as Table 4, but acomparison of the the observed and expected frequency of numbers of speciesper cell indicates that the difference is not significant and that the diameterincrement group provides no guide to the relevant mortality group (Table 5).
Table 4. Comparison between increment and mortality groups
26
Increment
grouP
Mortality group IndicatedI l0 group
I
2345678I
l 0l 1t 2l 3t 415l 6r 7l 8l 920272223242526272829303132333435363738394047
MSW
QMP
I
232BRO
RLL
QSANSO
II3
1 0cEVD CLO TRQ
DUB
STP
CRL
2
TSTNRA
I(RQ WES 2BOC
SBS
RDT IO2 5
75
STO 5WHZ 5IBS 5
INKP 5
6I1ID
YI,VSTSKRS
CHSBRCSSW2
FCH
LAN
WAL
BSL
EUQ WBSHlvfwSBN
22ILL
JHR
2
MCB
CMH
2
PKA
BUA9
NLLIMLPPWMWNWASBLOCOW MIS
NBD
GPN
l 015
5
I
SST
RAPRCD
2BSH
SLQ2 BSW ALB
CLLROO
HAL TBH
44I
BRY 54D
I6I
TYW IBRP
Total species 29 1in groupAverage 0.031 0.256mortaliw
24 1 4
0.0190.038 0.057 0.051 0.076 0.055 0.639 0.089
Jm,m.al of TropicalFmest Scimce 4(1): l5 - 36
Table 5. correspondence between increment and mortality groupings
27
Entriesper cell
Expectednumber
Observednumber
Test statistic(l ')
ProbabiliW
0I9t
Sum
32769l 4
410
32669l5
410
0.000.000.070.07 0.09
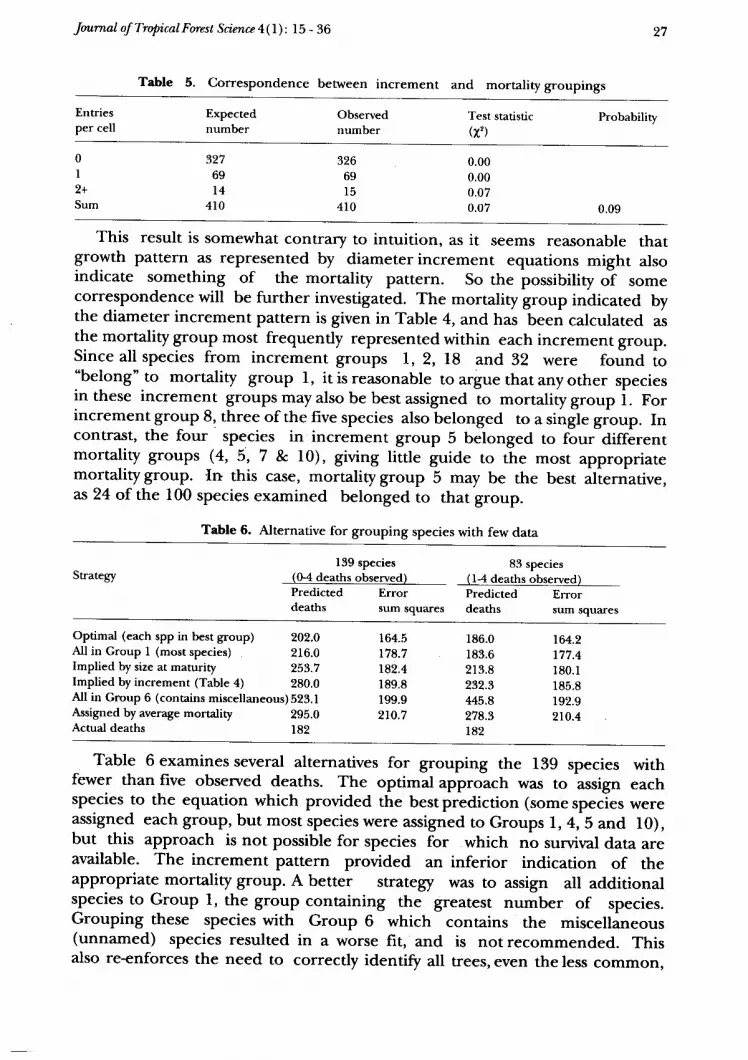
This result is somewhat contrary to intuition, as it seems reasonable thatgrowth pattern as represented by diameter increment equations might alsoindicate something of the mortality partern. So the possibiliry o? somecorresPondence will be further investigated. The mortality group indicated bythe diameter increment pattern is given in Table 4, and has been calculated asthe mortality group most frequently represented within each increment group.Since all species from increment groups l, 2, l8 and 32 were found to"belong" to mortality group l, it is reasonable to argue that any other speciesin these increment groups may also be best assigned to mortality gro.tp i. Forincrement group 8, three of the five species also belonged to a single gioup. Incontrast, the four' species in increment group 5 bJonged to four-diffirentmortality groups (4,5,7 e. l0), giving little guide to the mosr appropriatemortality group. {n this case, mortality group 5 may be the best iliernative,as 24 of the 100 species examined belonged to that group.
Table 6. Alternative for grouping species with few data
Strategy139 species
(G4 deaths observed)Predicted Errordeaths sum squares
83 species(14 deaths observed)Predicted Errordeaths sum squares
Optimal (each spp in best group) ZO2.O216.0253.7
164.5t78.7r82.4r89.8199.9zto.7
186.0183.6213.8232.3445.8278.3182
164.2r77.4180.1185.8r92.9210.4
All in Group I (most species)Implied by size at maturityImplied by increment (Table 4) 280.0All in Group 6 (contains miscellaneous)b23.1fusigned by average mortality 29b.0Actual deaths 182
Table 6 examines several alternatives for grouping the 139 species withfewer than five observed deaths. The optimal approach was to assign eachspecies to the equation which provided the best prediction (some rp.ci.r wereassigned each group, but most species were assigned to Groups 1, 4, 5 and l0),but this approach is not possible for species for which no survival data areavailable. The increment pattern provided an inferior indication of theapproPriate mortality group. A better strategy was to assign all additionalspecies to Group l, the group containing the greatest number of species.Grouping these species with Group 6 which conrains the miscellineous(unnamed) species resulted in a worse fit, and is not recommended. Thisalso reenforces the need to correctly identiS all trees, even the less common,
Jm,m,al of Tropical Fmest Sci.ence 4( I ) : 15 - 36 28
rather than to use codes for miscellaneous, et cetna. Unless there is some strongreason to assign these species otherwise, it may be most appropriate to groupspecies with no or few growth data to the group which contains the bulk of thespecies.
Table 7. Comparison of raw data, fitted model and previous model
Size
class
(car dbh)
Development data
Total Observed Predicted
trees dead dead
Species with 04 deaths All data
Total Observed Predicted
trees dead dead
Tota'l Observed Predicted Vanclay
tre€s dead dead (1989a)
lGl4 24769 t227
I5-lg 12016 582
2U24 7618 286
2529 5376 l9l
3G34 4l 16 129
35.59 5045 100
4044 2149 63
45.49 1675 58
50'54 1234 47
5t59 775 57
60& 484 t7
6569 '75 2r
7G.79 385 l2
8G99 222 6
l0Gllg 65 3
120+ 65 2
l24 l . l
550.0
302.0
195.5
138.2
94.9
70.4
54.4
40.8
28.6
18.3
13.4
15.0
. u .8
3.4
3.8
2340 79
1090 26
6U 15
4 W 9
399 15
280 I
258 7
206 4
165 5
153 3
9 8 3
75 I
106 2
76 I
30 l
1 8 2
85.0
35.3
18.4
15.6
I 1 . 3
7.9
7.2
5.3
3.4
3.4
2.4
1 .5
3 .1
2 .4
l . l
0.8
27tw 1306
13106 608
8272 y)l
5840 200
4515 t44
3325 109
2407 70
l88l 62
1599 52
928 40
582 20
450 22
491 t4
298 7
9 5 4
8 3 4
1326.1 1057.2
585.3 454.6
320.4 259.1
209.1 166.6
149.4 121.5
102.8 83.8
77.6 58.7
59.8 44.5
44.3 31.0
32.1 20.3
20.6 r2.7
14.9 9.4
18.0 9.4
r4.2 5.8
4.6 2.6
4.6 15.4
ft369 278r 6412 182 70781 2963 2983.8 2552.5
Discussion
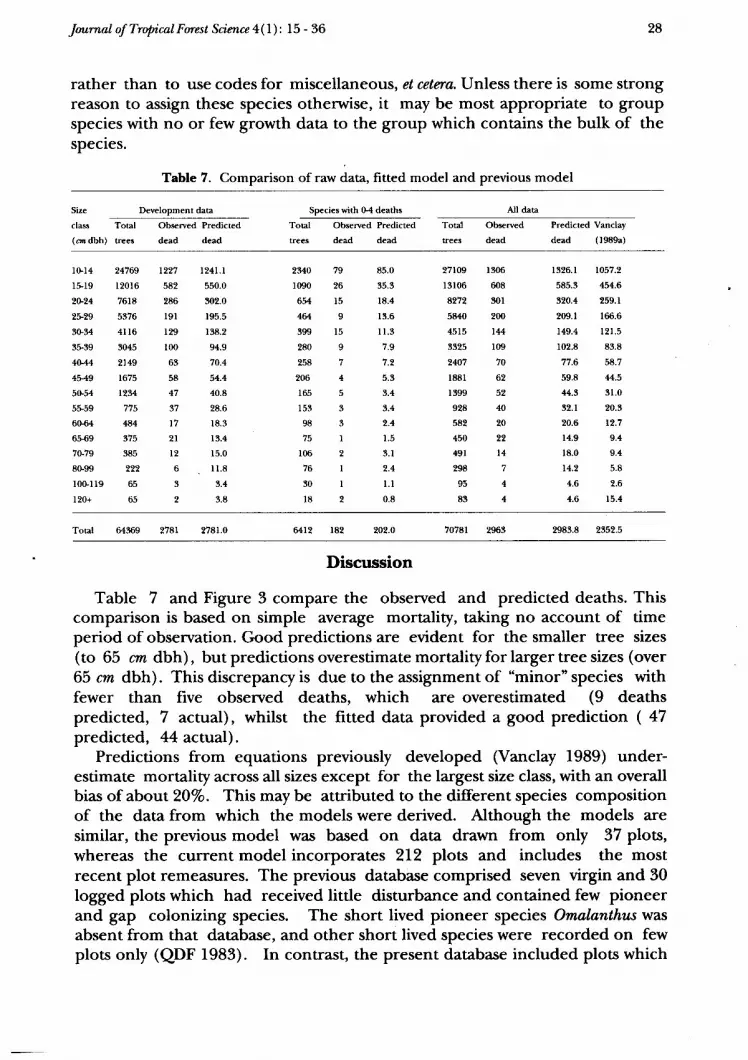
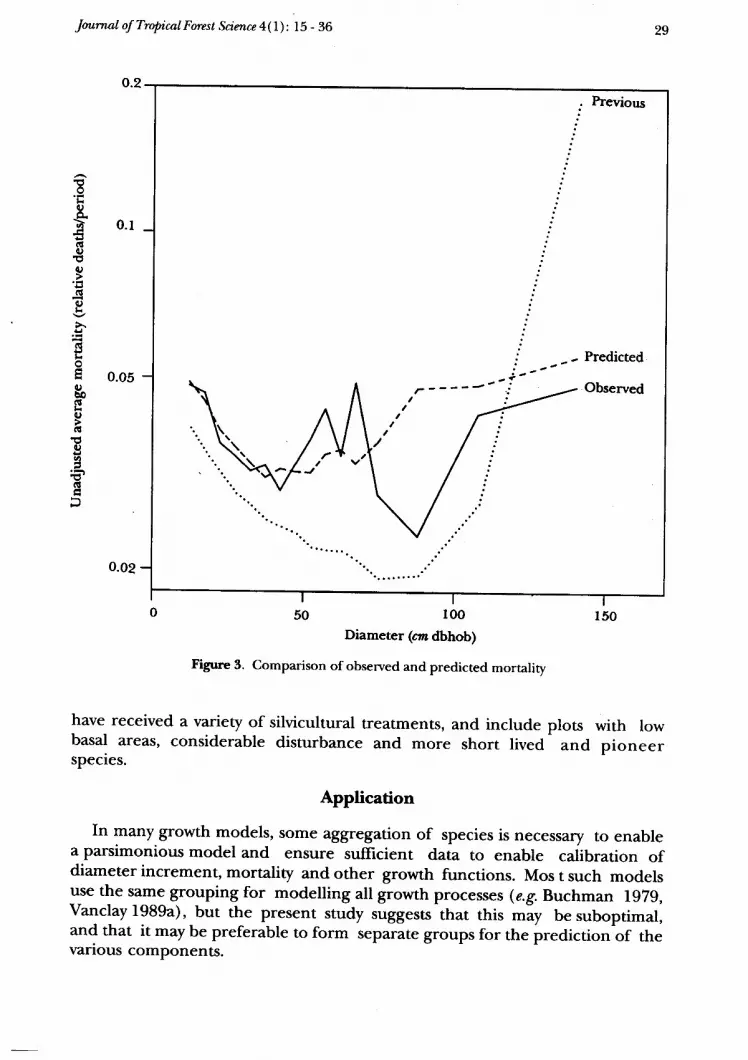
Table 7 and Figure 3 compare the observed and predicted deaths. Thiscomparison is based on simple average mortality, taking no account of timeperiod of observation. Good predictions are evident for the smaller tree sizes(to 65 cm dbh), but predictions overestimate mortality for larger tree sizes (over65 cm dbh). This discrepancy is due to the assignment of "minor" species withfewer than five observed deaths, which are overestimated (9 deathspredicted, 7 actual), whilst the fitted data provided a good prediction ( 47predicted, 44 actual).
Predictions from equations previously developed (Vanclay 1989) under-estimate mortality across all sizes except for the largest size class, with an overallbias of about 20Vo. This may be attributed to the different species compositionof the data from which the models were derived. Although the models aresimilar, the previous model was based on data drawn from only 37 plots,whereas the current model incorporates 212 plots and includes the mostrecent plot remeasures. The previous database comprised seven virgin and 30logged plots which had received little disturbance and contained few pioneerand gap colonizing species. The short lived pioneer species Omalanthus wasabsent from that database, and other short lived species were recorded on fewplots only (QDF f983). In contrast, the present database included plots which
Joumal of TropicalFmest Scimce a(l): l5 - 36
0.02
50 looDiameter (clll dbhob)
Figune 3. comparison of observed and predicted mortality
have received a variety of silvicultural treatments, and includebasal areas, considerable disturbance and more short livedspecies.
29
!otrq)A.
(!c)
1JO
(!
g
sko
q)bofitH
o(tl
0)rh,
E 'GItrp
plots with lowand p ioneer
Application
In many growth models, some aggregation of species is necessary to enablea parsimonious model and ensure sufficient data to enable caiibration ofdiameter increment, mortulity and other growth functions. Mos t such modelsuse the same grouping for modelling all growth processes (e.g. Buchman lg7g,Vanclay 1989a),_but the present study suggests that this miy be suboprimal,and that it may be preferable to form separate groups for the predictiott'of th.various components.
Jotr,m.al of TropicalFmest Scimce 4(1): 15 - 36
For many applications in growth and yield modelling it is desirable to retainindividual species identities (Vanclay 1989c, Vanclay & Preston 1989), but someamalgamation of species is necessary to provide reliable increment andmortality functions. Look-up tables can be used in growth models to enableany number of species to use a few diameter increment and mortality functionswhilst retaining the individual species identities. The present study describesan approach for objectively grouping species for the efficient estimation ofregression coefficients. It is not intended that species should be so grouped forall modelling processes, but that the grouping so identified will provide thenecessary entries in a look-up table of equation identities for mortalityprediction.
Conclusion
Taronomy does not provide a reliable indication of the growth or survivalpatterns of forest trees, as trees within the same genus may exhibit significantlydifferent parameters for prediction equations. An aggregation of tree speciesbased on the diameter increment pattern was not significantly correlated witha grouping based on survival. An independent aggregation based on mortalitydata provided a better model.
Species for which few growth data are available may be best assigned to thegroup with the greatest number of species for the prediction of mortaliry. Thegroup containing other "miscellaneous" species may not be the most-filpropr!ate for such species, and this emphasizes the need for correct identification of allspecies.
Acknowledgements
Many Oflicers of the Queensland Department of Forestry have contributedto the establishment and maintenance of the permanent sample plots anddatabase. N. Henry, J. Rudder and T. Richards helped with data processing.G. Unwin of CSIRO Forest Research kindly provided data for Backhousiabanmofiii. Two referees provided helpful criticism of an earlier manuscript.
References
AITKIN, M., ANDERSON, D., FRANCIS, B. & HINDE, J. 1989. Statistical Mod^ettinginGIJM,Oxfmd Statistical Science Snies 4. Clarendon, Oxford. 374 pp.
BUCHMAN, R.G. 1979. Mortality functions. Pp.47 - 55 in A gmnaliud forest growth projection
system applied to tlw Lahz States region. USDA Fmeit Smtice Gen"nal Technical Rcpmt NG49.BUCHMAN, R.G., PEDERSON, S.P. & WALTERS, N.R. 1983. A tree survival model with ap
plication to species of the Great Lakes region. Canad,ianJou,mal of Forest Research 13:601608.
EK A.R. &MONSERUD, R.A. 1979. Performance hnd comparison of stand growth models based
on individual tree and diameter class growth. CanadianJunnal of Fmest Research9:231-244GOWER, J.C. 1966. Some distance properties of latent roots and vector methods in multivariate
HAMILTON, D.A. 1980. Modelling mortality: a component of growth and yield modelling. pp.82 - 99 in Brown, KM. & Clarke, F.R. (Eds.) Fmecasting Fmest Stand, Dynamics. hoceed.iigsofWorhshop. June2+25,1980. School of Forestry, Lakehead University, Thunder Bay,Ontario.
HAMILTON, D.A. & EDWARDS, B.M. 1976. Modelling the probability of individual rree mor-tality. USDA Forest Smtice Research papn INT-LS5.
I{ANN,D.W. 1980. Development and evaluation of an even- and uneven-aged ponderosa kpine/Arizona fescue stand simulator.. USDA Fmest Snvice Research Papr INT-267. g5 pp.
JUST' T.E. 1991. Managementof tropical rainforests in north Qpeensland. pp. in -McKinnell,
F.H., Hopkins, B.R. & Fox,J.E.D. (Eds.) Fmest Management in Australia, hoceed,ings ofConfnence of Institute of Forestns of Australia. 1987. Surrey Beatty, Chipping Norton, NewSouth Wales.
LEECH'J.W., CORRELL, R. & MYINT, A.IC 1991. Use of Hotelling's TP and principal coor-dinate analysis to assist in aggregating species forvolume table consltructi on. Fmist Ecolagand Managemmt 40:279 - ZB8.
MELDAHL, R.S., ERII(SSON, M.& THOMAS, C.E. 1985. A method for grouping speciesforesttype combinations for the development of growth models for mixed spCciei stands. pp.422'428 in Shoulders, E. (Ed.) Proc. of the 3rd hiennial sor.tthrn. siluicultural research con-fnence. November 7 - 8, 1984. Atlanta, Georgia. USDA Fmest Smtice Gmnal Technical Reponso-54.
MITCHELL, KJ. 1969. Simulation of the growth of even-aged srands of white spruce. yateUniunsity School of Fmestry Bulletin No. 75.48 pp.
MONSERUD, R.A. 1976. Simulation of forest tree mortality. Fmest Science Z2(Z):42A444.NEWNHAM, R.M. 1964. The dnelopmcnt of a stand moful fm Dmgtas f,r. Ph.D. thesis. University of
British Columbia, Vancouver. 201 pp.PA]aNIE, C.D. (Ed.) 1986. The GLIM System. fulease 3.77 Manrzal Numerical Algorithms Group.
Oxford, U.K.PRESTON, R.A. & VANCLAYJ.K 1988. Calculation of timber yields from north Queensland rain
forests. Qteensland DEartmznt of Fmestry Technical paper No. 47. 16 pp.QDF. 1983. Rain forest research in north Queensland. Queenslan^d, Departnwnt of Fmestry position
Papn. 52 pp.
QDF. 1985. Research Report 1985. Queensl.and DEartment of Forestry. 100 pp.REINEKE, L.H. 1933. Perfectingastanddensityindexfor even-agedstands. J-oimalofAgricutturat
Rtsearch 46:627-638.SAA. 1983. Nomenclature of Australian Timbers. Australian Standard 2543-1983. Standards
Association of Australia. 62 pp.STOCKER, G.C. 1983. Aspectsof thedynamicsof rainforests innortheast Austraka. Ph.D. thesis.
University of New England. 400 pp.SWAINE' M.D. & WHITMORE, T.C. 1988. On the definition of ecological species groups
in tropical rain forests. VegetatioT5:81-86.VANCI-{Y J.K. lg89a. A growth model for north Queensland rain foresrs. Fmest Ecolog and,
Managem,ent 27 :245-27 l.VANCLAY, J.IC 1989b. Site productivity assessment in rain forests: an objective approach
using indicator species. Pp. 225-241 in Wan Razali Wan Mohd., Chan, H.T. & Appanah,S. (Eds.) Ctrowth and Yield in Tropical Mixed/Moist Fmests. hoc. Seminar. June 20-24, 1988.Kuala Lumpur, Malaysia. Forest Research Institute Malaysia.
VANCI-{Y J.K 1989c. A stand growth model for yield prediction in rain forests: design, imple-mentation and enhancements. Pp. 2l-34 in Wan Razali Mohd., Chan, H.T. & Appanah,S. (Eds.) C,rowth and' Yield in Tropicat Mixed/Moist Fmests. Proceed,ings Seminar. June 20-24,1988. Kuala Lumpur, Malaysia. Forest Research Institute Malaysia.
VANCI-AY J.IC 1990. Effects of selection logging on rainforest productivity. Australian Forestry53(3):20U2r4.
VANCI-AYJ.I( 1991. Aggregating tree species to develop diameter increment equations for tro-pical rain forests. Forest Ecolog and, Managemcnt 42: r4z - 16g.
3 l
Jm,m,al of TropicalForest Science 4(l): 15 - 36
VANCI-{Y J.IC & PRESTON, R.A. 1989. Sustainable timber harvesting in the rain forests
of northern Queensland. Pp. l8l-l9l in Fmest Planning fm Peoplz, hoceedings of 13th Bi-
mniol Confermce of tlu Institute of Foresters of Australia. September l8 - 22, 1989. Leura,
New South Wales.WAN RAZALI WAN MOHD. 1988. Modelling the mortality in mixed tropical forests of Peninsular
Malaysia. Pp. 9G105 in Wan Razali Wan Mohd., Chan, H.T. & Appanah, S. (Eds.) Ctrowth
and Yield in Tropical Mixed/Moist Fmests. hoc. Seminar. June 2U24, 1988. Kuala Lumpur,
Malaysia. Forest Research Institute Malaysia.YODA, IL, KIRA, T., OGAWA, H. & HOZUMI, I( 1963. Self thinning in overcrowded pure
stands under cultivated and natural conditions. Jutmal of Biolog of tlw Osaka City Uniansity14:107-129.
32
Jmmal of Tropical Fmest Scimce4( I ) : lS - 36
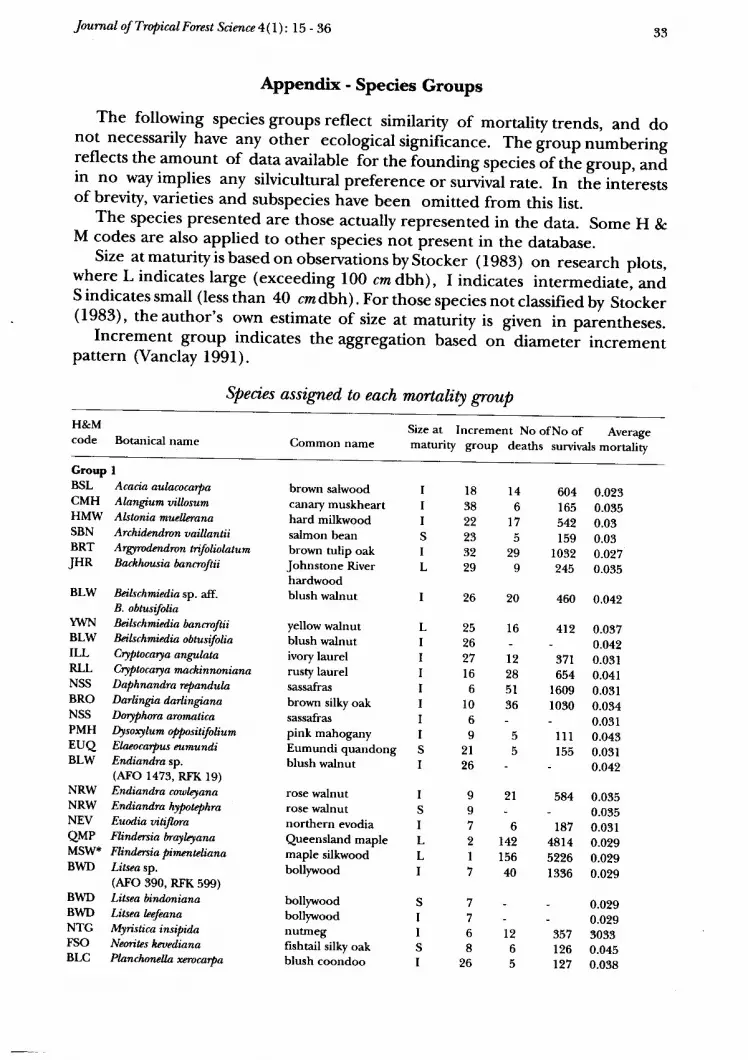
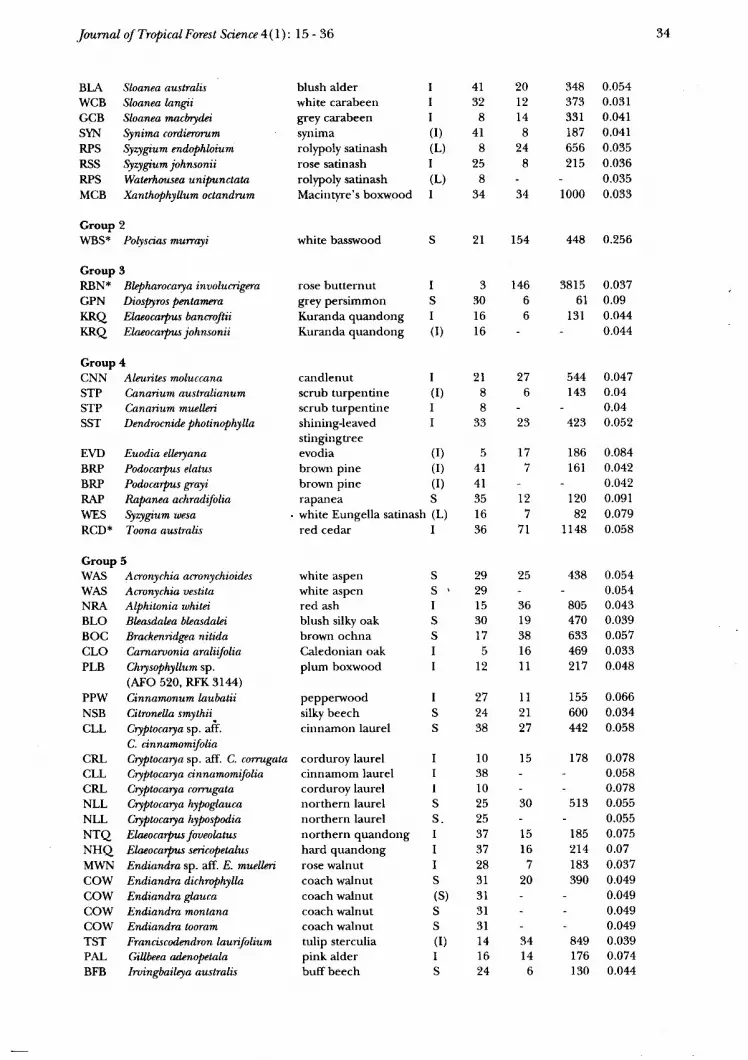
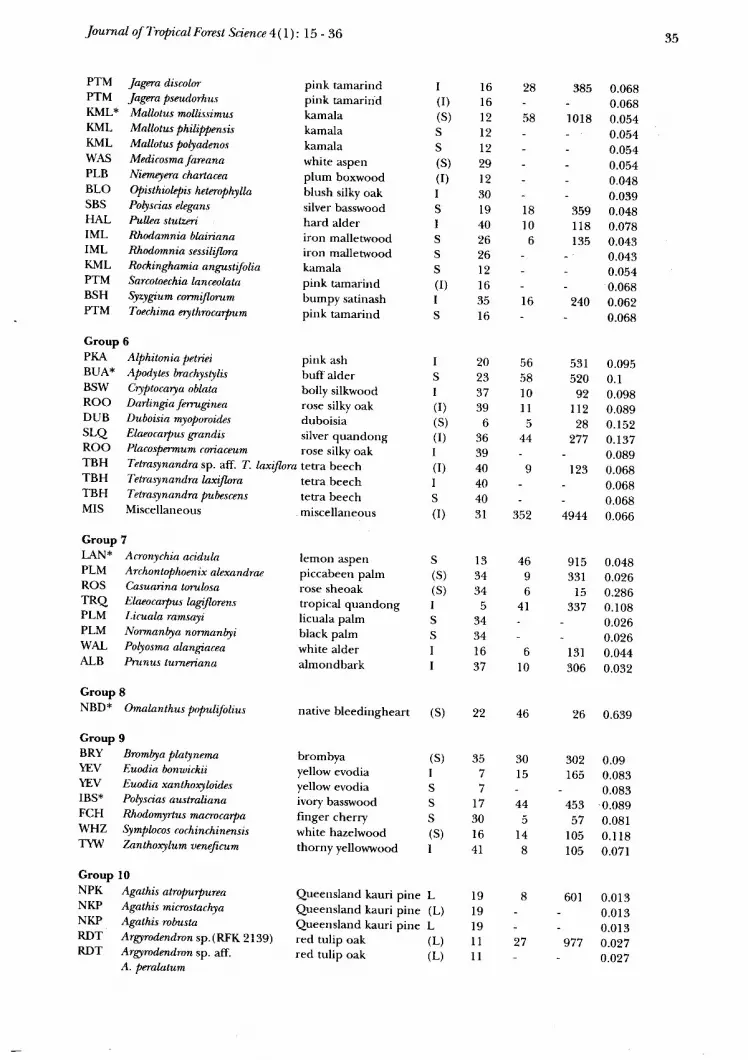
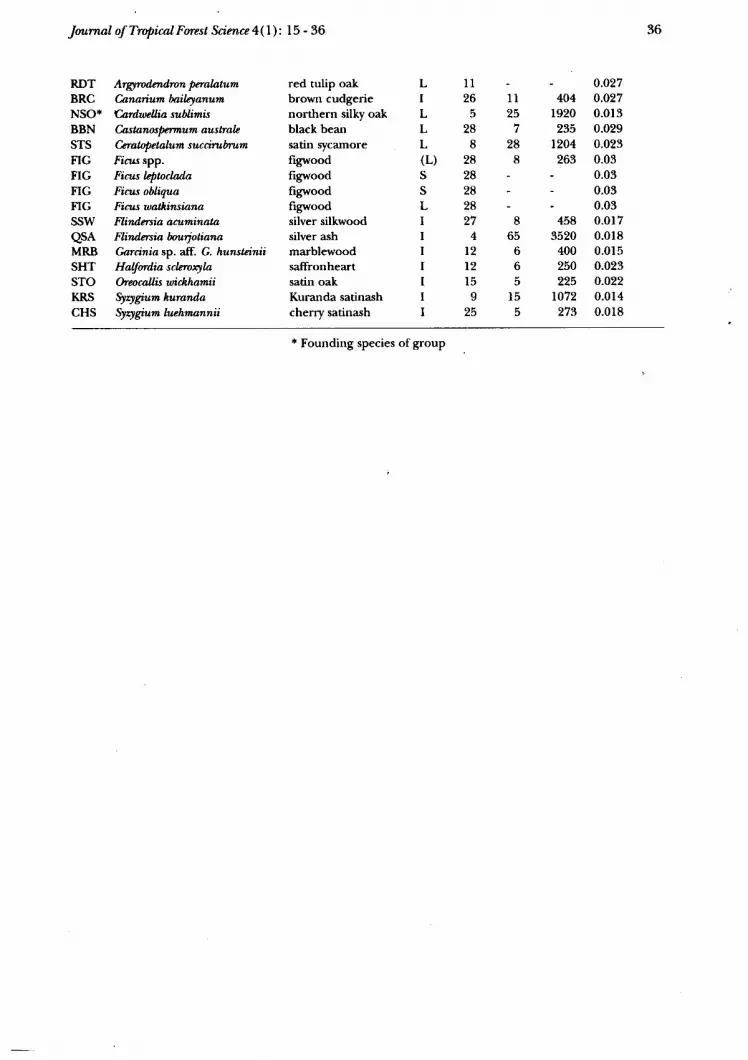
Appendix - Species Groups
The following species groups reflect similarity of mortality trends, and donot necessarily have any other ecological significance. The group numberingreflects the amount of data available for the iounding species "f tn. gro.rp, "r,Jin no way implies any silvicultural preference or survival rate. In the interestsof brevity, varieties and subspecies have been omitted from this list.
The species presented are those actually represented in the data. Some H &M codes are also applied to other species not present in the database.
Size atmaturityis based on observations byStocker (1983) on research plots,where L indicates large (exceeding 100 cm dbh), I indicates intermediate, andS indicates small (less than 40 cmdbh). For those species not classified by Stocker(1983), theauthor's own estimate of size at maturity is given in parentheses.
Increment group indicates the aggregation based on diametei ir,.r.-.ntpattern (Vanclay l99l).
Species assigned to each mortakty goup
33
H&Mcode Botanical narne Common name
Size at Increment No ofNo of Averagematurity group deaths survivals mortality