Journal of Geochemical Exploration xxx (2014) xxx–xxx
GEXPLO-05505; No of Pages 14
Contents lists available at ScienceDirect
Journal of Geochemical Exploration
j ourna l homepage: www.e lsev ie r .com/ locate / jgeoexp
Statistical analysis of soil geochemical data to identify pathfinders associated withmineral deposits: An example from the Coles Hill uranium deposit, Virginia, USA
Denise M. Levitan a,⁎, Carl E. Zipper b, Patricia Donovan b, Madeline E. Schreiber a, Robert R. Seal II c,Mark A. Engle c, John A. Chermak a, Robert J. Bodnar a, Daniel K. Johnson b, Joseph G. Aylor Jr. d
a Department of Geosciences, Virginia Tech, Blacksburg, VA 24061, United Statesb Department of Crop & Soil Environmental Sciences, Virginia Tech, Blacksburg, VA 24061, United Statesc U.S. Geological Survey, Reston, VA 20192, United Statesd Virginia Uranium, Inc., Chatham, VA 24531, United States
⁎ Corresponding author at: 4044 Derring Hall, BlacksbuBarr Engineering, Minneapolis, MN 55435, United States.
Please cite this article as: Levitan, D.M., et al.,An example from the Coles ..., J. Geochem. E
a b s t r a c t
a r t i c l e i n f o
Article history:Received 23 April 2014Revised 10 December 2014Accepted 20 December 2014Available online xxxx
Keywords:Soil geochemistryCompositional data analysisMultivariate analysisUranium
Soil geochemical anomalies can be used to identify pathfinders in exploration for ore deposits. In this study, com-positional data analysis is used with multivariate statistical methods to analyse soil geochemical data collectedfrom the Coles Hill uraniumdeposit, Virginia, USA, to identify pathfinders associatedwith this deposit. Elementalcompositions and relationships were compared between the collected Coles Hill soil and reference soil samplesextracted from a regional subset of a national-scale geochemical survey. Results show that pathfinders for theColes Hill deposit include light rare earth elements (La and Ce), which, when normalised by their Al content,are correlated with U/Al, and elevated Th/Al values, which are not correlated with U/Al, supporting decouplingof U from Th during soil generation. These results can be used in genetic and weathering models of the ColesHill deposit, and can also be applied to future prospecting for similar U deposits in the eastern United States,and in regions with similar geological/climatic conditions.
The soil andweatheredmaterials overlying ore deposits can serve asa component of geochemical exploration programmes to discover newdeposits (Grunsky, 2010). Studies that use soil geochemistry in explora-tion rely on anomalous concentrations and patterns of pathfinder ele-ments associated with the deposit type of interest (Bradshaw and Lett,1980). While the term “pathfinder” is generally used to describe con-centrations of one or more elements other than the economic one(s),here its usage is expanded to include ratios between elements, as arecommonly used in the analysis of compositional data. Pathfinders areidentified on the basis of the underlying geological, mineralogical, andgeochemical attributes of an ore deposit type. The pathfinders shouldhave a wider distribution in the immediate vicinity of the deposit thanthe elements of economic interest in order to define a target that canbe refinedwithmore expensive exploration techniques such as drilling.In some locations, the element of economic importance in the depositmay not be a good pathfinder in soil, because it may be mobile in theweathering environment and, therefore, not indicative of enrichmentin underlying unweathered rock. As such, Snelling (1984) suggestedthat U may be a poor element to use in exploration for U deposits,
rg, VA 24061; current address:
Statistical analysis of soil geocxplor. (2014), http://dx.doi.or
because it can be easily mobilised by near-surface oxidised water, lead-ing to low concentrations in soil and other weathering products.
Uranium deposits are among the most diverse types of mineral de-posit on Earth (Cuney, 2009). In fact, economic geologists classifythem into at least 15 geologically distinct genetic types and 40 subtypes(Fayek, 2013). Economic occurrences of U are found in sedimentary,metamorphic, and igneous rocks, as well as in rocks ranging in agefrom Archaean to Quaternary (Cuney, 2009; Dahlkamp, 1993; IAEA,2009). The wide range in geological environments and time periodsduring which U deposits have formed leads to a highly variable andoften diagnostic geochemical signature for the different U deposittypes. Geochemical anomalies are often associated with U depositsand have been documented in a variety of media, including alteredrock associated with mineralisation, sediment, soil, surface water, andground water. For example, Power et al. (2012) examined samples ofsoil and siliciclastic units overlying the Phoenix U deposit in the Atha-basca Basin, Canada, and found U, Mo, Co, Ag, and W anomalies inhumus, B-horizon soil, and uppermost sandstone units overlying orezones. In contrast, sedimentary U deposits, including sandstone-hosted (roll-front) U deposits of mostly Phanerozoic age, arecharacterised by anomalous V, Mo, Se, As, and locally Cu and Ag (Coxand Singer, 1986; Rose and Wright, 1980). Sandstone units overlyingunconformity-related U deposits, such as those that occur in the Atha-basca Basin of Canada, are associated with anomalous Ni, Co, As, andPb, with B and Cu also serving as pathfinders (Clark, 1987; Jefferson
hemical data to identify pathfinders associatedwithmineral deposits:g/10.1016/j.gexplo.2014.12.012
2 D.M. Levitan et al. / Journal of Geochemical Exploration xxx (2014) xxx–xxx
et al., 2007; Sopuck et al., 1983). As these examples show, U deposits arecharacterised by a widely variable suite of pathfinders, depending onthe geological environment of formation, among other factors. There-fore, the use of soil geochemistry to prospect for new U deposits, or torefine the location of a deposit discovered by other means, such as ra-diometric or geophysical surveying, requires that pathfinders specificto that deposit type be identified. Soil geochemistry largely reflectsthe underlying geology and climate in which weathering is takingplace; however, anthropogenic overprinting is also seen on a varietyof scales (Cohen et al., 2012).
Here, soil geochemical data, collected along transects over the unde-veloped Coles Hill U deposit, Virginia, USA, which have been treated bymultivariate statistical methods, are described. Study goals are to delin-eate anomalous distributions of elements in soil, and to identify ele-ments related to U at Coles Hill. These goals are achieved, whiledemonstrating the use of large-scale geochemical survey data in asite-specific study. It is expected that these data will prove to be valu-able, not only in exploration for similar types of deposits and for devel-opment of post-mining reclamation, but also contribute to developmentof a genetic model for the Coles Hill U deposit.
1.1 . The Coles Hill U deposit
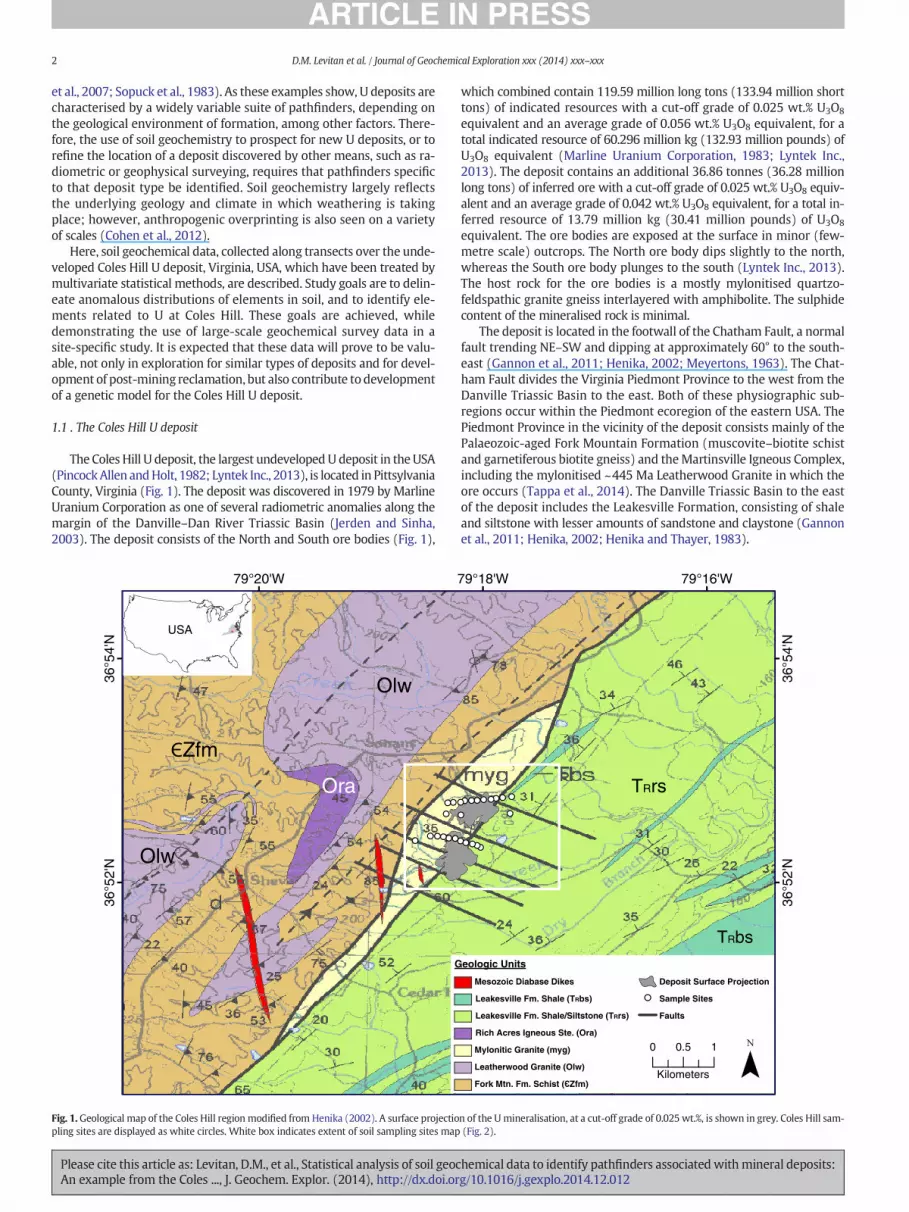
The Coles Hill U deposit, the largest undevelopedU deposit in the USA(PincockAllen andHolt, 1982; Lyntek Inc., 2013), is located in PittsylvaniaCounty, Virginia (Fig. 1). The deposit was discovered in 1979 by MarlineUranium Corporation as one of several radiometric anomalies along themargin of the Danville–Dan River Triassic Basin (Jerden and Sinha,2003). The deposit consists of the North and South ore bodies (Fig. 1),
USA
79°20'W
36°5
4'N
36°5
2'N
Olw
Olw
Ora
G
Fig. 1. Geological map of the Coles Hill region modified from Henika (2002). A surface projectiopling sites are displayed as white circles. White box indicates extent of soil sampling sites map
Please cite this article as: Levitan, D.M., et al., Statistical analysis of soil geocAn example from the Coles ..., J. Geochem. Explor. (2014), http://dx.doi.or
which combined contain 119.59 million long tons (133.94 million shorttons) of indicated resources with a cut-off grade of 0.025 wt.% U3O8
equivalent and an average grade of 0.056 wt.% U3O8 equivalent, for atotal indicated resource of 60.296 million kg (132.93 million pounds) ofU3O8 equivalent (Marline Uranium Corporation, 1983; Lyntek Inc.,2013). The deposit contains an additional 36.86 tonnes (36.28 millionlong tons) of inferred ore with a cut-off grade of 0.025 wt.% U3O8 equiv-alent and an average grade of 0.042 wt.% U3O8 equivalent, for a total in-ferred resource of 13.79 million kg (30.41 million pounds) of U3O8
equivalent. The ore bodies are exposed at the surface in minor (few-metre scale) outcrops. The North ore body dips slightly to the north,whereas the South ore body plunges to the south (Lyntek Inc., 2013).The host rock for the ore bodies is a mostly mylonitised quartzo-feldspathic granite gneiss interlayered with amphibolite. The sulphidecontent of the mineralised rock is minimal.
The deposit is located in the footwall of the Chatham Fault, a normalfault trending NE–SW and dipping at approximately 60° to the south-east (Gannon et al., 2011; Henika, 2002; Meyertons, 1963). The Chat-ham Fault divides the Virginia Piedmont Province to the west from theDanville Triassic Basin to the east. Both of these physiographic sub-regions occur within the Piedmont ecoregion of the eastern USA. ThePiedmont Province in the vicinity of the deposit consists mainly of thePalaeozoic-aged Fork Mountain Formation (muscovite–biotite schistand garnetiferous biotite gneiss) and theMartinsville Igneous Complex,including the mylonitised ~445 Ma Leatherwood Granite in which theore occurs (Tappa et al., 2014). The Danville Triassic Basin to the eastof the deposit includes the Leakesville Formation, consisting of shaleand siltstone with lesser amounts of sandstone and claystone (Gannonet al., 2011; Henika, 2002; Henika and Thayer, 1983).
79°16'W79°18'W
36°5
4'N
36°5
2'N
TRbs
TRrs
eologic Units
Leakesville Fm. Shale (TRbs)
Mylonitic Granite (myg)
Rich Acres Igneous Ste. (Ora)
Leatherwood Granite (Olw)
Leakesville Fm. Shale/Siltstone (TRrs)
Mesozoic Diabase Dikes Deposit Surface Projection
Faults
Sample Sites
0 0.5 1
Kilometers
n of the Umineralisation, at a cut-off grade of 0.025 wt.%, is shown in grey. Coles Hill sam-(Fig. 2).
hemical data to identify pathfinders associatedwithmineral deposits:g/10.1016/j.gexplo.2014.12.012
3D.M. Levitan et al. / Journal of Geochemical Exploration xxx (2014) xxx–xxx
The Coles Hill deposit exhibits characteristics of several different Udeposit types. It is an epigenetic deposit in which U ore is in the formof pitchblende, uraninite, coffinite and U-bearing apatite that occur inveins within a deformed meta-igneous host rock. Recent age dating(Tappa et al., 2014) indicates thatmineralised orthogneiss and amphib-olite are 419 ± 19 and 426 ± 21 Ma, respectively, and because themineralisation is epigenetic, it could have formed at any time after for-mation of the host rocks, including during a late hydrothermal stage ofthe magmatic event that formed the host rocks. Altered/mineralisedrocks at Coles Hill are enriched in Na2O and depleted in SiO2 relativeto unaltered or unmineralised rocks. Altered/mineralised rocks alsoshow a higher Na2O/K2O ratio as well as a decrease in SiO2, TiO2, SiO2,total Fe as Fe2O3, FeO, K2O and MgO, and an increase in Al2O3, Fe2O3,CaO, Na2O, P2O5, U3O8, CO2 (representing carbonate+ reduced carbon)and S (MarlineUraniumCorporation, 1983). To date, a confirmed genet-ic model for Coles Hill has yet to emerge, though some details of themineralisation and alteration history of the deposit are given in Jerden(2001). Dahlkamp (1993) included the Coles Hill deposit among theVein-Type deposits, and a more recent summary by Dahlkamp (2010)states that “the Coles Hill/Swanson deposit is primarily controlled bystructure and may be attributed to vein-type uranium deposits.” Morerecently, Aylor et al. (2014) suggested two possible sources for the U.One model invokes remobilisation of U from the Triassic basin bywestward-flowing meteoric water that intersected the Chatham Faultat depth andmigrated upward and laterally into the LeatherwoodGran-ite. A secondU sourcemodel involvesUmineralisation byhydrothermalfluids associated with emplacement and cooling of the LeatherwoodGranite. These fluids would have migrated upwards into a structural
N8
A3 A2
S9 S8S7 S6
S5S4 S3
S2S1
N9N7 N6 N5 N4
S11
S10
N11 N10
Mill Creek
0 0.2 0.4
Kilometers
North Ore Body
South Ore Body
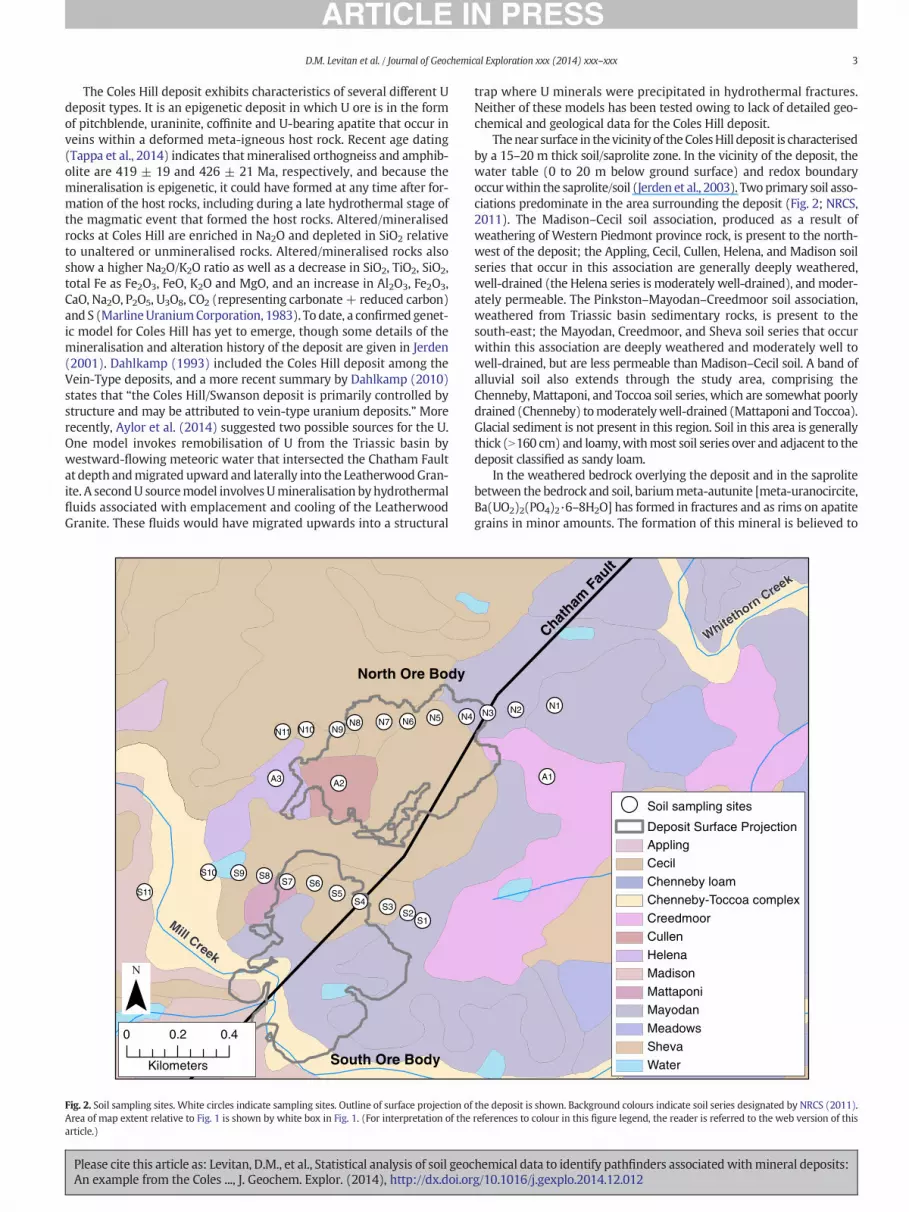
Fig. 2. Soil sampling sites. White circles indicate sampling sites. Outline of surface projection ofArea of map extent relative to Fig. 1 is shown by white box in Fig. 1. (For interpretation of thearticle.)
Please cite this article as: Levitan, D.M., et al., Statistical analysis of soil geocAn example from the Coles ..., J. Geochem. Explor. (2014), http://dx.doi.or
trap where U minerals were precipitated in hydrothermal fractures.Neither of these models has been tested owing to lack of detailed geo-chemical and geological data for the Coles Hill deposit.
Thenear surface in the vicinity of the ColesHill deposit is characterisedby a 15–20 m thick soil/saprolite zone. In the vicinity of the deposit, thewater table (0 to 20 m below ground surface) and redox boundaryoccurwithin the saprolite/soil (Jerden et al., 2003). Twoprimary soil asso-ciations predominate in the area surrounding the deposit (Fig. 2; NRCS,2011). The Madison–Cecil soil association, produced as a result ofweathering of Western Piedmont province rock, is present to the north-west of the deposit; the Appling, Cecil, Cullen, Helena, and Madison soilseries that occur in this association are generally deeply weathered,well-drained (the Helena series is moderately well-drained), andmoder-ately permeable. The Pinkston–Mayodan–Creedmoor soil association,weathered from Triassic basin sedimentary rocks, is present to thesouth-east; the Mayodan, Creedmoor, and Sheva soil series that occurwithin this association are deeply weathered and moderately well towell-drained, but are less permeable than Madison–Cecil soil. A band ofalluvial soil also extends through the study area, comprising theChenneby, Mattaponi, and Toccoa soil series, which are somewhat poorlydrained (Chenneby) tomoderatelywell-drained (Mattaponi and Toccoa).Glacial sediment is not present in this region. Soil in this area is generallythick (N160 cm) and loamy,withmost soil series over and adjacent to thedeposit classified as sandy loam.
In the weathered bedrock overlying the deposit and in the saprolitebetween the bedrock and soil, bariummeta-autunite [meta-uranocircite,Ba(UO2)2(PO4)2·6–8H2O] has formed in fractures and as rims on apatitegrains in minor amounts. The formation of this mineral is believed to
A1
N3 N2 N1
Whitethorn
Creek
Mill Creek
Soil sampling sites
Deposit Surface ProjectionAppling
Cecil
Chenneby loam
Chenneby-Toccoa complex
Creedmoor
Cullen
Helena
Madison
Mattaponi
Mayodan
Meadows
Sheva
Water
Chatham
Fault
the deposit is shown. Background colours indicate soil series designated by NRCS (2011).references to colour in this figure legend, the reader is referred to the web version of this
hemical data to identify pathfinders associatedwithmineral deposits:g/10.1016/j.gexplo.2014.12.012
4 D.M. Levitan et al. / Journal of Geochemical Exploration xxx (2014) xxx–xxx
immobilise the oxidised U, resulting in ground water U concentrationslower than expected (13.9 μg/l and less) in proximity to the deposit(Jerden and Sinha, 2003; Jerden et al., 2003). Uranium concentrationsin surfacewater draining the site are also low, ranging frombelowdetec-tion (0.1 μg/l) to a maximum of 0.34 μg/l in ephemeral streams drainingthe area of the North ore body (Levitan et al., 2014). Other secondaryminerals in the saturated saprolite include kaolinite and Mn oxides(Jerden et al., 2003). In the unsaturated saprolite and in the soil overlyingthe deposit, U is associated with Fe oxy-hydroxides (mainly throughsorption), found in the structure of Al-phosphates of the crandallitegroup (Jerden and Sinha, 2006), and incorporated in light rare-earth ele-ment (LREE)-bearing phosphates, such as rhabdophane (Jerden, 2001).Other secondary minerals in the unsaturated zone overlying the depositinclude vermiculite, montmorillonite, and gibbsite.
The deposit is located in a temperate humid climate. Average annualtemperature is 13 °C (55 °F) with a minimum in January (average low−5 °C or 23 °F) and a maximum in July (average high 31 °C or 87 °F).Annual rainfall is approximately 1150 mm (45 in.) and is distributedfairly evenly throughout the year (NCDC, 2012). Historical land use inthe area was for tobacco and cotton farming, and cattle grazing is cur-rently the predominant use of land (Aaron, 2009). During historicalcrop cultivation, various amendments were applied to the land surface,including fertilisers and lead arsenate pesticides.
2 . Methods
2.1 . Site selection
Twenty-five soil sampling sites (Fig. 2) were selected along east–west transects, which were based on locations of electrical resistivityprofiles conducted by Gannon et al. (2011). Two transects each com-prised of eleven sites were sampled across each ore body, with a sam-pling distance lag of ~100 m. Samples from an additional three sitesbetween the two transects were selected to encompass soil types notfound along the transects. Whereas nearly three-quarters of the soilsampling sites are underlain bymylonitised granite, six different soil se-ries are recognised (Fig. 2). At each sampling site, soil sampleswere col-lected from both the A- and C-horizons, yielding a total of 50 samplesfor analysis.
2.2 . Sample collection and analysis
Procedures for collection and analysis of soil samples followedU.S. Geological Survey (USGS) methods for determining trace-metal content (Smith et al., 2005). Soil samples were collectedusing hand-driven steel augers to a depth of 160 cm or auger refusal.Extracted soil was laid on plastic sheeting, and horizons were identi-fied by changes in soil colour, texture, and structure. In the event thata C-horizon was not identified in the top 160 cm of soil, the bottom25 cm of the collected soil (generally B-horizon) was sampled. To re-duce cross contamination between holes, augers were brushed cleanafter each sample, and a shallow test hole was augered at each siteprior to primary sampling, with the resulting soil discarded. Afterthe A- and C-horizons were identified, subsamples of soil were col-lected from each horizon, bagged, and labelled on site. In the labora-tory, subsamples were air-dried, then sieved to less than 2 mm usinga stainless steel sieve under laboratory hoods. Samples were storedin low-density polyethylene bags.
Major and trace element and carbon analyses were carried out bySGS Laboratories in Toronto, Canada. Forty-two major and trace ele-ments were measured using inductively-coupled plasma mass spec-trometry (ICP-MS) and inductively-coupled plasma atomic emissionspectroscopy (ICP-AES) following a multi-acid (HCl–HNO3–HClO4–HF)digestion. Carbon was measured by a carbon analyser. Radionuclideswere analysed by Pace Analytical Services in Greensburg, PA. Methodsinclude gamma spectroscopy (EPA Method 901.1 for Ra-226 and -228;
Please cite this article as: Levitan, D.M., et al., Statistical analysis of soil geocAn example from the Coles ..., J. Geochem. Explor. (2014), http://dx.doi.or
US EPA, 2009), extraction chromatography (RP280m DOE method forPb-210), and alpha spectrometry (HSL-300 m for Th and U species).Quality assurance/quality control (QA/QC) samples consisted of fieldduplicates (samples collected from adjacent auger holes), and lab repli-cates (samples divided following drying and sieving), as well as labora-tory internal QA/QC including standard samples.
A 20% relative difference threshold was used between duplicatesamples for elements for which the analytical precision allowed for rel-ative differences of 20% or less (i.e., if a primary sample measures 0.02and the duplicate 0.03, these measurements were not included in theQA/QC analysis). Overall, fewer than 10% of elements in five of six dupli-cate sets failed to meet the threshold and, therefore, the data set wasconsidered of acceptable quality. A comparison of field and lab dupli-cates suggested that variability was attributable to both field and labo-ratory procedures.
Mineralogywas determined by X-raydiffraction (XRD). Back-loadedpowder mounts were run using CuKα radiation over a range of 3 to80°2θ at 0.035°2θ/s. Minerals were identified using PANalytical X'PertHighScore Plus v.3.0 software loaded with patterns from the Interna-tional Centre for Diffraction Data (ICDD) PDF-2.
2.3 . Selection of reference soil data
In 2013, the USGS released data for a national soil geochemical andmineralogical survey designed to document the abundance and spatialdistribution of elements and minerals in the soil of the conterminousUnited States (Smith et al., 2013). National soil survey sampling siteswere selected using a spatially randomised design intended to repre-sent 1600 km2 areas (Smith et al., 2013). Analyses of data from pilottransects of North America (Smith et al., 2005) have been the subjectof a number of studies, many of which are included in a special issueof Applied Geochemistry (Vol. 24, Issue 8, 2009; Smith, 2009), as USGSreports (Smith et al., 2005), and in other publications (Drew et al.,2010).
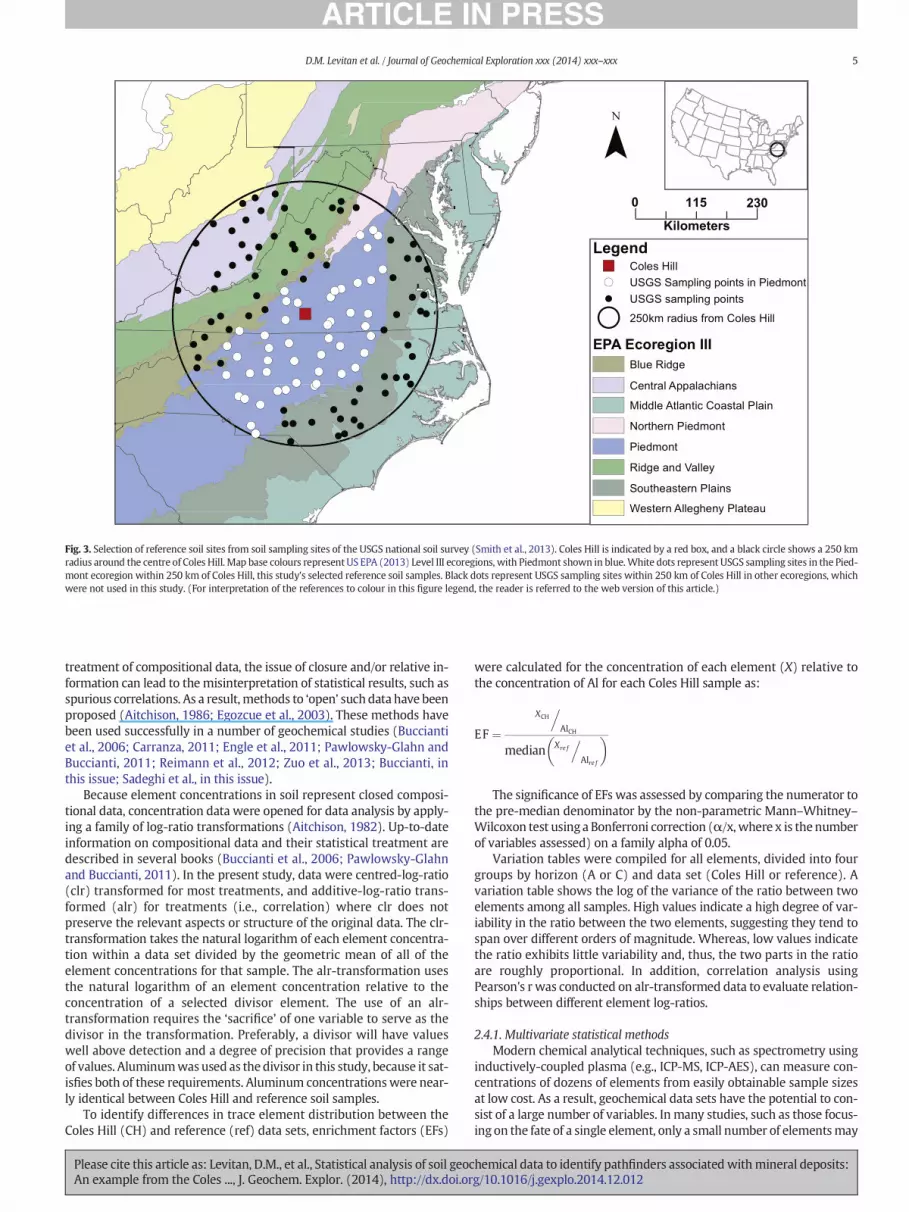
The publicly available data from the USGS national soil survey werehere used as a reference for determining anomalous elemental concen-trations in soil from the Coles Hill U deposit area. Soil in the presentstudy was collected and analysed using procedures identical to thoseof the national soil survey, sampling for which was completed a yearprior to the present study. National soil survey samples (A- and C-horizons) collected at locations within 250 km of Coles Hill and withinthe Piedmont EPA Level III ecoregion (US EPA, 2013) were selected asthe reference data set (n = 48; Fig. 3) in order to have similar climate,slope, and bedrock type to the Coles Hill samples, though the variationsin these aspects for the reference samples are likely to be of greatermagnitude than in the Coles Hill sample sites.
2.4 . Statistical treatment
Separate statistical treatments were conducted for soil samples fromthe A- and C-horizons. These statistical analyses were done using R (RDevelopment Core Team, 2011) and CoDaPack 2.0 (Comas-Cufí andThió-Henestrosa, 2011), in many cases using code modified fromReimann et al. (2008). Soil samples were classified based on horizonand origin (Coles Hill or reference). All elements present in both datasets, andwith N50% of observations recordedwith concentrations greaterthan detection limits, and organic carbon (Corg), were treated. Thirty-sixelements and Corg were considered. Non-detect observations were re-placed using a classical parametric approach based on isometric log-ratio transformation (Martín-Fernández et al., 2012; Palarea-Albaladejoet al., 2014; Templ et al., 2014).
In the statistical treatment of geochemical concentration data, theproblem of closure and/or relative information arises (Aitchison, 1986;Pawlowsky-Glahn and Egozcue, 2006). Closed data are observationsthat are expressed as parts of a whole (e.g., mg/kg) and often sum upto a constant constraining value (e.g., 106 mg/kg). In the statistical
hemical data to identify pathfinders associatedwithmineral deposits:g/10.1016/j.gexplo.2014.12.012
Fig. 3. Selection of reference soil sites from soil sampling sites of the USGS national soil survey (Smith et al., 2013). Coles Hill is indicated by a red box, and a black circle shows a 250 kmradius around the centre of Coles Hill. Map base colours represent US EPA (2013) Level III ecoregions, with Piedmont shown in blue.White dots represent USGS sampling sites in the Pied-mont ecoregion within 250 km of Coles Hill, this study's selected reference soil samples. Black dots represent USGS sampling sites within 250 km of Coles Hill in other ecoregions, whichwere not used in this study. (For interpretation of the references to colour in this figure legend, the reader is referred to the web version of this article.)
5D.M. Levitan et al. / Journal of Geochemical Exploration xxx (2014) xxx–xxx
treatment of compositional data, the issue of closure and/or relative in-formation can lead to the misinterpretation of statistical results, such asspurious correlations. As a result, methods to ‘open’ such data have beenproposed (Aitchison, 1986; Egozcue et al., 2003). These methods havebeen used successfully in a number of geochemical studies (Bucciantiet al., 2006; Carranza, 2011; Engle et al., 2011; Pawlowsky-Glahn andBuccianti, 2011; Reimann et al., 2012; Zuo et al., 2013; Buccianti, inthis issue; Sadeghi et al., in this issue).
Because element concentrations in soil represent closed composi-tional data, concentration data were opened for data analysis by apply-ing a family of log-ratio transformations (Aitchison, 1982). Up-to-dateinformation on compositional data and their statistical treatment aredescribed in several books (Buccianti et al., 2006; Pawlowsky-Glahnand Buccianti, 2011). In the present study, data were centred-log-ratio(clr) transformed for most treatments, and additive-log-ratio trans-formed (alr) for treatments (i.e., correlation) where clr does notpreserve the relevant aspects or structure of the original data. The clr-transformation takes the natural logarithm of each element concentra-tion within a data set divided by the geometric mean of all of theelement concentrations for that sample. The alr-transformation usesthe natural logarithm of an element concentration relative to theconcentration of a selected divisor element. The use of an alr-transformation requires the ‘sacrifice’ of one variable to serve as thedivisor in the transformation. Preferably, a divisor will have valueswell above detection and a degree of precision that provides a rangeof values. Aluminumwasused as the divisor in this study, because it sat-isfies both of these requirements. Aluminum concentrationswere near-ly identical between Coles Hill and reference soil samples.
To identify differences in trace element distribution between theColes Hill (CH) and reference (ref) data sets, enrichment factors (EFs)
Please cite this article as: Levitan, D.M., et al., Statistical analysis of soil geocAn example from the Coles ..., J. Geochem. Explor. (2014), http://dx.doi.or
were calculated for the concentration of each element (X) relative tothe concentration of Al for each Coles Hill sample as:
EF ¼XCH
.AlCH
median Xre f.
Alre f
� �
The significance of EFs was assessed by comparing the numerator tothe pre-median denominator by the non-parametric Mann–Whitney–Wilcoxon test using a Bonferroni correction (α/x, where x is thenumberof variables assessed) on a family alpha of 0.05.
Variation tables were compiled for all elements, divided into fourgroups by horizon (A or C) and data set (Coles Hill or reference). Avariation table shows the log of the variance of the ratio between twoelements among all samples. High values indicate a high degree of var-iability in the ratio between the two elements, suggesting they tend tospan over different orders of magnitude. Whereas, low values indicatethe ratio exhibits little variability and, thus, the two parts in the ratioare roughly proportional. In addition, correlation analysis usingPearson's r was conducted on alr-transformed data to evaluate relation-ships between different element log-ratios.
2.4.1. Multivariate statistical methodsModern chemical analytical techniques, such as spectrometry using
inductively-coupled plasma (e.g., ICP-MS, ICP-AES), can measure con-centrations of dozens of elements from easily obtainable sample sizesat low cost. As a result, geochemical data sets have the potential to con-sist of a large number of variables. In many studies, such as those focus-ing on the fate of a single element, only a small number of elementsmay
hemical data to identify pathfinders associatedwithmineral deposits:g/10.1016/j.gexplo.2014.12.012
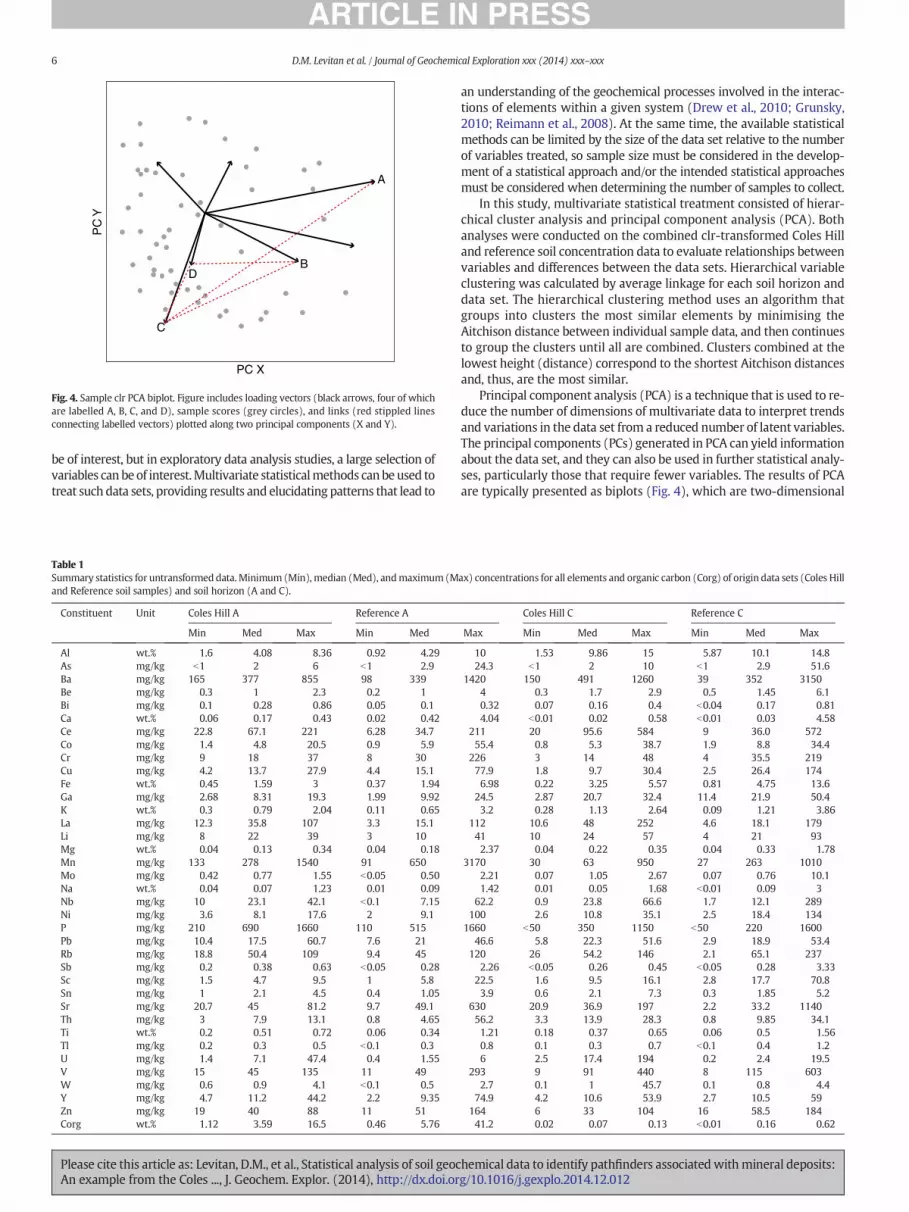
Fig. 4. Sample clr PCA biplot. Figure includes loading vectors (black arrows, four of whichare labelled A, B, C, and D), sample scores (grey circles), and links (red stippled linesconnecting labelled vectors) plotted along two principal components (X and Y).
6 D.M. Levitan et al. / Journal of Geochemical Exploration xxx (2014) xxx–xxx
be of interest, but in exploratory data analysis studies, a large selection ofvariables can be of interest.Multivariate statisticalmethods canbeused totreat such data sets, providing results and elucidating patterns that lead to
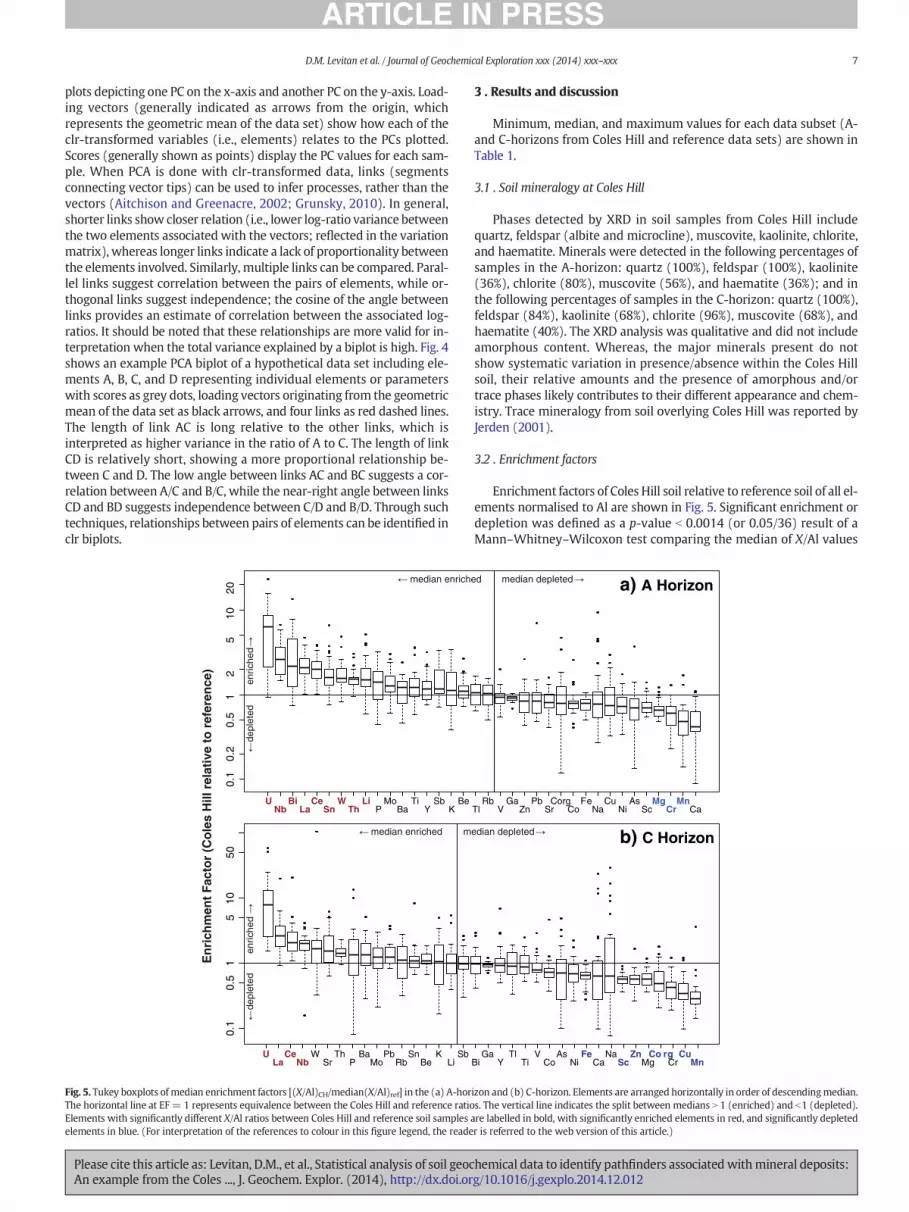
Table 1Summary statistics for untransformed data.Minimum (Min), median (Med), andmaximum(Mand Reference soil samples) and soil horizon (A and C).
Please cite this article as: Levitan, D.M., et al., Statistical analysis of soil geocAn example from the Coles ..., J. Geochem. Explor. (2014), http://dx.doi.or
an understanding of the geochemical processes involved in the interac-tions of elements within a given system (Drew et al., 2010; Grunsky,2010; Reimann et al., 2008). At the same time, the available statisticalmethods can be limited by the size of the data set relative to the numberof variables treated, so sample size must be considered in the develop-ment of a statistical approach and/or the intended statistical approachesmust be considered when determining the number of samples to collect.
In this study, multivariate statistical treatment consisted of hierar-chical cluster analysis and principal component analysis (PCA). Bothanalyses were conducted on the combined clr-transformed Coles Hilland reference soil concentration data to evaluate relationships betweenvariables and differences between the data sets. Hierarchical variableclustering was calculated by average linkage for each soil horizon anddata set. The hierarchical clustering method uses an algorithm thatgroups into clusters the most similar elements by minimising theAitchison distance between individual sample data, and then continuesto group the clusters until all are combined. Clusters combined at thelowest height (distance) correspond to the shortest Aitchison distancesand, thus, are the most similar.
Principal component analysis (PCA) is a technique that is used to re-duce the number of dimensions of multivariate data to interpret trendsand variations in the data set from a reduced number of latent variables.The principal components (PCs) generated in PCA can yield informationabout the data set, and they can also be used in further statistical analy-ses, particularly those that require fewer variables. The results of PCAare typically presented as biplots (Fig. 4), which are two-dimensional
ax) concentrations for all elements and organic carbon (Corg) of origin data sets (Coles Hill
7D.M. Levitan et al. / Journal of Geochemical Exploration xxx (2014) xxx–xxx
plots depicting one PC on the x-axis and another PC on the y-axis. Load-ing vectors (generally indicated as arrows from the origin, whichrepresents the geometric mean of the data set) show how each of theclr-transformed variables (i.e., elements) relates to the PCs plotted.Scores (generally shown as points) display the PC values for each sam-ple. When PCA is done with clr-transformed data, links (segmentsconnecting vector tips) can be used to infer processes, rather than thevectors (Aitchison and Greenacre, 2002; Grunsky, 2010). In general,shorter links show closer relation (i.e., lower log-ratio variance betweenthe two elements associated with the vectors; reflected in the variationmatrix), whereas longer links indicate a lack of proportionality betweenthe elements involved. Similarly, multiple links can be compared. Paral-lel links suggest correlation between the pairs of elements, while or-thogonal links suggest independence; the cosine of the angle betweenlinks provides an estimate of correlation between the associated log-ratios. It should be noted that these relationships are more valid for in-terpretation when the total variance explained by a biplot is high. Fig. 4shows an example PCA biplot of a hypothetical data set including ele-ments A, B, C, and D representing individual elements or parameterswith scores as grey dots, loading vectors originating from the geometricmean of the data set as black arrows, and four links as red dashed lines.The length of link AC is long relative to the other links, which isinterpreted as higher variance in the ratio of A to C. The length of linkCD is relatively short, showing a more proportional relationship be-tween C and D. The low angle between links AC and BC suggests a cor-relation between A/C and B/C, while the near-right angle between linksCD and BD suggests independence between C/D and B/D. Through suchtechniques, relationships between pairs of elements can be identified inclr biplots.
En
rich
men
t Fa
cto
r (C
ole
s H
ill r
elat
ive
to r
efer
ence
)
0.1
0.5
15
1050
ULa
CeNb
WSr
ThP
BaMo
PbRb
SnBe
KLi
Sb
m median enriched
dep
lete
den
riche
d
0.1
0.2
0.5
12
510
20
UNb
BiLa
CeSn
WTh
LiP
MoBa
TiY
SbK
Be
median enrich
dep
lete
den
riche
d
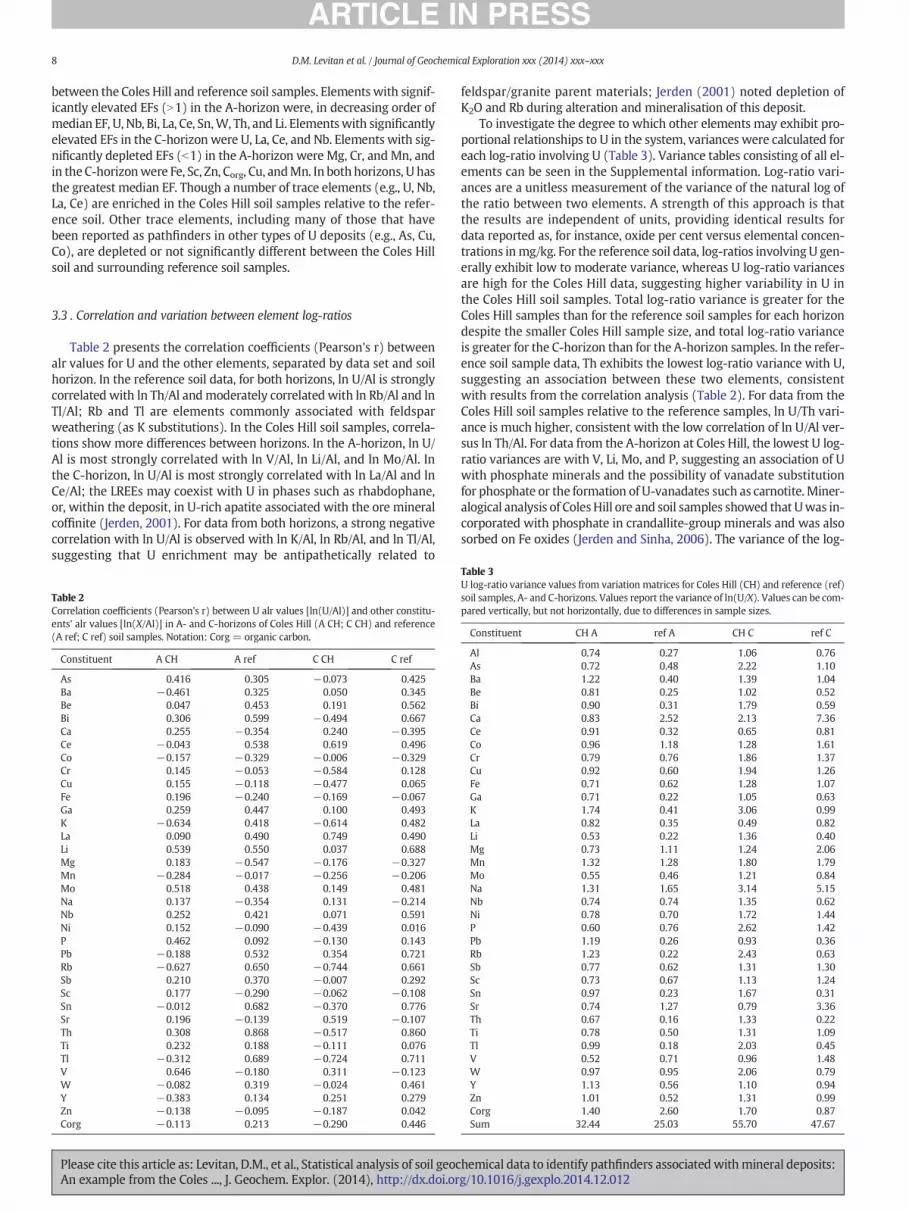
Fig. 5. Tukey boxplots of median enrichment factors [(X/Al)CH/median(X/Al)ref] in the (a) A-horThe horizontal line at EF = 1 represents equivalence between the Coles Hill and reference ratioElements with significantly different X/Al ratios between Coles Hill and reference soil samples aelements in blue. (For interpretation of the references to colour in this figure legend, the reade
Please cite this article as: Levitan, D.M., et al., Statistical analysis of soil geocAn example from the Coles ..., J. Geochem. Explor. (2014), http://dx.doi.or
3 . Results and discussion
Minimum, median, and maximum values for each data subset (A-and C-horizons from Coles Hill and reference data sets) are shown inTable 1.
3.1 . Soil mineralogy at Coles Hill
Phases detected by XRD in soil samples from Coles Hill includequartz, feldspar (albite and microcline), muscovite, kaolinite, chlorite,and haematite. Minerals were detected in the following percentages ofsamples in the A-horizon: quartz (100%), feldspar (100%), kaolinite(36%), chlorite (80%), muscovite (56%), and haematite (36%); and inthe following percentages of samples in the C-horizon: quartz (100%),feldspar (84%), kaolinite (68%), chlorite (96%), muscovite (68%), andhaematite (40%). The XRD analysis was qualitative and did not includeamorphous content. Whereas, the major minerals present do notshow systematic variation in presence/absence within the Coles Hillsoil, their relative amounts and the presence of amorphous and/ortrace phases likely contributes to their different appearance and chem-istry. Trace mineralogy from soil overlying Coles Hill was reported byJerden (2001).
3.2 . Enrichment factors
Enrichment factors of Coles Hill soil relative to reference soil of all el-ements normalised to Al are shown in Fig. 5. Significant enrichment ordepletion was defined as a p-value b 0.0014 (or 0.05/36) result of aMann–Whitney–Wilcoxon test comparing the median of X/Al values
BiGa
YTl
TiV
CoAs
NiFe
CaNa
ScZn
MgCo rg
CrCu
Mn
edian depleted b) C Horizon
a) A Horizon
TlRb
VGa
ZnPb
SrCorg
CoFe
NaCu
NiAs
ScMg
CrMn
Ca
median depleted ed
izon and (b) C-horizon. Elements are arranged horizontally in order of descendingmedian.s. The vertical line indicates the split between medians N 1 (enriched) and b1 (depleted).re labelled in bold, with significantly enriched elements in red, and significantly depletedr is referred to the web version of this article.)
hemical data to identify pathfinders associatedwithmineral deposits:g/10.1016/j.gexplo.2014.12.012
8 D.M. Levitan et al. / Journal of Geochemical Exploration xxx (2014) xxx–xxx
between the Coles Hill and reference soil samples. Elementswith signif-icantly elevated EFs (N1) in the A-horizon were, in decreasing order ofmedian EF, U, Nb, Bi, La, Ce, Sn,W, Th, and Li. Elementswith significantlyelevated EFs in the C-horizon were U, La, Ce, and Nb. Elements with sig-nificantly depleted EFs (b1) in the A-horizon were Mg, Cr, and Mn, andin the C-horizonwere Fe, Sc, Zn, Corg, Cu, andMn. In both horizons, U hasthe greatest median EF. Though a number of trace elements (e.g., U, Nb,La, Ce) are enriched in the Coles Hill soil samples relative to the refer-ence soil. Other trace elements, including many of those that havebeen reported as pathfinders in other types of U deposits (e.g., As, Cu,Co), are depleted or not significantly different between the Coles Hillsoil and surrounding reference soil samples.
3.3 . Correlation and variation between element log-ratios
Table 2 presents the correlation coefficients (Pearson's r) betweenalr values for U and the other elements, separated by data set and soilhorizon. In the reference soil data, for both horizons, ln U/Al is stronglycorrelated with ln Th/Al andmoderately correlated with ln Rb/Al and lnTl/Al; Rb and Tl are elements commonly associated with feldsparweathering (as K substitutions). In the Coles Hill soil samples, correla-tions show more differences between horizons. In the A-horizon, ln U/Al is most strongly correlated with ln V/Al, ln Li/Al, and ln Mo/Al. Inthe C-horizon, ln U/Al is most strongly correlated with ln La/Al and lnCe/Al; the LREEs may coexist with U in phases such as rhabdophane,or, within the deposit, in U-rich apatite associated with the ore mineralcoffinite (Jerden, 2001). For data from both horizons, a strong negativecorrelation with ln U/Al is observed with ln K/Al, ln Rb/Al, and ln Tl/Al,suggesting that U enrichment may be antipathetically related to
Table 2Correlation coefficients (Pearson's r) between U alr values [ln(U/Al)] and other constitu-ents' alr values [ln(X/Al)] in A- and C-horizons of Coles Hill (A CH; C CH) and reference(A ref; C ref) soil samples. Notation: Corg = organic carbon.
Please cite this article as: Levitan, D.M., et al., Statistical analysis of soil geocAn example from the Coles ..., J. Geochem. Explor. (2014), http://dx.doi.or
feldspar/granite parent materials; Jerden (2001) noted depletion ofK2O and Rb during alteration and mineralisation of this deposit.
To investigate the degree to which other elements may exhibit pro-portional relationships to U in the system, variances were calculated foreach log-ratio involving U (Table 3). Variance tables consisting of all el-ements can be seen in the Supplemental information. Log-ratio vari-ances are a unitless measurement of the variance of the natural log ofthe ratio between two elements. A strength of this approach is thatthe results are independent of units, providing identical results fordata reported as, for instance, oxide per cent versus elemental concen-trations inmg/kg. For the reference soil data, log-ratios involving U gen-erally exhibit low to moderate variance, whereas U log-ratio variancesare high for the Coles Hill data, suggesting higher variability in U inthe Coles Hill soil samples. Total log-ratio variance is greater for theColes Hill samples than for the reference soil samples for each horizondespite the smaller Coles Hill sample size, and total log-ratio varianceis greater for the C-horizon than for the A-horizon samples. In the refer-ence soil sample data, Th exhibits the lowest log-ratio variance with U,suggesting an association between these two elements, consistentwith results from the correlation analysis (Table 2). For data from theColes Hill soil samples relative to the reference samples, ln U/Th vari-ance is much higher, consistent with the low correlation of ln U/Al ver-sus ln Th/Al. For data from the A-horizon at Coles Hill, the lowest U log-ratio variances are with V, Li, Mo, and P, suggesting an association of Uwith phosphate minerals and the possibility of vanadate substitutionfor phosphate or the formation of U-vanadates such as carnotite. Miner-alogical analysis of ColesHill ore and soil samples showed that Uwas in-corporated with phosphate in crandallite-group minerals and was alsosorbed on Fe oxides (Jerden and Sinha, 2006). The variance of the log-
Table 3U log-ratio variance values from variation matrices for Coles Hill (CH) and reference (ref)soil samples, A- and C-horizons. Values report the variance of ln(U/X). Values can be com-pared vertically, but not horizontally, due to differences in sample sizes.
9D.M. Levitan et al. / Journal of Geochemical Exploration xxx (2014) xxx–xxx
ratios of U/Fe, U/Al, V/Fe, and V/Al are relatively low among Coles Hill A-horizon ratios involving U and Vwithin the variationmatrix, suggestingmore proportional relationships for U and V with Fe and Al than withmost other elements. For data from the Coles Hill C-horizon samples,the lowest U log-ratio variances are with La, Ce, and Sr. The presenceof lanthanide-phosphate minerals in association with U and U-phosphates in Coles Hill soil samples, as suggested by the statistical re-lationship of these elements, was noted by Jerden (2001).
Na Sr
Th
Ti
Nb
As
Mo
LiU V
Sb
Sn
Cu Bi
WC
rN
i
Hei
ght
12
34
56
7
A Horizo
A Horizo
24
68
10
Hei
ght Pb
Sb
WM
oN
bY
Ce
La
Be
LiBi
Sn
Th U
Ba
KR
b
PK
Rb Tl
Sn
Ti
Nb
Pb
Ca Li Y
U
Sr
Ba
Na
Ce
La
12
34
56
7
C Horizo
Hei
ght
C Horizo
Hei
ght
24
68
10
Sr
Ca
NaAl
Ga
Zn
Mn
Mg
Co
PC
uC
rN
iT
iV
Fe
Sc
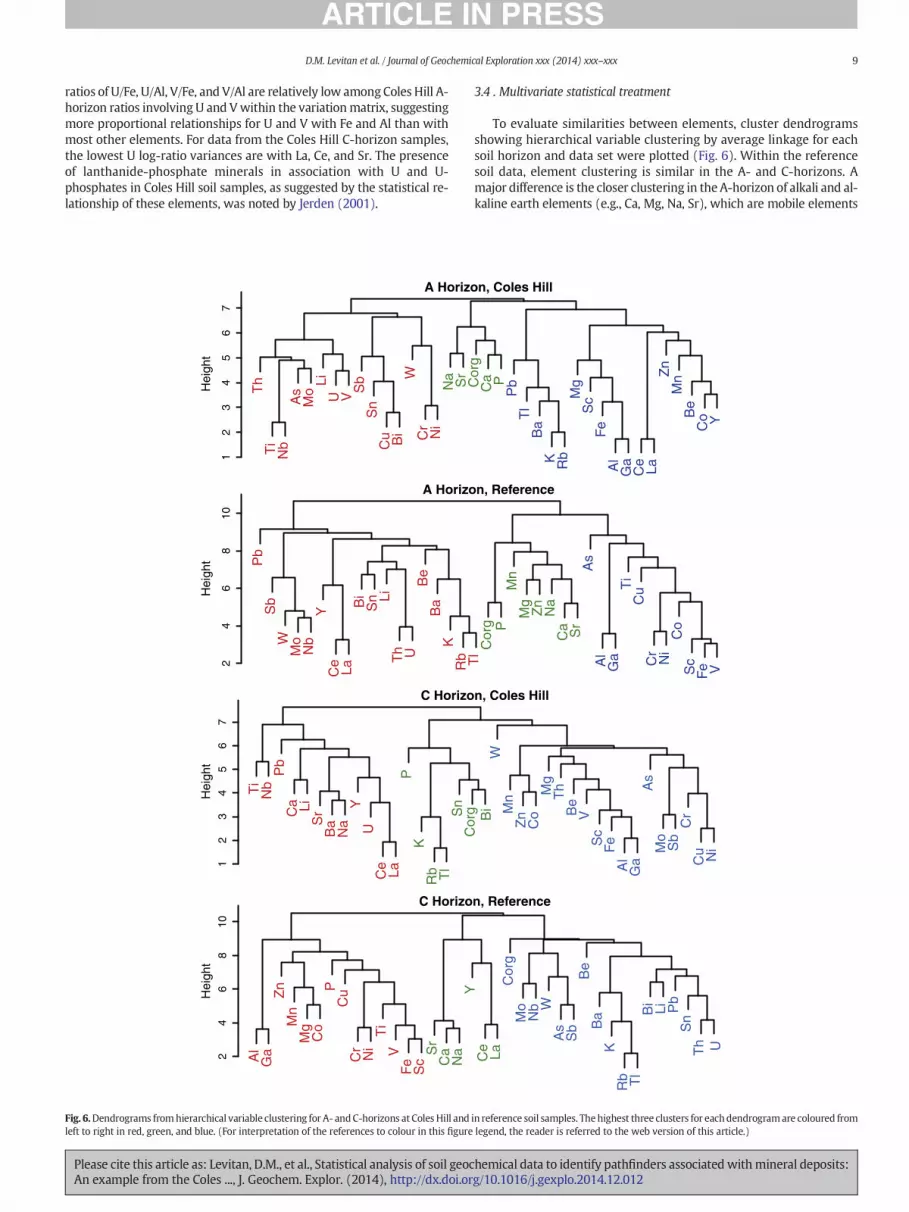
Fig. 6.Dendrograms fromhierarchical variable clustering for A- andC-horizons at Coles Hill andleft to right in red, green, and blue. (For interpretation of the references to colour in this figure
Please cite this article as: Levitan, D.M., et al., Statistical analysis of soil geocAn example from the Coles ..., J. Geochem. Explor. (2014), http://dx.doi.or
3.4 . Multivariate statistical treatment
To evaluate similarities between elements, cluster dendrogramsshowing hierarchical variable clustering by average linkage for eachsoil horizon and data set were plotted (Fig. 6). Within the referencesoil data, element clustering is similar in the A- and C-horizons. Amajor difference is the closer clustering in the A-horizon of alkali and al-kaline earth elements (e.g., Ca, Mg, Na, Sr), which are mobile elements
Pb
Tl
Ba
K Rb
Mg
Sc
Fe
Al
Ga
Ce
LaZ
nM
nB
eC
o Y
Cor
gC
a P
n, Coles Hill
n, ReferenceC
org P
Mn
Mg
Zn
Na
Ca Sr
As
Al
Ga
Ti
Cu
Cr
Ni
Co
Sc
Fe V
Tl
Mg
WM
nZ
nC
o
Th
Be
VS
cF
eA
lG
aA
sM
oS
bC
rC
u Ni
Cor
g Bi
n, Coles Hill
n, Reference
YC
eLa
Cor
gM
oN
b WA
sS
bB
eB
aK
Rb Tl
Bi
Li Pb
Sn
Th U
in reference soil samples. Thehighest three clusters for eachdendrogramare coloured fromlegend, the reader is referred to the web version of this article.)
hemical data to identify pathfinders associatedwithmineral deposits:g/10.1016/j.gexplo.2014.12.012
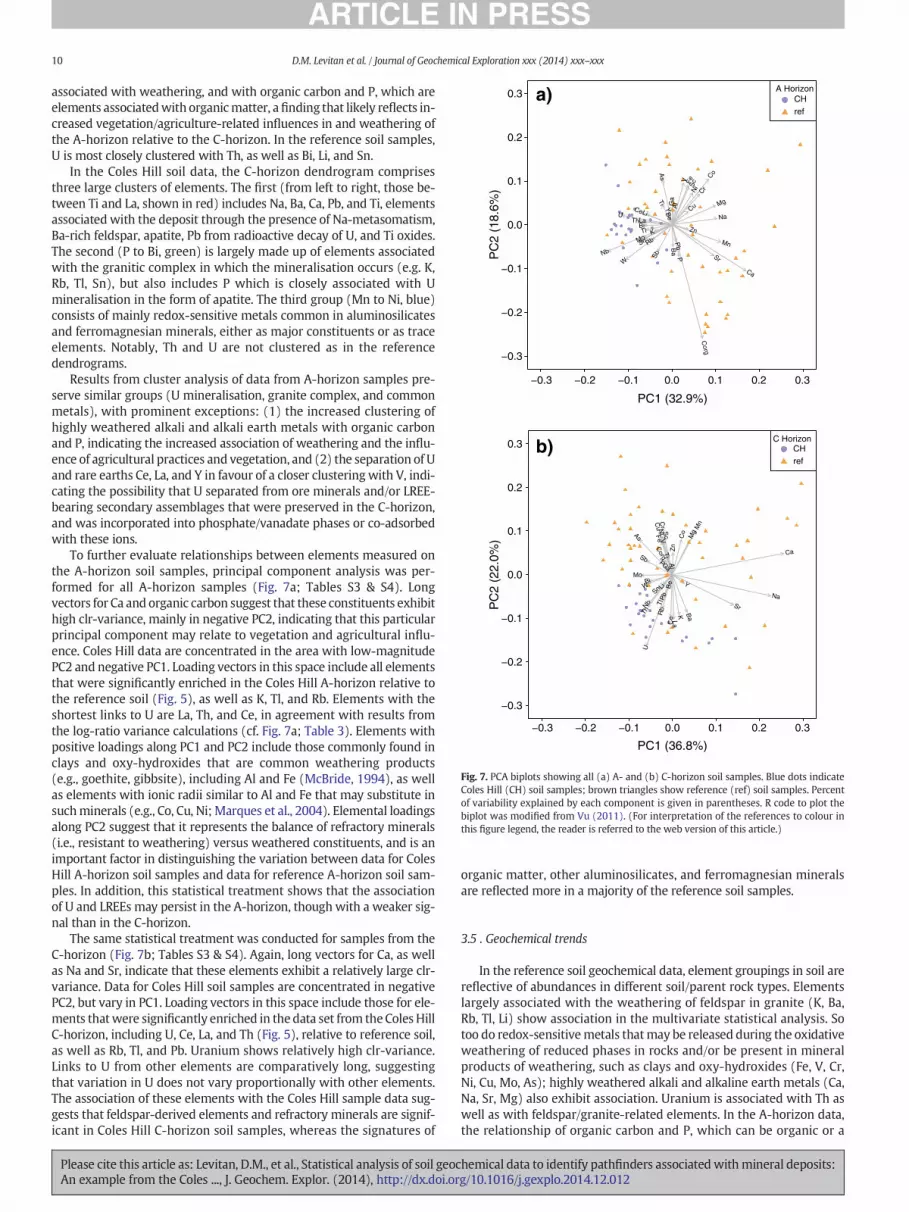
Fig. 7. PCA biplots showing all (a) A- and (b) C-horizon soil samples. Blue dots indicateColes Hill (CH) soil samples; brown triangles show reference (ref) soil samples. Percentof variability explained by each component is given in parentheses. R code to plot thebiplot was modified from Vu (2011). (For interpretation of the references to colour inthis figure legend, the reader is referred to the web version of this article.)
10 D.M. Levitan et al. / Journal of Geochemical Exploration xxx (2014) xxx–xxx
associated with weathering, and with organic carbon and P, which areelements associatedwith organicmatter, afinding that likely reflects in-creased vegetation/agriculture-related influences in and weathering ofthe A-horizon relative to the C-horizon. In the reference soil samples,U is most closely clustered with Th, as well as Bi, Li, and Sn.
In the Coles Hill soil data, the C-horizon dendrogram comprisesthree large clusters of elements. The first (from left to right, those be-tween Ti and La, shown in red) includes Na, Ba, Ca, Pb, and Ti, elementsassociated with the deposit through the presence of Na-metasomatism,Ba-rich feldspar, apatite, Pb from radioactive decay of U, and Ti oxides.The second (P to Bi, green) is largely made up of elements associatedwith the granitic complex in which the mineralisation occurs (e.g. K,Rb, Tl, Sn), but also includes P which is closely associated with Umineralisation in the form of apatite. The third group (Mn to Ni, blue)consists of mainly redox-sensitive metals common in aluminosilicatesand ferromagnesian minerals, either as major constituents or as traceelements. Notably, Th and U are not clustered as in the referencedendrograms.
Results from cluster analysis of data from A-horizon samples pre-serve similar groups (U mineralisation, granite complex, and commonmetals), with prominent exceptions: (1) the increased clustering ofhighly weathered alkali and alkali earth metals with organic carbonand P, indicating the increased association of weathering and the influ-ence of agricultural practices and vegetation, and (2) the separation of Uand rare earths Ce, La, and Y in favour of a closer clustering with V, indi-cating the possibility that U separated from ore minerals and/or LREE-bearing secondary assemblages that were preserved in the C-horizon,and was incorporated into phosphate/vanadate phases or co-adsorbedwith these ions.
To further evaluate relationships between elements measured onthe A-horizon soil samples, principal component analysis was per-formed for all A-horizon samples (Fig. 7a; Tables S3 & S4). Longvectors for Ca and organic carbon suggest that these constituents exhibithigh clr-variance, mainly in negative PC2, indicating that this particularprincipal component may relate to vegetation and agricultural influ-ence. Coles Hill data are concentrated in the area with low-magnitudePC2 and negative PC1. Loading vectors in this space include all elementsthat were significantly enriched in the Coles Hill A-horizon relative tothe reference soil (Fig. 5), as well as K, Tl, and Rb. Elements with theshortest links to U are La, Th, and Ce, in agreement with results fromthe log-ratio variance calculations (cf. Fig. 7a; Table 3). Elements withpositive loadings along PC1 and PC2 include those commonly found inclays and oxy-hydroxides that are common weathering products(e.g., goethite, gibbsite), including Al and Fe (McBride, 1994), as wellas elements with ionic radii similar to Al and Fe that may substitute insuchminerals (e.g., Co, Cu, Ni; Marques et al., 2004). Elemental loadingsalong PC2 suggest that it represents the balance of refractory minerals(i.e., resistant to weathering) versus weathered constituents, and is animportant factor in distinguishing the variation between data for ColesHill A-horizon soil samples and data for reference A-horizon soil sam-ples. In addition, this statistical treatment shows that the associationof U and LREEs may persist in the A-horizon, though with a weaker sig-nal than in the C-horizon.
The same statistical treatment was conducted for samples from theC-horizon (Fig. 7b; Tables S3 & S4). Again, long vectors for Ca, as wellas Na and Sr, indicate that these elements exhibit a relatively large clr-variance. Data for Coles Hill soil samples are concentrated in negativePC2, but vary in PC1. Loading vectors in this space include those for ele-ments thatwere significantly enriched in the data set from the Coles HillC-horizon, including U, Ce, La, and Th (Fig. 5), relative to reference soil,as well as Rb, Tl, and Pb. Uranium shows relatively high clr-variance.Links to U from other elements are comparatively long, suggestingthat variation in U does not vary proportionally with other elements.The association of these elements with the Coles Hill sample data sug-gests that feldspar-derived elements and refractory minerals are signif-icant in Coles Hill C-horizon soil samples, whereas the signatures of
Please cite this article as: Levitan, D.M., et al., Statistical analysis of soil geocAn example from the Coles ..., J. Geochem. Explor. (2014), http://dx.doi.or
organic matter, other aluminosilicates, and ferromagnesian mineralsare reflected more in a majority of the reference soil samples.
3.5 . Geochemical trends
In the reference soil geochemical data, element groupings in soil arereflective of abundances in different soil/parent rock types. Elementslargely associated with the weathering of feldspar in granite (K, Ba,Rb, Tl, Li) show association in the multivariate statistical analysis. Sotoo do redox-sensitivemetals thatmay be released during the oxidativeweathering of reduced phases in rocks and/or be present in mineralproducts of weathering, such as clays and oxy-hydroxides (Fe, V, Cr,Ni, Cu, Mo, As); highly weathered alkali and alkaline earth metals (Ca,Na, Sr, Mg) also exhibit association. Uranium is associated with Th aswell as with feldspar/granite-related elements. In the A-horizon data,the relationship of organic carbon and P, which can be organic or a
hemical data to identify pathfinders associatedwithmineral deposits:g/10.1016/j.gexplo.2014.12.012
11D.M. Levitan et al. / Journal of Geochemical Exploration xxx (2014) xxx–xxx
remnant of fertilisers, applied during cultivation, suggests a vegetativeand/or agricultural influence.
In the Coles Hill data, the clustering of granitic/feldspathic, commonmetals, andhighlyweathered elements remains, but there is a change inthe elements with which U is associated. The change suggests that thefraction of U that is derived from granitic and meta-granitic rocks isnot as influential on total U concentrations near the deposit as the refer-ence soil samples, which is further substantiated by the negative corre-lation between ln U/Al and ln felsic elements/Al (Table 2). In the A-horizon Coles Hill data, evidence for previously-observed associationwith phosphates is observed. In the C-horizon data, a relationship be-tween U and LREEs is apparent; this association likely reflects the pres-ence of U-LREE phosphates, derived from apatite enriched in theseelements within the mineralisation of the deposit (Jerden, 2001). In ad-dition, the proportion of Nb is elevated in Coles Hill C-horizon data,though its correlation with U is low to moderate and its PCA linkswith U are longer than those of other elements; in the Coles Hillmineralisation zone, Nb likely substitutes for Ti in anatase and other Tiphases associated with the ore (Jerden, 2001).
The Coles Hill site has been subjected to several centuries of agricul-tural activity, which includes the physical disturbance of the upper soillayers, aswell as the application of fertilisers and pesticides. Agriculturalactivity can impact the concentrations of organic carbon, elements thatfertilisers and liming agents are applied to supply (e.g., P, K, Ca, Mg),trace elements found in fertilisers (e.g., U, V, Cd; Mortvedt, 1995), andthe constituents of pesticides (e.g., Pb, As). Consequently, C-horizonsoil in agricultural areas may provide more reliable geochemicalprospecting information than the A-horizon.
In addition, elementswith a documented relationship to U, such as P(Jerden and Sinha, 2006), may not evidence useful geochemical
CH A CH C ref A ref C
log
U/A
l
CH A CH C
log
(La+
Ce)
/Al
CH A CH C ref A ref C
log
U/V
CH A CH C
log
U/T
h
−5.
5−
5.0
−4.
5−
4.0
−3.
5−
3.0
−3.
5−
3.0
−2.
5−
2.0
−2.
5−
2.0
−1.
5−
1.0
−0.
50.
0
−1.
0−
0.5
0.0
0.5
1.0
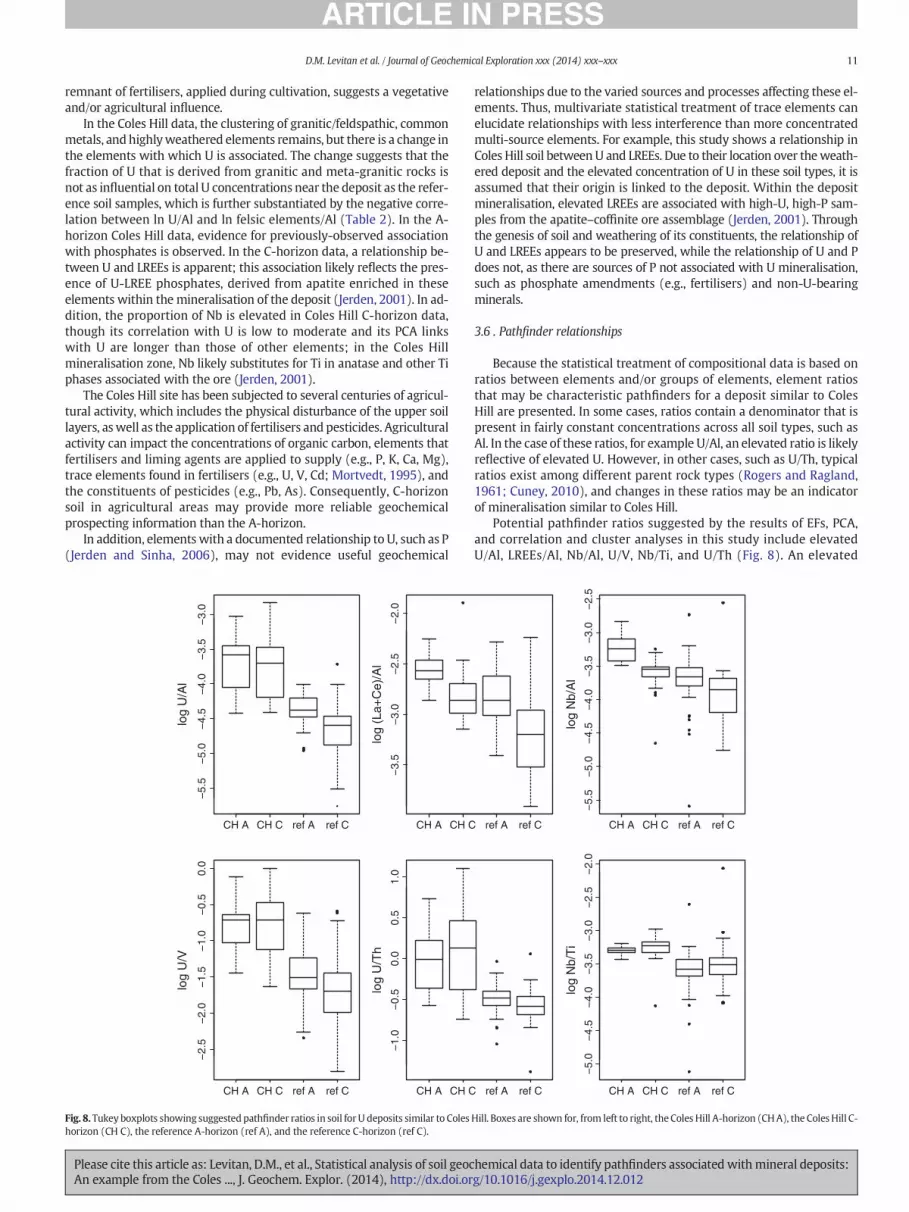
Fig. 8.Tukey boxplots showing suggestedpathfinder ratios in soil forU deposits similar to Coleshorizon (CH C), the reference A-horizon (ref A), and the reference C-horizon (ref C).
Please cite this article as: Levitan, D.M., et al., Statistical analysis of soil geocAn example from the Coles ..., J. Geochem. Explor. (2014), http://dx.doi.or
relationships due to the varied sources and processes affecting these el-ements. Thus, multivariate statistical treatment of trace elements canelucidate relationships with less interference than more concentratedmulti-source elements. For example, this study shows a relationship inColes Hill soil betweenU and LREEs. Due to their location over theweath-ered deposit and the elevated concentration of U in these soil types, it isassumed that their origin is linked to the deposit. Within the depositmineralisation, elevated LREEs are associated with high-U, high-P sam-ples from the apatite–coffinite ore assemblage (Jerden, 2001). Throughthe genesis of soil and weathering of its constituents, the relationship ofU and LREEs appears to be preserved, while the relationship of U and Pdoes not, as there are sources of P not associated with U mineralisation,such as phosphate amendments (e.g., fertilisers) and non-U-bearingminerals.
3.6 . Pathfinder relationships
Because the statistical treatment of compositional data is based onratios between elements and/or groups of elements, element ratiosthat may be characteristic pathfinders for a deposit similar to ColesHill are presented. In some cases, ratios contain a denominator that ispresent in fairly constant concentrations across all soil types, such asAl. In the case of these ratios, for example U/Al, an elevated ratio is likelyreflective of elevated U. However, in other cases, such as U/Th, typicalratios exist among different parent rock types (Rogers and Ragland,1961; Cuney, 2010), and changes in these ratios may be an indicatorof mineralisation similar to Coles Hill.
Potential pathfinder ratios suggested by the results of EFs, PCA,and correlation and cluster analyses in this study include elevatedU/Al, LREEs/Al, Nb/Al, U/V, Nb/Ti, and U/Th (Fig. 8). An elevated
ref A ref C CH A CH C ref A ref C
log
Nb/
Al
ref A ref C CH A CH C ref A ref C
log
Nb/
Ti
−5.
5−
5.0
−4.
5−
4.0
−3.
5−
3.0
−2.
5−
5.0
−4.
5−
4.0
−3.
5−
3.0
−2.
5−
2.0
Hill. Boxes are shown for, from left to right, the Coles Hill A-horizon (CHA), the ColesHill C-
hemical data to identify pathfinders associatedwithmineral deposits:g/10.1016/j.gexplo.2014.12.012
Fig. 9. (a) Log–log plot of Th vs. U concentrations (mg/kg). A-horizon values are shown asfilled symbols, and C-horizon values as open symbols. Black circles indicate Coles Hill (CH)soil samples, and red triangles indicate reference (ref) soil samples. Log–log linear best-fitlines are shown for Coles Hill and reference soil samples in their respective colours.(b) Plot of isometric log-ratio balances for K, U, and Th. (For interpretation of the refer-ences to colour in this figure legend, the reader is referred to the web version of thisarticle.)
12 D.M. Levitan et al. / Journal of Geochemical Exploration xxx (2014) xxx–xxx
U/Mn or Al/Mn ratio appears from the data to be a potential indica-tor, but the presence of Mn deposits documented within the refer-ence area (Espenshade, 1954) could provide a regional bias in thisratio.
In addition to elevated values, the spread of Nb/Ti andU/Th are differ-ent between data for the Coles Hill and reference soil samples; in theColes Hill soil data, Nb/Ti ratios are very uniform, whereas U/Th ratiosrange much more widely than in reference soil samples (Fig. 9a). Thetypical U/Th ratio in the upper continental crust is 0.26 (Cuney, 2010).
100
10
1
0.1
0.010 200 400 600 800 1000
100
10
1
0.1
0.010 200 400 600 800 1000
100
10
1
0.1
0.010
100
10
1
0.1
0.010
pCi/g
pCi/g
pCi/g
pCi/g
North Transect A Horizon
North Transect C Horizon
Distance along transect, m
Distance along transect, m
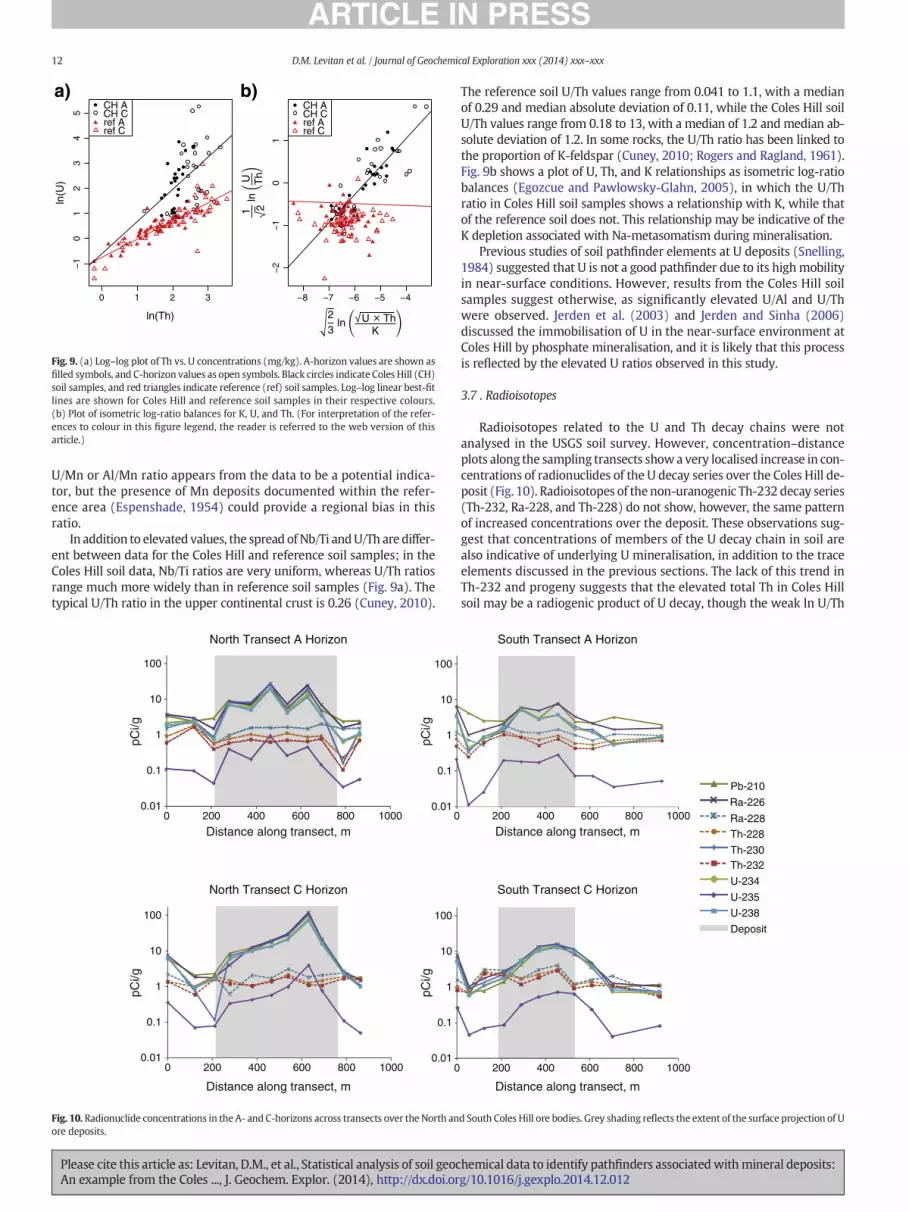
Fig. 10. Radionuclide concentrations in the A- and C-horizons across transects over the North anore deposits.
Please cite this article as: Levitan, D.M., et al., Statistical analysis of soil geocAn example from the Coles ..., J. Geochem. Explor. (2014), http://dx.doi.or
The reference soil U/Th values range from 0.041 to 1.1, with a medianof 0.29 and median absolute deviation of 0.11, while the Coles Hill soilU/Th values range from 0.18 to 13, with a median of 1.2 and median ab-solute deviation of 1.2. In some rocks, the U/Th ratio has been linked tothe proportion of K-feldspar (Cuney, 2010; Rogers and Ragland, 1961).Fig. 9b shows a plot of U, Th, and K relationships as isometric log-ratiobalances (Egozcue and Pawlowsky-Glahn, 2005), in which the U/Thratio in Coles Hill soil samples shows a relationship with K, while thatof the reference soil does not. This relationship may be indicative of theK depletion associated with Na-metasomatism during mineralisation.
Previous studies of soil pathfinder elements at U deposits (Snelling,1984) suggested that U is not a good pathfinder due to its high mobilityin near-surface conditions. However, results from the Coles Hill soilsamples suggest otherwise, as significantly elevated U/Al and U/Thwere observed. Jerden et al. (2003) and Jerden and Sinha (2006)discussed the immobilisation of U in the near-surface environment atColes Hill by phosphate mineralisation, and it is likely that this processis reflected by the elevated U ratios observed in this study.
3.7 . Radioisotopes
Radioisotopes related to the U and Th decay chains were notanalysed in the USGS soil survey. However, concentration–distanceplots along the sampling transects showa very localised increase in con-centrations of radionuclides of the U decay series over the Coles Hill de-posit (Fig. 10). Radioisotopes of the non-uranogenic Th-232 decay series(Th-232, Ra-228, and Th-228) do not show, however, the same patternof increased concentrations over the deposit. These observations sug-gest that concentrations of members of the U decay chain in soil arealso indicative of underlying U mineralisation, in addition to the traceelements discussed in the previous sections. The lack of this trend inTh-232 and progeny suggests that the elevated total Th in Coles Hillsoil may be a radiogenic product of U decay, though the weak ln U/Th
200 400 600 800 1000
200 400 600 800 1000
South Transect A Horizon
South Transect C Horizon
Distance along transect, m
Distance along transect, m
Pb-210
Ra-228
Ra-226
Th-228
Th-232Th-230
U-238
U-235
U-234
Deposit
d South Coles Hill ore bodies. Grey shading reflects the extent of the surface projection of U
hemical data to identify pathfinders associatedwithmineral deposits:g/10.1016/j.gexplo.2014.12.012
13D.M. Levitan et al. / Journal of Geochemical Exploration xxx (2014) xxx–xxx
correlation in Coles Hill soil samples is not consistent with thishypothesis.
4 . Conclusions
Statistical treatment of data from a baseline soil survey at the ColesHill U deposit reveals geochemical anomalies relative to regional soilsample data. Anomalies exist in both the A- and C-horizons; whereasthere are significant differences in composition between samples fromthe A- and C-horizon, as both horizons locally show the influence ofthe deposit, particularly in terms of U concentration. Soil concentrationsand proportions (i.e., ratios) of certain elements associated with the de-posit (e.g., U, Th, La, Ce, Nb) are higher in soil samples overlying the de-posit relative to regional reference soil samples. In some cases, elevatedconcentrations are likely due to proximity to the deposit, and are thetype of data that exploration geochemical surveys target. Based on thedifferences between Coles Hill and reference soil samples, and on rela-tionships between elements within them, elevated proportions(i.e., concentrations relative to Al or the geometric mean) of U, Th, La,Ce, and Nb in soil, as well as potentially those of U-progeny radioiso-topes, may be indicative of underlying mineralisation similar to ColesHill, and could be used as pathfinders for this type of deposit. Beyondsimply elevated levels of certain elements, their relationship to U orother elements is indicative of a possible buried deposit. For example,the results of this study show that this deposit is characterised by thepositive relationship of U and LREEs in overlying soil, and the negativeor lack of relationship of the proportions to Al of U and Th, K, Rb, andTl in overlying soil relative to other soil of the same type. These data pat-terns become evident through the use of multivariate compositionaldata analysis, which can be easily conducted using open-source soft-ware, and allows for the rapid statistical treatment of geochemicaldata sets with numerous interrelated parameters. This study also dem-onstrates the use of results of a national-scale geochemical survey asreference soil for comparison between a site of geological interest, theColes Hill U deposit, and regional soil.
Acknowledgements
Randy Cosby was involved in soil sampling, and Virginia Tech soillaboratory analyses were led by Julie Burger and Trey Rauh. XRD prepa-ration was performed by Nadine Piatak and Natalia Ainsfield of theUSGS. Virginia Uranium, Inc. provided partial financial support to Vir-ginia Tech. VUI andWalter Coles Sr. allowed property access, and Stew-art East provided valuable knowledge about the area. The use of productor trade names is for descriptive purposes only and does not constituteendorsement by the U.S. government. The authors thank VeraPawlowsky-Glahn of the University of Girona for input on composition-al data analysis. Comments from two anonymous reviewers and LarryDrew of the USGS greatly improved the manuscript.
Appendix A. Supplementary data
Supplementary data to this article can be found online at http://dx.doi.org/10.1016/j.gexplo.2014.12.012.
References
Aaron, L.G., 2009. Pittsylvania County, Virginia: a Brief History. The History Press, Charles-ton, SC, p. (160 pp.).
Aitchison, J., 1982. The statistical analysis of compositional data. J. R. Stat. Soc. Ser. BMethodol. 44 (2), 139–177.
Aitchison, J., 1986. The Statistical Analysis of Compositional Data. Chapman and Hall,London, New York (463 pp.).
Aitchison, J., Greenacre, M., 2002. Biplots of compositional data. J. R. Stat. Soc.: Ser. C: Appl.Stat. 51, 375–392.
Pincock Allen & Holt, 1982, 1982. Geologic Reserves: Coles Hill South Uranium Deposit,Pittsylvania County, Virginia. Pincock Allen & Holt, Tucson, Arizona.
Please cite this article as: Levitan, D.M., et al., Statistical analysis of soil geocAn example from the Coles ..., J. Geochem. Explor. (2014), http://dx.doi.or
Aylor, J., Bodnar, R.J., Beard, J., 2014. Geology of the Coles Hill uranium deposit, VirginiaPiedmont. Geol. Soc. Am. Field Guid. 35, 271–284.
Bradshaw, P.M.D., Lett, R.E.W., 1980. Geochemical exploration for uranium using soils.J. Geochem. Explor. 13, 305–319.
Buccianti, A., 2014. The FOREGS repository: modelling variability in stream waters on acontinental scale revising classical diagrams fromCoDA (compositional data analysis)perspective. In: Demetriades, A., Birke, M., Albanese, S., Schoeters, I., De Vivo, B. (Eds.),Continental, Regional and Local Scale Geochemical Mapping, Special Issue. Journal ofGeochemical Exploration (in this issue).
Buccianti, A., Mateu-Figueras, G., Pawlowsky-Glahn, V. (Eds.), 2006. Compositional dataanalysis in the geosciences. Geological Society Special Publication 264. Geological So-ciety of London, London (212 pp.).
Carranza, E.J.M., 2011. Analysis and mapping of geochemical anomalies using logratio-transformed stream sediment data with censored values. J. Geochem. Explor. 110,167–185.
Clark, L.A.C., 1987.Near surface lithogeochemical halos as an aid to discovery of deeply buriedunconformity-type deposits, Athabasca Basin, Canada. J. Geochem. Explor. 28, 71–84.
Cohen, D.R., Rutherford, N.F., Morisseau, E., Christoforou, I., Zissimos, A.M., 2012. Anthro-pogenic versus lithological influences on soil geochemical patterns in Cyprus.Geochem. Explor. Environ. Anal. 12, 349–360.
Comas-Cufí, M., Thió-Henestrosa, S., 2011. CoDaPack 2.0: a stand-alone, multi-platformcompositional software. In: Egozcue, J., Tolosana-Delgado, R., Ortego, M. (Eds.),CoDaWork'11: 4th International Workshop on Compositional Data Analysis.
Cox, D.P., Singer, D.A., 1986. Mineral deposit models. U.S. Geological Survey Bulletin I693(379 pp.).
Cuney, M., 2009. The extreme diversity of uranium deposits. Mineral. Deposita 44, 3–9.Cuney, M., 2010. Evolution of uranium fractionation processes through time: driving the
secular variation of uranium deposit types. Econ. Geol. 105, 553–569.Dahlkamp, F.J., 1993. Uranium Ore Deposits. Springer-Verlag, Berlin (493 pp.).Dahlkamp, F.J., 2010. Uranium Deposits of the World. Springer-Verlag, Berlin (460 pp.).Drew, L.J., Grunsky, E.C., Sutphin, D.M., Woodruff, L.G., 2010. Multivariate analysis of the
geochemistry and mineralogy of soils along two continental-scale transects inNorth America. Sci. Total Environ. 409, 218–227.
Egozcue, J.J., Pawlowsky-Glahn, V., 2005. Groups of parts and their balances in composi-tional data analysis. Math. Geol. 37, 795–828.
Egozcue, J.J., Pawlowsky-Glahn, V., Mateu-Figueras, G., Barceló-Vidal, C., 2003. Isometriclogratio transformations for compositional data analysis. Math. Geol. 35, 279–300.
Espenshade, G.H., 1954. Geology and mineral deposits of the James River-Roanoke Rivermanganese district, Virginia. US Geological Survey Bulletin 1008.
Fayek, M., 2013. Uranium ore deposits: a review. In: Burns, P.C., Sigmon, G.E. (Eds.), Ura-nium: Cradle to Grave. Mineralogical Association of Canada, pp. 121–146.
Gannon, J., Burbey, T., Bodnar, R., Aylor, J., 2011. Geophysical and geochemical character-ization of the groundwater system and the role of Chatham Fault in groundwatermovement at the Coles Hill uranium deposit, Virginia, USA. Hydrogeol. J. 20, 1–16.
Grunsky, E.C., 2010. The interpretation of geochemical survey data. Geochem. Explor. En-viron. Anal. 10, 27–74.
Henika, W.S., 2002. Geologic map of the Danville 30 by 60 minute quadrangle, Virginia.Virginia Division of Mineral Resources Pub. 166, Richmond, VA.
Henika, W.S., Thayer, P.A., 1983. Geologic map of the Spring Garden quadrangle, Virginia.Virginia Division of Mineral Resources Pub. 048, Richmond, VA.
IAEA, 2009. World distribution of uranium deposits (UDEPO) with uranium deposit clas-sification. IAEA TECDOC-1629. International Atomic Energy Agency, Vienna, Austria.
Jefferson, C., Thomas, D., Quirt, D., Mwenifumbo, C., Brisbin, D., 2007. Empirical models forCanadian unconformity-associated uranium deposits. In: Milkereit, B. (Ed.), Proceed-ings of Exploration 07: Fifth Decennial International Conference on Mineral Explora-tion, Toronto, pp. 741–769 (http://www.dmec.ca/ex07-dvd/E07/pdfs/51.pdf).
Jerden, J.L., 2001. Origin of uranium mineralization at Coles Hill, Virginia (USA) and itsnatural attenuation within an oxidizing rock–soil–ground water system. (Ph.D. dis-sertation), Virginia Tech, Blacksburg, VA (145 pp., http://scholar.lib.vt.edu/theses/available/etd-10032001-141240/unrestricted/JerdenDissertation.pdf).
Jerden, J.L., Sinha, A.K., 2003. Phosphate based immobilization of uranium in an oxidizingbedrock aquifer. Appl. Geochem. 18, 823–843.
Jerden, J.L., Sinha, A.K., 2006. Geochemical coupling of uranium and phosphorous in soilsoverlying an unmined uranium deposit: Coles Hill, Virginia. J. Geochem. Explor. 91,56–70.
Jerden, J.L., Sinha, A.K., Zelazny, L., 2003. Natural immobilization of uranium by phosphatemineralization in an oxidizing saprolite–soil profile: chemical weathering of the ColesHill uranium deposit, Virginia. Chem. Geol. 199, 129–157.
Levitan, D.M., Schreiber, M.E., Seal, R.R., Bodnar, R.J., Aylor, J.G., 2014. Developing protocolsfor geochemical baseline studies: an example from the Coles Hill uranium deposit,Virginia, USA. Appl. Geochem. 43, 88–100.
Lyntek Inc., 2013. Revised Updated Preliminary Economic Assessment— Coles Hill UraniumProperty. Lyntek Inc., Lakewood, CO (126 pp., http://www.virginiaenergyresources.com/i/pdf/VUI-Coles-Hill-PEA-Updated-Technical-Report-Aug19.pdf).
Marline Uranium Corporation, 1983. An Evaluation of Uranium Development inPittsylvania County. Marline Uranium Corporation, USA, Virginia.
Martín-Fernández, J.A., Hron, K., Templ, M., Filzmoser, P., Palarea-Albaladejo, J., 2012.Model-based replacement of rounded zeros in compositional data: classical and ro-bust approaches. Comput. Stat. Data Anal. 56, 2688–2704.
McBride, M.B., 1994. Environmental Chemistry of Soils. Oxford University Press, NewYork (416 pp.).
hemical data to identify pathfinders associatedwithmineral deposits:g/10.1016/j.gexplo.2014.12.012
14 D.M. Levitan et al. / Journal of Geochemical Exploration xxx (2014) xxx–xxx
Meyertons, C.T., 1963. Triassic formations of the Danville basin. Virginia Division of Min-eral Resources Report of Investigations 6, Richmond, VA (65 pp.).
Mortvedt, J.J., 1995. Heavy metal contaminants in inorganic and organic fertilizers. Fertil.Res. 43, 55–61.
NCDC, 2012. National Climatic Data Center. National Oceanic and Atmospheric Adminis-tration, Asheville, NC.
NRCS, 2011. Soil Survey Geographic Database (SSURGO) Database. Natural ResourcesConservation Service, U.S. Department of Agriculture.
Palarea-Albaladejo, J., Martín-Fernández, J.A., Buccianti, A., 2014. Compositional methodsfor estimating elemental concentrations below the limit of detection in practice usingR. J. Geochem. Explor. 141, 71–77.
Pawlowsky-Glahn, V., Buccianti, A., 2011. Compositional Data Analysis: Theory and Appli-cations. John Wiley & Sons, Ltd., London (400 pp.).
Pawlowsky-Glahn, V., Egozcue, J.J., 2006. Compositional data and their analysis: an intro-duction. In: Buccianti, A., Mateu-Figueras, G., Pawlowsky-Glahn, V. (Eds.), Composi-tional data analysis in the geosciences. Geological Society Special Publication 264.Geological Society of London, London, pp. 1–10.
Power, M., Hattori, K., Sorba, C., Potter, E.G., 2012. Geochemical anomalies in soils and up-permost siliciclastic units overlying the Phoenix uranium deposit, Athabasca Basin,Saskatchewan. Geological Survey of Canada Open File 7257 (36 pp., http://mysite.science.uottawa.ca/khattori/Power-GSCOPFR7257.pdf).
R Development Core Team, 2011. R: A Language and Environment for Statistical Comput-ing. R Foundation for Statistical Computing, Vienna, Austria (http://www.r-project.org/).
Reimann, C., Filzmoser, P., Garrett, R.G., Dutter, R., 2008. Statistical data analysis ex-plained: applied environmental statistics with R. John Wiley & Sons, Chichester, UK(343 pp.).
Reimann, C., Filzmoser, P., Fabian, K., Hron, K., Birke, M., Demetriades, A., Dinelli, E.,Ladenberger, A., The GEMAS Project Team, 2012. The concept of compositional dataanalysis in practice — total major element concentrations in agricultural and grazingland soils of Europe. Sci. Total Environ. 426, 196–210.
Rogers, J.J.W., Ragland, P.C., 1961. Variation of thorium and uranium in selected graniticrocks. Geochim. Cosmochim. Acta 25, 99–109.
Rose, A.W., Wright, R.J., 1980. Geochemical exploration models for sedimentary uraniumdeposits. J. Geochem. Explor. 13, 153–179.
Sadeghi, M., Billay, A., Carranza, E.J.M., 2014. Analysis and mapping of soil geochemicalanomalies: implications for bedrock mapping and gold exploration in Giyani area,
Please cite this article as: Levitan, D.M., et al., Statistical analysis of soil geocAn example from the Coles ..., J. Geochem. Explor. (2014), http://dx.doi.or
South Africa. In: Demetriades, A., Birke, M., Albanese, S., Schoeters, I., De Vivo, B.(Eds.), Continental, Regional and Local Scale Geochemical Mapping, Special Issue.Journal of Geochemical Exploration (in this issue).
Smith, D.B. (Ed.), 2009. Geochemical studies of North American soils: results from thepilot study phase of the North American Soil Geochemical Landscapes Project. Ap-plied Geochemistry 24(8), pp. 1355–1616.
Smith, D., Cannon,W.,Woodruff, L., Garrett, R., Klassen, R., Kilburn, J., Horton, J., King, H.D.,Goldhaber, M.B., Morrison, J.M., 2005. Major- and trace element concentrations insoils from two continental-scale transects of the United States and Canada. U.S. Geo-logical Survey Open-file Report 2005-1253 (20 pp., http://pubs.usgs.gov/of/2005/1253/pdf/OFR1253.pdf).
Smith, D.B., Cannon,W.F.,Woodruff, L.G., Solano, F., Kilburn, J.E., Fey, D.L., 2013. Geochem-ical andmineralogical data for soils of the conterminous United States. U.S. GeologicalSurvey Data Series 801 (19 pp., http://pubs.usgs.gov/ds/801/pdf/ds801.pdf).
Snelling, A.A., 1984. A soil geochemistry orientation survey for uranium at Koongarra,Northern Territory. J. Geochem. Explor. 22, 83–99.
Sopuck, A.J., de Carla, A.,Wray, E.M., Cooper, B., 1983. The application of lithogeochemistryin the search for unconformity-type uranium deposits, northern Saskatachewan,Canada. J. Geochem. Explor. 19, 77–99.
Tappa, M.J., Ayuso, R.A., Bodnar, R.J., Aylor, J.G., Beard, J., Henika, W.S., Vazquez, J.A.,Wooden, J.L., 2014. Age of host rocks at the Coles Hill uranium deposit, PittsylvaniaCounty, Virginia, based on zircon U–Pb geochronology. Econ. Geol. 109, 513–530.
Templ, M., Hron, K., Filzmoser, P., 2014. robCompositions: robust estimation for composi-tional data. R package. CRAN (57 pp., http://cran.r-project.org/web/packages/robCompositions/robCompositions.pdf).
US EPA, 2009. Technical notes for EPA Method 901.1: gamma emitting radionuclides indrinking water. United States Environmental Protection Agency (12 pp., http://www.epa.gov/ogwdw000/radionuclides/training/downloads/Technical_Notes_for_EPA_Method_901-1_Gamma_Spec_03-04-09.pdf).
US EPA, 2013. Level III Ecoregions of the Continental United States. U.S. EnvironmentalProtection Agency, Corvallis, Oregon.
Vu, V.Q., 2011. ggbiplot: A ggplot2 based biplot. R package.Zuo, R., Xia, Q., Wang, H., 2013. Compositional data analysis in the study of integrated
geochemical anomalies associated with mineralization. Appl. Geochem. 28, 202–211.
hemical data to identify pathfinders associatedwithmineral deposits:g/10.1016/j.gexplo.2014.12.012