Foliar and ecosystem respiration in an old-growthtropical rain forest
MOLLY A. CAVALERI1,2, STEVEN F. OBERBAUER3,4 & MICHAEL G. RYAN5,6
1Graduate Degree Program in Ecology, Colorado State University, Fort Collins, CO 80523, USA, 2Botany Department,University of Hawaii, Manoa, 3190 Maile Way, Honolulu, HI 96826, USA, 3Department of Biological Sciences, FloridaInternational University, 11200 SW 8th Street, Miami, FL 33199, USA, 4Fairchild Tropical Botanic Garden, 11935 Old CutlerRoad, Miami, FL 33156, USA, 5United States Department of Agriculture Forest Service, Rocky Mountain Research Station,240 West Prospect RD, Fort Collins, CO 80526, USA and 6Graduate Degree Program in Ecology, Department of Forest,Rangeland, and Watershed Stewardship, Colorado State University, Fort Collins, CO 80523, USA
ABSTRACT
Foliar respiration is a major component of ecosystem res-piration, yet extrapolations are often uncertain in tropicalforests because of indirect estimates of leaf area index(LAI). A portable tower was used to directly measure LAIand night-time foliar respiration from 52 vertical transectsthroughout an old-growth tropical rain forest in Costa Rica.In this study, we (1) explored the effects of structural, func-tional and environmental variables on foliar respiration; (2)extrapolated foliar respiration to the ecosystem; and (3)estimated ecosystem respiration. Foliar respiration tem-perature response was constant within plant functionalgroup, and foliar morphology drove much of the within-canopy variability in respiration and foliar nutrients.Foliar respiration per unit ground area was 3.5 � 0.2 mmolCO2 m-2 s-1, and ecosystem respiration was 9.4 � 0.5 mmolCO2 m-2 s-1 [soil = 41%; foliage = 37%; woody = 14%;coarse woody debris (CWD) = 7%]. When modelled withEl Niño Southern Oscillation (ENSO) year temperatures,foliar respiration was 9% greater than when modelled withtemperatures from a normal year, which is in the range ofcarbon sink versus source behaviour for this forest. Ourecosystem respiration estimate from component fluxes was33% greater than night-time net ecosystem exchange forthe same forest, suggesting that studies reporting a largecarbon sink for tropical rain forests based solely on eddyflux measurements may be in error.
Tropical forests account for more than one-third of globalplant productivity (Saugier, Roy & Mooney 2001), and atleast half of this carbon is released back into the atmo-sphere as autotrophic respiration (Edwards et al. 1981;
Chambers et al. 2004). Results vary widely about whethertropical forests are presently acting as carbon sources orsinks, or how this may be affected by global warming.Several eddy flux studies have concluded that tropical rainforests are primarily acting as carbon sinks (Fan et al. 1990;Grace et al. 1995; Malhi et al. 1998; Loescher et al. 2003,but see Saleska et al. 2003). Many atmosphere–biospheremodelling studies, on the other hand, predict that tropicalforests will be an increased carbon source with globalwarming (Kindermann, Würth & Kohlmaier 1996; Braswellet al. 1997; Tian et al. 1998; Cox et al. 2000; Ito & Oikawa2000; White, Cannell & Friend 2000; Cramer et al. 2001;Clark et al. 2003). A better understanding of autotrophicrespiration at the landscape scale is a crucial first step inpredicting how tropical rain forest ecosystem carbonbalance may change with climate change.
Foliage can account for 18–40% of total ecosystemrespiration (Chambers et al. 2004; Curtis et al. 2005), yetextrapolations are uncertain in tropical rain forests becauseof access difficulties and the lack of unbiased leaf area index(LAI) estimates. This study presents results from an inten-sive 2-year field campaign where we measured LAI andfoliar respiration across gradients of soil fertility in anold-growth tropical rain forest in Costa Rica. We used aportable scaffolding tower to access canopy foliage for res-piration measurements and to harvest foliage from forestfloor to canopy top to estimate LAI. To our knowledge, thisis the first foliar respiration estimate for a tropical rainforest where the ecosystem extrapolation is based ondetailed information of within-canopy variation in foliarrespiration and LAI.
Foliar respiration standardized to a common tempera-ture is influenced by many variables, including canopyheight, foliar or soil nutrients, foliar morphology andspecies (Bolstad, Mitchell & Vose 1999; Mitchell, Bolstad &Vose 1999; Turnbull et al. 2003). To complicate mattersfurther, the temperature response of foliar respiration canalso change with any of the mentioned variables (Atkinet al. 2005). Standardizing respiration measurements to acommon temperature according to within-canopy andacross-landscape variability in temperature response will
Correspondence: M. A. Cavaleri. Fax: 808-956-3923; e-mail:[email protected]
Plant, Cell and Environment (2008) 31, 473–483 doi: 10.1111/j.1365-3040.2008.01775.x
greatly reduce uncertainty involved in extrapolating foliarrespiration to the ecosystem.
Foliar dark respiration is a primary trait in the ‘leaf eco-nomics spectrum’ (Wright et al. 2004). Respiration, leaf life-span, photosynthetic capacity (Amax), leaf mass per area(LMA), nitrogen (N) and phosphorus (P) have been foundto correlate with each other across plant functional groupsand ecosystem types, revealing convergent evolution ona global scale (Reich, Walters & Ellsworth 1997). Weexpected night-time foliar respiration to be linearly relatedto LMA, foliar N, P and Amax, in accordance with the leafeconomics spectrum.
Some studies suggest that the more limiting the nutrientis, the tighter it will correlate with foliar respiration (Ryan1995; Meir, Grace & Miranda 2001). We expected foliarrespiratory rates to be better correlated with soil P than soilN, because phosphorus, rather than nitrogen, is likely limit-ing in this rain forest (McDade et al. 1994). The ratio ofphotosynthetic capacity to respiration (Amax/R) may alsovary in relation to nutrient limitation (Turnbull et al. 2005),and the ability of plants to maintain constant Amax/R maybe related to thermal acclimation (Dewar, Medlyn &McMurtrie 1999).To characterize these sources of variationand compare them to variation in respiration per unit leafarea (RA) and leaf mass (RM), we analysed the responses ofRA, RM, R/N, R/P and Amax/R to changes in soil N and Pstocks, plant functional group and canopy height.
We devised six different estimates of night-time foliarrespiration per unit ground area (Rfoliar), including twocomplex and four simple methods. The more complex esti-mates used detailed information of within-canopy variabil-ity and temperature data, while the four simpler methodsused overall means to see if we could provide realisticextrapolations of foliar respiration for this forest with lessinvestment.
This study had five objectives. Firstly, we sought to char-acterize the variation in foliar respiration with tempera-ture. Secondly, we asked if respiration corrected to acommon temperature of 25 °C varied with foliar nutrients,LMA, plant functional group, height or soil nutrients.Thirdly, we examined the relationship between foliar res-piration and photosynthetic capacity (Amax). Fourthly, weused relationships identified in (1) and (2) to compareseveral methods of extrapolating foliar respiration to aground-unit basis. Finally, we estimated ecosystem respira-tion by combining our detailed estimate of foliar respira-tion per unit ground area with previously published valuesof woody, soil and coarse woody debris (CWD) respira-tion, and compared the total to an estimate of eddy fluxnight-time net ecosystem exchange (NEEnight) for the samelocation (Loescher et al. 2003). The eddy flux techniquehas several possible sources of error, including complexcanopies, non-flat topography, still night-time air andbiased air movement, which all can result in a systematicunderestimation of night-time respiration (Baldocchi2003). Consequently, independent estimates of ecosystemrespiration that help constrain estimates of night-timeeffluxes should be extremely useful.
MATERIALS AND METHODS
Study site
La Selva Biological Station is located in the Caribbeanlowlands of northern Costa Rica (elevation 37–150 m,10°20′ N, 83°50′ W). La Selva, classified as tropical wetforest in the Holdridge life-zone system (Hartshorn 1983),has a mean annual rainfall of ~4000 mm, and a mean annualtemperature of 26 °C. This study includes sampling fromwithin La Selva’s 515 ha of old-growth forest. Further infor-mation about the soils and plant communities of La Selva isfound in McDade et al. (1994).
Tower construction and sampling scheme
The tower sampling design and construction were part of alarger project where we sought to characterize canopystructure and function across environmental gradients in atropical rain forest. We constructed an aluminium walk-upscaffolding tower (Upright, Inc., Dublin, Ireland) to the topof the canopy at each of 55 sites in the old-growth forest ofLa Selva Biological Station. See Cavaleri, Oberbauer &Ryan (2006) for site selection details. Towers were con-structed one 1.30 ¥ 1.86 ¥ 1.86 m (L ¥ W ¥ H) section at atime, harvesting all foliage within each section. A cantileverbalcony installed on the top of the tower during harvestingincreased the sample area to a total of 4.56 m2. Towerheights varied from 1.86 m (one section) to 44.64 m (24sections).All harvested foliage was separated by height andplant functional group and measured with a leaf area meter(Li-3100; Li-Cor, Inc., Lincoln, NE, USA). Plant functionalgroups for this study were trees, palms, lianas (woody vines)and herbaceous plants (including herbs, epiphytes, vinesand ferns). All foliar physiology sampling occurred onundamaged foliage accessible from the side of the towerafter each tower was constructed. We dismantled the towerafter all measurements were taken and moved it to thenearest preselected random site. Each tower site wassampled only once, and tower construction and samplingoccurred continuously from June 2003 to June 2005. Photo-synthesis and foliar respiration were sampled from 52 of the55 towers constructed.
Foliar gas exchange, morphology and nutrients
We measured photosynthetic capacity (Amax), foliar respira-tion, foliar nitrogen (N), foliar phosphorus (P) and LMAfor every species accessible from the tower, at every towersection in which the species was found. For each uniquespecies at each unique tower section, Amax was measured insitu, and adjacent foliage segments were flagged for respi-ration sampling. Each flagged foliage segment (two to sixsmall leaves or one large leaf) was cut under water in theafternoon and placed in a water-filled floral tube so that cutsurfaces were never exposed to air. Detached foliagesamples were transported back to the lab for night-timerespiration measurements. Three replicates of Amax and two
replicates of respiration were measured for each uniquespecies at each unique height, and replicates were averagedprior to statistical analyses. These data represent 990 foliarrespiration measurements: two replicate measurementseach of 495 plant samples, representing over 162 species and53 families.
We measured Amax with an open-system portable infraredgas analyser with an integrated blue–red light source insidethe leaf chamber (Li-6400, Li-Cor, Inc.). Measurementswere taken at a constant reference CO2 concentration of390 mmol mol-1 and an air flow of 500 mmol s-1. The photo-synthetic photon flux densities (PPFDs) were determinedas the saturating PPFD values from a photosynthesis/lightcurve on the same species at the same height. SaturatingPPFD values ranged from 500 to 1500 mmol m-2 s-1 atheights <10 m, and from 1000 to 2000 mmol m-2 s-1 forheights >10 m.
Prior to the construction of the first tower, we conducteda pilot study to ensure the validity of measuring respirationon detached foliage. We measured foliar respiration in situon 42 attached samples at night, detached the same samplesthe next afternoon and measured them again on the secondnight. Samples represented three functional groups and 13species: trees (seven species; n = 25), herbaceous (onespecies of vine; n = 4) and palms (five species; n = 13). Arepeated measures analysis of variance (anova) with func-tional group as a factor and attached–detached as thewithin-subjects factor showed no effect of detachment(d.f. = 39; P = 0.24). Several additional studies have alsofound no difference between respiration rates on attachedversus detached foliage (Bolstad et al. 1999; Mitchell et al.1999; Turnbull et al. 2005).
We measured night-time foliar respiration with LCA-3and LCA-4 open-system infrared gas analysers (AnalyticalDevelopment Company, Hoddesdon, UK). We clampedfoliage into a clear polycarbonate custom-made chamberwith a neoprene gasket (internal volume = 1750 mL;12.5 ¥ 28 ¥ 5 cm), with only the stem or petiole protrudingduring measurement. A 9 V battery-operated fan wasinstalled to stir the air inside the chamber. Air flow ratesthrough the chamber ranged from 330 to 340 mmol s-1, andchamber seals were checked with a flowmeter. Intake airwas drawn through a 19 L mixing chamber to maintainstable reference CO2 concentrations. We recorded the dif-ference in CO2 concentration between the reference andthe chamber after it had been stable for at least 2 min.Respiration measurements were taken in the dark between1900 and 0500 h at ambient temperature. Foliage tempera-ture was measured with a thermocouple thermometer. Allfoliage that was inside the chamber was measured with aleaf area meter (Li-3100; Li-Cor, Inc.) to determine respi-ration rates per unit leaf area. Foliage was dried to constantweight at 60 °C to calculate LMA (g m-2).
For a subsample of nine towers, we measured foliarrespiration–temperature response curves on all acces-sible species ¥ height combinations, excluding understoryspecies. Respiration–temperature response data includedtwo replications each of 31 tree samples (19 species), 13
liana samples (six species), eight palm samples (fourspecies) and one species from each of the herbaceousgroups: fern, epiphyte and vine. A temperature-controlledcuvette with a peltier cell was attached to the LCA-3 infra-red gas analyser to measure response curves (Hubbard,Ryan & Lukens 1995). A datalogger- (Campbell 21X;Campbell Scientific, Logan, UT, USA) controlled tempera-ture and logged foliar respiration rates over the tempera-tures 15, 25, 30 and 35 °C. The intake air passed through atube of CaSO4 desiccant (Drierite, Xenia, OH, USA) tominimize condensation at the lower temperatures. Tocorrect for the desiccant effect on CO2 flow, we took areading with no leaf in the chamber before and after eachtemperature curve and linearly interpolated between thesetwo ‘zero’ points to calculate a zero for each measurementof the temperature curve.
Replicates of foliage samples measured for respirationand respiration–temperature response were bulked fornutrient analyses and ground in a Wiley mill with 20-meshsieve. We analysed foliar samples for N concentrationwith a LECO TruSpec CN Determinator, (LECO, Inc., St.Joseph, MI, USA). Foliar P concentrations were determinedwith nitric acid/hydrogen peroxide digests and an induc-tively coupled plasma spectrometer (PerkinElmer 4300Optima Dual View, Norwalk, CT, USA) by MDS HarrisLaboratories, Lincoln, NE, USA.
Soil nutrient sampling
At each site, we sampled soil to a depth of 1 m with a0.03-m-diameter half-core auger. Two subsamples weretaken at a distance of 1 m from the tower base centre and ata 180° angle from each other. Six to eight additional sub-samples were taken at a distance of 2 m from the tower basecentre at regularly spaced angles. Each subsample was sepa-rated into four layers by depth: 0–0.1, 0.1–0.3, 0.3–0.5 and0.5–1 m.All subsamples for each tower were mixed by layerand organic material, and stones removed. Samples wereair-dried, sieved through a 2 mm screen, ground in a coffeemill and stored until nutrient analysis. Samples were oven-dried at 40 °C for 2–3 d, and 20 g of each sample was finelyground in an agate mill (Fritsch, Idar-Oberstein, Germany).Total N (mg g-1) was analysed by combustion with a C/N-Analyzer (CHN-O-RAPID, Heraeus, Hanau, Germany),and total P (mg g-1) was analysed with a HNO3-pressureextraction and inductively coupled plasma spectrometry(ICP Spectro, Kleve, Germany). Stocks of N and P (mg ha-1)for each soil layer were calculated using the mean bulkdensity of each layer (0.67, 0.79, 0.85 and 0.89 g cm-3, respec-tively, at depths 0–0.1, 0.1–0.3, 0.3–0.5 and 0.5–1 m), mea-sured from six permanent plots within the old-growth forestof La Selva Biological Station (Clark, unpublished data). Nand P stocks for each layer were summed for cumulative soilN and P stocks by tower.
Data analysis
We used the following equation to model each respirationtemperature response curve:
where b0 and b1 are model parameters, and RTleaf is respira-tion rate (mmol CO2 m-2 s-1) at the measured foliage tem-perature, Tleaf (°C). Q10, the change in respiration rate with10 °C change in temperature, is defined as exp(10 ¥ b1). Wealso modelled each respiration temperature response curvewith a modified Arrhenius function described by Lloyd &Taylor (1994), shown as follows for a base temperature of25 °C or 298K:
R RER T
ATleafg leaf
= × ⎛⎝⎜
⎞⎠⎟
−⎛⎝⎜
⎞⎠⎟
⎡⎣⎢
⎤⎦⎥
⎧⎨⎩
⎫⎬⎭
exp 0 1298
1(2)
where Rg is the gas constant (0.008314 kJ mol-1 K-1), and E0
(kJ mol-1 K-1) is a parameter which describes the magni-tude of temperature response, described as the energy ofactivation.We examined variation in Q10 and E0 with simplelinear regression (RA, LMA, foliar N, foliar P, soil N, soil Pand height), analysis of covariance (ancova) (functionalgroup + height) and anova (functional group) procedures.Based on the results of these analyses, we used functionalgroup-specific Q10 values to standardize respiration ratesto a base temperature of 25 °C. For all further statisticalanalyses, we corrected respiration rates to 25 °C using:
RR
Q TATleaf
leaf= −( )
1025 10 (3)
Mass-based respiration rates at 25 °C (RM: nmol g-1 s-1)were calculated with LMA (g m-2) for each leaf. For botharea- and mass-based measurements, we used simple linearregressions to analyse variation in foliar respiration withLMA and foliar nutrients. In further analyses, we did notuse slopes of these regressions to determine respiration perunit nitrogen (R/N: mmol g-1 N s-1) or respiration per unitphosphorus (R/P: mmol g-1 P s-1), because the area- andmass-based slopes differed. Instead, we calculated R/N andR/P for each individual sample, which is the same valuewhether using mass- or area-based measurements (LMAcancels out). The Amax versus RA relationship was modelledwith a non-linear rectangular hyperbola.
We used ancova procedures to model RA, RM, R/N, R/Pand Amax/RA (Table 1) with the following predictor vari-ables: canopy height (m), soil N (mg ha-1), soil P (mg ha-1)and functional group (trees, lianas, palms and herbaceousgroups). All statistical analyses were performed with SASversion 9.1 (SAS Institute, Inc., Cary, NC, USA), witha = 0.05.
Estimating foliar respiration per unit groundarea and ecosystem respiration
We compared six estimates of foliar respiration per unitground area (Rfoliar) using two complex and four simplermethods of extrapolation (Table 2). For estimates 1 and 2,we used half-hourly temperature data (Loescher et al.
2003) from 1999, a ‘normal’ year, and 1998, a strong ElNiño Southern Oscillation (ENSO) year (Table 2). Usingfunctional-group-specific Q10 values, we calculated meandeviations from respiration rates at 25 °C (RTair/RA) for eachplant functional group in each year. We multiplied thesemean deviations by mean RA values and LAI stratified bythe corresponding height and functional group (data notshown), and summed over categories to obtain a value perunit ground area (Rfoliar; mmol CO2 m-2
ground s-1).Rfoliar estimates 3–6 were simpler because they were
neither extrapolated using within-canopy variability ofrespiration, nor modelled with actual temperature data
Table 1. Abbreviations used and their description
Variable Description Units
Amax Photosynthetic capacity mmol CO2 m-2 s-1
Amax/RA The ratio of Amax to RA UnitlessE0 Energy of activation kJ mol-1 K-1
CWD Coarse woody debris –LAI Leaf area index, leaf area per
unit ground aream2 m-2
ground
LMA Leaf mass per unit leaf area g m-2
NEEnight Night-time net ecosystemexchange from eddy flux*
mmol CO2 m-2ground s-1
NA Foliar N per unit leaf area g m-2
NM Foliar N per unit leaf mass mg g-1
Ntot Total mass of foliar N per unitground area
g m-2ground
PA Foliar P per unit leaf area g m-2
PM Foliar P per unit leaf mass mg g-1
Q10 Change in respiration with10 °C change in temperature
Unitless
RTleaf Foliar respiration rate at Tleaf mmol CO2 m-2 s-1
RTa Foliar respiration rate at Ta mmol CO2 m-2 s-1
RA Foliar respiration per unit leafarea at 25 °C
mmol CO2 m-2 s-1
RM Foliar respiration per unit leafmass at 25 °C
nmol CO2 g-1 s-1
R/N Foliar respiration at 25 °C perunit mass of foliar N
mmol CO2 g-1 N s-1
R/P Foliar respiration at 25 °C perunit mass of foliar P
mmol CO2 g-1 P s-1
Reco Ecosystem respiration per unitground area
mmol CO2 m-2ground s-1
Rfoliar Foliar respiration per unitground area
mmol CO2 m-2ground s-1
Rsoil Soil respiration per unitground area†
mmol CO2 m-2ground s-1
Rwoody Woody respiration per unitground area‡
mmol CO2 m-2ground s-1
RCWD Coarse woody debrisrespiration per unit groundarea§
mmol CO2 m-2ground s-1
Ta Above-canopy temperature atnight
°C or K
Tleaf Leaf temperature at time ofmeasurement
°C or K
*Data from Loescher et al. (2003).†Data from Schwendenmann et al. (2003).‡Data from Cavaleri et al. (2006).§Data from Clark et al. (2002).
(all respiration measurements were corrected to 25 °C;Table 2). Estimate 3 was calculated by multiplying theoverall tower mean and standard error of LAI(6.03 � 0.32 m2 m-2
ground; n = 45) by the overall sample meanand standard error of RA (0.59 � 0.02 mmol CO2 m-2 s-1;n = 495). Estimates 4–6 were each calculated by multiplyingthe overall tower mean and standard error of total N perunit ground area (Ntot = 11.62 � 0.65 g N m-2
ground; n = 45),by three different estimates of R/N and their correspondingstandard errors. For estimate 4, we used the overall samplemean of R/N (0.32 � 0.01 mmol CO2 g-1 N s-1; n = 495). Forestimate 5, we used the slope of the regression betweenRA and NA (0.34 � 0.02 mmol CO2 g-1 N s-1; Fig. 2a), and forestimate 6, we used the slope of the regression betweenRM and NM (0.10 � 0.03 mmol CO2 g-1 N s-1; Fig. 2d). Forestimates 4–6, Ntot was calculated for each tower bysumming: [total LAI (m2 m-2
ground) ¥ mean LMA (g m-2) ¥mean NM (g g-1)] for each functional group in each towersection. All additive and multiplicative errors in this studywere calculated as per Mood, Greybill & Boes (1974). Forexample, when two or more means (X and Y) with standarderrors of the mean (SEMx and SEMy) were added yieldingthe value Z; the standard error of Z was calculated asfollows:
SEM SEM SEMZ X Y= ( ) + ( )2 2(4)
and if X and Y were multiplied, the resulting standard errorof Z was calculated as follows:
SEMSEM SEM
ZX YZ
X Y= ×
( )+
( )2 2
(5)
We estimated ecosystem respiration for the forest (Reco)by adding our best estimate of Rfoliar to published estimatesof woody respiration (Rwoody), soil respiration (Rsoil) andCWD respiration (RCWD) from the old-growth rain forest ofLa Selva Biological Station. Cavaleri et al. (2006) reportedRwoody as 1.34 � 0.36 mmol CO2 m-2
ground s-1, based on
extrapolated chamber measurements. To estimate RCWD, wedivided published values of downed CWD total carbonbiomass (22.3 � 2.7 mg C ha-1), by turnover time (9 years)(Clark et al. 2002), and converted units to yield0.66 � 0.05 mmol CO2 m-2
ground s-1. For Rsoil, we used soilCO2 efflux data from plots located in the same soil type asthe eddy flux tower (Schwendenmann et al. 2003). We cal-culated the mean � 1 standard error of six soil chambermeasurement plot averages (3 plots ¥ 2 years) and con-verted units for a value of 3.88 � 0.22 mmol CO2 m-2
ground s-1
(Schwendenmann et al. 2003).We compared the summed value of ecosystem res-
piration to eddy flux night-time net ecosystem exchange(NEEnight) for the same forest: 7.05 � 0.69 mmol CO2 m-2 s-1
(Loescher et al. 2003). This NEEnight estimate was based ondata for turbulent nights only, when friction velocity (u*)was greater than 0.4 m s-1 (Loescher et al. 2003).
RESULTS
Temperature response
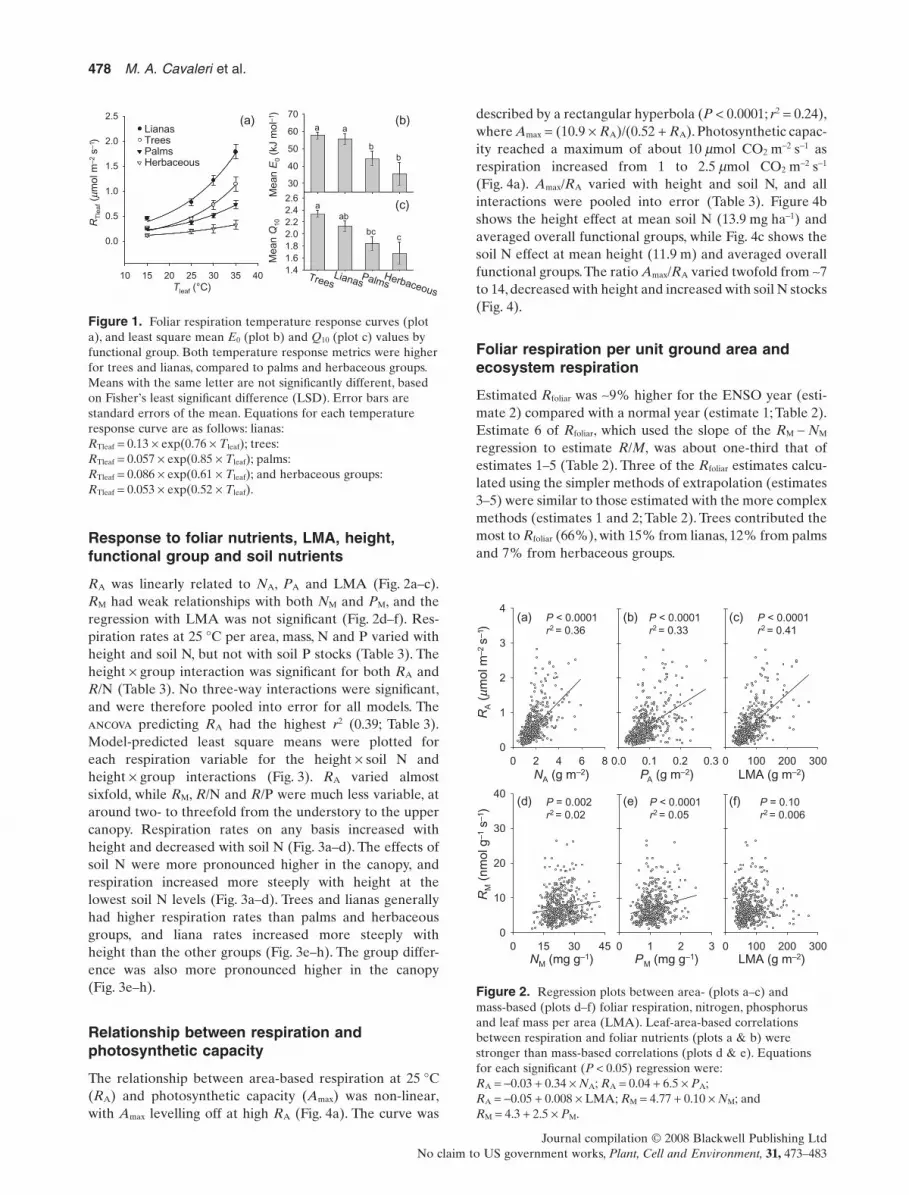
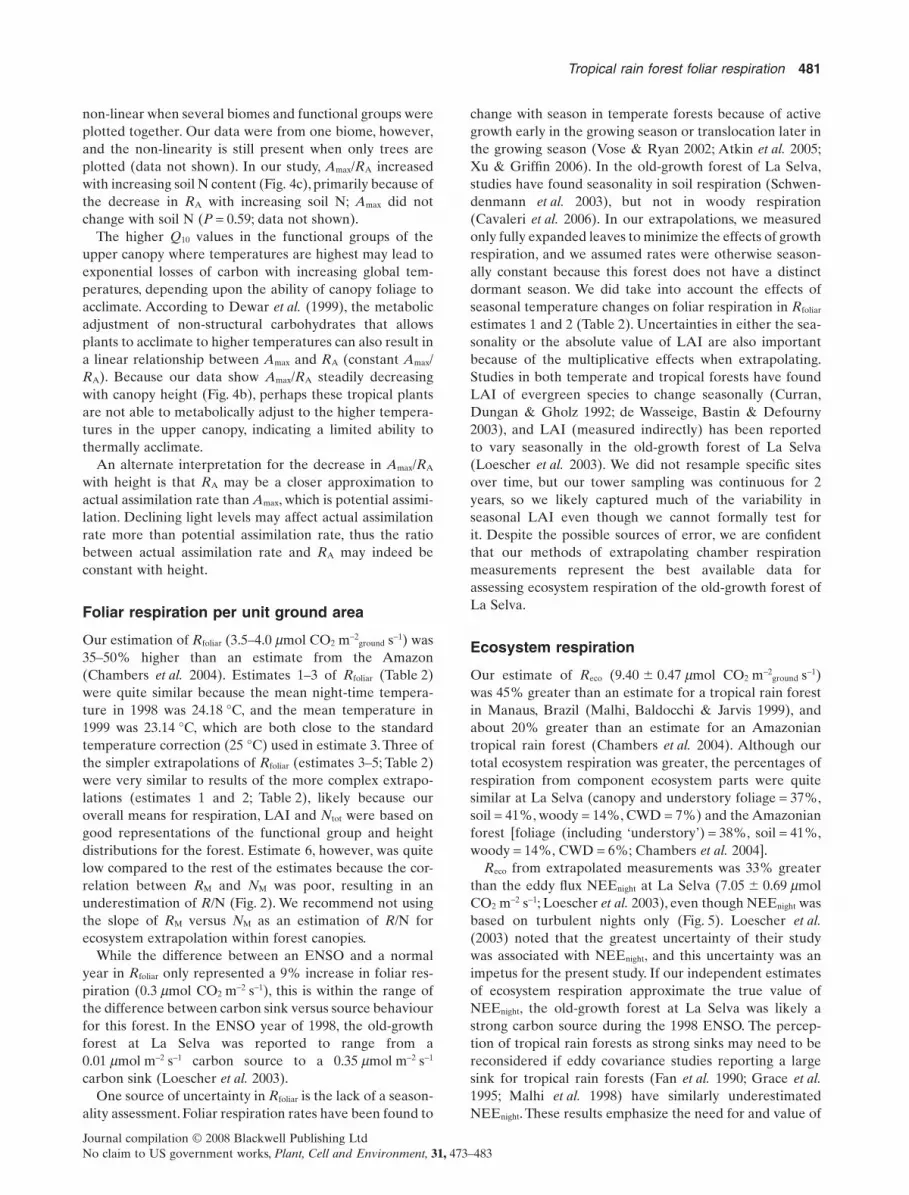
Regression, anova and ancova results showed that neitherQ10 nor E0 showed any relationships with soil nutrients,LMA, respiration at 25 °C or foliar nutrients per unit leafmass or area. Both Q10 and E0 varied with height (P < 0.01),but the differences were caused by the distribution of func-tional groups with height. Functional group explained 56%of the variability in both Q10 and E0, and the addition ofheight to the models improved the r2 by less than 1% inboth cases. Although liana respiration rates were highest,trees showed the largest response with temperature(Fig. 1a), and both Q10 and E0 varied similarly among func-tional groups (Fig. 1b,c). For all further analyses, respirationrates per unit area (RA) and mass (RM) were standardized to25 °C using a different Q10 value for each plant functionalgroup. Mean Q10 values were: herbaceous = 1.7, palm = 1.8,liana = 2.1 and tree = 2.3 (Fig. 1c) Mean E0 values for eachgroup were: herbaceous = 35.5, palm = 44.4, liana = 55.6 andtree = 57.7 kJ mol-1 (Fig. 1b).
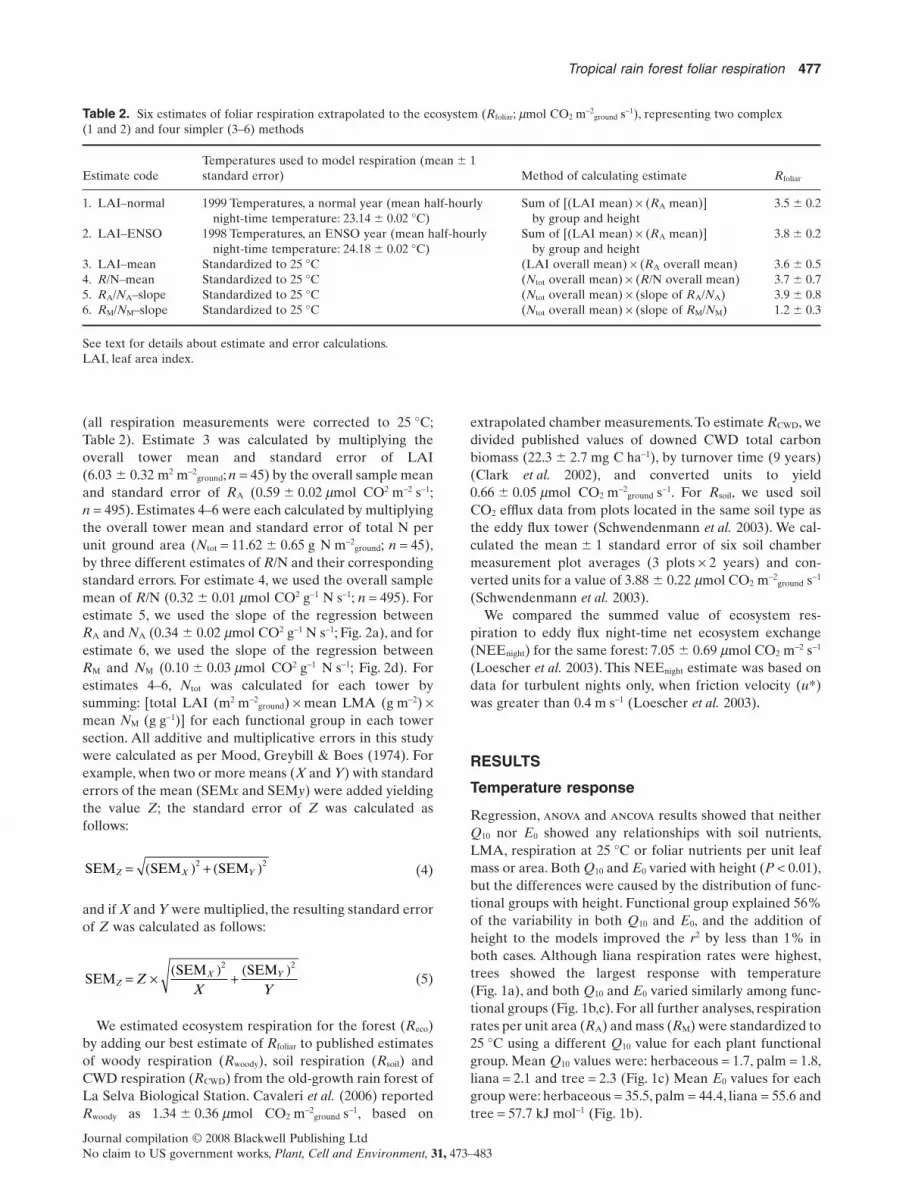
Table 2. Six estimates of foliar respiration extrapolated to the ecosystem (Rfoliar; mmol CO2 m-2ground s-1), representing two complex
(1 and 2) and four simpler (3–6) methods
Estimate codeTemperatures used to model respiration (mean � 1standard error) Method of calculating estimate Rfoliar
1. LAI–normal 1999 Temperatures, a normal year (mean half-hourlynight-time temperature: 23.14 � 0.02 °C)
Sum of [(LAI mean) ¥ (RA mean)]by group and height
3.5 � 0.2
2. LAI–ENSO 1998 Temperatures, an ENSO year (mean half-hourlynight-time temperature: 24.18 � 0.02 °C)
Sum of [(LAI mean) ¥ (RA mean)]by group and height
3.8 � 0.2
3. LAI–mean Standardized to 25 °C (LAI overall mean) ¥ (RA overall mean) 3.6 � 0.54. R/N–mean Standardized to 25 °C (Ntot overall mean) ¥ (R/N overall mean) 3.7 � 0.75. RA/NA–slope Standardized to 25 °C (Ntot overall mean) ¥ (slope of RA/NA) 3.9 � 0.86. RM/NM–slope Standardized to 25 °C (Ntot overall mean) ¥ (slope of RM/NM) 1.2 � 0.3
See text for details about estimate and error calculations.LAI, leaf area index.
Response to foliar nutrients, LMA, height,functional group and soil nutrients
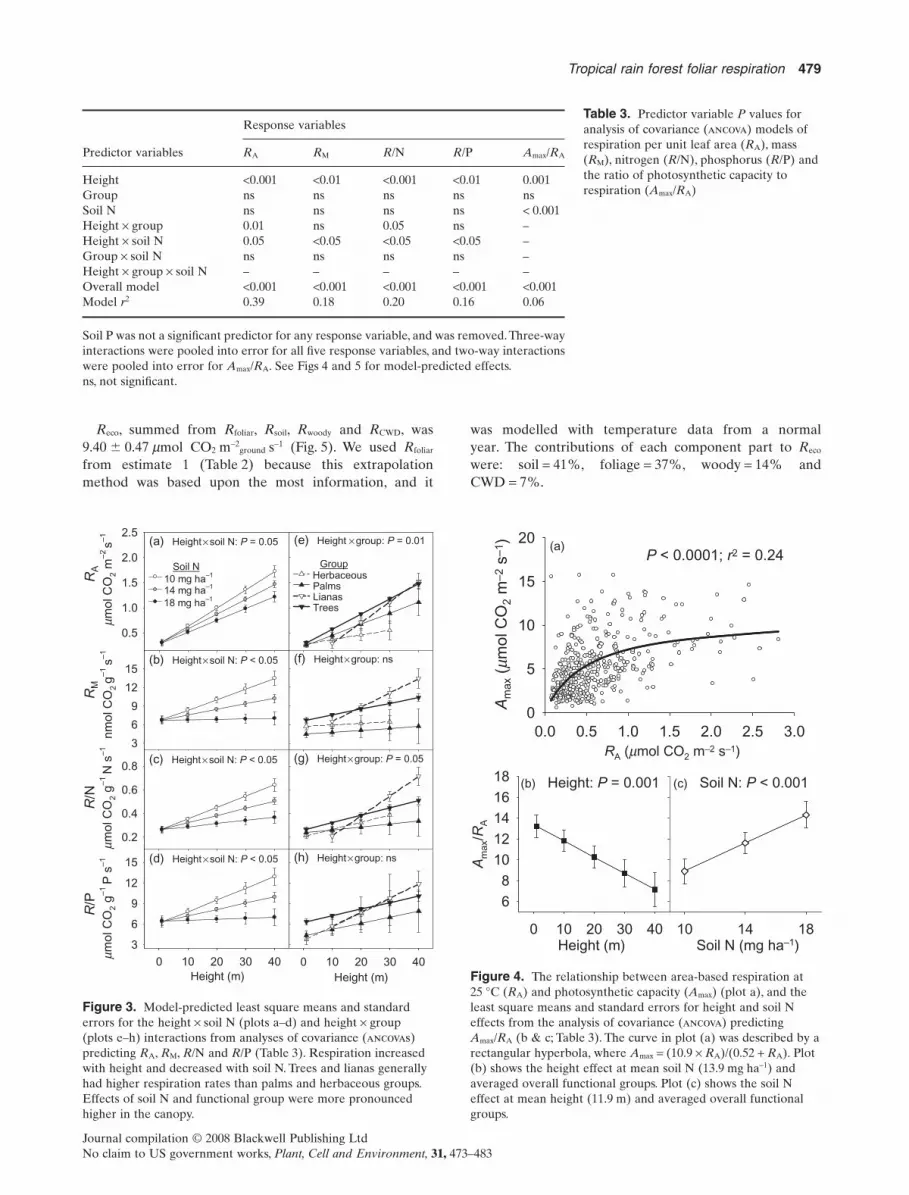
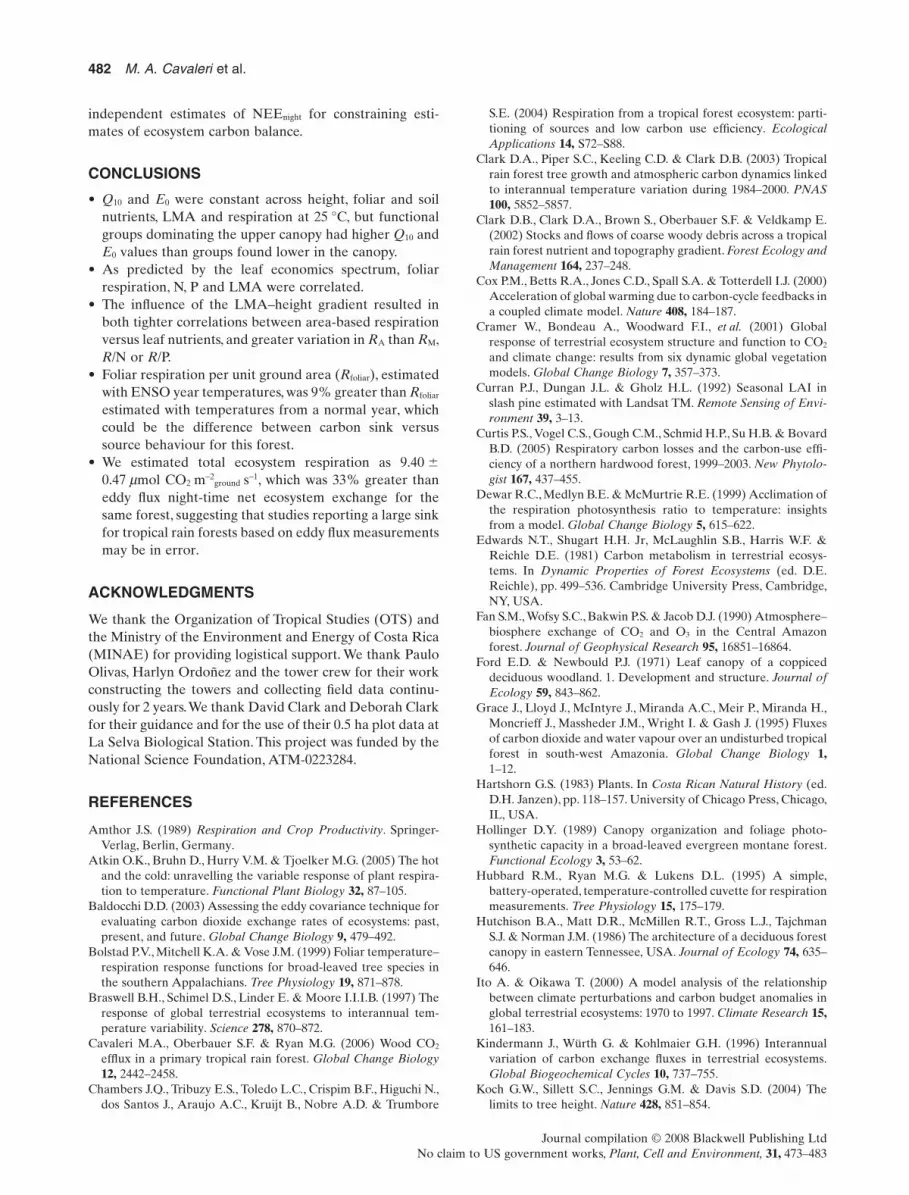
RA was linearly related to NA, PA and LMA (Fig. 2a–c).RM had weak relationships with both NM and PM, and theregression with LMA was not significant (Fig. 2d–f). Res-piration rates at 25 °C per area, mass, N and P varied withheight and soil N, but not with soil P stocks (Table 3). Theheight ¥ group interaction was significant for both RA andR/N (Table 3). No three-way interactions were significant,and were therefore pooled into error for all models. Theancova predicting RA had the highest r2 (0.39; Table 3).Model-predicted least square means were plotted foreach respiration variable for the height ¥ soil N andheight ¥ group interactions (Fig. 3). RA varied almostsixfold, while RM, R/N and R/P were much less variable, ataround two- to threefold from the understory to the uppercanopy. Respiration rates on any basis increased withheight and decreased with soil N (Fig. 3a–d). The effects ofsoil N were more pronounced higher in the canopy, andrespiration increased more steeply with height at thelowest soil N levels (Fig. 3a–d). Trees and lianas generallyhad higher respiration rates than palms and herbaceousgroups, and liana rates increased more steeply withheight than the other groups (Fig. 3e–h). The group differ-ence was also more pronounced higher in the canopy(Fig. 3e–h).
Relationship between respiration andphotosynthetic capacity
The relationship between area-based respiration at 25 °C(RA) and photosynthetic capacity (Amax) was non-linear,with Amax levelling off at high RA (Fig. 4a). The curve was
described by a rectangular hyperbola (P < 0.0001; r2 = 0.24),where Amax = (10.9 ¥ RA)/(0.52 + RA). Photosynthetic capac-ity reached a maximum of about 10 mmol CO2 m-2 s-1 asrespiration increased from 1 to 2.5 mmol CO2 m-2 s-1
(Fig. 4a). Amax/RA varied with height and soil N, and allinteractions were pooled into error (Table 3). Figure 4bshows the height effect at mean soil N (13.9 mg ha-1) andaveraged overall functional groups, while Fig. 4c shows thesoil N effect at mean height (11.9 m) and averaged overallfunctional groups.The ratio Amax/RA varied twofold from ~7to 14, decreased with height and increased with soil N stocks(Fig. 4).
Foliar respiration per unit ground area andecosystem respiration
Estimated Rfoliar was ~9% higher for the ENSO year (esti-mate 2) compared with a normal year (estimate 1; Table 2).Estimate 6 of Rfoliar, which used the slope of the RM - NM
regression to estimate R/M, was about one-third that ofestimates 1–5 (Table 2). Three of the Rfoliar estimates calcu-lated using the simpler methods of extrapolation (estimates3–5) were similar to those estimated with the more complexmethods (estimates 1 and 2; Table 2). Trees contributed themost to Rfoliar (66%), with 15% from lianas, 12% from palmsand 7% from herbaceous groups.
Herbaceous
Trees10 15 20 25 30 35 40
0.0
0.5
1.0
1.5
2.0
2.5
1.4
1.6
1.8
2.0
2.2
2.4
2.6
30
40
50
60
70
Me
an E
0(k
J m
ol–
1 )
a a
b
PalmsLianas
(b)
(c)
b
a
ab
cbc
Me
an Q
10
(a)
RT
lea
f(m
mo
l m
s–1
–2
)
Tleaf (°C)
LianasTreesPalmsHerbaceous
Figure 1. Foliar respiration temperature response curves (plota), and least square mean E0 (plot b) and Q10 (plot c) values byfunctional group. Both temperature response metrics were higherfor trees and lianas, compared to palms and herbaceous groups.Means with the same letter are not significantly different, basedon Fisher’s least significant difference (LSD). Error bars arestandard errors of the mean. Equations for each temperatureresponse curve are as follows: lianas:RTleaf = 0.13 ¥ exp(0.76 ¥ Tleaf); trees:RTleaf = 0.057 ¥ exp(0.85 ¥ Tleaf); palms:RTleaf = 0.086 ¥ exp(0.61 ¥ Tleaf); and herbaceous groups:RTleaf = 0.053 ¥ exp(0.52 ¥ Tleaf).
0 2 4 6 8
0
1
2
3
4
0.0 0.1 0.2 0.3
0 15 30 45
0
10
20
30
40
0 1 2 3 0 100 200 300
0 100 200 300
P < 0.0001r2 = 0.33
RA
(mm
ol m
–2s
–1 )
RM
(nm
ol g
–1
s–
1)
NA (g m–2) (g m–2)PA LMA (g m–2)
NM (mg g–1) PM (mg g–1)
(a) (b) (c)
(d) (e) (f)
P < 0.0001r2 = 0.36
P < 0.0001r2 = 0.41
P = 0.002 r2 = 0.02
P < 0.0001 r2 = 0.05
P = 0.10r2 = 0.006
LMA (g m–2)
Figure 2. Regression plots between area- (plots a–c) andmass-based (plots d–f) foliar respiration, nitrogen, phosphorusand leaf mass per area (LMA). Leaf-area-based correlationsbetween respiration and foliar nutrients (plots a & b) werestronger than mass-based correlations (plots d & e). Equationsfor each significant (P < 0.05) regression were:RA = -0.03 + 0.34 ¥ NA; RA = 0.04 + 6.5 ¥ PA;RA = -0.05 + 0.008 ¥ LMA; RM = 4.77 + 0.10 ¥ NM; andRM = 4.3 + 2.5 ¥ PM.
Table 3. Predictor variable P values foranalysis of covariance (ancova) models ofrespiration per unit leaf area (RA), mass(RM), nitrogen (R/N), phosphorus (R/P) andthe ratio of photosynthetic capacity torespiration (Amax/RA)
Predictor variables
Response variables
RA RM R/N R/P Amax/RA
Height <0.001 <0.01 <0.001 <0.01 0.001Group ns ns ns ns nsSoil N ns ns ns ns < 0.001Height ¥ group 0.01 ns 0.05 ns –Height ¥ soil N 0.05 <0.05 <0.05 <0.05 –Group ¥ soil N ns ns ns ns –Height ¥ group ¥ soil N – – – – –Overall model <0.001 <0.001 <0.001 <0.001 <0.001Model r2 0.39 0.18 0.20 0.16 0.06
Soil P was not a significant predictor for any response variable, and was removed.Three-wayinteractions were pooled into error for all five response variables, and two-way interactionswere pooled into error for Amax/RA. See Figs 4 and 5 for model-predicted effects.ns, not significant.
(h) Height × group: ns
Height (m)
0 10 20 30 40
(g) Height × group: P = 0.05
(f) Height × group: ns
(e) Height × group: P = 0.01
(d) Height × soil N: P < 0.05
Height (m)
0 10 20 30 40
m mo
l C
O2 g
–1
P s
–1
3
6
9
12
15
(c) Height × soil N: P < 0.05
m mo
l C
O2 g
–1
N s
–1
0.2
0.4
0.6
0.8
(b) Height × soil N: P < 0.05
nm
ol C
O2 g
–1
s–
1
3
6
9
12
15
(a) Height × soil N: P = 0.05
m mo
l C
O2 m
–2s
–1
0.5
1.0
1.5
2.0
2.5
10 mg ha–1
14 mg ha–1
18 mg ha–1
Soil NHerbaceousPalmsLianasTrees
Group
RM
R/P
R/N
RA
Figure 3. Model-predicted least square means and standarderrors for the height ¥ soil N (plots a–d) and height ¥ group(plots e–h) interactions from analyses of covariance (ancovas)predicting RA, RM, R/N and R/P (Table 3). Respiration increasedwith height and decreased with soil N. Trees and lianas generallyhad higher respiration rates than palms and herbaceous groups.Effects of soil N and functional group were more pronouncedhigher in the canopy.
0.0 0.5 1.0 1.5 2.0 2.5 3.0
0
5
10
15
20
(b) Height: P = 0.001
Height (m)0 10 20 30 40
Am
ax/R
A
6
8
10
12
14
16
18(c) Soil N: P < 0.001
Soil N (mg ha–1)10 14 18
Am
ax
(mm
ol C
O2
m–
2 s
–1)
RA (mmol CO2 m–2 s–1)
P < 0.0001; r2 = 0.24 (a)
Figure 4. The relationship between area-based respiration at25 °C (RA) and photosynthetic capacity (Amax) (plot a), and theleast square means and standard errors for height and soil Neffects from the analysis of covariance (ancova) predictingAmax/RA (b & c; Table 3). The curve in plot (a) was described by arectangular hyperbola, where Amax = (10.9 ¥ RA)/(0.52 + RA). Plot(b) shows the height effect at mean soil N (13.9 mg ha-1) andaveraged overall functional groups. Plot (c) shows the soil Neffect at mean height (11.9 m) and averaged overall functionalgroups.
We found no difference in Q10 or E0 with either height ornutrients, indicating that the primary source of variationin temperature response was genetically controlled differ-ences among species or functional groups, greatly sim-plifying our subsequent modelling and extrapolation proce-dures. Xu & Griffin (2006) also found consistency in E0 withheight which simplified further extrapolation.
As predicted by the leaf economics spectrum, respirationrates were correlated with foliar N, P and LMA. Respirationis linked to photosynthesis, and 90% of plant N is inproteins, with ribulose 1·5-bisphosphate carboxylase/oxygenase (Rubisco) comprising up to half of all plantproteins (Lawlor 1993; Ryan et al. 1996). Phosphorus isnecessary for protein synthesis, nucleic acids, plasmamembranes, ADP phosphorylation and triose phosphateproduction (Amthor 1989; Stitt 1990). In the full verticaltransect of forest canopies, foliar respiration tends to relatebetter to foliar N and P when expressed on a leaf area basisthan a leaf mass basis (Mitchell et al. 1999; Meir et al. 2001;Xu & Griffin 2006), likely as a result of increasing LMAwith height in forest canopies (Ford & Newbould 1971;Hutchison et al. 1986; Oberbauer & Strain 1986; Hollinger1989; Niinemets & Kull 1995; Niinemets & Tenhunen 1997;Meir et al. 2001; Marshall & Monserud 2003; Koch et al.2004). In our data set, LMA also had a strong linear
relationship with height (data not shown), and we believethe changes in LMA within the canopy profile underliethe strong covariance between area-based respiration andleaf nutrients.
Even without the influence of LMA, R/N, R/P and RM, allstill increased with height, and were highest for trees andlianas (which dominate the upper canopy). Higher in thecanopy where light is more abundant, more N and P may beallocated to respiratory and photosynthetic proteins, ratherthan other compounds such as those used in herbivorydefence. Lianas showed the steepest increase in foliar res-piration with height of all the groups (Fig. 3), likely becauselianas rely on neighbouring trees for support. Lianas canallocate increasing resources into metabolic compounds aslight increases, whereas trees still need to allocate energyand nutrients to woody growth (Putz 1983).
Our overall sample mean for R/N was 0.32 mmol CO2 g-1
N s-1 (Fig. 3), which was quite similar to R/N reported forPinus radiata (0.31 mmol CO2 g-1 N s-1 when standardized to25 °C with the reported Q10 of 2.5 (Ryan et al. 1996).A valuereported for boreal and subalpine forests (0.53 mmol CO2 g-1
N s-1 when standardized to 25 °C with the reported Q10 of2.0) was 66% greater than our mean R/N, (Ryan 1995).Within forest canopies, respiration per unit nitrogen (R/N) isoften less variable than RM (Ryan 1995), and the variabilityof respiration per unit phosphorus (R/P) has not been well-studied. Fertilization increased the variability in R/N of P.radiata, either because of an increased variability of theproportion of N in protein,or an increase in the variability inRubisco activation (Ryan et al. 1996).We found R/N,R/P andRM all to be less variable than RA, likely because of theinfluence of the LMA gradient with height on RA.
Both NA and PA explained a similar amount of variationin RA (Fig. 2); therefore, we did not find foliar phosphorusto constrain respiration more strongly than foliar nitrogendid, as Meir et al. (2001) reported in a tropical rain forest inCameroon. Turnbull et al. (2005) found an increase in RA
with soil fertility along a soil chronosequence in NewZealand, but none of the respiratory variables in our studyvaried with soil P, contrary to expectation. In fact, respira-tion decreased with increasing soil N stocks, which is diffi-cult to interpret because respiration and foliar N werepositively correlated. In this forest, it seems that soil N andfoliar N are decoupled; soil N stocks are not related to Ntot,NM or NA (data not shown), supporting the assumption thatnitrogen is not limiting in this system (McDade et al. 1994).
Respiration and photosynthetic capacity
Values of Amax/RA by height and soil N varied from ~7 to 14(Fig. 4), with similar values found in temperate rain forests,deciduous and coniferous forests (Turnbull et al. 2001, 2005;Vose & Ryan 2002).At high values of Amax, leaf metabolismappears to increase at a faster rate than the plant’s ability toassimilate CO2, indicated by the non-linear relationshipbetween RA and Amax (Fig. 4). Reich et al. (1998) found therelationship between RA and Amax to be linear withinbiomes (indicating a constant ratio of Amax/RA), but
0
2
4
6
8
10
12
Extrapolated
measurements
Eddy
flux
Re
co
(mm
ol C
O2
m–2gro
und
s–1)
NEEnight
Rfoliar
Rwood
RCWD
Rsoil
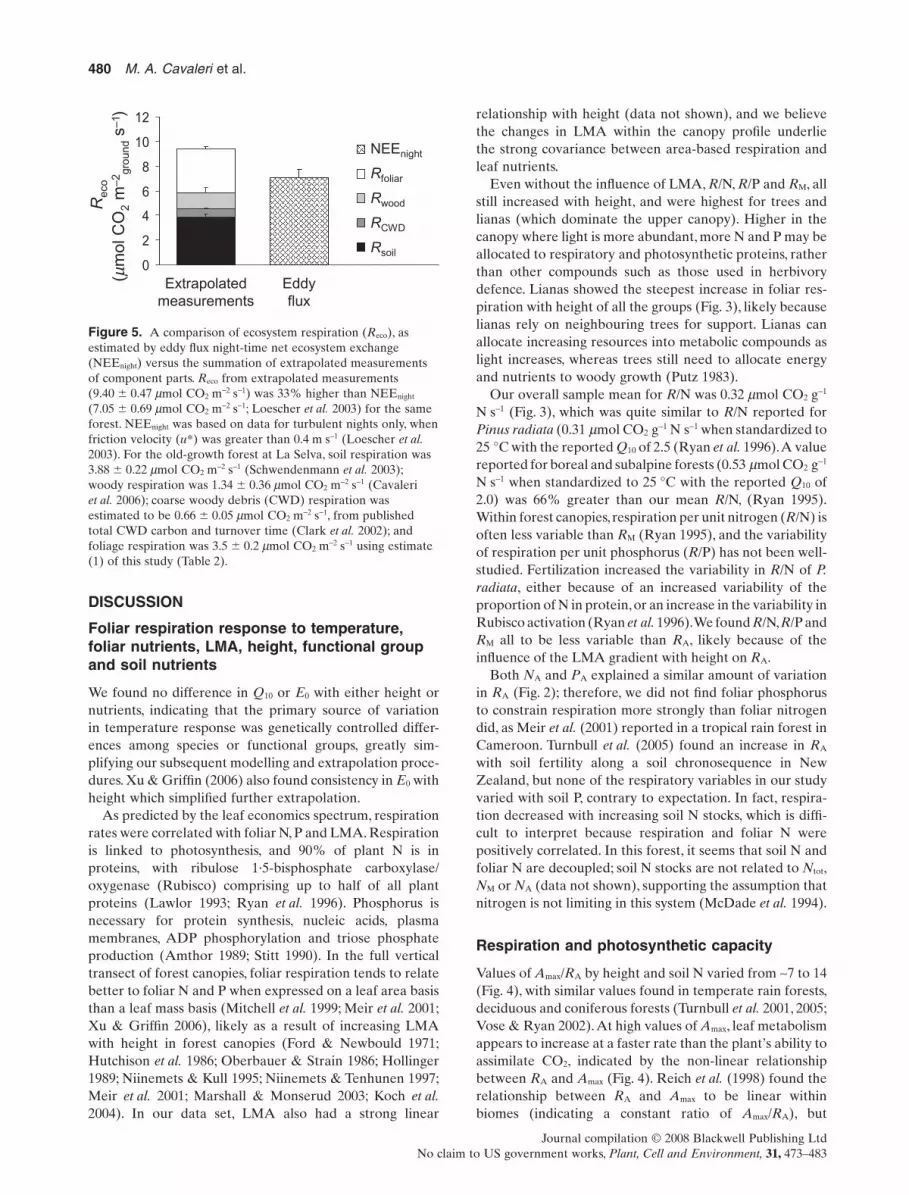
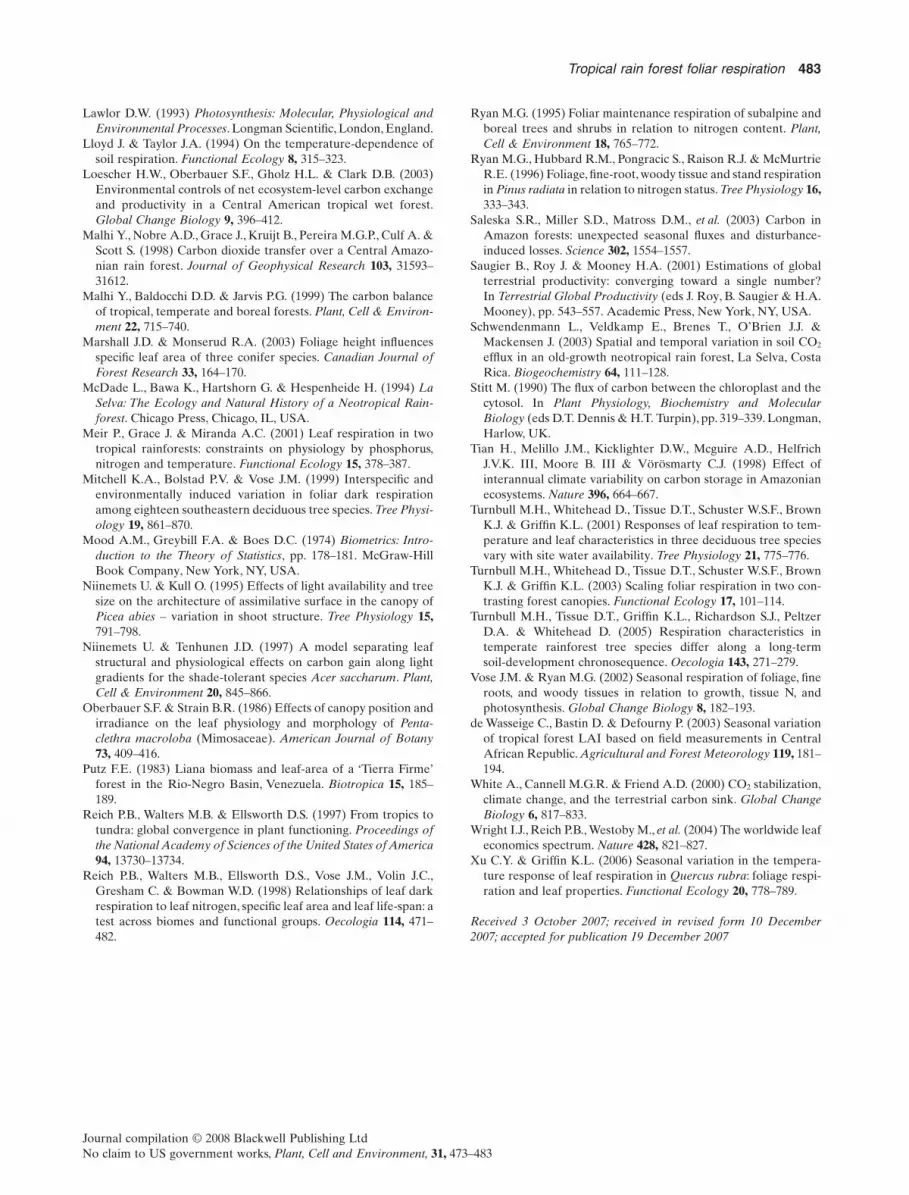
Figure 5. A comparison of ecosystem respiration (Reco), asestimated by eddy flux night-time net ecosystem exchange(NEEnight) versus the summation of extrapolated measurementsof component parts. Reco from extrapolated measurements(9.40 � 0.47 mmol CO2 m-2 s-1) was 33% higher than NEEnight
(7.05 � 0.69 mmol CO2 m-2 s-1; Loescher et al. 2003) for the sameforest. NEEnight was based on data for turbulent nights only, whenfriction velocity (u*) was greater than 0.4 m s-1 (Loescher et al.2003). For the old-growth forest at La Selva, soil respiration was3.88 � 0.22 mmol CO2 m-2 s-1 (Schwendenmann et al. 2003);woody respiration was 1.34 � 0.36 mmol CO2 m-2 s-1 (Cavaleriet al. 2006); coarse woody debris (CWD) respiration wasestimated to be 0.66 � 0.05 mmol CO2 m-2 s-1, from publishedtotal CWD carbon and turnover time (Clark et al. 2002); andfoliage respiration was 3.5 � 0.2 mmol CO2 m-2 s-1 using estimate(1) of this study (Table 2).
non-linear when several biomes and functional groups wereplotted together. Our data were from one biome, however,and the non-linearity is still present when only trees areplotted (data not shown). In our study, Amax/RA increasedwith increasing soil N content (Fig. 4c), primarily because ofthe decrease in RA with increasing soil N; Amax did notchange with soil N (P = 0.59; data not shown).
The higher Q10 values in the functional groups of theupper canopy where temperatures are highest may lead toexponential losses of carbon with increasing global tem-peratures, depending upon the ability of canopy foliage toacclimate. According to Dewar et al. (1999), the metabolicadjustment of non-structural carbohydrates that allowsplants to acclimate to higher temperatures can also result ina linear relationship between Amax and RA (constant Amax/RA). Because our data show Amax/RA steadily decreasingwith canopy height (Fig. 4b), perhaps these tropical plantsare not able to metabolically adjust to the higher tempera-tures in the upper canopy, indicating a limited ability tothermally acclimate.
An alternate interpretation for the decrease in Amax/RA
with height is that RA may be a closer approximation toactual assimilation rate than Amax, which is potential assimi-lation. Declining light levels may affect actual assimilationrate more than potential assimilation rate, thus the ratiobetween actual assimilation rate and RA may indeed beconstant with height.
Foliar respiration per unit ground area
Our estimation of Rfoliar (3.5–4.0 mmol CO2 m-2ground s-1) was
35–50% higher than an estimate from the Amazon(Chambers et al. 2004). Estimates 1–3 of Rfoliar (Table 2)were quite similar because the mean night-time tempera-ture in 1998 was 24.18 °C, and the mean temperature in1999 was 23.14 °C, which are both close to the standardtemperature correction (25 °C) used in estimate 3. Three ofthe simpler extrapolations of Rfoliar (estimates 3–5; Table 2)were very similar to results of the more complex extrapo-lations (estimates 1 and 2; Table 2), likely because ouroverall means for respiration, LAI and Ntot were based ongood representations of the functional group and heightdistributions for the forest. Estimate 6, however, was quitelow compared to the rest of the estimates because the cor-relation between RM and NM was poor, resulting in anunderestimation of R/N (Fig. 2). We recommend not usingthe slope of RM versus NM as an estimation of R/N forecosystem extrapolation within forest canopies.
While the difference between an ENSO and a normalyear in Rfoliar only represented a 9% increase in foliar res-piration (0.3 mmol CO2 m-2 s-1), this is within the range ofthe difference between carbon sink versus source behaviourfor this forest. In the ENSO year of 1998, the old-growthforest at La Selva was reported to range from a0.01 mmol m-2 s-1 carbon source to a 0.35 mmol m-2 s-1
carbon sink (Loescher et al. 2003).One source of uncertainty in Rfoliar is the lack of a season-
ality assessment. Foliar respiration rates have been found to
change with season in temperate forests because of activegrowth early in the growing season or translocation later inthe growing season (Vose & Ryan 2002; Atkin et al. 2005;Xu & Griffin 2006). In the old-growth forest of La Selva,studies have found seasonality in soil respiration (Schwen-denmann et al. 2003), but not in woody respiration(Cavaleri et al. 2006). In our extrapolations, we measuredonly fully expanded leaves to minimize the effects of growthrespiration, and we assumed rates were otherwise season-ally constant because this forest does not have a distinctdormant season. We did take into account the effects ofseasonal temperature changes on foliar respiration in Rfoliar
estimates 1 and 2 (Table 2). Uncertainties in either the sea-sonality or the absolute value of LAI are also importantbecause of the multiplicative effects when extrapolating.Studies in both temperate and tropical forests have foundLAI of evergreen species to change seasonally (Curran,Dungan & Gholz 1992; de Wasseige, Bastin & Defourny2003), and LAI (measured indirectly) has been reportedto vary seasonally in the old-growth forest of La Selva(Loescher et al. 2003). We did not resample specific sitesover time, but our tower sampling was continuous for 2years, so we likely captured much of the variability inseasonal LAI even though we cannot formally test forit. Despite the possible sources of error, we are confidentthat our methods of extrapolating chamber respirationmeasurements represent the best available data forassessing ecosystem respiration of the old-growth forest ofLa Selva.
Ecosystem respiration
Our estimate of Reco (9.40 � 0.47 mmol CO2 m-2ground s-1)
was 45% greater than an estimate for a tropical rain forestin Manaus, Brazil (Malhi, Baldocchi & Jarvis 1999), andabout 20% greater than an estimate for an Amazoniantropical rain forest (Chambers et al. 2004). Although ourtotal ecosystem respiration was greater, the percentages ofrespiration from component ecosystem parts were quitesimilar at La Selva (canopy and understory foliage = 37%,soil = 41%, woody = 14%, CWD = 7%) and the Amazonianforest [foliage (including ‘understory’) = 38%, soil = 41%,woody = 14%, CWD = 6%; Chambers et al. 2004].
Reco from extrapolated measurements was 33% greaterthan the eddy flux NEEnight at La Selva (7.05 � 0.69 mmolCO2 m-2 s-1; Loescher et al. 2003), even though NEEnight wasbased on turbulent nights only (Fig. 5). Loescher et al.(2003) noted that the greatest uncertainty of their studywas associated with NEEnight, and this uncertainty was animpetus for the present study. If our independent estimatesof ecosystem respiration approximate the true value ofNEEnight, the old-growth forest at La Selva was likely astrong carbon source during the 1998 ENSO. The percep-tion of tropical rain forests as strong sinks may need to bereconsidered if eddy covariance studies reporting a largesink for tropical rain forests (Fan et al. 1990; Grace et al.1995; Malhi et al. 1998) have similarly underestimatedNEEnight. These results emphasize the need for and value of
independent estimates of NEEnight for constraining esti-mates of ecosystem carbon balance.
CONCLUSIONS
• Q10 and E0 were constant across height, foliar and soilnutrients, LMA and respiration at 25 °C, but functionalgroups dominating the upper canopy had higher Q10 andE0 values than groups found lower in the canopy.
• As predicted by the leaf economics spectrum, foliarrespiration, N, P and LMA were correlated.
• The influence of the LMA–height gradient resulted inboth tighter correlations between area-based respirationversus leaf nutrients, and greater variation in RA than RM,R/N or R/P.
• Foliar respiration per unit ground area (Rfoliar), estimatedwith ENSO year temperatures, was 9% greater than Rfoliar
estimated with temperatures from a normal year, whichcould be the difference between carbon sink versussource behaviour for this forest.
• We estimated total ecosystem respiration as 9.40 �
0.47 mmol CO2 m-2ground s-1, which was 33% greater than
eddy flux night-time net ecosystem exchange for thesame forest, suggesting that studies reporting a large sinkfor tropical rain forests based on eddy flux measurementsmay be in error.
ACKNOWLEDGMENTS
We thank the Organization of Tropical Studies (OTS) andthe Ministry of the Environment and Energy of Costa Rica(MINAE) for providing logistical support. We thank PauloOlivas, Harlyn Ordoñez and the tower crew for their workconstructing the towers and collecting field data continu-ously for 2 years.We thank David Clark and Deborah Clarkfor their guidance and for the use of their 0.5 ha plot data atLa Selva Biological Station. This project was funded by theNational Science Foundation, ATM-0223284.
REFERENCES
Amthor J.S. (1989) Respiration and Crop Productivity. Springer-Verlag, Berlin, Germany.
Atkin O.K., Bruhn D., Hurry V.M. & Tjoelker M.G. (2005) The hotand the cold: unravelling the variable response of plant respira-tion to temperature. Functional Plant Biology 32, 87–105.
Baldocchi D.D. (2003) Assessing the eddy covariance technique forevaluating carbon dioxide exchange rates of ecosystems: past,present, and future. Global Change Biology 9, 479–492.
Bolstad P.V., Mitchell K.A. & Vose J.M. (1999) Foliar temperature–respiration response functions for broad-leaved tree species inthe southern Appalachians. Tree Physiology 19, 871–878.
Braswell B.H., Schimel D.S., Linder E. & Moore I.I.I.B. (1997) Theresponse of global terrestrial ecosystems to interannual tem-perature variability. Science 278, 870–872.
Cavaleri M.A., Oberbauer S.F. & Ryan M.G. (2006) Wood CO2
efflux in a primary tropical rain forest. Global Change Biology12, 2442–2458.
S.E. (2004) Respiration from a tropical forest ecosystem: parti-tioning of sources and low carbon use efficiency. EcologicalApplications 14, S72–S88.
Clark D.A., Piper S.C., Keeling C.D. & Clark D.B. (2003) Tropicalrain forest tree growth and atmospheric carbon dynamics linkedto interannual temperature variation during 1984–2000. PNAS100, 5852–5857.
Clark D.B., Clark D.A., Brown S., Oberbauer S.F. & Veldkamp E.(2002) Stocks and flows of coarse woody debris across a tropicalrain forest nutrient and topography gradient. Forest Ecology andManagement 164, 237–248.
Cox P.M., Betts R.A., Jones C.D., Spall S.A. & Totterdell I.J. (2000)Acceleration of global warming due to carbon-cycle feedbacks ina coupled climate model. Nature 408, 184–187.
Cramer W., Bondeau A., Woodward F.I., et al. (2001) Globalresponse of terrestrial ecosystem structure and function to CO2
and climate change: results from six dynamic global vegetationmodels. Global Change Biology 7, 357–373.
Curran P.J., Dungan J.L. & Gholz H.L. (1992) Seasonal LAI inslash pine estimated with Landsat TM. Remote Sensing of Envi-ronment 39, 3–13.
Curtis P.S., Vogel C.S., Gough C.M., Schmid H.P., Su H.B. & BovardB.D. (2005) Respiratory carbon losses and the carbon-use effi-ciency of a northern hardwood forest, 1999–2003. New Phytolo-gist 167, 437–455.
Dewar R.C., Medlyn B.E. & McMurtrie R.E. (1999) Acclimation ofthe respiration photosynthesis ratio to temperature: insightsfrom a model. Global Change Biology 5, 615–622.
Edwards N.T., Shugart H.H. Jr, McLaughlin S.B., Harris W.F. &Reichle D.E. (1981) Carbon metabolism in terrestrial ecosys-tems. In Dynamic Properties of Forest Ecosystems (ed. D.E.Reichle), pp. 499–536. Cambridge University Press, Cambridge,NY, USA.
Fan S.M., Wofsy S.C., Bakwin P.S. & Jacob D.J. (1990) Atmosphere–biosphere exchange of CO2 and O3 in the Central Amazonforest. Journal of Geophysical Research 95, 16851–16864.
Ford E.D. & Newbould P.J. (1971) Leaf canopy of a coppiceddeciduous woodland. 1. Development and structure. Journal ofEcology 59, 843–862.
Grace J., Lloyd J., McIntyre J., Miranda A.C., Meir P., Miranda H.,Moncrieff J., Massheder J.M., Wright I. & Gash J. (1995) Fluxesof carbon dioxide and water vapour over an undisturbed tropicalforest in south-west Amazonia. Global Change Biology 1,1–12.
Hartshorn G.S. (1983) Plants. In Costa Rican Natural History (ed.D.H. Janzen), pp. 118–157. University of Chicago Press, Chicago,IL, USA.
Hollinger D.Y. (1989) Canopy organization and foliage photo-synthetic capacity in a broad-leaved evergreen montane forest.Functional Ecology 3, 53–62.
Hubbard R.M., Ryan M.G. & Lukens D.L. (1995) A simple,battery-operated, temperature-controlled cuvette for respirationmeasurements. Tree Physiology 15, 175–179.
Hutchison B.A., Matt D.R., McMillen R.T., Gross L.J., TajchmanS.J. & Norman J.M. (1986) The architecture of a deciduous forestcanopy in eastern Tennessee, USA. Journal of Ecology 74, 635–646.
Ito A. & Oikawa T. (2000) A model analysis of the relationshipbetween climate perturbations and carbon budget anomalies inglobal terrestrial ecosystems: 1970 to 1997. Climate Research 15,161–183.
Kindermann J., Würth G. & Kohlmaier G.H. (1996) Interannualvariation of carbon exchange fluxes in terrestrial ecosystems.Global Biogeochemical Cycles 10, 737–755.
Koch G.W., Sillett S.C., Jennings G.M. & Davis S.D. (2004) Thelimits to tree height. Nature 428, 851–854.
Lloyd J. & Taylor J.A. (1994) On the temperature-dependence ofsoil respiration. Functional Ecology 8, 315–323.
Loescher H.W., Oberbauer S.F., Gholz H.L. & Clark D.B. (2003)Environmental controls of net ecosystem-level carbon exchangeand productivity in a Central American tropical wet forest.Global Change Biology 9, 396–412.
Malhi Y., Nobre A.D., Grace J., Kruijt B., Pereira M.G.P., Culf A. &Scott S. (1998) Carbon dioxide transfer over a Central Amazo-nian rain forest. Journal of Geophysical Research 103, 31593–31612.
Marshall J.D. & Monserud R.A. (2003) Foliage height influencesspecific leaf area of three conifer species. Canadian Journal ofForest Research 33, 164–170.
McDade L., Bawa K., Hartshorn G. & Hespenheide H. (1994) LaSelva: The Ecology and Natural History of a Neotropical Rain-forest. Chicago Press, Chicago, IL, USA.
Meir P., Grace J. & Miranda A.C. (2001) Leaf respiration in twotropical rainforests: constraints on physiology by phosphorus,nitrogen and temperature. Functional Ecology 15, 378–387.
Mitchell K.A., Bolstad P.V. & Vose J.M. (1999) Interspecific andenvironmentally induced variation in foliar dark respirationamong eighteen southeastern deciduous tree species. Tree Physi-ology 19, 861–870.
Mood A.M., Greybill F.A. & Boes D.C. (1974) Biometrics: Intro-duction to the Theory of Statistics, pp. 178–181. McGraw-HillBook Company, New York, NY, USA.
Niinemets U. & Kull O. (1995) Effects of light availability and treesize on the architecture of assimilative surface in the canopy ofPicea abies – variation in shoot structure. Tree Physiology 15,791–798.
Niinemets U. & Tenhunen J.D. (1997) A model separating leafstructural and physiological effects on carbon gain along lightgradients for the shade-tolerant species Acer saccharum. Plant,Cell & Environment 20, 845–866.
Oberbauer S.F. & Strain B.R. (1986) Effects of canopy position andirradiance on the leaf physiology and morphology of Penta-clethra macroloba (Mimosaceae). American Journal of Botany73, 409–416.
Putz F.E. (1983) Liana biomass and leaf-area of a ‘Tierra Firme’forest in the Rio-Negro Basin, Venezuela. Biotropica 15, 185–189.
Reich P.B., Walters M.B. & Ellsworth D.S. (1997) From tropics totundra: global convergence in plant functioning. Proceedings ofthe National Academy of Sciences of the United States of America94, 13730–13734.
Reich P.B., Walters M.B., Ellsworth D.S., Vose J.M., Volin J.C.,Gresham C. & Bowman W.D. (1998) Relationships of leaf darkrespiration to leaf nitrogen, specific leaf area and leaf life-span: atest across biomes and functional groups. Oecologia 114, 471–482.
Ryan M.G. (1995) Foliar maintenance respiration of subalpine andboreal trees and shrubs in relation to nitrogen content. Plant,Cell & Environment 18, 765–772.
Ryan M.G., Hubbard R.M., Pongracic S., Raison R.J. & McMurtrieR.E. (1996) Foliage, fine-root, woody tissue and stand respirationin Pinus radiata in relation to nitrogen status. Tree Physiology 16,333–343.
Saleska S.R., Miller S.D., Matross D.M., et al. (2003) Carbon inAmazon forests: unexpected seasonal fluxes and disturbance-induced losses. Science 302, 1554–1557.
Saugier B., Roy J. & Mooney H.A. (2001) Estimations of globalterrestrial productivity: converging toward a single number?In Terrestrial Global Productivity (eds J. Roy, B. Saugier & H.A.Mooney), pp. 543–557. Academic Press, New York, NY, USA.
Schwendenmann L., Veldkamp E., Brenes T., O’Brien J.J. &Mackensen J. (2003) Spatial and temporal variation in soil CO2
efflux in an old-growth neotropical rain forest, La Selva, CostaRica. Biogeochemistry 64, 111–128.
Stitt M. (1990) The flux of carbon between the chloroplast and thecytosol. In Plant Physiology, Biochemistry and MolecularBiology (eds D.T. Dennis & H.T. Turpin), pp. 319–339. Longman,Harlow, UK.
Tian H., Melillo J.M., Kicklighter D.W., Mcguire A.D., HelfrichJ.V.K. III, Moore B. III & Vörösmarty C.J. (1998) Effect ofinterannual climate variability on carbon storage in Amazonianecosystems. Nature 396, 664–667.
Turnbull M.H., Whitehead D., Tissue D.T., Schuster W.S.F., BrownK.J. & Griffin K.L. (2001) Responses of leaf respiration to tem-perature and leaf characteristics in three deciduous tree speciesvary with site water availability. Tree Physiology 21, 775–776.
Turnbull M.H., Whitehead D., Tissue D.T., Schuster W.S.F., BrownK.J. & Griffin K.L. (2003) Scaling foliar respiration in two con-trasting forest canopies. Functional Ecology 17, 101–114.
Turnbull M.H., Tissue D.T., Griffin K.L., Richardson S.J., PeltzerD.A. & Whitehead D. (2005) Respiration characteristics intemperate rainforest tree species differ along a long-termsoil-development chronosequence. Oecologia 143, 271–279.
Vose J.M. & Ryan M.G. (2002) Seasonal respiration of foliage, fineroots, and woody tissues in relation to growth, tissue N, andphotosynthesis. Global Change Biology 8, 182–193.
de Wasseige C., Bastin D. & Defourny P. (2003) Seasonal variationof tropical forest LAI based on field measurements in CentralAfrican Republic. Agricultural and Forest Meteorology 119, 181–194.
White A., Cannell M.G.R. & Friend A.D. (2000) CO2 stabilization,climate change, and the terrestrial carbon sink. Global ChangeBiology 6, 817–833.
Wright I.J., Reich P.B., Westoby M., et al. (2004) The worldwide leafeconomics spectrum. Nature 428, 821–827.
Xu C.Y. & Griffin K.L. (2006) Seasonal variation in the tempera-ture response of leaf respiration in Quercus rubra: foliage respi-ration and leaf properties. Functional Ecology 20, 778–789.
Received 3 October 2007; received in revised form 10 December2007; accepted for publication 19 December 2007