Rain-induced subsurface airflow and Lisse effect Haipeng Guo, 1 Jiu J. Jiao, 1 and Edwin P. Weeks 2 Received 25 June 2007; revised 8 February 2008; accepted 24 March 2008; published 18 July 2008. [1] Water-level increase after rainfall is usually indicative of rainfall recharge to groundwater. This, however, may not be true if the Lisse effect occurs. This effect represents the water-level increase in a well driven by airflow induced by an advancing wetting front during highly intensive rains. The rainwater, which may behave like a low- permeability lid, seals the ground surface so that the air pressure beneath the wetting front is increased because of air compression due to downward movement of the wetting front. A rapid and substantial rise of the water level in the well screened below water table, which bears no relationship to groundwater recharge, can be induced when various factors such as soil properties and the rain-runoff condition combine favorably. A transient, three-dimensional and variably saturated flow model was employed to study the air and groundwater flows in the soil under rain conditions. The objectives of this paper are two-fold: to evaluate the reliability of the theory of the Lisse effect presented by Weeks to predict its magnitude in modeled situations that mimic the physical complexity of real aquifers, and to conduct parametric studies on the sensitivity of the water-level rise in the well to soil properties and the rain event. The simulation results reveal that the magnitude of the Lisse effect increases with the ponding depth. Soil permeability plays a key role in generating the Lisse effect. The water-level rise in the well is delayed relative to the air-pressure rise in the unsaturated zone when the soil permeability is low, and the maximum water-level rise is less than the maximum air pressure induced by rain infiltration. The simulation also explores the sensitivity of the Lisse effect to the van Genuchten parameters and the water table depth. Citation: Guo, H., J. J. Jiao, and E. P. Weeks (2008), Rain-induced subsurface airflow and Lisse effect, Water Resour. Res., 44, W07409, doi:10.1029/2007WR006294. 1. Introduction [2] Water table fluctuation may induce subsurface airflow [Jiao and Li, 2004] and airflow caused by rain infiltration may induce water table movement [Weeks, 2002]. Water- level increase after rainfall is usually indicative of recharge to groundwater. Some field workers, however, have ob- served fairly large rises in water levels of wells screened below the water table during heavy rainstorms [Bianchi and Haskell, 1966; Meyboom, 1967; Heliotis and Dewitt, 1987], that may bear no relationship to groundwater recharge, but are induced by air compression ahead of the wetting front because the infiltrating water restricts air escape through the wetted zone. This phenomenon was first described by Thal Larsen in 1932 from water-level data in the village of Lisse, Holland [Weeks, 2002]. [3] Bianchi and Haskell [1966] concluded from field observations in an experimental plot that elevated air pressure ahead of the wetting front could cause a visible rise in water level in an observation well before actual recharge, making it difficult to determine when recharge began. Meyboom [1967] observed that the Lisse effect occurred when the water table was at 0.6 or 1 m below land surface in light sandy soils and that the ratio of rainfall to water table rise in the observation well was commonly 1:18. He also noted the water level in the observation well would be reattained commonly within 10 d. Heliotis and Dewitt [1987] recorded about 20 occurrences of the Lisse effect in a lakeshore cedar swamp, and summarized quali- tative criteria to identify the Lisse effect, based on these data. They also conducted laboratory experiments using peat cores to study sensitivity of the Lisse effect to rain intensity and water table depth. However, some important factors that can significantly impact the Lisse effect, such as ponding depth and permeability and air entry pressure of the soil, were not explored. [4] The Lisse effect has been explained as being induced by the compression of air ahead of the wetting front, which forces the water level in the observation well to rise [Meyboom, 1967; Freeze and Cherry , 1979, p. 232; Todd and Mays, 2005, p. 298; Healy and Cook, 2002]. According to this explanation, the increase in water level height can be described as [Weeks, 2002]: DH ¼ P WC m h m ð1Þ 1 Department of Earth Sciences, University of Hong Kong, Hong Kong, China. 2 Denver Federal Center, U.S. Geological Survey, Lakewood, Colorado, USA. Copyright 2008 by the American Geophysical Union. 0043-1397/08/2007WR006294$09.00 W07409 WATER RESOURCES RESEARCH, VOL. 44, W07409, doi:10.1029/2007WR006294, 2008 Click Here for Full Articl e 1 of 9
Transcript
Rain-induced subsurface airflow and Lisse effect
Haipeng Guo,1 Jiu J. Jiao,1 and Edwin P. Weeks2
Received 25 June 2007; revised 8 February 2008; accepted 24 March 2008; published 18 July 2008.
[1] Water-level increase after rainfall is usually indicative of rainfall recharge togroundwater. This, however, may not be true if the Lisse effect occurs. This effectrepresents the water-level increase in a well driven by airflow induced by an advancingwetting front during highly intensive rains. The rainwater, which may behave like a low-permeability lid, seals the ground surface so that the air pressure beneath the wettingfront is increased because of air compression due to downward movement of the wettingfront. A rapid and substantial rise of the water level in the well screened below water table,which bears no relationship to groundwater recharge, can be induced when variousfactors such as soil properties and the rain-runoff condition combine favorably. Atransient, three-dimensional and variably saturated flow model was employed to study theair and groundwater flows in the soil under rain conditions. The objectives of this paperare two-fold: to evaluate the reliability of the theory of the Lisse effect presented byWeeks to predict its magnitude in modeled situations that mimic the physical complexityof real aquifers, and to conduct parametric studies on the sensitivity of the water-level risein the well to soil properties and the rain event. The simulation results reveal that themagnitude of the Lisse effect increases with the ponding depth. Soil permeability plays akey role in generating the Lisse effect. The water-level rise in the well is delayed relative tothe air-pressure rise in the unsaturated zone when the soil permeability is low, and themaximum water-level rise is less than the maximum air pressure induced by raininfiltration. The simulation also explores the sensitivity of the Lisse effect to the vanGenuchten parameters and the water table depth.
Citation: Guo, H., J. J. Jiao, and E. P. Weeks (2008), Rain-induced subsurface airflow and Lisse effect, Water Resour. Res., 44,
W07409, doi:10.1029/2007WR006294.
1. Introduction
[2] Water table fluctuation may induce subsurface airflow[Jiao and Li, 2004] and airflow caused by rain infiltrationmay induce water table movement [Weeks, 2002]. Water-level increase after rainfall is usually indicative of rechargeto groundwater. Some field workers, however, have ob-served fairly large rises in water levels of wells screenedbelow the water table during heavy rainstorms [Bianchi andHaskell, 1966; Meyboom, 1967; Heliotis and Dewitt, 1987],that may bear no relationship to groundwater recharge, butare induced by air compression ahead of the wetting frontbecause the infiltrating water restricts air escape through thewetted zone. This phenomenon was first described by ThalLarsen in 1932 from water-level data in the village of Lisse,Holland [Weeks, 2002].[3] Bianchi and Haskell [1966] concluded from field
observations in an experimental plot that elevated airpressure ahead of the wetting front could cause a visiblerise in water level in an observation well before actual
recharge, making it difficult to determine when rechargebegan. Meyboom [1967] observed that the Lisse effectoccurred when the water table was at 0.6 or 1 m belowland surface in light sandy soils and that the ratio of rainfallto water table rise in the observation well was commonly1:18. He also noted the water level in the observation wellwould be reattained commonly within 10 d. Heliotis andDewitt [1987] recorded about 20 occurrences of the Lisseeffect in a lakeshore cedar swamp, and summarized quali-tative criteria to identify the Lisse effect, based on thesedata. They also conducted laboratory experiments usingpeat cores to study sensitivity of the Lisse effect to rainintensity and water table depth. However, some importantfactors that can significantly impact the Lisse effect, such asponding depth and permeability and air entry pressure ofthe soil, were not explored.[4] The Lisse effect has been explained as being induced
by the compression of air ahead of the wetting front, whichforces the water level in the observation well to rise[Meyboom, 1967; Freeze and Cherry, 1979, p. 232; Toddand Mays, 2005, p. 298; Healy and Cook, 2002]. Accordingto this explanation, the increase in water level height can bedescribed as [Weeks, 2002]:
DH ¼ PWC
m
h�m
� �ð1Þ
1Department of Earth Sciences, University of Hong Kong, Hong Kong,China.
2Denver Federal Center, U.S. Geological Survey, Lakewood, Colorado,USA.
Copyright 2008 by the American Geophysical Union.0043-1397/08/2007WR006294$09.00
W07409
WATER RESOURCES RESEARCH, VOL. 44, W07409, doi:10.1029/2007WR006294, 2008ClickHere
where PWC is atmospheric pressure in the form of watercolumn height, m is the depth of rain penetration, and h isthe distance from land surface to the top of the capillaryfringe. Weeks [2002] explained the Lisse effect morethoroughly by invoking the infiltration theory of Greenand Ampt [1911], which postulates that, during infiltration,the assumed advancing sharp wetting front saturates the soilbehind it as it advances. On the basis of an analysis of thebalance of forces at the wetting front, he concluded that theelevated air pressure ahead of the wetting front was relatedto the effective negative pressure head, Yf, at the wettingfront, i.e., in the absence of ponding, DH = m � Yf, or, inthe presence of ponding, DH = dp + m � yf (Figure 1),where dp is the ponding depth. According to his analysis,the water level rise in the observation well should rangefrom �0.10 to �0.60 m.[5] The buildup of the air pressure between the wetting
front and the original water table is the key cause for theLisse effect. Previous researchers [Free and Palmer, 1940;Horton, 1940; Peck, 1965; Wang et al., 1997] investigatedpossible effects of soil air pressure on infiltration throughlaboratory experiments. They considered several factors,such as the length of the laboratory column, physicalproperties of the soil, and boundary conditions that mightcontribute to the air pressure-time relationship. Linden andDixon [1973] conducted several field experiments to inves-tigate infiltration and water table responses to soil airpressure under border irrigation, and observed that the watertable was depressed at the center of the field and raised nearthe border strip. In addition, infiltration was greater at the
edges than at the center of the field. They suggested the airpressure effects should be included in the soil-water move-ment theory.[6] The first objective of this paper is to evaluate the
reliability of the simple theory of the Lisse effect presentedby Weeks [2002] to predict its magnitude in modeledsituations that mimic the physical complexity of real aqui-fers. A second objective is to conduct parametric studies onthe sensitivity of the water-level rise in the observation wellto soil properties and the rain event. The followingsections describe numerical modeling undertaken to evalu-ate physical processes that control the scale of the Lisseeffect. TOUGH2 [Pruess et al., 1999] was used to obtainthe numerical solutions.
2. Setup of the Numerical Model
2.1. Governing Equations
[7] The mathematical model describing two-phase air-water flow is based on the mass conservation equation[Pruess et al., 1999],
d
dt
ZVn
MkdVn ¼ZGn
Fk � ndGn þZVn
qkdVn: ð2Þ
[8] The integration is over an arbitrary subdomain Vn ofthe flow system, which is bounded by a closed surface Gn.The quantity M appearing in the accumulation term (lefthand side) represents mass per volume, with k labeling themass component of air or water. F denotes mass flux. qdenotes sinks and sources. n is a unit normal vector onsurface element dGn, pointing inward into Vn.[9] The general form of the mass accumulation term in
equation (2) can be written as
Mk ¼ fXb
Sbrb Xkb ð3Þ
[10] The total mass of component k (air or water) isobtained by summing over the fluid phases b (liquid or gas).f is porosity, Sb is the saturation of phase b (i.e., thefraction of pore volume occupied by phase b), rb is thedensity of phase b, and Xb
k is the mass fraction of compo-nent k present in phase b.[11] Advective mass flux of a component (air or water) is
a sum over phases. It can be written as
Fk ¼Xb
X kb Fb ð4Þ
Individual phase fluxes are given by a multiphase version ofDarcy’s law:
Fb ¼ rbub ¼ �kkrbrbmb
rPb � rbg� �
ð5Þ
[12] Here ub is the Darcy velocity (volume flux) in phaseb; k is absolute permeability; krb is relative permeability tophase b; mb is viscosity; Pb is the fluid pressure in phase b;
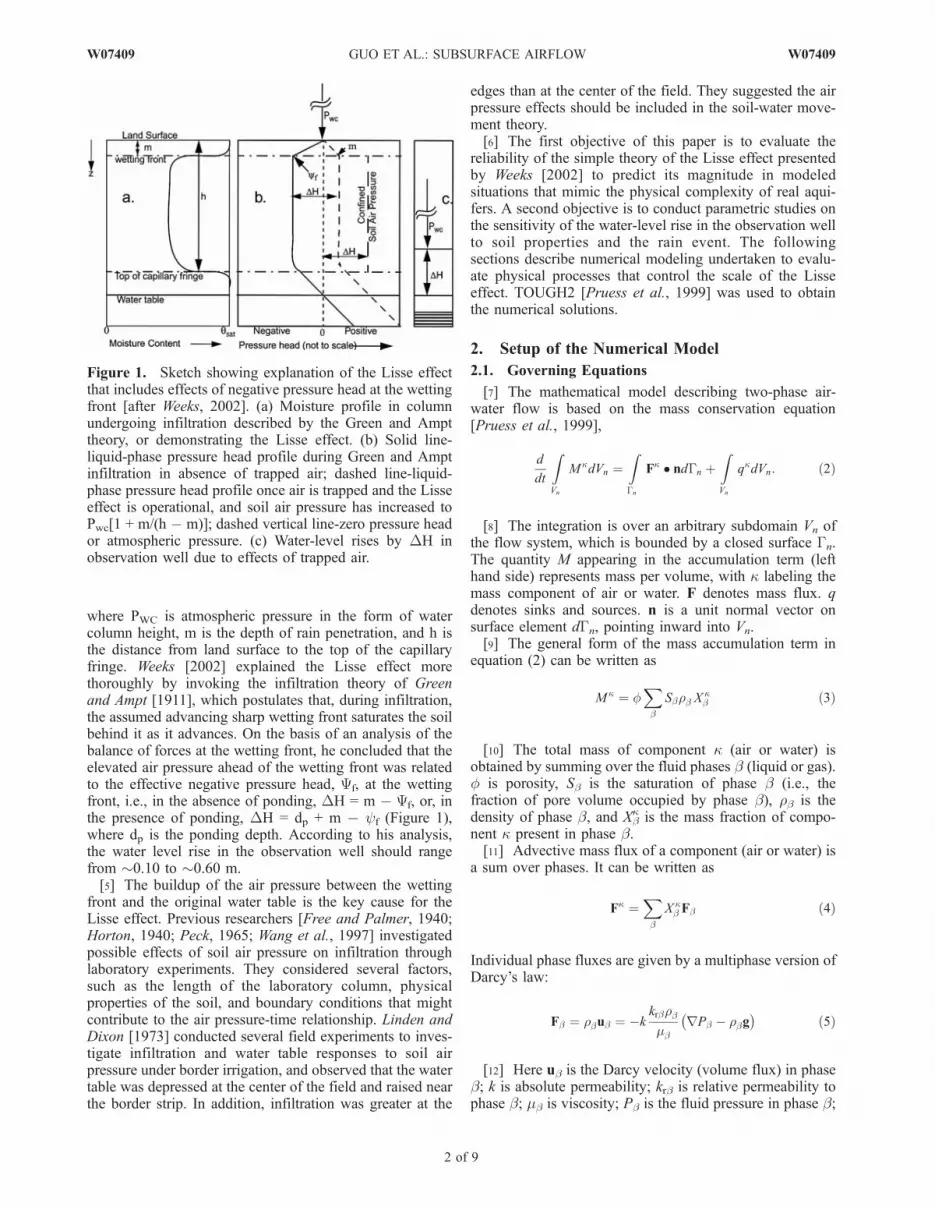
Figure 1. Sketch showing explanation of the Lisse effectthat includes effects of negative pressure head at the wettingfront [after Weeks, 2002]. (a) Moisture profile in columnundergoing infiltration described by the Green and Ampttheory, or demonstrating the Lisse effect. (b) Solid line-liquid-phase pressure head profile during Green and Amptinfiltration in absence of trapped air; dashed line-liquid-phase pressure head profile once air is trapped and the Lisseeffect is operational, and soil air pressure has increased toPwc[1 + m/(h � m)]; dashed vertical line-zero pressure heador atmospheric pressure. (c) Water-level rises by DH inobservation well due to effects of trapped air.
2 of 9
W07409 GUO ET AL.: SUBSURFACE AIRFLOW W07409
and g is the vector of gravitational acceleration. Thepressures in liquid phase (Pl) and gas phase (Pg) are relatedvia the capillary pressure, Pcap,
Pl ¼ Pg þ Pcap ð6Þ
2.2. Geometry, Boundary, and Initial Conditions
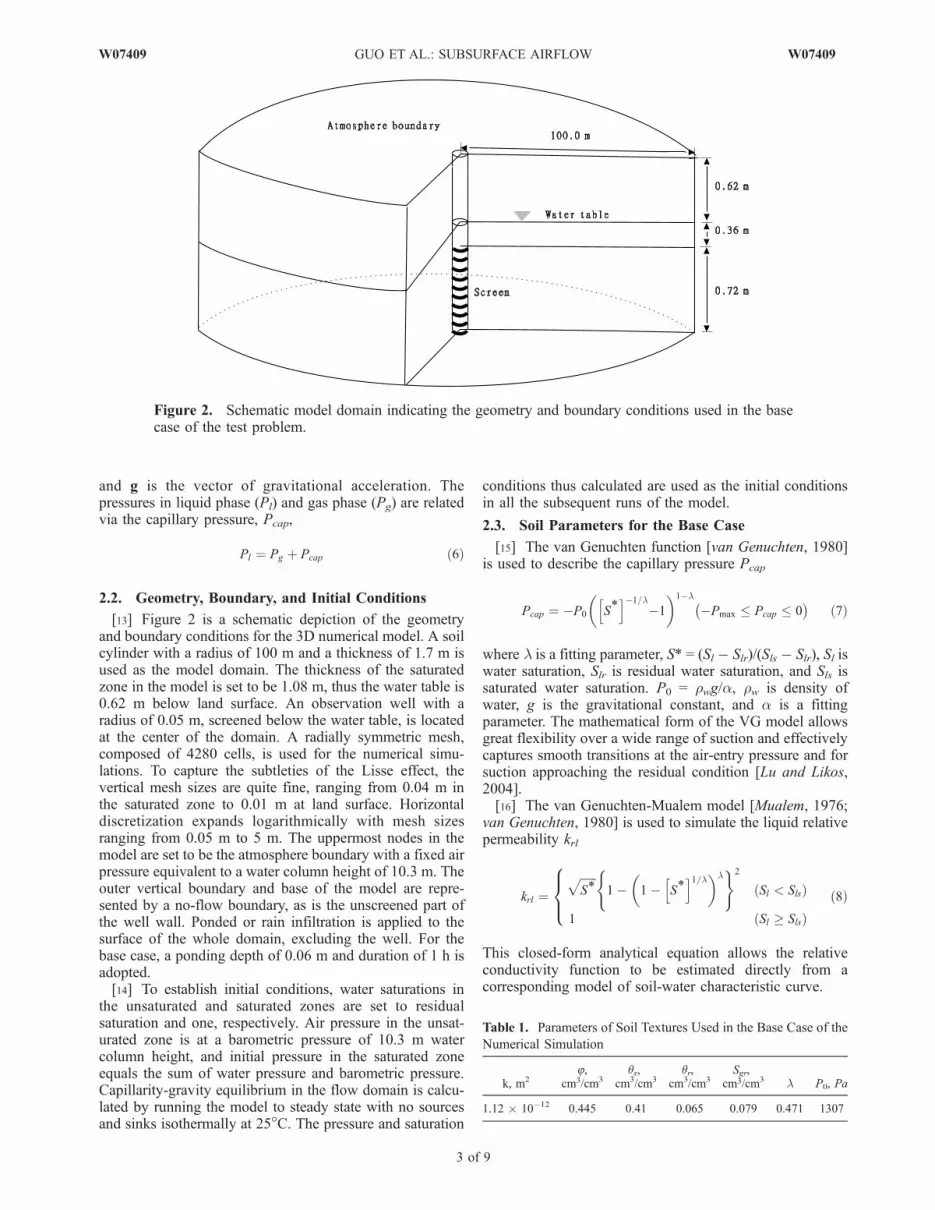
[13] Figure 2 is a schematic depiction of the geometryand boundary conditions for the 3D numerical model. A soilcylinder with a radius of 100 m and a thickness of 1.7 m isused as the model domain. The thickness of the saturatedzone in the model is set to be 1.08 m, thus the water table is0.62 m below land surface. An observation well with aradius of 0.05 m, screened below the water table, is locatedat the center of the domain. A radially symmetric mesh,composed of 4280 cells, is used for the numerical simu-lations. To capture the subtleties of the Lisse effect, thevertical mesh sizes are quite fine, ranging from 0.04 m inthe saturated zone to 0.01 m at land surface. Horizontaldiscretization expands logarithmically with mesh sizesranging from 0.05 m to 5 m. The uppermost nodes in themodel are set to be the atmosphere boundary with a fixed airpressure equivalent to a water column height of 10.3 m. Theouter vertical boundary and base of the model are repre-sented by a no-flow boundary, as is the unscreened part ofthe well wall. Ponded or rain infiltration is applied to thesurface of the whole domain, excluding the well. For thebase case, a ponding depth of 0.06 m and duration of 1 h isadopted.[14] To establish initial conditions, water saturations in
the unsaturated and saturated zones are set to residualsaturation and one, respectively. Air pressure in the unsat-urated zone is at a barometric pressure of 10.3 m watercolumn height, and initial pressure in the saturated zoneequals the sum of water pressure and barometric pressure.Capillarity-gravity equilibrium in the flow domain is calcu-lated by running the model to steady state with no sourcesand sinks isothermally at 25�C. The pressure and saturation
conditions thus calculated are used as the initial conditionsin all the subsequent runs of the model.
2.3. Soil Parameters for the Base Case
[15] The van Genuchten function [van Genuchten, 1980]is used to describe the capillary pressure Pcap
Pcap ¼ �P0 S*h i�1=l
�1
� �1�l
�Pmax Pcap 0� �
ð7Þ
where l is a fitting parameter, S* = (Sl � Slr)/(Sls � Slr), Sl iswater saturation, Slr is residual water saturation, and Sls issaturated water saturation. P0 = rwg/a, rw is density ofwater, g is the gravitational constant, and a is a fittingparameter. The mathematical form of the VG model allowsgreat flexibility over a wide range of suction and effectivelycaptures smooth transitions at the air-entry pressure and forsuction approaching the residual condition [Lu and Likos,2004].[16] The van Genuchten-Mualem model [Mualem, 1976;
van Genuchten, 1980] is used to simulate the liquid relativepermeability krl
krl ¼ffiffiffiffiffiffiS*
p1� 1� S*
h i1=l� �l( )2
Sl < Slsð Þ
1 Sl Slsð Þ
8><>: ð8Þ
This closed-form analytical equation allows the relativeconductivity function to be estimated directly from acorresponding model of soil-water characteristic curve.
Figure 2. Schematic model domain indicating the geometry and boundary conditions used in the basecase of the test problem.
Table 1. Parameters of Soil Textures Used in the Base Case of the
Numerical Simulation
k, m28,
cm3/cm3qs,
cm3/cm3qr,
cm3/cm3Sgr,
cm3/cm3 l P0, Pa
1.12 � 10�12 0.445 0.41 0.065 0.079 0.471 1307
W07409 GUO ET AL.: SUBSURFACE AIRFLOW
3 of 9
W07409
[17] The gas relative permeability krg is chosen as one ofthe following two forms, the second of which is due toCorey [1954] [Pruess et al., 1999]
krg ¼1� krl Sgr ¼ 0
� �1� S� �2
1� S2
� �Sgr > 0� �
(ð9Þ
with S = (Sl � Slr)/(1 � Slr � Sgr), and Sgr is residual gassaturation.[18] The porous soil is assumed homogeneous and iso-
tropic for all cases. The soil parameters used in the base caseare those for a sandy loam. Table 1 lists the absolutepermeability k, the residual and saturated water content qrand qs, the gas residual saturation Sgr, porosity 8 and the vanGenuchten water retention parameters l and P0 for this soiltexture. These data are from Carsel and Parrish [1988] andvan Genuchten et al. [1991]. Similar data sets were used by,for example, Wang et al. [1997] and Schaap et al. [1998].The capillary pressure and relative permeabilities as func-tions of water content used in the base case are shown inFigure 3.
3. Analysis and Discussion of the SimulationResults
3.1. Rain-Induced Airflow and Water-Level Responsein the Well
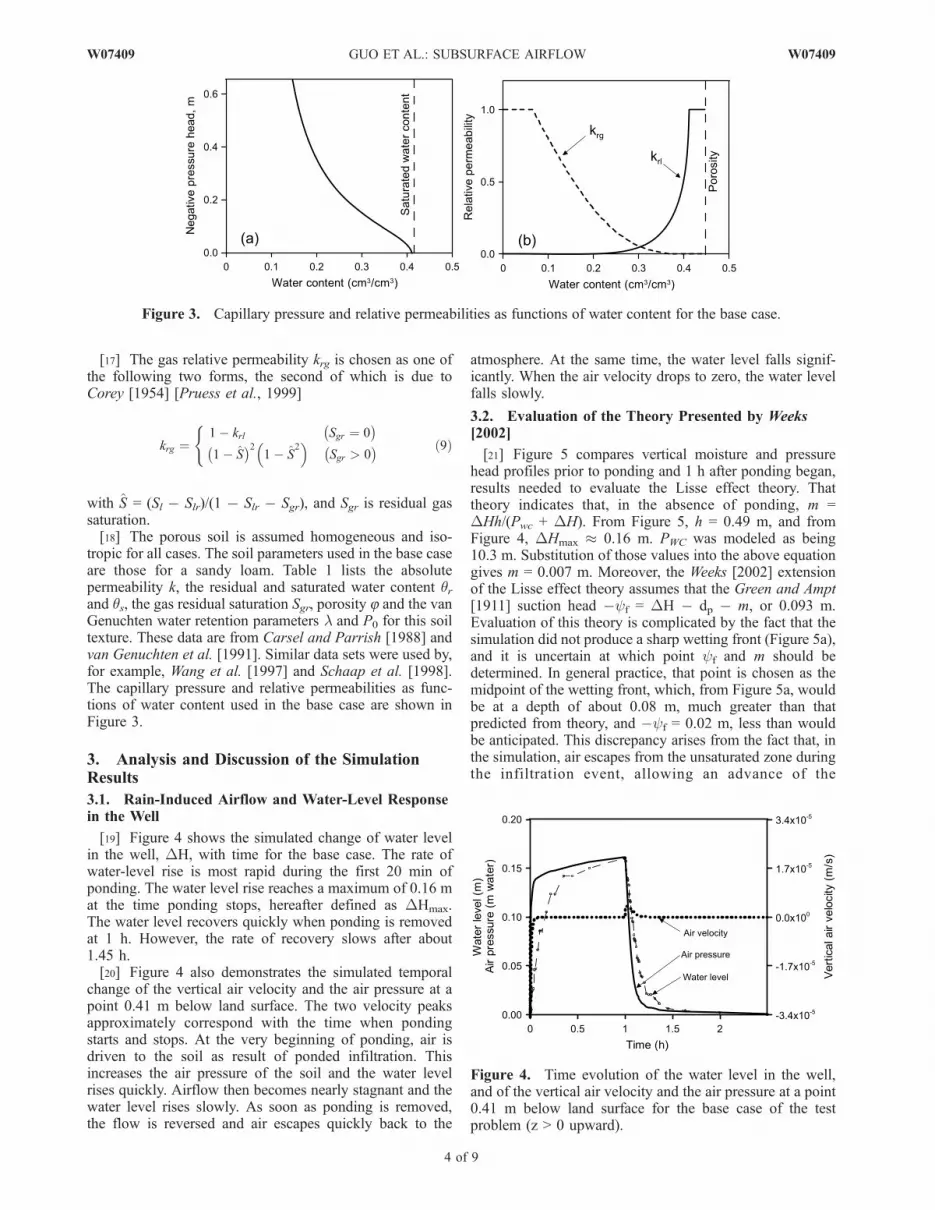
[19] Figure 4 shows the simulated change of water levelin the well, DH, with time for the base case. The rate ofwater-level rise is most rapid during the first 20 min ofponding. The water level rise reaches a maximum of 0.16 mat the time ponding stops, hereafter defined as DHmax.The water level recovers quickly when ponding is removedat 1 h. However, the rate of recovery slows after about1.45 h.[20] Figure 4 also demonstrates the simulated temporal
change of the vertical air velocity and the air pressure at apoint 0.41 m below land surface. The two velocity peaksapproximately correspond with the time when pondingstarts and stops. At the very beginning of ponding, air isdriven to the soil as result of ponded infiltration. Thisincreases the air pressure of the soil and the water levelrises quickly. Airflow then becomes nearly stagnant and thewater level rises slowly. As soon as ponding is removed,the flow is reversed and air escapes quickly back to the
atmosphere. At the same time, the water level falls signif-icantly. When the air velocity drops to zero, the water levelfalls slowly.
3.2. Evaluation of the Theory Presented by Weeks[2002]
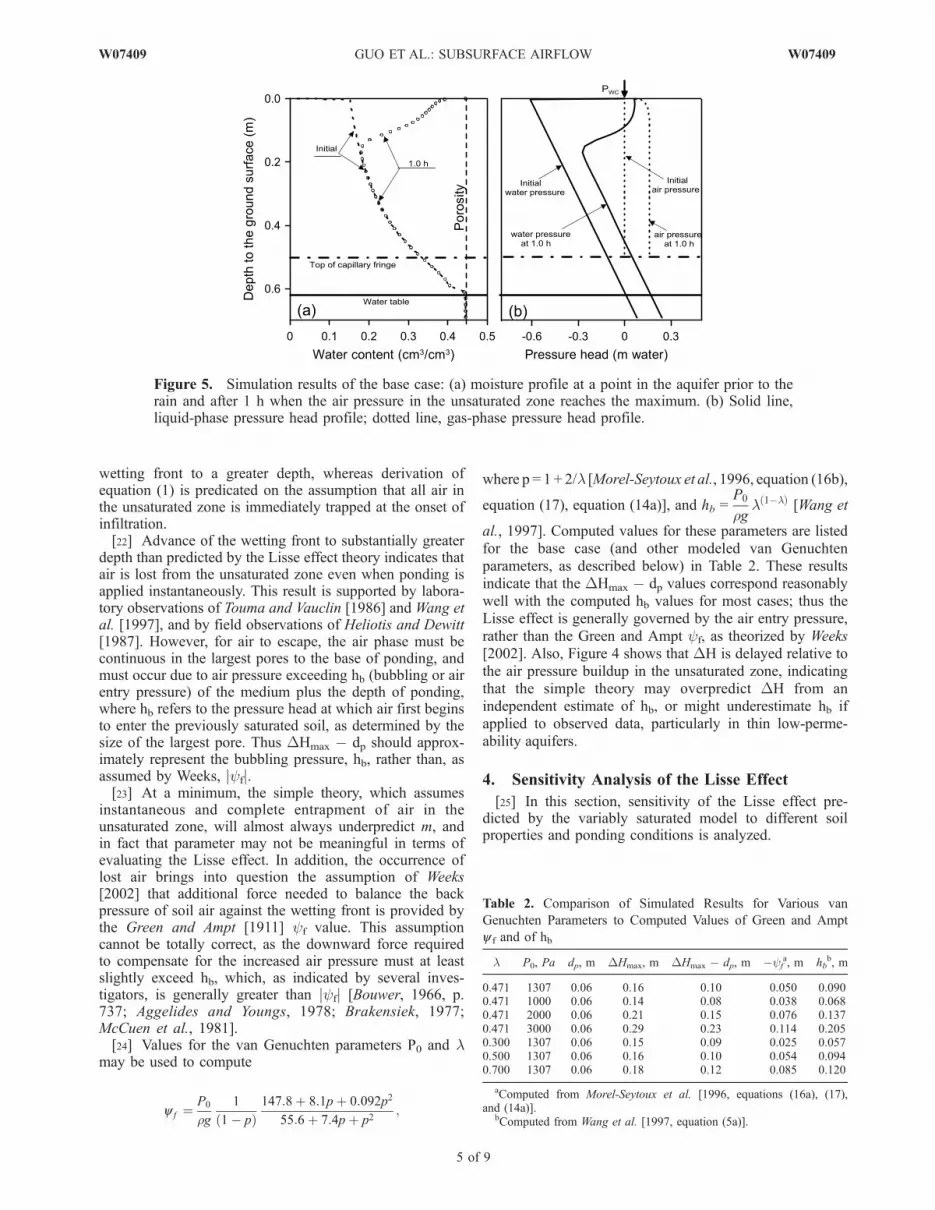
[21] Figure 5 compares vertical moisture and pressurehead profiles prior to ponding and 1 h after ponding began,results needed to evaluate the Lisse effect theory. Thattheory indicates that, in the absence of ponding, m =DHh/(Pwc + DH). From Figure 5, h = 0.49 m, and fromFigure 4, DHmax � 0.16 m. PWC was modeled as being10.3 m. Substitution of those values into the above equationgives m = 0.007 m. Moreover, the Weeks [2002] extensionof the Lisse effect theory assumes that the Green and Ampt[1911] suction head �yf = DH � dp � m, or 0.093 m.Evaluation of this theory is complicated by the fact that thesimulation did not produce a sharp wetting front (Figure 5a),and it is uncertain at which point yf and m should bedetermined. In general practice, that point is chosen as themidpoint of the wetting front, which, from Figure 5a, wouldbe at a depth of about 0.08 m, much greater than thatpredicted from theory, and �yf = 0.02 m, less than wouldbe anticipated. This discrepancy arises from the fact that, inthe simulation, air escapes from the unsaturated zone duringthe infiltration event, allowing an advance of the
Figure 3. Capillary pressure and relative permeabilities as functions of water content for the base case.
Figure 4. Time evolution of the water level in the well,and of the vertical air velocity and the air pressure at a point0.41 m below land surface for the base case of the testproblem (z > 0 upward).
4 of 9
W07409 GUO ET AL.: SUBSURFACE AIRFLOW W07409
wetting front to a greater depth, whereas derivation ofequation (1) is predicated on the assumption that all air inthe unsaturated zone is immediately trapped at the onset ofinfiltration.[22] Advance of the wetting front to substantially greater
depth than predicted by the Lisse effect theory indicates thatair is lost from the unsaturated zone even when ponding isapplied instantaneously. This result is supported by labora-tory observations of Touma and Vauclin [1986] and Wang etal. [1997], and by field observations of Heliotis and Dewitt[1987]. However, for air to escape, the air phase must becontinuous in the largest pores to the base of ponding, andmust occur due to air pressure exceeding hb (bubbling or airentry pressure) of the medium plus the depth of ponding,where hb refers to the pressure head at which air first beginsto enter the previously saturated soil, as determined by thesize of the largest pore. Thus DHmax � dp should approx-imately represent the bubbling pressure, hb, rather than, asassumed by Weeks, jyfj.[23] At a minimum, the simple theory, which assumes
instantaneous and complete entrapment of air in theunsaturated zone, will almost always underpredict m, andin fact that parameter may not be meaningful in terms ofevaluating the Lisse effect. In addition, the occurrence oflost air brings into question the assumption of Weeks[2002] that additional force needed to balance the backpressure of soil air against the wetting front is provided bythe Green and Ampt [1911] yf value. This assumptioncannot be totally correct, as the downward force requiredto compensate for the increased air pressure must at leastslightly exceed hb, which, as indicated by several inves-tigators, is generally greater than jyfj [Bouwer, 1966, p.737; Aggelides and Youngs, 1978; Brakensiek, 1977;McCuen et al., 1981].[24] Values for the van Genuchten parameters P0 and l
may be used to compute
y f ¼P0
rg1
1� pð Þ147:8þ 8:1pþ 0:092p2
55:6þ 7:4pþ p2;
where p = 1 + 2/l [Morel-Seytoux et al., 1996, equation (16b),
equation (17), equation (14a)], and hb =P0
rgl 1�lð Þ [Wang et
al., 1997]. Computed values for these parameters are listedfor the base case (and other modeled van Genuchtenparameters, as described below) in Table 2. These resultsindicate that the DHmax � dp values correspond reasonablywell with the computed hb values for most cases; thus theLisse effect is generally governed by the air entry pressure,rather than the Green and Ampt yf, as theorized by Weeks
[2002]. Also, Figure 4 shows that DH is delayed relative tothe air pressure buildup in the unsaturated zone, indicatingthat the simple theory may overpredict DH from anindependent estimate of hb, or might underestimate hb ifapplied to observed data, particularly in thin low-perme-ability aquifers.
4. Sensitivity Analysis of the Lisse Effect
[25] In this section, sensitivity of the Lisse effect pre-dicted by the variably saturated model to different soilproperties and ponding conditions is analyzed.
Figure 5. Simulation results of the base case: (a) moisture profile at a point in the aquifer prior to therain and after 1 h when the air pressure in the unsaturated zone reaches the maximum. (b) Solid line,liquid-phase pressure head profile; dotted line, gas-phase pressure head profile.
Table 2. Comparison of Simulated Results for Various van
Genuchten Parameters to Computed Values of Green and Ampt
aComputed from Morel-Seytoux et al. [1996, equations (16a), (17),and (14a)].
bComputed from Wang et al. [1997, equation (5a)].
W07409 GUO ET AL.: SUBSURFACE AIRFLOW
5 of 9
W07409
4.1. Sensitivity to the Parameter P0
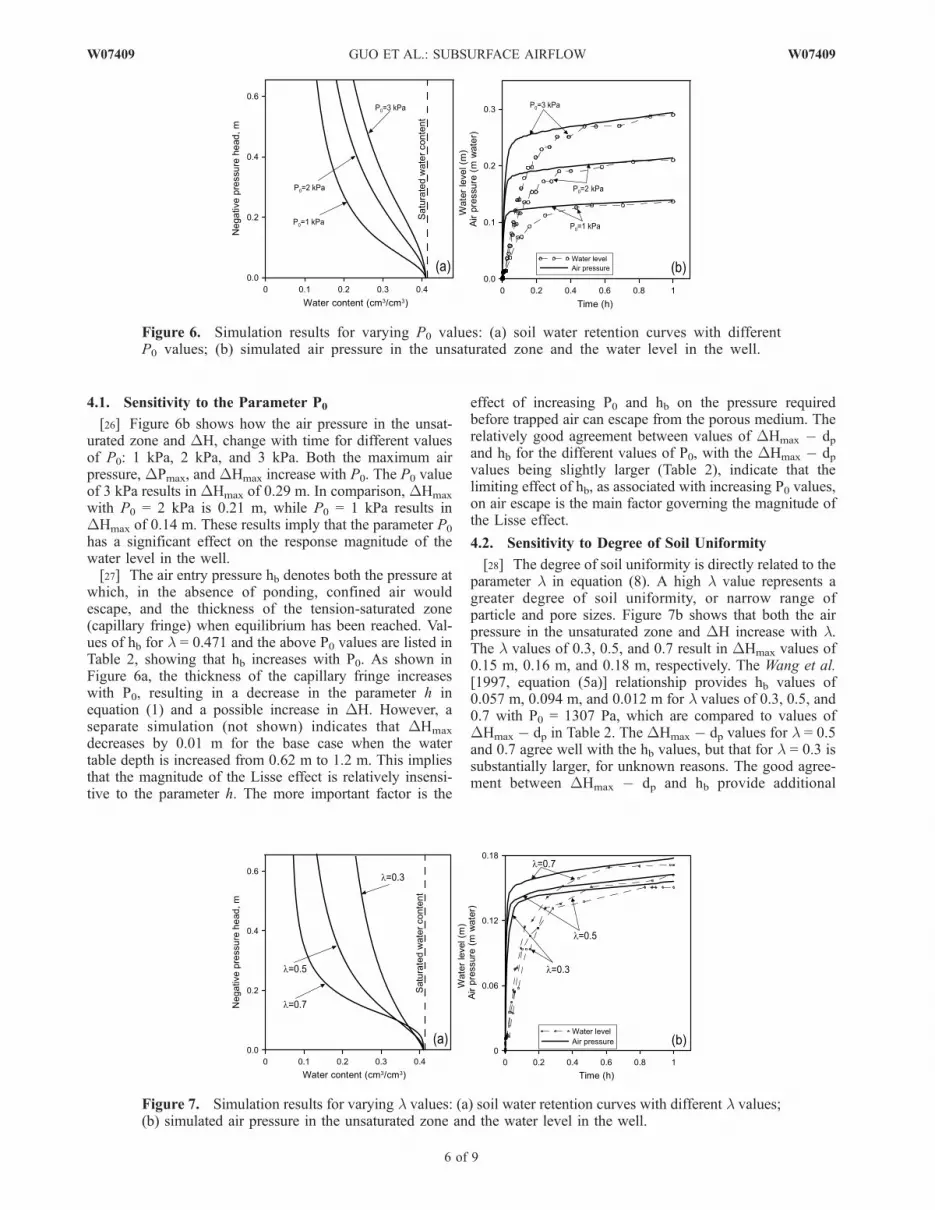
[26] Figure 6b shows how the air pressure in the unsat-urated zone and DH, change with time for different valuesof P0: 1 kPa, 2 kPa, and 3 kPa. Both the maximum airpressure, DPmax, and DHmax increase with P0. The P0 valueof 3 kPa results in DHmax of 0.29 m. In comparison, DHmax
with P0 = 2 kPa is 0.21 m, while P0 = 1 kPa results inDHmax of 0.14 m. These results imply that the parameter P0
has a significant effect on the response magnitude of thewater level in the well.[27] The air entry pressure hb denotes both the pressure at
which, in the absence of ponding, confined air wouldescape, and the thickness of the tension-saturated zone(capillary fringe) when equilibrium has been reached. Val-ues of hb for l = 0.471 and the above P0 values are listed inTable 2, showing that hb increases with P0. As shown inFigure 6a, the thickness of the capillary fringe increaseswith P0, resulting in a decrease in the parameter h inequation (1) and a possible increase in DH. However, aseparate simulation (not shown) indicates that DHmax
decreases by 0.01 m for the base case when the watertable depth is increased from 0.62 m to 1.2 m. This impliesthat the magnitude of the Lisse effect is relatively insensi-tive to the parameter h. The more important factor is the
effect of increasing P0 and hb on the pressure requiredbefore trapped air can escape from the porous medium. Therelatively good agreement between values of DHmax � dpand hb for the different values of P0, with the DHmax � dpvalues being slightly larger (Table 2), indicate that thelimiting effect of hb, as associated with increasing P0 values,on air escape is the main factor governing the magnitude ofthe Lisse effect.
4.2. Sensitivity to Degree of Soil Uniformity
[28] The degree of soil uniformity is directly related to theparameter l in equation (8). A high l value represents agreater degree of soil uniformity, or narrow range ofparticle and pore sizes. Figure 7b shows that both the airpressure in the unsaturated zone and DH increase with l.The l values of 0.3, 0.5, and 0.7 result in DHmax values of0.15 m, 0.16 m, and 0.18 m, respectively. The Wang et al.[1997, equation (5a)] relationship provides hb values of0.057 m, 0.094 m, and 0.012 m for l values of 0.3, 0.5, and0.7 with P0 = 1307 Pa, which are compared to values ofDHmax � dp in Table 2. The DHmax � dp values for l = 0.5and 0.7 agree well with the hb values, but that for l = 0.3 issubstantially larger, for unknown reasons. The good agree-ment between DHmax � dp and hb provide additional
Figure 6. Simulation results for varying P0 values: (a) soil water retention curves with differentP0 values; (b) simulated air pressure in the unsaturated zone and the water level in the well.
Figure 7. Simulation results for varying l values: (a) soil water retention curves with different l values;(b) simulated air pressure in the unsaturated zone and the water level in the well.
6 of 9
W07409 GUO ET AL.: SUBSURFACE AIRFLOW W07409
evidence that the bubbling pressure is a key parametergoverning the magnitude of the Lisse effect.
4.3. Sensitivity to Intrinsic Permeability
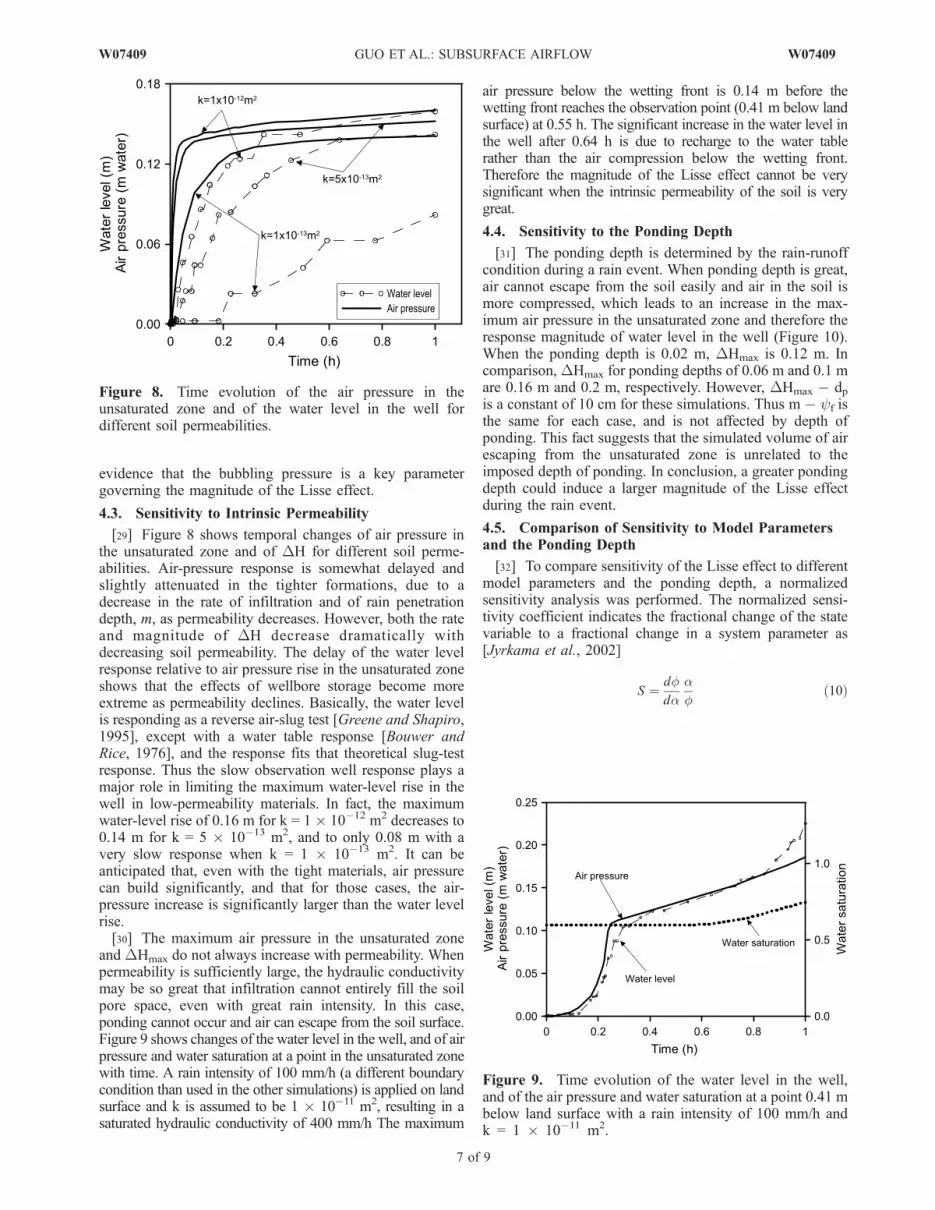
[29] Figure 8 shows temporal changes of air pressure inthe unsaturated zone and of DH for different soil perme-abilities. Air-pressure response is somewhat delayed andslightly attenuated in the tighter formations, due to adecrease in the rate of infiltration and of rain penetrationdepth, m, as permeability decreases. However, both the rateand magnitude of DH decrease dramatically withdecreasing soil permeability. The delay of the water levelresponse relative to air pressure rise in the unsaturated zoneshows that the effects of wellbore storage become moreextreme as permeability declines. Basically, the water levelis responding as a reverse air-slug test [Greene and Shapiro,1995], except with a water table response [Bouwer andRice, 1976], and the response fits that theoretical slug-testresponse. Thus the slow observation well response plays amajor role in limiting the maximum water-level rise in thewell in low-permeability materials. In fact, the maximumwater-level rise of 0.16 m for k = 1 � 10�12 m2 decreases to0.14 m for k = 5 � 10�13 m2, and to only 0.08 m with avery slow response when k = 1 � 10�13 m2. It can beanticipated that, even with the tight materials, air pressurecan build significantly, and that for those cases, the air-pressure increase is significantly larger than the water levelrise.[30] The maximum air pressure in the unsaturated zone
and DHmax do not always increase with permeability. Whenpermeability is sufficiently large, the hydraulic conductivitymay be so great that infiltration cannot entirely fill the soilpore space, even with great rain intensity. In this case,ponding cannot occur and air can escape from the soil surface.Figure 9 shows changes of the water level in the well, and of airpressure and water saturation at a point in the unsaturated zonewith time. A rain intensity of 100 mm/h (a different boundarycondition than used in the other simulations) is applied on landsurface and k is assumed to be 1 � 10�11 m2, resulting in asaturated hydraulic conductivity of 400 mm/h The maximum
air pressure below the wetting front is 0.14 m before thewetting front reaches the observation point (0.41 m below landsurface) at 0.55 h. The significant increase in the water level inthe well after 0.64 h is due to recharge to the water tablerather than the air compression below the wetting front.Therefore the magnitude of the Lisse effect cannot be verysignificant when the intrinsic permeability of the soil is verygreat.
4.4. Sensitivity to the Ponding Depth
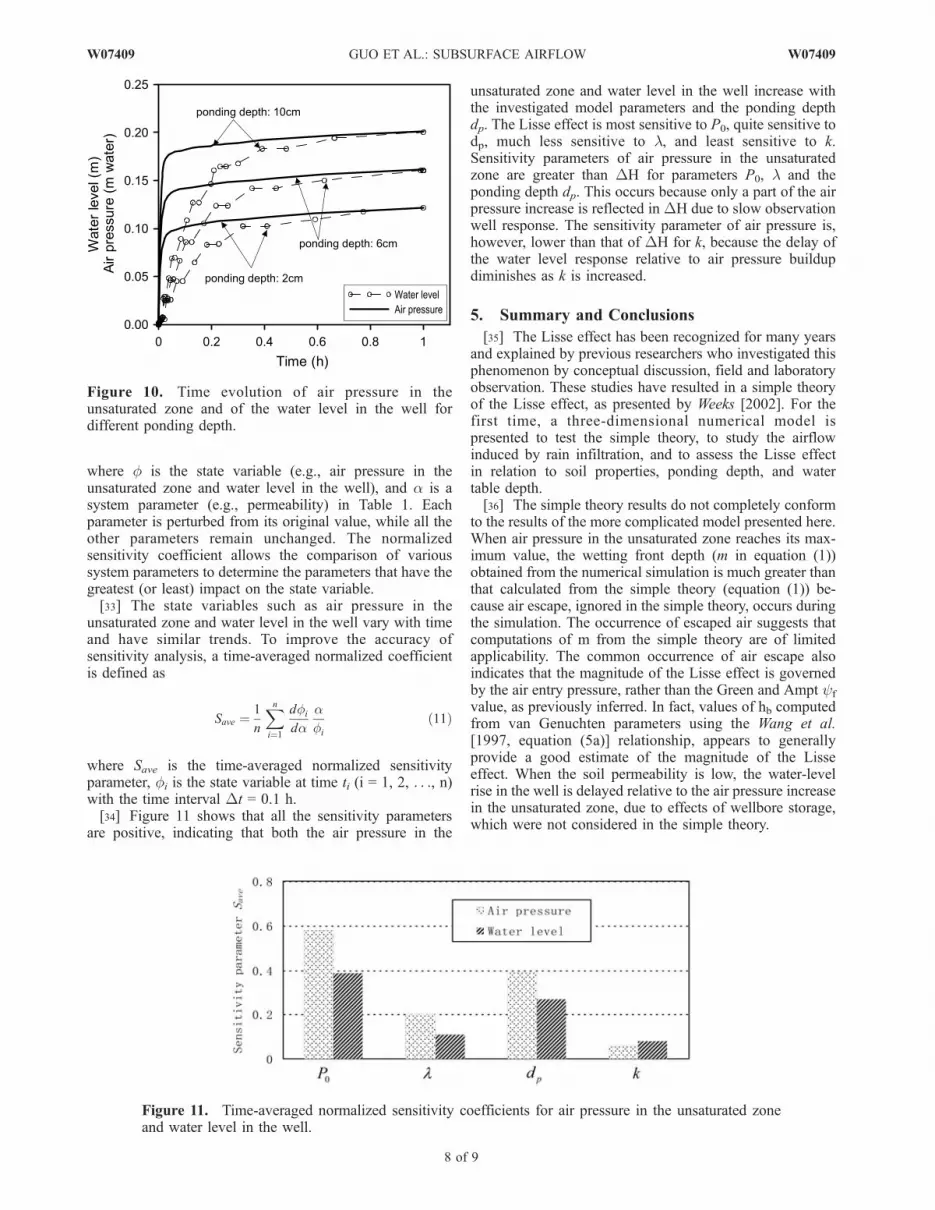
[31] The ponding depth is determined by the rain-runoffcondition during a rain event. When ponding depth is great,air cannot escape from the soil easily and air in the soil ismore compressed, which leads to an increase in the max-imum air pressure in the unsaturated zone and therefore theresponse magnitude of water level in the well (Figure 10).When the ponding depth is 0.02 m, DHmax is 0.12 m. Incomparison,DHmax for ponding depths of 0.06 m and 0.1 mare 0.16 m and 0.2 m, respectively. However, DHmax � dpis a constant of 10 cm for these simulations. Thus m � yf isthe same for each case, and is not affected by depth ofponding. This fact suggests that the simulated volume of airescaping from the unsaturated zone is unrelated to theimposed depth of ponding. In conclusion, a greater pondingdepth could induce a larger magnitude of the Lisse effectduring the rain event.
4.5. Comparison of Sensitivity to Model Parametersand the Ponding Depth
[32] To compare sensitivity of the Lisse effect to differentmodel parameters and the ponding depth, a normalizedsensitivity analysis was performed. The normalized sensi-tivity coefficient indicates the fractional change of the statevariable to a fractional change in a system parameter as[Jyrkama et al., 2002]
S ¼ dfda
af
ð10Þ
Figure 8. Time evolution of the air pressure in theunsaturated zone and of the water level in the well fordifferent soil permeabilities.
Figure 9. Time evolution of the water level in the well,and of the air pressure and water saturation at a point 0.41 mbelow land surface with a rain intensity of 100 mm/h andk = 1 � 10�11 m2.
W07409 GUO ET AL.: SUBSURFACE AIRFLOW
7 of 9
W07409
where f is the state variable (e.g., air pressure in theunsaturated zone and water level in the well), and a is asystem parameter (e.g., permeability) in Table 1. Eachparameter is perturbed from its original value, while all theother parameters remain unchanged. The normalizedsensitivity coefficient allows the comparison of varioussystem parameters to determine the parameters that have thegreatest (or least) impact on the state variable.[33] The state variables such as air pressure in the
unsaturated zone and water level in the well vary with timeand have similar trends. To improve the accuracy ofsensitivity analysis, a time-averaged normalized coefficientis defined as
Save ¼1
n
Xni¼1
dfi
daafi
ð11Þ
where Save is the time-averaged normalized sensitivityparameter, fi is the state variable at time ti (i = 1, 2, . . ., n)with the time interval Dt = 0.1 h.[34] Figure 11 shows that all the sensitivity parameters
are positive, indicating that both the air pressure in the
unsaturated zone and water level in the well increase withthe investigated model parameters and the ponding depthdp. The Lisse effect is most sensitive to P0, quite sensitive todp, much less sensitive to l, and least sensitive to k.Sensitivity parameters of air pressure in the unsaturatedzone are greater than DH for parameters P0, l and theponding depth dp. This occurs because only a part of the airpressure increase is reflected in DH due to slow observationwell response. The sensitivity parameter of air pressure is,however, lower than that of DH for k, because the delay ofthe water level response relative to air pressure buildupdiminishes as k is increased.
5. Summary and Conclusions
[35] The Lisse effect has been recognized for many yearsand explained by previous researchers who investigated thisphenomenon by conceptual discussion, field and laboratoryobservation. These studies have resulted in a simple theoryof the Lisse effect, as presented by Weeks [2002]. For thefirst time, a three-dimensional numerical model ispresented to test the simple theory, to study the airflowinduced by rain infiltration, and to assess the Lisse effectin relation to soil properties, ponding depth, and watertable depth.[36] The simple theory results do not completely conform
to the results of the more complicated model presented here.When air pressure in the unsaturated zone reaches its max-imum value, the wetting front depth (m in equation (1))obtained from the numerical simulation is much greater thanthat calculated from the simple theory (equation (1)) be-cause air escape, ignored in the simple theory, occurs duringthe simulation. The occurrence of escaped air suggests thatcomputations of m from the simple theory are of limitedapplicability. The common occurrence of air escape alsoindicates that the magnitude of the Lisse effect is governedby the air entry pressure, rather than the Green and Ampt yf
value, as previously inferred. In fact, values of hb computedfrom van Genuchten parameters using the Wang et al.[1997, equation (5a)] relationship, appears to generallyprovide a good estimate of the magnitude of the Lisseeffect. When the soil permeability is low, the water-levelrise in the well is delayed relative to the air pressure increasein the unsaturated zone, due to effects of wellbore storage,which were not considered in the simple theory.
Figure 10. Time evolution of air pressure in theunsaturated zone and of the water level in the well fordifferent ponding depth.
Figure 11. Time-averaged normalized sensitivity coefficients for air pressure in the unsaturated zoneand water level in the well.
8 of 9
W07409 GUO ET AL.: SUBSURFACE AIRFLOW W07409
[37] The maximum water-level rise in the well increaseswith P0 due to increase of hb with P0. As shown by thesimulation results, the magnitude of the Lisse effectincreases with degree of soil uniformity, and decreases withthe water table depth. However, the Lisse effect tends to berelatively less sensitive to these two factors than with P0.When the soil permeability increases, the Lisse effectbecomes more significant because the rain penetration depthis greater and the delay of the water-level rise in the wellrelative to the air pressure buildup in the unsaturated zonebecomes less significant. However, the Lisse effect cannotbe very significant when the soil permeability is large. Inthis case, the rainwater cannot completely seal off thesubsurface air, and air freely escapes through the descend-ing unsaturated wetting front. A large response could beanticipated when the ponding depth, which represents therain-runoff condition, is increased. The normalized sensi-tivity analysis reveals that the air entry pressure and theponding depth have the most significant impact on the Lisseeffect.
[38] Acknowledgments. The study was supported by the ResearchGrants Council of the Hong Kong Special Administrative Region, China(HKU 7028/05P). TOUGH2 was run via the interface of PetraSim. Theauthors appreciate David DiCarlo and three anonymous reviewers for theircomments.
ReferencesAggelides, S., and E. G. Youngs (1978), The dependence of the parametersin the Green and Ampt infiltration equation on the initial water content indraining and wetting states, Water Resour. Res., 14(5), 857–862.
Bianchi, W. C., and E. E. Haskell (1966), Air in the vadose zone as it affectswater movements beneath a recharge basin, Water Resour. Res., 2, 315–322.
Bouwer, H. (1966), Rapid field measurement of air entry value and hy-draulic conductivity of soil as significant parameters in flow systemanalysis, Water Resour. Res., 2(4), 729–738.
Bouwer, H., and R. C. Rice (1976), Slug test for determining hydraulicconductivity of unconfined aquifers with completely or partially pene-trating wells, Water Resour. Res., 12, 423–428.
Brakensiek, D. L. (1977), Estimating the effective capillary pressure in theGreen and Ampt infiltration equation, Water Resour. Res., 13(3), 680–682.
Carsel, R. F., and R. S. Parrish (1988), Developing joint probability dis-tributions of soil water retention characteristics, Water Resour. Res., 24,755–769.
Corey, A. T. (1954), The interrelation between gas and oil relative perme-abilities, Prod. Monthly, 19, 38–41.
Free, G. R., and J. J. Palmer (1940), Interrelationships of infiltration, airmovement, and pore size in graded silica sand, Proc. Soil Sci. Soc. Am.,5, 390–398.
Freeze, R. A., and J. A. Cherry (1979), Groundwater, Prentice-Hall, Engle-wood Cliffs, N. J.
Greene, E. A., and A. M. Shapiro (1995), Methods of conducting air-pressurized slug tests and computation of type curves for estimatingtransmissivity and storativity, U.S. Geol. Surv. Open-file report 95-424,43 pp. (Available at http://pubs.er.usgs.gov/usgspubs/ofr/ofr95424)
Green, W. H., and G. A. Ampt (1911), Studies on soil physics. part I: Theflow of air and water through soils, J. Agric. Sci., 4 1–24.
Healy, R. W., and P. G. Cook (2002), Using groundwater levels to estimaterecharge, Hydrogeol. J., 10, 91–109.
Heliotis, F. D., and C. B. Dewitt (1987), Rapid water-table responses torainfall in a northern peatland ecosystem, Water Resour. Bull., 23, 1011–1016.
Horton, R. E. (1940), An approach toward a physical interpretation ofinfiltration capacity, Proc. Soil Sci. Soc. Am., 5, 399–417.
Jiao, J. J., and H. L. Li (2004), Breathing of coastal vadose zone induced bysea level fluctuations, Geophys. Res. Lett., 31, L11502, doi:10.1029/2004GL019572.
Jyrkama, M. I., J. F. Sykes, and S. D. Normani (2002), Recharge estimationfor transient ground water modeling, Ground Water, 40, 638–648.
Linden, D. R., and R. M. Dixon (1973), Infiltration and water table effectsof soil air pressure under border irrigation, Soil Sci. Soc. Am. J., 37, 94–98.
Lu, N., and W. J. Likos (2004), Unsaturated Soil Mechanics, John Wiley,New York.
McCuen, R. H., W. J. Rawls, and D. L. Brakensiek (1981), Statisticalanalysis of the Brooks-Corey and the Green-Ampt parameters across soiltextures, Water Resour. Res., 17(4), 1005–1013.
Meyboom, P. (1967), Groundwater studies in the Assiniboine River drai-nage basin. part II: Hydrologic characteristics of phreatophytic vegetationin south-central Saskatchewan, Geol. Surv. Can. Bull., 139.
Morel-Seytoux, H. J., P. D. Meyer, M. Nachabe, J. Touma, M. T. vanGenuchten, and R. L. Lenhard (1996), Parameter equivalence for theBrooks-Corey and van Genuchten soil characteristics: Preserving theeffective capillary drive, Water Resour. Res., 32(5), 1251–1258.
Mualem, Y. (1976), New model for predicting hydraulic conductivity ofunsaturated porous-media, Water Resour. Res., 12, 513–522.
Peck, A. J. (1965), Moisture profile development and air compression dur-ing water uptake by bounded bodies. part III: Vertical columns, Soil Sci.,100, 44–51.
Pruess, K., et al. (1999), TOUGH2 User’s Guide, Version 2.0, Earth Sci.Div. Lawrence Berkeley Natl. Lab. Univ. of Calif., Berkeley, Calif.
Schaap, M. G., F. J. Leij, and M. T. van Genuchten (1998), Neural networkanalysis for hierarchical prediction of soil hydraulic properties, Soil Sci.Soc. Am. J., 62(4), 847–855.
Todd, D. K., and L. W. Mays (2005), Groundwater Hydrology, 3rd ed.,John Wiley, Hoboken, N. J.
Touma, J., and M. Vauclin (1986), Experimental and numerical analysis oftwo-phase infiltration in a partially saturated soil, Transp. Porous Media,1, 27–55.
van Genuchten, M. T. (1980), A closed-form equation for predicting thehydraulic conductivity of unsaturated soils, Soil Sci. Soc. Am. J., 44,892–898.
van Genuchten, M. T., F. J. Leij, and S. R. Yates (1991), The RETC codefor quantifying the hydraulic functions of unsaturated soils, report, U.S.Salinity Lab., Riverside, Calif.
Wang, Z., J. Feyen, D. R. Nielsen, and M. T. van Genuchten (1997), Two-phase flow infiltration equations accounting for air entrapment effects,Water Resour. Res., 33, 2759–2767.
Weeks, E. P. (2002), The Lisse effect revisited, Ground Water, 40, 652–656.
����������������������������H. Guo and J. J. Jiao, Department of Earth Sciences, University of Hong