793 European Journal of Remote Sensing - 2015, 48: 793-809 doi: 10.5721/EuJRS20154844 Received 22/06/2015 accepted 16/10/2015 European Journal of Remote Sensing - 2015, 48: 793-809 doi: 10.5721/EuJRS20154844 Received 22/06/2015 accepted 16/10/2015 European Journal of Remote Sensing An official journal of the Italian Society of Remote Sensing www.aitjournal.com Discriminant analysis of olive oil mill wastes using spectroradiometers in the visible and near infrared part of the spectrum Athos Agapiou 1,2 *, Nikos Papadopoulos 2 and Apostolos Sarris 2 1 Department of Civil Engineering and Geomatics, Faculty of Engineering and Technology, Cyprus University of Technology, 2-6, Saripolou str., 3603, Limassol, Cyprus, [email protected]2 Laboratory of Geophysical-Satellite Remote Sensing & Archaeo-environment, Institute for Mediterranean Studies, Foundation for Research & Technology, Hellas (F.O.R.T.H.) *Corresponding author, e-mail address: [email protected]Abstract This paper aims to introduce an index which is able to assist the recognition of Olive Oil Mill Wastes (OOMW) disposal areas using multispectral satellite images. For this purpose several ground spectroradiometric measurements in the range of 450 - 900 nm have been collected at a variety of targets. The samples were initially resampled to the GeoEye-1 sensor using the appropriate Relative Spectral Response Filter (RSR) and then scatter plots and spectral signatures were projected. Then an evaluation of nine widely used vegetation indices was performed. This analysis indicated that, Perpendicular Vegetation Index (PVI), Transformed Soil Adjusted Vegetation Index (TSAVI) and Soil and Atmospherically Resistant Vegetation Index (SARVI) are the most efficient indices to enhance the detection of Olive Mill Waste disposal areas. Moreover, correlation as well as separability analysis have shown than blue and near infrared (NIR) spectral bands are the most suitable for interpretation purposes. The Olive Mill Waste index was applied also to GeoEye-1 in different cases studies in the island of Crete. Keywords: Olive Oil Mill Waste Index, spectroradiometer, separability analysis, GeoEye, Crete. Introduction Management of olive mill waste water (OMWW) remains a critical and unsolved problem, especially in regions where huge quantities of wastes are produced. Indeed the olive mill wastes (OMW) generated from olive oil extraction is a major environmental issue, particularly in Mediterranean areas [Dermeche et al., 2013]. It is estimated that almost 750 million productive olive trees exists worldwide, while a majority of them (≈98%) being located in the Mediterranean region, where the three major olive oil producers (Spain, Italy, and Greece) worldwide are located [Roig et al., 2006; Asfi et al., 2012]. Therefore
Transcript
793
European Journal of Remote Sensing - 2015, 48: 793-809 doi: 10.5721/EuJRS20154844 Received 22/06/2015 accepted 16/10/2015European Journal of Remote Sensing - 2015, 48: 793-809 doi: 10.5721/EuJRS20154844 Received 22/06/2015 accepted 16/10/2015
European Journal of Remote SensingAn official journal of the Italian Society of Remote Sensing
www.aitjournal.com
Discriminant analysis of olive oil mill wastes using spectroradiometers in the visible and near infrared part
of the spectrum
Athos Agapiou1,2*, Nikos Papadopoulos2 and Apostolos Sarris2
1Department of Civil Engineering and Geomatics, Faculty of Engineering and Technology, Cyprus University of Technology, 2-6, Saripolou str., 3603, Limassol, Cyprus, [email protected]
2Laboratory of Geophysical-Satellite Remote Sensing & Archaeo-environment,Institute for Mediterranean Studies, Foundation for Research & Technology, Hellas (F.O.R.T.H.)
AbstractThis paper aims to introduce an index which is able to assist the recognition of Olive Oil Mill Wastes (OOMW) disposal areas using multispectral satellite images. For this purpose several ground spectroradiometric measurements in the range of 450 - 900 nm have been collected at a variety of targets. The samples were initially resampled to the GeoEye-1 sensor using the appropriate Relative Spectral Response Filter (RSR) and then scatter plots and spectral signatures were projected. Then an evaluation of nine widely used vegetation indices was performed. This analysis indicated that, Perpendicular Vegetation Index (PVI), Transformed Soil Adjusted Vegetation Index (TSAVI) and Soil and Atmospherically Resistant Vegetation Index (SARVI) are the most efficient indices to enhance the detection of Olive Mill Waste disposal areas. Moreover, correlation as well as separability analysis have shown than blue and near infrared (NIR) spectral bands are the most suitable for interpretation purposes. The Olive Mill Waste index was applied also to GeoEye-1 in different cases studies in the island of Crete.Keywords: Olive Oil Mill Waste Index, spectroradiometer, separability analysis, GeoEye, Crete.
IntroductionManagement of olive mill waste water (OMWW) remains a critical and unsolved problem, especially in regions where huge quantities of wastes are produced. Indeed the olive mill wastes (OMW) generated from olive oil extraction is a major environmental issue, particularly in Mediterranean areas [Dermeche et al., 2013]. It is estimated that almost 750 million productive olive trees exists worldwide, while a majority of them (≈98%) being located in the Mediterranean region, where the three major olive oil producers (Spain, Italy, and Greece) worldwide are located [Roig et al., 2006; Asfi et al., 2012]. Therefore
Agapiou et al. Discriminant analysis of olive oil mill wastes using spectroradiometers
794
olive oil industry is very important in Mediterranean countries, both in terms of wealth and tradition and it is considered to be as one of the driving sectors of the agricultural economy of the Mediterranean basin. OMWW is mainly composed of water (80-83%), organic (15-18%) and inorganic compounds (2%). Although OMWW can be used as natural, low-cost fertilizer, it is non-biodegradable and therefore unsuitable for further use as fertilizer or as irrigation water [Niaounakis and Halvadakis, 2006].In the last years efforts have been made for efficient and ecological management of OOMW disposal areas as well as for their long term monitoring [Kavadias et al., 2014]. In order to avoid environmental impacts, which include soil and air pollution, olive mills were forced to treat or eliminate this OMWW using a variety of techniques and technologies. To this direction current research efforts have been oriented towards the development of efficient treatment technologies, namely physical, chemical and biological processes as well as various combinations of them [Asfi et al., 2012]. In some Mediterranean countries, untreated OMWW are often discharged directly into sewer systems and water streams or disposed in evaporation ponds/lagoons and soils despite the fact that such management practices are not allowed in most Mediterranean countries [Hanifi and El Hadrami, 2009]. Moreover, no specific European Commission legislation exists today for OMWW management and each country issues different guidelines [Komnitsas et al., 2011].OMWW disposal areas are generally scattered in different places with diverse local topographical and geological settings, while their identification might be difficult and time consuming if it is based purely on in-situ observations. Alternative, satellite remote sensing employing multispectral images seems to be ideal for the detection and systematic monitoring of OMWW disposal areas. As Agapiou et al. [2015] have recently shown, medium and high resolution images can be used to detect OMWW. However difficulties might exist in classification processing as well as detection algorithms due to the spectral variance of OMWW. This problem becomes more difficult in some cases due to the phenomenon of the mixed pixels in the satellite images.This paper aims to investigate further this spectral variance as well to identify spectral windows where satellite images can be used so as to enhance the final results and help the recognition of OOMWs. For this purpose spectroradiometric measurements were taken from a variety of samples. The spectral signatures were then post-processed through a variety of remote sensing analyses including discriminate analysis, vegetation indices and correlation analysis.
MethodologyDuring the disposal of oil wastes as well as temporal changes of OOMW disposal areas, different spectral signatures may be recorded in these sites. Indeed, fresh olive oil mill waste may sometimes mixed with soil, water or even dry olive oil mill wastes etc. Therefore, in order to accomplish the scientific objectives of this study, laboratory spectroradiometric measurements were taken over the following samples: (a) fresh olive wastes (same day production); (b) dry olive wastes; (c) olive wastes mixed with water (25%); (d) olive wastes mixed with water (50%); (e) olive wastes mixed with soil (25%); (f) olive wastes mixed with water (50%) and soil (50%) and (g) bare soil. The soil type of the samples was skeletic-calcaric- and calcaric-lithic with a smooth texture and brown colour.The samples were recently taken from field campaigns conducted this year (2015) by the
795
European Journal of Remote Sensing - 2015, 48: 793-809
authors. For each one of these samples, 50 spectroradiometric measurements were taken using a GER1500 spectroradiometer. The instrument was set up to collect an average of 5 measurements per sample. GER 1500 spectroradiometer has the ability to record electromagnetic radiation from visible to NIR spectrum (350-1050 nm) using 512 different channels, with a range of ~1.5 nm. Moreover, a lambertian spectralon panel was also used in order to measure the incoming solar radiation and calibrate all the measurements taken over the samples. The field of view (FOV) of the instrument was set to 4 degrees (≈0.02 m2 taken from a height of 1.2 m). At first the incoming radiance was calculated based on the reference measurement at the spectralon panel, while the following measurements were taken over the sample.Then these narrowband measurements were simulated with the high resolution sensor GeoEye-1 using the appropriate Relative Spectral Response (RSR) filter which was obtained from the operator’s website. The spectral band response ρ was simulated by integrating the measured radiances for each target, with the spectral response curve applied as a weighting function, i.e:
ρλ λ λ
λ λ λ
λ
λ
λ
λ=( ) ( )
( ) ( )[ ]∫
∫1
2
1
2 1w R d
w dΙ
where R is the measured reflected radiation at the top of the canopy as a function of wavelength λ, w is the relative response of the broadband sensor and I is the corresponding incident radiance measured on an ideal reference panel. The actual reference panel measurement I is corrected to the ideal (100% reflectance) by dividing the measured value by its true reflectance ρref:
I I
ref( ) '( )
( )λ
λρ λ
= [ ]2
Based on these broadbnd reflectance values several vegetation indices as shown in Table 1 were calculated. In detail the Normalized Difference Vegetation Index (NDVI); Simple Ratio (SR); Perpendicular Vegetation Index (PVI); Ratio Vegetation Index (RVI); Transformed Soil Adjusted Vegetation Index (TSAVI); Modified Soil Adjusted Vegetation Index (MSAVI); Soil and Atmospherically Resistant Vegetation Index (SARVI); DVI (Difference Vegetation Index) and Green Normalized Difference Vegetation Index (Green NDVI) were examined. Later, the relative differences between all samples and vegetation indices were calculated.In parallel, the spectral similarity of the samples in the range of 450-900 nm was at first examined through the determination coefficient (R2) of all samples in this spectral range. In addition, two main separability indices were evaluated: (a) Euclidean distance and (b) Cosine similarity. Separability among indices was performed in order to identify the spectral regions which can be used for the enhancement of the OOMW identification in satellite images.
Agapiou et al. Discriminant analysis of olive oil mill wastes using spectroradiometers
796
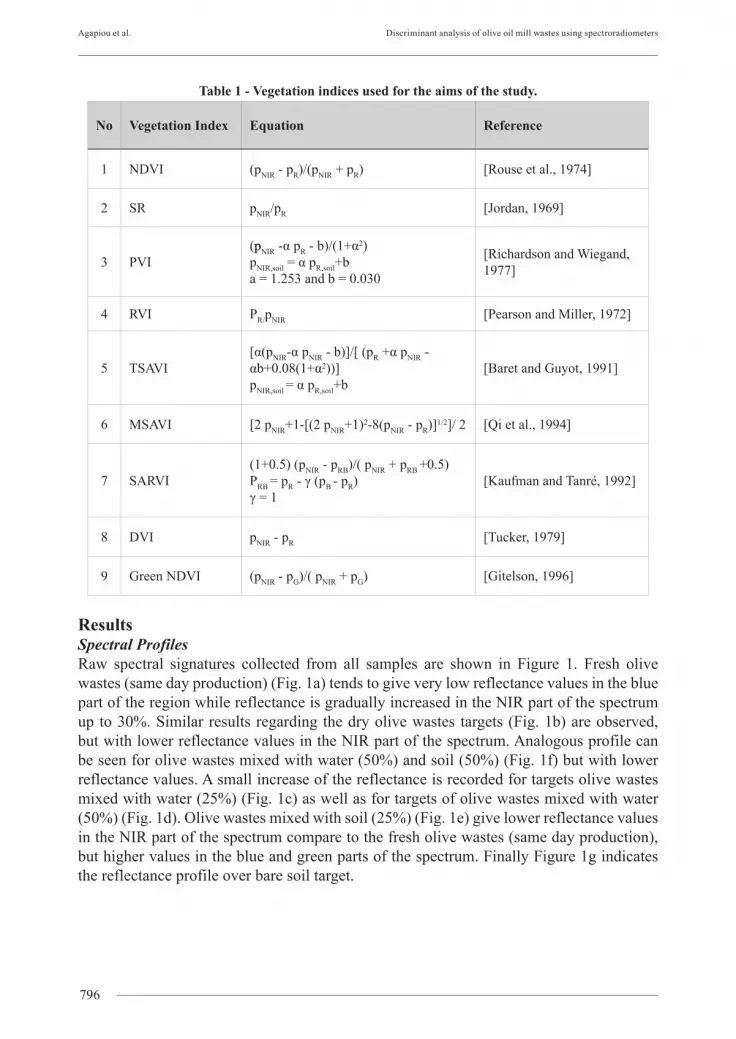
Table 1 - Vegetation indices used for the aims of the study.
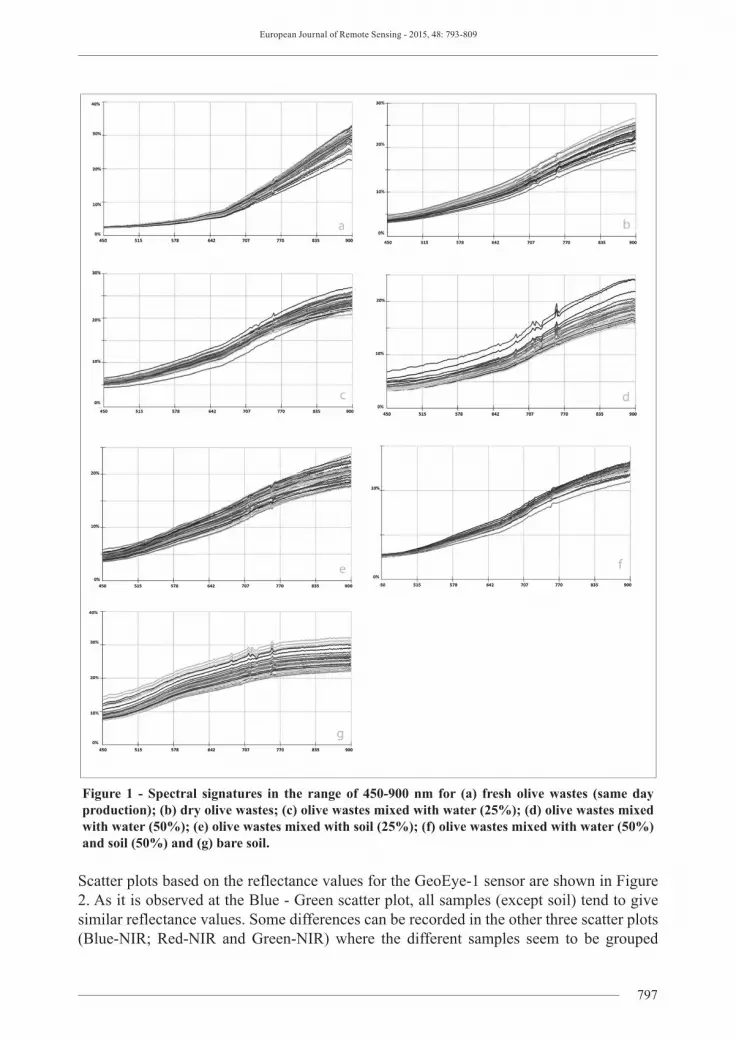
ResultsSpectral ProfilesRaw spectral signatures collected from all samples are shown in Figure 1. Fresh olive wastes (same day production) (Fig. 1a) tends to give very low reflectance values in the blue part of the region while reflectance is gradually increased in the NIR part of the spectrum up to 30%. Similar results regarding the dry olive wastes targets (Fig. 1b) are observed, but with lower reflectance values in the NIR part of the spectrum. Analogous profile can be seen for olive wastes mixed with water (50%) and soil (50%) (Fig. 1f) but with lower reflectance values. A small increase of the reflectance is recorded for targets olive wastes mixed with water (25%) (Fig. 1c) as well as for targets of olive wastes mixed with water (50%) (Fig. 1d). Olive wastes mixed with soil (25%) (Fig. 1e) give lower reflectance values in the NIR part of the spectrum compare to the fresh olive wastes (same day production), but higher values in the blue and green parts of the spectrum. Finally Figure 1g indicates the reflectance profile over bare soil target.
797
European Journal of Remote Sensing - 2015, 48: 793-809
Figure 1 - Spectral signatures in the range of 450-900 nm for (a) fresh olive wastes (same day production); (b) dry olive wastes; (c) olive wastes mixed with water (25%); (d) olive wastes mixed with water (50%); (e) olive wastes mixed with soil (25%); (f) olive wastes mixed with water (50%) and soil (50%) and (g) bare soil.
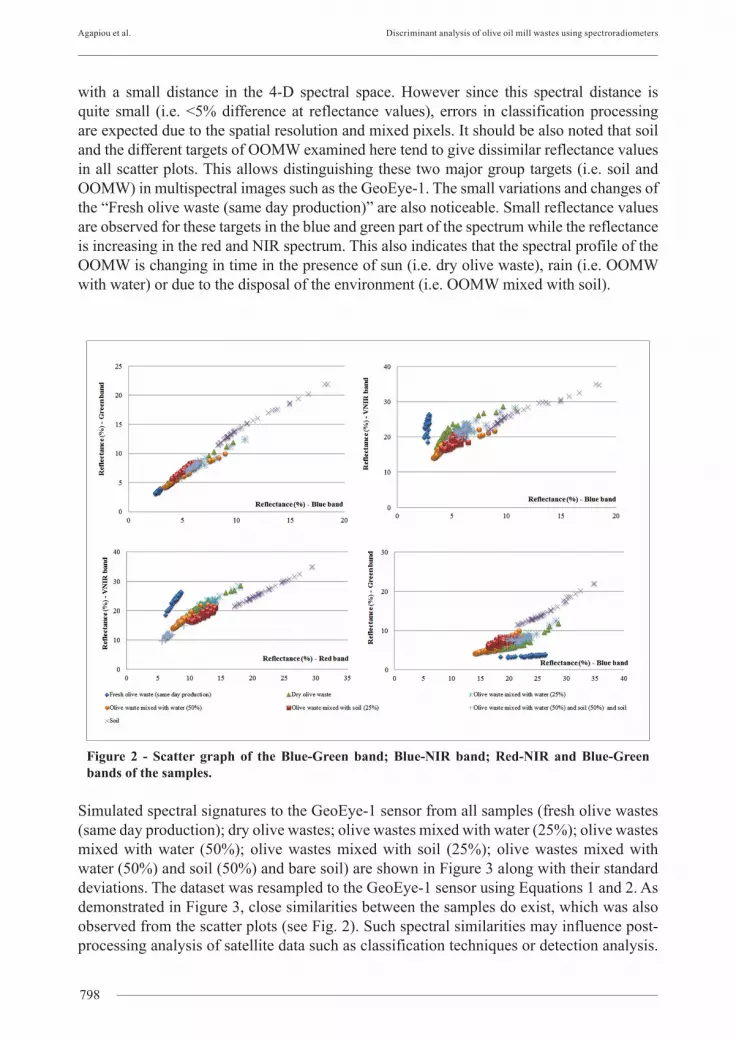
Scatter plots based on the reflectance values for the GeoEye-1 sensor are shown in Figure 2. As it is observed at the Blue - Green scatter plot, all samples (except soil) tend to give similar reflectance values. Some differences can be recorded in the other three scatter plots (Blue-NIR; Red-NIR and Green-NIR) where the different samples seem to be grouped
Agapiou et al. Discriminant analysis of olive oil mill wastes using spectroradiometers
798
with a small distance in the 4-D spectral space. However since this spectral distance is quite small (i.e. <5% difference at reflectance values), errors in classification processing are expected due to the spatial resolution and mixed pixels. It should be also noted that soil and the different targets of OOMW examined here tend to give dissimilar reflectance values in all scatter plots. This allows distinguishing these two major group targets (i.e. soil and OOMW) in multispectral images such as the GeoEye-1. The small variations and changes of the “Fresh olive waste (same day production)” are also noticeable. Small reflectance values are observed for these targets in the blue and green part of the spectrum while the reflectance is increasing in the red and NIR spectrum. This also indicates that the spectral profile of the OOMW is changing in time in the presence of sun (i.e. dry olive waste), rain (i.e. OOMW with water) or due to the disposal of the environment (i.e. OOMW mixed with soil).
Figure 2 - Scatter graph of the Blue-Green band; Blue-NIR band; Red-NIR and Blue-Green bands of the samples.
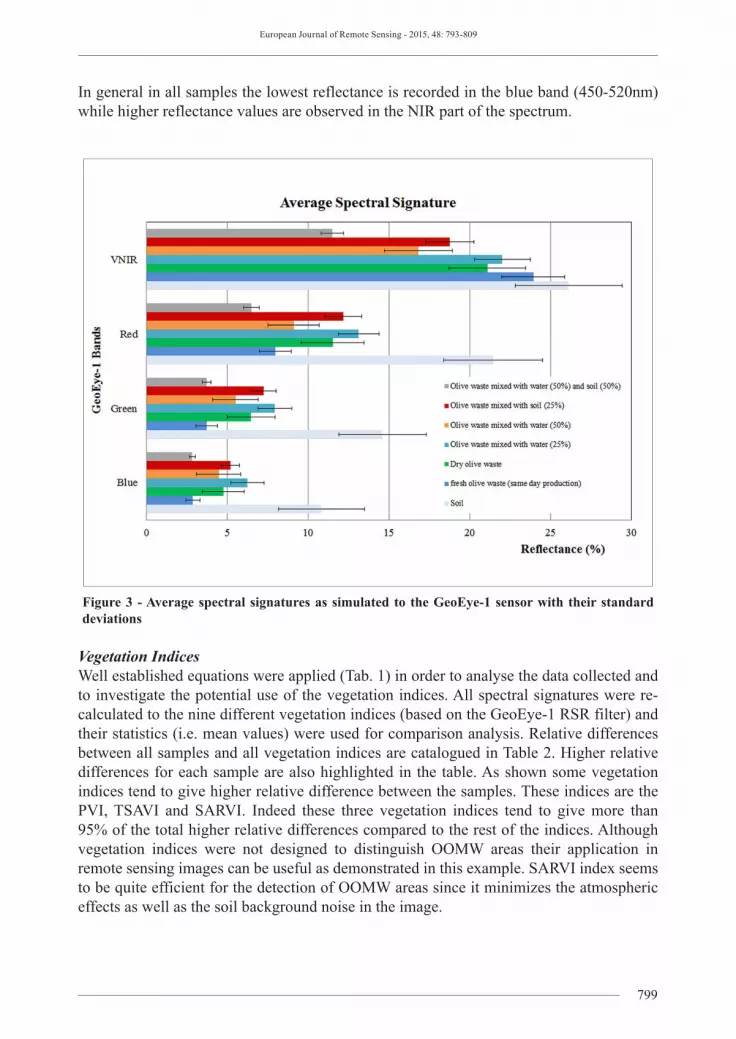
Simulated spectral signatures to the GeoEye-1 sensor from all samples (fresh olive wastes (same day production); dry olive wastes; olive wastes mixed with water (25%); olive wastes mixed with water (50%); olive wastes mixed with soil (25%); olive wastes mixed with water (50%) and soil (50%) and bare soil) are shown in Figure 3 along with their standard deviations. The dataset was resampled to the GeoEye-1 sensor using Equations 1 and 2. As demonstrated in Figure 3, close similarities between the samples do exist, which was also observed from the scatter plots (see Fig. 2). Such spectral similarities may influence post-processing analysis of satellite data such as classification techniques or detection analysis.
799
European Journal of Remote Sensing - 2015, 48: 793-809
In general in all samples the lowest reflectance is recorded in the blue band (450-520nm) while higher reflectance values are observed in the NIR part of the spectrum.
Figure 3 - Average spectral signatures as simulated to the GeoEye-1 sensor with their standard deviations
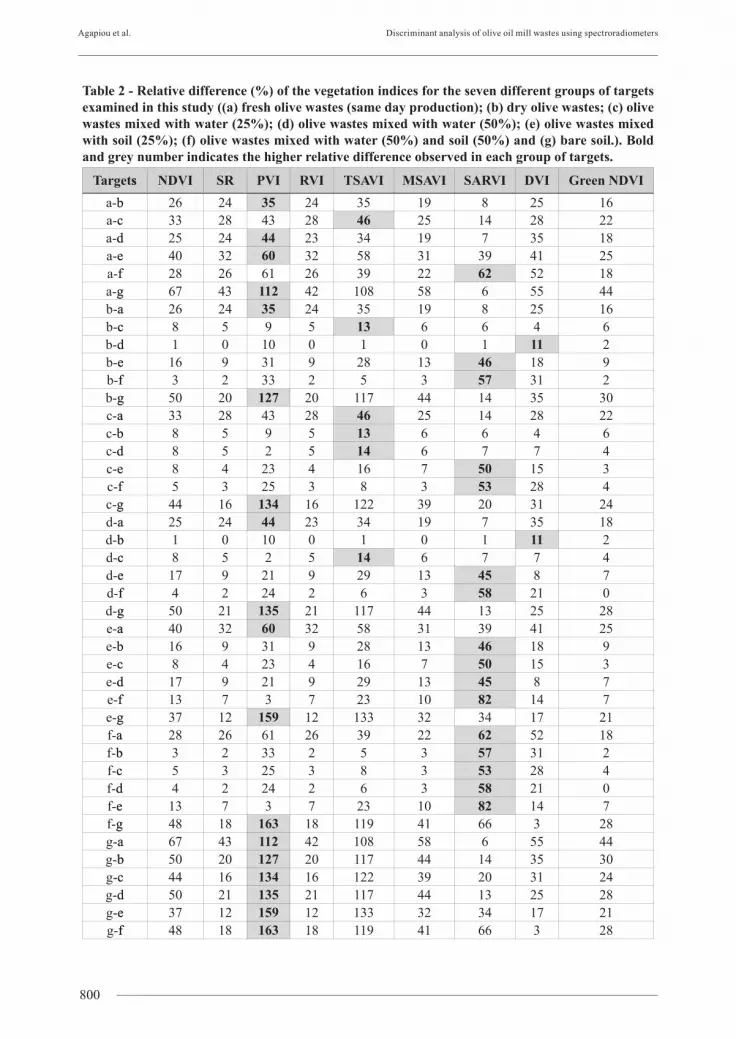
Vegetation IndicesWell established equations were applied (Tab. 1) in order to analyse the data collected and to investigate the potential use of the vegetation indices. All spectral signatures were re-calculated to the nine different vegetation indices (based on the GeoEye-1 RSR filter) and their statistics (i.e. mean values) were used for comparison analysis. Relative differences between all samples and all vegetation indices are catalogued in Table 2. Higher relative differences for each sample are also highlighted in the table. As shown some vegetation indices tend to give higher relative difference between the samples. These indices are the PVI, TSAVI and SARVI. Indeed these three vegetation indices tend to give more than 95% of the total higher relative differences compared to the rest of the indices. Although vegetation indices were not designed to distinguish OOMW areas their application in remote sensing images can be useful as demonstrated in this example. SARVI index seems to be quite efficient for the detection of OOMW areas since it minimizes the atmospheric effects as well as the soil background noise in the image.
Agapiou et al. Discriminant analysis of olive oil mill wastes using spectroradiometers
800
Table 2 - Relative difference (%) of the vegetation indices for the seven different groups of targets examined in this study ((a) fresh olive wastes (same day production); (b) dry olive wastes; (c) olive wastes mixed with water (25%); (d) olive wastes mixed with water (50%); (e) olive wastes mixed with soil (25%); (f) olive wastes mixed with water (50%) and soil (50%) and (g) bare soil.). Bold and grey number indicates the higher relative difference observed in each group of targets.
European Journal of Remote Sensing - 2015, 48: 793-809
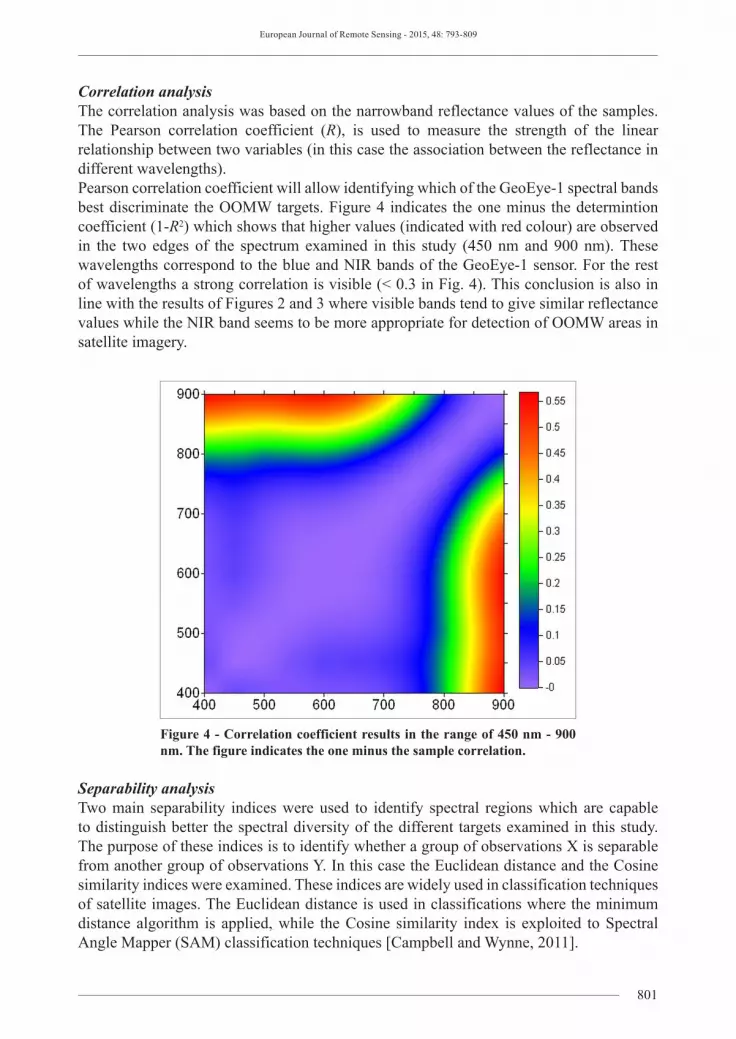
Correlation analysisThe correlation analysis was based on the narrowband reflectance values of the samples. The Pearson correlation coefficient (R), is used to measure the strength of the linear relationship between two variables (in this case the association between the reflectance in different wavelengths).Pearson correlation coefficient will allow identifying which of the GeoEye-1 spectral bands best discriminate the OOMW targets. Figure 4 indicates the one minus the determintion coefficient (1-R2) which shows that higher values (indicated with red colour) are observed in the two edges of the spectrum examined in this study (450 nm and 900 nm). These wavelengths correspond to the blue and NIR bands of the GeoEye-1 sensor. For the rest of wavelengths a strong correlation is visible (< 0.3 in Fig. 4). This conclusion is also in line with the results of Figures 2 and 3 where visible bands tend to give similar reflectance values while the NIR band seems to be more appropriate for detection of OOMW areas in satellite imagery.
Figure 4 - Correlation coefficient results in the range of 450 nm - 900 nm. The figure indicates the one minus the sample correlation.
Separability analysisTwo main separability indices were used to identify spectral regions which are capable to distinguish better the spectral diversity of the different targets examined in this study. The purpose of these indices is to identify whether a group of observations X is separable from another group of observations Y. In this case the Euclidean distance and the Cosine similarity indices were examined. These indices are widely used in classification techniques of satellite images. The Euclidean distance is used in classifications where the minimum distance algorithm is applied, while the Cosine similarity index is exploited to Spectral Angle Mapper (SAM) classification techniques [Campbell and Wynne, 2011].
Agapiou et al. Discriminant analysis of olive oil mill wastes using spectroradiometers
802
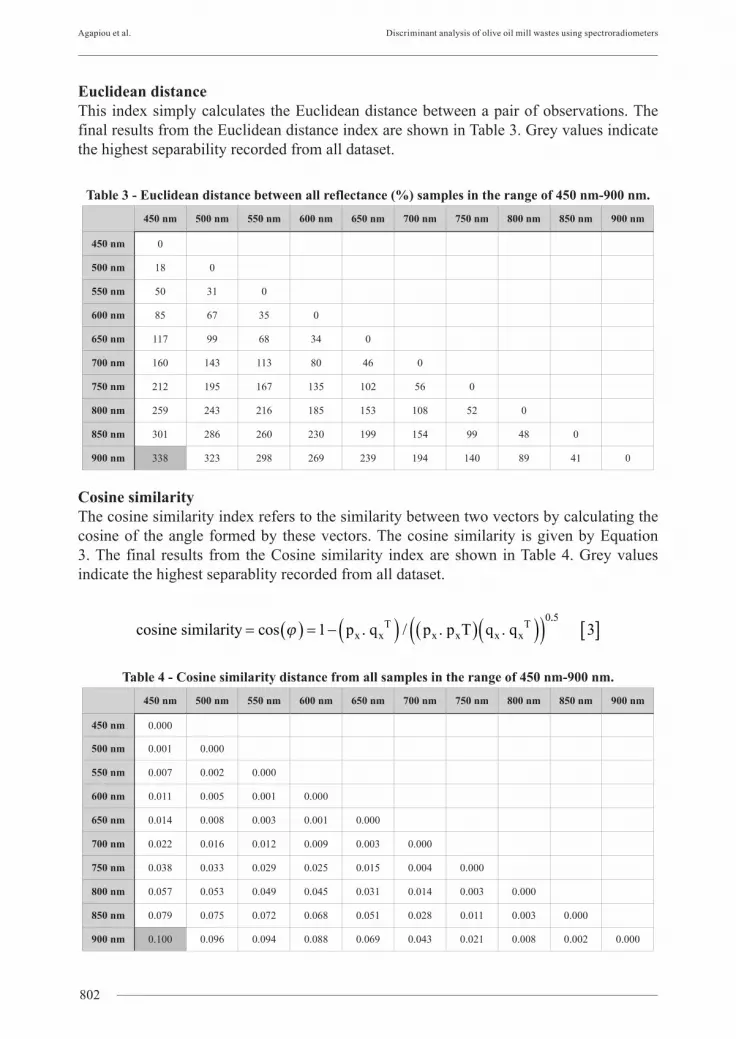
Euclidean distanceThis index simply calculates the Euclidean distance between a pair of observations. The final results from the Euclidean distance index are shown in Table 3. Grey values indicate the highest separability recorded from all dataset.
Table 3 - Euclidean distance between all reflectance (%) samples in the range of 450 nm-900 nm.450 nm 500 nm 550 nm 600 nm 650 nm 700 nm 750 nm 800 nm 850 nm 900 nm
450 nm 0
500 nm 18 0
550 nm 50 31 0
600 nm 85 67 35 0
650 nm 117 99 68 34 0
700 nm 160 143 113 80 46 0
750 nm 212 195 167 135 102 56 0
800 nm 259 243 216 185 153 108 52 0
850 nm 301 286 260 230 199 154 99 48 0
900 nm 338 323 298 269 239 194 140 89 41 0
Cosine similarityThe cosine similarity index refers to the similarity between two vectors by calculating the cosine of the angle formed by these vectors. The cosine similarity is given by Equation 3. The final results from the Cosine similarity index are shown in Table 4. Grey values indicate the highest separablity recorded from all dataset.
cosine similarity cos 1 p q p p q qx x x x x x= ( ) = − ( ) ( )( )( )ϕ . / . .Τ ΤΤ0..5
3[ ]
Table 4 - Cosine similarity distance from all samples in the range of 450 nm-900 nm.450 nm 500 nm 550 nm 600 nm 650 nm 700 nm 750 nm 800 nm 850 nm 900 nm
European Journal of Remote Sensing - 2015, 48: 793-809
The final results from both separability indices indicate that 450nm (blue band) and 900 nm (NIR band) are the best GeoEye-1bands for the detection of OOMW targets. Therefore using these spectral regions (i.e. Blue and NIR in the GeoEye-1 image) OOMW areas should be enhanced better than any other spectral combination.
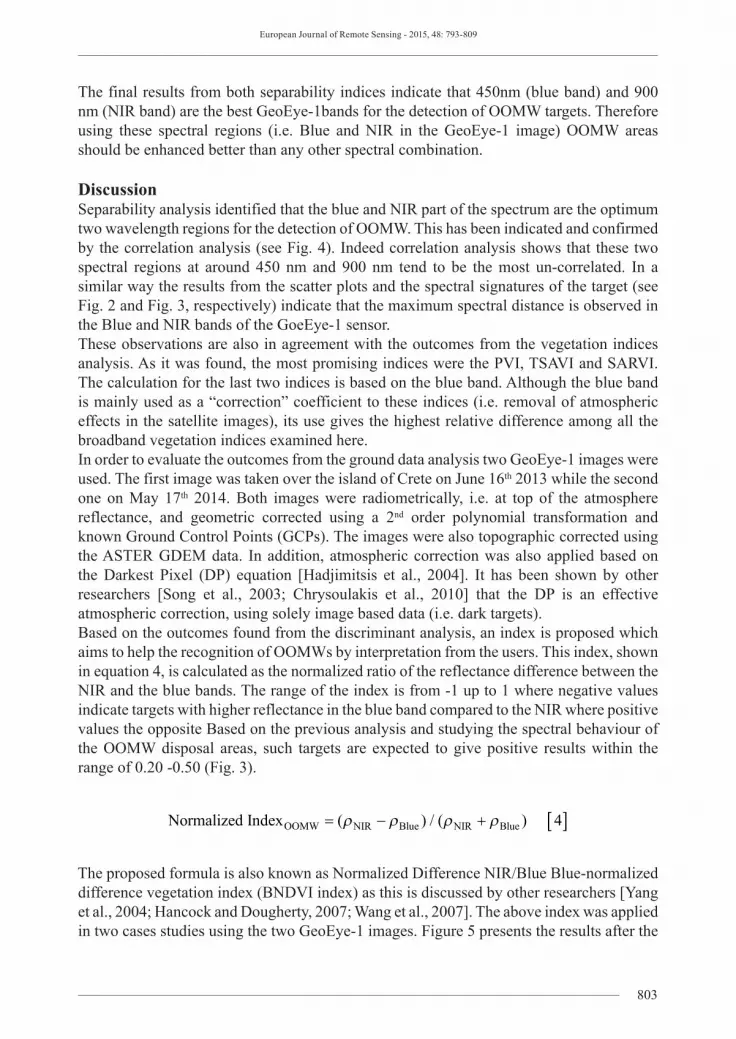
DiscussionSeparability analysis identified that the blue and NIR part of the spectrum are the optimum two wavelength regions for the detection of OOMW. This has been indicated and confirmed by the correlation analysis (see Fig. 4). Indeed correlation analysis shows that these two spectral regions at around 450 nm and 900 nm tend to be the most un-correlated. In a similar way the results from the scatter plots and the spectral signatures of the target (see Fig. 2 and Fig. 3, respectively) indicate that the maximum spectral distance is observed in the Blue and NIR bands of the GoeEye-1 sensor.These observations are also in agreement with the outcomes from the vegetation indices analysis. As it was found, the most promising indices were the PVI, TSAVI and SARVI. The calculation for the last two indices is based on the blue band. Although the blue band is mainly used as a “correction” coefficient to these indices (i.e. removal of atmospheric effects in the satellite images), its use gives the highest relative difference among all the broadband vegetation indices examined here.In order to evaluate the outcomes from the ground data analysis two GeoEye-1 images were used. The first image was taken over the island of Crete on June 16th 2013 while the second one on May 17th 2014. Both images were radiometrically, i.e. at top of the atmosphere reflectance, and geometric corrected using a 2nd order polynomial transformation and known Ground Control Points (GCPs). The images were also topographic corrected using the ASTER GDEM data. In addition, atmospheric correction was also applied based on the Darkest Pixel (DP) equation [Hadjimitsis et al., 2004]. It has been shown by other researchers [Song et al., 2003; Chrysoulakis et al., 2010] that the DP is an effective atmospheric correction, using solely image based data (i.e. dark targets).Based on the outcomes found from the discriminant analysis, an index is proposed which aims to help the recognition of OOMWs by interpretation from the users. This index, shown in equation 4, is calculated as the normalized ratio of the reflectance difference between the NIR and the blue bands. The range of the index is from -1 up to 1 where negative values indicate targets with higher reflectance in the blue band compared to the NIR where positive values the opposite Based on the previous analysis and studying the spectral behaviour of the OOMW disposal areas, such targets are expected to give positive results within the range of 0.20 -0.50 (Fig. 3).
The proposed formula is also known as Normalized Difference NIR/Blue Blue-normalized difference vegetation index (BNDVI index) as this is discussed by other researchers [Yang et al., 2004; Hancock and Dougherty, 2007; Wang et al., 2007]. The above index was applied in two cases studies using the two GeoEye-1 images. Figure 5 presents the results after the
Agapiou et al. Discriminant analysis of olive oil mill wastes using spectroradiometers
804
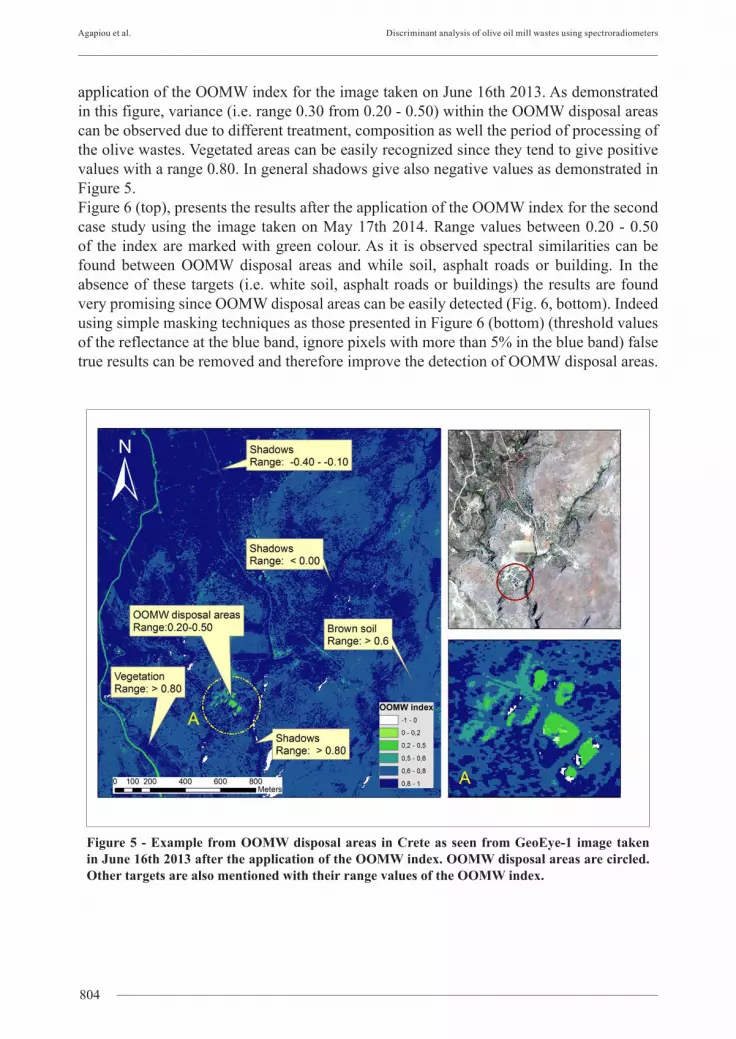
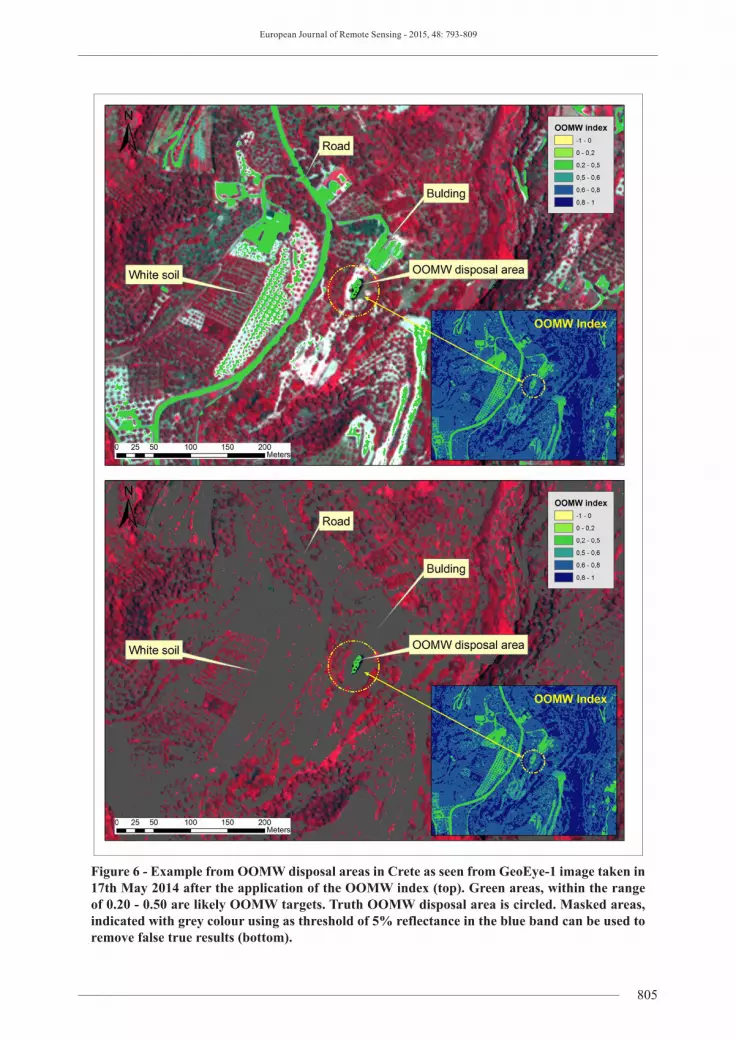
application of the OOMW index for the image taken on June 16th 2013. As demonstrated in this figure, variance (i.e. range 0.30 from 0.20 - 0.50) within the OOMW disposal areas can be observed due to different treatment, composition as well the period of processing of the olive wastes. Vegetated areas can be easily recognized since they tend to give positive values with a range 0.80. In general shadows give also negative values as demonstrated in Figure 5.Figure 6 (top), presents the results after the application of the OOMW index for the second case study using the image taken on May 17th 2014. Range values between 0.20 - 0.50 of the index are marked with green colour. As it is observed spectral similarities can be found between OOMW disposal areas and while soil, asphalt roads or building. In the absence of these targets (i.e. white soil, asphalt roads or buildings) the results are found very promising since OOMW disposal areas can be easily detected (Fig. 6, bottom). Indeed using simple masking techniques as those presented in Figure 6 (bottom) (threshold values of the reflectance at the blue band, ignore pixels with more than 5% in the blue band) false true results can be removed and therefore improve the detection of OOMW disposal areas.
Figure 5 - Example from OOMW disposal areas in Crete as seen from GeoEye-1 image taken in June 16th 2013 after the application of the OOMW index. OOMW disposal areas are circled. Other targets are also mentioned with their range values of the OOMW index.
805
European Journal of Remote Sensing - 2015, 48: 793-809
Figure 6 - Example from OOMW disposal areas in Crete as seen from GeoEye-1 image taken in 17th May 2014 after the application of the OOMW index (top). Green areas, within the range of 0.20 - 0.50 are likely OOMW targets. Truth OOMW disposal area is circled. Masked areas, indicated with grey colour using as threshold of 5% reflectance in the blue band can be used to remove false true results (bottom).
Agapiou et al. Discriminant analysis of olive oil mill wastes using spectroradiometers
806
OOMW index is very sensitive to the atmospheric conditions of the area, so atmospheric correction of the satellite images is essential prior to the calculation of the index. Rayleigh scattering can change the reflectance values significantly especially in the blue part of the spectrum giving out of range values than those presented in this paper. From examples carried out from the authors (not shown here) it was found that without atmospheric correction, OOMW index can give even negative values in pixels with OOMW disposal areas. Image-based atmospheric corrections algorithms, as those of the DP method, can be easily applied by users and solved this problem [Agapiou et al., 2011].
ConclusionsThis paper aims to highlight the contribution of satellite remote sensing as a tool for systematic and effective way for monitoring OMWW disposal areas. Previous studies have shown [Agapiou et al., 2015] that remote sensing can be used as an alternative and effective tool for the detection of OMWW areas.This paper has investigated several samples related with OOMW using ground spectroradiometers and was able to report the performance of some indices and the employed satellite bands. Discriminant analysis was carried out in the samples collected and the final results have shown that the NR and Blue spectral bands of the GeoEye-1 can be used to enhance the results in the satellite images. This conclusion was observed in a variety of remote sensing analysis: from simple scatter plots and spectral signatures, to vegetation indices as well to separability indices.An index that can help the recognition of OOMWs disposal areas was applied to GeoEye-1 multispectral images successfully, improving the interpretation of the image. Although OOMW index (i.e. same as BNDVI index) can help the detection of OOMW disposal areas, other targets such as soil and roads can be seen within the same range value, and therefore interpretation from users is essential so as to recognize the real OOMW areas. Empirical values indicate that the range between 0.20-0.50 of the OOMW index is appropriate to distinguish OOMW disposal areas from the surrounding areas. However, radiometric corrections including the application of atmospheric techniques to the images are essential prior to the interpretation and extraction of OOMW disposal areas. In this range of the index (i.e. 0.20-0.50) other targets can be also included. However, the application of the proposed index can minimize the area of interest at a satellite image, and improve therefore automatic extraction of OOMW areas. Indeed, techniques for the automatic detection of OOMW disposal areas have been proposed by the authors [Agapiou et al., 2015] taking into consideration also spatial characteristics (e.g. size and shape) so as to detect OOMW disposal areas.It should be noticed however that the spectral reflectance of olive waste (given the olive waste level of purity) has to be “spectrally different” enough from surrounding targets in order to be distinguished from them. In addition, suitable remote sensing images have to be available to this aim including further the spectral resolution (NIR and blue bands) also radiometric, spatial and spectral, temporal resolution. Other high resolution satellite data can be used as well so as to detect OOMW disposal areas. Other studies perform by the authors (see forthcoming publications) have recently shown, IKONOS sensor has the potential for the detection of OOMW areas. The overall results suggest that satellite remote sensing images can be used sufficiently for detecting and monitoring OOMW
807
European Journal of Remote Sensing - 2015, 48: 793-809
disposal areas in the whole life cycle (from fresh olive waste to mixed olive waste with soil). Future work of the authors will concentrate in the evaluation of other high resolution satellite sensors such as WorldView-2, QuickBird and Pleiades, while the potential use of Unmanned Aerial Vehicles (UAVs) attached with remote sensing sensors over OOMW areas will be attempted. Also linear and no-linear spectral unmixing techniques can be investigated based on ground truth data as those obtained in this paper so as to improve the detection of OOMW disposal areas.
AcknowledgmentsThis work was performed in the framework of the PEFYKA project within the KRIPIS Action of the GSRT. The project is funded by Greece and the European Regional Development Fund of the European Union under the NSRF and the O.P. Competitiveness and Entrepreneurship.
ReferencesAgapiou A., Papadopoulos N., Sarris A. (2015) - Olive oil mill wastes: a monitoring
approach through space technologies. Proceedings of the Third International Conference on Remote Sensing and Geoinformation of Environment, 16-19 March 2015, Pafos, Cyprus.
Agapiou A., Hadjimitsis D.G., Papoutsa C., Alexakis D.D., Papadavid G. (2011) - The Importance of Accounting for Atmospheric Effects in the Application of NDVI and Interpretation of Satellite Imagery Supporting Archaeological Research: The Case Studies of Palaepaphos and Nea Paphos Sites in Cyprus. Remote Sensing, 3: 2605-2629. doi: http://dx.doi.org/10.3390/rs3122605.
Asfi M., Ouzounidou G., Panajiotidis S., Therios I., Moustakas M. (2012) - Toxicity effects of olive-mill wastewater on growth, photosynthesis and pollen morphology of spinach plants. Ecotoxicology and Environmental Safety, 80 (1): 69-75. doi: http://dx.doi.org/10.1016/j.ecoenv.2012.02.030.
Baret F., Guyot G. (1991) - Potentials and limits of vegetation indices for LAI and APAR assessment. Remote Sensing of Environment, 35: 161-173. doi: http://dx.doi.org/10.1016/0034-4257(91)90009-U.
Campbell J.B., Wynne H.R. (2011) - Introduction to Remote Sensing. The Guilford Press, 5th edition, ISBN-13: 978-1609181765.
Chrysoulakis N., Abrams M., Feidas H., Arai K. (2010) - Comparison of atmospheric correction methods using ASTER data for the area of Crete: The ATMOSAT Project. International Journal of Remote Sensing, 31: 6347-6385. doi: http://dx.doi.org/10.1080/01431160903413697.
Dermeche S., Nadour M., Larroche C., Moulti-Mati F., Michaud P. (2013) - Olive mill wastes: Biochemical characterizations and valorization strategies. Process Biochemistry, 48 (10): 1532-1552. doi: http://dx.doi.org/10.1016/j.procbio.2013.07.010.
Gitelson A.A., Kaufman Y.J., Merzlyak M.N. (1996) - Use of a green channel in remote sensing of global vegetation from EOS-MODIS. Remote Sensing of Environment, 58: 289-298. doi: http://dx.doi.org/10.1016/S0034-4257(96)00072-7.
Hadjimitsis D.G., Clayton C.R.I., Hope V.S. (2004) - An assessment of the effectiveness of atmospheric correction algorithms through the remote sensing of some reservoirs.
Agapiou et al. Discriminant analysis of olive oil mill wastes using spectroradiometers
808
International Journal of Remote Sensing, 25: 3651-3674. doi: http://dx.doi.org/10.1080/01431160310001647993.
Hancock D.W., Dougherty C.T. (2007) - Relationships between blue- and red-based vegetation indices and leaf area and yield of alfalfa. Crop Science, 47 (6): 2547-2556. doi: http://dx.doi.org/10.2135/cropsci2007.01.0031.
Hanifi S., El Hadrami I. (2009) - Olive mill wastewaters: Diversity of the fatal product in olive oil industry and its valorisation as agronomical amendment of poor soils. A review. Journal of Agronomy, 8: 1-13. doi: http://dx.doi.org/10.3923/ja.2009.1.13.
Jordan C.F. (1969) - Derivation of leaf area index from quality of light on the forest floor. Ecology, 50: 663-666. doi: http://dx.doi.org/10.2307/1936256.
Kavvadias V., Doula M., Theocharopoulos S. (2014) - Long-Term Effects on Soil of the Disposal of Olive Mill Waste Waters (OMW). Environmental Forensics, 15 (1): 37-51. doi: http://dx.doi.org/10.1080/15275922.2013.872713.
Kaufman Y.J., Tanré D. (1992) - Atmospherically resistant vegetation index (ARVI) for EOS-MODIS. IEEE Transaction on Geoscience and Remote Sensing, 30: 261-270. doi: http://dx.doi.org/10.1109/36.134076.
Komnitsas K., Zaharaki D., Doula M., Kavvadias V. (2011) - Origin of recalcitrant heavy metals present in olive mill wastewater evaporation ponds and nearby agricultural Soils. Environmental Forensics, 12: 319-326. doi: http://dx.doi.org/10.1080/15275922.2011.622349.
Niaounakis M., Halvadakis C.P. (2006) - Olive processing waste management. Literature review and patent survey. Waste Management Series, 5, Elsevier Ltd.
Pearson R.L., Miller L.D. (1972) - Remote Mapping of Standing Crop Biomass and Estimation of the Productivity of the Short Grass Prairie, Pawnee National Grasslands, Colorado. In: Proceedings of the 8th International Symposium on Remote Sensing of the Environment, Ann Arbor, MI, USA, 2-6 October 1972, pp. 1357-1381.
Roig A., Cayuela M.L., Sánchez-monedero M.A. (2006) - An overview on olive mill wastes and their valorisation methods. Waste Management, 26 (9): 960-969. doi: http://dx.doi.org/10.1016/j.wasman.2005.07.024.
Rouse J.W., Haas R.H., Schell J.A., Deering D.W., Harlan J.C. (1974) - Monitoring the Vernal Advancements and Retrogradation (Greenwave Effect) of Nature Vegetation. NASA/GSFC Final Report; NASA: Greenbelt, MD, USA, 1974.
Song J., Duanjun L., Wesely M.L. (2003) - A simplified Atmospheric Correction Procedure for the Normalized Difference Vegetation Index. Photogrammetric Engineering & Remote Sensing, 69: 521-528. doi: http://dx.doi.org/10.14358/PERS.69.5.521.
Tucker C.J. (1979) - Red and photographic infrared linear combinations for monitoring vegetation. Remote Sensing of Environment, 8: 127-150. doi: http://dx.doi.org/10.1016/0034-4257(79)90013-0.
Wang F.-M., Huang J.-F., Tang Y.-L., Wang X.-Z. (2007) - New Vegetation Index and Its Application in Estimating Leaf Area Index of Rice. Rice Science, 14 (3): 195-203. doi:
809
European Journal of Remote Sensing - 2015, 48: 793-809