This paper (SPE 121669) was accepted for presentation at the SPE International Symposium on Oilfield Chemistry, The Woodlands, Texas, USA, 20–22 April 2009, and revised for publication. Original manuscript received for review 17 February 2009. Revised manuscript received for review 27 August 2009. Paper peer approved 10 November 2009.
Summary
With the increasing development of heavy- and extraheavy-oil (EHO) fields, separation operations are becoming increasingly challenging compared to separation for conventional oil fields. For in-situ bitumen, EHOs produced by thermal-process dehydration require solvent addition, injection of a large amount of demulsifier additives, relatively high operating temperature, and long retention times inside the separators. So, in order to respect specifications on crude oil and water quality at lower cost, an optimization of the different parameters involved in the whole process of separation becomes necessary.
In the case of EHOs, the presence of polar heavy components, such as asphaltenes, structured as a rigid film at the water/oil inter-face, limits the coalescence phenomena and, consequently, limits the efficiency of separation by gravity or by using conventional electrocoalescence.
The paper presents a methodology that permits the optimization of water and oil separation in the case of an in-situ EHO (produced by thermal process). The crude oil was first characterized in terms of rheological behavior and interfacial properties. The dilatational viscoelastic properties of the interface were determined from measurements performed with an oscillating oil-drop tensiometer. Properties of emulsification were also investigated by using a specific device called a dispersion rig that allows the reconstitution of crude-oil emulsions under controlled hydrodynamic conditions. Then, a laboratory procedure based on electrical stability tests (ESTs) was applied to optimize the concentration of demulsifier required for effective water separation.
Finally, the optimal electrical parameters were determined in an electrocoalescer device in the presence of the selected concentra-tion of additive. The efficiency of coalescence was measured by following the growth of dispersed water droplets inside the emul-sion using differential scanning calorimetry (DSC).
This methodology may be used advantageously as a useful base for further scaleup studies concerning field separation facilities.
Introduction
In-situ EHOs produced by cold or thermal methods (e.g., steam-assisted gravity drainage) tend to form tight and stable emulsions containing oil, water, diluents, and solids. These emulsions have to be treated either by using conventional gravity-based vessels operating at high temperatures with long retention times and huge chemical injection or by using more-advanced technologies, such as electrostatic coalescers (Sams and Zaouk 2000; Noïk et al. 2005, 2006; Eow and Ghadiri 2002).
For thermal in-situ EHOs, such as the ones in Athabasca, elec-trocoalescence is scarcely used. This paper will present the specific case of one of these EHOs for which a rigorous methodology was applied in the laboratory to optimize water and oil separation by electrocoalescence.
First, some chemical and physicochemical properties, such as rheological behavior and interfacial and emulsification properties,
were investigated. Then, a laboratory procedure based on ESTs was applied to select an efficient demulsifier and to determine the optimal concentration required for an effective crude dehydration. Finally, emulsions from the extraheavy crude oils were submitted to electrocoalescence experiments at high frequency on a tubular electrocoalescer device developed in the French Institute of Petro-leum (IFP). The efficiency of coalescence determined by DSC allowed for the evaluation of the influence of parameters such as additive concentration, residence time under electrical field, and temperature.
Materials and Methods
Fluids and Additives. EHO is an extraheavy crude oil issued from thermal production and provided by the operators directly from the fi eld without any emulsion-breaker additive. The dehy-drated-crude-oil properties are given in Table 1. The samples were received as water-in-oil emulsions containing approximately 40% dispersed water. These emulsion samples were diluted with naphtha to respect a fi xed weight ratio of x% dehydrated crude oil/y% naphtha. Then, the diluted emulsions were centrifuged for 30 minutes at 10,000 rev/min to separate the water phase. After centrifugation, the supernatant corresponding to x% dehydrated crude oil/y% naphtha was collected for the different experiments. The reconstituted water/oil emulsions were prepared by using synthetic brine with 5 g/L of NaCl. Two different types of naphtha solvent were used: Naphtha P with density at 15°C of 0.7929 g/cm3 and Naphtha J with a density at 15°C of 0.6814 g/cm3.
Six emulsion-breaker additives coming from different fields (cold and thermal production) were studied.
Densities and Viscosities. Densities were determined by using an Anton Paar DMA 5000 densimeter. The instrument used for rheological measurements was a Haake RS150, which is a rotary rheometer. For fl ow-curve determination, shear rate is fi xed and shear stress is measured under coaxial cylinder geometry at con-trolled temperature. Viscosity is determined in the shear-rate range between 0.1 and 1000 s−1.
Interfacial Properties. A Krüss K100 tensiometer equipped with a Wilhelmy plate was used to determine static interfacial tensions (IFTs) between oil and water phases. Dynamic IFT measurements were performed using a drop tensiometer (Tracker from IT Con-cept), which is thoroughly described by Benjamins et al. (1996).
The oil-drop technique is an established method for measur-ing IFT at nonmiscible-liquids interface. In the present setup, the oil-drop profile is analyzed automatically, and it is necessary to consider the pressure difference �P between the inside and outside of the drop. The IFT is deduced using the Laplace equation:
where � is interfacial tension and R1 and R2 are the main radii of the curvature of the drop.
The Tracker oil-drop tensiometer consists simply of a light source, a cell containing the oil drop, and a charge-coupled-device camera aligned on an optical bench. After the drop formation using a syringe and motor for pressing down the syringe plunger, the drop profile is digitalized through the camera and a personal
September 2010 SPE Journal 727
computer. The monitor is used to align, check, and adjust the drop. Two values of area, volume, and surface tension are calculated and recorded per second.
This apparatus is also designed to measure the dilatational elastic modulus or viscoelastic modulus E*, by programming sinu-soidal variations of the drop area. The software can be used to plot the fluctuating interfacial tension vs. the relative variations in drop area. Then, it is possible to determine both the absolute value of the complex modulus E = �E*� and the phase angle � between the changes in interfacial tension and the changes in interfacial area. In the case of homogeneous deformation of the entire area, the absolute value E can be calculated from the maximum changes in IFT �� and in the interfacial area �A by
The elastic component E�, which characterizes the conservative behavior of the interface, and the viscous component E�, which characterizes the dissipative interfacial phenomena, are then cal-culated from E and �:
Emulsion Characterization by DSC. DSC may be used for emul-sion characterization, and it is especially suitable for water-in-oil emulsions. DSC is based on the measurement of heat exchanges between a sample and a reference as a function of time or tem-perature. The peak area of the recorded signal is related to the heat fl ow generated or absorbed by the sample. The sample is cooled
at a constant scanning rate until the water droplets in the emulsion crystallize. The crystallization temperature is correlated to the drop-let sizes and decreases with them: The smaller the volume of the droplets is, the lower the temperature of crystallization is. This tech-nique may be used advantageously for emulsion characterization before and after application of an electrical stress. The droplet-size evolution is correlated directly to the evolution of the crystallization temperature and energy peaks. The principle of this technique was thoroughly presented in various previous publications (Dalmazzone and Clausse 2001; Clausse et al. 2005a, 2005b).
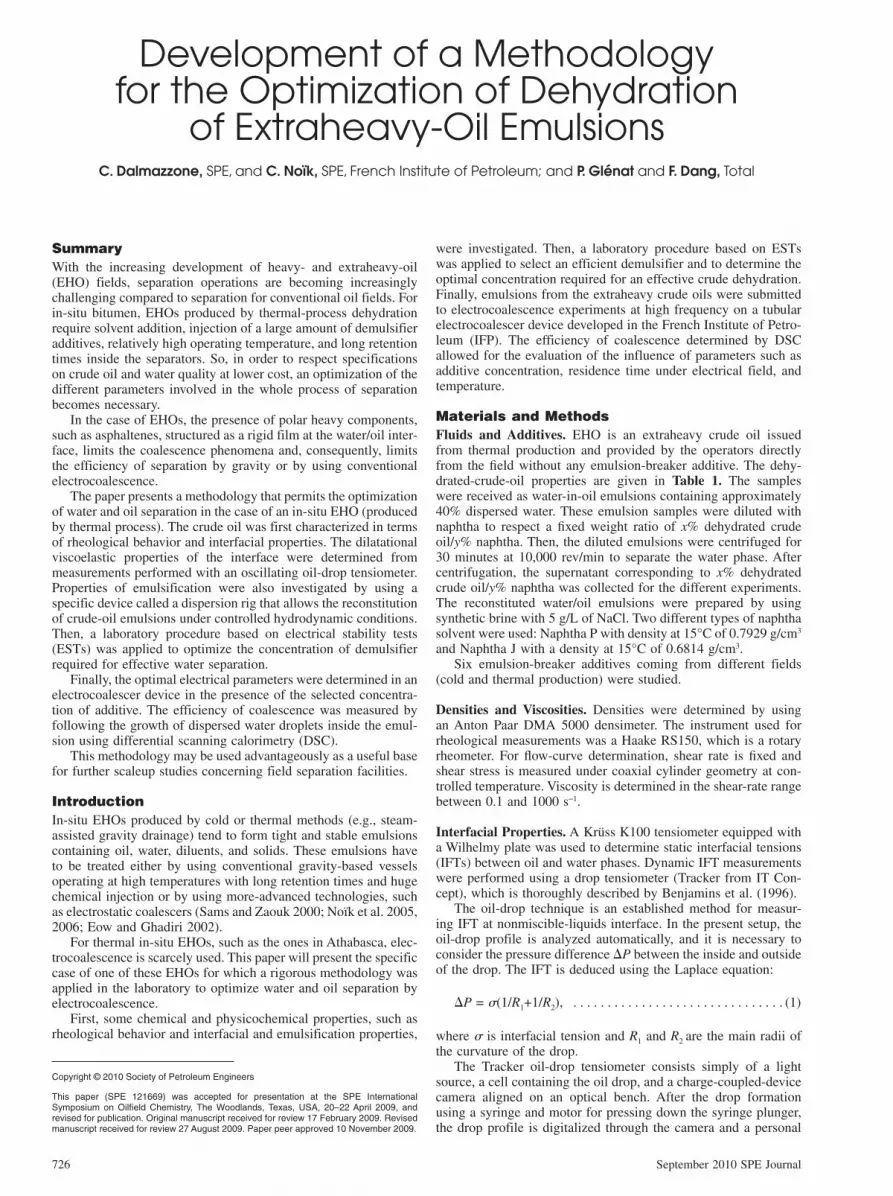
Emulsifi cation Properties by Dispersion Rig. A specifi c experi-mental setup has been developed to reconstitute water-in-crude-oil emulsions under controlled pressure and temperature conditions (Malot et al. 2003; Galinat et al. 2005). The objective is to simulate the fl ow of crude oil and brine through a choke valve by pumping both fl uids through a calibrated orifi ce that represents a model choke valve (Fig. 1). The turbulent fl ow created downstream from the orifi ce leads to a dispersion of water droplets in the oil phase (i.e., emulsion formation). A programmable controller allowing a perfect synchronization of both piston pumps pilots the simultane-ous injection of both fl uids. A maximum volume of 500 mL of each phase can be pumped at a fi xed fl ow rate into the supply tubes. The third pump is a metering pump, which may inject additives in line just after emulsion formation. The fl uid pressure is measured at two locations, upstream and downstream from the orifi ce. This allows the measurement of the permanent pressure drop �Pperm induced by the orifi ce. The produced water/oil mixture is collected in a separator that is located above the orifi ce and then may be analyzed. All of the equipment is placed inside a cupboard and can be heated up to a maximum temperature of 80°C. The maxi-mum pressure is 150 bar in the piston pumps and 50 bar in the separator. The fl uids system produced in the separator is analyzed by measuring the phase volume of oil, emulsion, and free water.
The dispersed water in the emulsion phase is measured by Karl Fischer titration or DSC.
ESTs. The method and electrical tester apparatus used correspond to the ones developed for oil-based drilling mud stability control (API 13B-2). They were recently proposed for the development of chemical demulsifi ers for treating water-in-crude oil emul-sions (Beetge and Horne 2008). It consists of a simple electrode dropped in the fl uid with an alternating current voltage at 340-Hz frequency. The voltage amplitude increases progressively at a rate of 150 V/s and is limited to a maximum of 12.9 kV/cm. The current intensity is measured, and the critical voltage is recorded at 61-�A intensity, which corresponds to the short-circuiting condition of the apparatus. Previous studies have demonstrated that the value of the critical voltage is a good quantitative parameter for characterizing emulsion stability (Beetge and Horne 2008). The higher the critical voltage value, the higher the stability of the emulsion. The mixing procedure used to form the water/oil emulsion is as follows. The total volume of emulsion is 300 mL, prepared in a 600-mL beaker. The mixing device is an Ultra-Turrax T25 homogenizer, equipped with an S25-18G rod. The reconstituted water (5 g/L NaCl) is added drop by drop in the oil phase, and the mixing is performed for 10 minutes at 24,000 rev/min. This procedure allows for the reconstitution of water/oil emulsions similar to the ones obtained in the dispersion rig. Temperature is controlled during the EST, and measurements are performed every 5 minutes on the same prepared emulsion. After the ESTs, the emulsion stability is checked by leaving the emulsion for 24 hours at the test temperature while monitoring the volume of free-water phase.
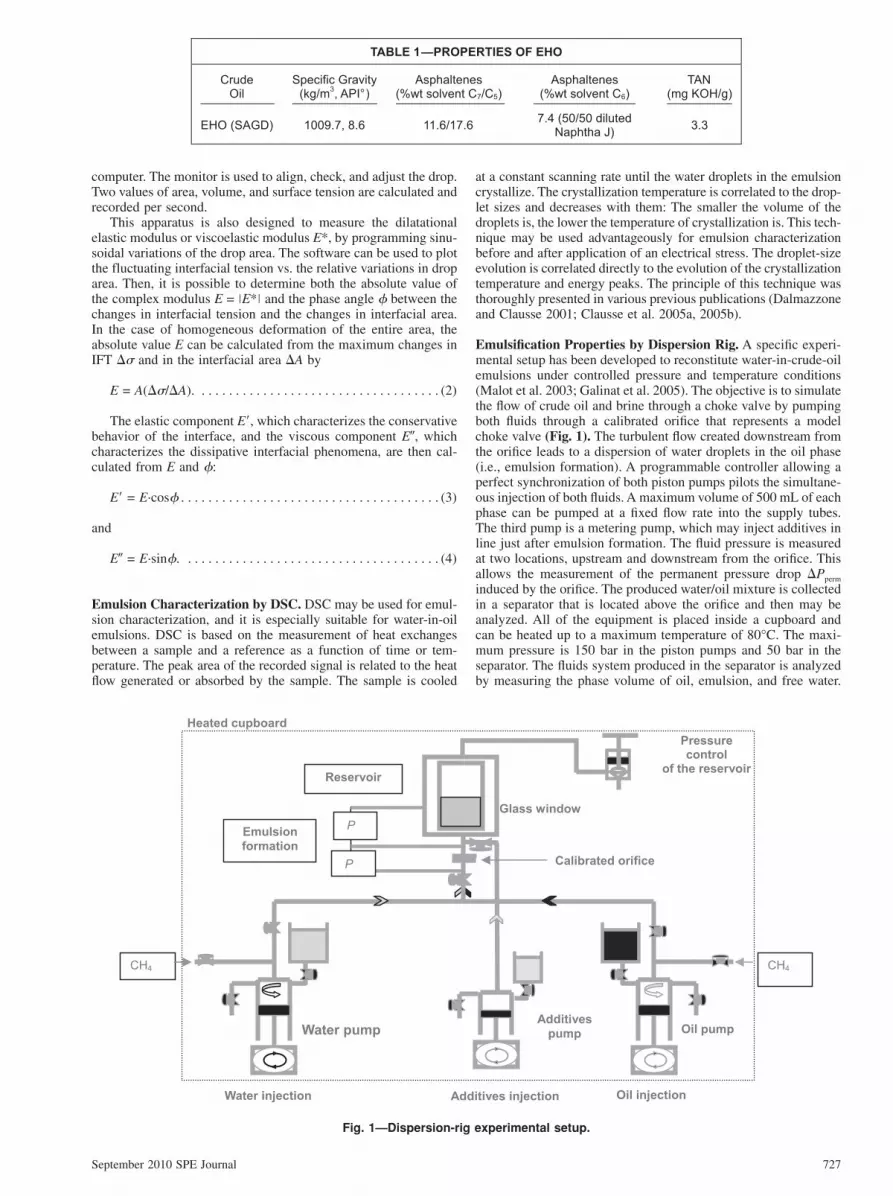
Electrocoalescer Device. A laboratory prototype was developed to study the coalescence phenomena of water droplets inside a crude-oil emulsion fl ow stressed by a sinusoidal electrical fi eld with controlled voltage and frequency (Noïk et al. 2008a, 2008b). Electrical effects increase the droplet size above 100 �m in the Stokes’-law domain critical for separator-tank effi ciency. The pro-totype consists of two concentric tubes, inside which the electrical fi eld is applied, with fl uids circulating upward inside the annular space (Fig. 2). On the laboratory prototype, the operating condi-tions are limited to the circulation of a fl uid with a viscosity below
100 mPa·s for a maximum fl ow rate of 1.2 m3/h under controlled temperature up to 80°C and atmospheric pressure. Various device geometries are possible for testing. For this study, the tube length is 100 cm and the annular space is 1 cm.
The residence time under the electrical field varies according to the flow rate. A stable emulsion is formed through an Ultra-Turrax homogenizer. The emulsion is then injected in line at the bottom of the electrocoalescer where the electrical-field parameters, such as voltage and frequency, are controlled. The efficiency of coales-cence is determined by measuring emulsion characteristics (droplet size, crystallization energy from DSC) before and after application of the electrostatic field.
Results and Discussion
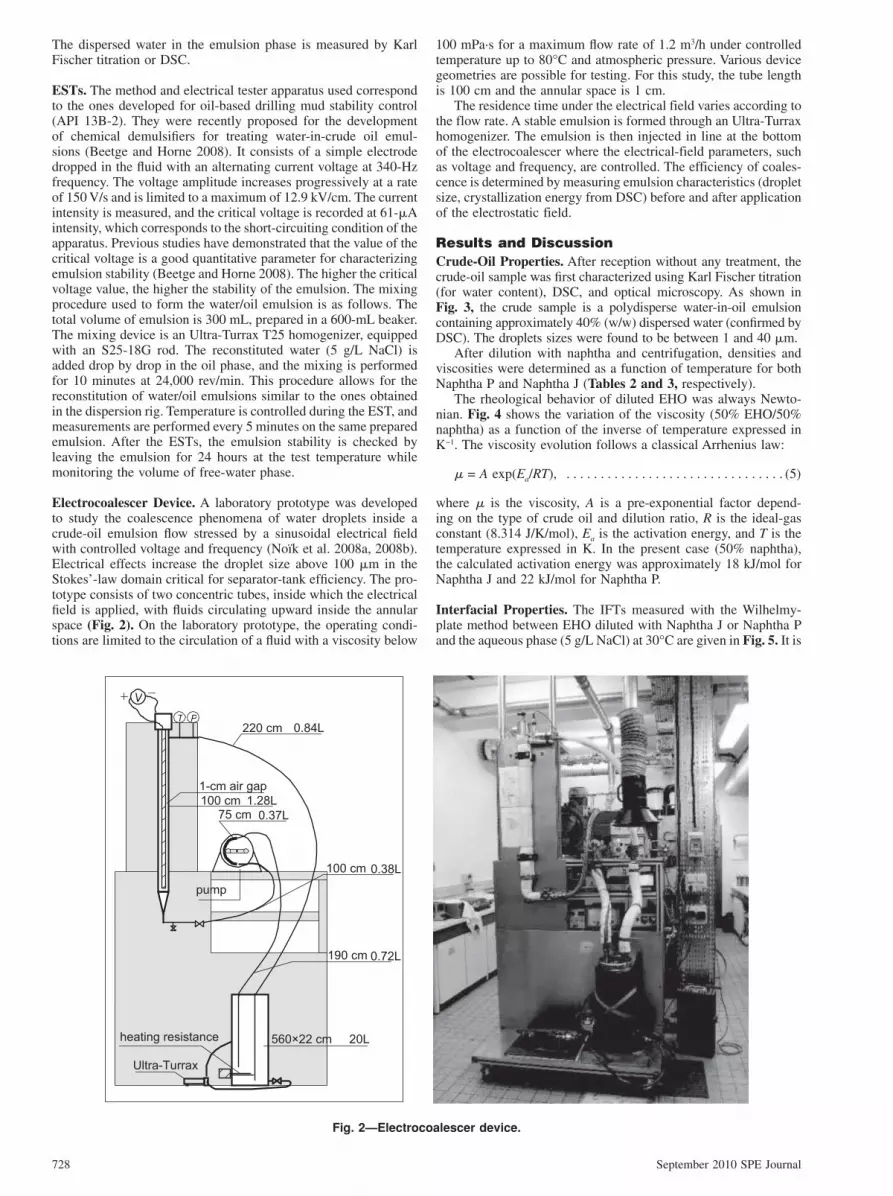
Crude-Oil Properties. After reception without any treatment, the crude-oil sample was fi rst characterized using Karl Fischer titration (for water content), DSC, and optical microscopy. As shown in Fig. 3, the crude sample is a polydisperse water-in-oil emulsion containing approximately 40% (w/w) dispersed water (confi rmed by DSC). The droplets sizes were found to be between 1 and 40 �m.
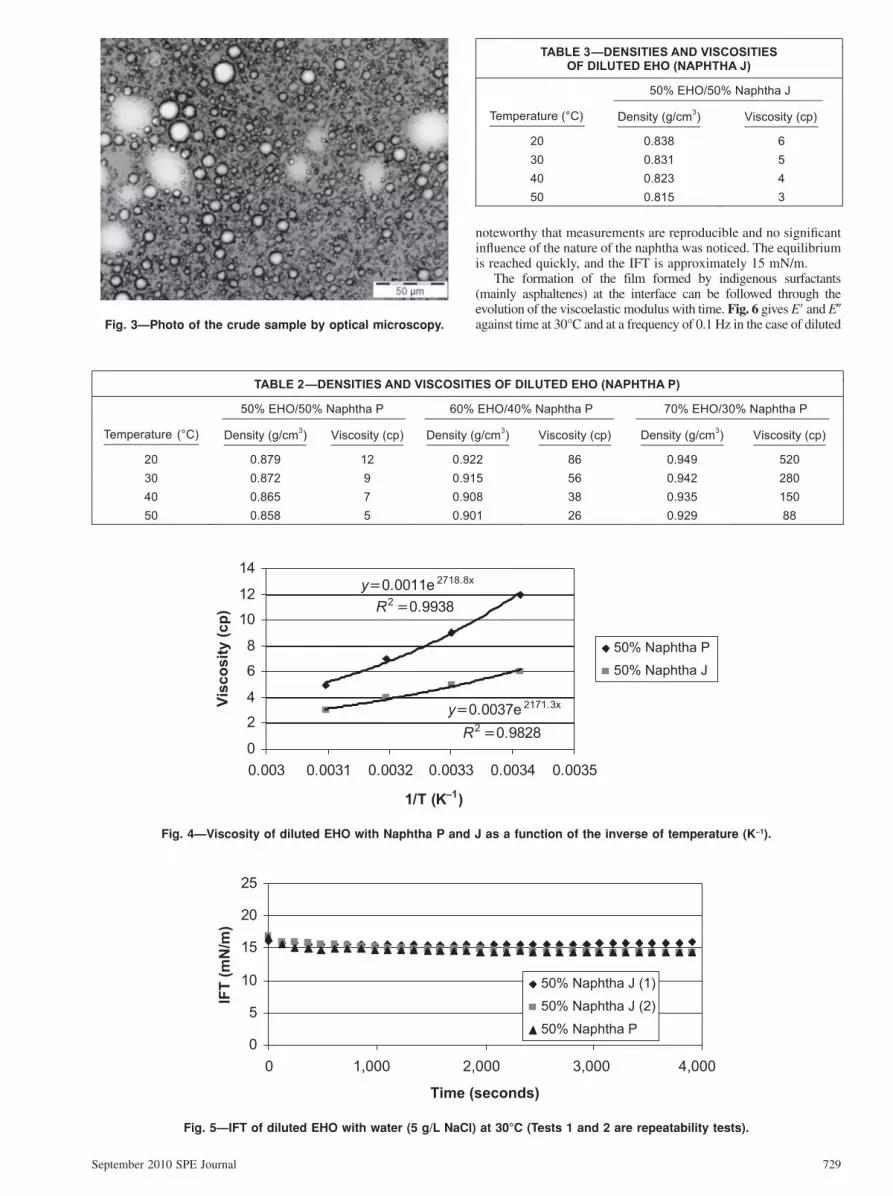
After dilution with naphtha and centrifugation, densities and viscosities were determined as a function of temperature for both Naphtha P and Naphtha J (Tables 2 and 3, respectively).
The rheological behavior of diluted EHO was always Newto-nian. Fig. 4 shows the variation of the viscosity (50% EHO/50% naphtha) as a function of the inverse of temperature expressed in K−1. The viscosity evolution follows a classical Arrhenius law:
where � is the viscosity, A is a pre-exponential factor depend-ing on the type of crude oil and dilution ratio, R is the ideal-gas constant (8.314 J/K/mol), Ea is the activation energy, and T is the temperature expressed in K. In the present case (50% naphtha), the calculated activation energy was approximately 18 kJ/mol for Naphtha J and 22 kJ/mol for Naphtha P.
Interfacial Properties. The IFTs measured with the Wilhelmy-plate method between EHO diluted with Naphtha J or Naphtha P and the aqueous phase (5 g/L NaCl) at 30°C are given in Fig. 5. It is
T P 220 cm 0.84L
190 cm 0.72L
100 cm 0.38L
75 cm 0.37L
100 cm 1.28L
1-cm air gap
V
560×22 cm 20L
Ultra-Turrax
heating resistance
pump
Fig. 2—Electrocoalescer device.
September 2010 SPE Journal 729
noteworthy that measurements are reproducible and no signifi cant infl uence of the nature of the naphtha was noticed. The equilibrium is reached quickly, and the IFT is approximately 15 mN/m.
The formation of the film formed by indigenous surfactants (mainly asphaltenes) at the interface can be followed through the evolution of the viscoelastic modulus with time. Fig. 6 gives E� and E� against time at 30°C and at a frequency of 0.1 Hz in the case of diluted Fig. 3—Photo of the crude sample by optical microscopy.
TABLE 2—DENSITIES AND VISCOSITIES OF DILUTED EHO (NAPHTHA P)
50% EHO/50% Naphtha P 60% EHO/40% Naphtha P 70% EHO/30% Naphtha P
Temperature (°C) Density (g/cm3) Viscosity (cp) Density (g/cm
3) Viscosity (cp) Density (g/cm
3) Viscosity (cp)
20 0.879 12 0.922 86 0.949 520
30 0.872 9 0.915 56 0.942 280
40 0.865 7 0.908 38 0.935 150
50 0.858 5 0.901 26 0.929 88
TABLE 3—DENSITIES AND VISCOSITIES OF DILUTED EHO (NAPHTHA J)
50% EHO/50% Naphtha J
Temperature (°C) Density (g/cm3) Viscosity (cp)
20 0.838 6
30 0.831 5
40 0.823 4
50 0.815 3
y=0.0011e 2718.8x
R2 =0.9938
y=0.0037e 2171.3x
R2 =0.98280
2
4
6
8
10
12
14
0.003 0.0031 0.0032 0.0033 0.0034 0.0035
1/T (K–1)
Vis
co
sit
y (
cp
)
50% Naphtha P
50% Naphtha J
Fig. 4—Viscosity of diluted EHO with Naphtha P and J as a function of the inverse of temperature (K−1).
0
5
10
15
20
25
0 1,000 2,000 3,000 4,000
Time (seconds)
IFT
(m
N/m
)
50% Naphtha J (1)
50% Naphtha J (2)
50% Naphtha P
Fig. 5—IFT of diluted EHO with water (5 g/L NaCl) at 30°C (Tests 1 and 2 are repeatability tests).
730 September 2010 SPE Journal
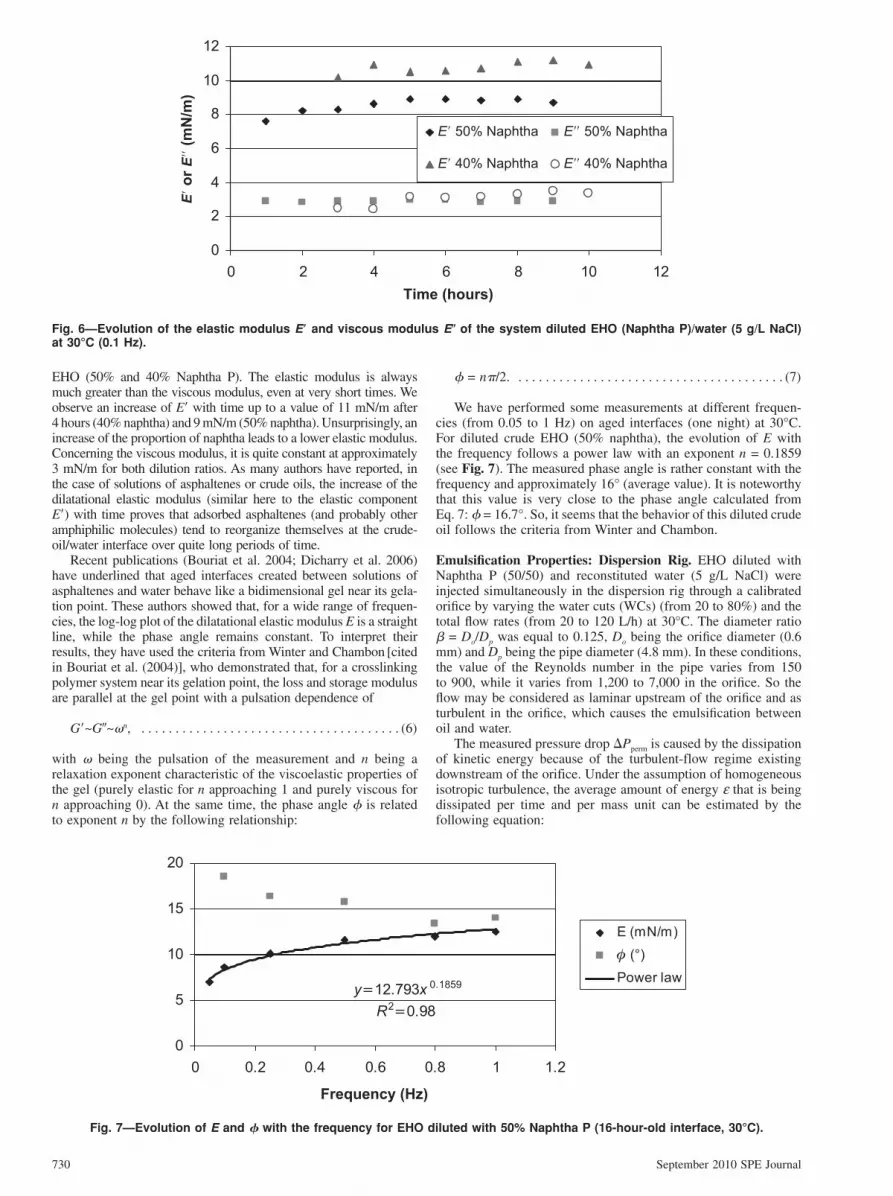
EHO (50% and 40% Naphtha P). The elastic modulus is always much greater than the viscous modulus, even at very short times. We observe an increase of E� with time up to a value of 11 mN/m after 4 hours (40% naphtha) and 9 mN/m (50% naphtha). Unsurprisingly, an increase of the proportion of naphtha leads to a lower elastic modulus. Concerning the viscous modulus, it is quite constant at approximately 3 mN/m for both dilution ratios. As many authors have reported, in the case of solutions of asphaltenes or crude oils, the increase of the dilatational elastic modulus (similar here to the elastic component E�) with time proves that adsorbed asphaltenes (and probably other amphiphilic molecules) tend to reorganize themselves at the crude-oil/water interface over quite long periods of time.
Recent publications (Bouriat et al. 2004; Dicharry et al. 2006) have underlined that aged interfaces created between solutions of asphaltenes and water behave like a bidimensional gel near its gela-tion point. These authors showed that, for a wide range of frequen-cies, the log-log plot of the dilatational elastic modulus E is a straight line, while the phase angle remains constant. To interpret their results, they have used the criteria from Winter and Chambon [cited in Bouriat et al. (2004)], who demonstrated that, for a crosslinking polymer system near its gelation point, the loss and storage modulus are parallel at the gel point with a pulsation dependence of
with being the pulsation of the measurement and n being a relaxation exponent characteristic of the viscoelastic properties of the gel (purely elastic for n approaching 1 and purely viscous for n approaching 0). At the same time, the phase angle � is related to exponent n by the following relationship:
We have performed some measurements at different frequen-cies (from 0.05 to 1 Hz) on aged interfaces (one night) at 30°C. For diluted crude EHO (50% naphtha), the evolution of E with the frequency follows a power law with an exponent n = 0.1859 (see Fig. 7). The measured phase angle is rather constant with the frequency and approximately 16° (average value). It is noteworthy that this value is very close to the phase angle calculated from Eq. 7: � = 16.7°. So, it seems that the behavior of this diluted crude oil follows the criteria from Winter and Chambon.
Emulsifi cation Properties: Dispersion Rig. EHO diluted with Naphtha P (50/50) and reconstituted water (5 g/L NaCl) were injected simultaneously in the dispersion rig through a calibrated orifi ce by varying the water cuts (WCs) (from 20 to 80%) and the total fl ow rates (from 20 to 120 L/h) at 30°C. The diameter ratio � = Do/Dp was equal to 0.125, Do being the orifi ce diameter (0.6 mm) and Dp being the pipe diameter (4.8 mm). In these conditions, the value of the Reynolds number in the pipe varies from 150 to 900, while it varies from 1,200 to 7,000 in the orifi ce. So the fl ow may be considered as laminar upstream of the orifi ce and as turbulent in the orifi ce, which causes the emulsifi cation between oil and water.
The measured pressure drop �Pperm is caused by the dissipation of kinetic energy because of the turbulent-flow regime existing downstream of the orifice. Under the assumption of homogeneous isotropic turbulence, the average amount of energy ε that is being dissipated per time and per mass unit can be estimated by the following equation:
0
2
4
6
8
10
12
0 2 4 6 8 10 12
Time (hours)
E′
or E
′′ (
mN
/m)
E′ 50% Naphtha E′′ 50% Naphtha
E′ 40% Naphtha E′′ 40% Naphtha
Fig. 6—Evolution of the elastic modulus E� and viscous modulus E� of the system diluted EHO (Naphtha P)/water (5 g/L NaCl) at 30°C (0.1 Hz).
y=12.793x 0.1859
R2=0.98
0
5
10
15
20
0 0.2 0.4 0.6 0.8 1 1.2
Frequency (Hz)
E (mN/m)
φ (°)
Power law
Fig. 7—Evolution of E and � with the frequency for EHO diluted with 50% Naphtha P (16-hour-old interface, 30°C).
where Uo is the average fluid velocity in the orifice, � is the con-tinuous-phase density, and Ldis is the length of the zone in which most of the kinetic energy is dissipated. For a turbulent flow in a circular pipe, the general relationship currently used to define this length is Ldis = 2·Dp.
After the emulsion-formation step, emulsified fluids are col-lected. After a period of rest (24 hours), during which separation
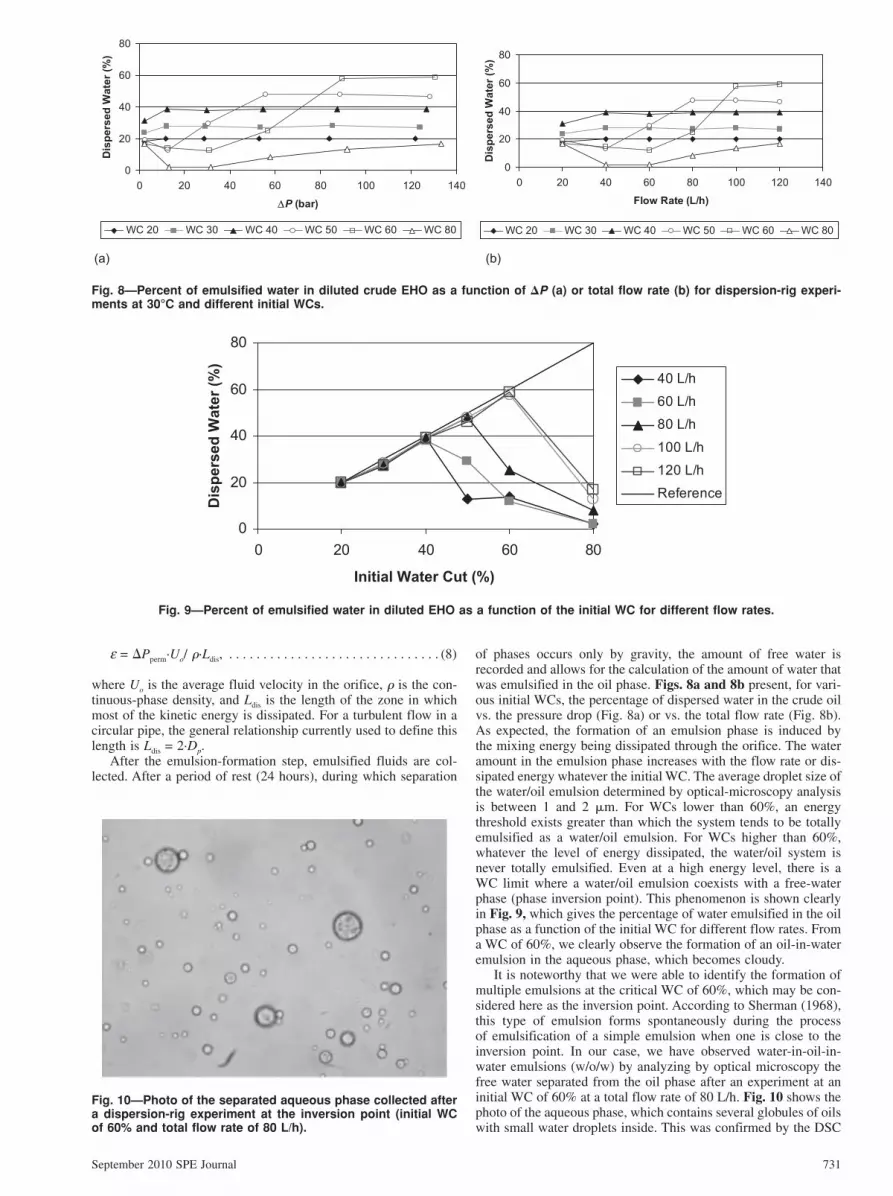
of phases occurs only by gravity, the amount of free water is recorded and allows for the calculation of the amount of water that was emulsified in the oil phase. Figs. 8a and 8b present, for vari-ous initial WCs, the percentage of dispersed water in the crude oil vs. the pressure drop (Fig. 8a) or vs. the total flow rate (Fig. 8b). As expected, the formation of an emulsion phase is induced by the mixing energy being dissipated through the orifice. The water amount in the emulsion phase increases with the flow rate or dis-sipated energy whatever the initial WC. The average droplet size of the water/oil emulsion determined by optical-microscopy analysis is between 1 and 2 �m. For WCs lower than 60%, an energy threshold exists greater than which the system tends to be totally emulsified as a water/oil emulsion. For WCs higher than 60%, whatever the level of energy dissipated, the water/oil system is never totally emulsified. Even at a high energy level, there is a WC limit where a water/oil emulsion coexists with a free-water phase (phase inversion point). This phenomenon is shown clearly in Fig. 9, which gives the percentage of water emulsified in the oil phase as a function of the initial WC for different flow rates. From a WC of 60%, we clearly observe the formation of an oil-in-water emulsion in the aqueous phase, which becomes cloudy.
It is noteworthy that we were able to identify the formation of multiple emulsions at the critical WC of 60%, which may be con-sidered here as the inversion point. According to Sherman (1968), this type of emulsion forms spontaneously during the process of emulsification of a simple emulsion when one is close to the inversion point. In our case, we have observed water-in-oil-in-water emulsions (w/o/w) by analyzing by optical microscopy the free water separated from the oil phase after an experiment at an initial WC of 60% at a total flow rate of 80 L/h. Fig. 10 shows the photo of the aqueous phase, which contains several globules of oils with small water droplets inside. This was confirmed by the DSC
)b( )a(
0
20
40
60
80
0 20 40 60 80 100 120 140
∆P (bar)
Dis
pers
ed
Wate
r (%
)
WC 20 WC 30 WC 40 WC 50 WC 60 WC 80
0
20
40
60
80
0 20 40 60 80 100 120 140
Flow Rate (L/h)
Dis
pe
rse
d W
ate
r (%
)
WC 20 WC 30 WC 40 WC 50 WC 60 WC 80
Fig. 8—Percent of emulsified water in diluted crude EHO as a function of �P (a) or total flow rate (b) for dispersion-rig experi-ments at 30°C and different initial WCs.
0
20
40
60
80
0 20 40 60 80
Initial Water Cut (%)
Dis
pe
rse
d W
ate
r (%
)
40 L/h
60 L/h
80 L/h
100 L/h
120 L/h
Reference
Fig. 9—Percent of emulsified water in diluted EHO as a function of the initial WC for different flow rates.
Fig. 10—Photo of the separated aqueous phase collected after a dispersion-rig experiment at the inversion point (initial WC of 60% and total flow rate of 80 L/h).
732 September 2010 SPE Journal
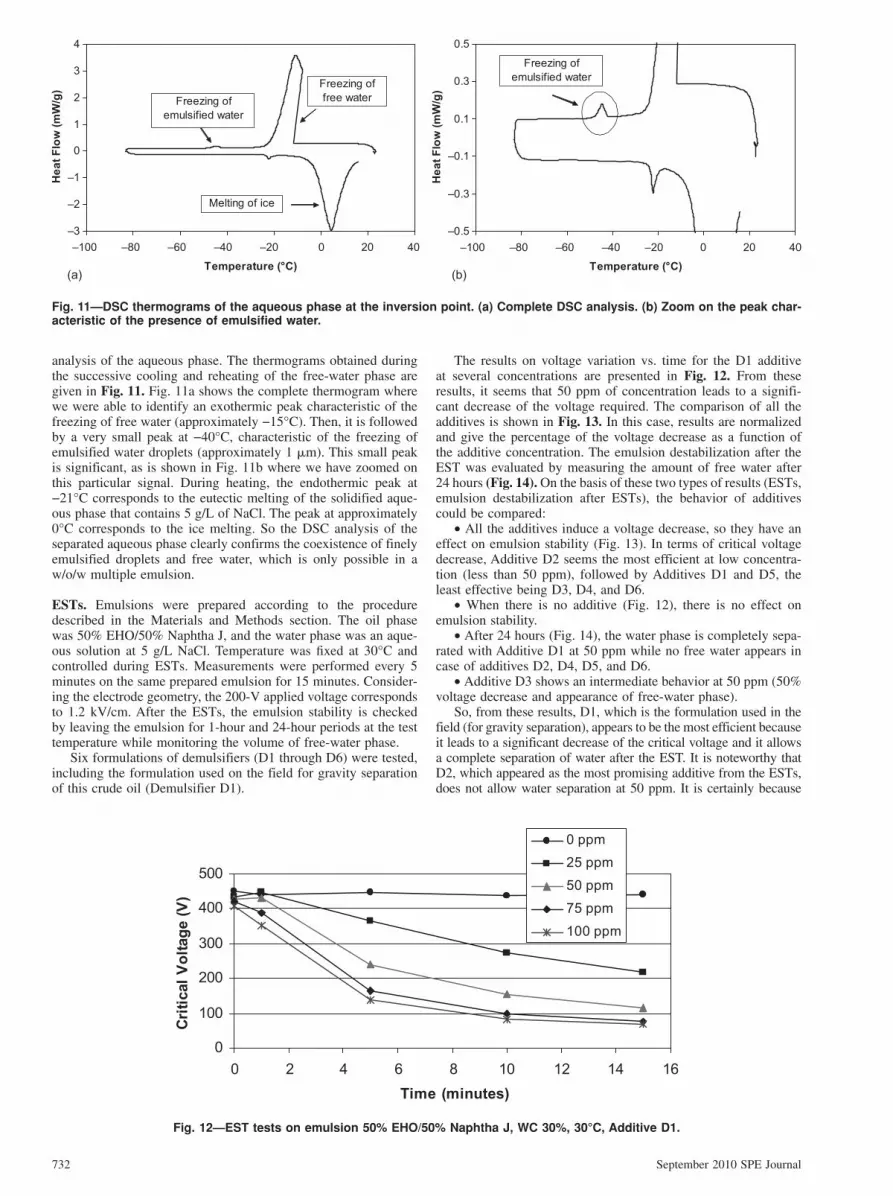
analysis of the aqueous phase. The thermograms obtained during the successive cooling and reheating of the free-water phase are given in Fig. 11. Fig. 11a shows the complete thermogram where we were able to identify an exothermic peak characteristic of the freezing of free water (approximately −15°C). Then, it is followed by a very small peak at −40°C, characteristic of the freezing of emulsified water droplets (approximately 1 �m). This small peak is significant, as is shown in Fig. 11b where we have zoomed on this particular signal. During heating, the endothermic peak at −21°C corresponds to the eutectic melting of the solidified aque-ous phase that contains 5 g/L of NaCl. The peak at approximately 0°C corresponds to the ice melting. So the DSC analysis of the separated aqueous phase clearly confirms the coexistence of finely emulsified droplets and free water, which is only possible in a w/o/w multiple emulsion.
ESTs. Emulsions were prepared according to the procedure described in the Materials and Methods section. The oil phase was 50% EHO/50% Naphtha J, and the water phase was an aque-ous solution at 5 g/L NaCl. Temperature was fi xed at 30°C and controlled during ESTs. Measurements were performed every 5 minutes on the same prepared emulsion for 15 minutes. Consider-ing the electrode geometry, the 200-V applied voltage corresponds to 1.2 kV/cm. After the ESTs, the emulsion stability is checked by leaving the emulsion for 1-hour and 24-hour periods at the test temperature while monitoring the volume of free-water phase.
Six formulations of demulsifiers (D1 through D6) were tested, including the formulation used on the field for gravity separation of this crude oil (Demulsifier D1).
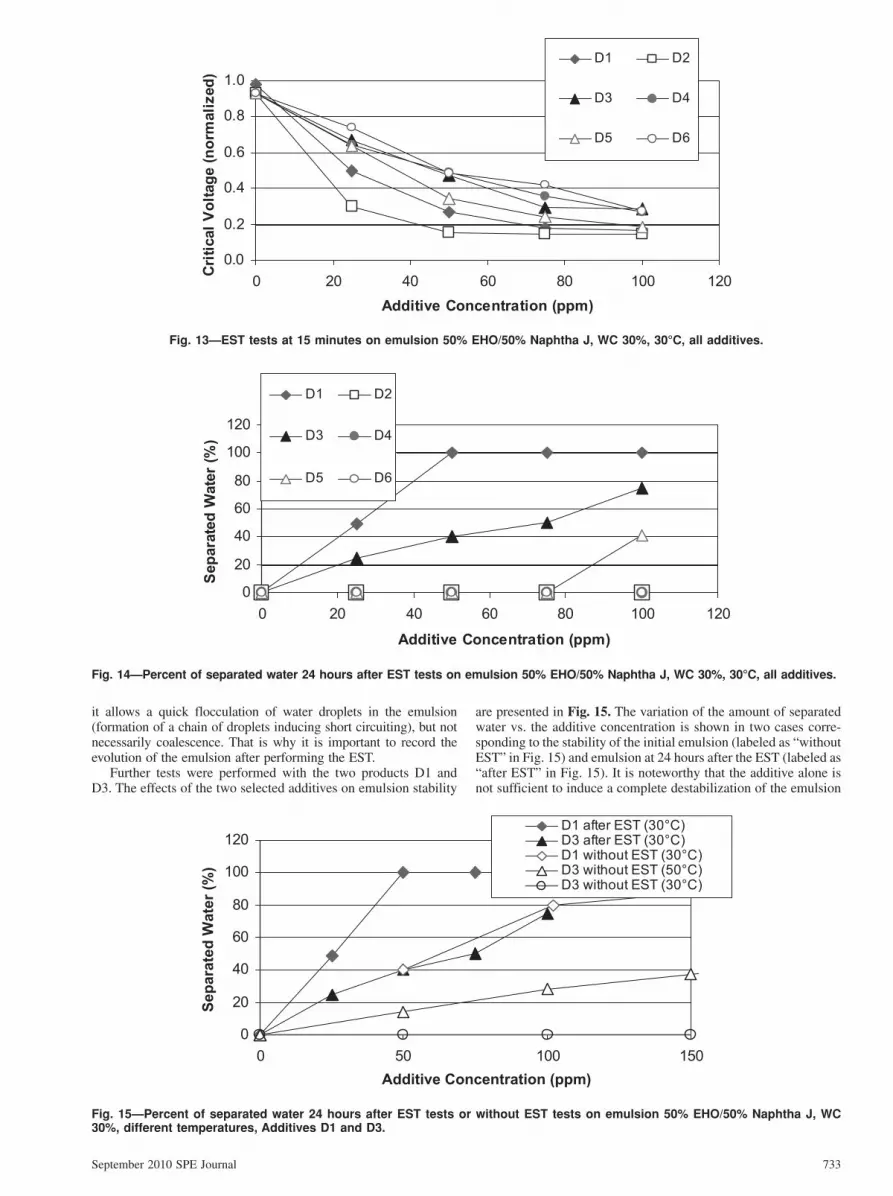
The results on voltage variation vs. time for the D1 additive at several concentrations are presented in Fig. 12. From these results, it seems that 50 ppm of concentration leads to a signifi-cant decrease of the voltage required. The comparison of all the additives is shown in Fig. 13. In this case, results are normalized and give the percentage of the voltage decrease as a function of the additive concentration. The emulsion destabilization after the EST was evaluated by measuring the amount of free water after 24 hours (Fig. 14). On the basis of these two types of results (ESTs, emulsion destabilization after ESTs), the behavior of additives could be compared:
• All the additives induce a voltage decrease, so they have an effect on emulsion stability (Fig. 13). In terms of critical voltage decrease, Additive D2 seems the most efficient at low concentra-tion (less than 50 ppm), followed by Additives D1 and D5, the least effective being D3, D4, and D6.
• When there is no additive (Fig. 12), there is no effect on emulsion stability.
• After 24 hours (Fig. 14), the water phase is completely sepa-rated with Additive D1 at 50 ppm while no free water appears in case of additives D2, D4, D5, and D6.
• Additive D3 shows an intermediate behavior at 50 ppm (50% voltage decrease and appearance of free-water phase).
So, from these results, D1, which is the formulation used in the field (for gravity separation), appears to be the most efficient because it leads to a significant decrease of the critical voltage and it allows a complete separation of water after the EST. It is noteworthy that D2, which appeared as the most promising additive from the ESTs, does not allow water separation at 50 ppm. It is certainly because
)b( )a(
–3
–2
–1
0
1
2
3
4
–100 –80 –60 –40 –20 0 20 40
Temperature (°C)
He
at
Flo
w (
mW
/g)
Freezing of
free waterFreezing of
emulsified water
Melting of ice
–0.5
–0.3
–0.1
0.1
0.3
0.5
–100 –80 –60 –40 –20 0 20 40
Temperature (°C)
He
at
Flo
w (
mW
/g)
Freezing of
emulsified water
Fig. 11—DSC thermograms of the aqueous phase at the inversion point. (a) Complete DSC analysis. (b) Zoom on the peak char-acteristic of the presence of emulsified water.
it allows a quick flocculation of water droplets in the emulsion (formation of a chain of droplets inducing short circuiting), but not necessarily coalescence. That is why it is important to record the evolution of the emulsion after performing the EST.
Further tests were performed with the two products D1 and D3. The effects of the two selected additives on emulsion stability
are presented in Fig. 15. The variation of the amount of separated water vs. the additive concentration is shown in two cases corre-sponding to the stability of the initial emulsion (labeled as “without EST” in Fig. 15) and emulsion at 24 hours after the EST (labeled as “after EST” in Fig. 15). It is noteworthy that the additive alone is not sufficient to induce a complete destabilization of the emulsion
0.0
0.2
0.4
0.6
0.8
1.0
0 20 40 60 80 100 120
Additive Concentration (ppm)
Cri
tical
Vo
ltag
e (
no
rmali
zed
)
D1 D2
D3 D4
D5 D6
Fig. 13—EST tests at 15 minutes on emulsion 50% EHO/50% Naphtha J, WC 30%, 30°C, all additives.
0
20
40
60
80
100
120
0 20 40 60 80 100 120
Additive Concentration (ppm)
Sep
ara
ted
Wate
r (%
)
D1 D2
D3 D4
D5 D6
Fig. 14—Percent of separated water 24 hours after EST tests on emulsion 50% EHO/50% Naphtha J, WC 30%, 30°C, all additives.
0
20
40
60
80
100
120
0 50 100 150
Additive Concentration (ppm)
Se
pa
rate
d W
ate
r (%
)
D1 after EST (30°C)D3 after EST (30°C)D1 without EST (30°C)D3 without EST (50°C)D3 without EST (30°C)
Fig. 15—Percent of separated water 24 hours after EST tests or without EST tests on emulsion 50% EHO/50% Naphtha J, WC 30%, different temperatures, Additives D1 and D3.
734 September 2010 SPE Journal
and that the electrical stress is necessary to cause coalescence, hence separation of the oil and water phases. It is especially true for Additive D3, for which no separation of water was observed with the bottle test at 30°C. By increasing the temperature to 50°C, the maximum amount of separated water is less than 40% at 150 ppm. It seems, therefore, that the application of the electrical stress in ESTs allows a significant decrease of the amount of demulsifier required for coalescence of droplets in the emulsion.
Electrocoalescence Effi ciency in the Electrocoalescer Rig. From the results of the ESTs performed on the different demulsifi er addi-tives, it was decided to select Additive D3 for the experiments in the electrocoalescer rig because this formulation allows a signifi -cant separation of water after the EST while absolutely no water is separated from bottle tests at the same temperature (30°C).
Experiments on the electrocoalescer rig were performed with a water/oil emulsion formed with an in-line Ultra-Turrax homog-enizer from an oil phase (50% EHO/ 50% Naphtha J) and a water phase (5g/L NaCl brine) at 30% WC in presence of Additive D3 at 1 kHz. This high frequency has been chosen following previ-ous studies on various types of EHOs (Noïk et al. 2008a, 2008b). The residence time of the emulsion under electrical stress is fixed by the flow rate between 0.05 and 1.0 m3/h that corresponds to a time range of 90 to 4.5 seconds. All experiments are performed under a laminar-flow regime. It is noteworthy that water/oil emul-sions formed in the electrocoalescer device are similar to the ones formed for ESTs.
The procedure consists first in determining the breakdown voltage where short-circuiting starts to appear. Then, electrocoales-cence efficiency is evaluated at this breakdown voltage by measur-ing the droplet coalescence using mainly the DSC technique.
)b( )a(
–1.5
–1
–0.5
0
0.5
1
1.5
–100 –80 –60 –40 –20 0 20 40
Temperature (°C)
Heat
Flo
w (
mW
/g)
A0
Freezing of
small droplets
Melting of
ice
Temperature (°C)
Heat
Flo
w (
mW
/g)
Af
Freezing of
large droplets
–1.5
–1
–0.5
0
0.5
1
1.5
–100 –80 –60 –40 –20 0 20 40
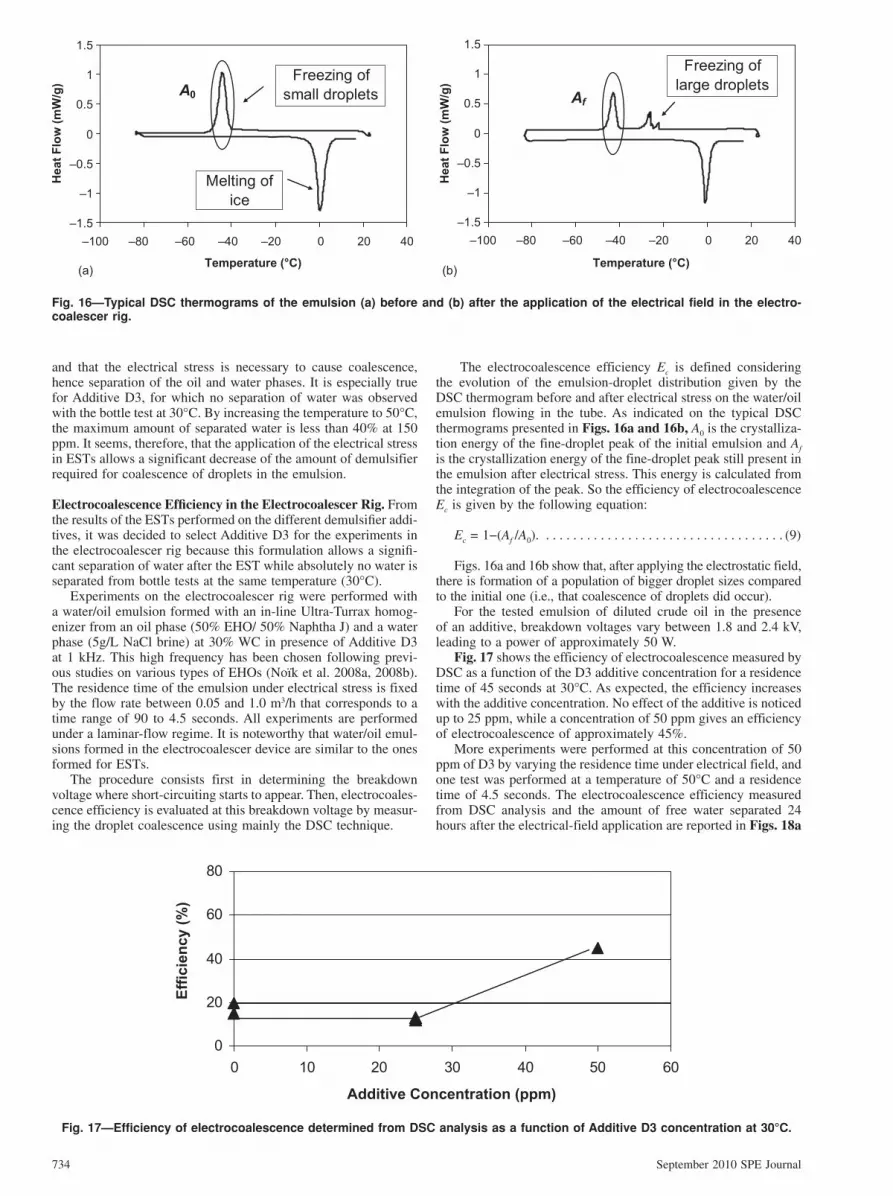
Fig. 16—Typical DSC thermograms of the emulsion (a) before and (b) after the application of the electrical field in the electro-coalescer rig.
0
20
40
60
80
0 10 20 30 40 50 60
Additive Concentration (ppm)
Eff
icie
nc
y (
%)
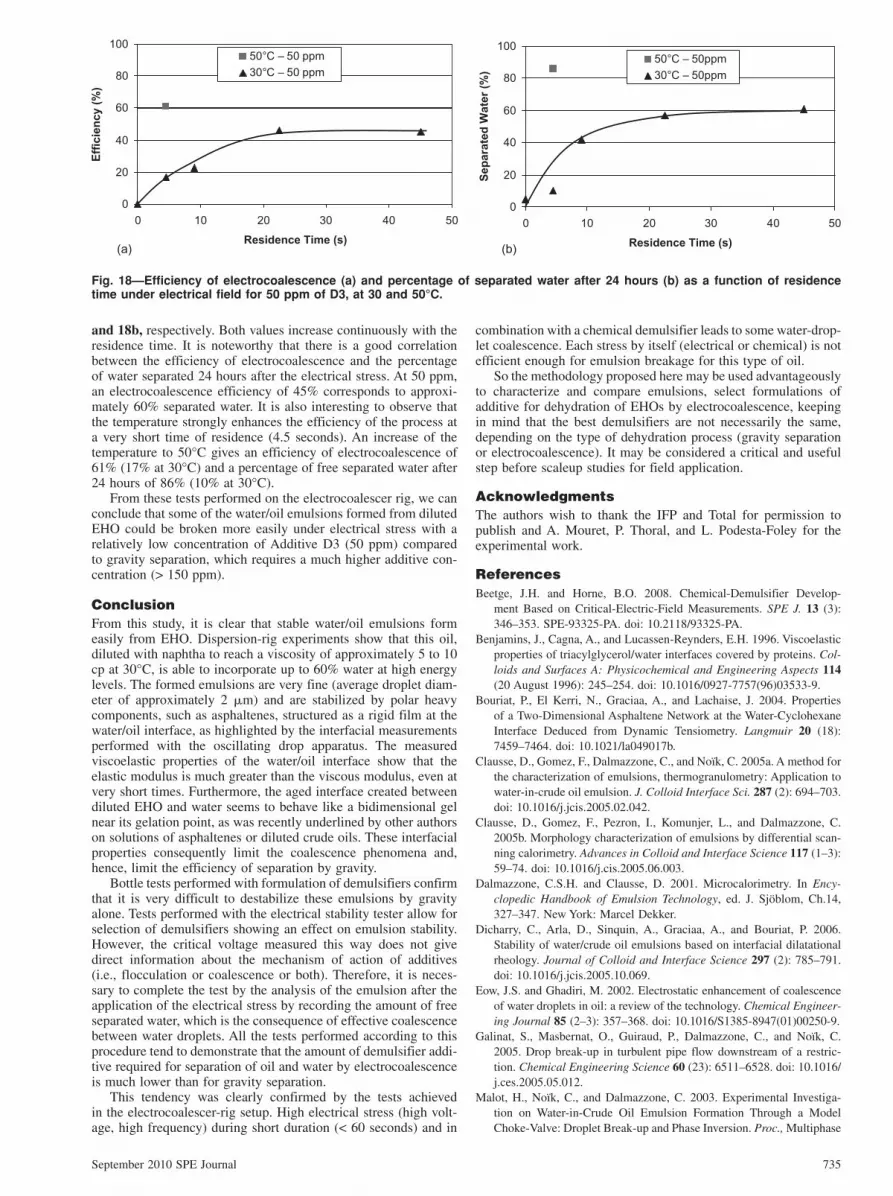
Fig. 17—Efficiency of electrocoalescence determined from DSC analysis as a function of Additive D3 concentration at 30°C.
The electrocoalescence efficiency Ec is defined considering the evolution of the emulsion-droplet distribution given by the DSC thermogram before and after electrical stress on the water/oil emulsion flowing in the tube. As indicated on the typical DSC thermograms presented in Figs. 16a and 16b, A0 is the crystalliza-tion energy of the fine-droplet peak of the initial emulsion and Af is the crystallization energy of the fine-droplet peak still present in the emulsion after electrical stress. This energy is calculated from the integration of the peak. So the efficiency of electrocoalescence Ec is given by the following equation:
Figs. 16a and 16b show that, after applying the electrostatic field, there is formation of a population of bigger droplet sizes compared to the initial one (i.e., that coalescence of droplets did occur).
For the tested emulsion of diluted crude oil in the presence of an additive, breakdown voltages vary between 1.8 and 2.4 kV, leading to a power of approximately 50 W.
Fig. 17 shows the efficiency of electrocoalescence measured by DSC as a function of the D3 additive concentration for a residence time of 45 seconds at 30°C. As expected, the efficiency increases with the additive concentration. No effect of the additive is noticed up to 25 ppm, while a concentration of 50 ppm gives an efficiency of electrocoalescence of approximately 45%.
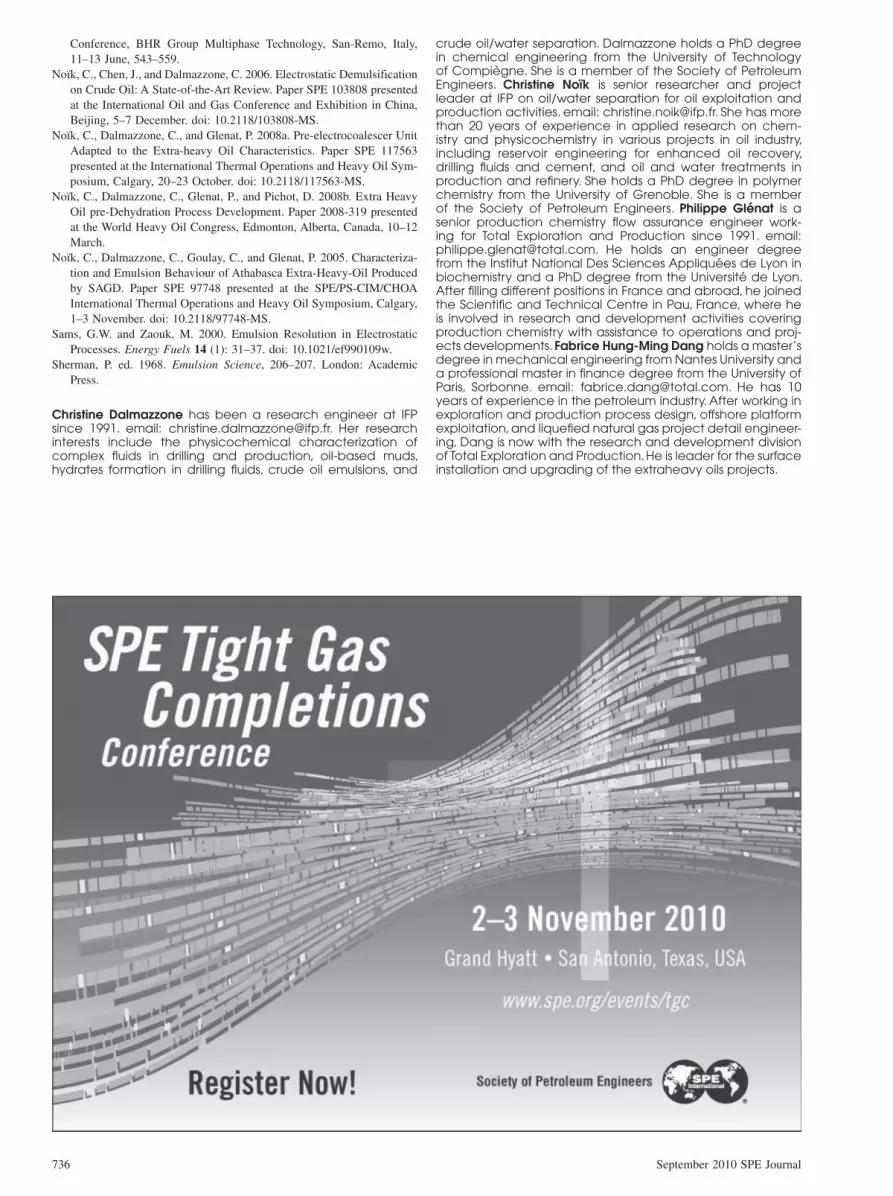
More experiments were performed at this concentration of 50 ppm of D3 by varying the residence time under electrical field, and one test was performed at a temperature of 50°C and a residence time of 4.5 seconds. The electrocoalescence efficiency measured from DSC analysis and the amount of free water separated 24 hours after the electrical-field application are reported in Figs. 18a
September 2010 SPE Journal 735
and 18b, respectively. Both values increase continuously with the residence time. It is noteworthy that there is a good correlation between the efficiency of electrocoalescence and the percentage of water separated 24 hours after the electrical stress. At 50 ppm, an electrocoalescence efficiency of 45% corresponds to approxi-mately 60% separated water. It is also interesting to observe that the temperature strongly enhances the efficiency of the process at a very short time of residence (4.5 seconds). An increase of the temperature to 50°C gives an efficiency of electrocoalescence of 61% (17% at 30°C) and a percentage of free separated water after 24 hours of 86% (10% at 30°C).
From these tests performed on the electrocoalescer rig, we can conclude that some of the water/oil emulsions formed from diluted EHO could be broken more easily under electrical stress with a relatively low concentration of Additive D3 (50 ppm) compared to gravity separation, which requires a much higher additive con-centration (> 150 ppm).
Conclusion
From this study, it is clear that stable water/oil emulsions form easily from EHO. Dispersion-rig experiments show that this oil, diluted with naphtha to reach a viscosity of approximately 5 to 10 cp at 30°C, is able to incorporate up to 60% water at high energy levels. The formed emulsions are very fine (average droplet diam-eter of approximately 2 �m) and are stabilized by polar heavy components, such as asphaltenes, structured as a rigid film at the water/oil interface, as highlighted by the interfacial measurements performed with the oscillating drop apparatus. The measured viscoelastic properties of the water/oil interface show that the elastic modulus is much greater than the viscous modulus, even at very short times. Furthermore, the aged interface created between diluted EHO and water seems to behave like a bidimensional gel near its gelation point, as was recently underlined by other authors on solutions of asphaltenes or diluted crude oils. These interfacial properties consequently limit the coalescence phenomena and, hence, limit the efficiency of separation by gravity.
Bottle tests performed with formulation of demulsifiers confirm that it is very difficult to destabilize these emulsions by gravity alone. Tests performed with the electrical stability tester allow for selection of demulsifiers showing an effect on emulsion stability. However, the critical voltage measured this way does not give direct information about the mechanism of action of additives (i.e., flocculation or coalescence or both). Therefore, it is neces-sary to complete the test by the analysis of the emulsion after the application of the electrical stress by recording the amount of free separated water, which is the consequence of effective coalescence between water droplets. All the tests performed according to this procedure tend to demonstrate that the amount of demulsifier addi-tive required for separation of oil and water by electrocoalescence is much lower than for gravity separation.
This tendency was clearly confirmed by the tests achieved in the electrocoalescer-rig setup. High electrical stress (high volt-age, high frequency) during short duration (< 60 seconds) and in
combination with a chemical demulsifier leads to some water-drop-let coalescence. Each stress by itself (electrical or chemical) is not efficient enough for emulsion breakage for this type of oil.
So the methodology proposed here may be used advantageously to characterize and compare emulsions, select formulations of additive for dehydration of EHOs by electrocoalescence, keeping in mind that the best demulsifiers are not necessarily the same, depending on the type of dehydration process (gravity separation or electrocoalescence). It may be considered a critical and useful step before scaleup studies for field application.
Acknowledgments
The authors wish to thank the IFP and Total for permission to publish and A. Mouret, P. Thoral, and L. Podesta-Foley for the experimental work.
References
Beetge, J.H. and Horne, B.O. 2008. Chemical-Demulsifier Develop-
ment Based on Critical-Electric-Field Measurements. SPE J. 13 (3):
346–353. SPE-93325-PA. doi: 10.2118/93325-PA.
Benjamins, J., Cagna, A., and Lucassen-Reynders, E.H. 1996. Viscoelastic
properties of triacylglycerol/water interfaces covered by proteins. Col-
loids and Surfaces A: Physicochemical and Engineering Aspects 114
(20 August 1996): 245–254. doi: 10.1016/0927-7757(96)03533-9.
Bouriat, P., El Kerri, N., Graciaa, A., and Lachaise, J. 2004. Properties
of a Two-Dimensional Asphaltene Network at the Water-Cyclohexane
Interface Deduced from Dynamic Tensiometry. Langmuir 20 (18):
7459–7464. doi: 10.1021/la049017b.
Clausse, D., Gomez, F., Dalmazzone, C., and Noïk, C. 2005a. A method for
the characterization of emulsions, thermogranulometry: Application to
water-in-crude oil emulsion. J. Colloid Interface Sci. 287 (2): 694–703.
doi: 10.1016/j.jcis.2005.02.042.
Clausse, D., Gomez, F., Pezron, I., Komunjer, L., and Dalmazzone, C.
2005b. Morphology characterization of emulsions by differential scan-
ning calorimetry. Advances in Colloid and Interface Science 117 (1–3):
59–74. doi: 10.1016/j.cis.2005.06.003.
Dalmazzone, C.S.H. and Clausse, D. 2001. Microcalorimetry. In Ency-
clopedic Handbook of Emulsion Technology, ed. J. Sjöblom, Ch.14,
327–347. New York: Marcel Dekker.
Dicharry, C., Arla, D., Sinquin, A., Graciaa, A., and Bouriat, P. 2006.
Stability of water/crude oil emulsions based on interfacial dilatational
rheology. Journal of Colloid and Interface Science 297 (2): 785–791.
doi: 10.1016/j.jcis.2005.10.069.
Eow, J.S. and Ghadiri, M. 2002. Electrostatic enhancement of coalescence
of water droplets in oil: a review of the technology. Chemical Engineer-
ing Journal 85 (2–3): 357–368. doi: 10.1016/S1385-8947(01)00250-9.
Galinat, S., Masbernat, O., Guiraud, P., Dalmazzone, C., and Noïk, C.
2005. Drop break-up in turbulent pipe flow downstream of a restric-
tion. Chemical Engineering Science 60 (23): 6511–6528. doi: 10.1016/
j.ces.2005.05.012.
Malot, H., Noïk, C., and Dalmazzone, C. 2003. Experimental Investiga-
tion on Water-in-Crude Oil Emulsion Formation Through a Model
Choke-Valve: Droplet Break-up and Phase Inversion. Proc., Multiphase
Fig. 18—Efficiency of electrocoalescence (a) and percentage of separated water after 24 hours (b) as a function of residence time under electrical field for 50 ppm of D3, at 30 and 50°C.
)b( )a(
0
20
40
60
80
100
0 10 20 30 40 50
Residence Time (s)
Eff
icie
nc
y (
%)
50°C – 50 ppm
30°C – 50 ppm
0
20
40
60
80
100
0 10 20 30 40 50
Residence Time (s)
Se
pa
rate
d W
ate
r (%
)
50°C – 50ppm
30°C – 50ppm
736 September 2010 SPE Journal
Conference, BHR Group Multiphase Technology, San-Remo, Italy,
11–13 June, 543–559.
Noïk, C., Chen, J., and Dalmazzone, C. 2006. Electrostatic Demulsification
on Crude Oil: A State-of-the-Art Review. Paper SPE 103808 presented
at the International Oil and Gas Conference and Exhibition in China,
Beijing, 5–7 December. doi: 10.2118/103808-MS.
Noïk, C., Dalmazzone, C., and Glenat, P. 2008a. Pre-electrocoalescer Unit
Adapted to the Extra-heavy Oil Characteristics. Paper SPE 117563
presented at the International Thermal Operations and Heavy Oil Sym-
Noïk, C., Dalmazzone, C., Glenat, P., and Pichot, D. 2008b. Extra Heavy
Oil pre-Dehydration Process Development. Paper 2008-319 presented
at the World Heavy Oil Congress, Edmonton, Alberta, Canada, 10–12
March.
Noïk, C., Dalmazzone, C., Goulay, C., and Glenat, P. 2005. Characteriza-
tion and Emulsion Behaviour of Athabasca Extra-Heavy-Oil Produced
by SAGD. Paper SPE 97748 presented at the SPE/PS-CIM/CHOA
International Thermal Operations and Heavy Oil Symposium, Calgary,
1–3 November. doi: 10.2118/97748-MS.
Sams, G.W. and Zaouk, M. 2000. Emulsion Resolution in Electrostatic
Processes. Energy Fuels 14 (1): 31–37. doi: 10.1021/ef990109w.
Sherman, P. ed. 1968. Emulsion Science, 206–207. London: Academic
Press.
Christine Dalmazzone has been a research engineer at IFP since 1991. email: [email protected]. Her research interests include the physicochemical characterization of complex fluids in drilling and production, oil-based muds, hydrates formation in drilling fluids, crude oil emulsions, and
crude oil/water separation. Dalmazzone holds a PhD degree in chemical engineering from the University of Technology of Compiègne. She is a member of the Society of Petroleum Engineers. Christine Noïk is senior researcher and project leader at IFP on oil/water separation for oil exploitation and production activities. email: [email protected]. She has more than 20 years of experience in applied research on chem-istry and physicochemistry in various projects in oil industry, including reservoir engineering for enhanced oil recovery, drilling fluids and cement, and oil and water treatments in production and refinery. She holds a PhD degree in polymer chemistry from the University of Grenoble. She is a member of the Society of Petroleum Engineers. Philippe Glénat is a senior production chemistry flow assurance engineer work-ing for Total Exploration and Production since 1991. email: [email protected]. He holds an engineer degree from the Institut National Des Sciences Appliquées de Lyon in biochemistry and a PhD degree from the Université de Lyon. After filling different positions in France and abroad, he joined the Scientific and Technical Centre in Pau, France, where he is involved in research and development activities covering production chemistry with assistance to operations and proj-ects developments. Fabrice Hung-Ming Dang holds a master’s degree in mechanical engineering from Nantes University and a professional master in finance degree from the University of Paris, Sorbonne. email: [email protected]. He has 10 years of experience in the petroleum industry. After working in exploration and production process design, offshore platform exploitation, and liquefied natural gas project detail engineer-ing, Dang is now with the research and development division of Total Exploration and Production. He is leader for the surface installation and upgrading of the extraheavy oils projects.