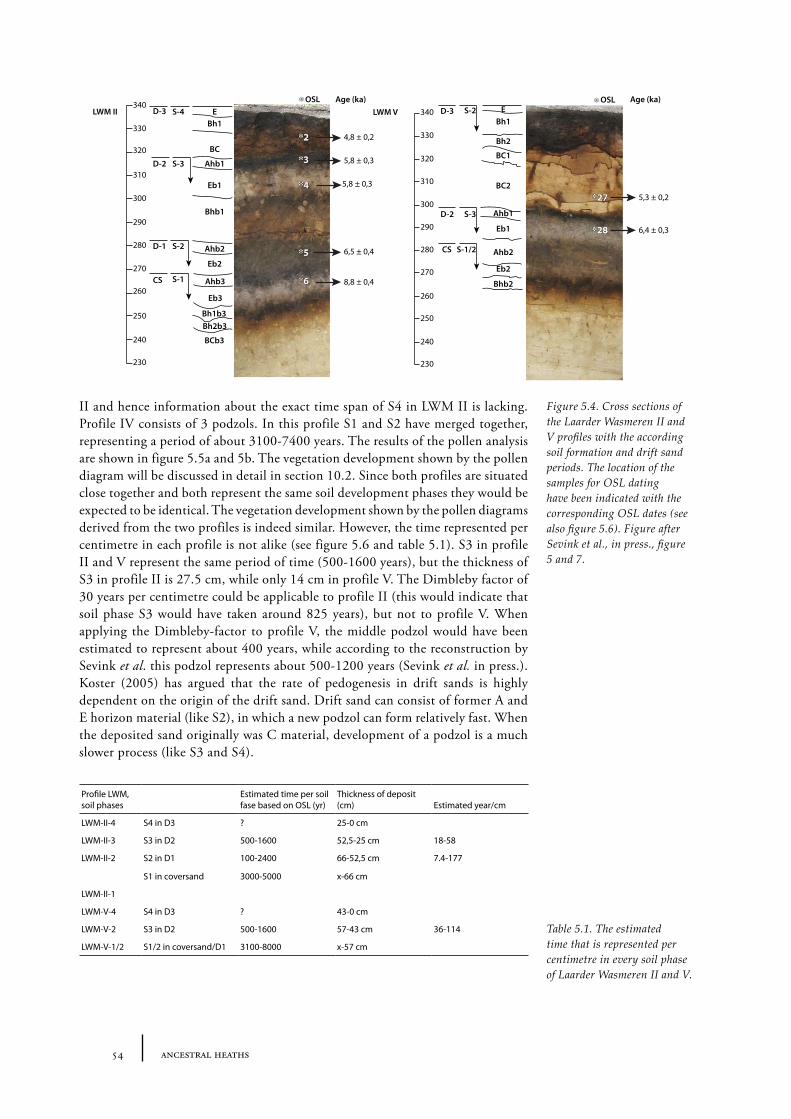
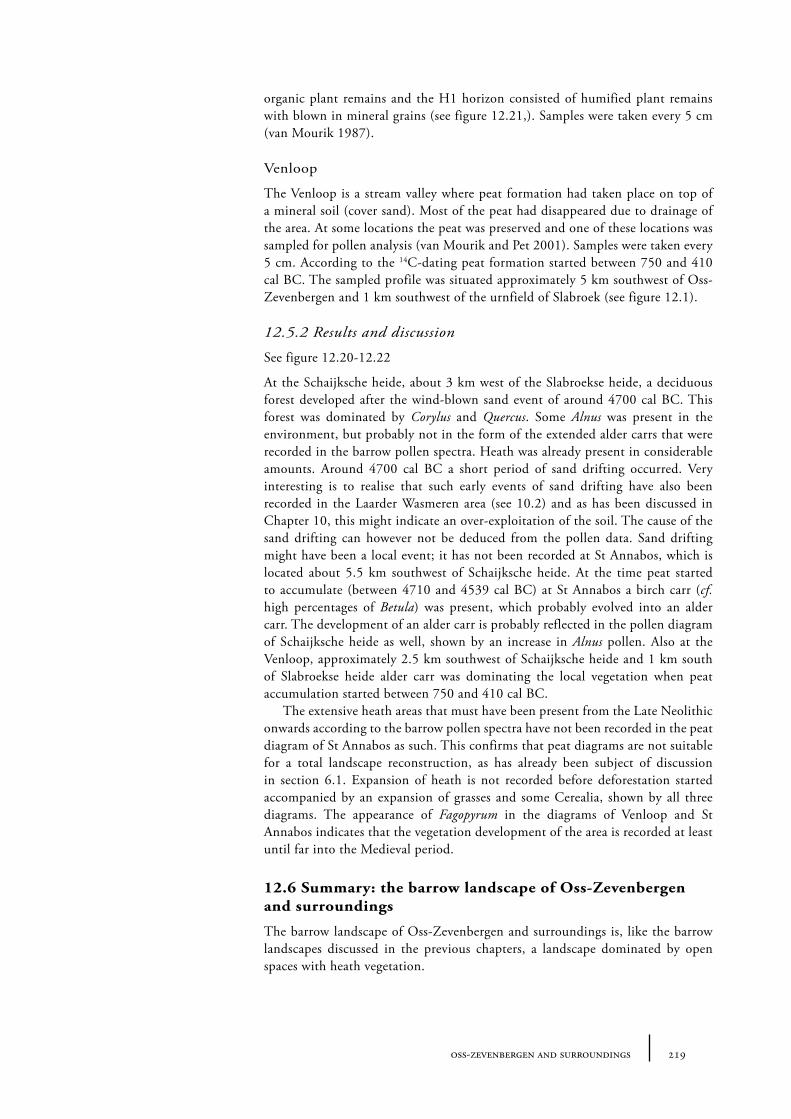
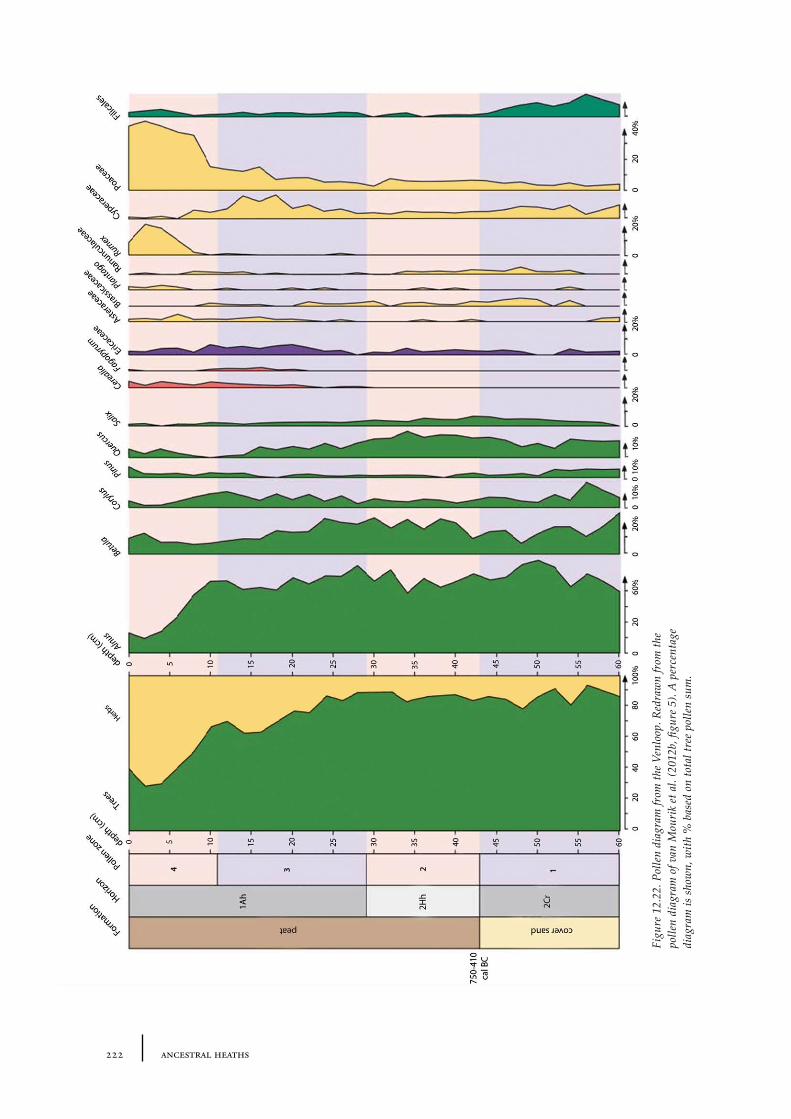
reconstructing the barrow landscape in the central and southern netherlands Marieke Doorenbosch ancestral heaths reconstructing the barrow landscape in the central and southern netherlands Marieke Doorenbosch ancestral heaths
Transcript
anc
estral h
eaths
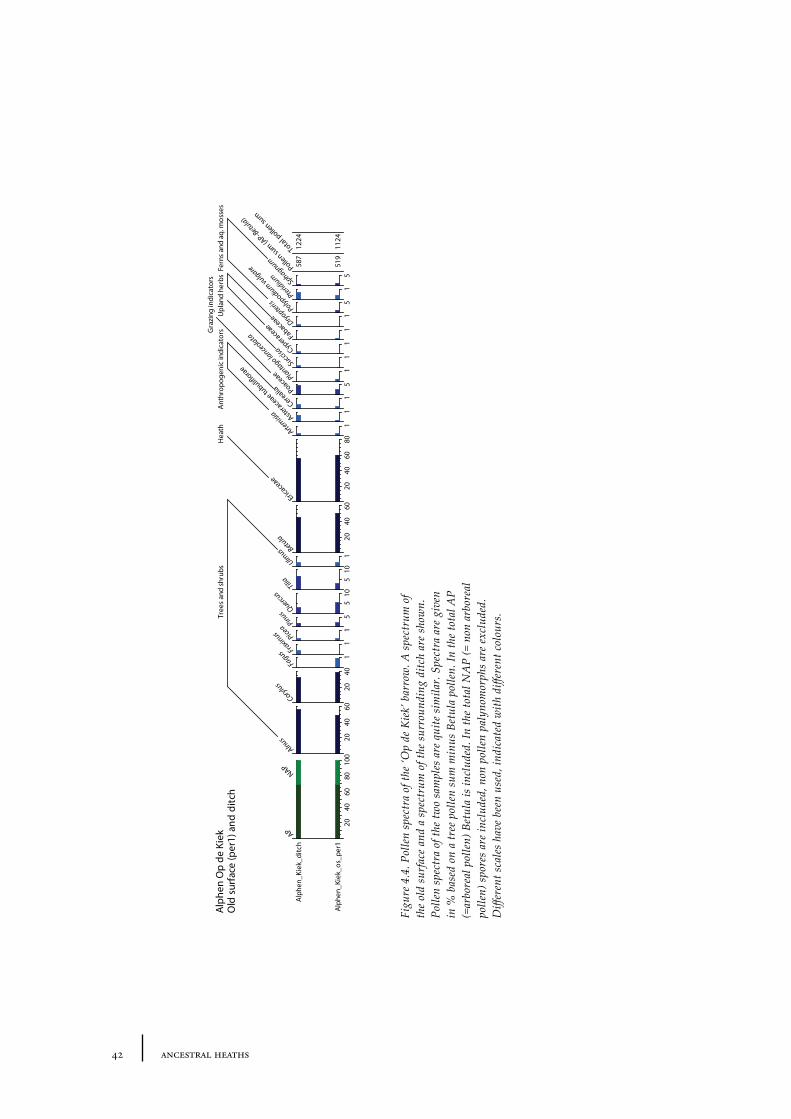
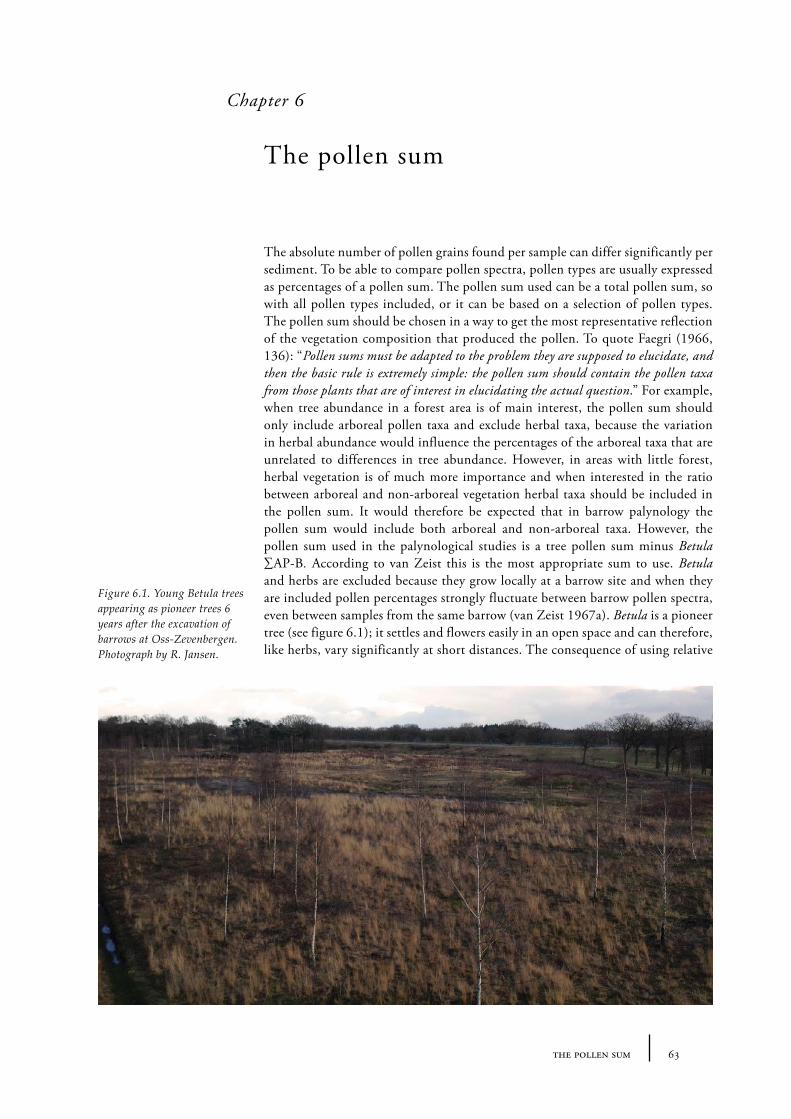
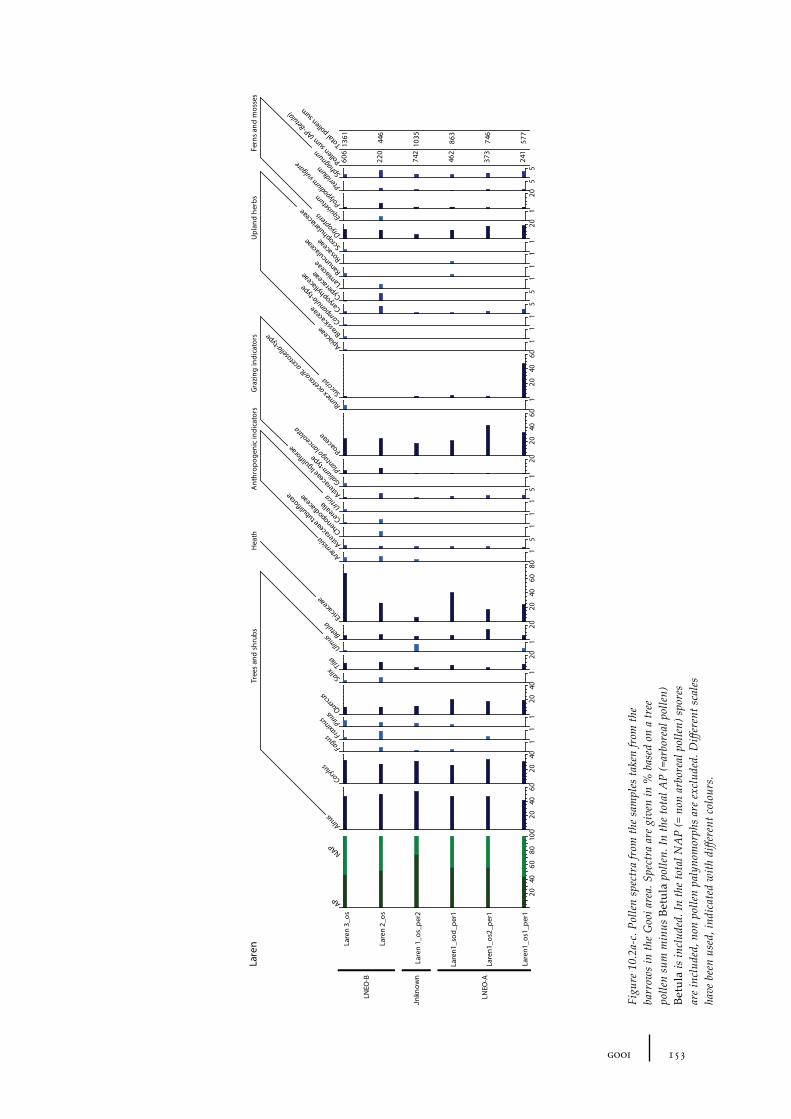
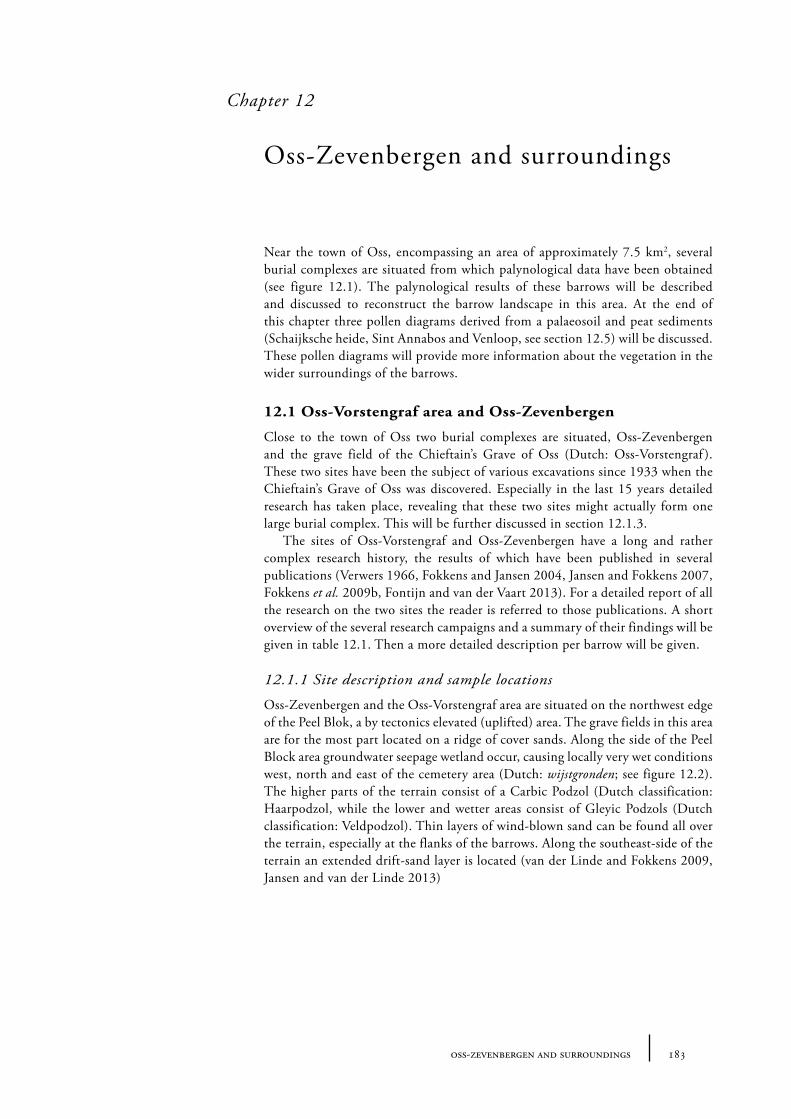
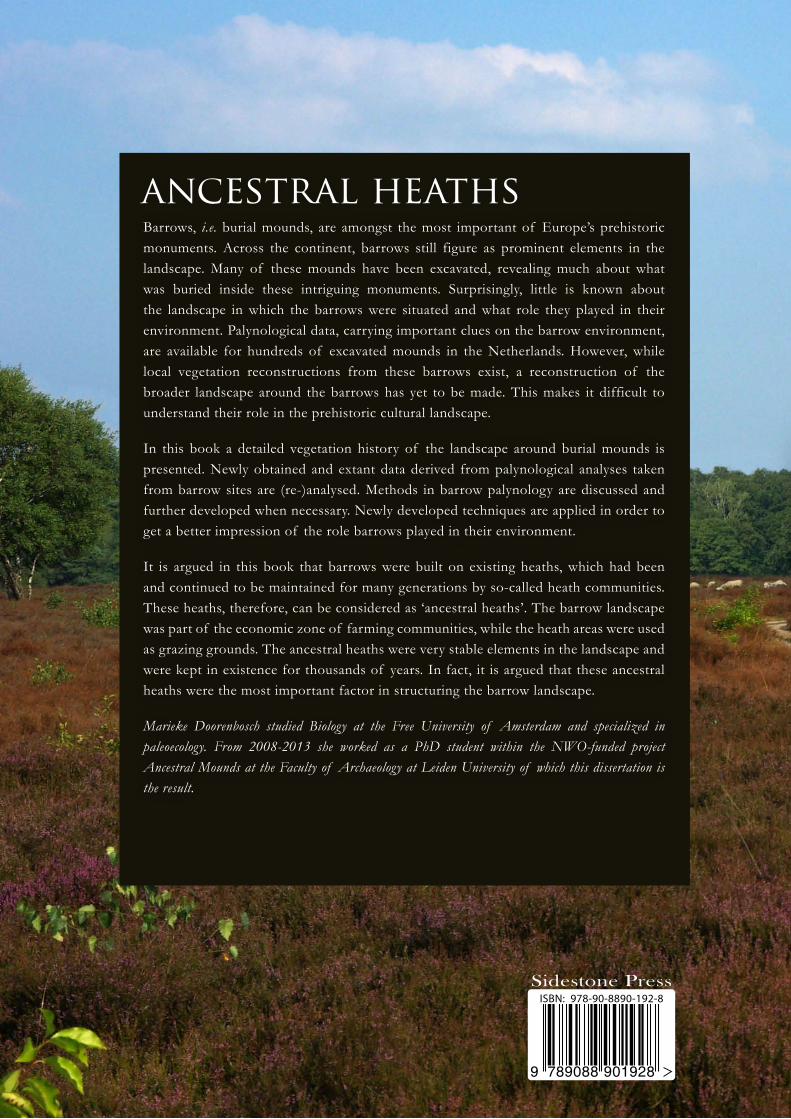
Barrows, i.e. burial mounds, are amongst the most important of Europe’s prehistoric monuments. Across the continent, barrows still figure as prominent elements in the landscape. Many of these mounds have been excavated, revealing much about what was buried inside these intriguing monuments. Surprisingly, little is known about the landscape in which the barrows were situated and what role they played in their environment. Palynological data, carrying important clues on the barrow environment, are available for hundreds of excavated mounds in the Netherlands. However, while local vegetation reconstructions from these barrows exist, a reconstruction of the broader landscape around the barrows has yet to be made. This makes it difficult to understand their role in the prehistoric cultural landscape.
In this book a detailed vegetation history of the landscape around burial mounds is presented. Newly obtained and extant data derived from palynological analyses taken from barrow sites are (re-)analysed. Methods in barrow palynology are discussed and further developed when necessary. Newly developed techniques are applied in order to get a better impression of the role barrows played in their environment.
It is argued in this book that barrows were built on existing heaths, which had been and continued to be maintained for many generations by so-called heath communities. These heaths, therefore, can be considered as ‘ancestral heaths’. The barrow landscape was part of the economic zone of farming communities, while the heath areas were used as grazing grounds. The ancestral heaths were very stable elements in the landscape and were kept in existence for thousands of years. In fact, it is argued that these ancestral heaths were the most important factor in structuring the barrow landscape.
Marieke Doorenbosch studied Biology at the Free University of Amsterdam and specialized in paleoecology. From 2008-2013 she worked as a PhD student within the NWO-funded project Ancestral Mounds at the Faculty of Archaeology at Leiden University of which this dissertation is the result.
reconstructing the barrow landscape in the central and southern netherlands
Marieke Doorenbosch
ancestral heaths
Sid
esto
ne9 789088 901928
ISBN 978-90-8890-192-8
ISBN: 978-90-8890-192-8
Sidestone Press
Mar
ieke D
oo
ren
bosc
h
ancestral heathsreconstructing the barrow landscape in the
central and southern netherlands
anc
estral h
eaths
Mar
ieke D
oo
ren
bosc
h
Marieke Doorenbosch
ancestral heaths
This is an Open Access publication. Visit our website for more OA publication, to read any of our books for free online, or to buy them in print or PDF.
www.sidestone.com
Check out some of our latest publications:
Sidestone Press
ancestral heaths
Proefschrift
ter verkrijging vande graad van Doctor aan de Universiteit Leiden,
op gezag van Rector Magnificus prof.mr. C.J.J.M. Stolker, volgens besluit van het College voor Promotieste verdedigen op donderdag 21 november 2013
klokke 15.00 uur
door
Marieke Doorenbosch
geboren te Amsterdamin 1980
reconstructing the barrow landscape in the central and southern netherlands
Second (revised) edition, December 2013 (see p. 280 for changes)
Published by Sidestone Press, Leiden www.sidestone.com
ISBN 978-90-8890-192-8
Lay-out & cover design: Sidestone PressPhotograph cover: K. Wentink
This publication was financially supported by the Stichting Nederlands Museum voor Anthropologie en Praehistorie (SNMAP)
Promotiecommissie:
Promotor: Prof. Dr. C.C. Bakels
Co-promotor: Dr. D.R. Fontijn
Overige commissieleden:
Prof. Dr. J. Müller, Christian-Albrechts-Universität, Kiel
Dr. J.M. van Mourik, Universiteit van Amsterdam
Dr. A.B. Nielsen, Lunds Universitet
Prof. Dr. H. Fokkens, Universiteit Leiden
Contents
Part One 11
1 Introduction: why study the environment of barrows? 13
1.1 The academic significance of environmental barrow research 131.2 The societal significance of environmental barrow research 15
2 Environmental research on barrows, an overview so far 17
2.1 The vegetation history of the Netherlands in the Holocene 172.2 Environmental research on barrows 19
2.2.1 An overview 192.2.2 Pollen analyses for dating purposes 202.2.3 The reconstruction of local vegetation: regional and cultural differences 21
2.3 Vegetation reconstructions of the barrow environment: open spaces in the landscape 24
2.3.1 An overview of open spaces 252.3.2 Which open spaces were chosen for the building of barrows? 282.3.3 What was the size of the open spaces barrows were built in? 32
Conclusions 32
3 Barrow research, missing data 33
3.1 Research questions 333.2 Research area 343.3 Research methods 35
Part Two 37
Methodology 37
4 Sampling and treatment of soil samples 39
4.1 The sampling of barrows 394.1.1 The sampling of the old surface 394.1.2 The sampling of sods 404.1.3 The sampling of the soil profile underneath barrows 404.1.4 The sampling of ditch fills 414.1.5 The sampling of posthole fills 43
4.2 Chemical treatment and analysis of palynological soil samples 45
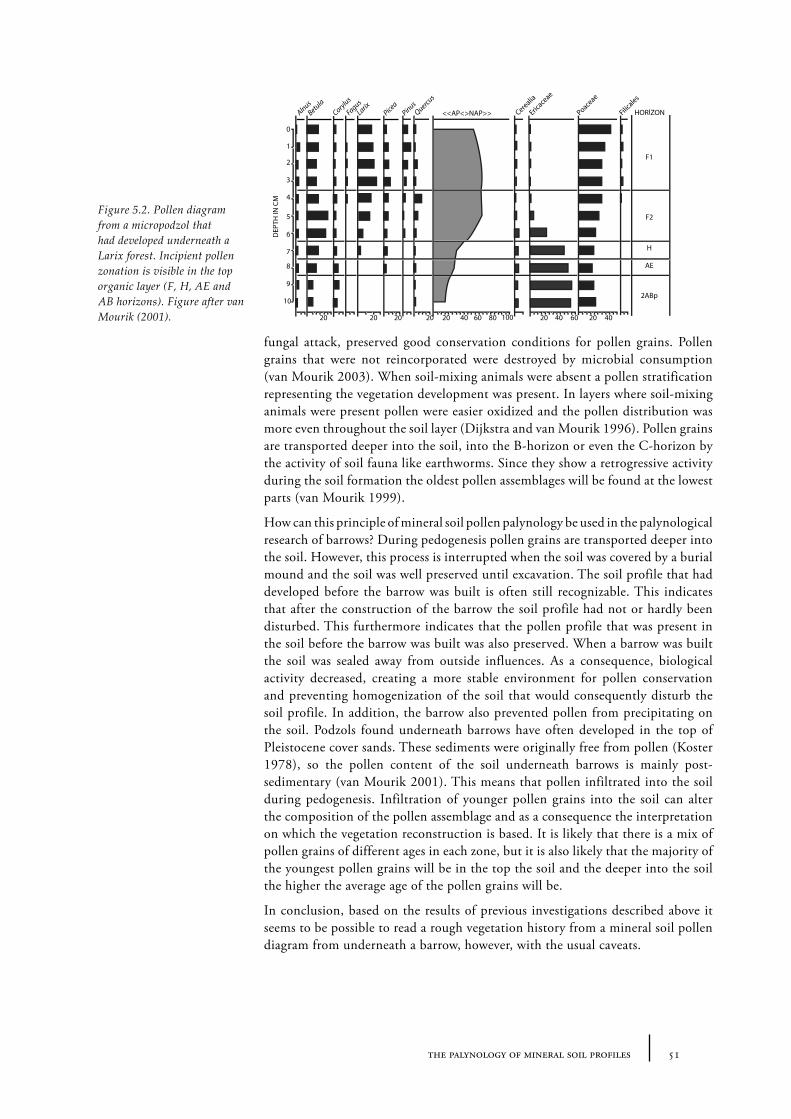
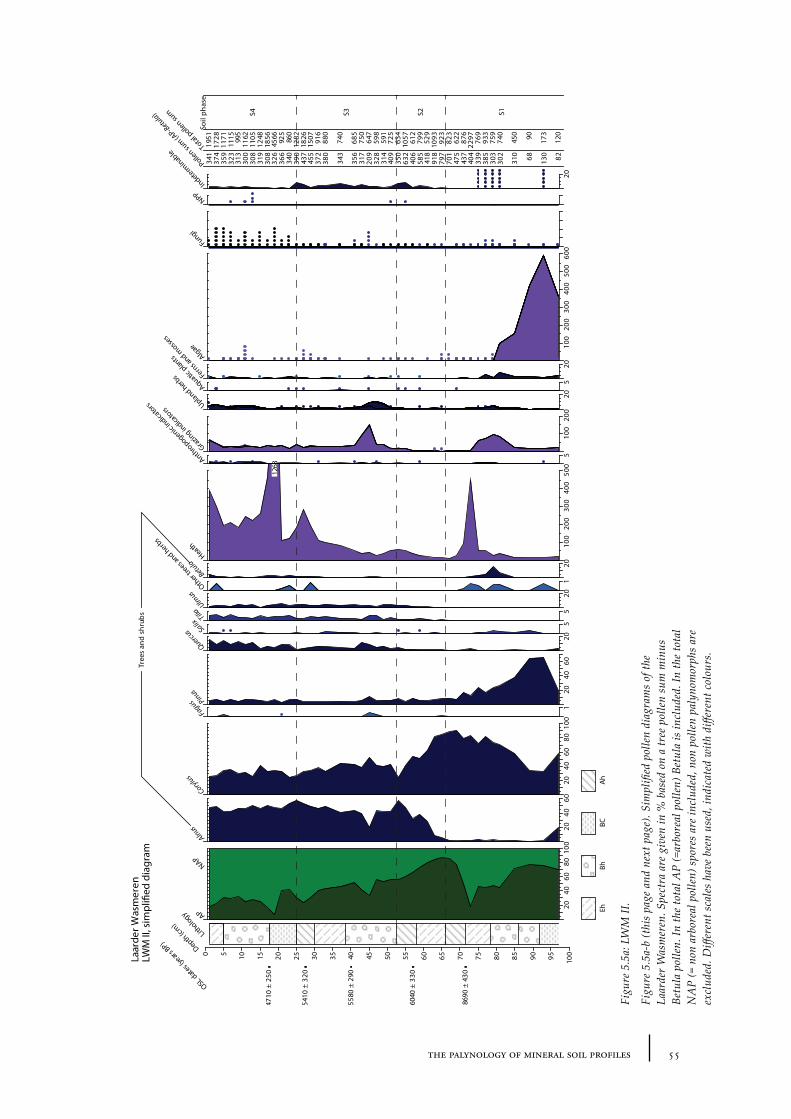
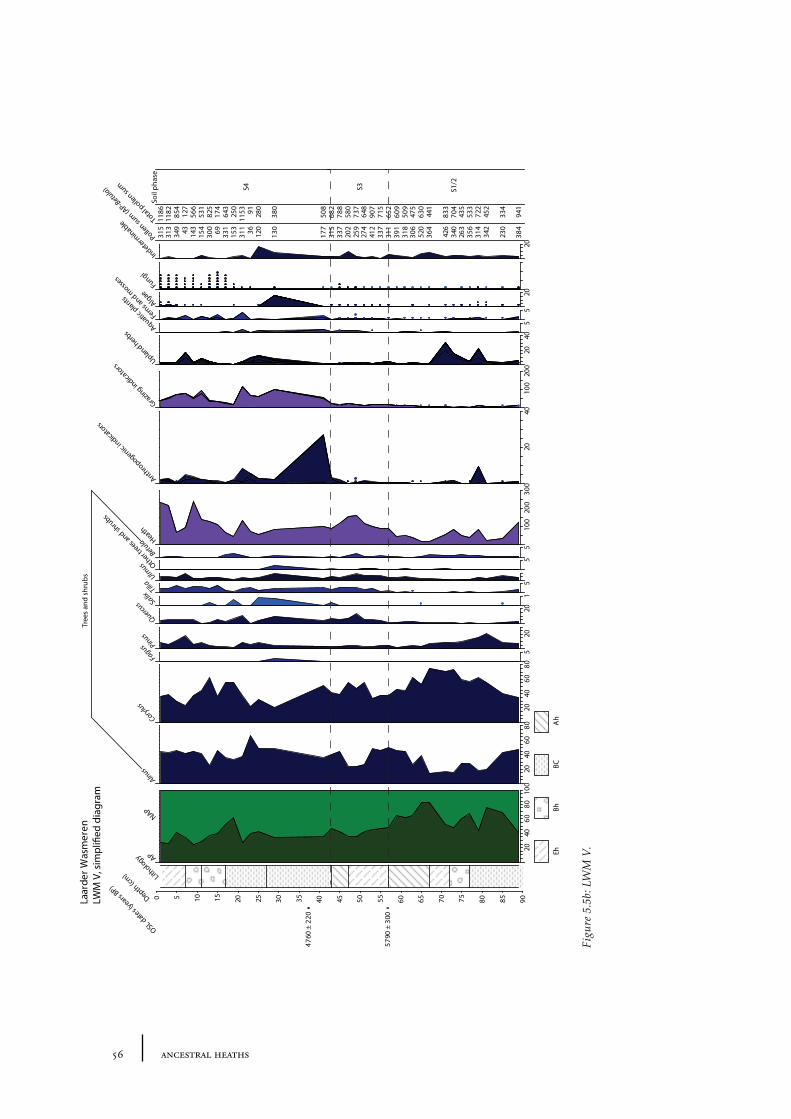
5 The palynology of mineral soil profiles 47
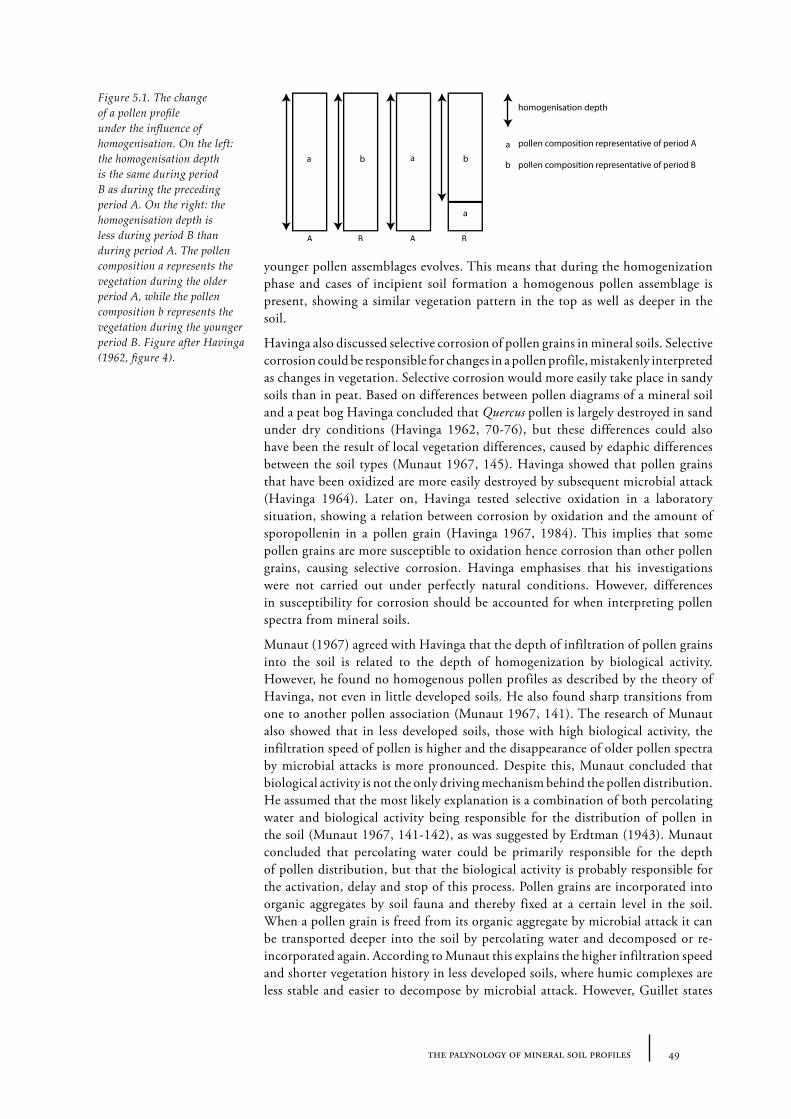
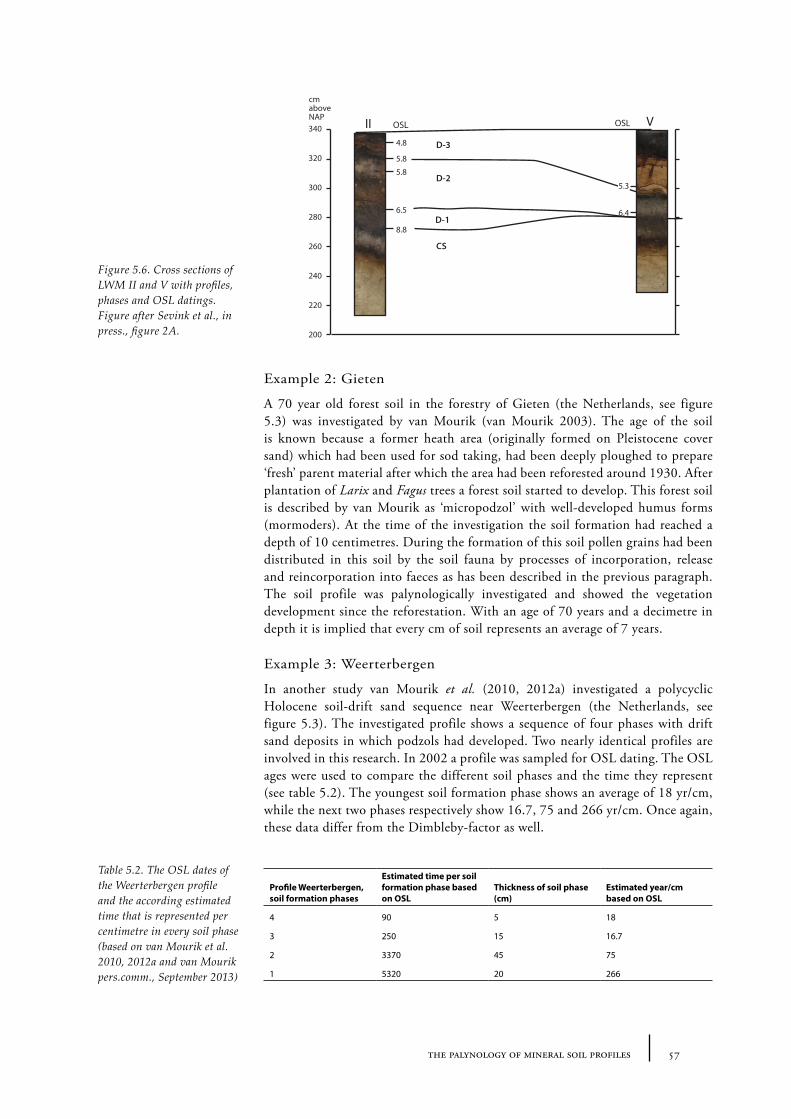
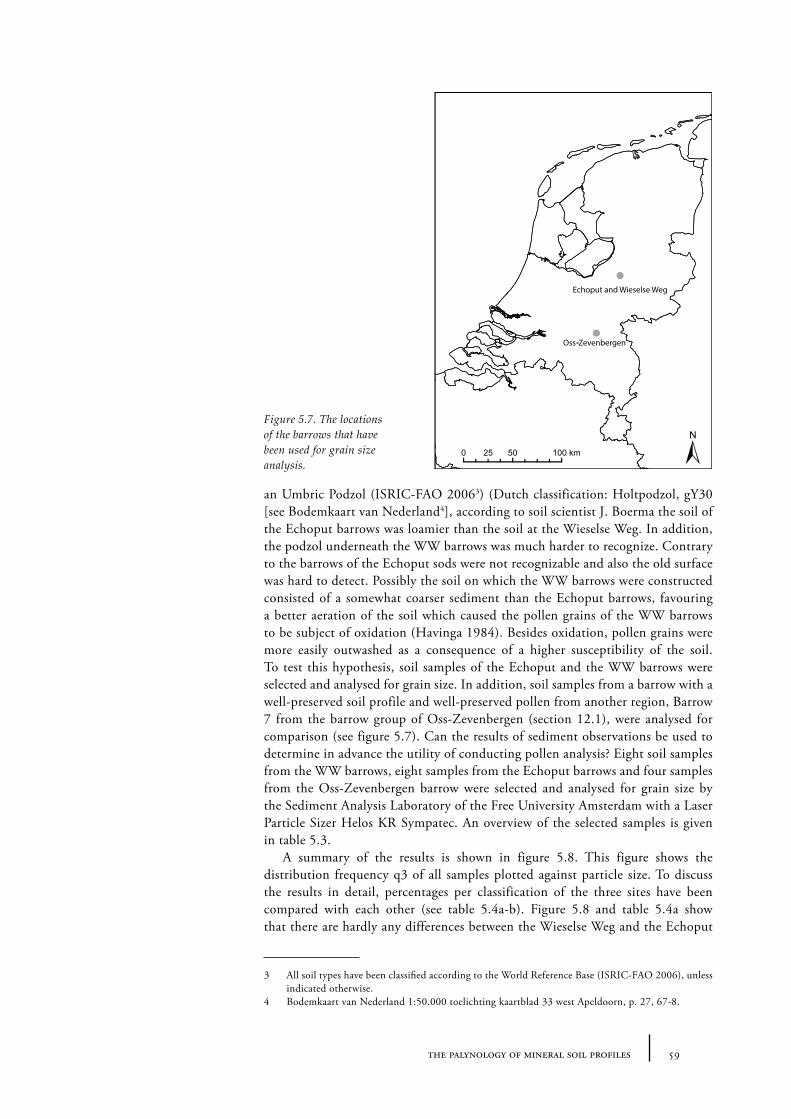
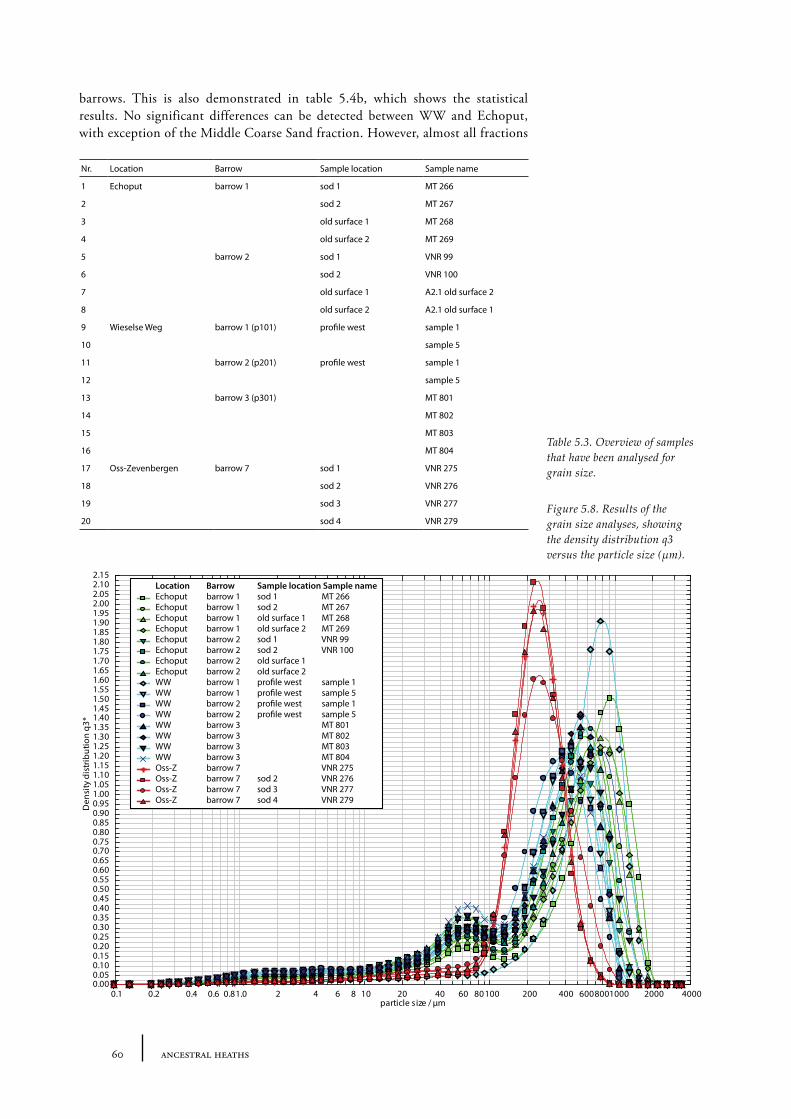
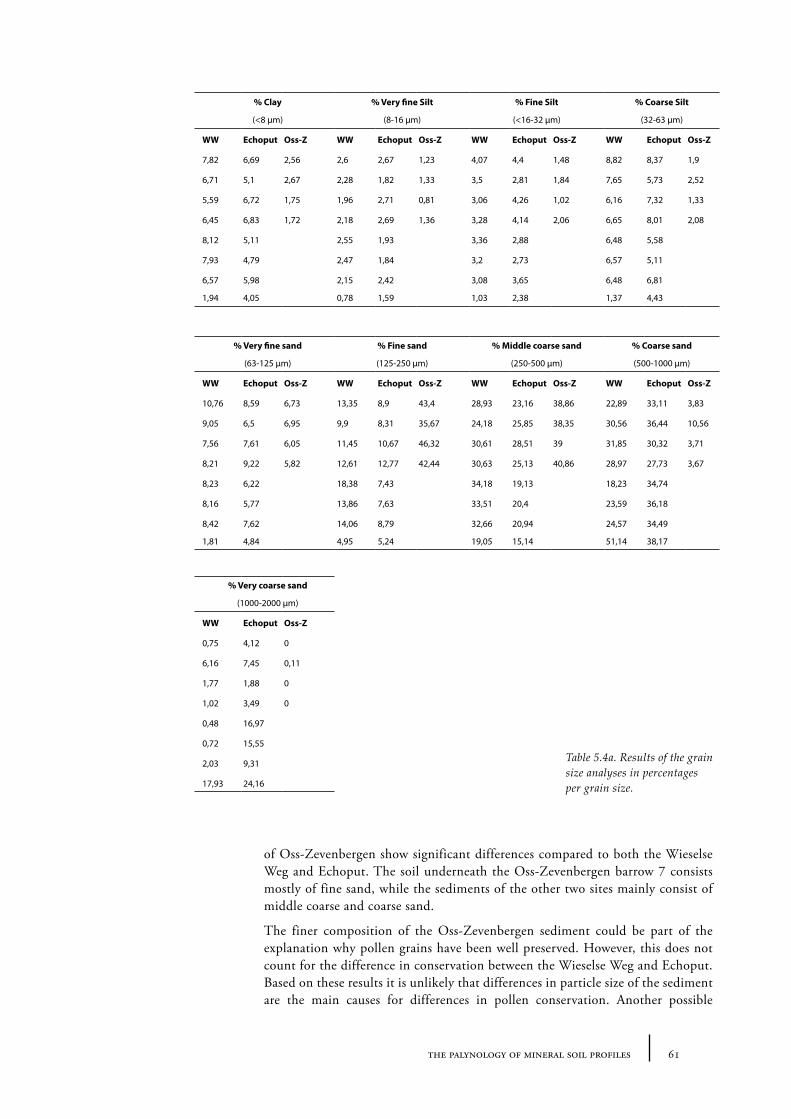
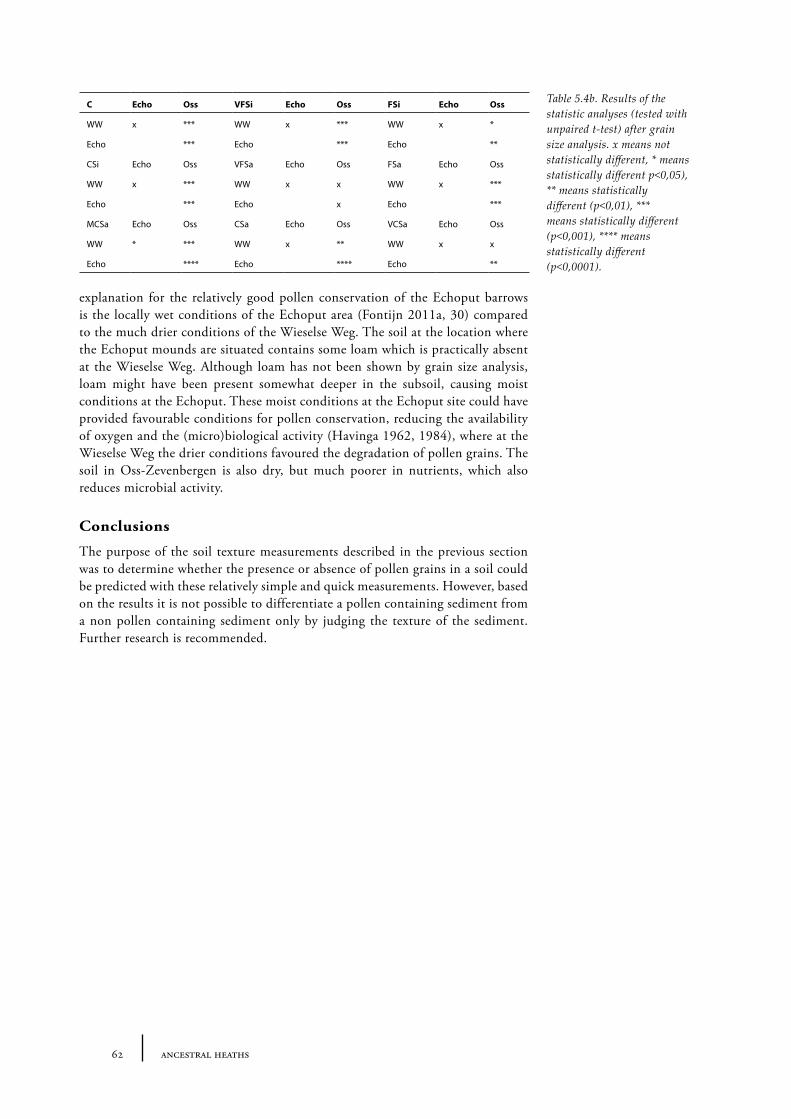
5.1 The theory behind the palynology of mineral soils 475.2 The time represented in a mineral soil pollen diagram 525.3. Absence of pollen grains in barrows 58Conclusions 62
7 The size of an open place where a barrow was built 77
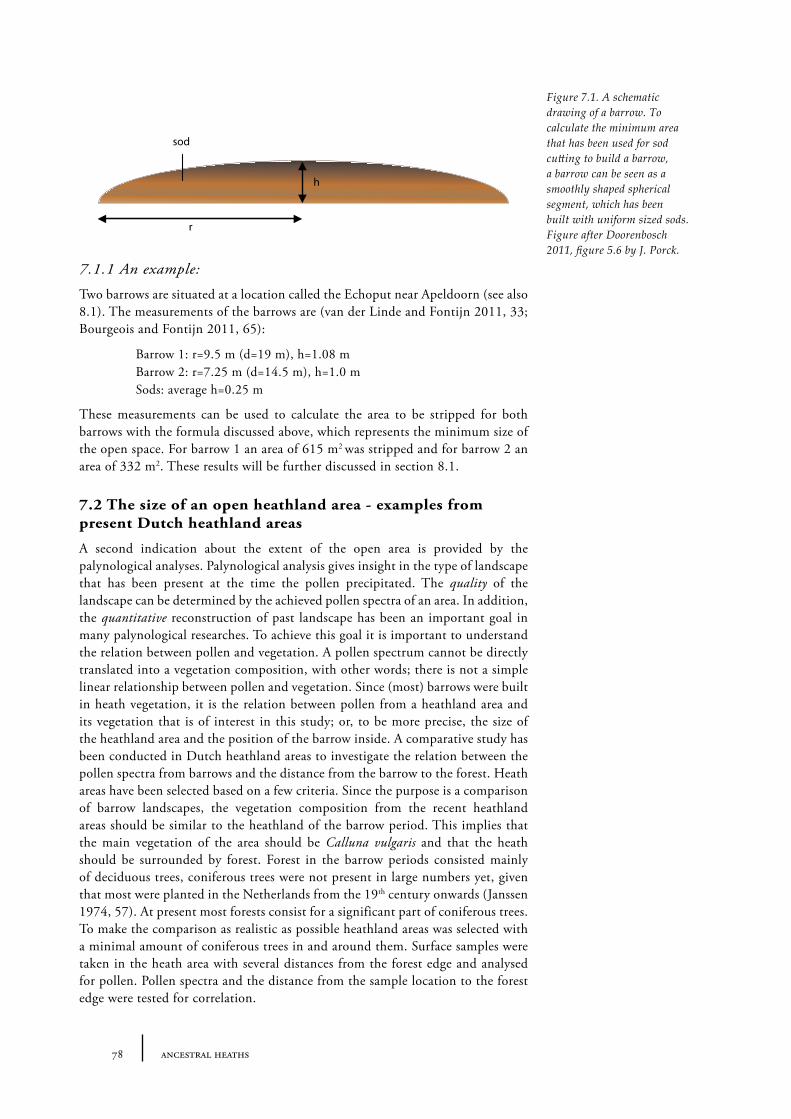
7.1 The size and the number of sods used in a barrow 777.1.1 An example: 78
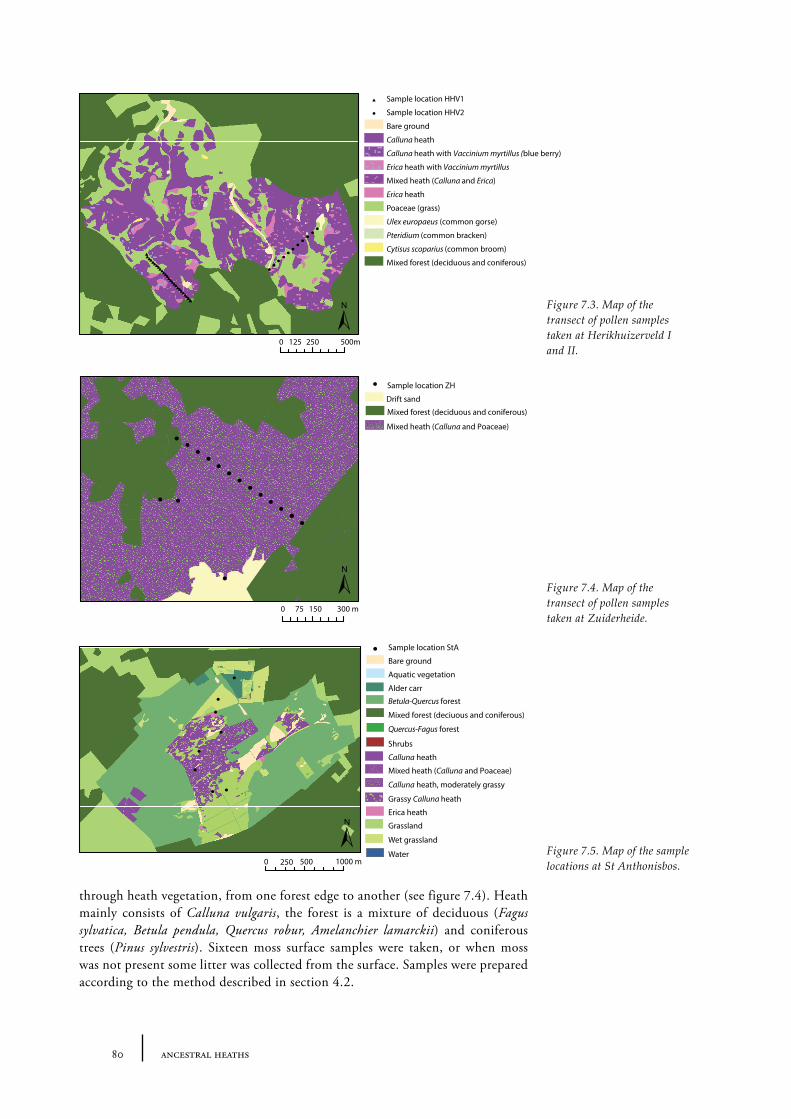
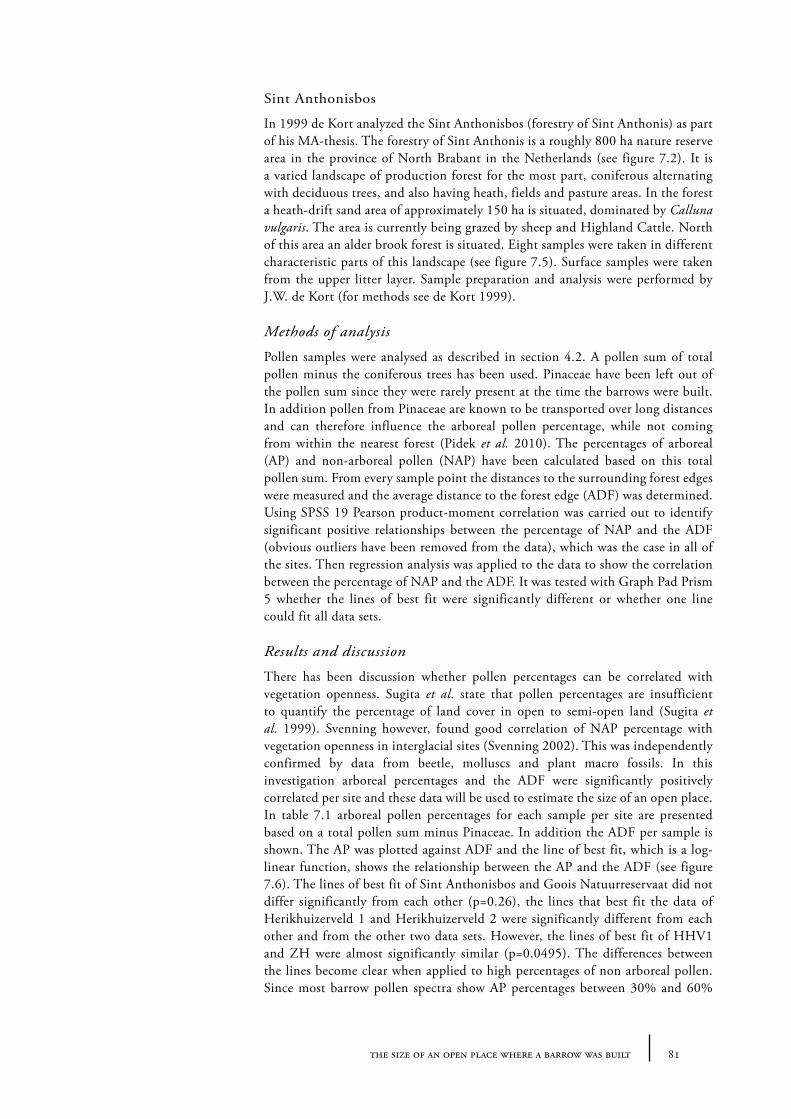
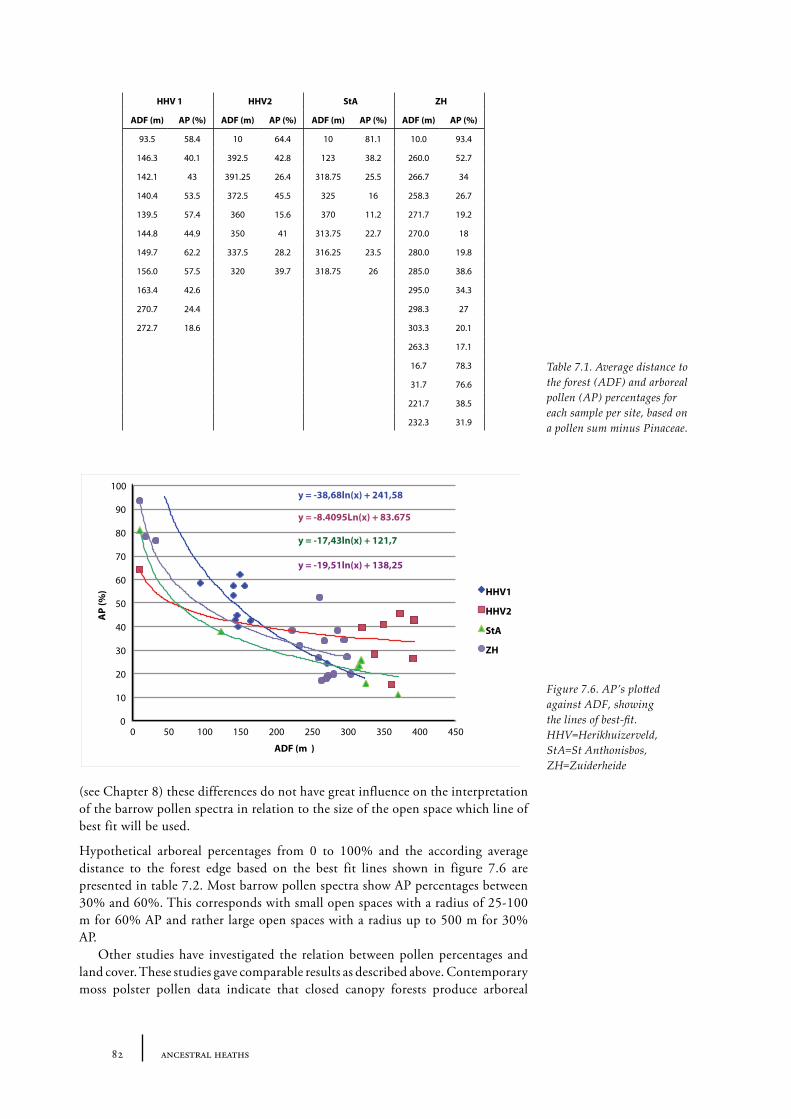
7.2 The size of an open heathland area - examples from present Dutch heathland areas 78
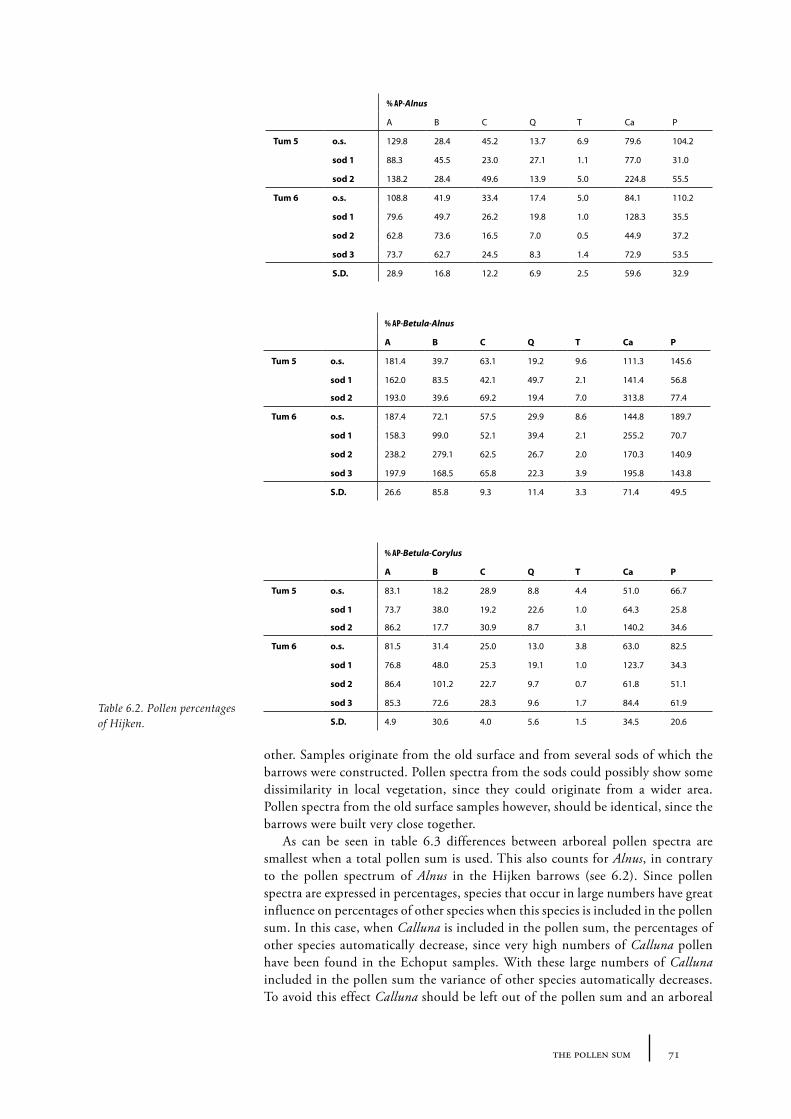
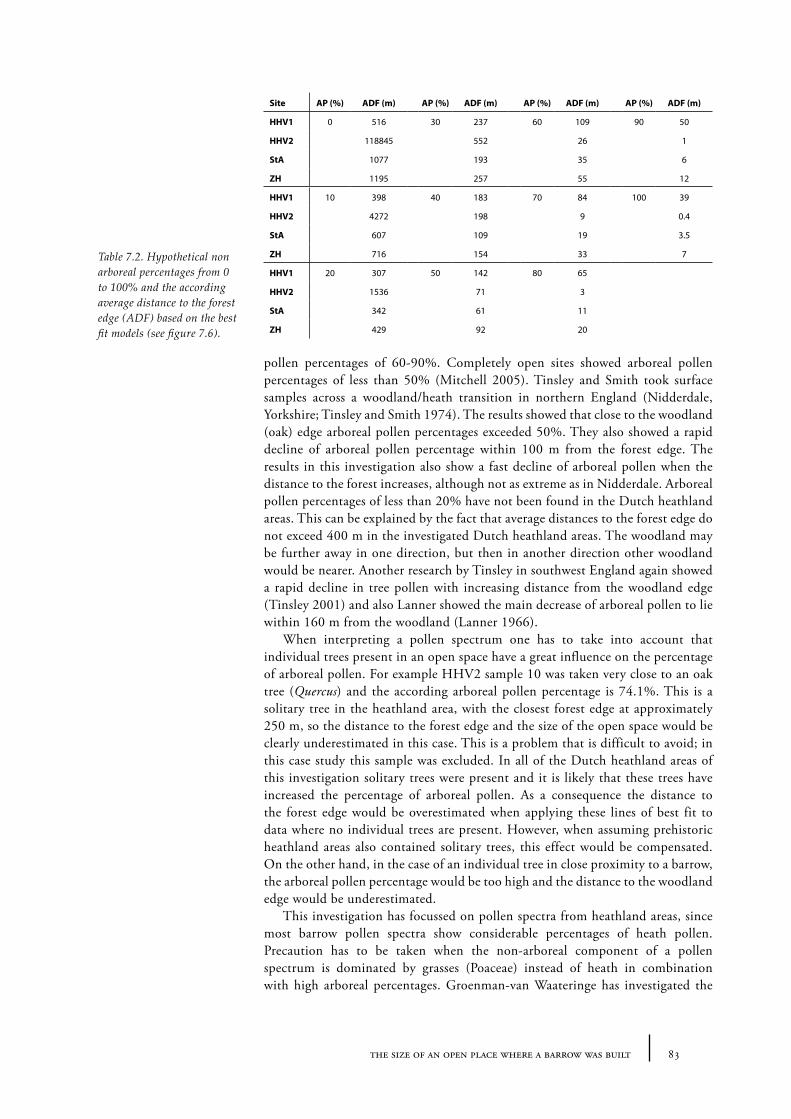
Sites and sampling methods 79Methods of analysis 81Results and discussion 81Conclusions 84
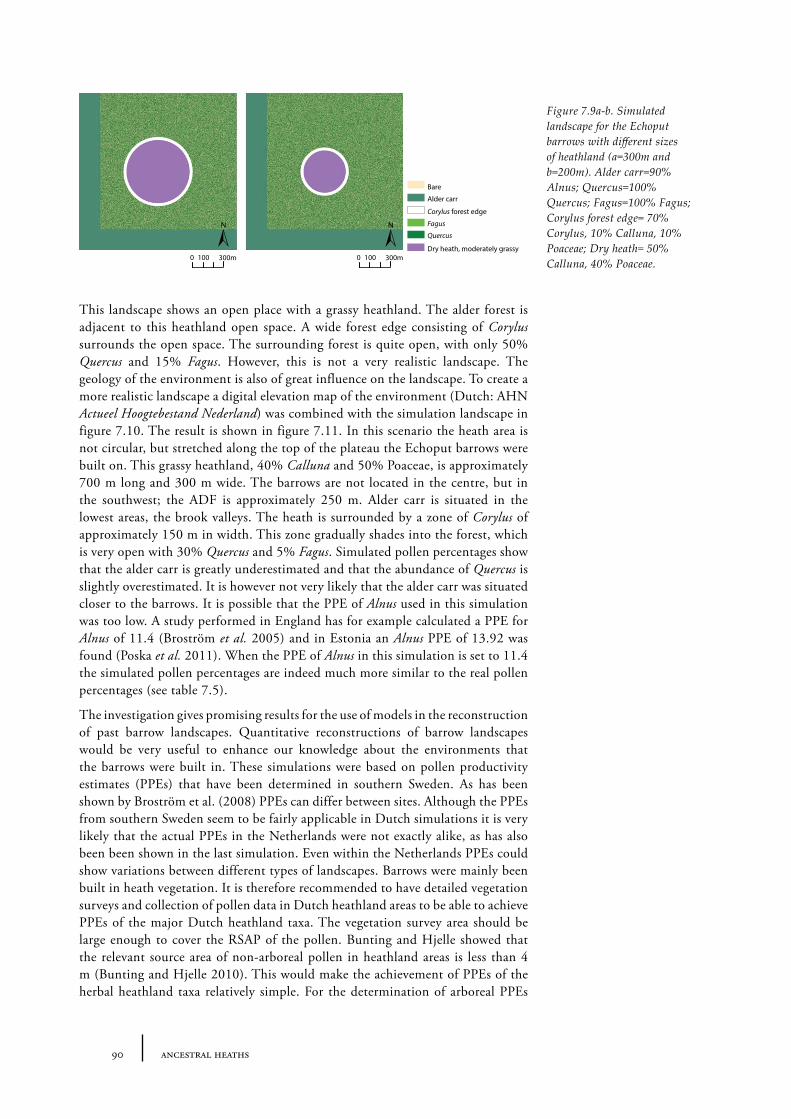
7.3 The distance of a barrow to the forest edge - palynological modelling 84Barrow landscape simulation 85
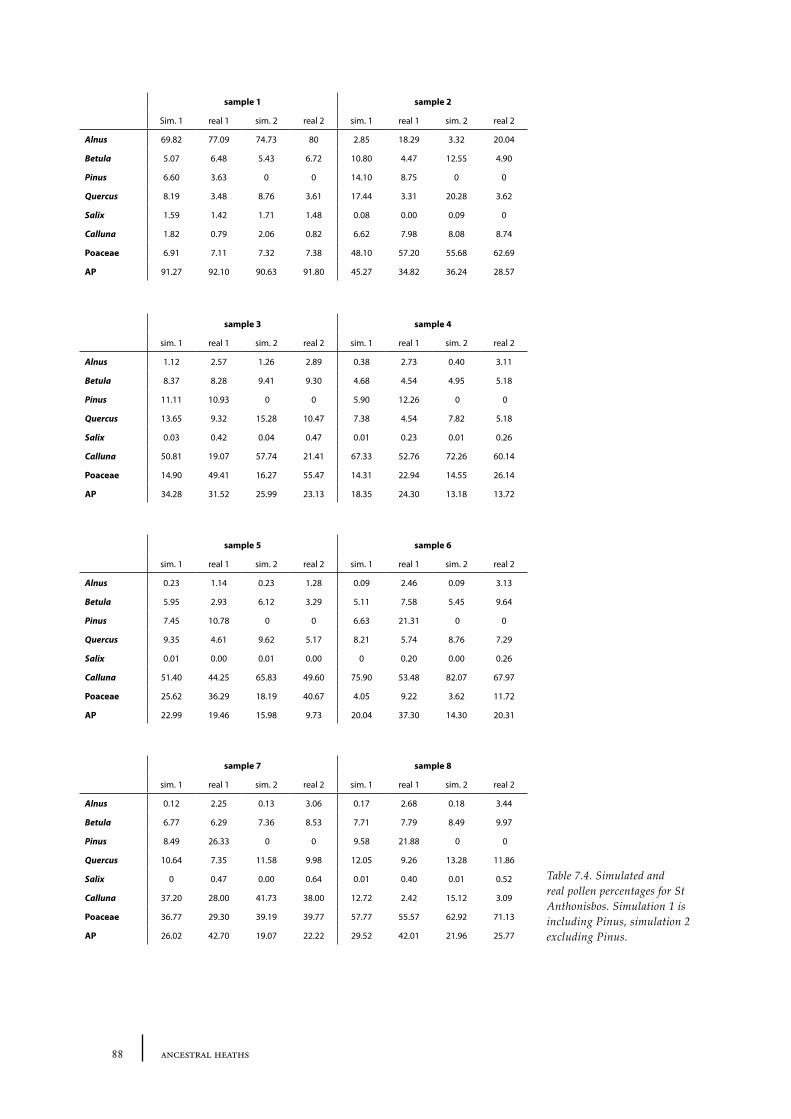
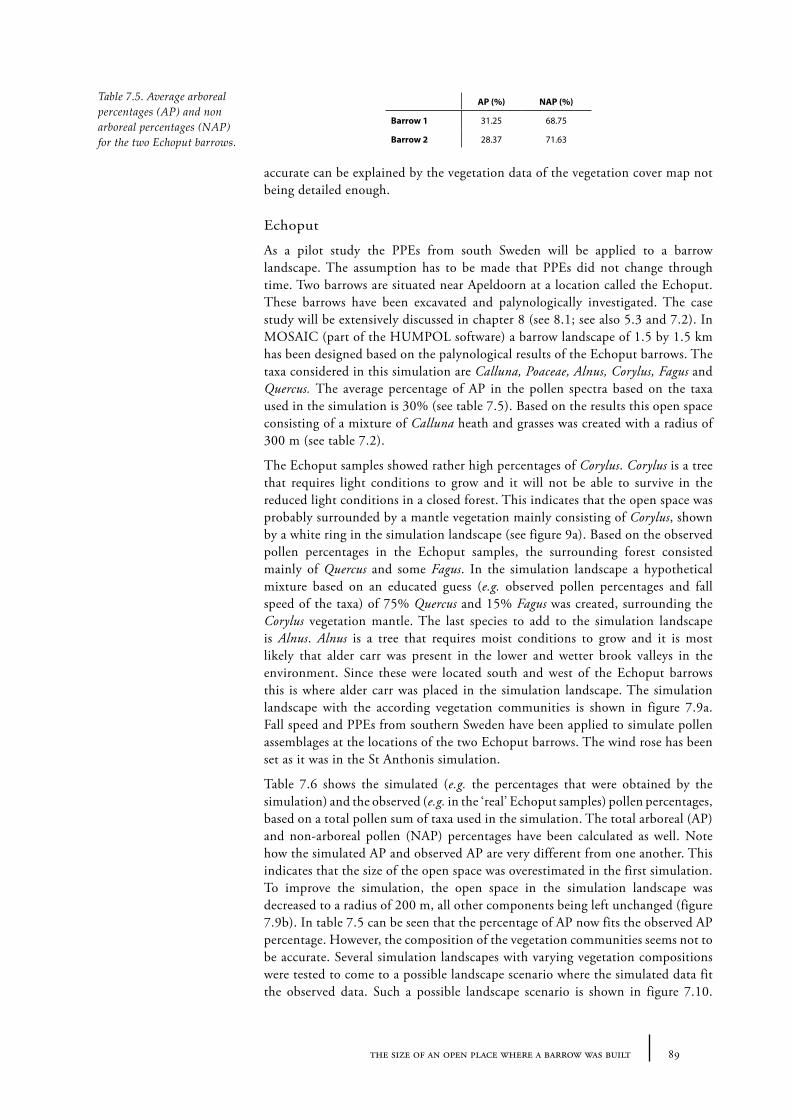
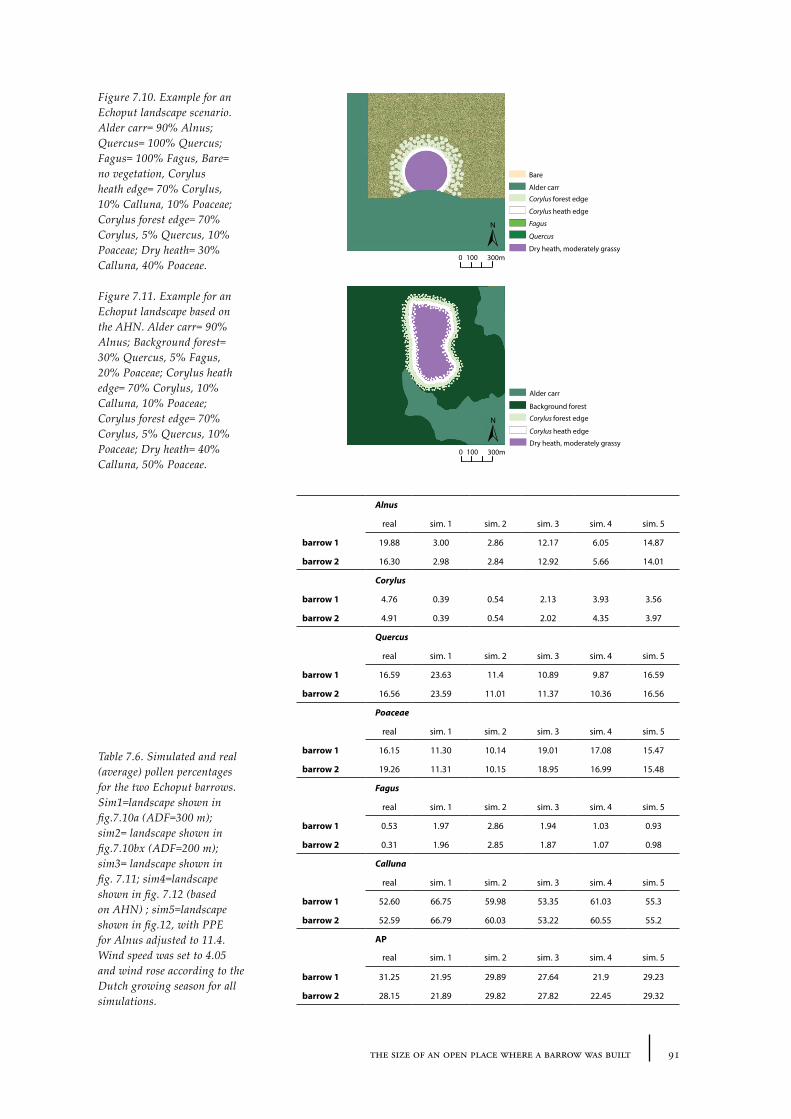
7.4 Discussion 92
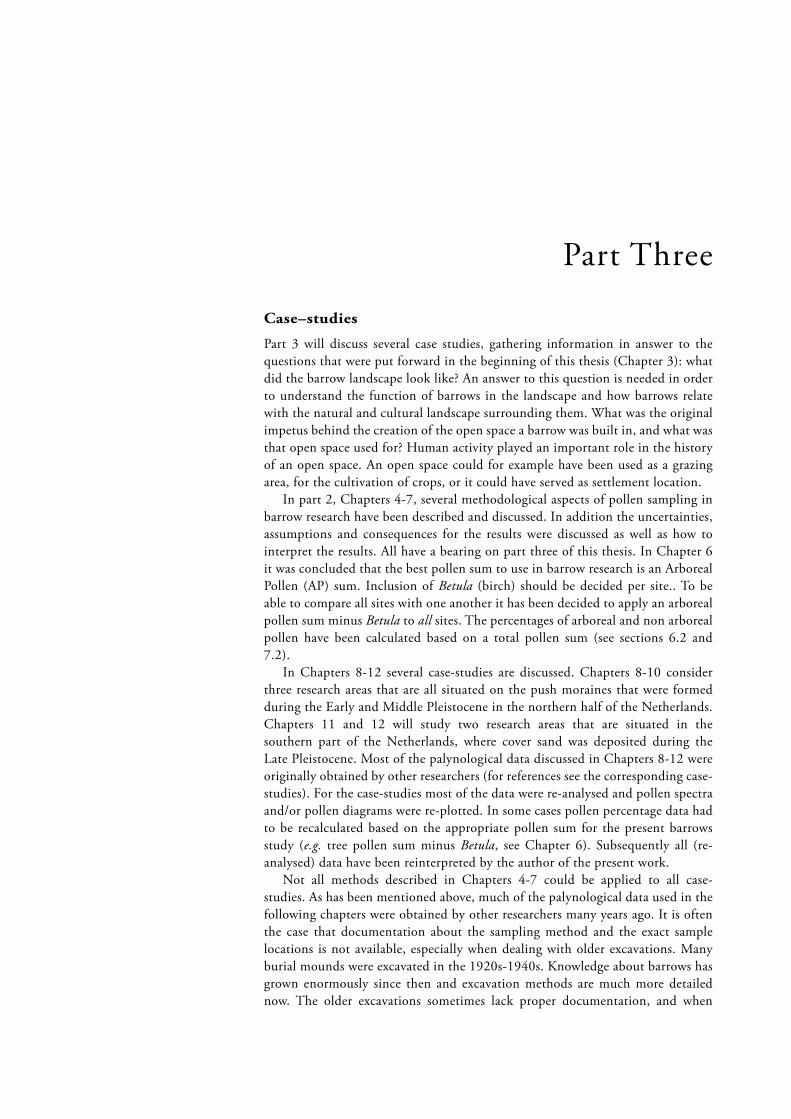
Part Three 93
Case–studies 93
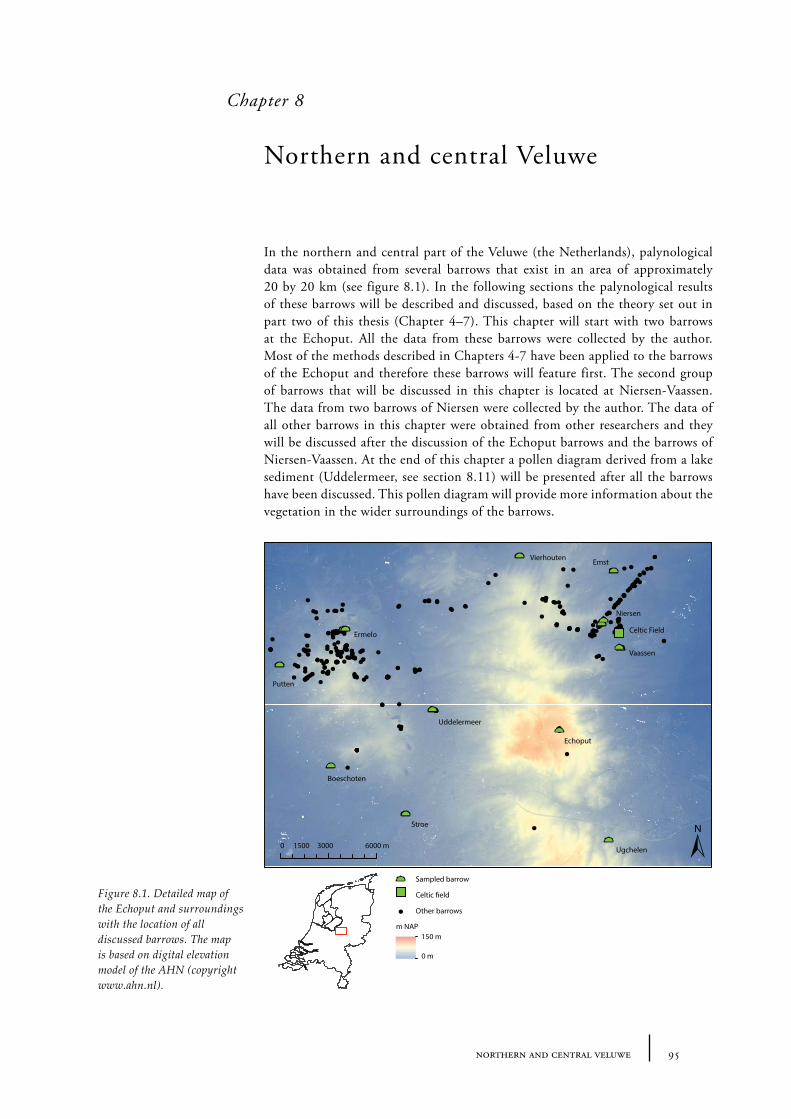
8 Northern and central Veluwe 95
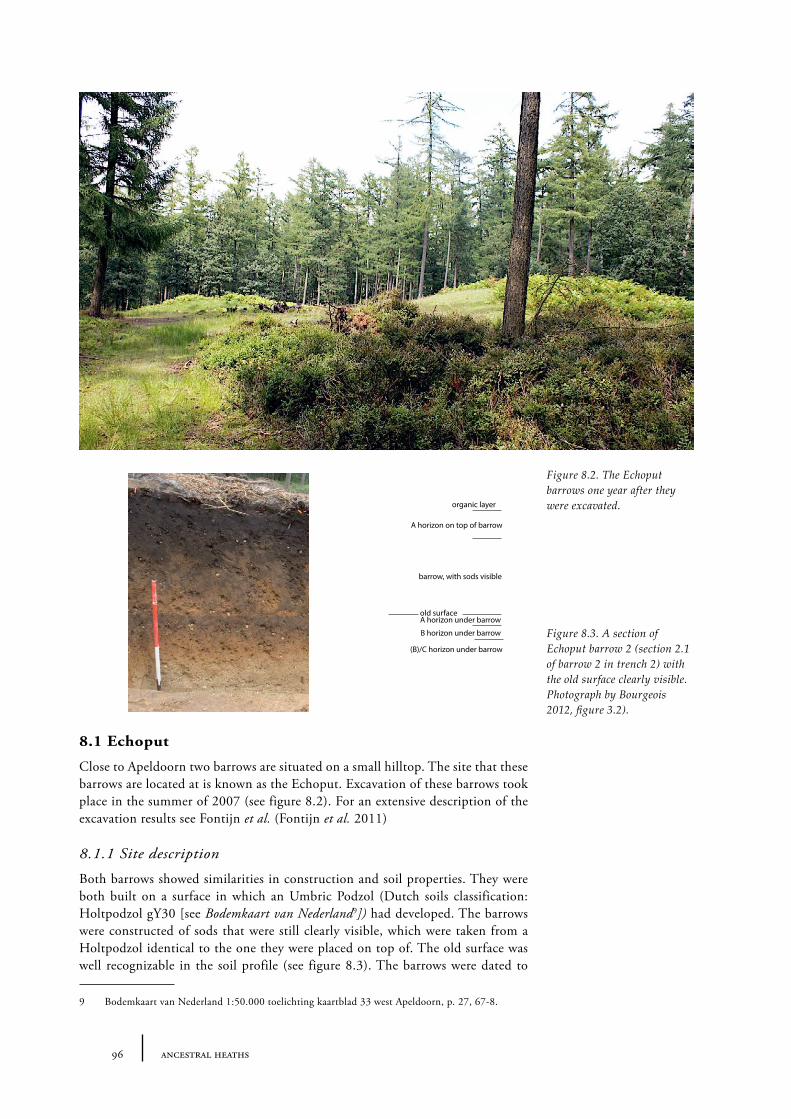
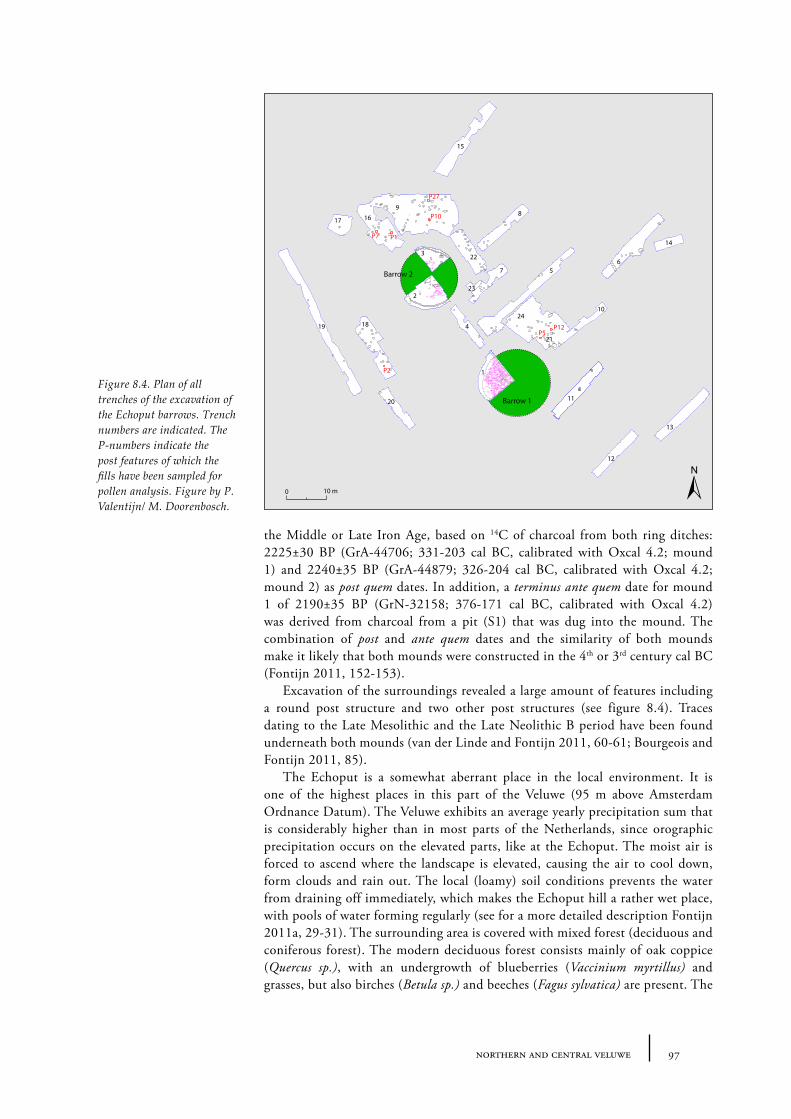
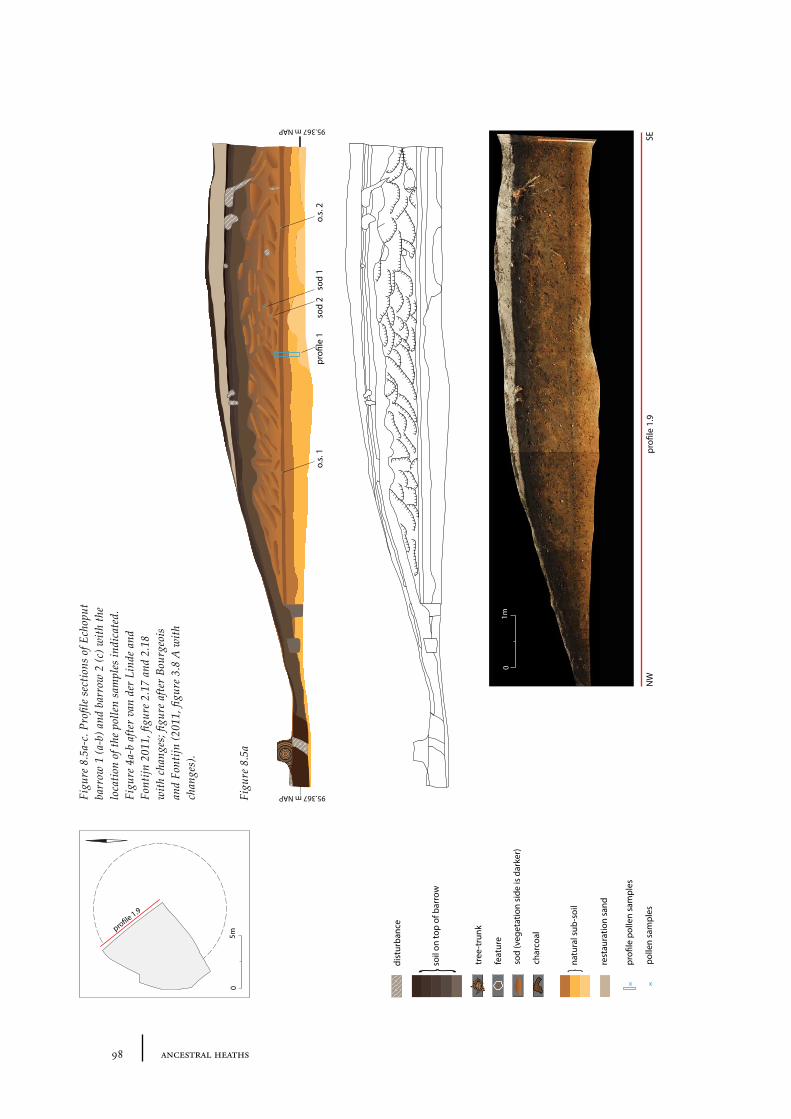
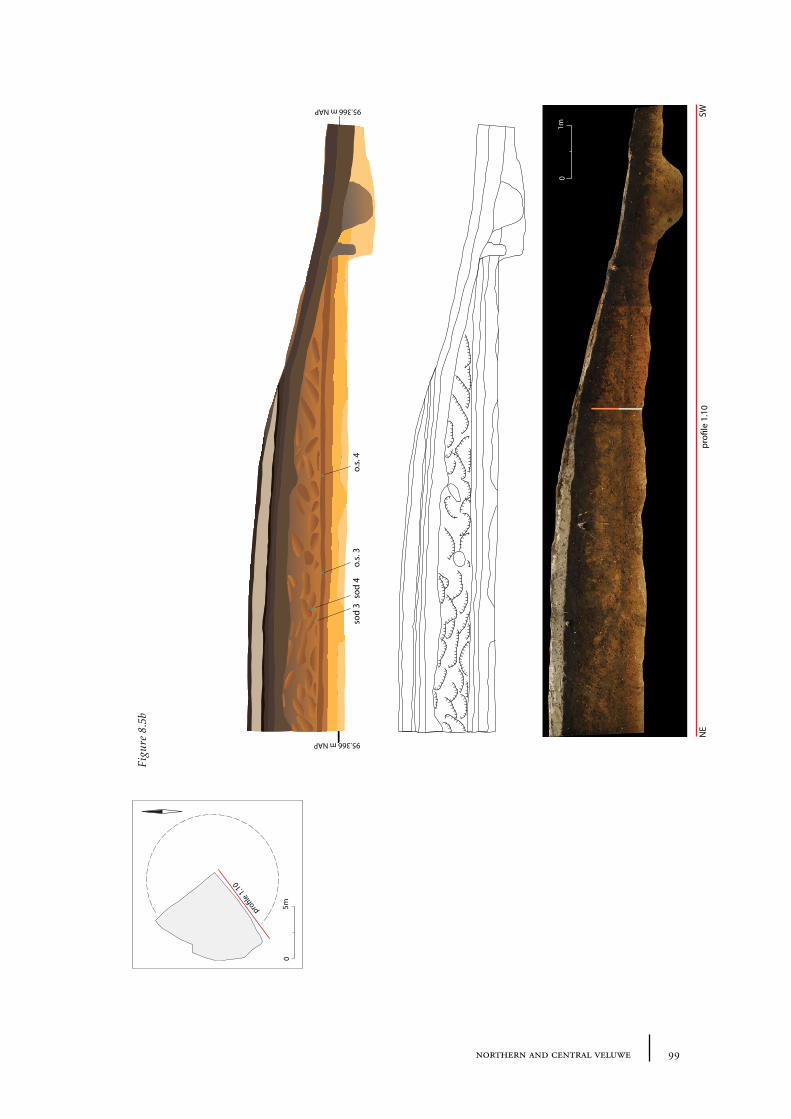
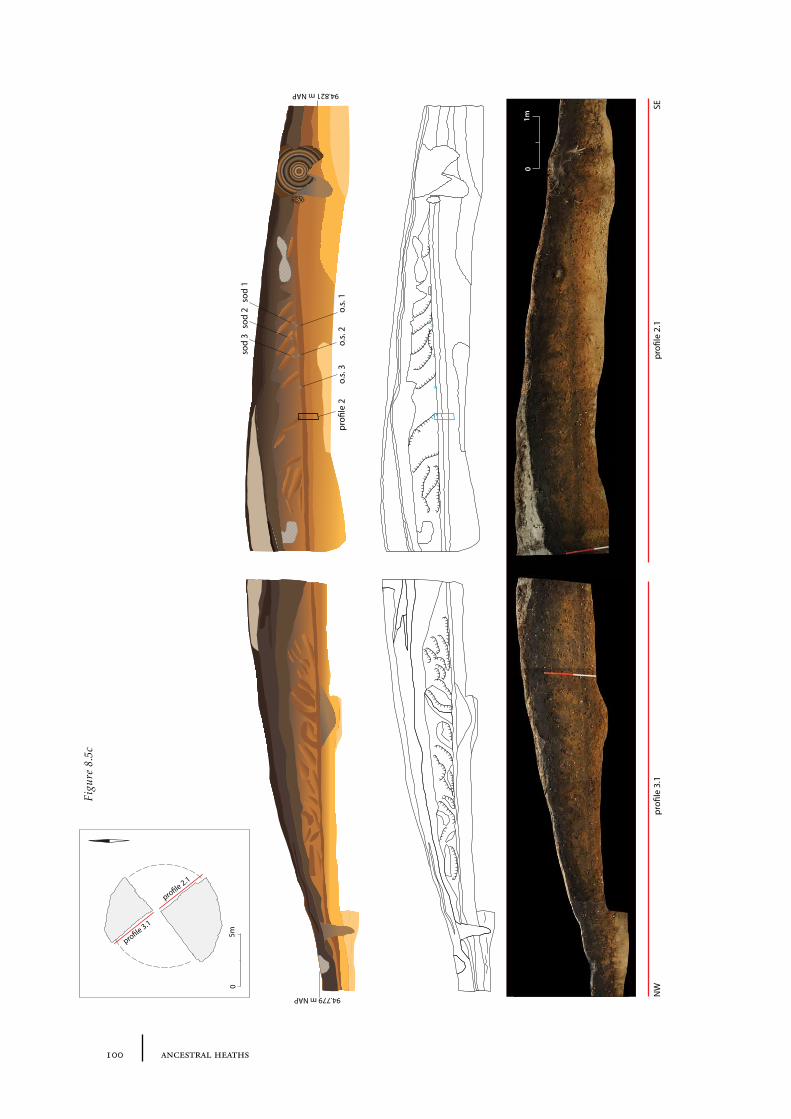
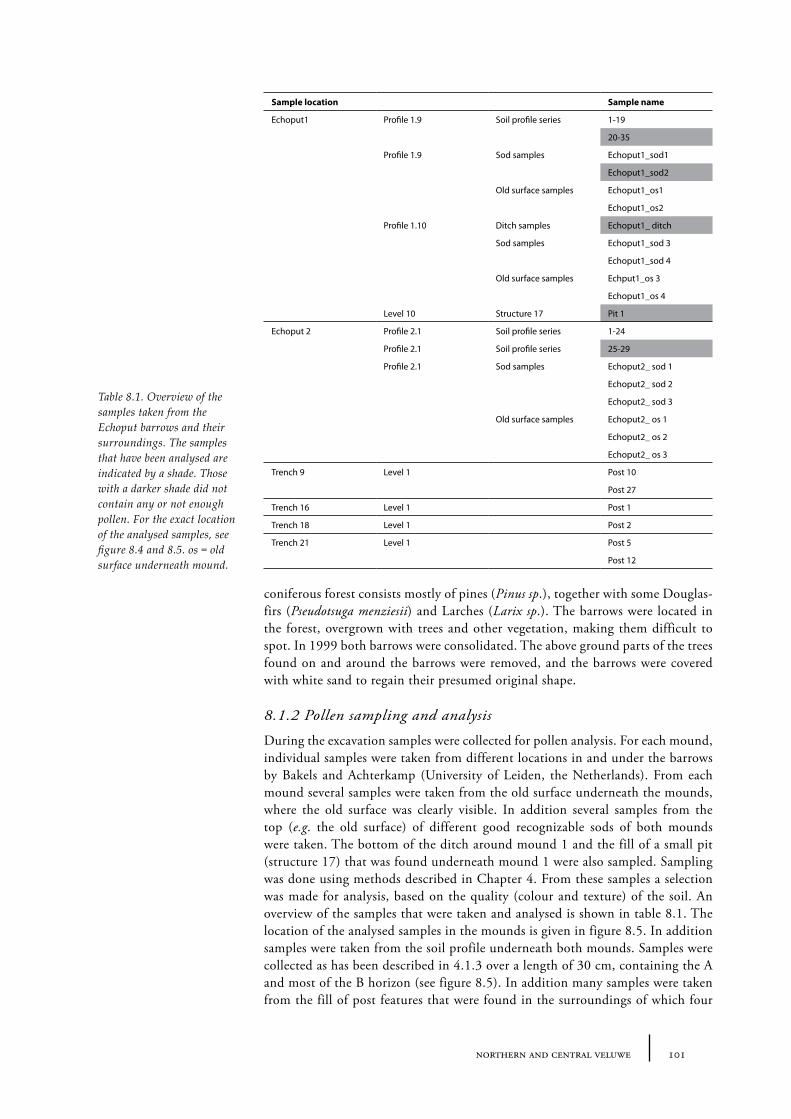
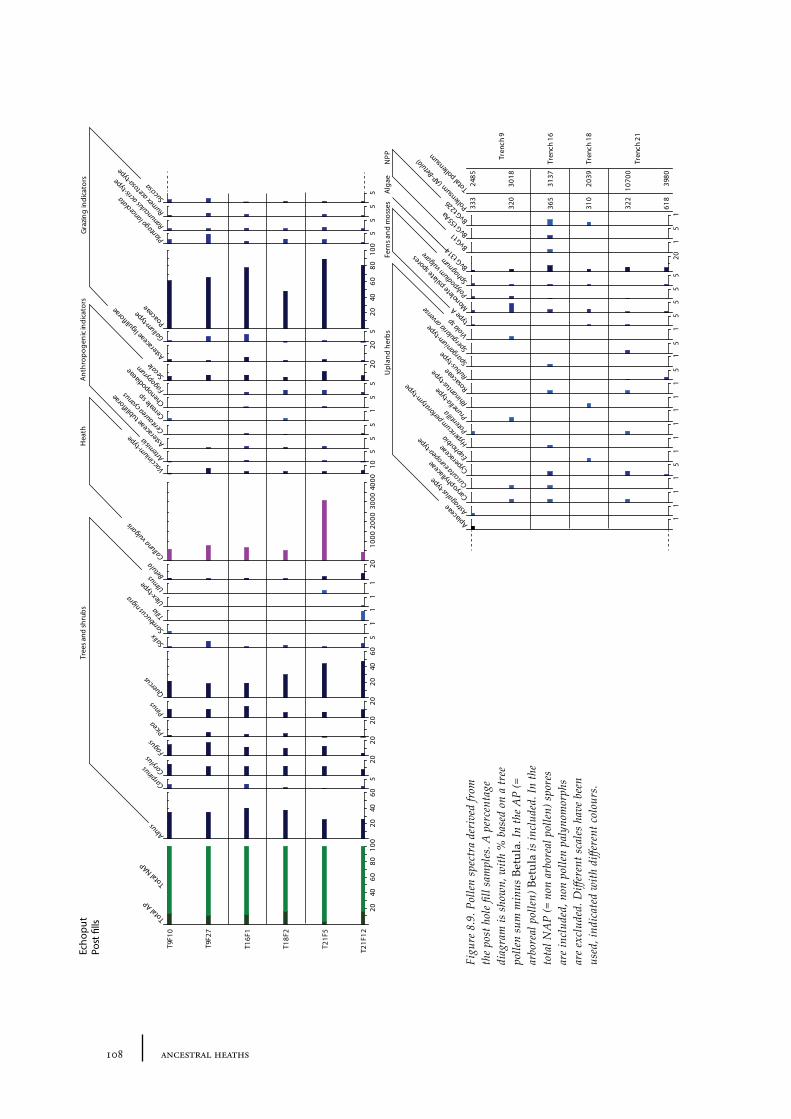
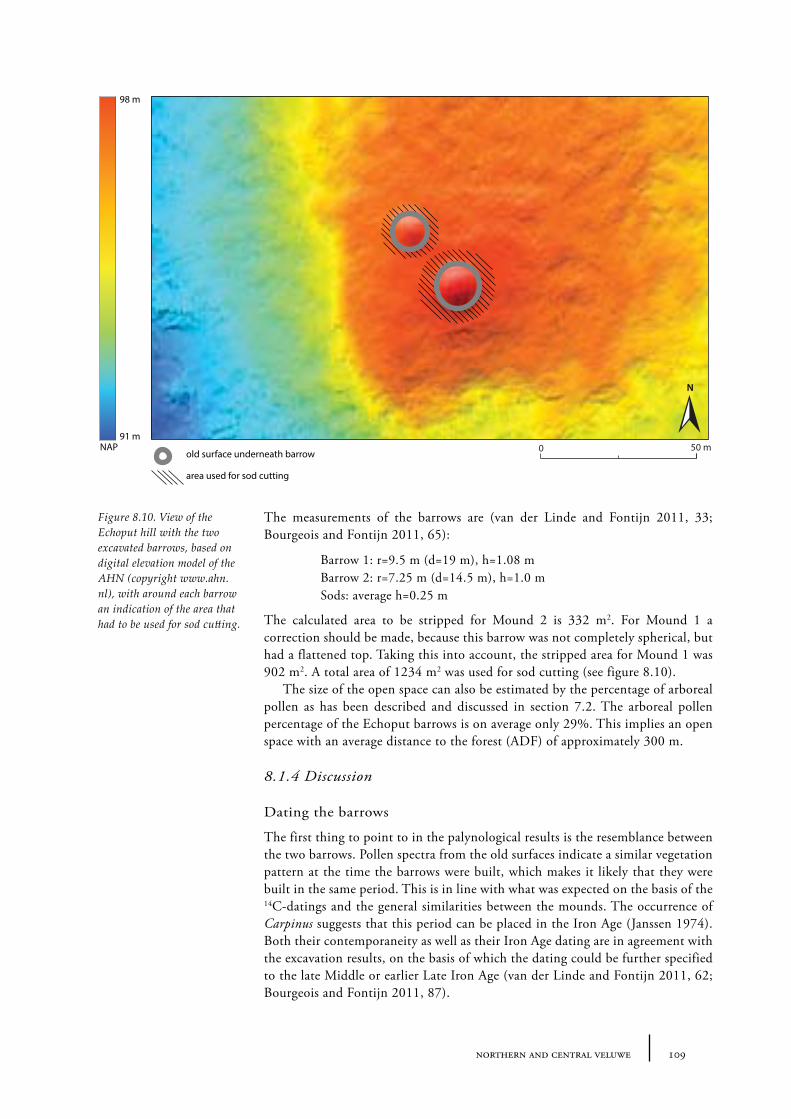
8.1 Echoput 968.1.1 Site description 968.1.2 Pollen sampling and analysis 1018.1.3 Results 1028.1.4 Discussion 1098.1.5 In conclusion: the history of the Echoput barrow landscape 114
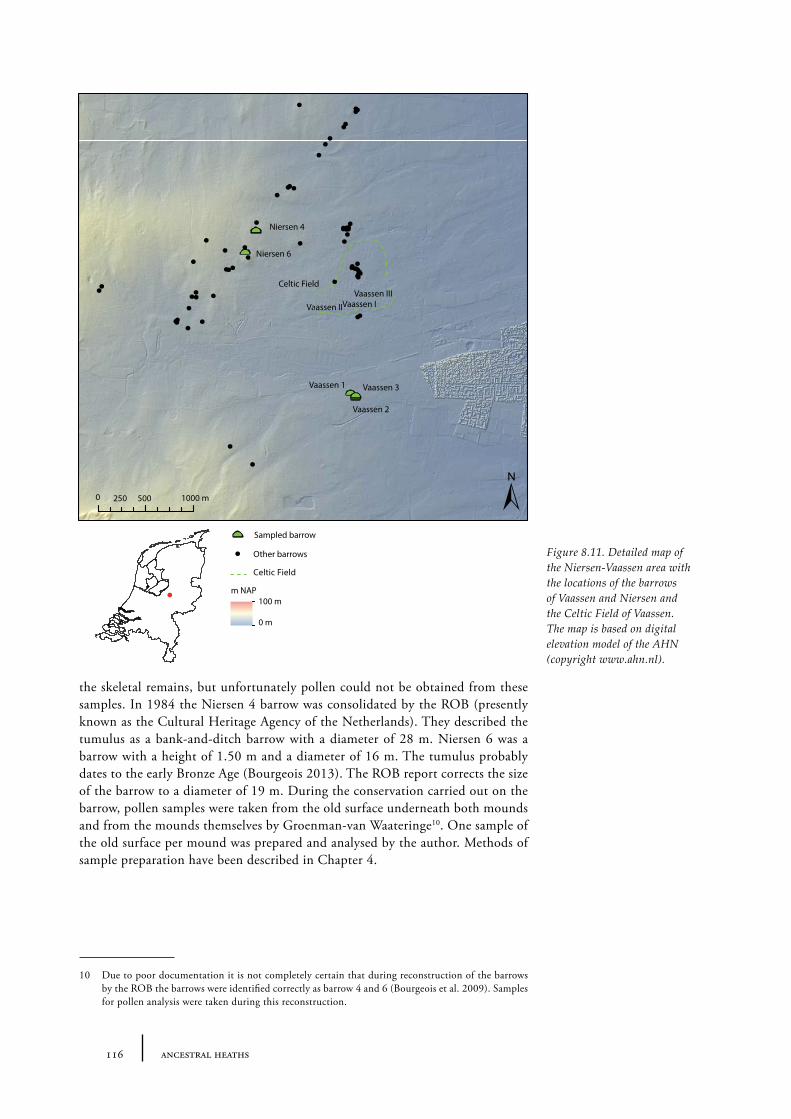
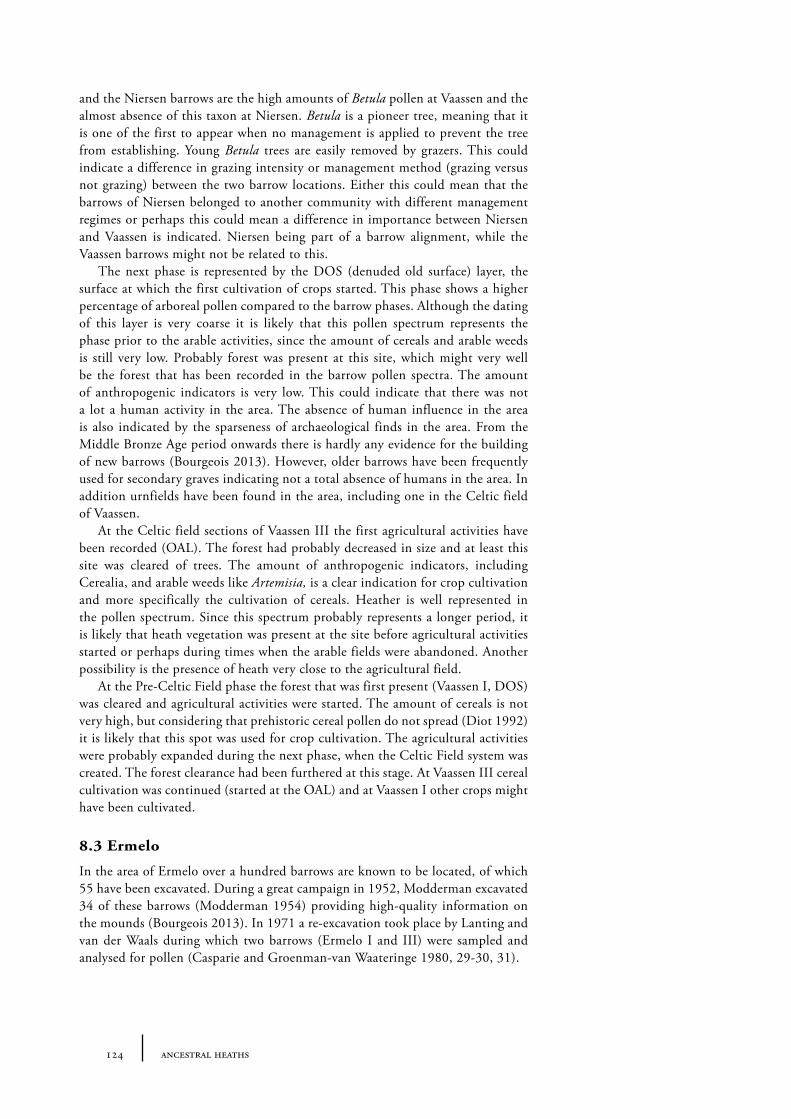
8.2 Niersen-Vaassen 1158.2.1 Site description and sample locations 1158.2.2 Results 1208.2.3 Discussion 123
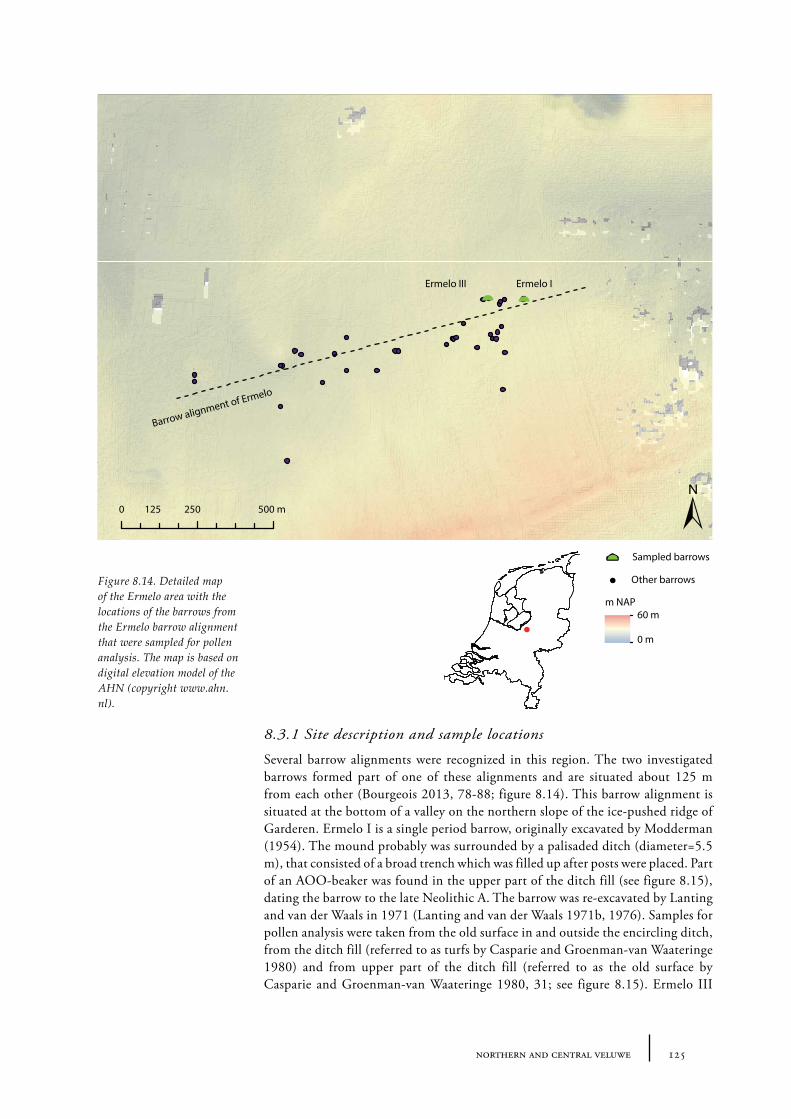
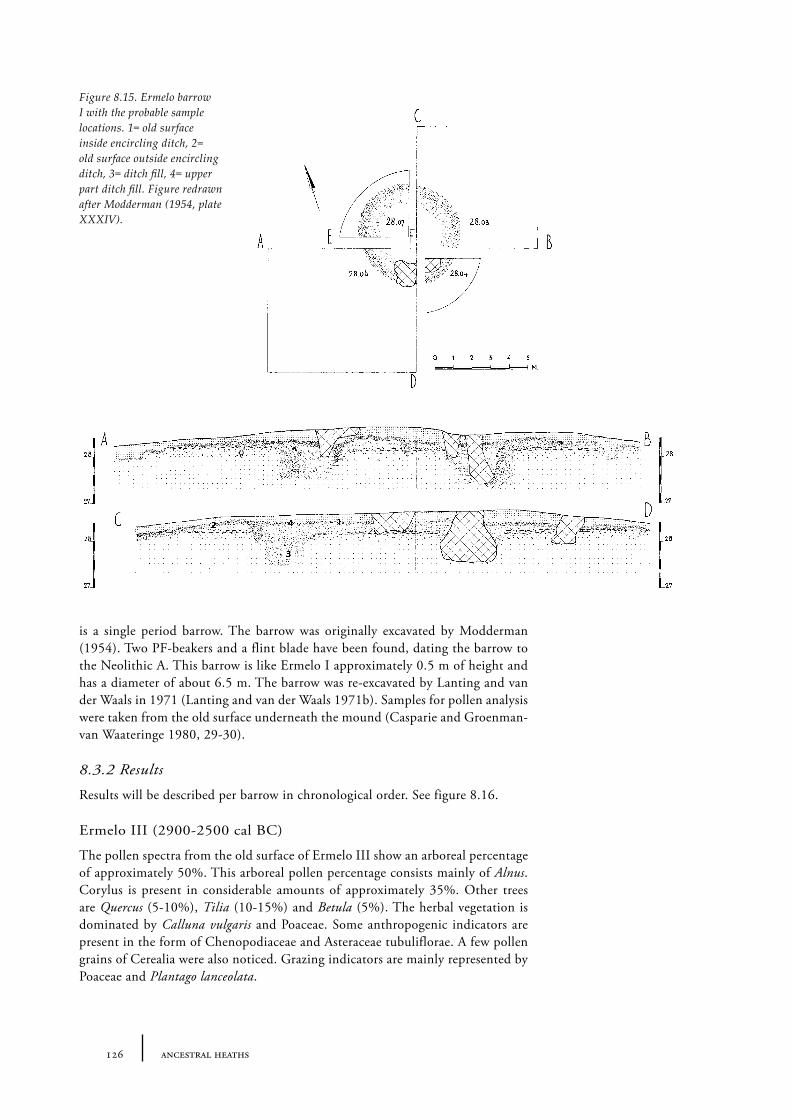
8.3 Ermelo 1248.3.1 Site description and sample locations 1258.3.2 Results 1268.3.3 Discussion 128
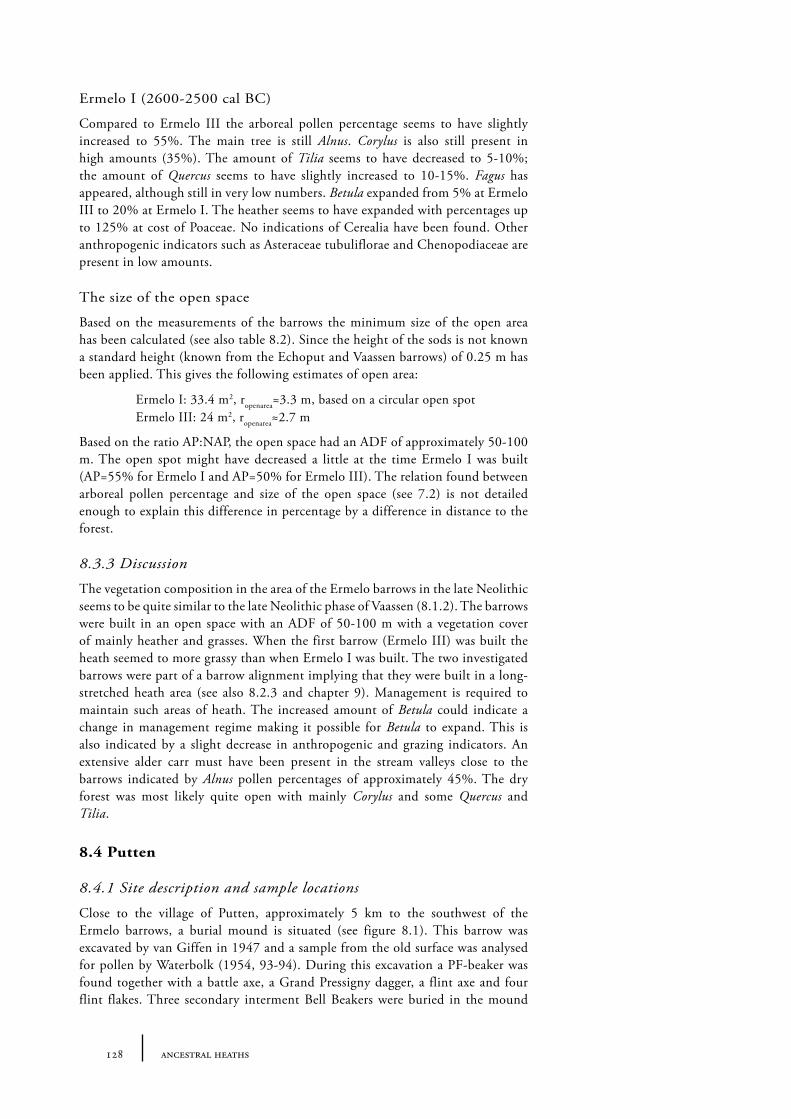
8.4 Putten 1288.4.1 Site description and sample locations 1288.4.2 Results and discussion 130
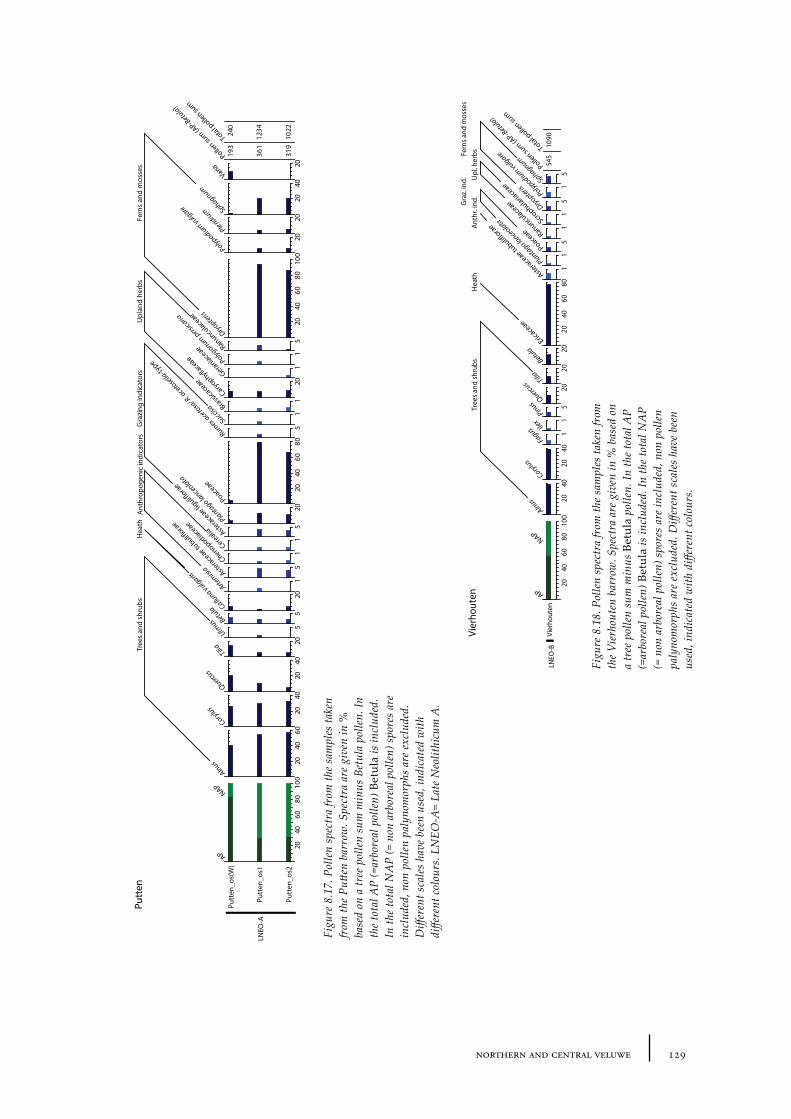
8.5 Vierhouten 1308.5.1 Site description and sample locations 1308.5.2 Results and discussion 130
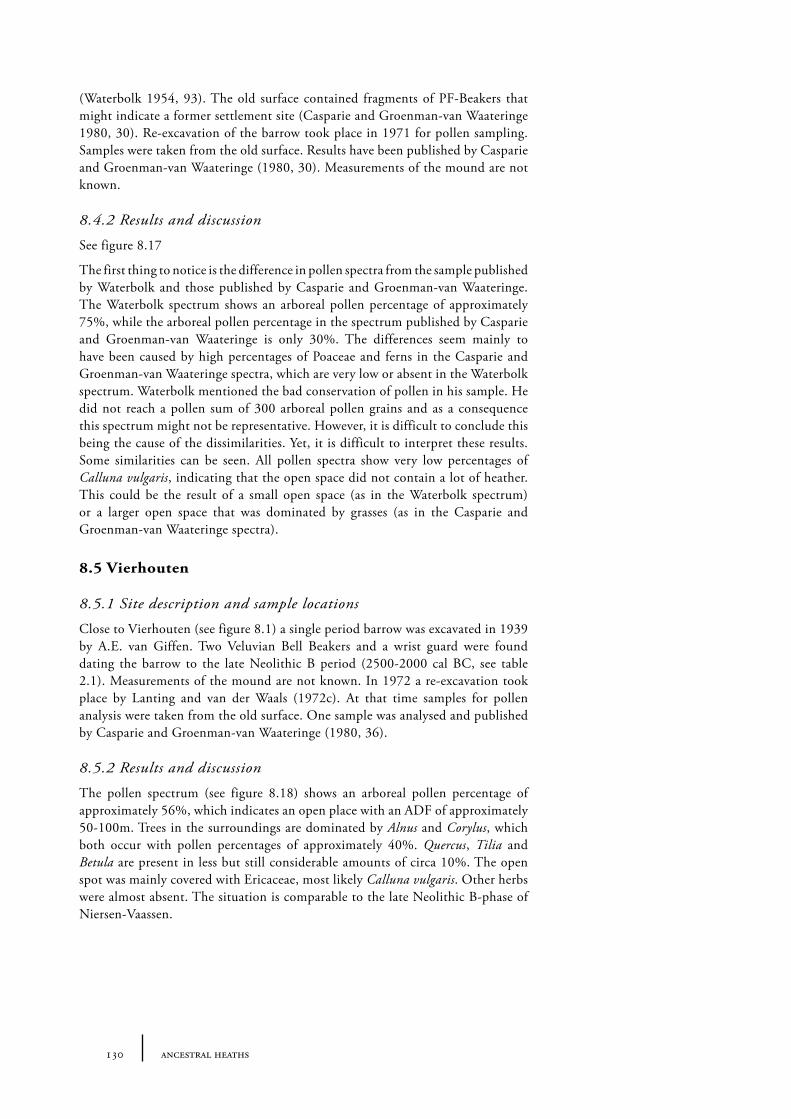
8.6 Emst 1328.6.1 Site description and sample locations 1328.6.1 Results and discussion 132
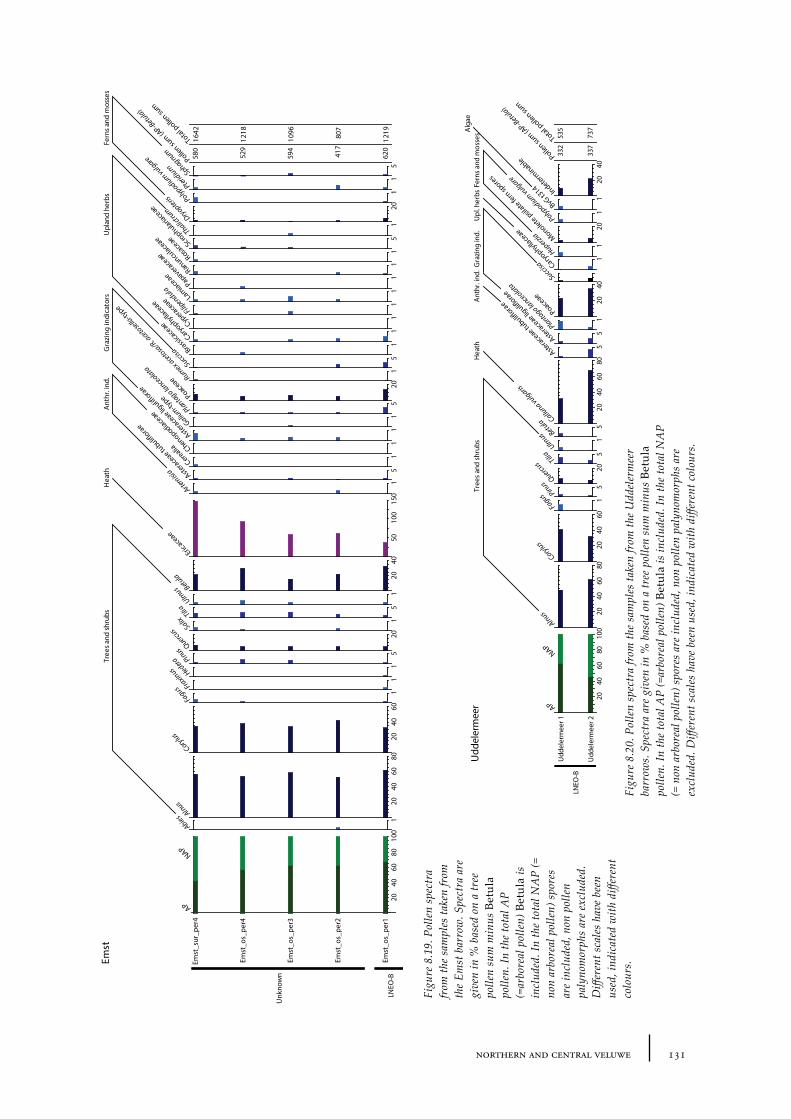
8.7 Uddelermeer 1328.7.1 Site description and sample locations 1328.7.2 Results and discussion 132
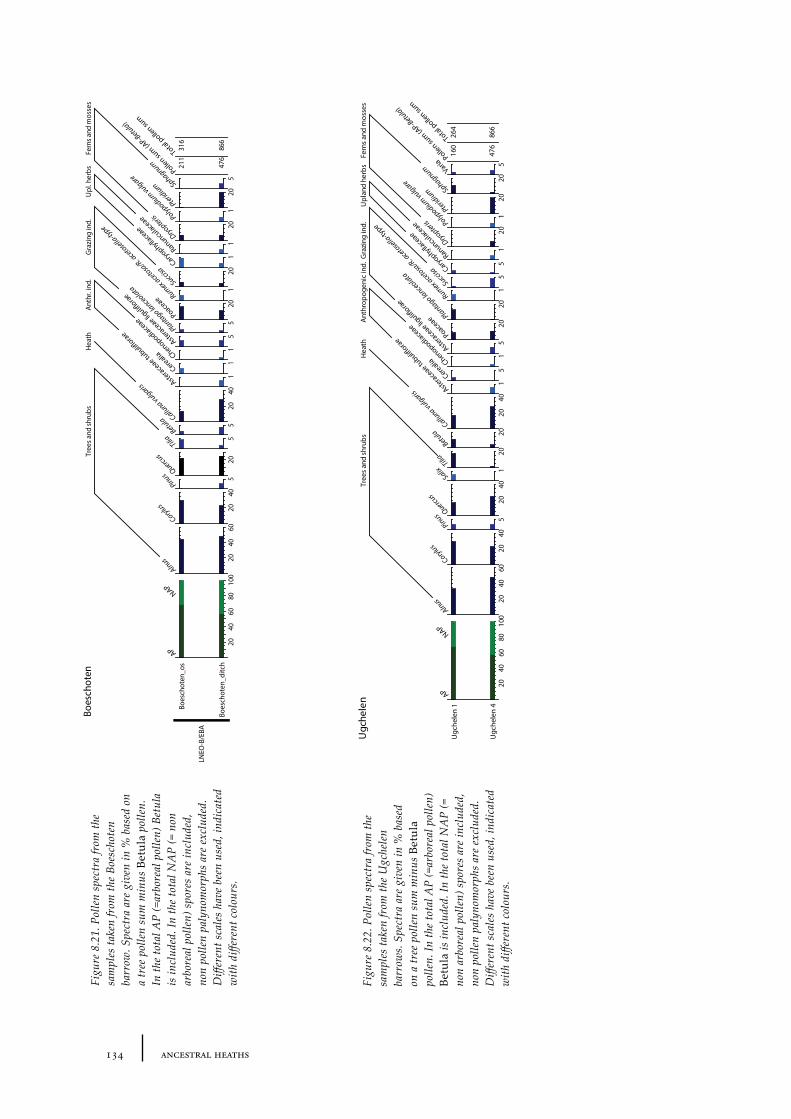
8.8 Boeschoten 1338.8.1 Site description and sample locations 1338.8.1 Results and discussion 133
8.9 Ugchelen 1338.9.1 Site description and sample locations 1338.9.1 Results and discussion 133
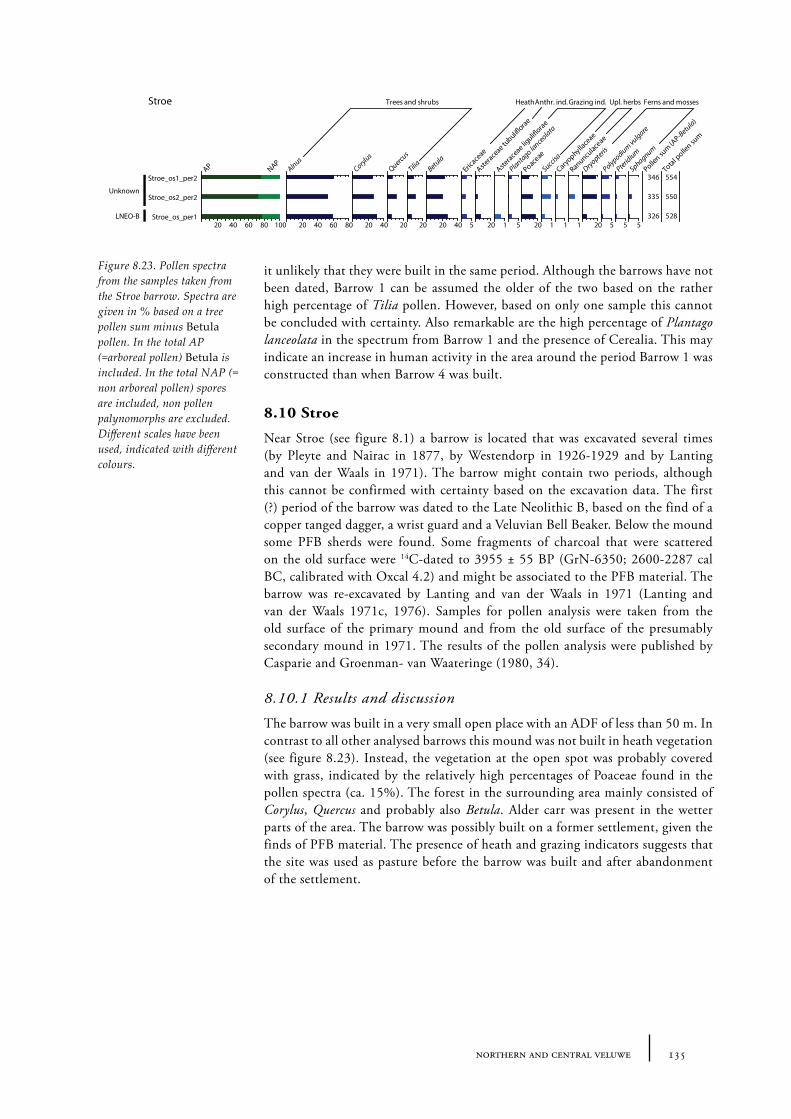
8.10 Stroe 1358.10.1 Results and discussion 135
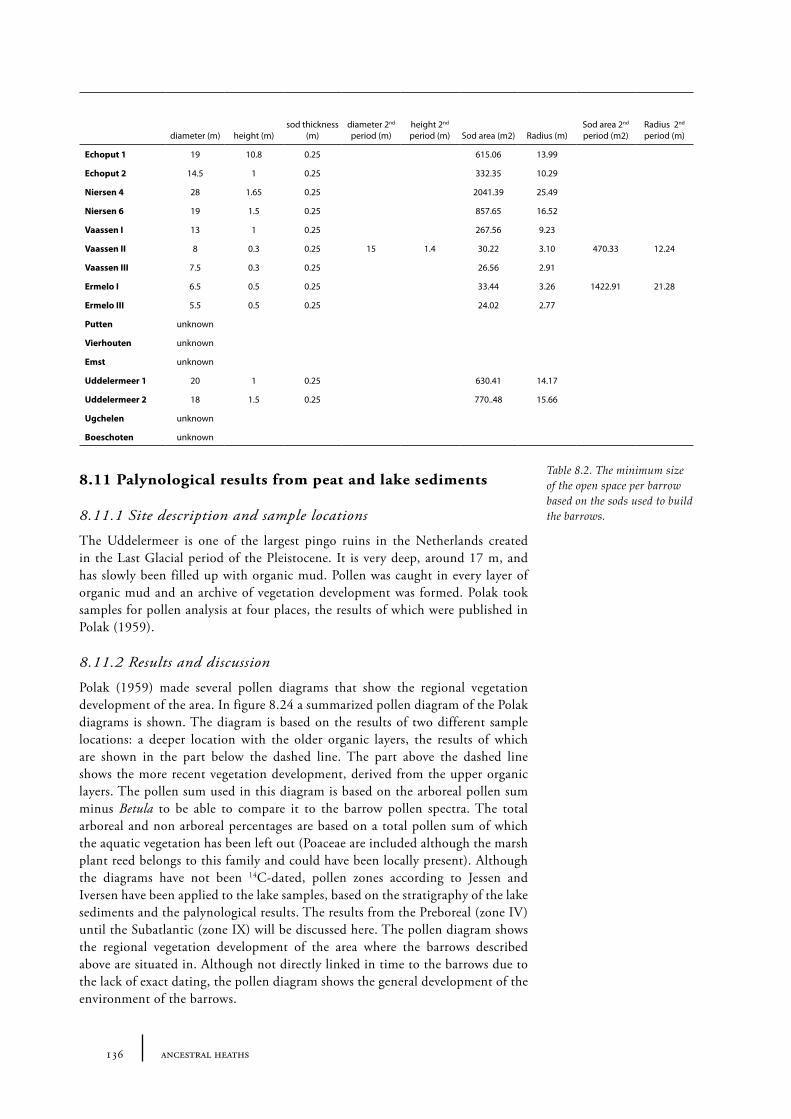
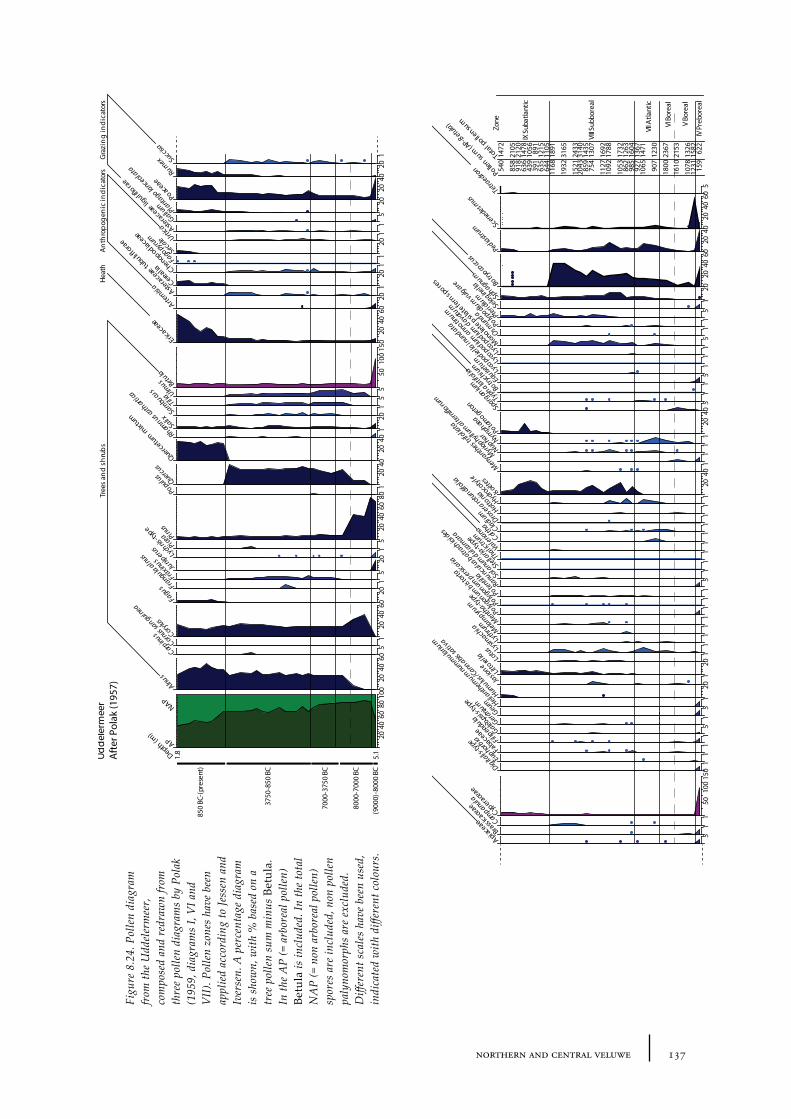
8.11 Palynological results from peat and lake sediments 1368.11.1 Site description and sample locations 1368.11.2 Results and discussion 136
8.12 Summary: the barrow landscape of northern and central Veluwe 138
9 The Renkum stream valley 141
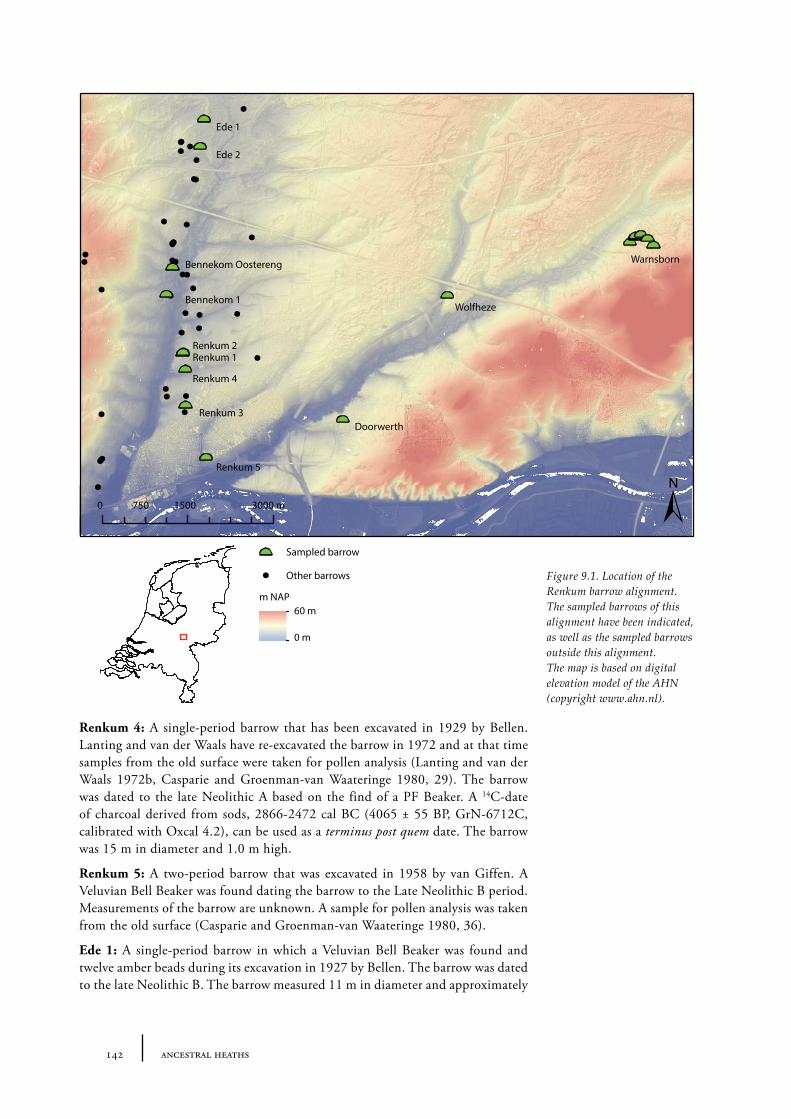
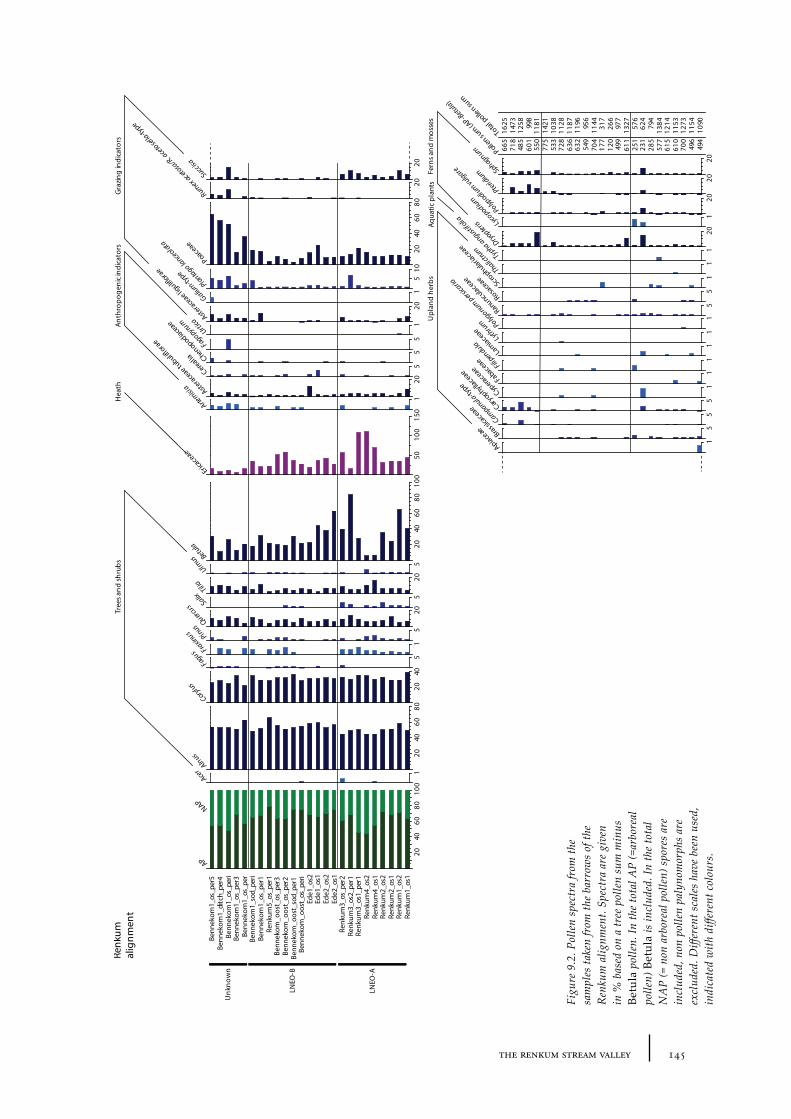
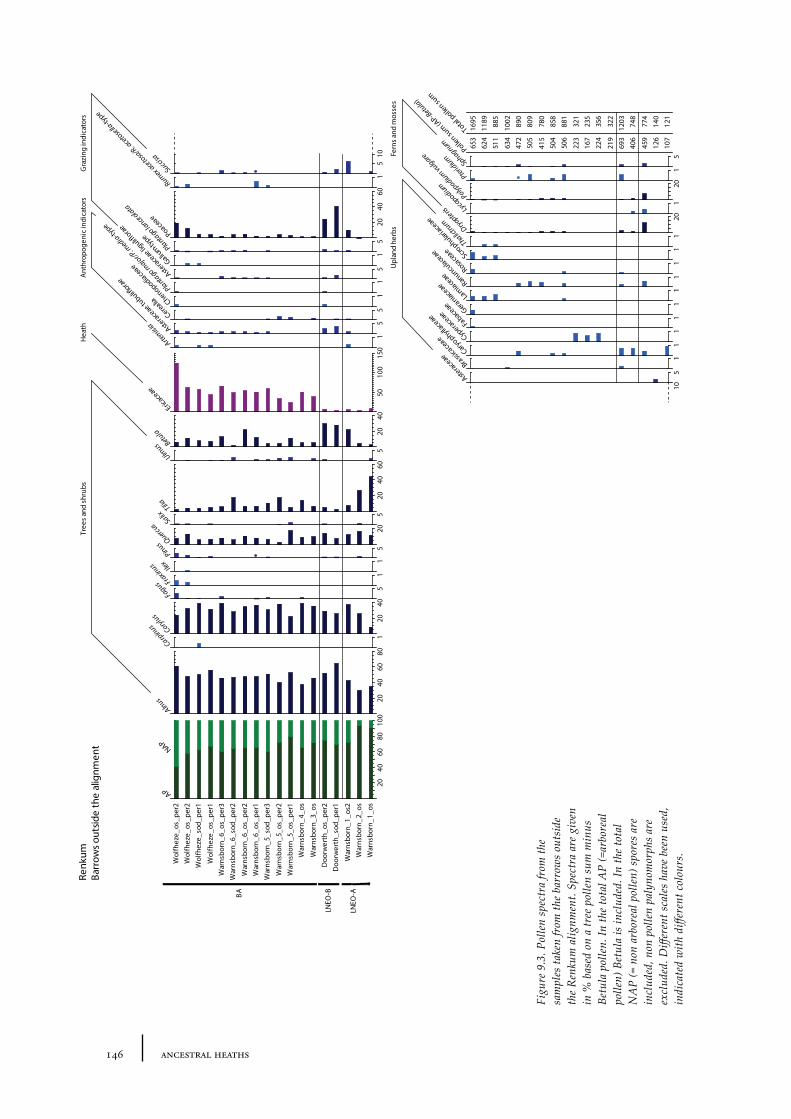
9.1 Site description and sample locations 141Burial mounds belonging to the barrow alignment 141Burial mounds outside the barrow alignment 143
9.2 Results and discussion 144
10 Gooi 149
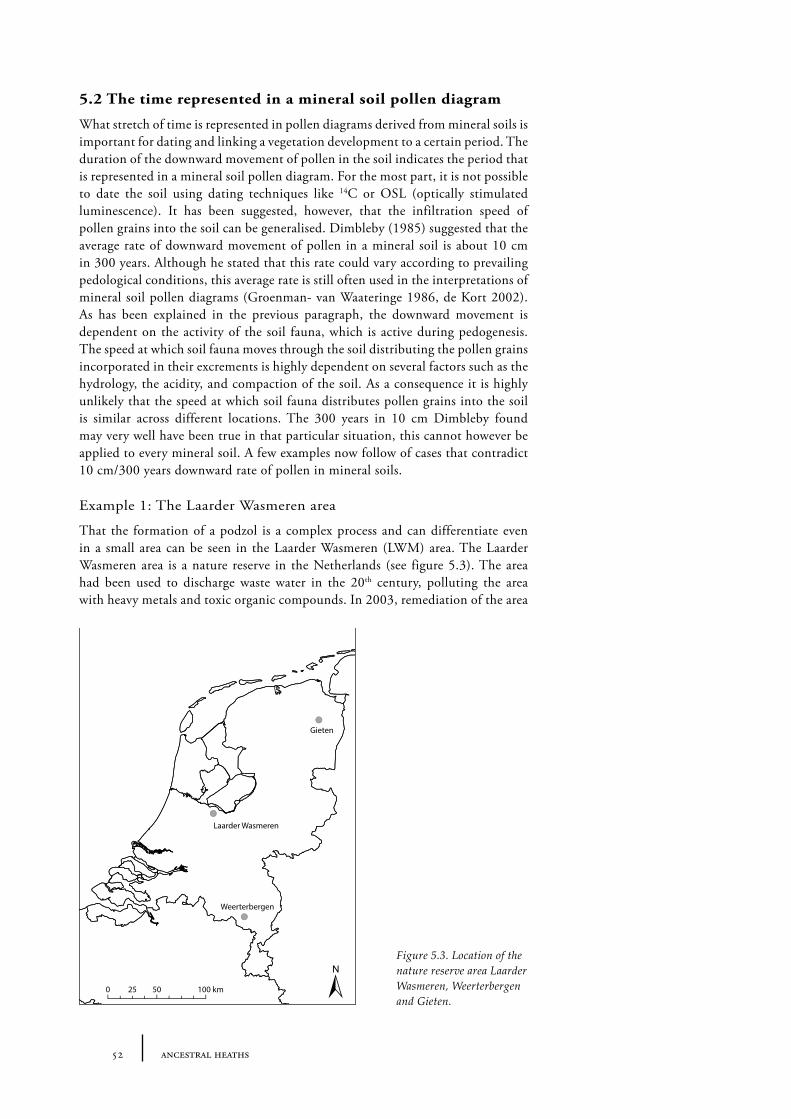
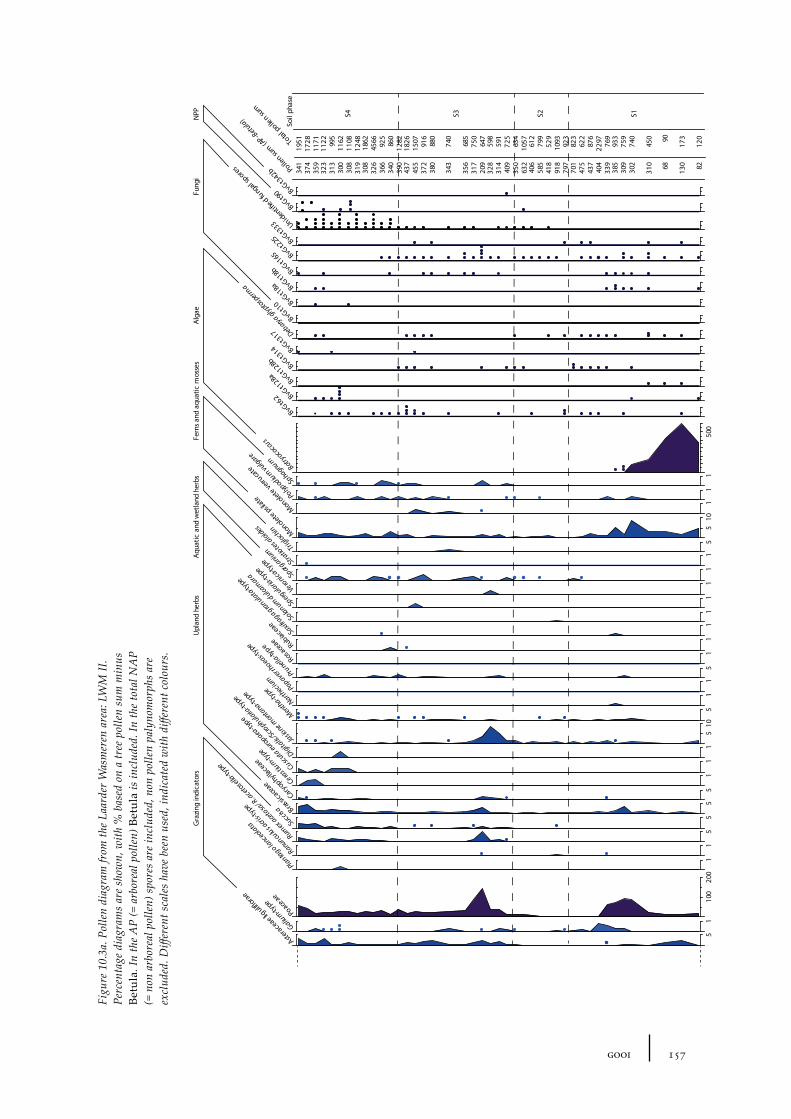
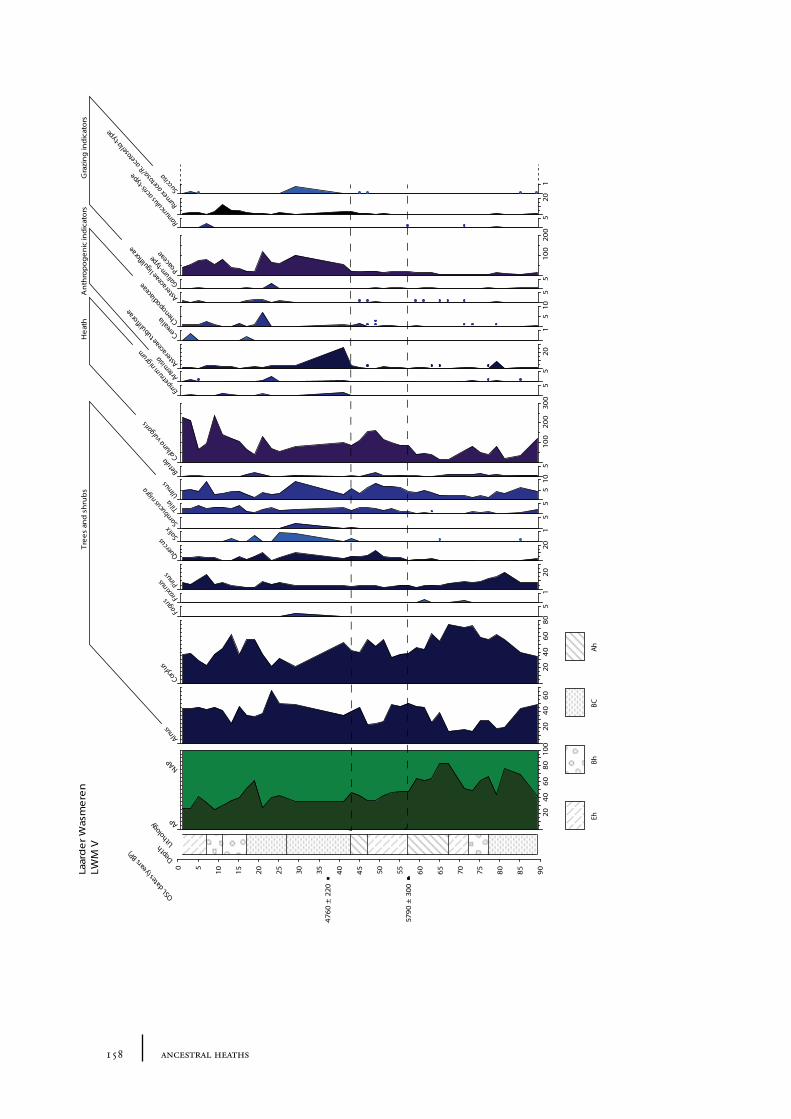
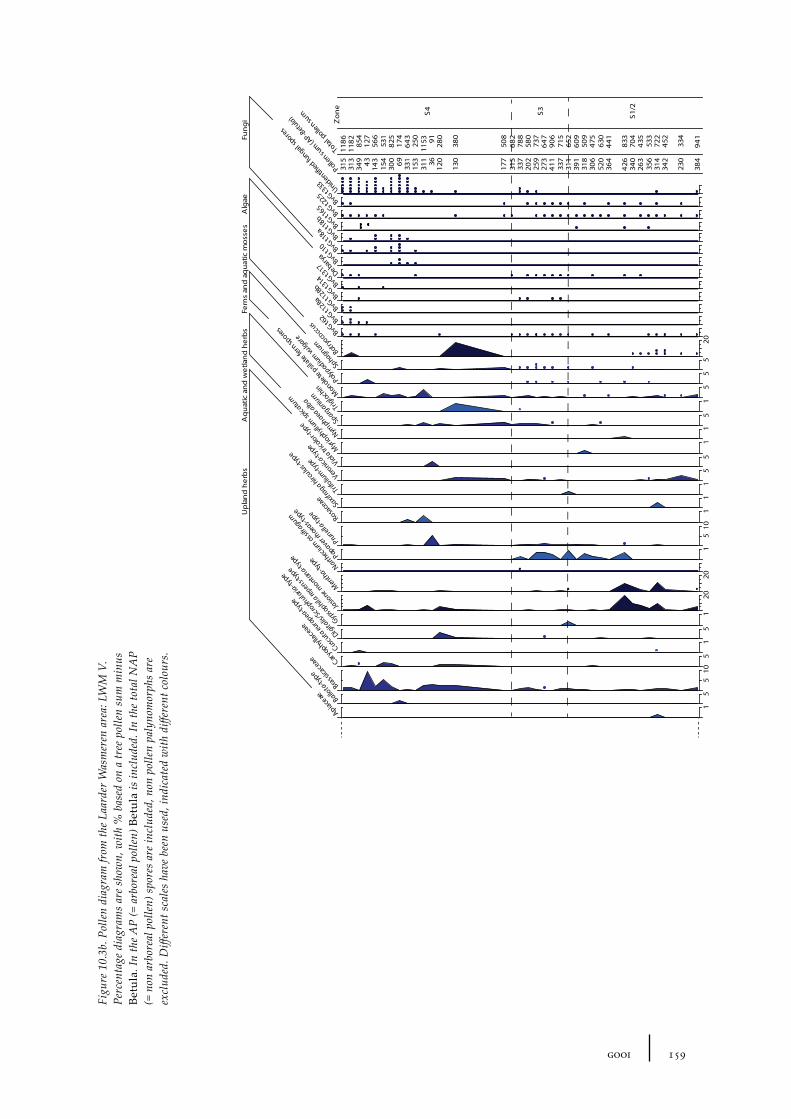
10.1 Site description and sample locations 149Baarn Group 149Hilversum Group 149Laren Group 150Roosterbos 151The Laarder Wasmeren area 151
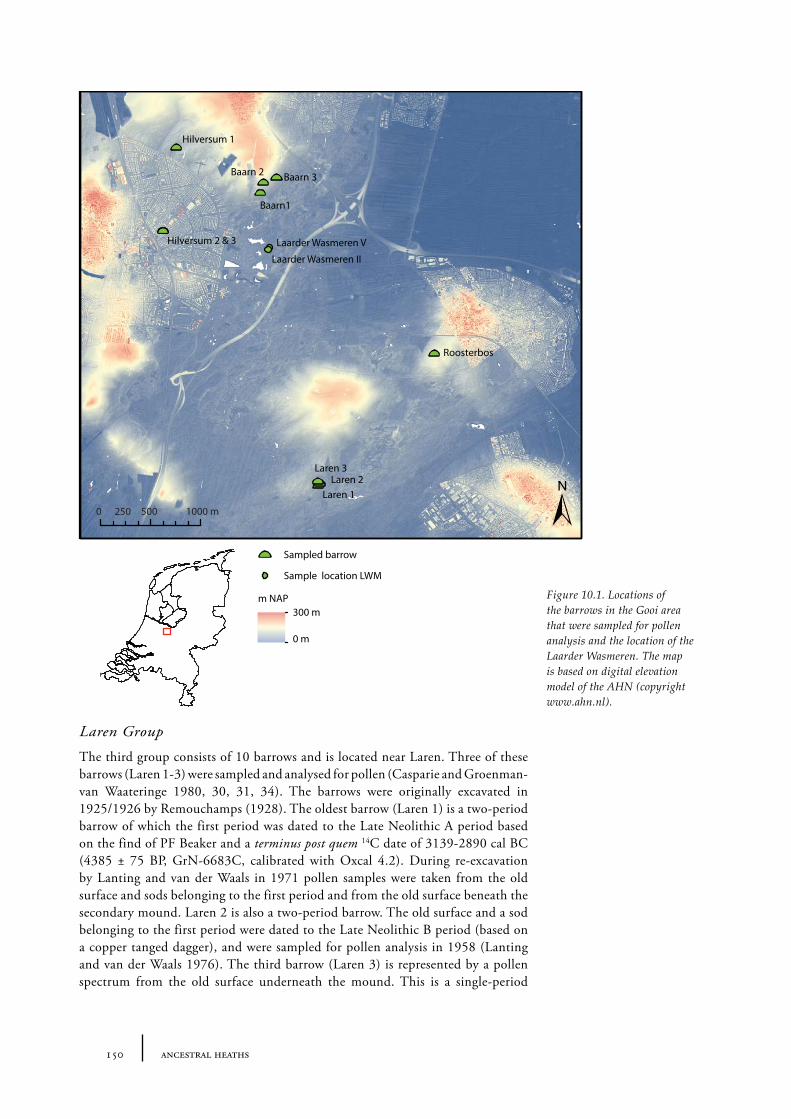
10.2 Results and discussion 151Gooi area 151Laarder Wasmeren area 155The (pre)barrow landscape of the Gooi 160
11 Toterfout-Halve Mijl and surroundings 163
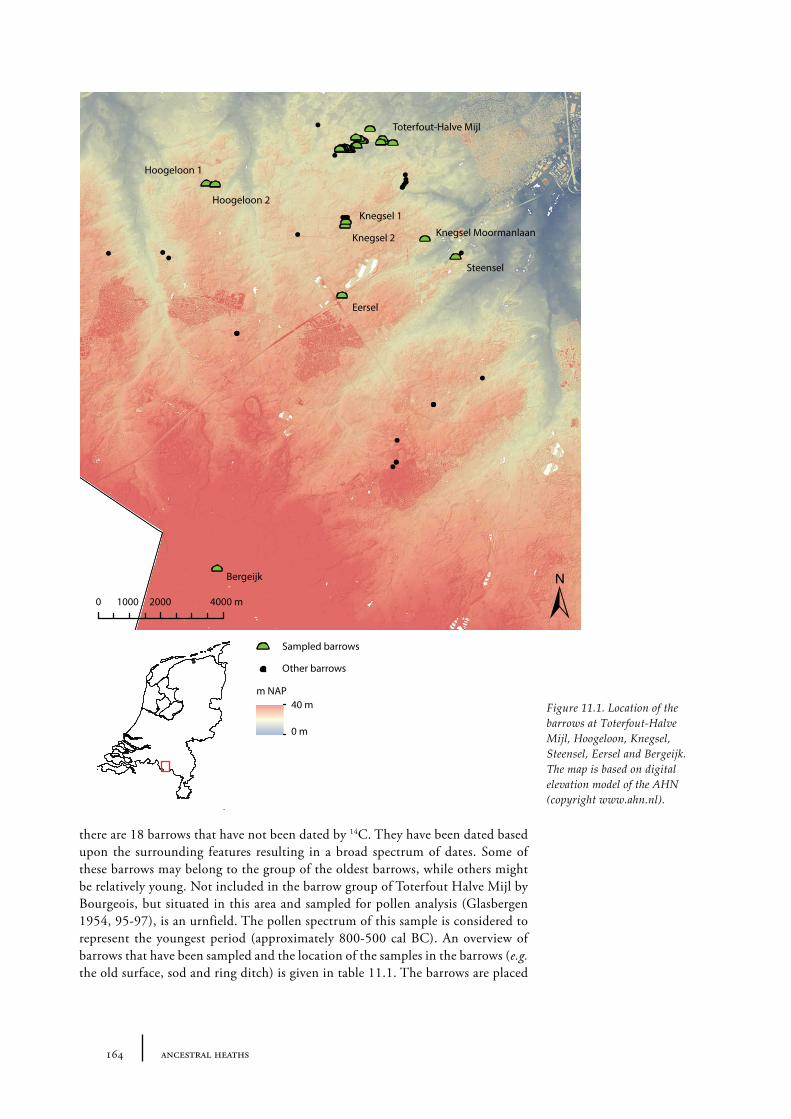
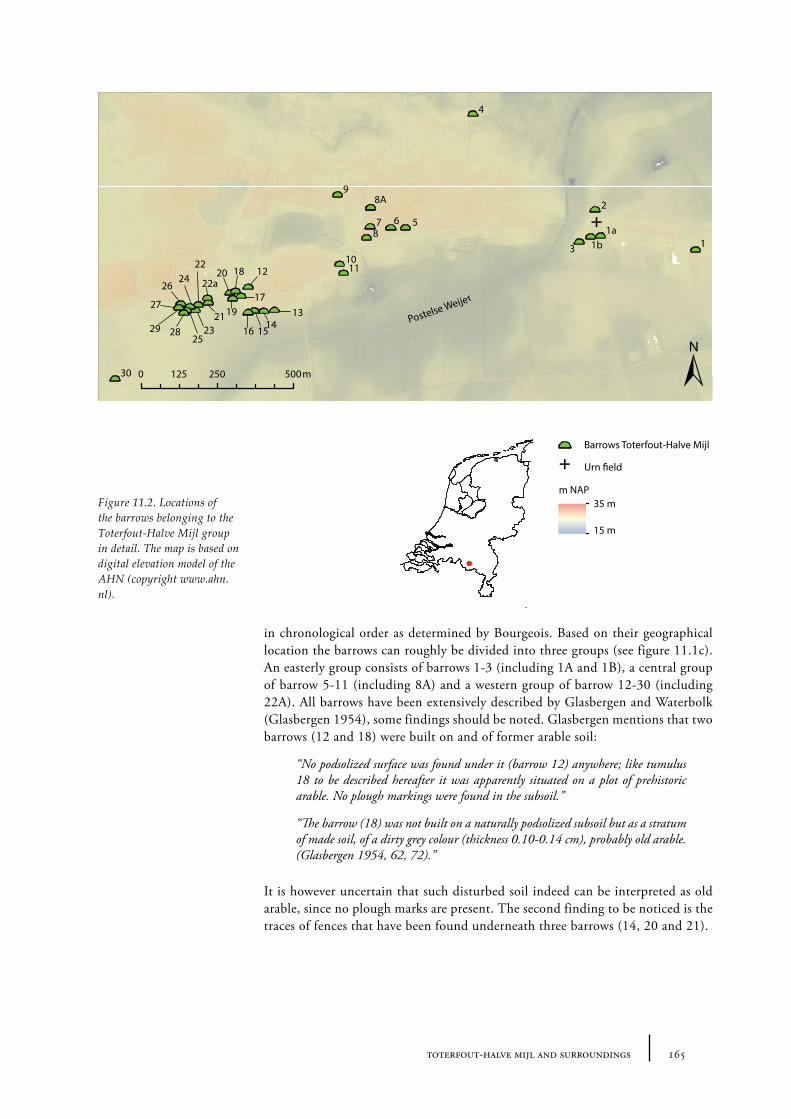
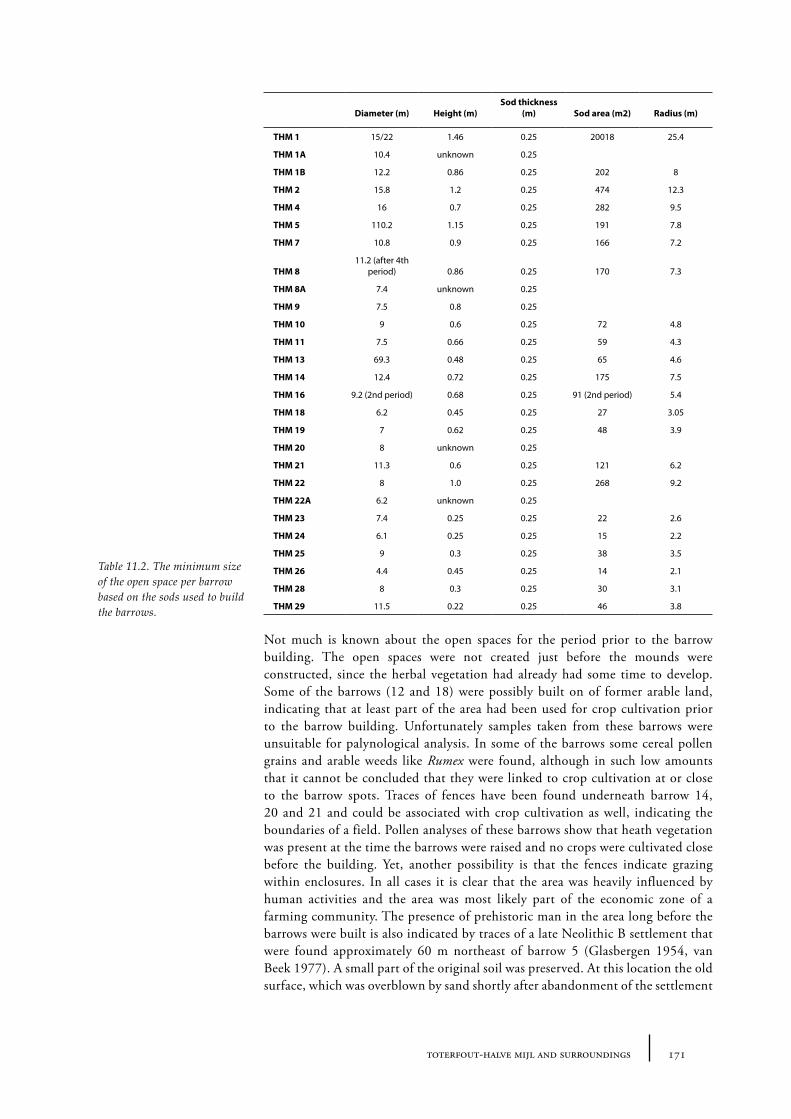
11.1 Toterfout-Halve Mijl 16311.1.1 Site description and sample locations 16311.1.2 Results and discussion 170
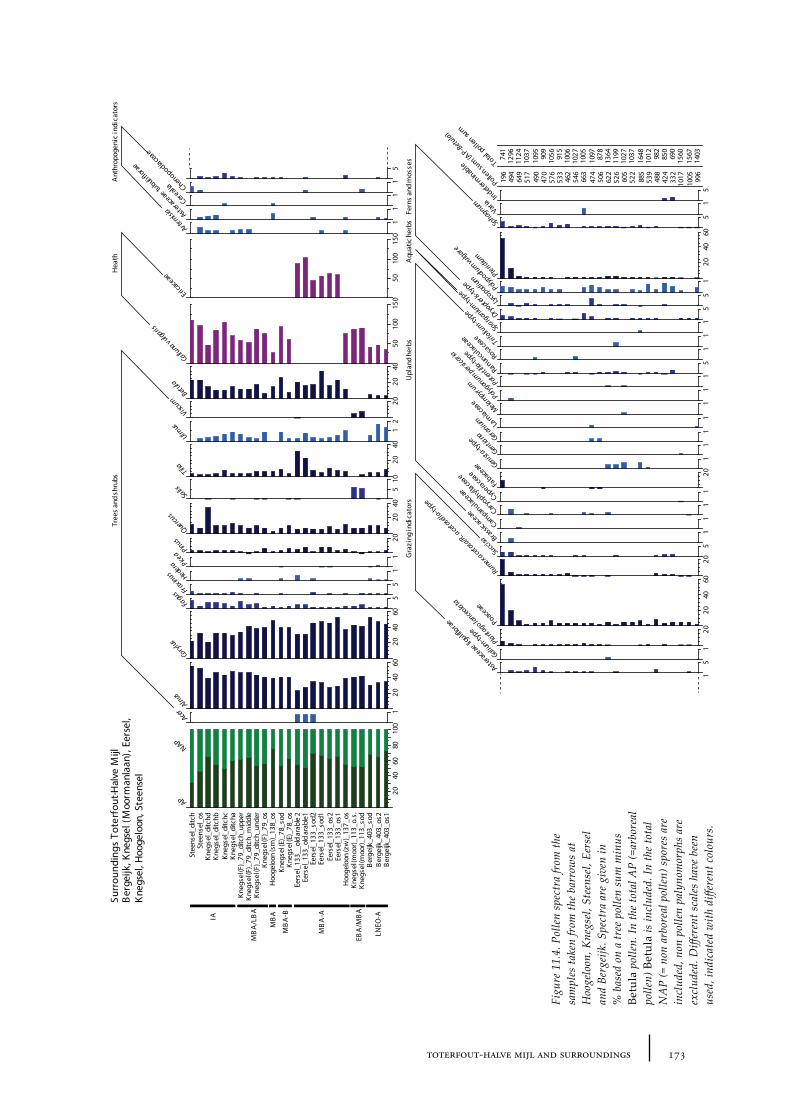
11.2 Hoogeloon 17211.2.1 Site description and sample locations 17211.2.2 Results and discussion 172
11.3 Knegsel-Urnenweg 17411.3.1 Site description and sample locations 17411.3.2 Results and discussion 174
11.4 Knegsel-Moormanlaan 17411.4.1 Site description and sample locations 17511.4.2 Results and discussion 175
11.5 Steensel 17511.5.1 Site description and sample locations 17511.5.2 Results and discussion 175
11.6 Eersel 17611.6.1 Site description and sample locations 17611.6.2 Results and discussion 176
11.7 Bergeijk 17611.7.1 Site description and sample locations 17611.7.2 Results and discussion 177
11.8 Alphen 17711.8.1 Site description and sample locations 17711.8.2 Results and discussion 177
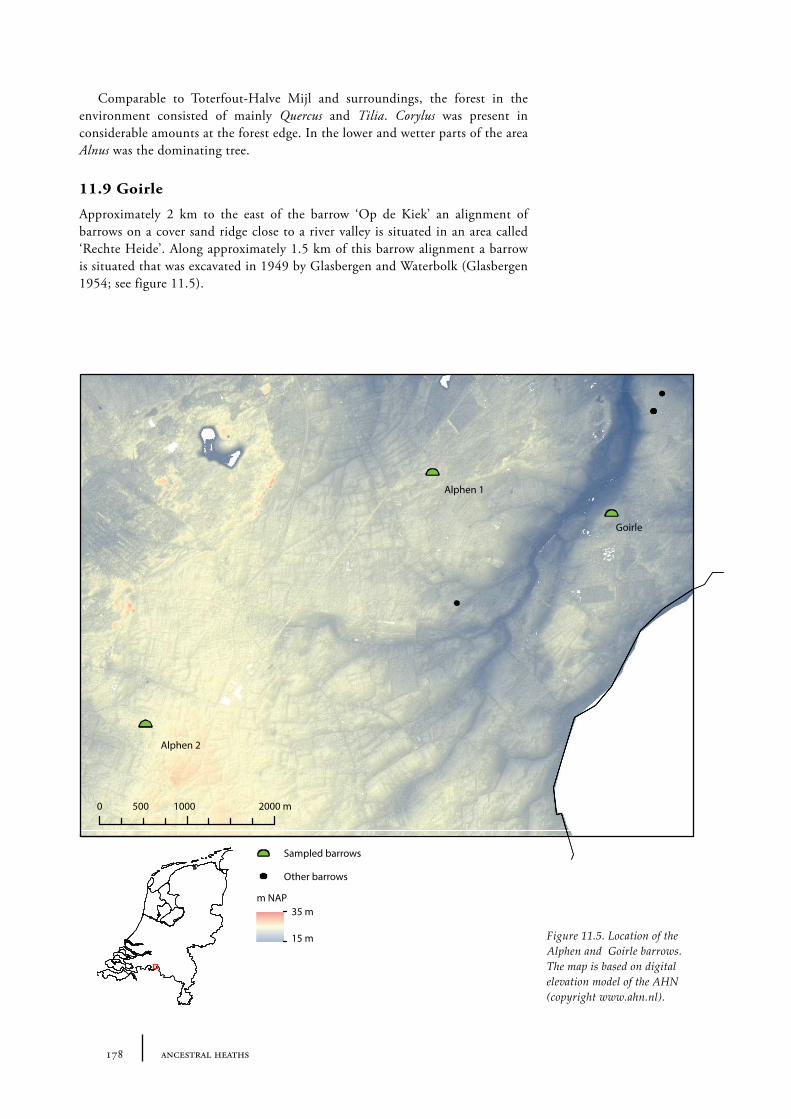
11.9 Goirle 17811.9.1 Site description and sample locations 17911.9.2 Results and discussion 179
11.10 Summary: the barrow landscape of Toterfout-Halve Mijl and surroundings 179
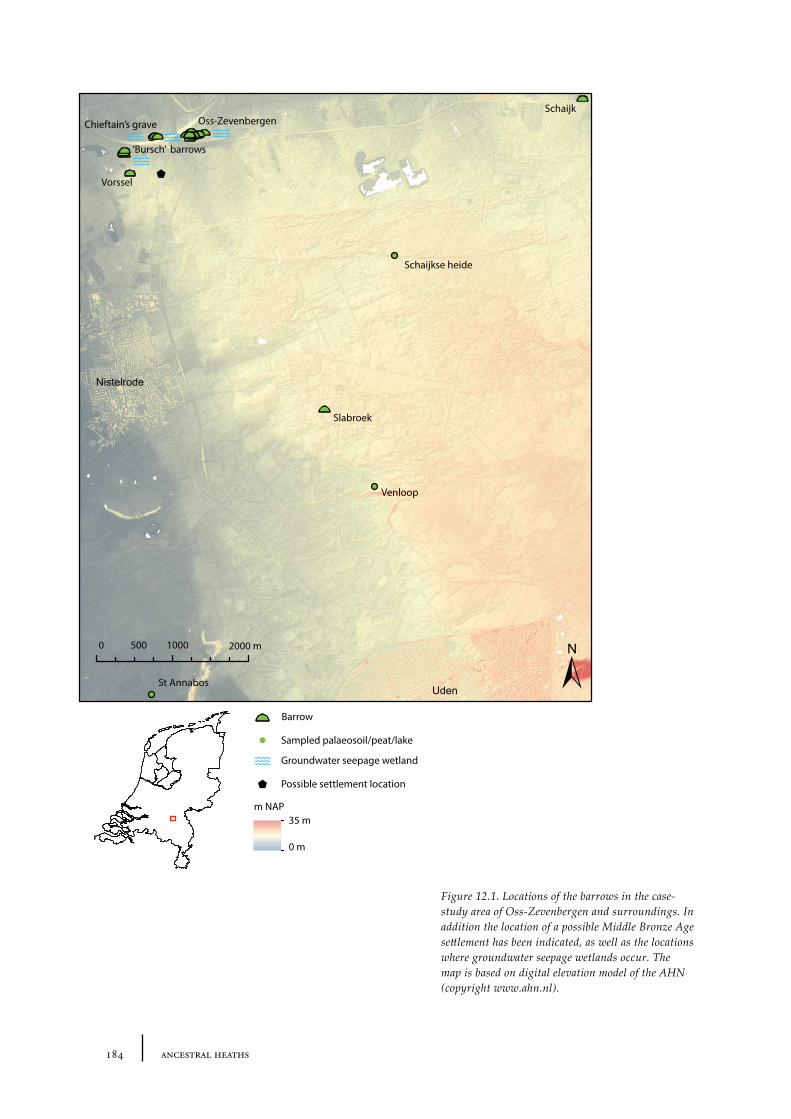
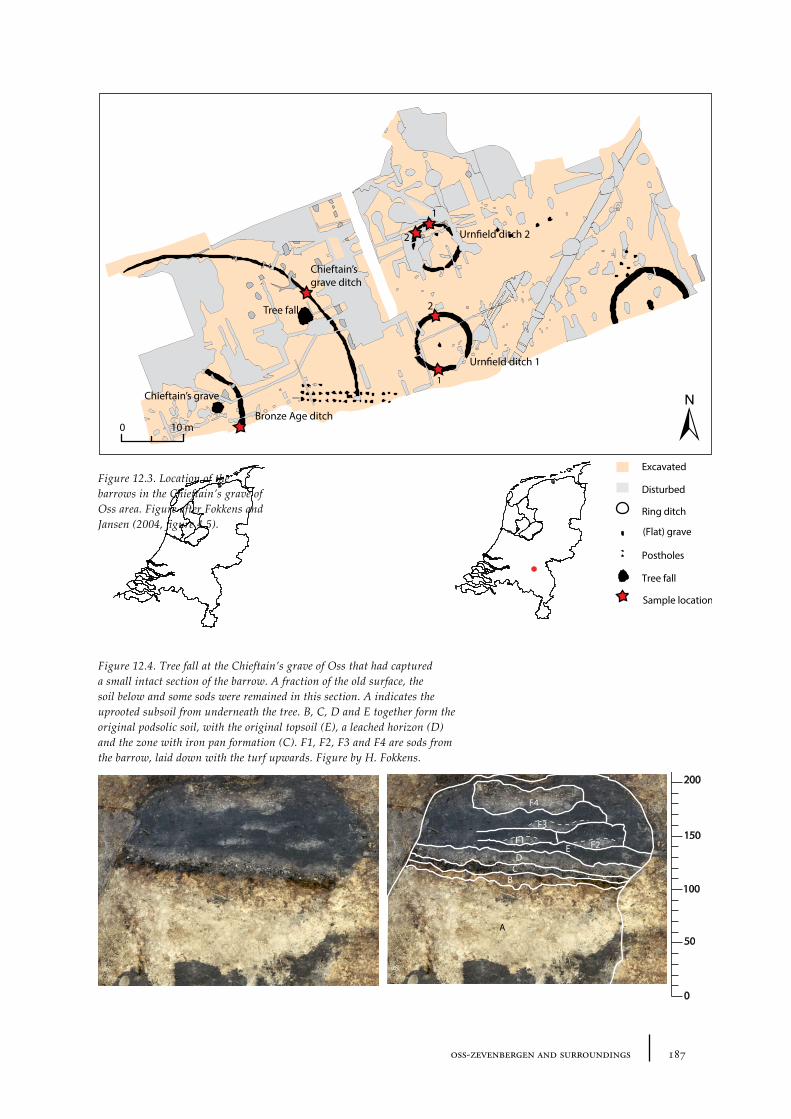
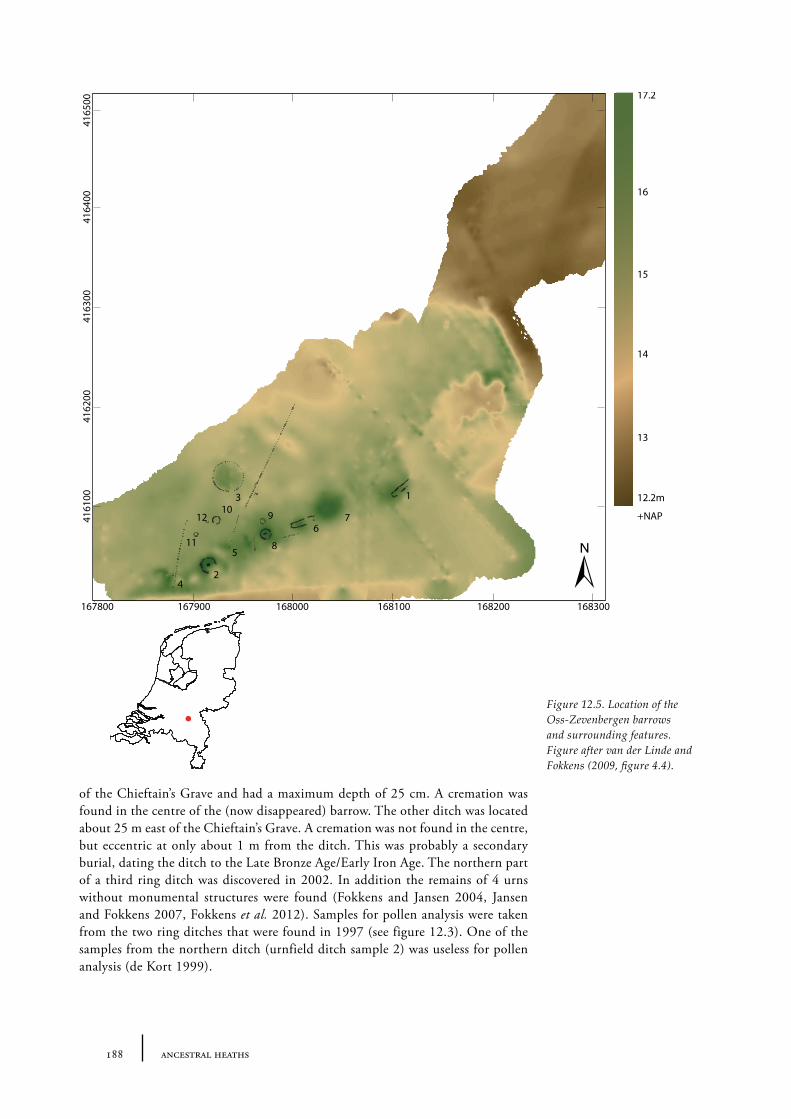
12 Oss-Zevenbergen and surroundings 183
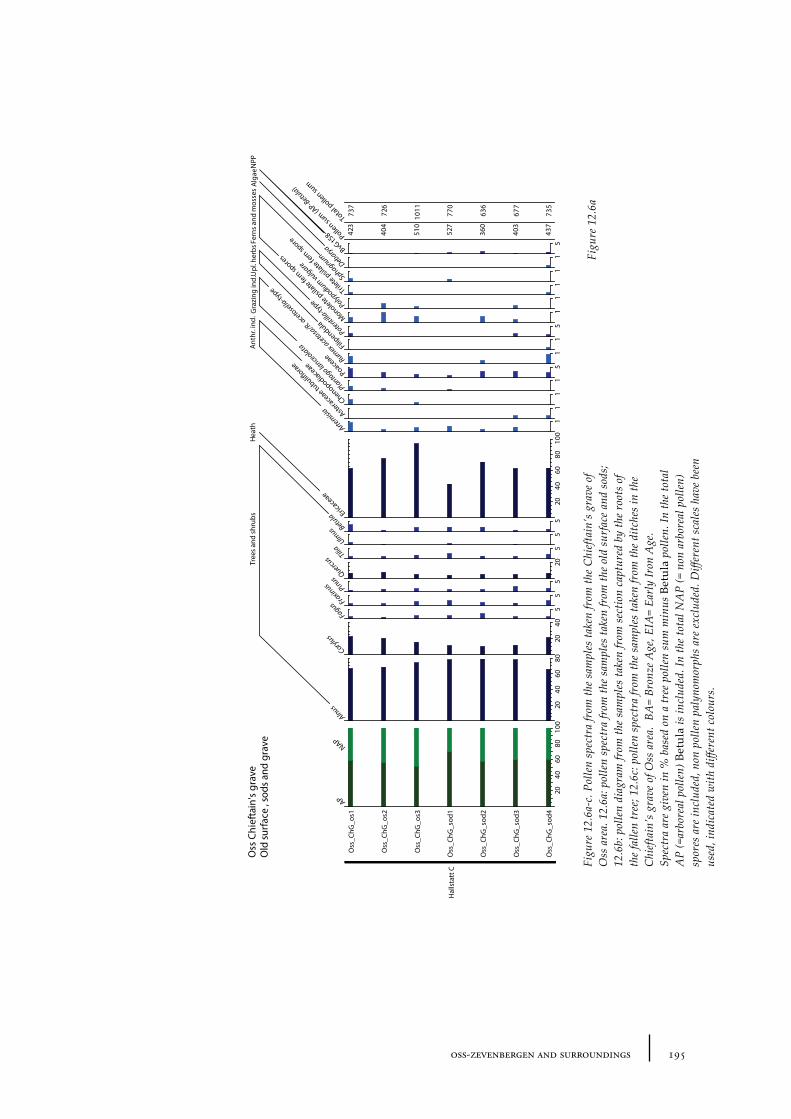
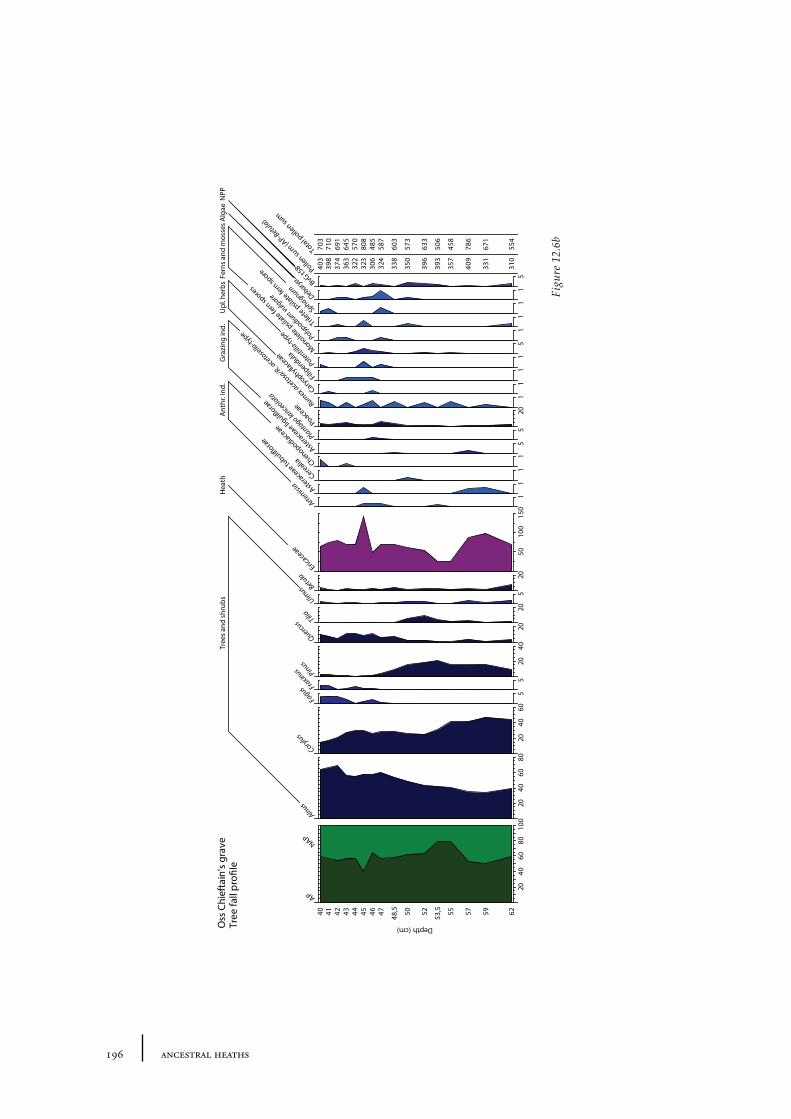
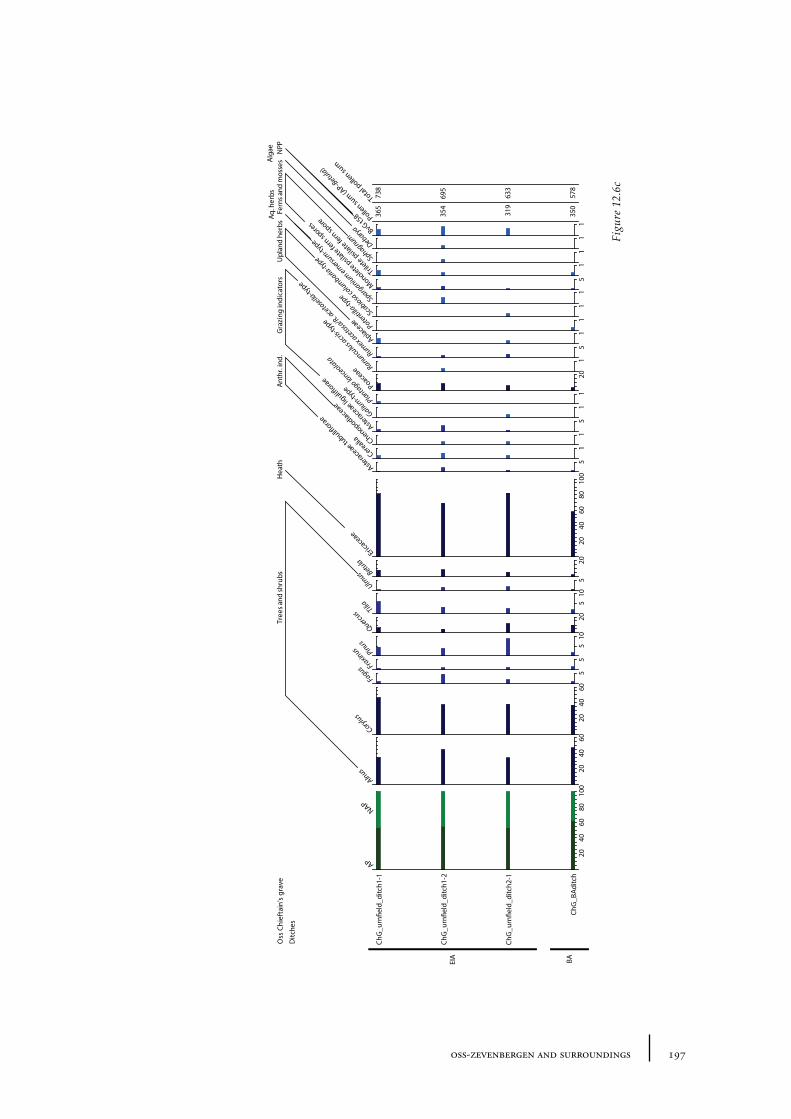
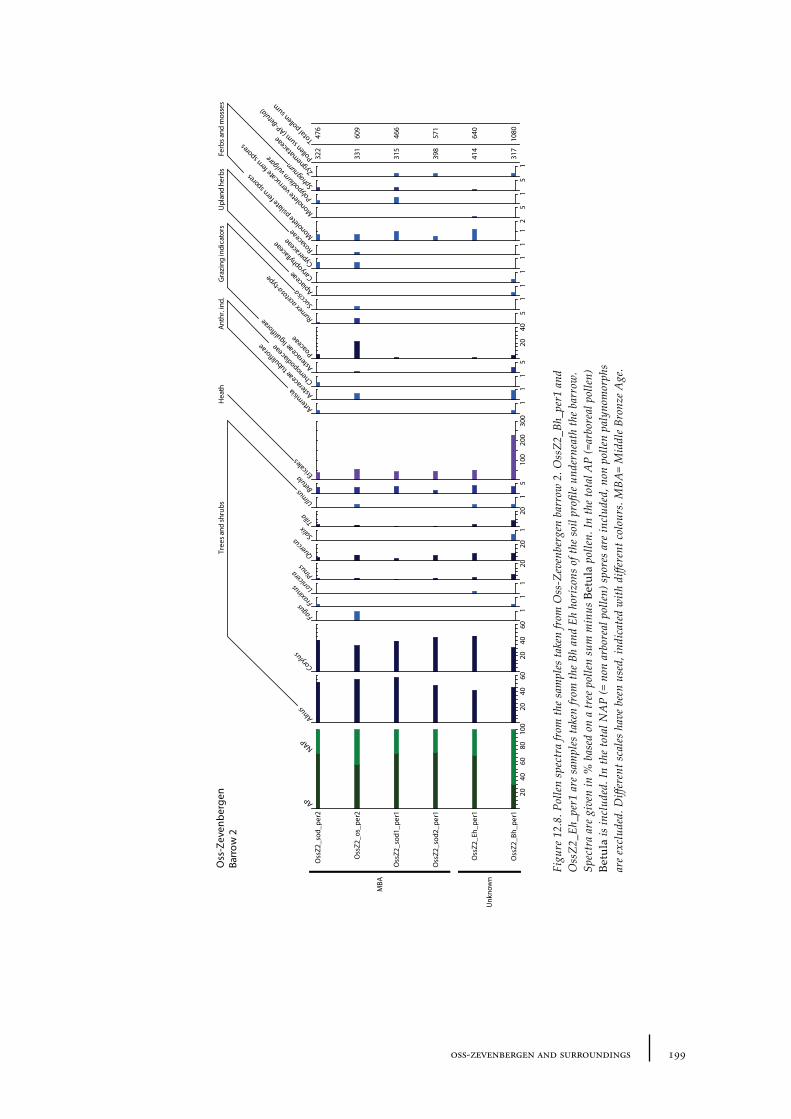
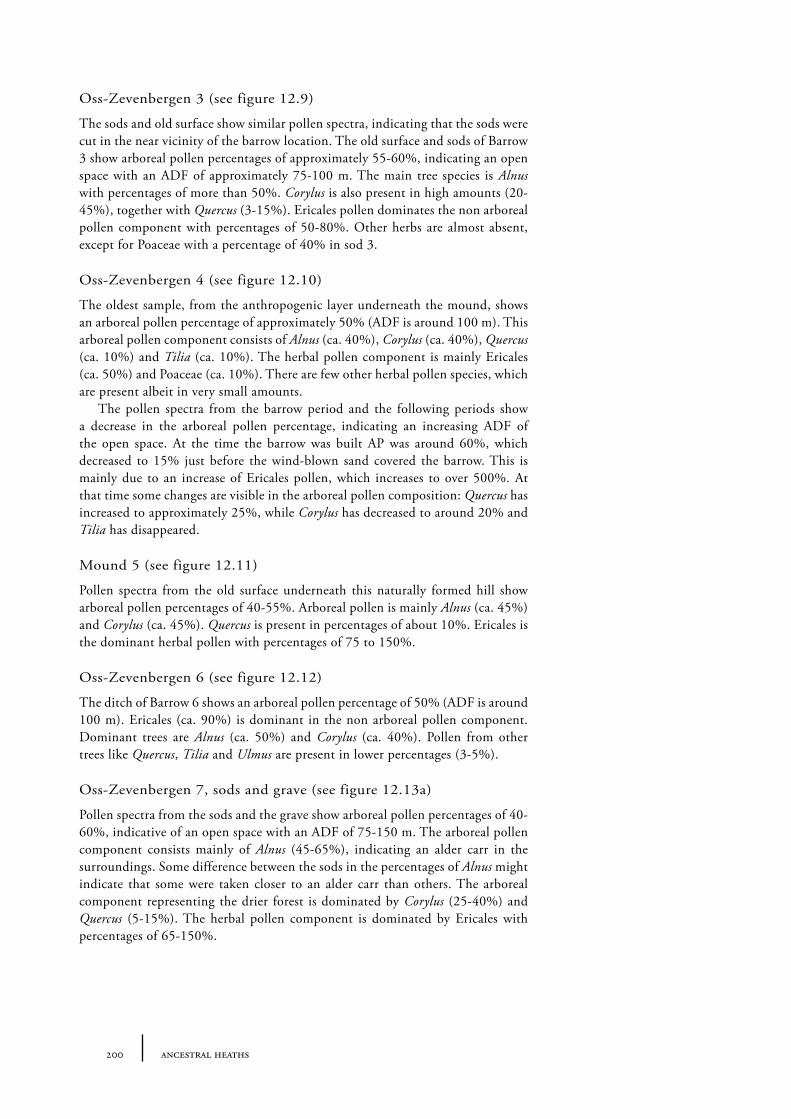
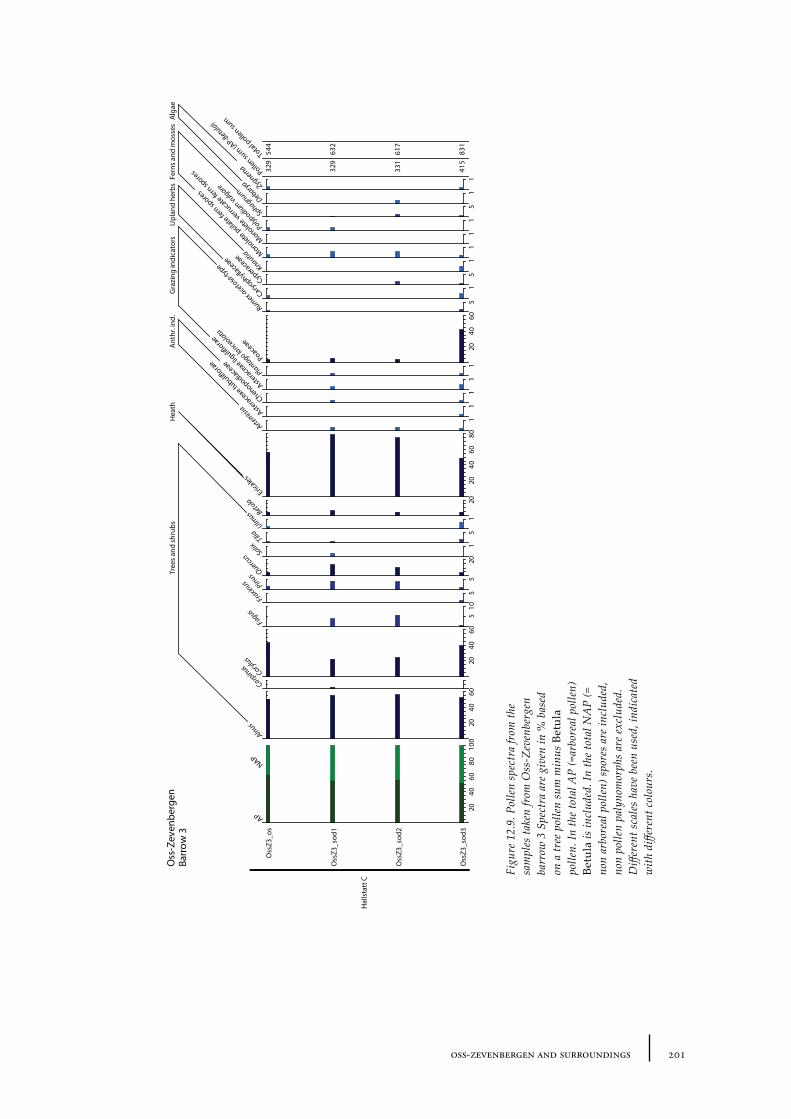
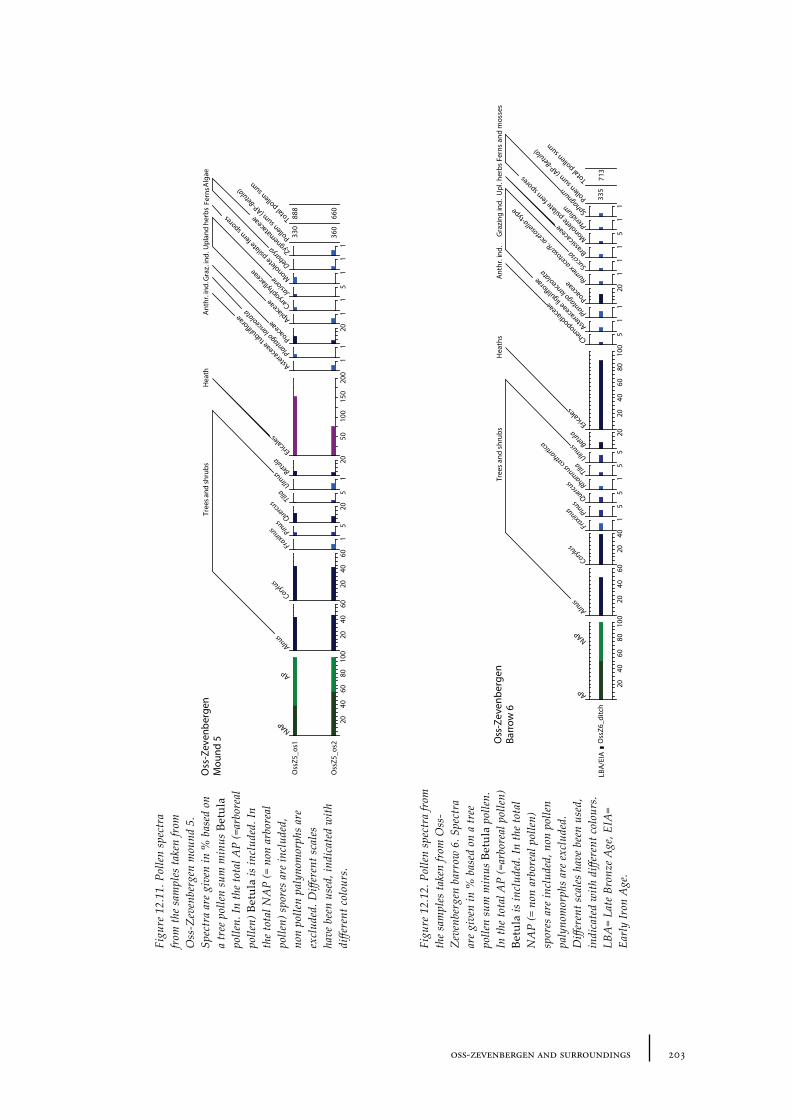
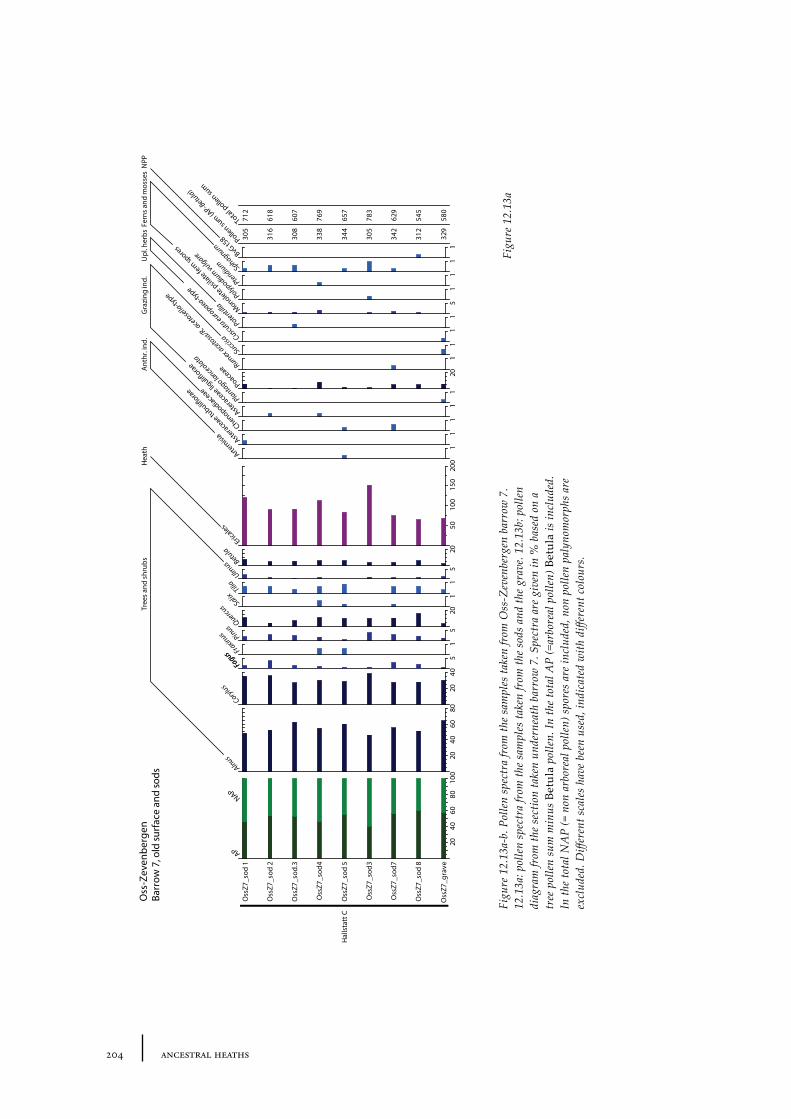
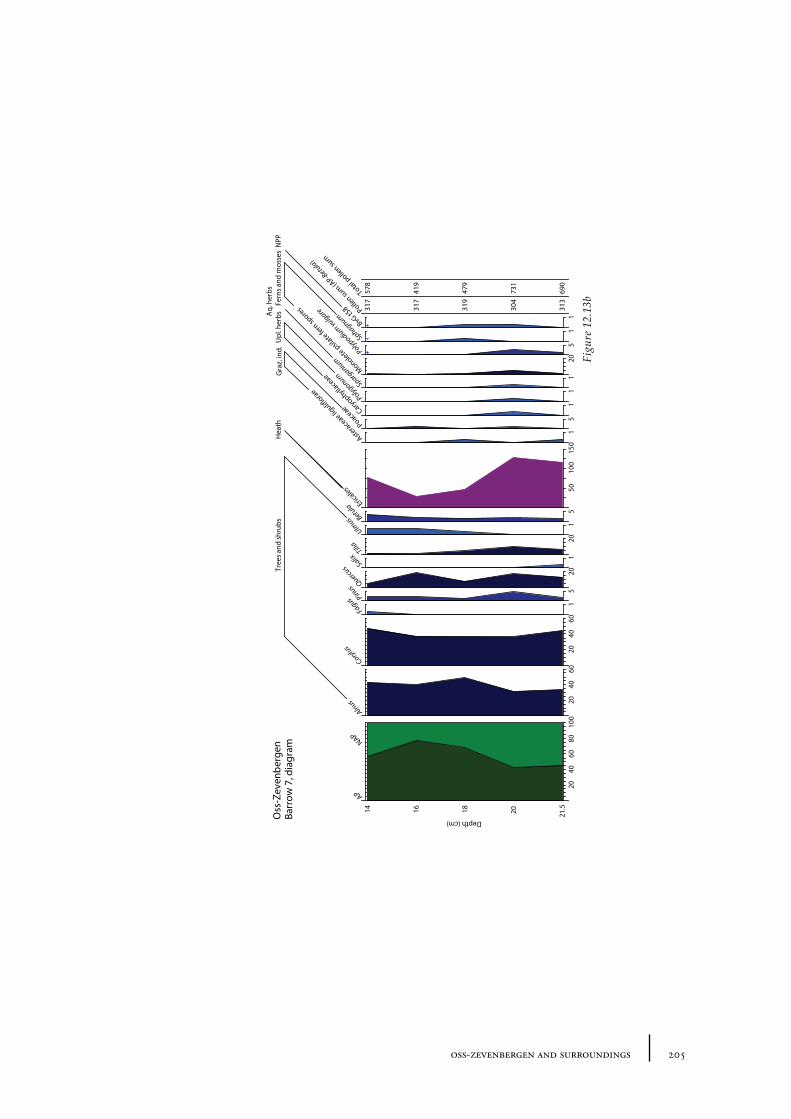
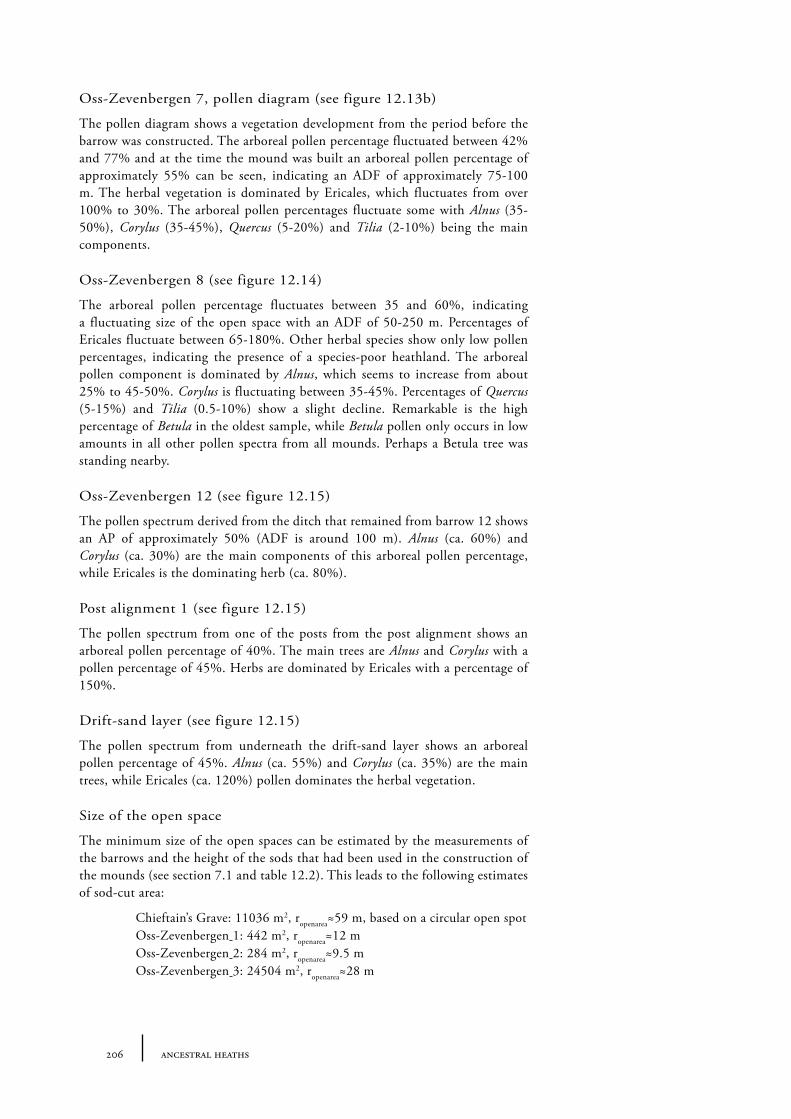
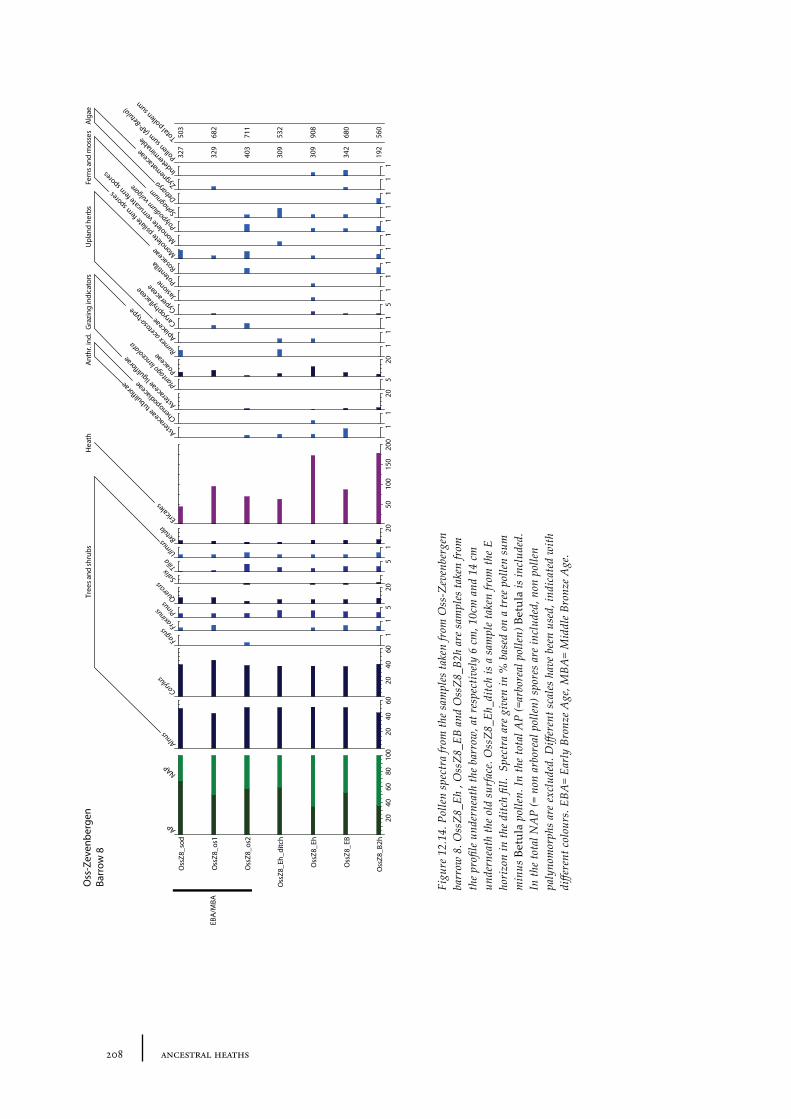
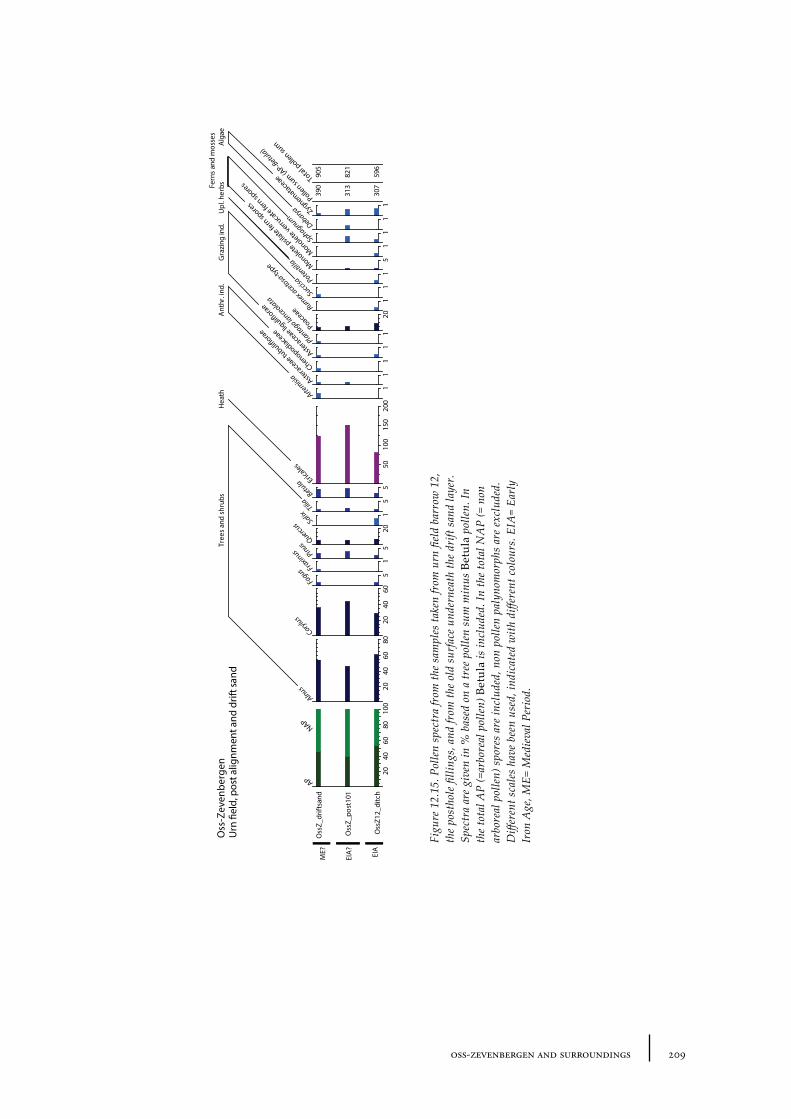
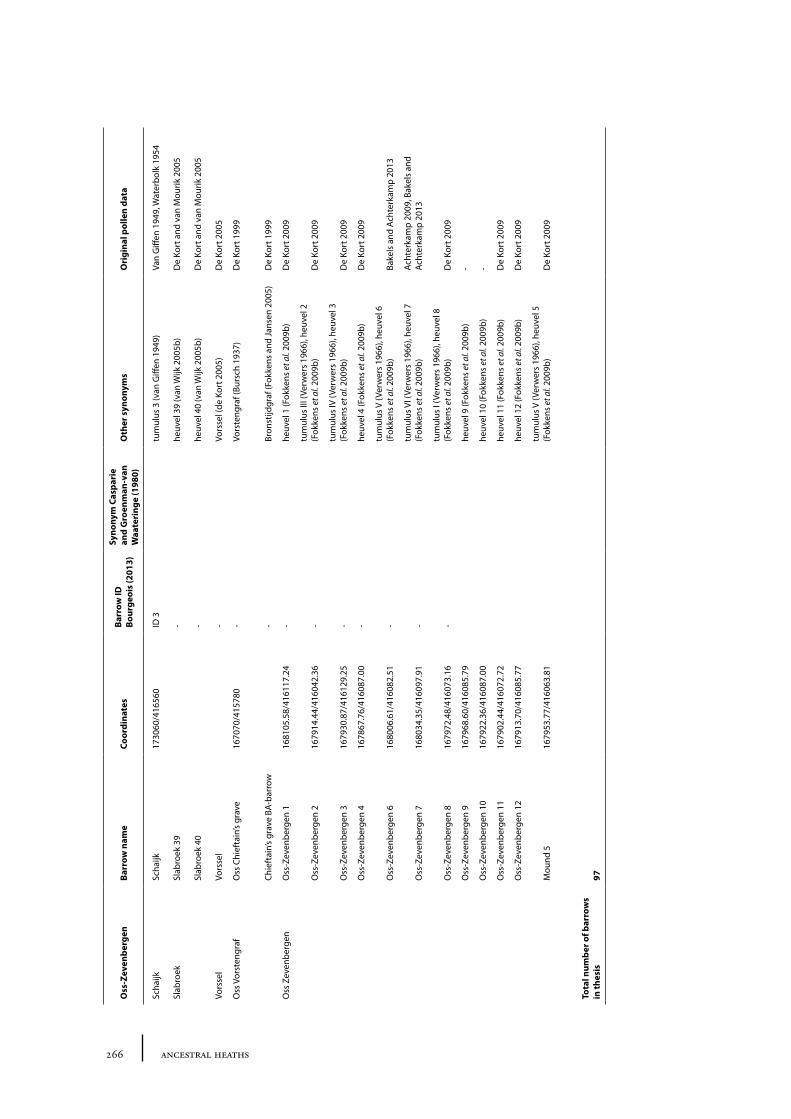
12.1 Oss-Vorstengraf area and Oss-Zevenbergen 18312.1.1 Site description and sample locations 18312.1.2 Results 19412.1.3 Discussion 20712.1.4 In conclusion: the history of the Oss-Zevenbergen landscape 212
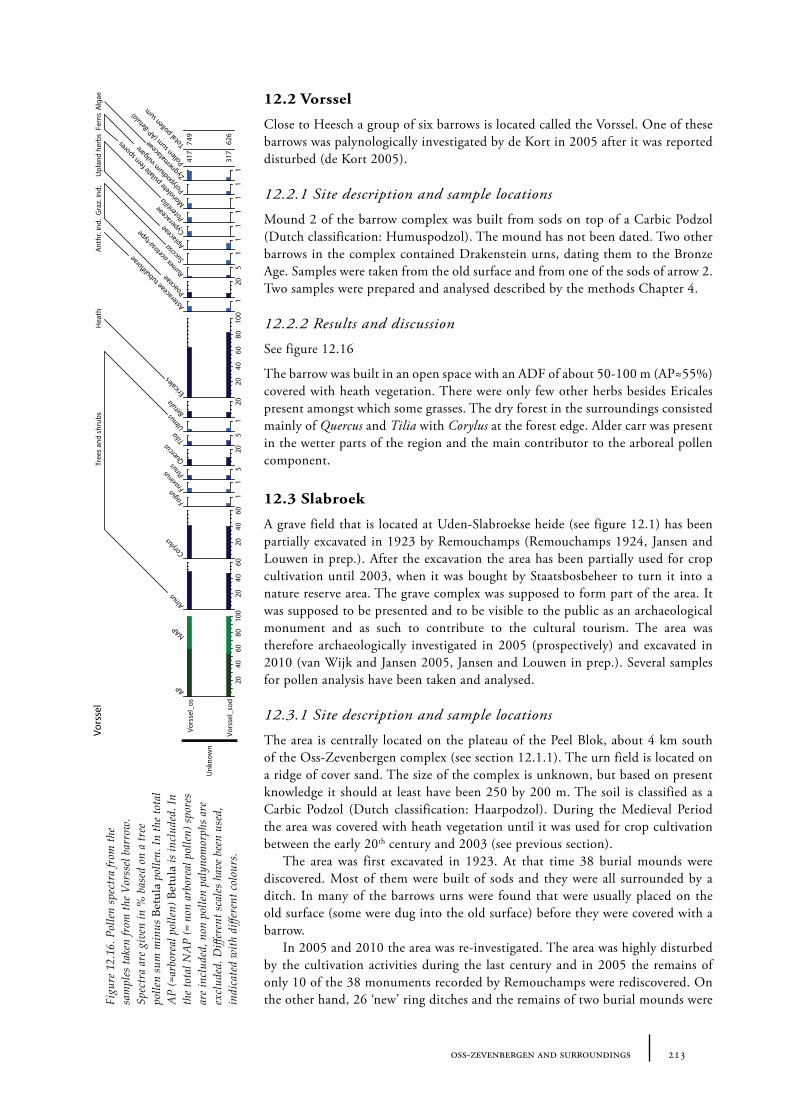
12.2 Vorssel 21312.2.1 Site description and sample locations 21312.2.2 Results and discussion 213
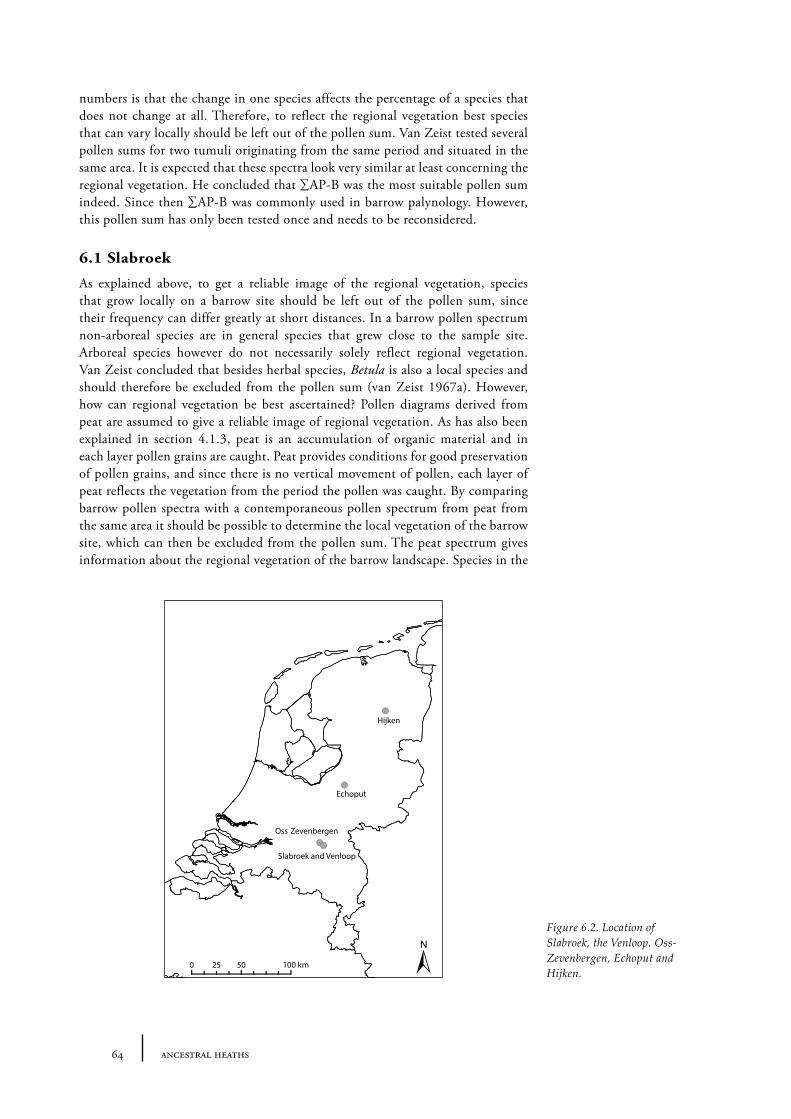
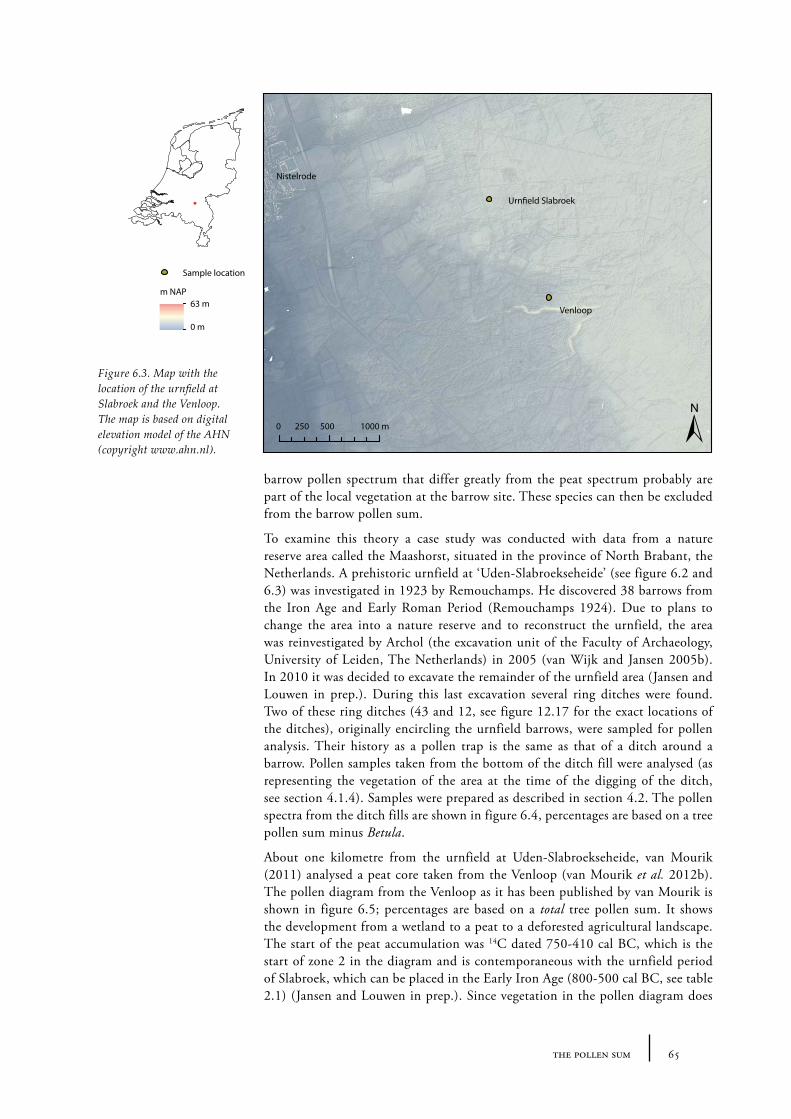
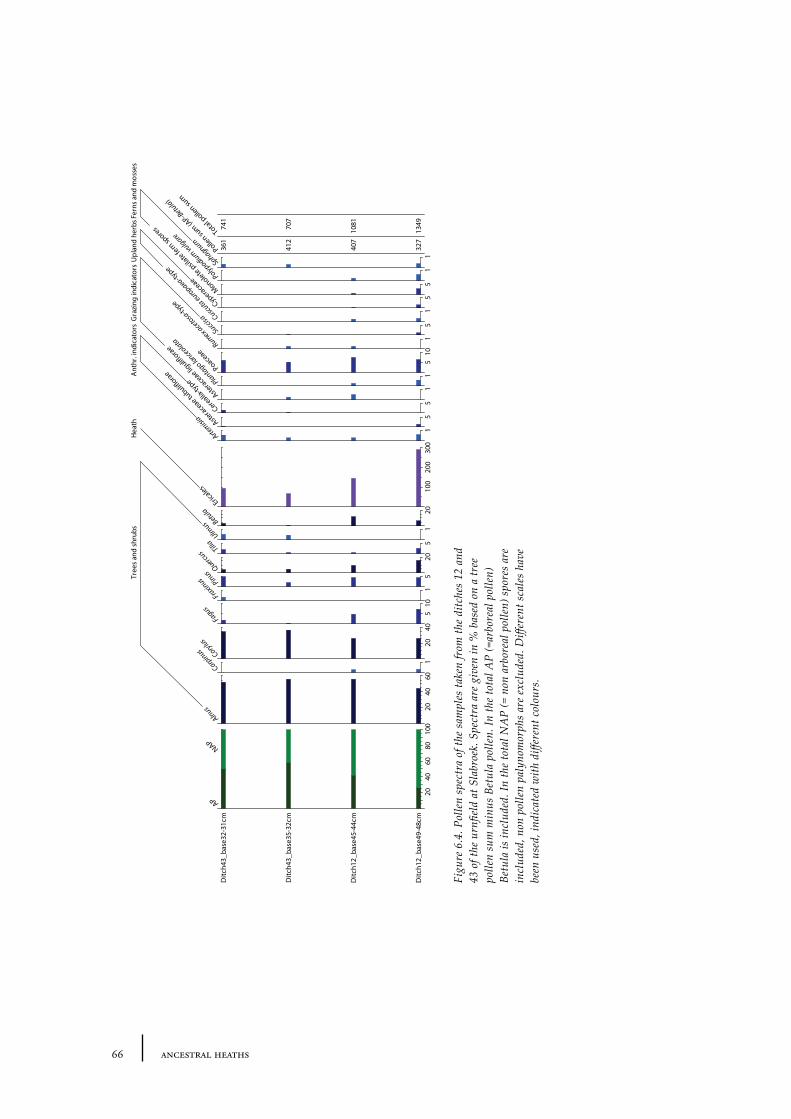
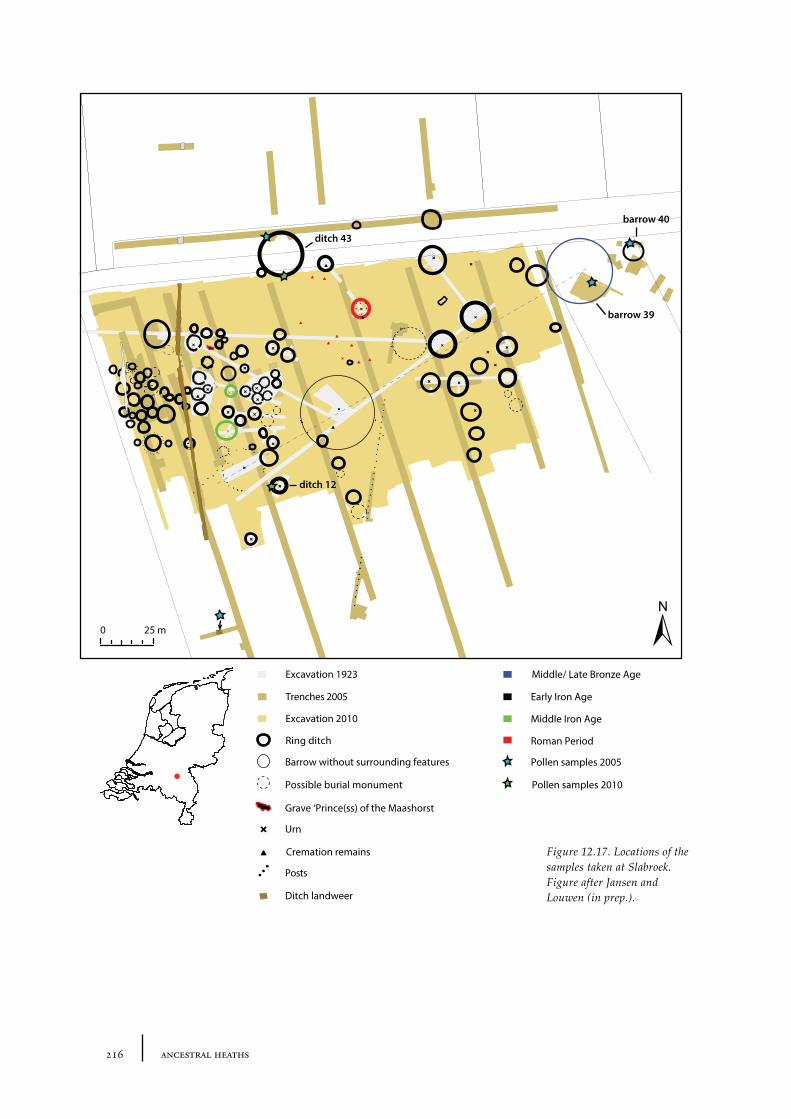
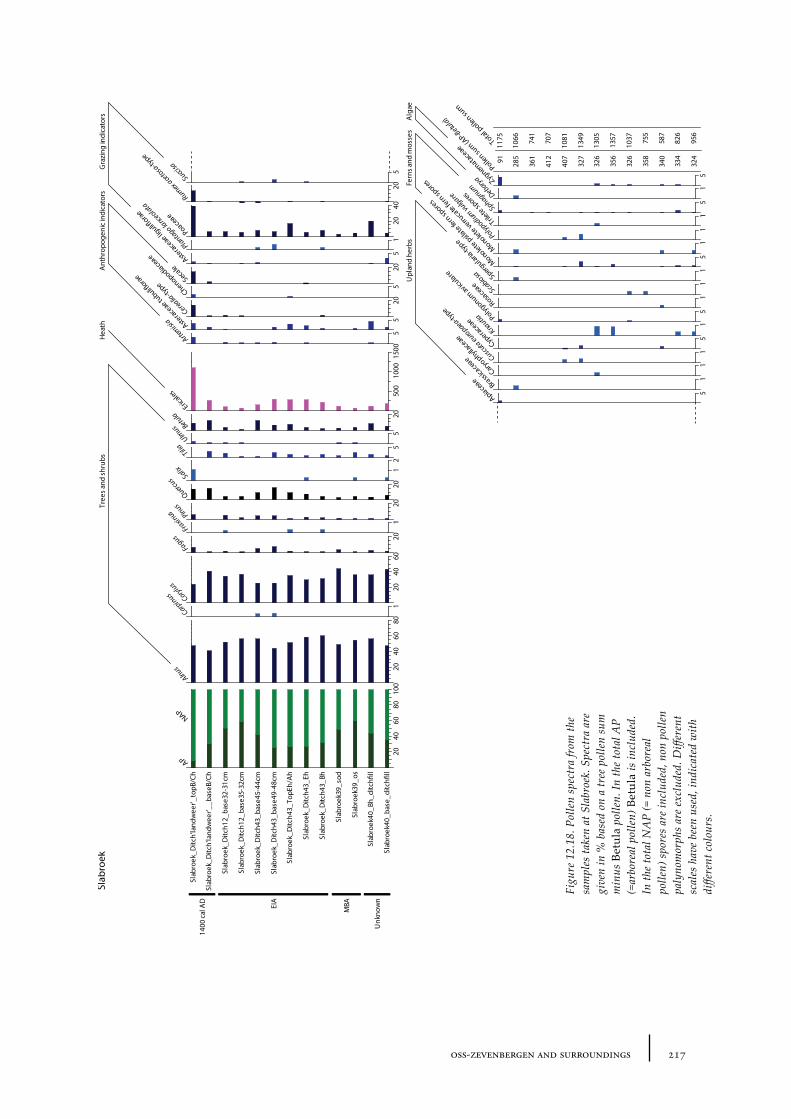
12.3 Slabroek 21312.3.1 Site description and sample locations 21312.3.2 Results and discussion 215
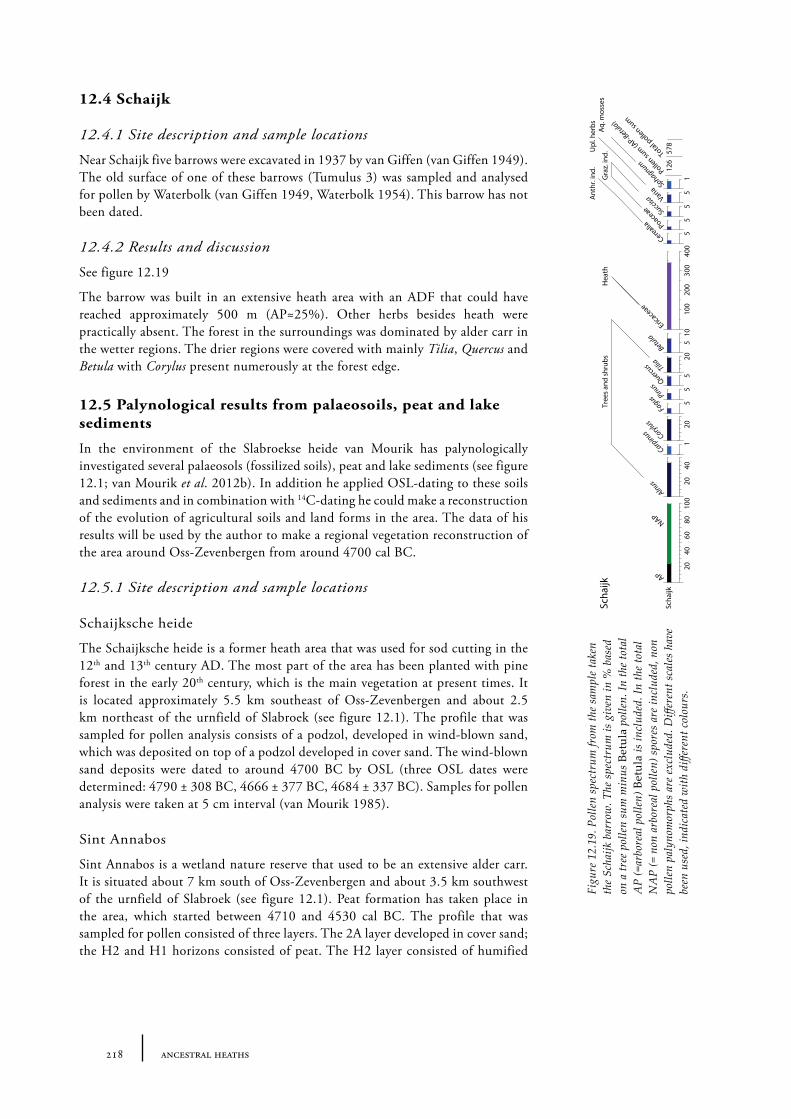
12.4 Schaijk 21812.4.1 Site description and sample locations 21812.4.2 Results and discussion 218
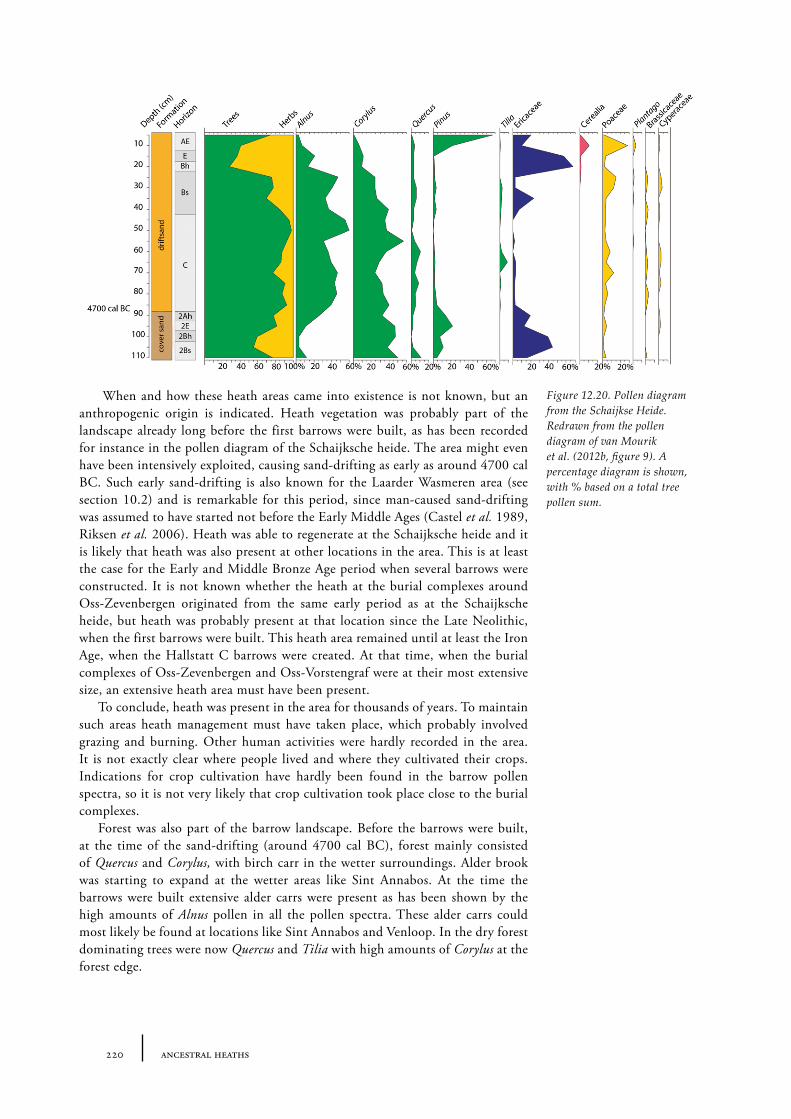
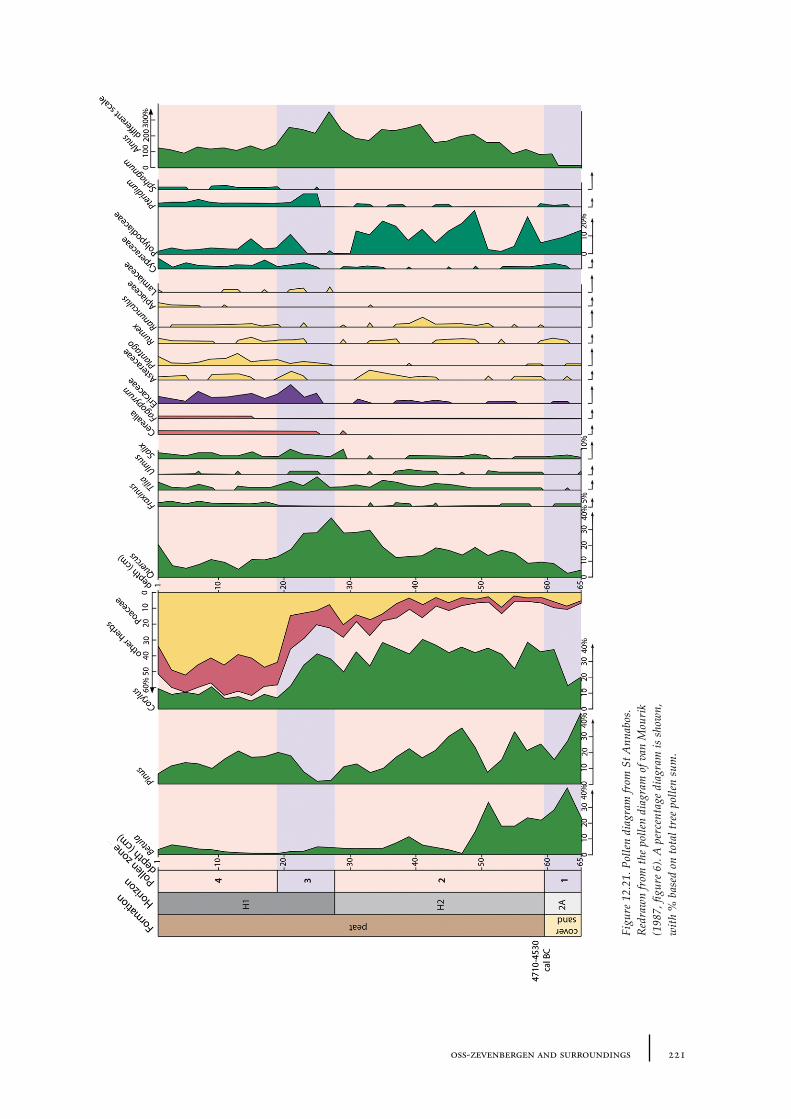
12.5 Palynological results from palaeosoils, peat and lake sediments 21812.5.1 Site description and sample locations 21812.5.2 Results and discussion 219
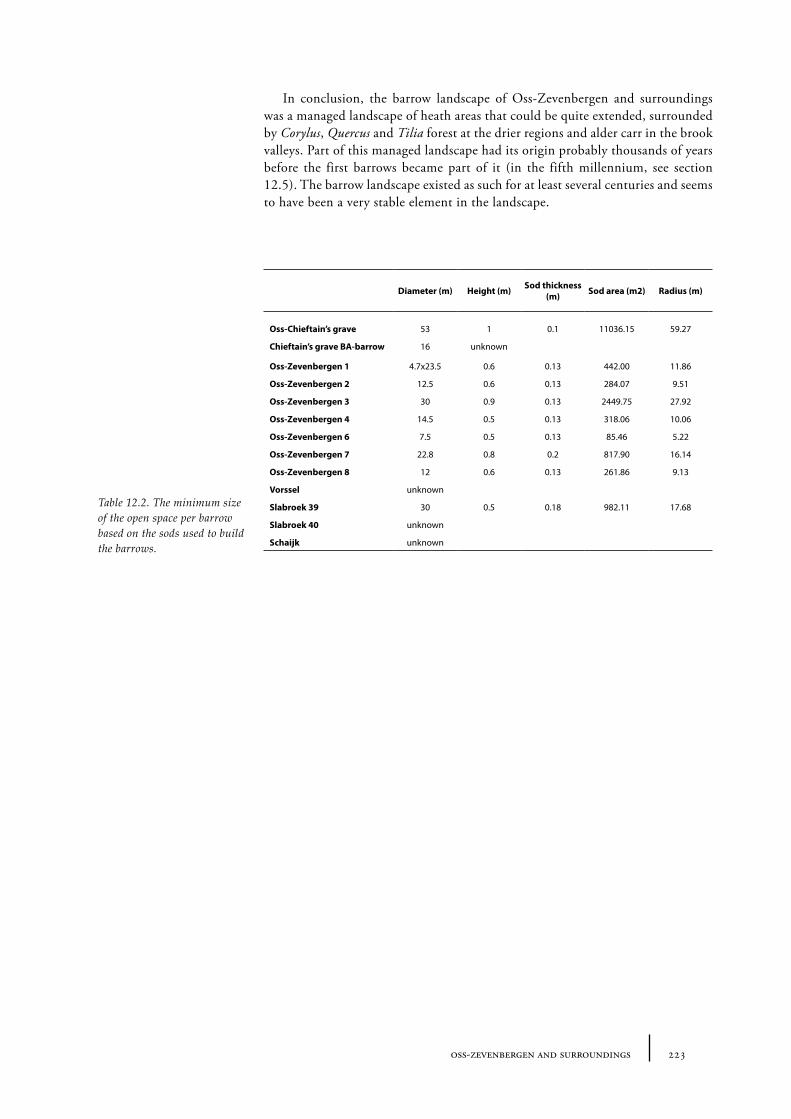
12.6 Summary: the barrow landscape of Oss-Zevenbergen and surroundings 219
13 Ancestral heaths: understanding the barrow landscape 225
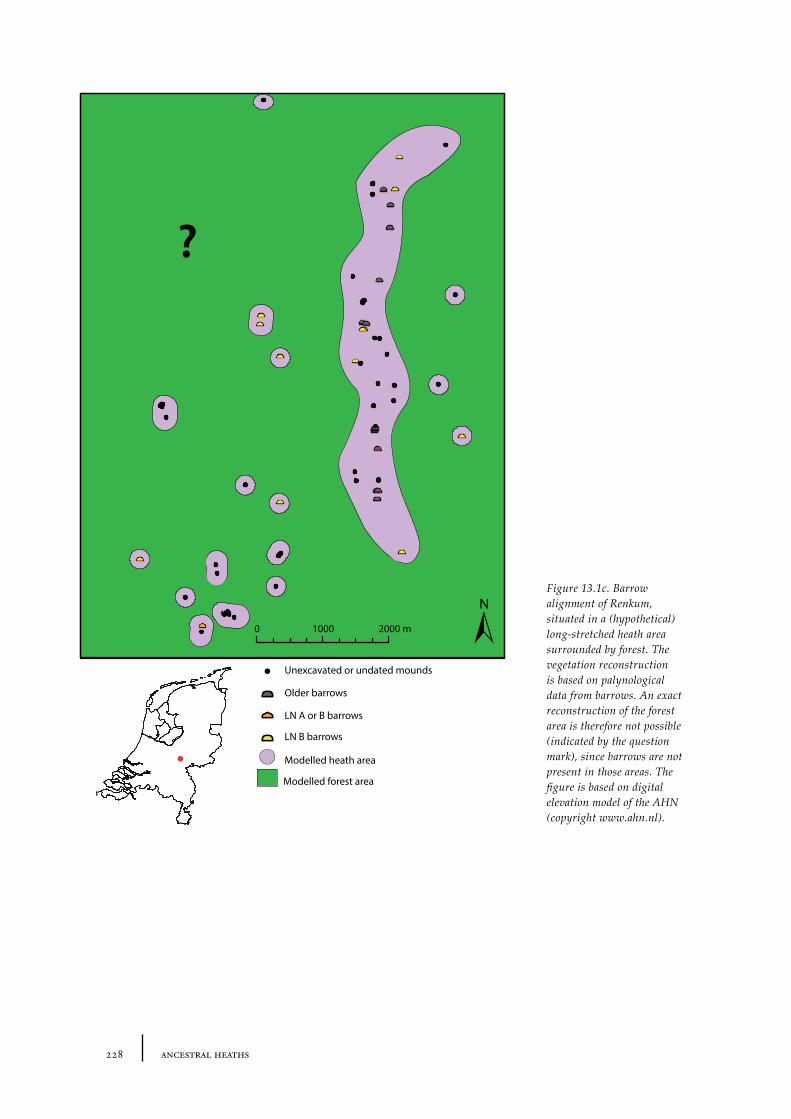
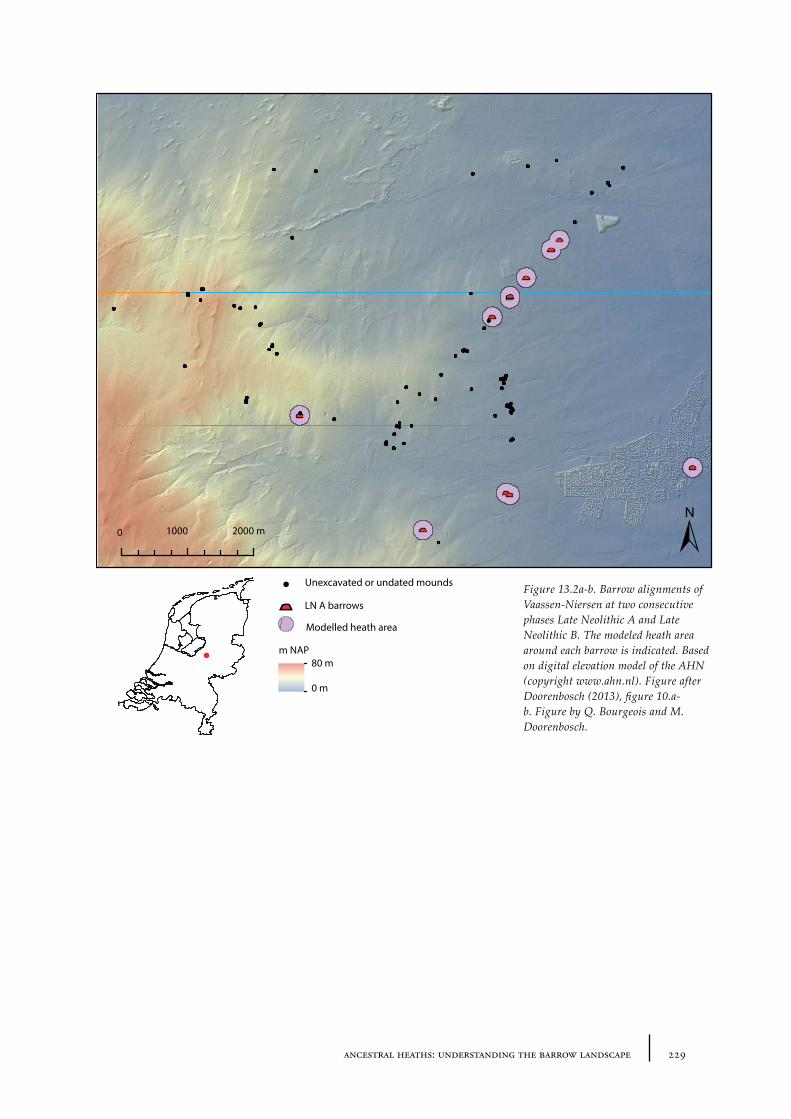
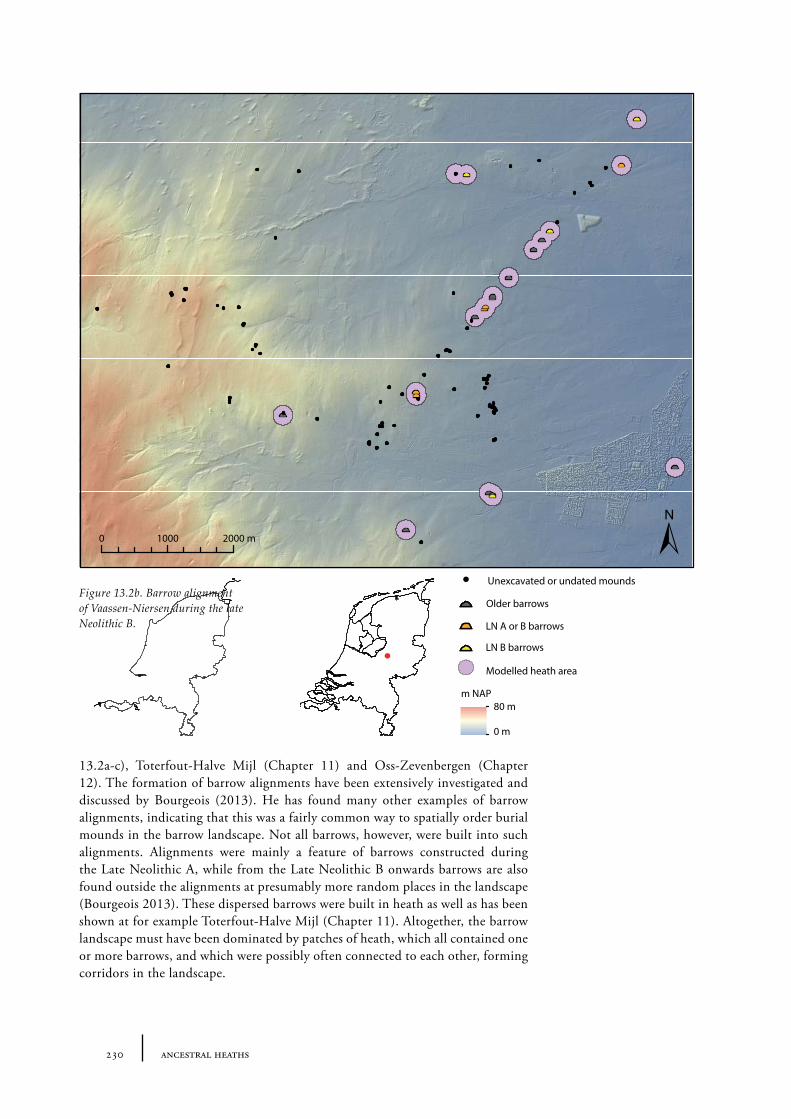
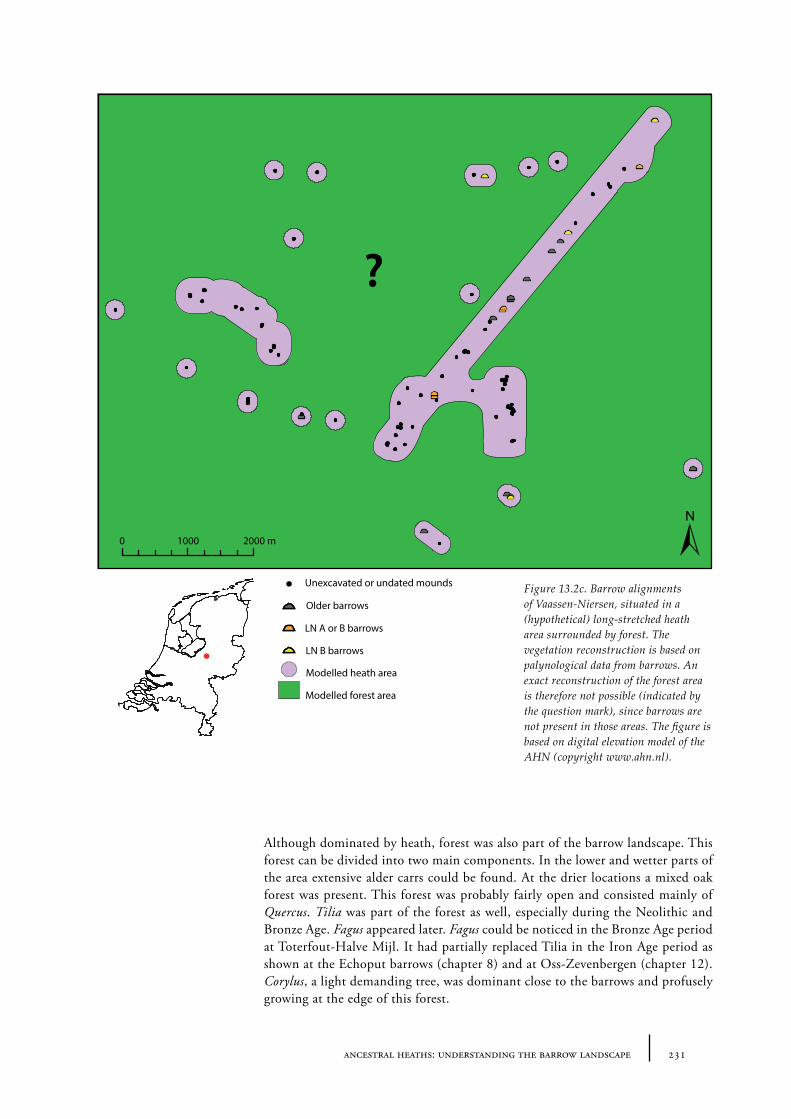
13.1 The barrow landscape 22513.1.1 What did the barrow landscape look like in the central and southern Netherlands during the 3rd to 1st millennium cal BC? 22513.1.2 What was the history of the barrow landscape before the barrows were built? 23413.1.3 What does this mean? 23413.1.4 What was the role of barrows in the landscape? 237
13.2 The heath open-forest passage landscape as part of the Dutch prehistoric landscape 239
14 Conclusions: answers to the research questions 241
References� 245
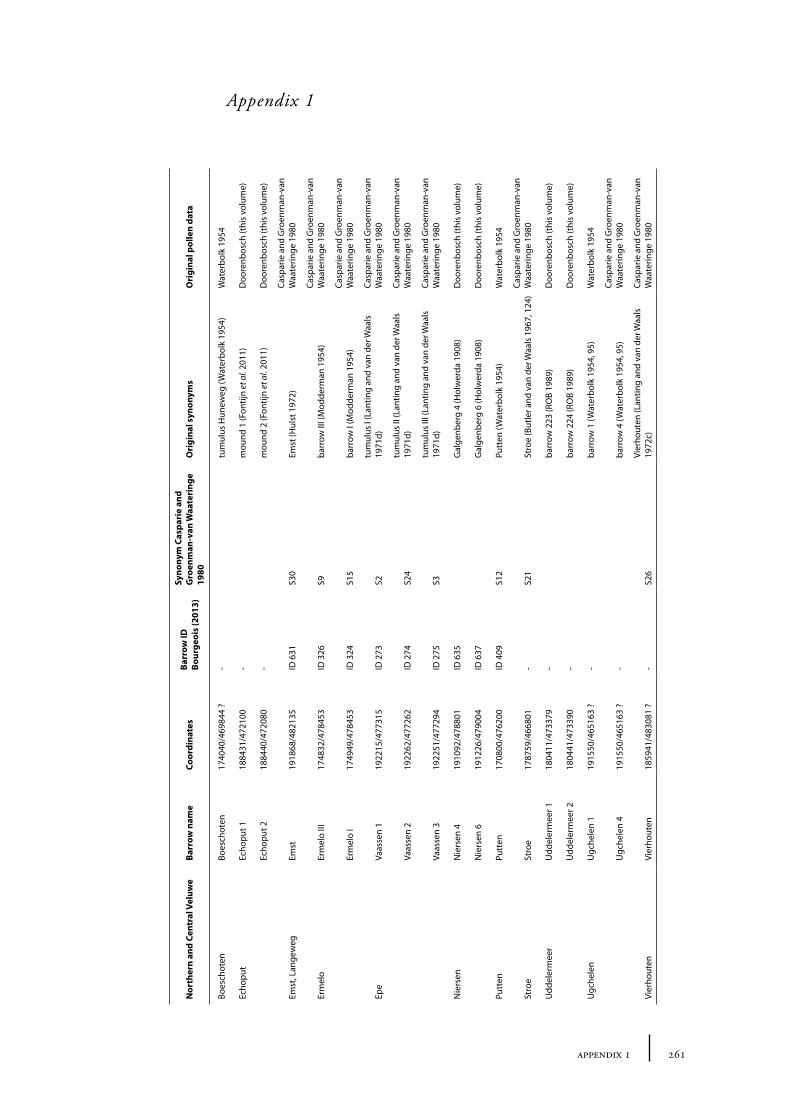
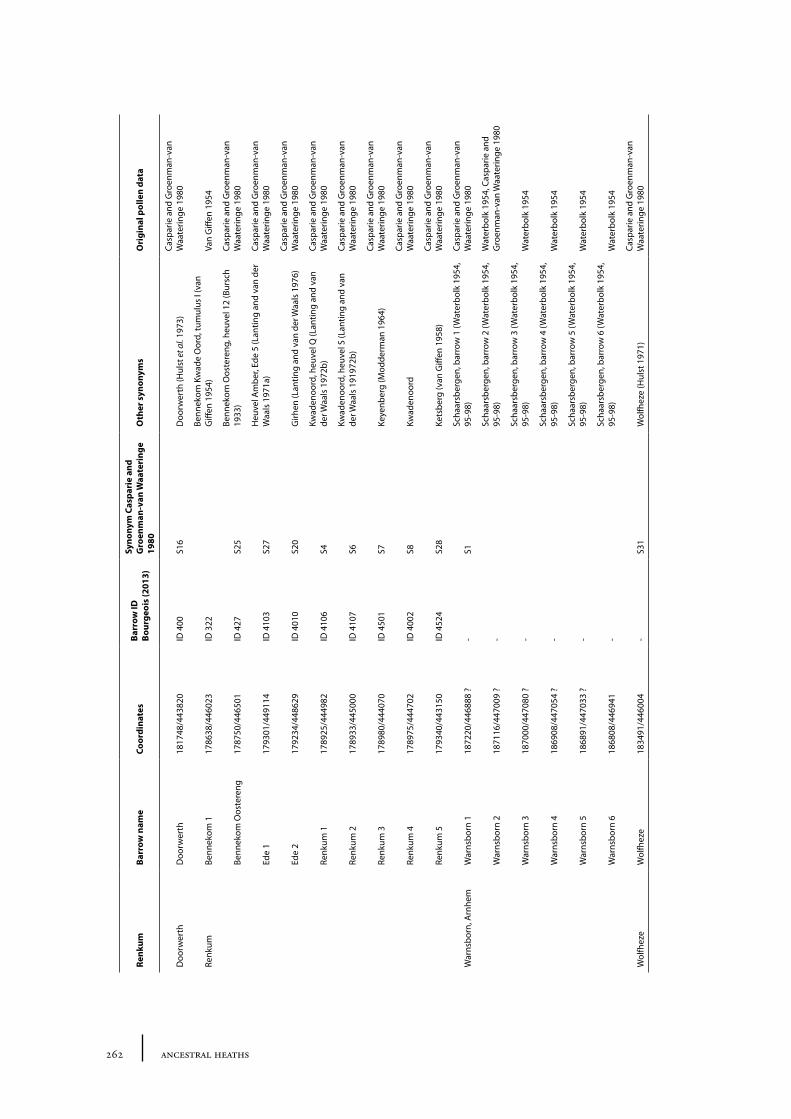
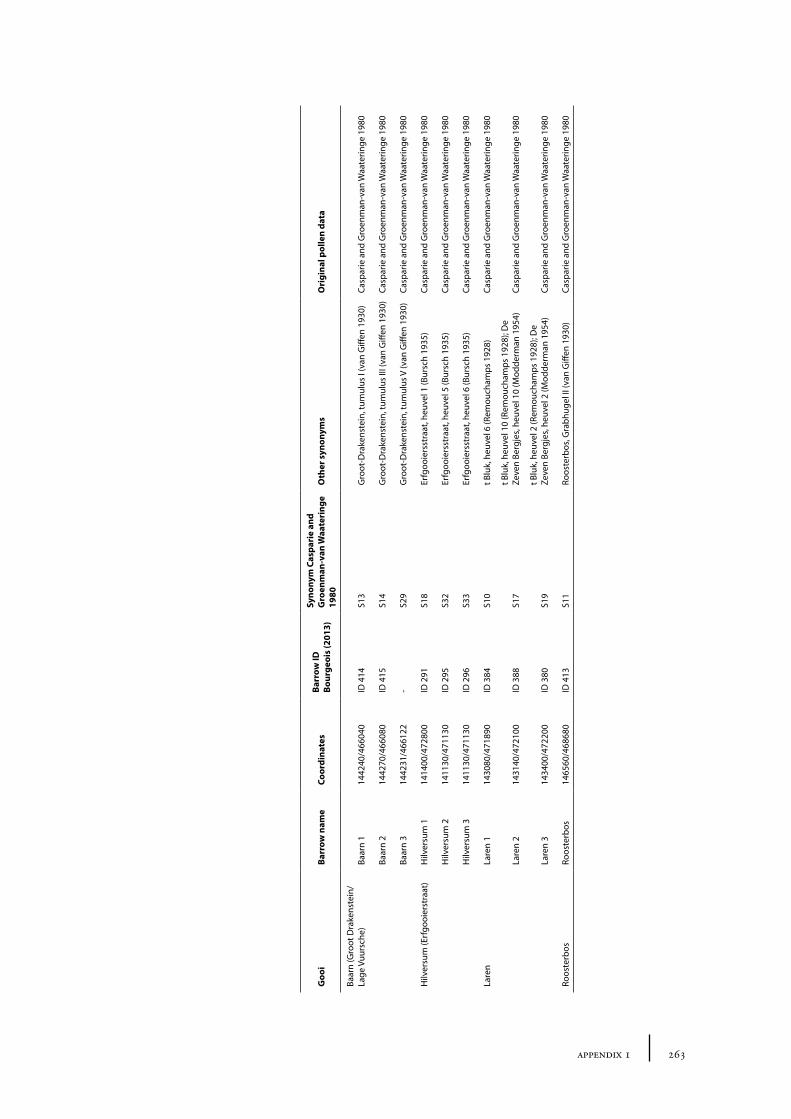
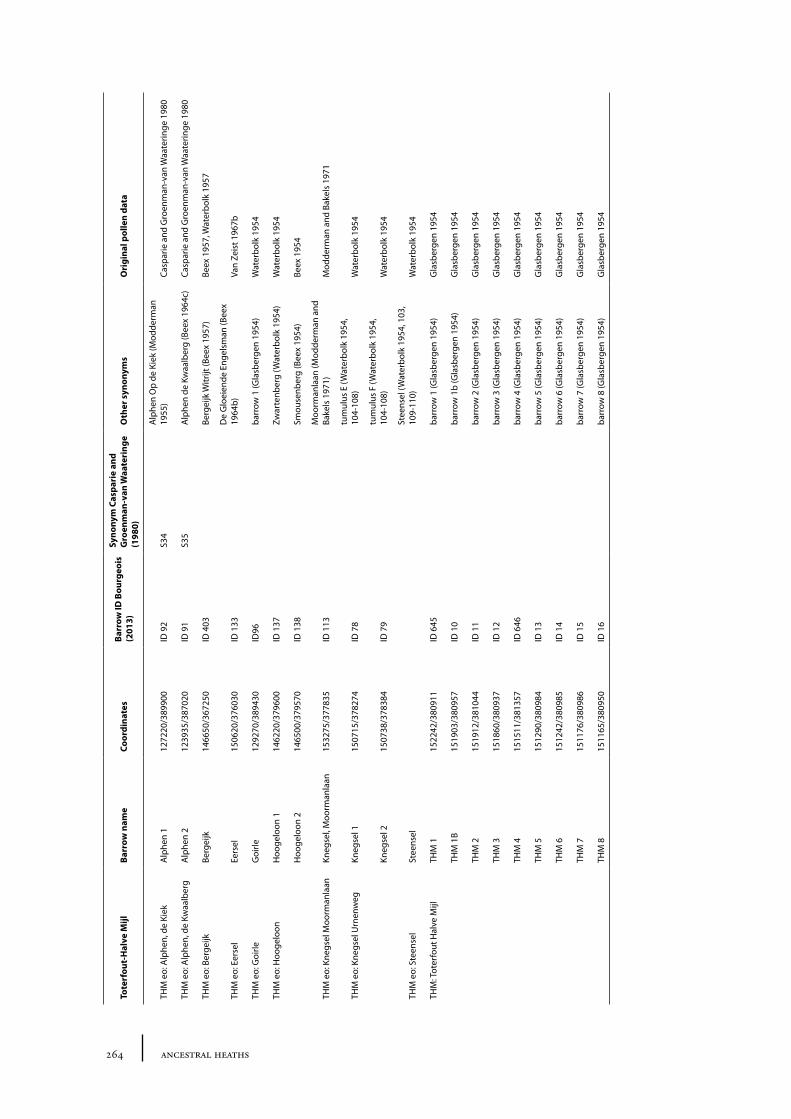
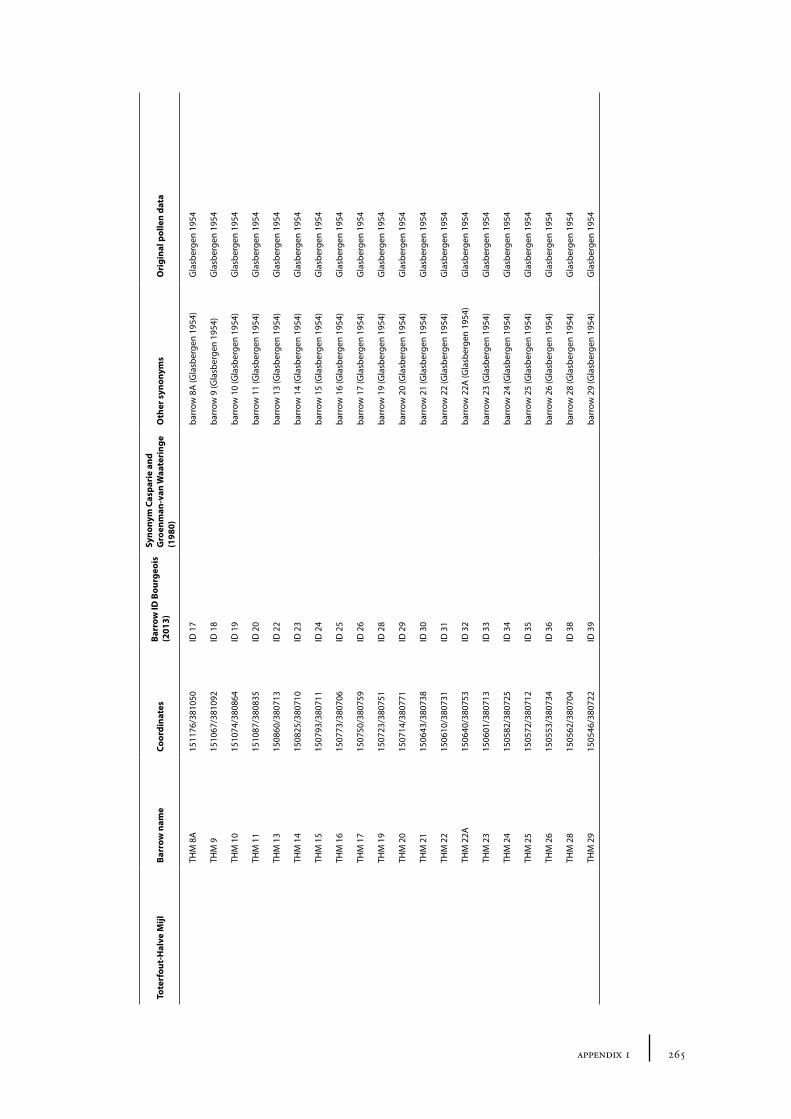
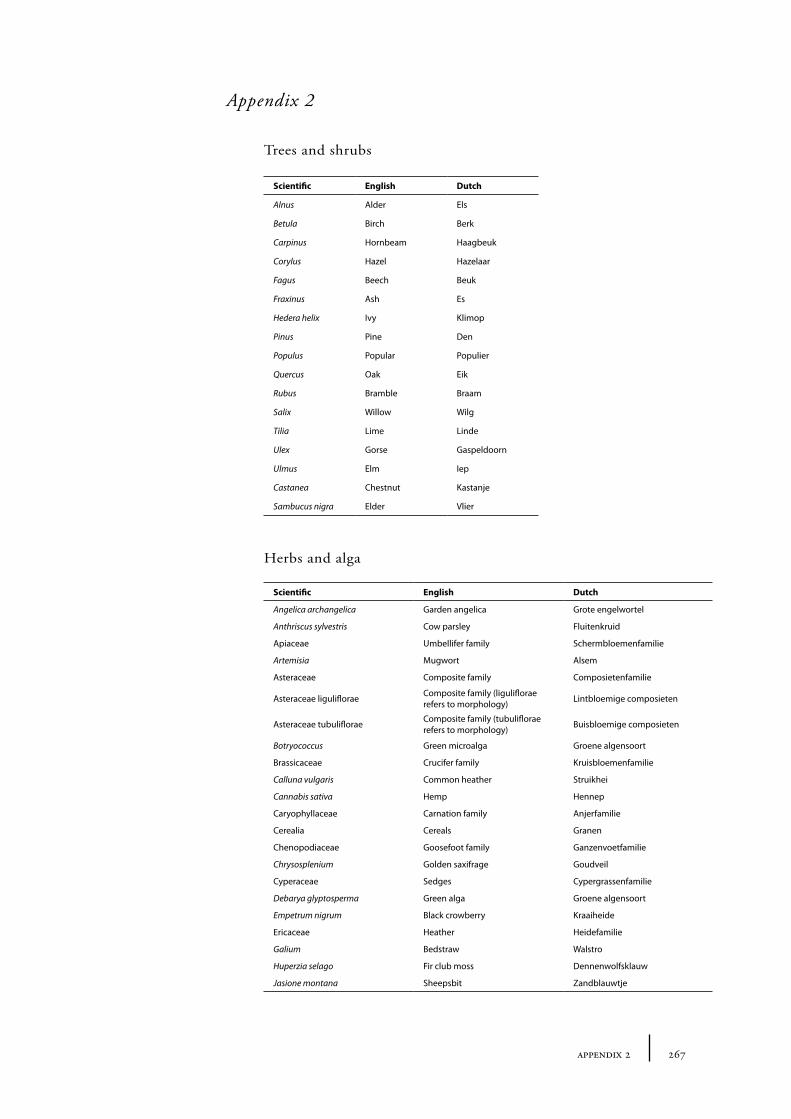
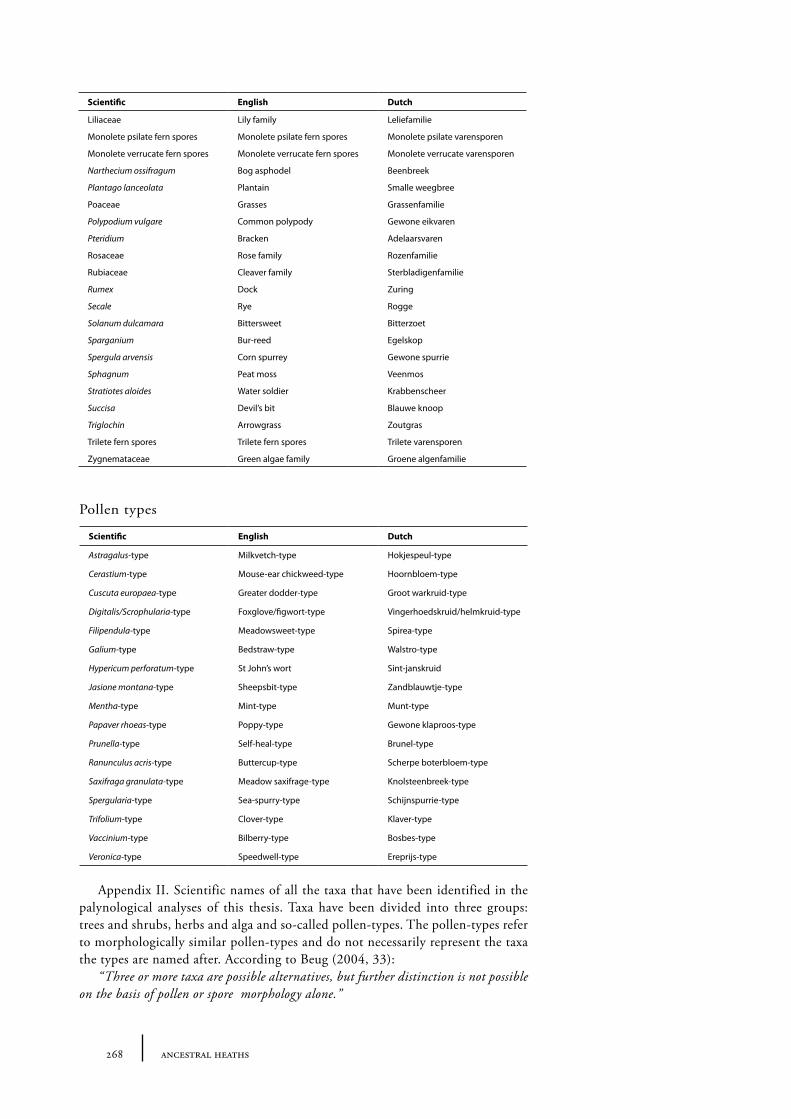
Appendix�1� 261
Appendix�2 267
Acknowledgments� 277
Curriculum�Vitae 279
Part OneThis thesis is divided into three parts. Part one (Chapters 1, 2 and 3) concerns the background of this research, beginning (Chapter 1) with an overview of the development of the palynological research of barrows. Following the overview is an assessment of what data are available (Chapter 2) and what is still missing (Chapter 3) from the palynological research of barrows.
Part two will go further into the methodology behind the palynology of barrows. Chapter 4 gives an overview of sampling techniques used in this study. Chapter 5 discusses the theory of vegetation history reconstruction through the use of pollen diagrams derived from mineral soils. In addition the relation between time and depth in mineral soils will be discussed in this chapter. In Chapter 6 the so-called pollen sum that is used in palynological analyses of barrows will be examined and reconsidered. Chapter 7 concerns the determination of size of the open place a barrow was built in. Three methods to determine the extent of an open space are described and discussed.
In part three of this thesis (Chapters 8-14) the methodological theories described and discussed in part two are applied to reconstruct the barrow landscapes of five case study areas. Each case study area is dealt with in a separate chapter (chapters 8-12), including the presentation of palynological analyses of several individual barrows and/or barrow complexes. In Chapter 13 the results of all case studies are summarized and discussed, and the last chapter (14) submits answers to the research questions put forward in this thesis.
13introduction
Chapter�1
Introduction: why study the environment of barrows?
1.1 The academic significance of environmental barrow research
Barrows, i.e. burial mounds, are amongst the most important of Europe’s prehistoric monuments. In the European landscape today hundreds of thousands of them are still visible, and considering the large number of barrows that have disappeared over time, it is not difficult to imagine the great importance barrows must have had. Across Europe, barrows still figure as a prominent element in the landscape. In Denmark alone, more than 80,000 barrows are known (Johansen�et�al. 2004). Many barrows in Europe have been excavated, revealing much about what was buried inside these monuments. Little is known, however, about the landscape in which the barrows were situated. Palynological data, carrying important clues on the barrow environment, are absent for most of the excavated barrows in Europe. In the Netherlands however, the opposite is the case, with palynological data being available for hundreds of excavated barrows, a fact which places the Netherlands as a very important centre for the environmental research of barrows.
Some 3,000 barrows are presently known in the Netherlands (Bourgeois 2008). Burial mounds were built from the 4th millennium BC until around 500 year BC, with most being constructed during the 3rd and 2nd millennium BC. So many barrows were built during this period that they must have visibly dominated the landscape. Many of these barrows have been the subject of archaeological research in the Netherlands. In 1906, Holwerda was the first to begin excavating barrows near Hoog Soeren, the Veluwe (Holwerda 1907). Holwerda also did much to popularize barrow archaeology, bringing it to the attention of the public. Van Giffen, a contemporary of Holwerda, pioneered the quadrant method of barrow excavation. With the quadrant method, the barrow is divided into four quadrants and the opposing quarters are removed in order to identify internal features and expose a continuous profile of the object through its centre along intersecting axes (see figure 1.1). Van Giffen involved palynology, determination of bones and seeds, geology and C14 dating in his archaeological research (Louwe Kooijmans 1979), in large part due to his training and background. After the Second World War Glasbergen en Modderman continued to excavate numerous barrows. Around 1970 it was realised that burial mounds were valuable archaeological monuments that needed protection, which led to the mounds being listed as cultural heritage monuments protected by the state. Since then very few barrows have been excavated and it was thought for a long time that there was more than enough known about burial mounds.
Since 1906 around 800 barrows have been excavated. These excavations have contributed not only to the knowledge we presently have on barrows, but also to what we know of prehistoric man. However, this information has nowadays become dated. In the past barrows were solely interpreted as burial places for
14 ancestral heaths
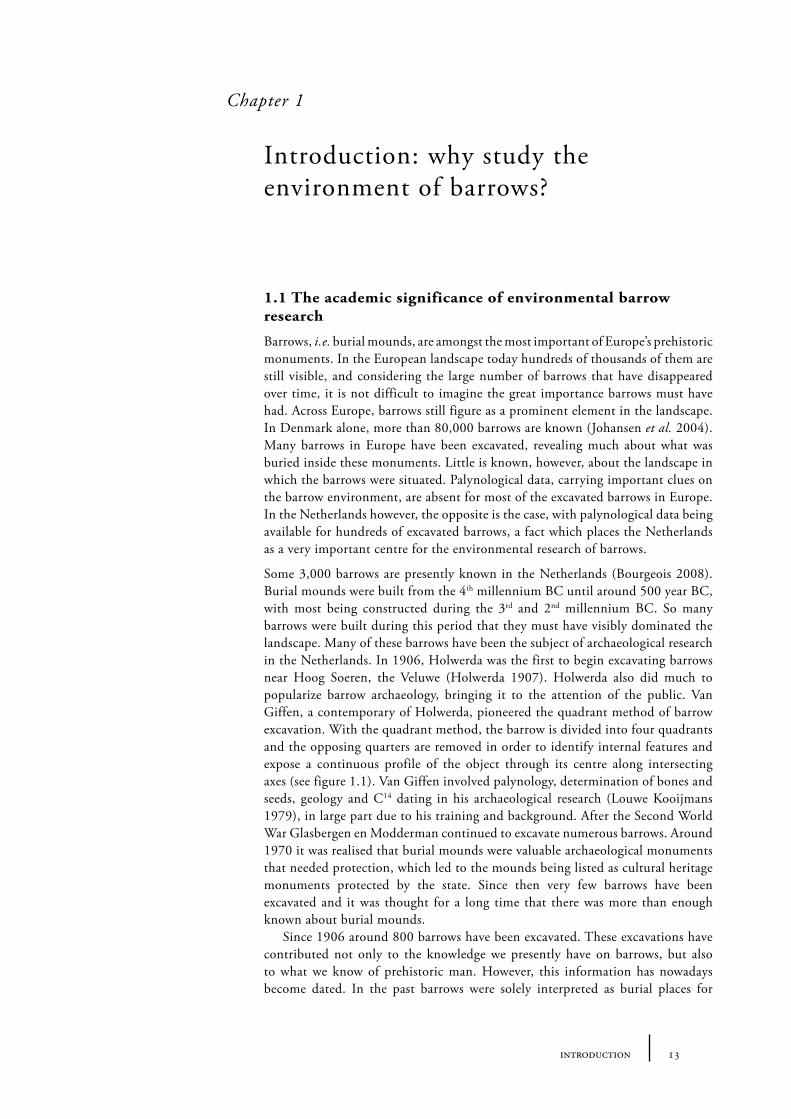
prestigious individuals or martial chiefs, but, based on the special and sometimes exotic objects that are often found in barrows, especially barrows from the 3rd and 2nd millennium cal BC, there is growing evidence pointing to barrows having been highly important ritual places with a specific cultural value. The importance of barrows in the past was emphasised by the fact that they were often re-used again for burials and other ritual practices for hundreds of years and that barrows formed in their entirety highly visible barrow landscapes. However, the specific social and ideological significance of barrows is still unclear. What is further lacking is information on the landscape surrounding the barrows. While local vegetation reconstructions from many barrows in the Netherlands are available, a reconstruction of the total landscape around the barrows has yet to made, without which it would be difficult to understand their role in the prehistoric cultural landscape. To improve our knowledge of barrows with respect to the problems mentioned above, the project ‘Ancestral Mounds’ was started. The following research questions were formulated (Fontijn 2007):
What was the social and ideological significance of barrow graves? In what way do they differ, in terms of content, location, and landscape setting, from contemporaneous other types of burials and ritual depositions? What does this tell us about the social roles of the deceased buried in barrows?What was the significance of barrows as landscape monuments? How were they embedded in the by then emerging agrarian landscape and how did their presence structure the landscape of later generations?
The ‘Ancestral Mounds’ project is divided into three PhD-projects, each focusing on a different level of analysis:
Project one is pitched at the level of the grave(s) inside the burial mounds. What was the social and ideological identity of the dead? This will be investigated by analysing the life-cycles of all artefacts found in burial places (Wentink in prep.).
Project two focuses on the barrow groups (Bourgeois 2013). How and why did barrows come to form entire landscapes?
1.
2.
Figure 1.1. An example of a barrow in which one quadrant has been excavated according to the quadrant method pioneered by van Giffen. The excavated barrow in the picture is located at the Echoput, near Apeldoorn (see chapter 8.1). Photograph by Q. Bourgeois.
15introduction
Project three, which is the subject of this thesis, studies the barrow environment. What did a barrow landscape look like and what was the role of barrows in this landscape? In this thesis a detailed vegetation history around barrows is reconstructed in order to get a better impression of what role barrows played in their environment. The research questions and methods will be discussed more in detail in Chapter 3.
1.2 The societal significance of environmental barrow research
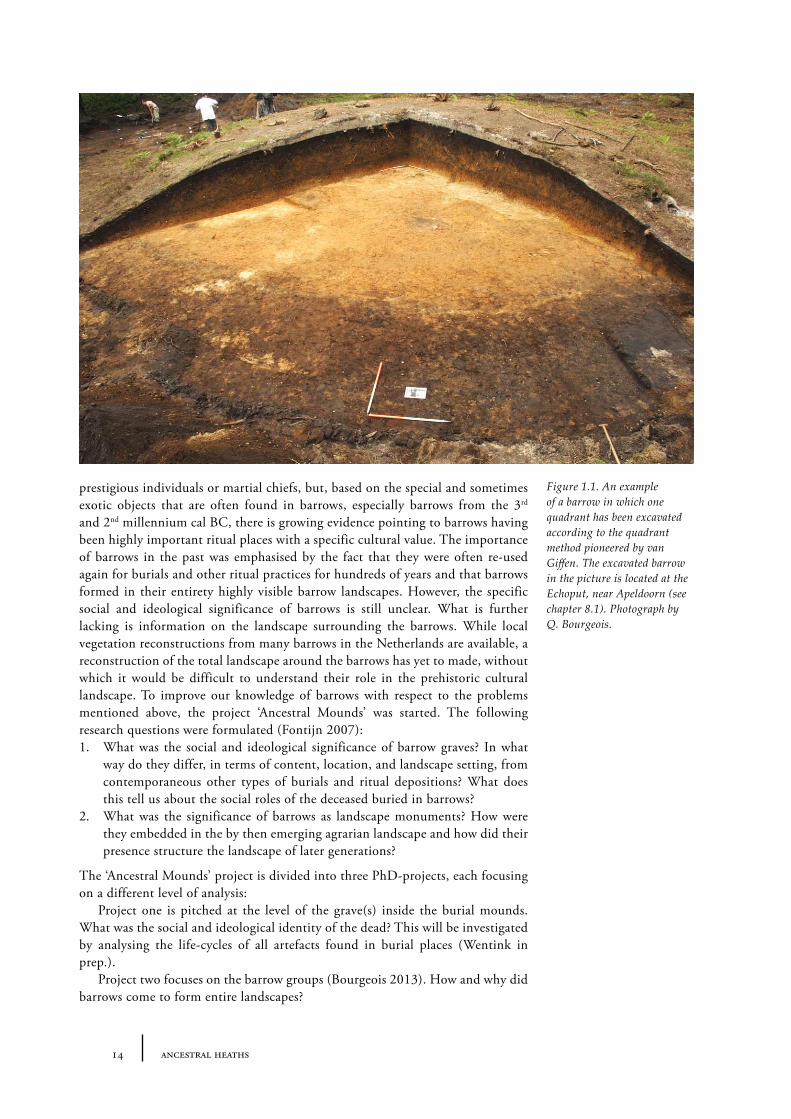
Besides the academic concern for doing research on barrows in the Netherlands, there is also a societal concern. The Dutch public and landowners are very interested in the barrows in their region. A tourist route in a nature reserve may pass several burial mounds (see figure 1.2 for an example), with only a small sign next to the barrow indicating the presence of a burial mound (see figure 1.3). It is also often the case that very little information about the barrow is available. Owners of areas with barrows have expressed a desire for more information about the history of these barrows, and in some cases they want to show what the barrow landscape looked like at the time of the barrow’s building. Nature reserves such as the Staatsbosbeheer and Kroondomeinen are interested in reconstructing barrow landscapes and including the burial mounds in their management and development of the landscape. But in order to carry out this management, they need to know what the barrow environment looked like.
The archaeological value of the barrows is not always clear to the public, as evidenced by the disturbance of several barrows in recent years. For example in Rhenen-Elsterberg a barrow had been dug into to presumably make a place for a shelter (Arnoldussen�et�al. 2009). Greater awareness of the archaeological value of barrows could prevent such unfortunate unwitting vandalism from occurring.
Figure 1.2. Two barrows at the Zuiderheide, near Hilversum.
16 ancestral heaths
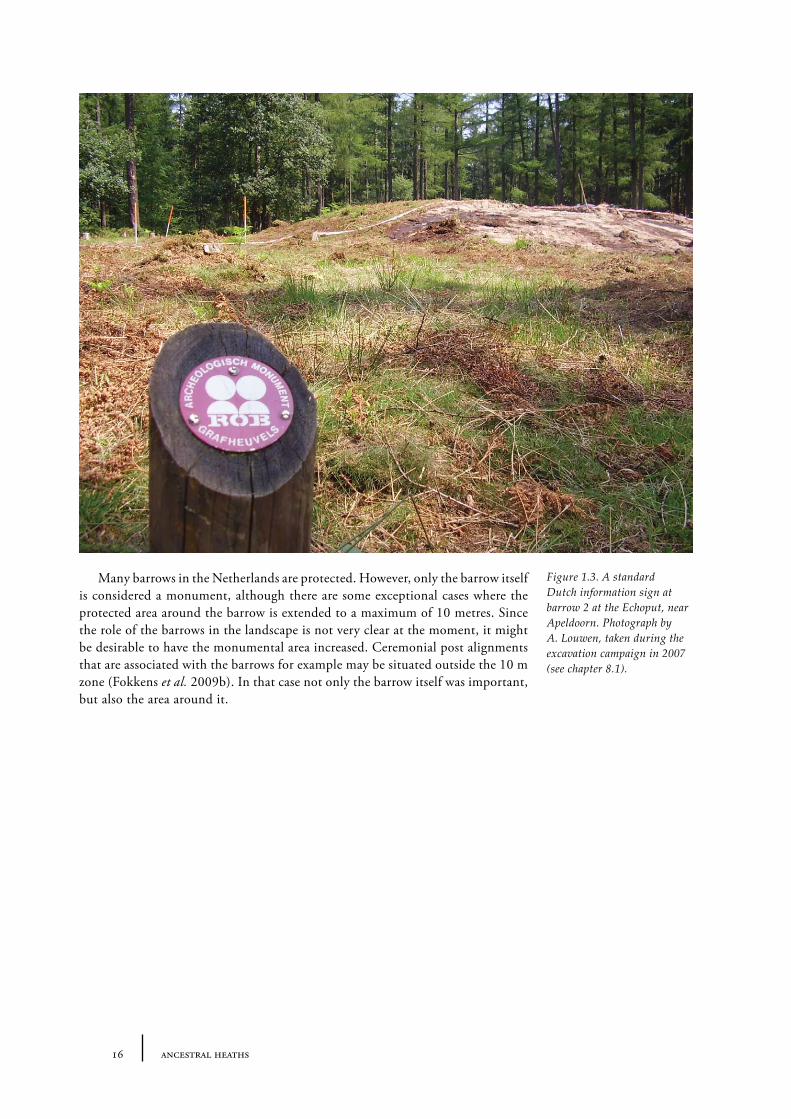
Many barrows in the Netherlands are protected. However, only the barrow itself is considered a monument, although there are some exceptional cases where the protected area around the barrow is extended to a maximum of 10 metres. Since the role of the barrows in the landscape is not very clear at the moment, it might be desirable to have the monumental area increased. Ceremonial post alignments that are associated with the barrows for example may be situated outside the 10 m zone (Fokkens�et�al. 2009b). In that case not only the barrow itself was important, but also the area around it.
Figure 1.3. A standard Dutch information sign at barrow 2 at the Echoput, near Apeldoorn. Photograph by A. Louwen, taken during the excavation campaign in 2007 (see chapter 8.1).
17environmental research on barrows
Chapter�2
Environmental research on barrows, an overview so far
In this chapter an overview of previous environmental barrow research is given. This chapter starts with a general overview of the Holocene vegetation history of the Netherlands, followed by a more specific overview of environmental barrow research.
2.1 The vegetation history of the Netherlands in the Holocene
Before looking into detail at barrow landscapes it is useful to provide a sketch of the regional vegetation development during the second part of the Holocene (from the Subboreal period onwards), the period in which barrows were built. This vegetation development is mostly derived from pollen records preserved in peat and lake sediments. The following vegetation development will focus on the central and southern Netherlands, this research’s area of interest (see section 3.2).
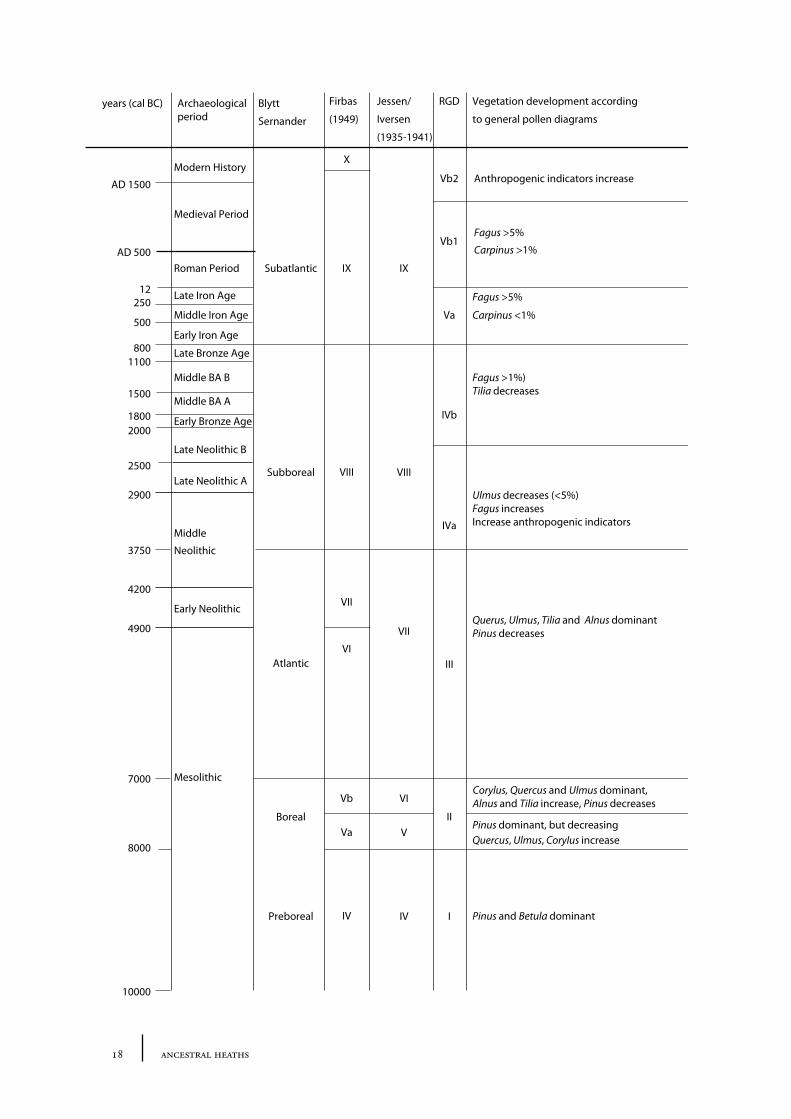
The Holocene is divided into periods based on artefact remains, the vegetation history of the Holocene, however, is divided into climatic zones based on peat stratigraphy (Blytt-Sernander) and on data from pollen cores. Three separate pollen zone descriptive schemes (formulated individually by Firbas, Jessen/Iversen, and the Rijksgeologische� Dienst [RGD, the Dutch State Geological Service]) are commonly used to describe the Holocene vegetation development in the Netherlands (see table 2.1).
The first barrows were built during the Subboreal period. A deciduous forest dominated the Netherlands during the preceding Atlantic period. Quercus, Tilia, Ulmus and� Corylus were the main forest species in the drier regions, with also Fraxinus increasing its presence throughout this period. In the wetter areas Alnus was the dominant species. Pinus, a coniferous tree that had been present in large numbers in the preceding periods, rapidly decreased during the Atlantic and was almost absent in the Netherlands.
During the Subboreal, which correlates with the Neolithic and the Bronze Age for most of the Netherlands and pollen zone VIII (in the schemas of Firbas and Iversen), several changes in vegetation occurred. At its start there is a decline of� Ulmus.� In large parts of Northwest Europe this was a very rapid decline, also referred to as the Ulmus� fall. This decline was not as pronounced in the Netherlands, but still a decrease of a few percentages that can be seen with respect to the Atlantic. Tilia� also� decreased and almost disappeared at the end of the Subboreal, a process that started in the north of the Netherlands and proceeded to the middle and south of the Netherlands (Waterbolk 1954). This period is also characterised by the appearance of Fagus. The Subboreal is also the period where man seriously started to interfere with the landscape. The character of the vegetation changed. Natural forests were cleared for agricultural activities. In some places the forest could recover, but in others a Calluna-heath established
18 ancestral heaths
Blytt
Sernander
Firbas
(1949)
Jessen/
Iversen
(1935-1941)
RGD Vegetation development according
to general pollen diagrams
Vb2 Anthropogenic indicators increase
X
Vb1Fagus >5%
Carpinus >1%
Subatlantic IX IX
Va
Fagus >5%
Carpinus <1%
IVb
Subboreal VIII VIII
IVaMiddle
Neolithic
Early Neolithic VII
AtlanticVI
VII
III
Vb VI
BorealVa V
II
Mesolithic
Preboreal IV IV I Pinus and Betula dominant
10000
8000
7000
3750
1800
4900
Quercus, Ulmus, Corylus increasePinus dominant, but decreasing
Querus, Ulmus, Tilia and Alnus dominantPinus decreases
Corylus, Quercus and Ulmus dominant,Alnus and Tilia increase, Pinus decreases
AD 500Roman Period
AD 1500
Medieval Period
Modern History
years (cal BC)
19environmental research on barrows
itself. Natural forests alternated with a cultivated landscape, such as fields, pasture land and settlements.
The Subatlantic period that followed the Subboreal started around 800 cal BC (when the Subboreal climate deteriorated) and continues to the present day. Fagus�and Carpinus�expanded and Quercus declined.�Tilia�and�Ulmus�have almost disappeared. Herbs became more prevalent, which seemed to be favoured by human influence. Artemisia,�Plantago,�Cerealia and grasses gained importance. In the early Middle Ages, also known as the Dark Ages, the vegetation changed. After the fall of the Western Roman Empire, during the Migration Period (300-600 cal AD), human pressure on the vegetation seemed to lessen. Forests were able to recover in the South and Southeast of the Netherlands, while a concurrent decline of human influence was almost absent in the northern Netherlands (Janssen and Ten Hove 1971, Renes 1988, Bunnik 1999). For example in the loess area in the Netherlands between the Rhine and the Meuse Corylus and Quercus� could expand first, succeeded by Fagus�and Carpinus. In the wetter areas Alnus�was able to expand enormously (Bunnik 1999). During the Merovingian and Carolingian dynasty (ca. 600-900 cal AD) human cultivation activities increased again and in the late Medieval Period most of the natural forest had disappeared due to forest clearing. Due to (agri-) cultural activities, the soil impoverished and Calluna-heath could establish itself at great scale. The heath was exploited (grazing, sod cutting, etc.) and was therefore able to expand. From the 16th century onwards the forest was able to regenerate, mostly due to the planting of trees.�Pinus was planted in enormous amounts in the 19th century, and at present Dutch forests consist of about 20% deciduous forest, 20% coniferous forest and 50% of mixed forest. (Waterbolk 1954, Janssen 1974, Berendsen 2004, Bastiaens and Deforce 2005).
2.2 Environmental research on barrows
2.2.1�An�overview�
There are several ways to investigate the prehistoric landscape in which the barrows were situated. The appearance of a landscape is for a great deal determined by the vegetation that is in it. No understanding of a barrow landscape can be considered complete without knowledge of its vegetation. Palynological analysis is a common way of reconstructing a landscape’s vegetation in the past. In an ideal scenario pollen analysis can be applied to a deposit that has accumulated over time, such as peat or lake mud. The pollen rain that precipitated on the surface was embedded in the deposit as it built up. In this way the peat or the sediment in a lake became an archive of vegetation history for the surrounding area. When pollen precipitates onto a soil surface there is no incorporation by layers built on top of the surface and it is very likely that pollen grains on the surface will be corroded or washed away. However, after construction of a barrow, the surface containing the pollen precipitation was covered and protected from the air, reducing microbiological activity and thus corrosion of the pollen grains. In addition, the tumulus will prevent new pollen from precipitating on the old surface. The old surface under the barrow is often still recognizable as a darker layer and can be sampled for pollen analysis. Besides the old surface, the sods of which the barrow is constructed are also suitable for pollen analysis, since they also contain the upper part of the soil profile (Waterbolk 1954, van Zeist 1967b). This topic will treated more fully in Chapter 4.
Table 2.1. An overview of commonly used pollen zones for the Holocene period and the general vegetation development in the central and southern Netherlands per zone. RGD= Rijks Geologische Dienst.
20 ancestral heaths
Soils in Neolithic barrows were first investigated in Denmark by Müller and Sarauw (Müller 1884, Sarauw 1898). As mentioned in Chapter 1, van Giffen initiated investigations into the environmental aspects concerning barrows in the Netherlands and the first pollen analysis of barrows dates from before World War II. The ideas of van Giffen were carried out and improved upon by Waterbolk (1954). The barrow database, and barrow interpretations, was later enlarged through contributions made by van Zeist (1955), and Groenman-van Waateringe and Casparie (1980). Barrow palynology was practiced mainly in the Netherlands, although barrows in regions outside the Netherlands were also subjected to palynological analyses. For example in Belgium barrows were palynologically investigated by Groenman-van Waateringe (1977) and van Zeist (1963), and in Denmark by Andersen (1988); Averdieck (1980) and Groenman-van Waateringe (1979) investigated several barrows in Germany, Dimbleby and Evans (1974) in England and Groenman-van Waateringe (1983) in Ireland. Knowledge and ideas about barrows and their environment have evolved during the last century. These developments will be discussed in the coming sections.
2.2.2�Pollen�analyses�for�dating�purposes
Palynology was at first primarily used to date peat and sediment sequences. A general reference pollen diagram representing the vegetation history of the Netherlands during the Holocene, based on pollen data from mainly peat and lake deposits, can be divided into pollen zones (see table 2.1). Pollen spectra from undated sediment layers can often be fitted into a certain pollen zone and thus be linked to a certain time period. This method of dating is most reliable when multiple pollen spectra or a local pollen diagram is provided instead of a single pollen spectrum in order to create as much overlap with the reference pollen diagram as possible. In addition, this technique was extended to the dating of various archaeological objects and sites. An object that was found embedded in a sediment can be linked to a certain depth in the pollen diagram obtained from this sediment and therefore to a certain age, when the exact original location of the object in the sediment is known.
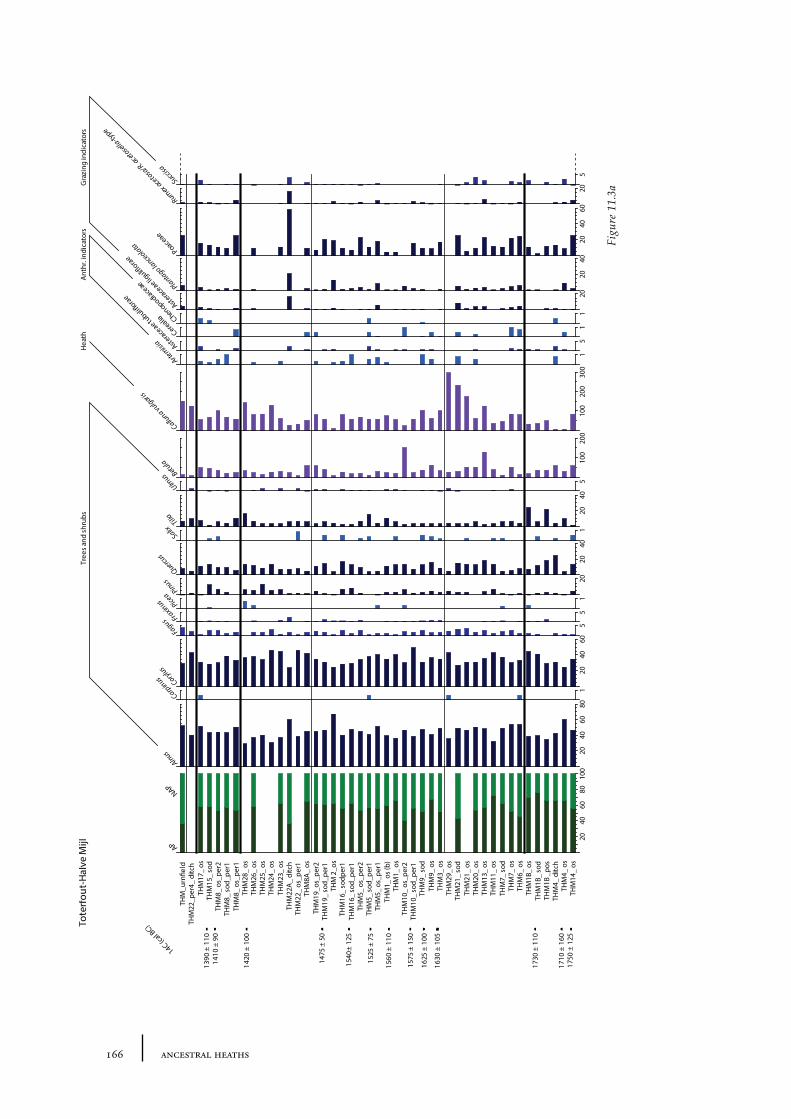
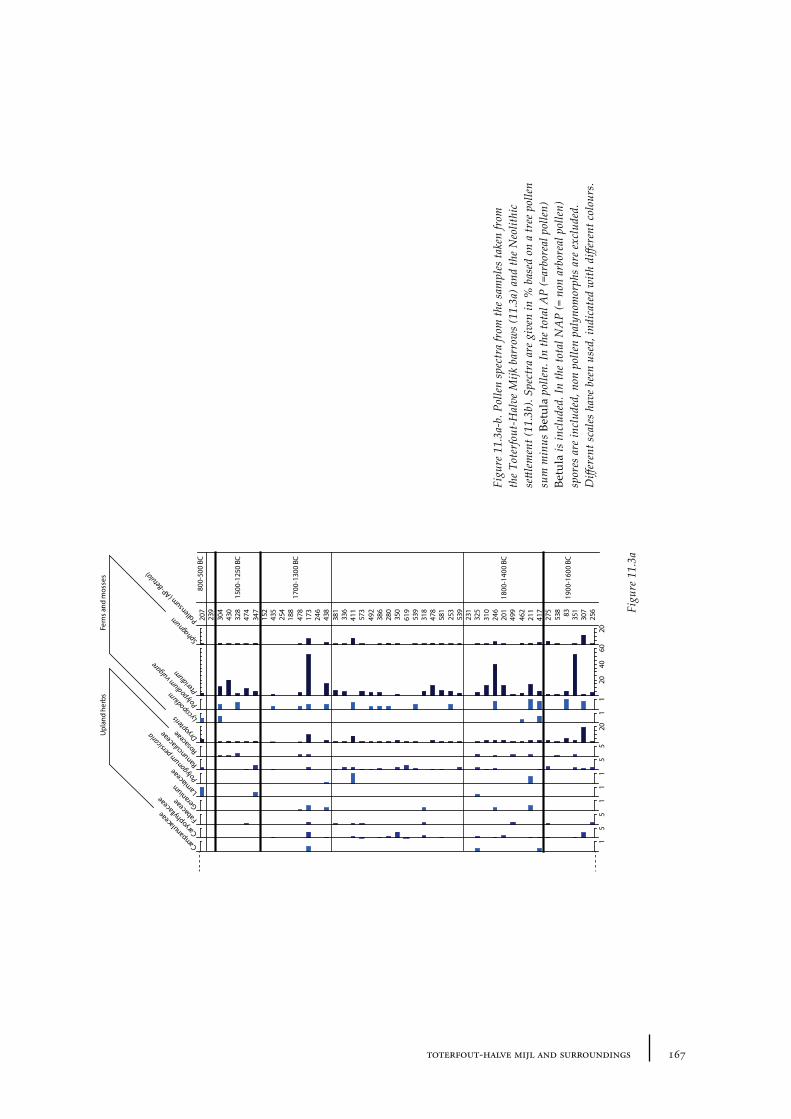
Palynological dating has also been applied to barrow research. When grave goods are absent, dating a barrow is difficult. When Waterbolk first derived palynological data from the old surfaces beneath numerous barrows in the Netherlands, they were used for dating purposes. Two barrows near Apeldoorn, extensively described and discussed in Chapter 8 of this thesis, were first palynogically dated to a pollen zone known to be contemporaneous to the Iron Age. This dating was later confirmed by the radiocarbon dating of charcoal from the ring ditches surrounding the barrows (see Chapter 8). However, dating barrows using palynological data has not always been completely accurate. For example, a large group of barrows at Toterfout-Halve Mijl has been chronologically ordered mostly based on their pollen spectra by Waterbolk (1954). Bourgeois, however, has shown that the chronological sequence of these barrows should probably be different, on the basis of radiocarbon dates and the surrounding features (Bourgeois 2013; see also Chapter 11).
Dating by palynological analysis is a form of relative dating, since chronologic checkpoints from other sources are needed. Presently, absolute dating methods like radiocarbon dating and OSL dating have displaced palynological dating to all intents and purposes. However, the method still finds application on occasion, when no datable material is available.
Besides dating, pollen data have also been used to reconstruct vegetation in the vicinity of the barrows at the time the barrows were built, providing information on the agricultural systems used by prehistoric man. In addition, these palynological analyses were used to show differences in land use (Waterbolk 1954, Van Zeist 1959, 1967a). Two different agricultural systems– the Iversen landnam and Troels-Smith landnam- can be distinguished during the Neolithic. These types of land use are named after the two Danish scientists who first described them. The Iversen landnam is a Neolithic land occupation phase (in the Middle Neolithic B), describing the clearance of the primeval forest by burning and cutting trees. The Iversen landnam was first described by Iversen (1941, 1973), based on the results of palynological analyses of Danish small lakes. The Iversen landnam consists of three phases, which can be recognised in the pollen diagrams as follows:
Phase 1: The first phase represents the actual forest clearance by cutting and burning: at first Ulmus declines, followed by the decrease of Tilia�and�Quercus.�The pioneer tree Betula shows an increase.
Phase 2: This phase corresponds with the agricultural phase, involving grazing and crop cultivation. Anthropogenic and grazing indicators show a maximum; particularly Plantago�lanceolata, but also Cerealia, Poaceae and Rumex acetosella.
Phase 3: The third phase represents the abandonment of the pastures and fields, allowing regeneration of the forest. This is shown by a maximum of Corylus, the increase of mainly Quercus, Fraxinus and Tilia and the decrease of Betula. Anthropogenic and grazing indicators decrease and disappear almost completely.
Troels-Smith introduced a second type of Neolithic occupation in Denmark, prior to the Iversen landnam (Troels-Smith 1953). He found various agricultural indicators, such as cereal pollen, contemporaneous with the Ulmus decline (around 3750 cal BC, see table 2.1). Troels-Smith suggested that the fall of the elm curve reflected pollarding of the trees for the purpose of cattle fodder. Together with the absence of pastures, deduced from very small numbers of Plantago�lanceolata,�Troels-Smith concluded that a farmer culture existed preceding the Iversen landnam, mainly based on small-scale arable farming with livestock kept within enclosures throughout the year.
The investigations and interpretations offered by Iversen and Troels-Smith triggered similar investigations in the Netherlands. In pollen diagrams derived from peats in the province of Drenthe (in the north of the Netherlands) named Bargeroosterveen, Emmen and Nieuw-Dordrecht, the two types of landnam were shown to have occurred (Van Zeist 1959, 1967a). In the period between ca. 3700 cal BC and 2800 cal BC the Ulmus decline can be seen, together with low percentages of Plantago�lanceolata.�The data reflect the type of land use described by Troels-Smith, characterised by small forest clearances and cattle kept within enclosures. In the period after ca. 2800 cal BC an increase of Plantago�lanceolata�can be observed, signalling the Iversen-landnam, with rather large cleared forest areas mostly used for grazing.
Van Zeist compared these pollen diagrams with spectra from Neolithic grave monuments. Grave monuments from three Neolithic cultures were investigated: megalithic tombs built by people from the oldest culture, the Funnel Beaker Culture (FB) (ca. 3400-2900 cal BC, van den Broeke et�al. 2005, 28) and barrows built by people belonging to the later Protruding Foot Beaker Culture (PFB) (ca. 2900-2500 cal BC, van den Broeke et�al. 2005, 28) and the Bell Beaker Culture
22 ancestral heaths
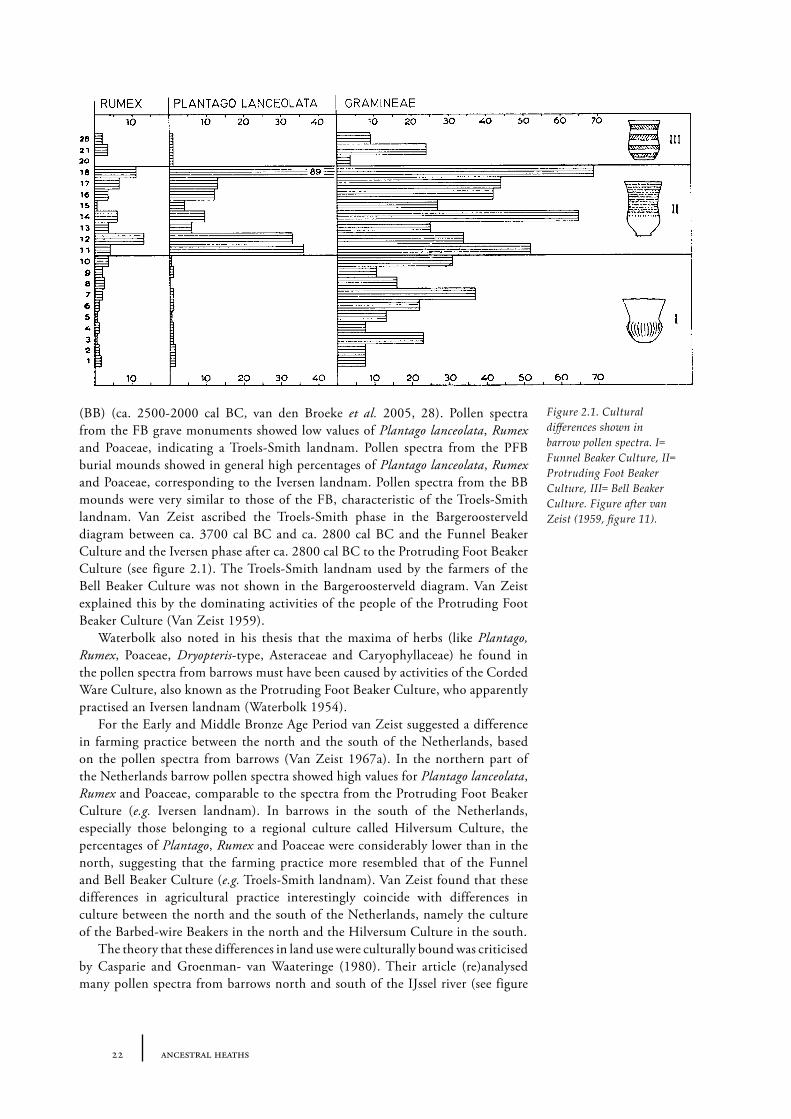
(BB) (ca. 2500-2000 cal BC, van den Broeke et� al. 2005, 28). Pollen spectra from the FB grave monuments showed low values of Plantago lanceolata, Rumex and Poaceae, indicating a Troels-Smith landnam. Pollen spectra from the PFB burial mounds showed in general high percentages of Plantago�lanceolata, Rumex and Poaceae, corresponding to the Iversen landnam. Pollen spectra from the BB mounds were very similar to those of the FB, characteristic of the Troels-Smith landnam. Van Zeist ascribed the Troels-Smith phase in the Bargeroosterveld diagram between ca. 3700 cal BC and ca. 2800 cal BC and the Funnel Beaker Culture and the Iversen phase after ca. 2800 cal BC to the Protruding Foot Beaker Culture (see figure 2.1). The Troels-Smith landnam used by the farmers of the Bell Beaker Culture was not shown in the Bargeroosterveld diagram. Van Zeist explained this by the dominating activities of the people of the Protruding Foot Beaker Culture (Van Zeist 1959).
Waterbolk also noted in his thesis that the maxima of herbs (like Plantago,�Rumex, Poaceae, Dryopteris-type, Asteraceae and Caryophyllaceae) he found in the pollen spectra from barrows must have been caused by activities of the Corded Ware Culture, also known as the Protruding Foot Beaker Culture, who apparently practised an Iversen landnam (Waterbolk 1954).
For the Early and Middle Bronze Age Period van Zeist suggested a difference in farming practice between the north and the south of the Netherlands, based on the pollen spectra from barrows (Van Zeist 1967a). In the northern part of the Netherlands barrow pollen spectra showed high values for Plantago lanceolata, Rumex and Poaceae, comparable to the spectra from the Protruding Foot Beaker Culture (e.g. Iversen landnam). In barrows in the south of the Netherlands, especially those belonging to a regional culture called Hilversum Culture, the percentages of Plantago, Rumex and Poaceae were considerably lower than in the north, suggesting that the farming practice more resembled that of the Funnel and Bell Beaker Culture (e.g. Troels-Smith landnam). Van Zeist found that these differences in agricultural practice interestingly coincide with differences in culture between the north and the south of the Netherlands, namely the culture of the Barbed-wire Beakers in the north and the Hilversum Culture in the south.
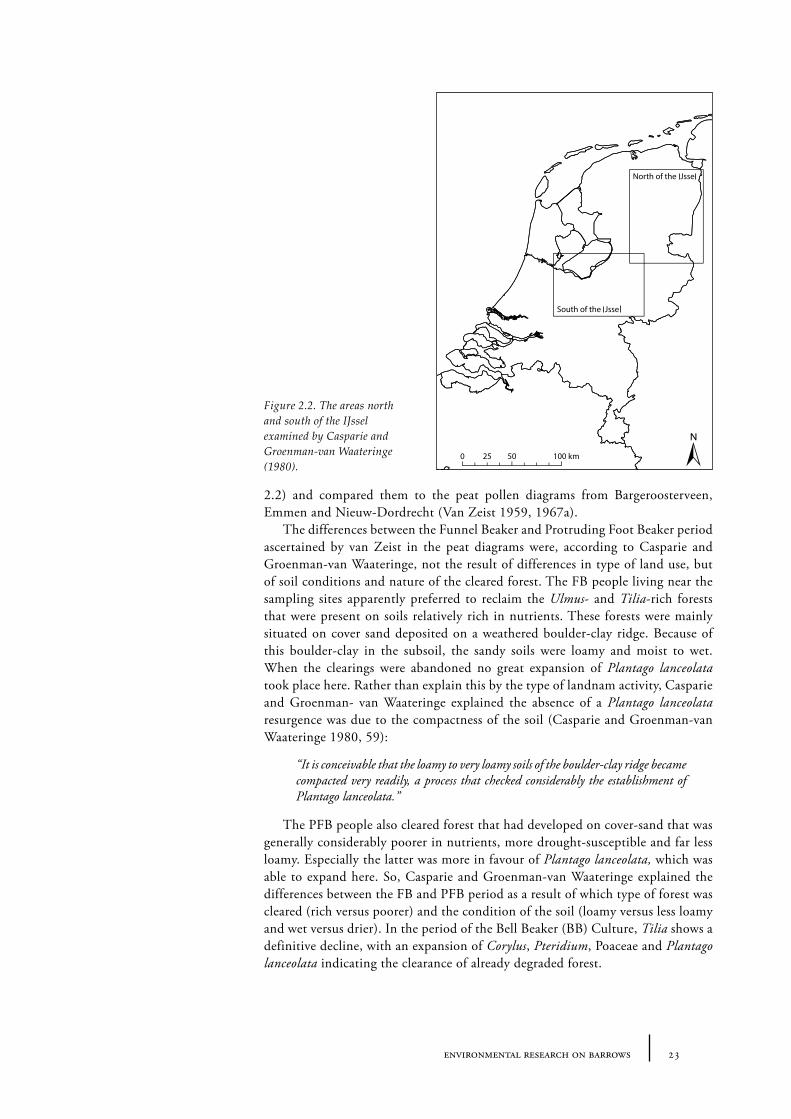
The theory that these differences in land use were culturally bound was criticised by Casparie and Groenman- van Waateringe (1980). Their article (re)analysed many pollen spectra from barrows north and south of the IJssel river (see figure
Figure 2.1. Cultural differences shown in barrow pollen spectra. I= Funnel Beaker Culture, II= Protruding Foot Beaker Culture, III= Bell Beaker Culture. Figure after van Zeist (1959, figure 11).
23environmental research on barrows
2.2) and compared them to the peat pollen diagrams from Bargeroosterveen, Emmen and Nieuw-Dordrecht (Van Zeist 1959, 1967a).
The differences between the Funnel Beaker and Protruding Foot Beaker period ascertained by van Zeist in the peat diagrams were, according to Casparie and Groenman-van Waateringe, not the result of differences in type of land use, but of soil conditions and nature of the cleared forest. The FB people living near the sampling sites apparently preferred to reclaim the Ulmus- and Tilia-rich forests that were present on soils relatively rich in nutrients. These forests were mainly situated on cover sand deposited on a weathered boulder-clay ridge. Because of this boulder-clay in the subsoil, the sandy soils were loamy and moist to wet. When the clearings were abandoned no great expansion of Plantago� lanceolata took place here. Rather than explain this by the type of landnam activity, Casparie and Groenman- van Waateringe explained the absence of a Plantago� lanceolata resurgence was due to the compactness of the soil (Casparie and Groenman-van Waateringe 1980, 59):
The PFB people also cleared forest that had developed on cover-sand that was generally considerably poorer in nutrients, more drought-susceptible and far less loamy. Especially the latter was more in favour of Plantago�lanceolata,�which was able to expand here. So, Casparie and Groenman-van Waateringe explained the differences between the FB and PFB period as a result of which type of forest was cleared (rich versus poorer) and the condition of the soil (loamy versus less loamy and wet versus drier). In the period of the Bell Beaker (BB) Culture, Tilia�shows a definitive decline, with an expansion of Corylus, Pteridium, Poaceae and Plantago�lanceolata indicating the clearance of already degraded forest.
Figure 2.2. The areas north and south of the IJssel examined by Casparie and Groenman-van Waateringe (1980).
24 ancestral heaths
In addition, pollen spectral differences between barrows belonging to the FB and BB period on the one hand (e.g. low values for herbaceous plants, ascribed to the Troels-Smith landnam) and PFB period on the other (e.g. relatively high values for herbaceous plants, ascribed to the Iversen landnam) described by van Zeist (1967a) were not as explicit in Casparie and Groenman-van Waateringe’s results. Within each culture, pollen spectra showed considerable differences, therefore the pollen spectra alone could not be used to culturally isolate a group. The differences van Zeist found in barrow pollen spectra were more likely to be due to dissimilarities in soil type, since all PFB barrows were located on the Drents plateau (Drenthe, northern Netherlands) and the BB barrows were located on the Veluwe (central Netherlands). Casparie and Groenman-van Waateringe did in fact find some differences between barrow pollen spectra from the Drents Plateau (north of the IJssel) and the Veluwe (south of the IJssel). The northern barrow pollen spectra showed an earlier and more pronounced expansion of heath than the southern spectra. These differences were ascribed to differences in the hydrological situation. The northern barrows were nearly all situated on the Drents Plateau, where soils were influenced by the presence of impervious boulder-clay not far below the surface.
In the area south of the IJssel the barrows analysed by Casparie and Groenman-van Waateringe (1980) were situated on the Veluwe. The Veluwe is a landscape consisting of pushed moraines, cover sands and fluvio-glacial material of porous nature, where water seeps down more easily. As a result the soils are much drier than on the Drents Plateau. According to Casparie and Groenman-van Waateringe the forest was therefore probably more open at the Veluwe with a well-developed undergrowth of herbaceous plants sufficient for grazing. Grazing pressure caused a gradually opening up of the woodland, allowing grasses and heath to expand. The research by Casparie and Groenman-van Waateringe showed that differences in land use were not culturally bound. As Casparie and Groenman-van Waateringe concluded:
2.3 Vegetation reconstructions of the barrow environment: open spaces in the landscape
It has become clear from research that most of barrows in the Netherlands were built in open spaces. These open spaces might have been small or large. Waterbolk (1954) mentioned that practically all barrows were built in an open space without deliberate clearance of the area. Van Zeist (1967a) suggested after analysis of pollen data from several Neolithic and Bronze Age barrows in the Netherlands that they were constructed in either small clearings (Troels-Smith landnam) or larger clearings (Iversen landnam). Casparie and Groenman- van Waateringe concluded from their research (1980):
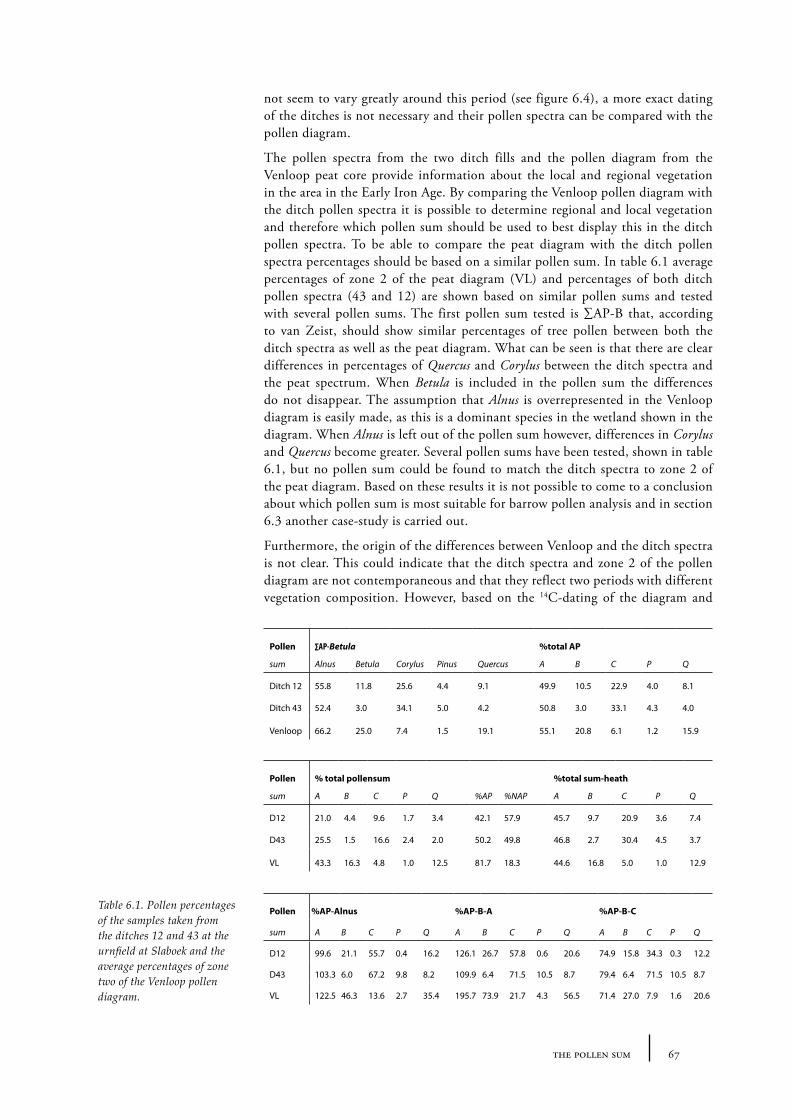
De Kort palynologically investigated several barrows in the Netherlands. For a cemetery complex in North Brabant called Oss-Zevenbergen (see for an extensive description and discussion Chapter 12) he concluded that all barrows he investigated were erected in an open place covered with heath vegetation. This open place was probably already present before the oldest barrow was constructed and continued to be present during the period the barrows were built (e.g. from the late Neolithic until the Iron Age) (de Kort 2009, 166, 169). In another cemetery complex near Slabroek in North Brabant, an urn field that also contained some barrows that probably dated to the Bronze Age, de Kort found that the oldest barrow was built in a small open place with heath vegetation (see also chapter 12). The heath at this open place probably expanded during the Bronze Age when the younger barrows were built (de Kort 2010, 64).
Barrows in regions besides the Netherlands were also found to have been built in open places. Andersen found indications that in the Vroue area, West Jutland (Denmark), Early Neolithic barrows were built in natural woodland with heath patches (Andersen 1994-95). Later on trees became increasingly scarce and open spaces became larger. For Early Bronze Age barrows in Thy, Denmark, Andersen found indications that they were built in a rather treeless landscape, with remnants of woodlands that probably had been in the area some time before the barrows were built (Andersen 1996-97). It has been suggested that burial mounds in southern Sweden were built in a rather open landscape, with forest cover estimated at 20-40%, falling to 10% in the immediate surroundings of the barrow itself (Hannon�et�al. 2008).
The open spaces barrows were built in have mostly been interpreted in terms of prehistoric man’s land use. Let us now focus on the open space itself and its relation to the barrow. First an overview of possible open spaces and their origin will be given, than follows an overview of open spaces in which barrows were built.
2.3.1�An�overview�of�open�spaces
Natural open spaces
The general view is, as has been described in section 2.1, that a closed canopy forest developed in the beginning of the Holocene in Western and Central Europe. When human interference with the landscape, the density of the forest decreased and open spaces were created. There is, however, an alternative hypothesis: a half-open park-like landscape, described by Vera (1997) as a landscape consisting of a continuous grassland with clumps of shrubs and forest. Vera claims that the initial Holocene vegetation of Western and Central Europe was not a closed forest system, but a half-open-park-like landscape. He points out that Quercus�and Corylus would not be able to flower and regenerate in closed forests, while these species were continuously present in considerable numbers in Central and Western Europe since the last ice age. Vera’s suggested type of half-open-park-like landscape was created and maintained by large herbivores, in a process he calls the theory of cyclical vegetation turnover (Vera 1997).
In Vera’s cyclical vegetation turnover, thorny shrubs establish themselves in the grassland. In these clumps of thorny shrubs trees could grow, protected from grazers by the thorns. The trees developed into a forest, which would degenerate
26 ancestral heaths
back into grassland again due to large herbivores and climatic events such as drought and storms. The process could start over again, with the establishment of thorny shrubs in the grassland (Vera 1997).
Mitchell (2005) tested the hypothesis of Vera that large grazers kept the forest open. He compared palynological data of Quercus and Corylus from Ireland, where only two large herbivores were present during the Early Holocene, to that from other European countries with a greater assortment of large herbivores (Mitchell 2005). He found no obvious differences in Quercus/Corylus regenerative progression and concluded that large herbivores would have had little impact on the abundances of Quercus and Corylus. Mitchell also argued that, based on data from small forest hollows in Europe and eastern USA, opening up of the forest canopy was mainly artificial and caused by human activities.
Nevertheless, other researchers join Vera in believing that the natural structure of the northwest European forest in the Early Holocene was probably more open than previously thought. Svenning stated that closed forest would be predominant in ‘normal’ uplands, but with longer-lasting openings (Svenning 2002). These openings would have mainly occurred on floodplains, on calcareous or poor, sandy soil and in the continental interior of northwest Europe. At these locations the appropriate conditions would have existed for the presence of open vegetation like open woodland, scrub, heath and meadows. Fire would probably have been an important agent involved in the maintenance of this vegetation. Bradshaw et�al. also argued that closed forest theory alone is not a perfect model for the Early Holocene vegetation structure (Bradshaw� et� al. 2003). They agreed that closed forest canopy is the dominant vegetation type, but they also argued that some parts of the landscape were open. This openness might have been created and maintained by events like floods, fires and wind throw. A combination of fire and grazing pressure may have created proper circumstances for regeneration of Quercus and Corylus. Whitehouse and Smith discussed that other proxy indicators may provide useful information that contributes to this subject (Whitehouse and Smith 2010). They showed, using beetle records from archaeological and palaeoecological sites in Britain, that the early Holocene was characterized by quite open woodland and that locally open areas may have played an important role. They found little evidence that those open areas were maintained by grazing activity of large herbivores, and proposed that other disturbance factors were probably of more importance.
To conclude, there are numerous indications that the west European Holocene landscape was probably more open than previously thought.
Fabricated open spaces: forest clearance
The landscape started to change rapidly with the onset of prehistoric man’s interference. During the Neolithic, man switched from a hunter-gatherer strategy to an agricultural strategy. Farmers started to plant their own food and began to keep their own animals. This change to crop cultivation and animal husbandry had great impact on the vegetation and consequently on the landscape. Agricultural practise required open spaces for arable fields and livestock too, needed pasture to graze in. Forests were cleared and from the period of around 4100 cal BC, human influence becomes visible in palynological research in the form of cereal pollen grains and weeds from both arable and pasture land (Louwe Kooijmans 1974, Out 2009, Chapter 8 in this thesis). From 3000 cal BC there is a pronounced human impact on the environment. Both agriculture and stock breeding were practised on a large scale. For agriculture open space was needed on the most
27environmental research on barrows
fertile grounds. Forest areas were cleared, notable in palynological records by the rapid decline in trees, the increase of herbs growing in open vegetation and indicators for cultivation, such as cereal pollen (Louwe Kooijmans 1974).
The influence of human activity on the landscape was mainly notable in pollen spectra by the presence of anthropogenic indicators (Behre 1986). Bakker for example, reconstructed the emergence and expansion of agriculture on the Drenthe Plateau (eastern Netherlands) by using the indicator-species approach in combination with the use of modern pollen/land-use relationships (Bakker 2003). Bakker demonstrated that the first small-scale arable farming and livestock foddering took place on the Drenthe Plateau in the Subboreal (4050-3450 cal BC, according to Bakker 2003). An increase of Poaceae, Cyperaceae, Calluna,�Plantago�lanceolata�and Rumex�acetosa-type�indicate the presence of various types of grass-rich vegetation, probably maintained by livestock. The appearance of Cerealia indicates the presence of arable fields. In the following phase (3450-2600 cal BC, Bakker 2003) more widespread clearances occurred, especially in the rich and higher forest. The further increase of Cerealia indicates the increased importance of arable fields.
After a period of decreased human influence on the vegetation during 2600-1770 cal BC (Bakker 2003), a more extensive clearance of the forest and their replacement by agricultural fields can be seen in the later phase of the Subboreal (1770-800 cal BC, Bakker 2003). Cleared forest areas could be used for crop cultivation for several years until the soil was exhausted. On these fallow fields grasses were able to expand and could be used as pasture (Groenman-van Waateringe�et�al. 1968). Grazing animals prevented the forest from regenerating and besides grasses heath was able to establish itself on the abandoned fields. Bakker (2003) showed that in the Subatlantic (800 cal BC-1500 cal AD), the exhausted and abandoned fields on the Drenthe Plateau were dominated by Calluna and extensive heath fields dominated the landscape. Heath was also grazed and maintenance and expansion of the heath was ascertained. The maintenance of these heath areas will be further discussed extensively in Chapters 8-13. Forest clearance might also have taken place for the sole purpose of providing pasture for grazing.
Forest clearings could have been accomplished by tree felling. Felled wood and other vegetation from the forest clearances could have been used as raw material, as fuel and served to cattle. As a raw material wood could serve as construction material for several structures in a settlement, such as houses, sheds, fences and palisades. Bakels for example showed that Linearbandkeramik settlements in the southern Netherlands (ca. 5300-4900 cal BC) used large quantities of wood. For a settlement of 200-250 houses that were built over a period of about 400 years, a woodland area of 50-1000 ha was needed (Bakels 1978). Wooden structures have also been found in association with barrows. Barrows were for example often encircled by wooden posts in the form of palisaded ditches (Late Neolithic), widely spaced post circles (1800-1400 cal BC) and closely spaced post circles (1700-1300 cal BC) (Bourgeois 2013, 34-36). Besides its use as fencing, wood was also used for the pyre when a body was cremated and in some cases a body was buried in a wooden coffin or a burial chamber constructed of wood (Bourgeois 2013).
Another method of forest clearing is burning. The deliberate use of fire to manipulate the vegetation in prehistory has been suggested by several authors (Mellars 1976, Simmons and Innes 1987, 1996a). Simmons and Innes suggest that fires were a deliberate tactic for resource management as early as the Mesolithic (Simmons and Innes 1996b). The resultant opening up of the landscape would have facilitated hunting by improving the sight and/or making the landscape more attractive for certain game species.
28 ancestral heaths
A combination of cutting and burning wood is applied in the so-called slash and burn agriculture. The forest is felled and the wood is left to dry, to be later burned. With this technique the soil is mixed with ash, enhancing the soil’s fertility for crop cultivation. It has been suggested that slash and burn agriculture was already taking place in the Neolithic, as Iversen connected Neolithic forest clearance (e.g. Iversen landnam, see section 2.2.3) with slash and burn (Iversen 1941). Large amounts of charcoal in soil samples may be taken as indication of the use of fire. Odgaard suggests that charcoal layers found in soil samples indicate the use of fire in clearing woodland (Odgaard 1994).�Andersen mentions deformed tree pollen grains found in Neolithic barrow soil samples (Andersen 1994-95). The deformed tree pollen grains were interpreted as an indication that trees had been felled and burned, when lying on the ground (Andersen 1992, 1994-95). However, deformed pollen grains were mixed with non-deformed herbaceous pollen grains, indicating that regeneration of the burnt area had already started. Therefore, in this case burning of the trees had already taken place sometime before the barrows were built. In some barrows in the north of the Netherlands high concentrations of charcoal particles were found, indicating that the local vegetation was burned intentionally before the barrow was built (Casparie and Groenman-van Waateringe 1980). Hannon et�al. (2008) also found charcoal particles in most of the barrows they investigated on Bjäre Peninsula, southern Sweden. They concluded that slash and burn agriculture was practised in the area.
Open spaces, whether created by man or by nature, were present in the Neolithic landscape. Since the Neolithic, man’s interference with the landscape grew in range and magnitude. Forests were cleared and over time the vegetation became more and more open. During the Neolithic period erecting barrows in open spaces was already an established practise. Choice in open spaces was in all likelihood limited at that time, although the landscape may have been more open than previously thought (see section 2.3.1). In the Bronze and Iron Ages, the availability of open space was certainly greater. However, what do we know about the open spaces in which a barrow was set? Open spaces were created by man, but where these open spaces also chosen as building site for a barrow?
Barrows in arable fields
Cleared forest areas, mostly used for agriculture (see section 2.3.1), may have been chosen as sites for constructing barrows in. Some barrows were probably built on arable land that had recently or since a longer period been abandoned. Casparie and Groenman-van Waateringe (1980) found that, especially in the northeast of the Netherlands (Drenthe; see figure 2.3), the open spaces where barrows are placed were previously used as arable land, and that they were probably already long abandoned before the barrows were built. The open spots might originally have been cleared for agricultural purposes, but at the time the barrows were built the agricultural fields were no longer in use. In the central Netherlands (Veluwe, Gooi and Utrechtse Heuvelrug; see figure 2.3) indications for arable land are scarce. Casparie and Groenman-van Waateringe (1980) noted the difficulty in establishing with certainty whether an area had been used for crop cultivation, but concluded that in general, barrows were seldom constructed on or in the vicinity of arable land then in use.
Research outside the Netherlands has shown that barrows were not often built on arable land. Andersen (1994-95) found indications that mounds in Denmark were often built at sites that were less intensively exploited than areas in the near
29environmental research on barrows
vicinity. Pollen spectra from some barrows in the Vroue area, (West Jutland, Denmark) dating to the Middle Neolithic, showed traces of agriculture, but on the whole the pollen spectra from barrows in the Vroue area showed no evidence of agricultural practice. In Thy (West Jutland, Denmark) Andersen concluded that the Early Bronze Age barrows were built in pastureland and that only some of the barrows were built in recently cleared coppice wood that had been used for cereal cultivation prior to the barrow building. Lawson et� al. suggests that there seems to be a correlation between soils and the distribution of barrows in Norfolk (Southeast England), where barrows were placed on agriculturally poor, light soils (Lawson� et� al. 1981). Altogether there seems to be a preference for building a barrow on a location that had not been used as arable land recently. It has even been suggested that barrows were preferably built on marginal land, so that no (economic) valuable land that could be used for cultivation was wasted (Ovrevik 1990, Field 1998). However, as Downes mentioned, this marginal land might have been very useful for other purposes (boggy ground could have served as source for fuel for example) and not have been as insignificant as assumed (Downes 1994)
Barrows in pastoral zones
The change in the Neolithic to a more agricultural way of living also included the raising of livestock. Farming communities became more and more dependent on livestock to provide meat, dairy products, manure and wool, leather or other raw materials, as well as for pulling ploughs. Livestock needed pasture for grazing, at least for part of the year. They might have been grazing in natural open places in the forest. Groenman–van Waateringe found, however, that a Neolithic farmer had to open up the forest, since woodland composed of less than 30% grasses was not suitable for grazing (Groenman-van Waateringe 1993). Adams also mentioned that forest cover needed to be less than 50% (Adams 1975). Forests were cleared
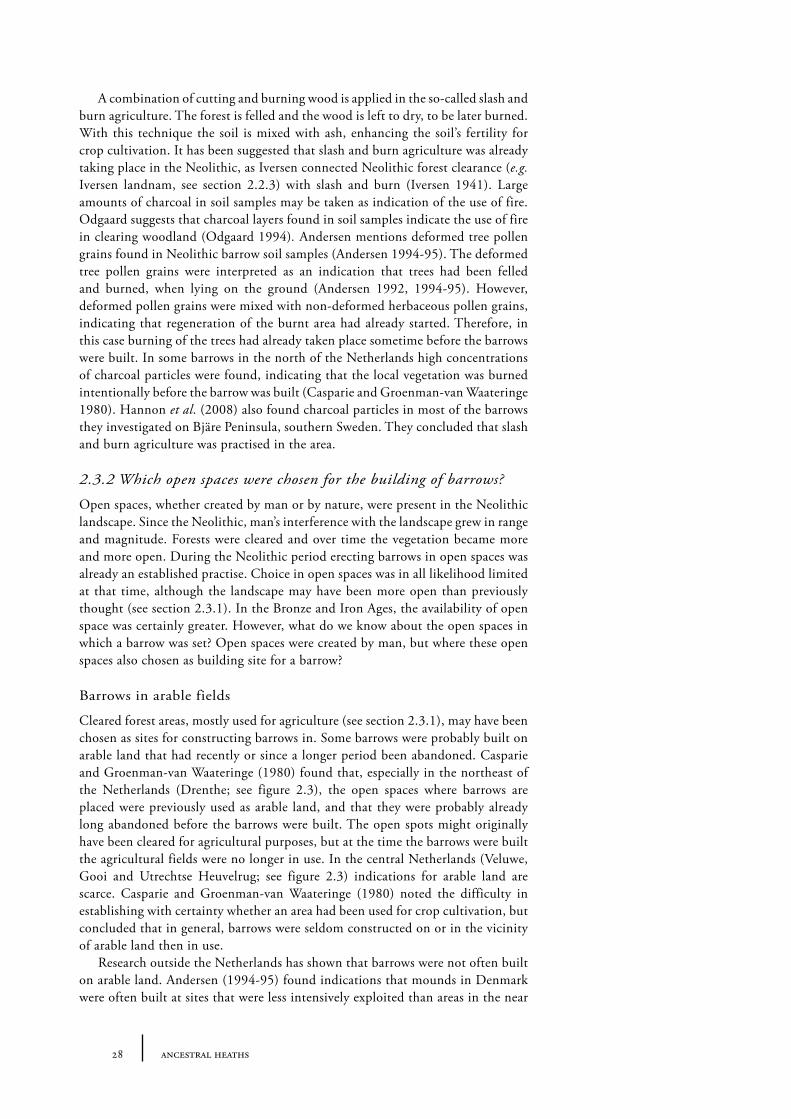
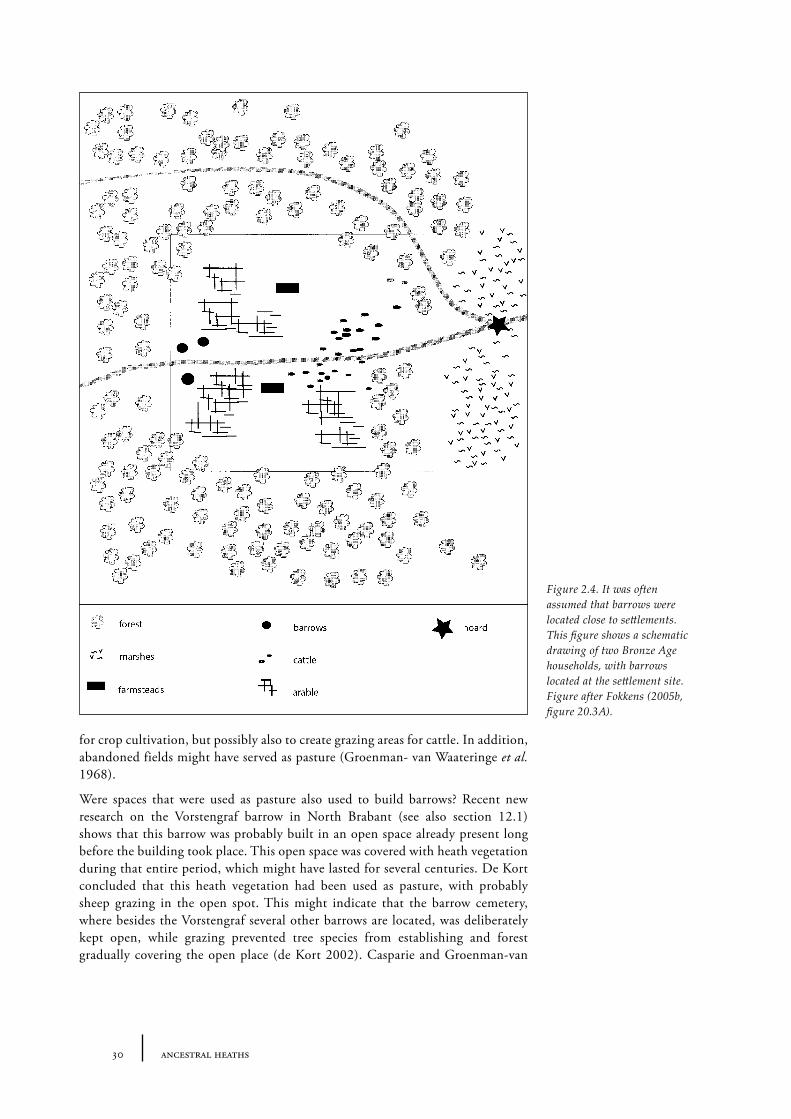
Figure 2.3. The Drenthe, Veluwe, Gooi, and Utrechtse Heuvelrug regions.
30 ancestral heaths
for crop cultivation, but possibly also to create grazing areas for cattle. In addition, abandoned fields might have served as pasture (Groenman- van Waateringe�et�al. 1968).
Were spaces that were used as pasture also used to build barrows? Recent new research on the Vorstengraf barrow in North Brabant (see also section 12.1) shows that this barrow was probably built in an open space already present long before the building took place. This open space was covered with heath vegetation during that entire period, which might have lasted for several centuries. De Kort concluded that this heath vegetation had been used as pasture, with probably sheep grazing in the open spot. This might indicate that the barrow cemetery, where besides the Vorstengraf several other barrows are located, was deliberately kept open, while grazing prevented tree species from establishing and forest gradually covering the open place (de Kort 2002). Casparie and Groenman-van
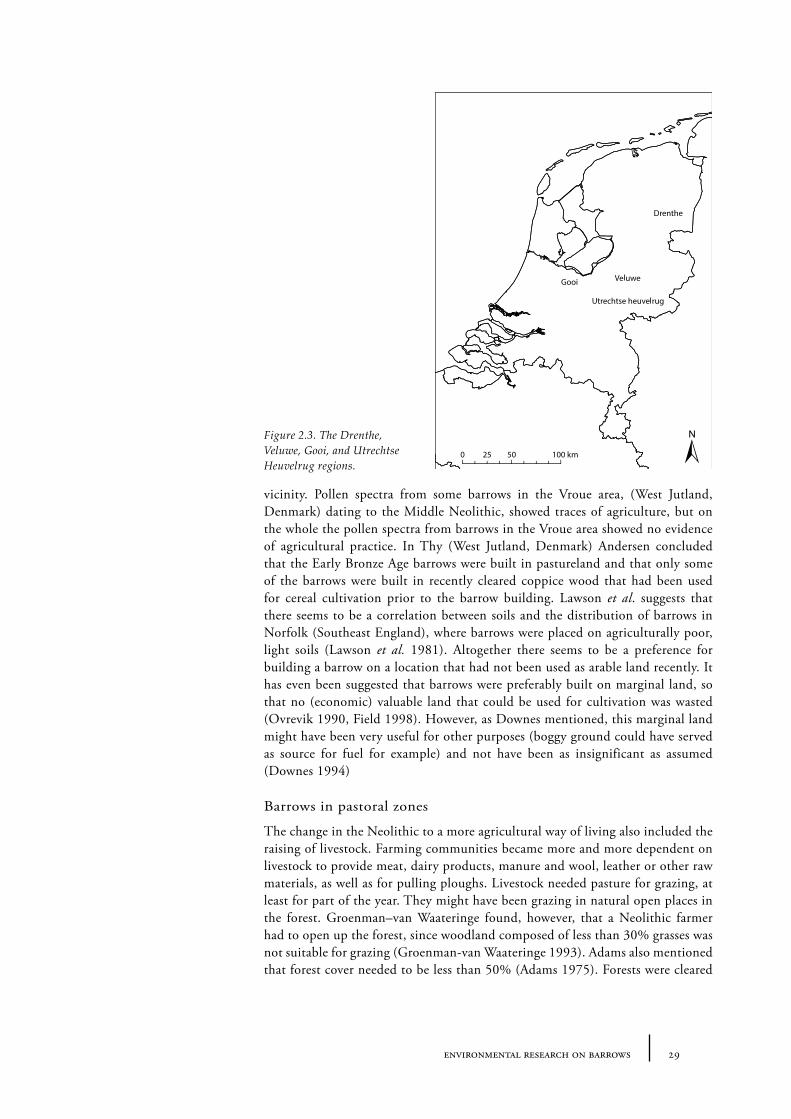
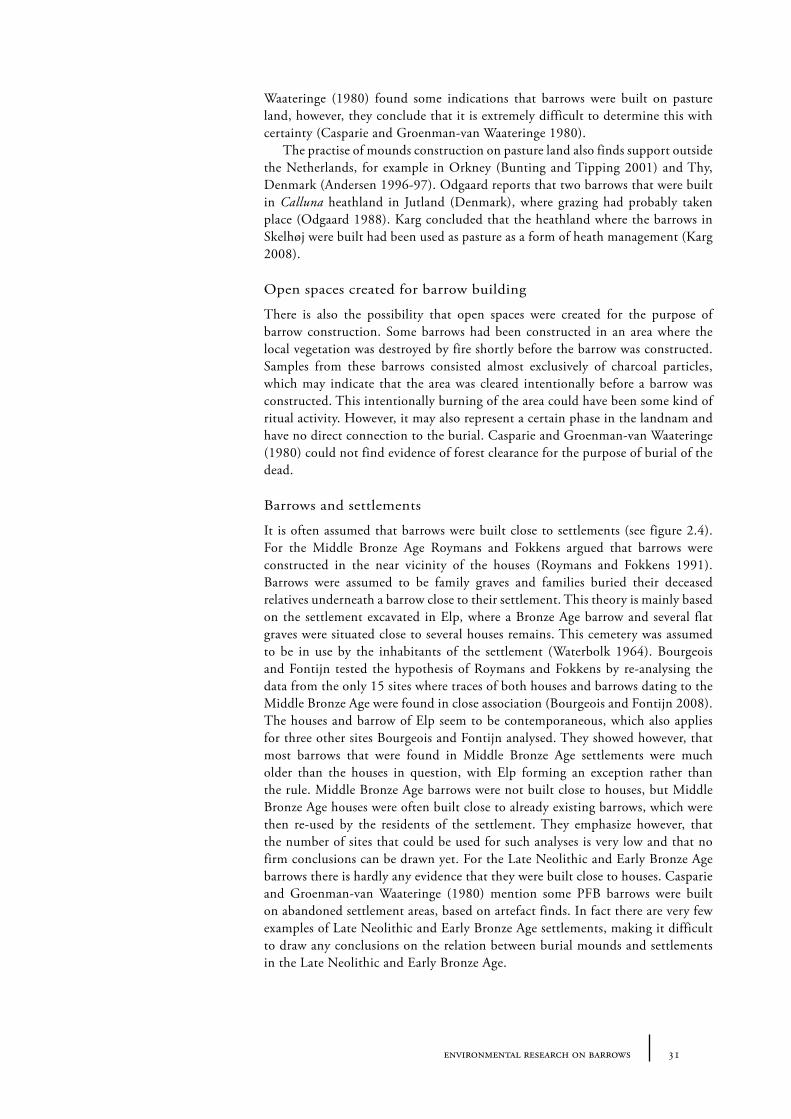
Figure 2.4. It was often assumed that barrows were located close to settlements. This figure shows a schematic drawing of two Bronze Age households, with barrows located at the settlement site. Figure after Fokkens (2005b, figure 20.3A).
31environmental research on barrows
Waateringe (1980) found some indications that barrows were built on pasture land, however, they conclude that it is extremely difficult to determine this with certainty (Casparie and Groenman-van Waateringe 1980).
The practise of mounds construction on pasture land also finds support outside the Netherlands, for example in Orkney (Bunting and Tipping 2001) and Thy, Denmark (Andersen 1996-97). Odgaard reports that two barrows that were built in Calluna�heathland in Jutland (Denmark), where grazing had probably taken place (Odgaard 1988). Karg concluded that the heathland where the barrows in Skelhøj were built had been used as pasture as a form of heath management (Karg 2008).
Open spaces created for barrow building
There is also the possibility that open spaces were created for the purpose of barrow construction. Some barrows had been constructed in an area where the local vegetation was destroyed by fire shortly before the barrow was constructed. Samples from these barrows consisted almost exclusively of charcoal particles, which may indicate that the area was cleared intentionally before a barrow was constructed. This intentionally burning of the area could have been some kind of ritual activity. However, it may also represent a certain phase in the landnam and have no direct connection to the burial. Casparie and Groenman-van Waateringe (1980) could not find evidence of forest clearance for the purpose of burial of the dead.
Barrows and settlements
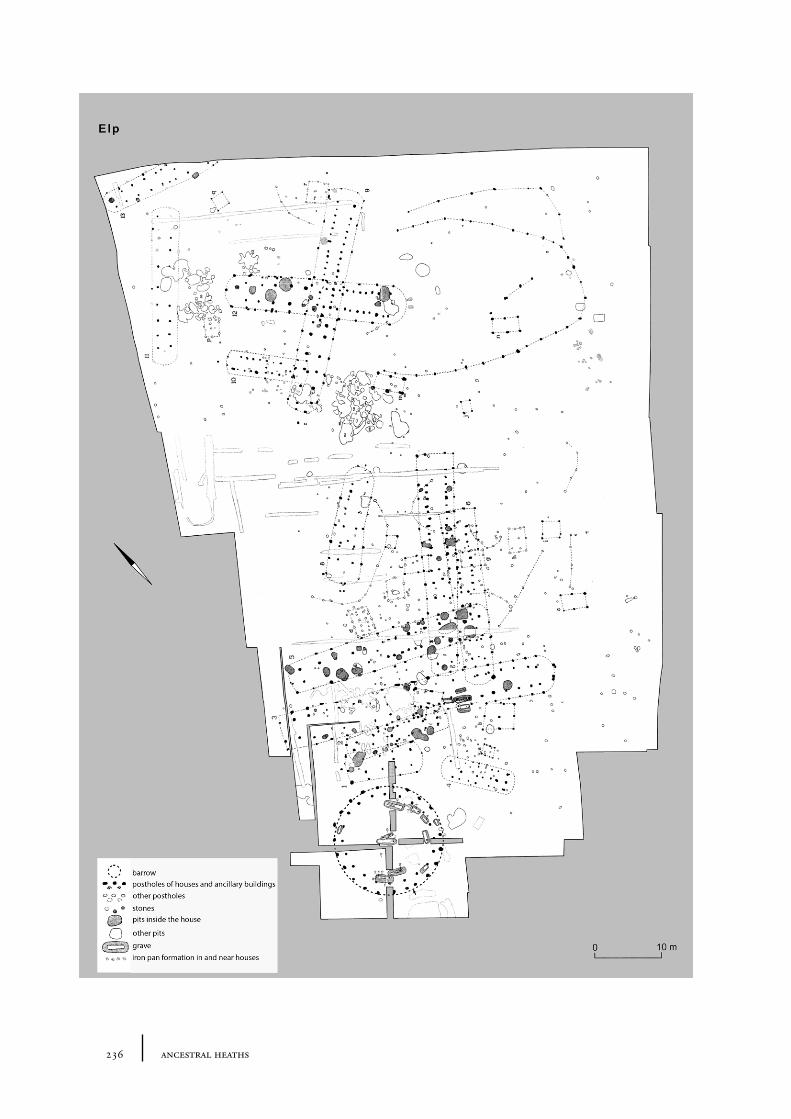
It is often assumed that barrows were built close to settlements (see figure 2.4). For the Middle Bronze Age Roymans and Fokkens argued that barrows were constructed in the near vicinity of the houses (Roymans and Fokkens 1991). Barrows were assumed to be family graves and families buried their deceased relatives underneath a barrow close to their settlement. This theory is mainly based on the settlement excavated in Elp, where a Bronze Age barrow and several flat graves were situated close to several houses remains. This cemetery was assumed to be in use by the inhabitants of the settlement (Waterbolk 1964). Bourgeois and Fontijn tested the hypothesis of Roymans and Fokkens by re-analysing the data from the only 15 sites where traces of both houses and barrows dating to the Middle Bronze Age were found in close association (Bourgeois and Fontijn 2008). The houses and barrow of Elp seem to be contemporaneous, which also applies for three other sites Bourgeois and Fontijn analysed. They showed however, that most barrows that were found in Middle Bronze Age settlements were much older than the houses in question, with Elp forming an exception rather than the rule. Middle Bronze Age barrows were not built close to houses, but Middle Bronze Age houses were often built close to already existing barrows, which were then re-used by the residents of the settlement. They emphasize however, that the number of sites that could be used for such analyses is very low and that no firm conclusions can be drawn yet. For the Late Neolithic and Early Bronze Age barrows there is hardly any evidence that they were built close to houses. Casparie and Groenman-van Waateringe (1980) mention some PFB barrows were built on abandoned settlement areas, based on artefact finds. In fact there are very few examples of Late Neolithic and Early Bronze Age settlements, making it difficult to draw any conclusions on the relation between burial mounds and settlements in the Late Neolithic and Early Bronze Age.
32 ancestral heaths
On the one hand one could expect that barrows were placed close to a settlement, where one lived close to one’s deceased ancestors. On the other hand, the place a burial mound was located in could be seen as a ritual and/or sacred area that would be kept separate from the world of the living.
Barrows were built in open spaces in the forest. It is likely that open spaces in Neolithic times were smaller than in later periods, since prehistoric man created more and more openness in the forest during the Holocene. However, there is not much known about the size of the open places that were used to build burial mounds. Sods were used to construct a burial mound. These sods were most likely taken from the near surroundings of the place where the barrow was planned (Waterbolk 1954, van Zeist 1967a). This suggests a larger open place was necessary than just the size of the barrow. Jonassen concludes that in a forest non arboreal pollen (NAP) shows values of approximately 10%, but that a few hundred metres from the forest values rise up to about 100% NAP. Spectra with NAP of 100-500% could indicate an open landscape in a forested area with forest at a distance of about 1 km (Jonassen 1950, 71-72). Waterbolk (1954) estimated the size of the open space around the Neolithic barrows at a few to tens of hectares. De Kort estimated in his MA-thesis that the size of the open space that was needed to take sods from to build the Vorstengraf barrow in Oss was about 1.5 ha (de Kort 1999; see also Chapter 12).
Conclusions
A large amount of vegetation data of barrows is available, as has been described in the previous paragraphs. The data that informs us on how the barrow landscape looked like is still limited, however, and many questions about the barrow environment remain. The next chapter will be on this subject.
33barrow research, missing data
Chapter�3
Barrow research, missing data
3.1 Research questions
The barrows of the Netherlands have been the source for many reconstructions of prehistoric local vegetation. Barrows were built in open spaces, in areas that could have been used for several purposes before the construction of the barrow (see previous chapter). And yet, what the total landscape around the barrow looked like during the barrow’s construction, and the history of the area prior to the barrow’s erection, represents a great lacuna in the history of barrow research. This lack prompts the first research question:
What did a barrow landscape look like and what was the vegetation (history) around barrows?
Was the origin of the open space (e.g. how the open space originated and its original function) influential, affecting the builder’s choice on the barrow’s setting? Hardly any evidence supports the idea that the barrows were built in areas that were cleared for burial rite activities. The open place that a burial mound was raised in probably had a longer existence as an open space, before becoming the site of a burial mound. It might have been used for crop cultivation or as pasture, or the open space might have served as a settlement location. It has been suggested that the barrow builders had a preference for ancestral grounds, land that has been used by their ancestors. In several cases indications have been found that barrows were built on a location with a history of pasture (see section 2.3.2). This conscious decision, if true, suggests there might be a relation between barrows and pastoral zones. The second research question has been formulated as follows:
Were barrows built on ancestral grounds? What is the relationship with pastoral zones?
In addition to our ignorance on the origin of open spaces, what also is unknown is the size of the open spaces. The size of the open space is important for the understanding of the role of barrows in the landscape, for knowing the size of the open space tells us something about the visibility of the burial mound and the barrow landscape: Were they built in small open spaces with a short distance to the forest, where surrounding forest probably prevented the sight from and towards the mound? Alternatively, were they built in large open areas, so they were well visible from the environment and offered a good view towards the surroundings? In addition, the size tells us about the method by which it was cleared and the�energy requirements in maintaining the open space.�
1.
2.
34 ancestral heaths
What was the size of the open space barrows were constructed in and what was the distance to the forest?
The previous research questions lead to the last research question, concerning the role of barrows in the landscape.
What was the role of barrows in the landscape? How can the history of the barrow environment be linked to that of the natural and cultural landscape in the surroundings?
Since there is a public interest in knowing more about barrows (see Chapter 1), an additional research goal can be appended to the research questions described above:
Supplying Staatsbosbeheer and other authorities with advice and suggestions, to aide in reconstructing the original environment around barrows for purposes of tourism.
3.2 Research area
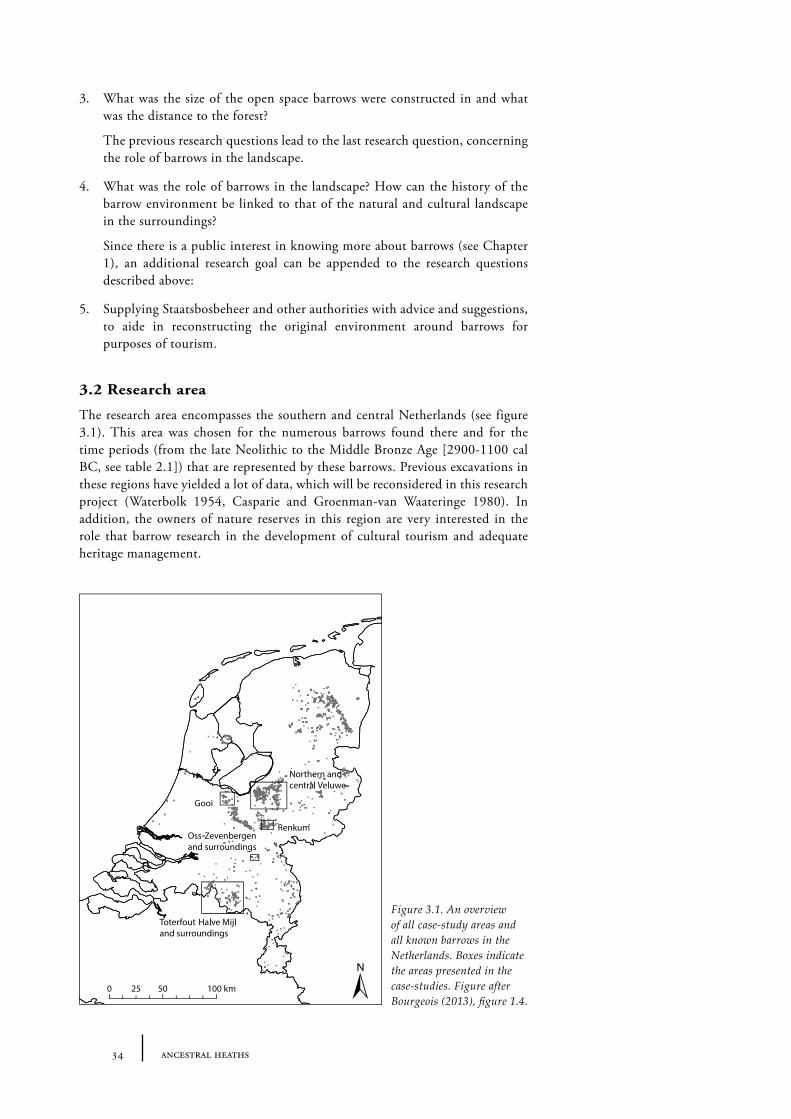
The research area encompasses the southern and central Netherlands (see figure 3.1). This area was chosen for the numerous barrows found there and for the time periods (from the late Neolithic to the Middle Bronze Age [2900-1100 cal BC, see table 2.1]) that are represented by these barrows. Previous excavations in these regions have yielded a lot of data, which will be reconsidered in this research project (Waterbolk 1954, Casparie and Groenman-van Waateringe 1980). In addition, the owners of nature reserves in this region are very interested in the role that barrow research in the development of cultural tourism and adequate heritage management.
3.
4.
5.
Figure 3.1. An overview of all case-study areas and all known barrows in the Netherlands. Boxes indicate the areas presented in the case-studies. Figure after Bourgeois (2013), figure 1.4.
35barrow research, missing data
3.3 Research methods
Below a brief overview is given of the methods used to answer the research questions. The methodology is further discussed in detail in part two of this thesis (Chapters 4-7).
Vegetation reconstructions (RQ1) were made using data derived from pollen analyses taken from barrow sites. These environmental reconstructions provide information about the prehistoric land-use that was in practice before and at the time the barrows were built (RQ 2). Extant data sets were explored and reconsidered in five case-studies (Chapters 8-12). To expand the original data sets additional sampling of barrows was undertaken as well (Chapters 8 and 12). In addition to single pollen spectra, pollen diagrams from the soils underneath the barrows were made. From these diagrams vegetation development in the barrow landscapes through time could be reconstructed. Despite possible factors of disturbance (see Chapter 5), buried mineral soils appear to be suitable for pollen analysis, as has been demonstrated by past researches. For example in Harreskov, Jutland, where Odgaard and Rostholm obtained a pollen spectrum from a fossil soil found under a barrow (Odgaard and Rostholm 1987). The diagram showed a clear vegetation development, corresponding to the development shown by a peat diagram. Calibration of these pollen diagrams is necessary to determine the time-depth relation. Until present a calibration value of 10 cm per 300 years was used, defined by Dimbleby, based on a buried soil in Suffolk (East of England; Dimbleby 1985). A calibration based on pollen diagrams of Dutch Pleistocene sandy soils with known age is necessary for this research. The necessity of this calibration is further explained and discussed in Chapter 5. Besides pollen diagrams, single pollen spectra were used to compare the ancient surface data from clusters of barrows of differing ages belonging to one barrow group.
Barrows were constructed with sods, probably taken from the immediate vicinity of the barrow. The number and size of these sods that were used to build the barrow can provide information about the minimum size of the open area around the barrow. Pollen data from sods were compared to pollen data from the old surface, to ascertain whether the sods were taken in the immediate surroundings of the barrow (Chapter 7).
The vegetation reconstructions undertaken provide information about the size of the open spot. The ratio of arboreal to non-arboreal pollen was used to estimate the distance of the barrow to the forest edge (Chapter 7). To refine these reconstructions, a recent open area surrounded by forest with known vegetation cover was sampled at increasing distances from the forest border. These pollen spectra were used to calibrate the barrow pollen data.
The answers to research questions 1, 2 and 3 provide the foundation from which RQ 4 can be posed. To understand the role of the barrows in the landscape it is necessary to know what the landscape looked like and what vegetation was present at and around the barrow site prior to and at the time the barrows were built (RQ1). To link the barrow landscape to the natural and cultural surroundings, the origin of the open area, and what it was used for, should be reconstructed (RQ2).
36 ancestral heaths
The reconstruction of the size of the open area (RQ3) gives valuable information about the role of barrows in a wider landscape, while providing welcome insights on the visibility and impact of a barrow on its surroundings (chapter 13).
RQ5:�Cultural�tourism
To reconstruct barrows and their original environments in nature reserves requires a detailed vegetation history of the barrow landscape. The outcomes of this thesis research will provide the owners of these areas with information that they may use to include the barrows in their management and development of the nature reserve areas (Chapter 14).
Part Two
Methodology
The methodology of palynological research can be rather complicated and requires some exposition before palynological results can be interpreted appropriately. The technique of sampling a barrow and its surroundings, and the chemical analysis of the soil samples, is described in Chapter 4. Vegetation reconstruction of the barrow’s locale does not follow as a matter of course from the soil samples taken from those barrows. The theory underpinning the palynological research of soil profiles is discussed in Chapter 5. The expression of palynological data in percentages is common to palynology, enabling comparison of different sites and time series with one another. These percentages are fractions of an arbitrarily chosen pollen sum. Which pollen sum will be used in this research and the theory behind this choice is explained in Chapter 6. One of the main research questions concerns the size of the open place a barrow was built in. Chapter 7 discusses three methods that can be used to determine the extent of the open area around a barrow.
pollen rain
old surface
sod cutting
39sampling and treatment of soil samples
Chapter�4
Sampling and treatment of soil samples
4.1 The sampling of barrows
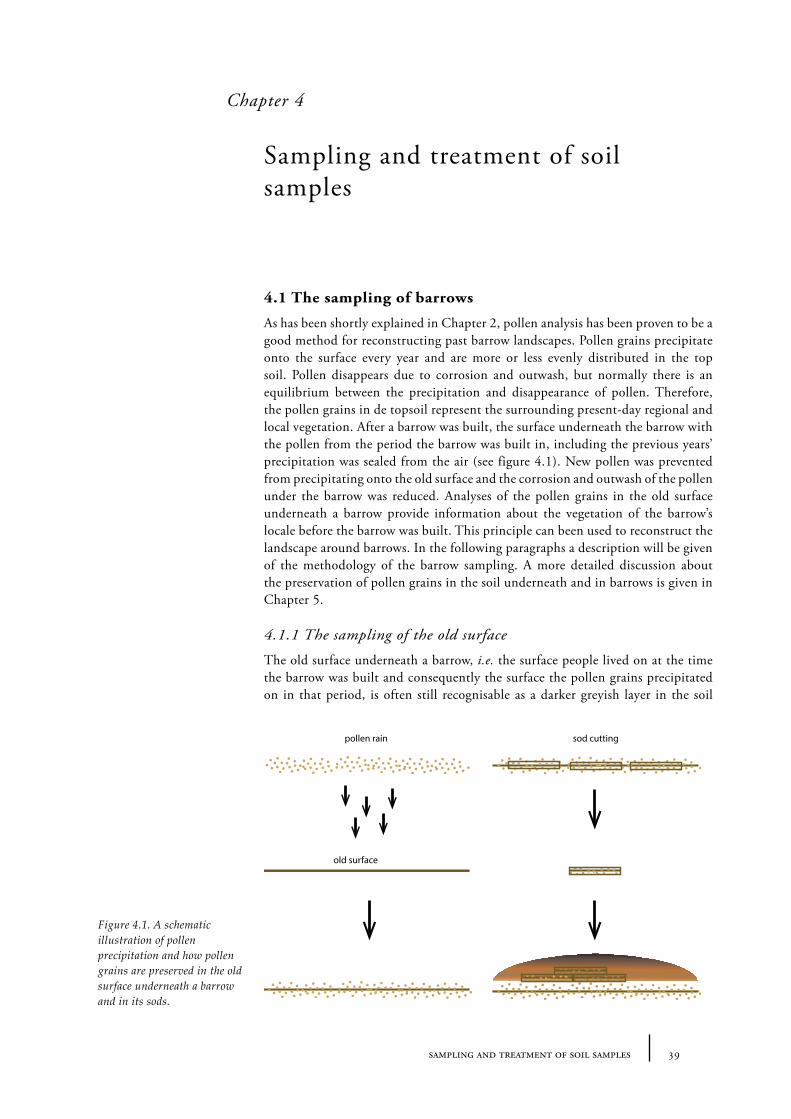
As has been shortly explained in Chapter 2, pollen analysis has been proven to be a good method for reconstructing past barrow landscapes. Pollen grains precipitate onto the surface every year and are more or less evenly distributed in the top soil. Pollen disappears due to corrosion and outwash, but normally there is an equilibrium between the precipitation and disappearance of pollen. Therefore, the pollen grains in de topsoil represent the surrounding present-day regional and local vegetation. After a barrow was built, the surface underneath the barrow with the pollen from the period the barrow was built in, including the previous years’ precipitation was sealed from the air (see figure 4.1). New pollen was prevented from precipitating onto the old surface and the corrosion and outwash of the pollen under the barrow was reduced. Analyses of the pollen grains in the old surface underneath a barrow provide information about the vegetation of the barrow’s locale before the barrow was built. This principle can been used to reconstruct the landscape around barrows. In the following paragraphs a description will be given of the methodology of the barrow sampling. A more detailed discussion about the preservation of pollen grains in the soil underneath and in barrows is given in Chapter 5.
4.1.1�The�sampling�of�the�old�surface
The old surface underneath a barrow, i.e. the surface people lived on at the time the barrow was built and consequently the surface the pollen grains precipitated on in that period, is often still recognisable as a darker greyish layer in the soil
Figure 4.1. A schematic illustration of pollen precipitation and how pollen grains are preserved in the old surface underneath a barrow and in its sods.
40 ancestral heaths
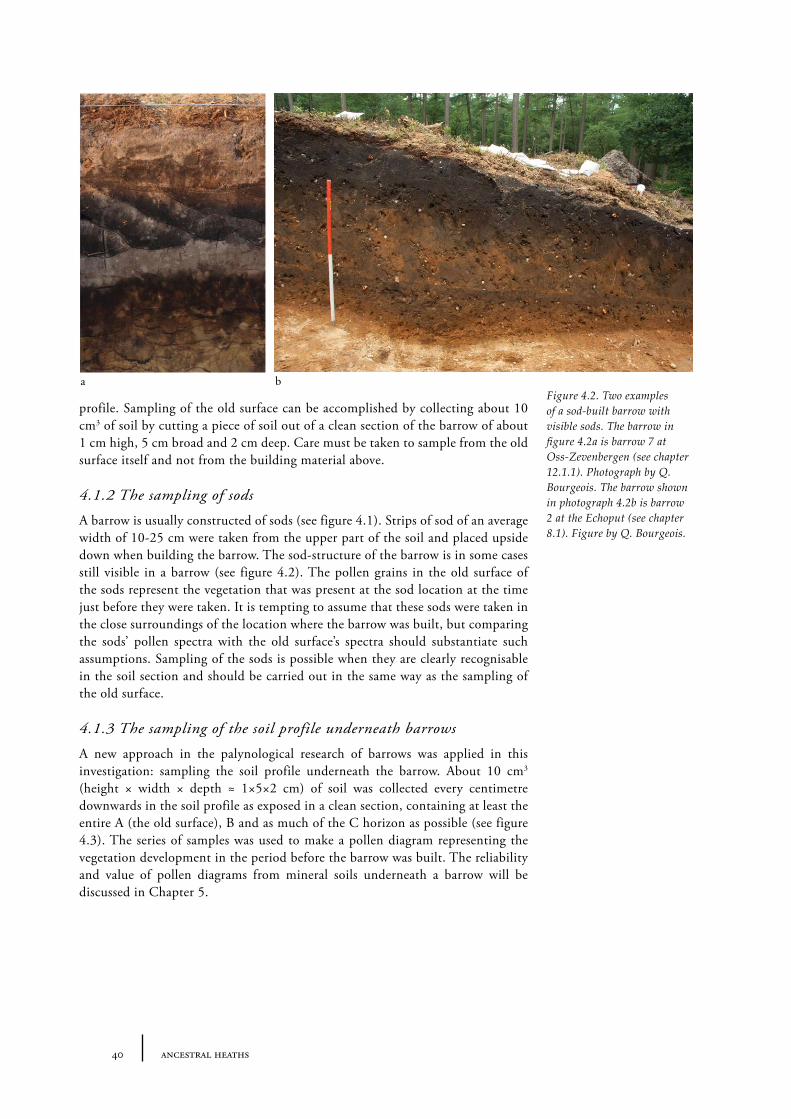
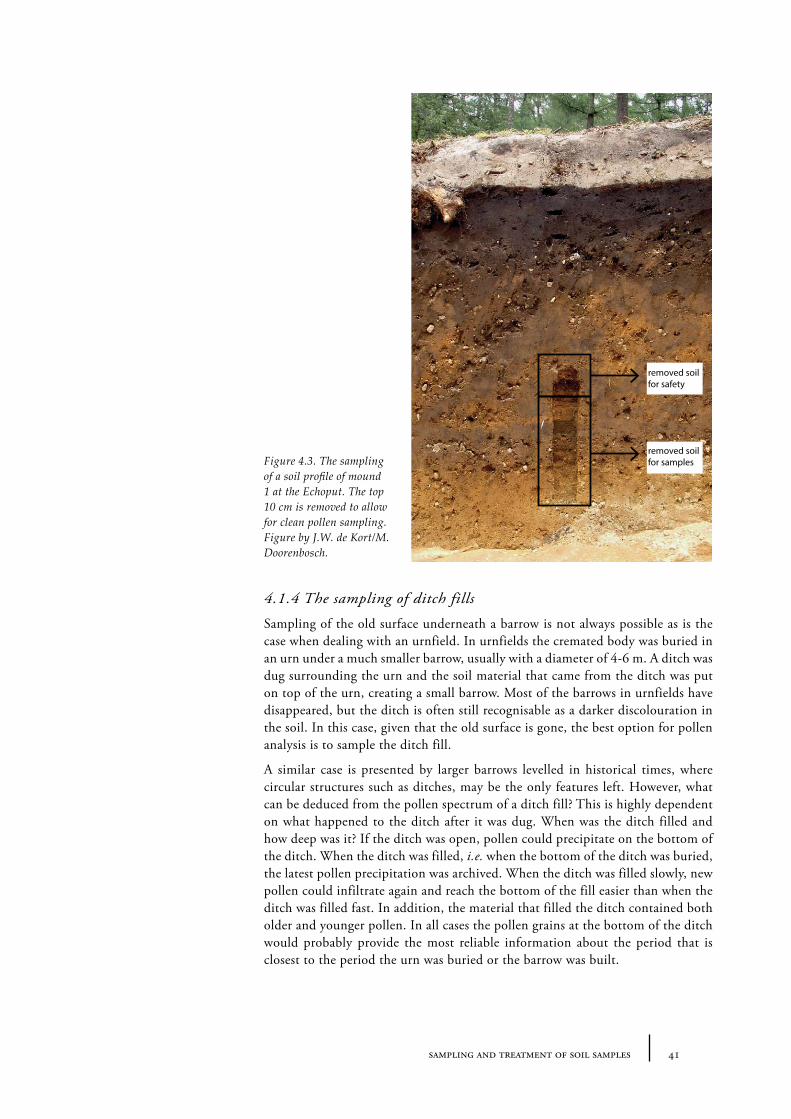
profile. Sampling of the old surface can be accomplished by collecting about 10 cm3 of soil by cutting a piece of soil out of a clean section of the barrow of about 1 cm high, 5 cm broad and 2 cm deep. Care must be taken to sample from the old surface itself and not from the building material above.
4.1.2�The�sampling�of�sods
A barrow is usually constructed of sods (see figure 4.1). Strips of sod of an average width of 10-25 cm were taken from the upper part of the soil and placed upside down when building the barrow. The sod-structure of the barrow is in some cases still visible in a barrow (see figure 4.2). The pollen grains in the old surface of the sods represent the vegetation that was present at the sod location at the time just before they were taken. It is tempting to assume that these sods were taken in the close surroundings of the location where the barrow was built, but comparing the sods’ pollen spectra with the old surface’s spectra should substantiate such assumptions. Sampling of the sods is possible when they are clearly recognisable in the soil section and should be carried out in the same way as the sampling of the old surface.
A new approach in the palynological research of barrows was applied in this investigation: sampling the soil profile underneath the barrow. About 10 cm3
(height × width × depth ≈ 1×5×2 cm) of soil was collected every centimetre downwards in the soil profile as exposed in a clean section, containing at least the entire A (the old surface), B and as much of the C horizon as possible (see figure 4.3). The series of samples was used to make a pollen diagram representing the vegetation development in the period before the barrow was built. The reliability and value of pollen diagrams from mineral soils underneath a barrow will be discussed in Chapter 5.
a bFigure 4.2. Two examples of a sod-built barrow with visible sods. The barrow in figure 4.2a is barrow 7 at Oss-Zevenbergen (see chapter 12.1.1). Photograph by Q. Bourgeois. The barrow shown in photograph 4.2b is barrow 2 at the Echoput (see chapter 8.1). Figure by Q. Bourgeois.
41sampling and treatment of soil samples
4.1.4�The�sampling�of�ditch�fills
Sampling of the old surface underneath a barrow is not always possible as is the case when dealing with an urnfield. In urnfields the cremated body was buried in an urn under a much smaller barrow, usually with a diameter of 4-6 m. A ditch was dug surrounding the urn and the soil material that came from the ditch was put on top of the urn, creating a small barrow. Most of the barrows in urnfields have disappeared, but the ditch is often still recognisable as a darker discolouration in the soil. In this case, given that the old surface is gone, the best option for pollen analysis is to sample the ditch fill.
A similar case is presented by larger barrows levelled in historical times, where circular structures such as ditches, may be the only features left. However, what can be deduced from the pollen spectrum of a ditch fill? This is highly dependent on what happened to the ditch after it was dug. When was the ditch filled and how deep was it? If the ditch was open, pollen could precipitate on the bottom of the ditch. When the ditch was filled, i.e.�when�the bottom of the ditch was buried, the latest pollen precipitation was archived. When the ditch was filled slowly, new pollen could infiltrate again and reach the bottom of the fill easier than when the ditch was filled fast. In addition, the material that filled the ditch contained both older and younger pollen. In all cases the pollen grains at the bottom of the ditch would probably provide the most reliable information about the period that is closest to the period the urn was buried or the barrow was built.
removed soil for safety
removed soil for samplesFigure 4.3. The sampling
of a soil profile of mound 1 at the Echoput. The top 10 cm is removed to allow for clean pollen sampling. Figure by J.W. de Kort/M. Doorenbosch.
42 ancestral heaths
Alph
en_K
iek_
ditc
h
Alph
en_K
iek_
os_p
er1
2040
6080
100
AP
NAP
2040
60
Alnus
2040
Corylus
1
Fagus
1
Fraxinus 1
Picea
5Pinus
510
Quercus
510
Tilia
1
Ulmus
2040
60
Betula
2040
6080
Ericace
ae
1
Artemisia
1Astera
ceaetu
buli�orae
1Cerealia
5Poaceae 1
Plantagolanceolata1
Succisa1
Cyperace
ae 1Fabac
eae 1
Dryopteris 5Polypodiumvulgare
1
Pteridium 5Sphagnum
587
519
Pollensu
m(A
P-Betula)
1224
1124
Totalp
ollensu
mTr
ees
and
shru
bsH
eath
Ant
hrop
ogen
ic in
dica
torsG
razi
ngin
dica
tors
Upl
and
herb
sFe
rns
and
aq.m
osse
sAl
phen
Op
deKi
ekO
ldsu
rfac
e(p
er1)
and
ditc
h
Figu
re 4
.4. P
olle
n sp
ectr
a of
the
‘Op
de K
iek’
bar
row
. A s
pect
rum
of
the
old
surf
ace
and
a sp
ectr
um o
f the
sur
roun
ding
ditc
h ar
e sh
own.
Po
llen
spec
tra
of th
e tw
o sa
mpl
es a
re q
uite
sim
ilar.
Spe
ctra
are
giv
en
in %
bas
ed o
n a
tree
pol
len
sum
min
us B
etul
a po
llen.
In th
e to
tal A
P (=
arbo
real
pol
len)
Bet
ula
is in
clud
ed. I
n th
e to
tal N
AP
(= n
on a
rbor
eal
polle
n) s
pore
s ar
e in
clud
ed, n
on p
olle
n pa
lyno
mor
phs
are
excl
uded
. D
iffer
ent s
cale
s ha
ve b
een
used
, ind
icat
ed w
ith d
iffer
ent c
olou
rs.
43sampling and treatment of soil samples
The reliability of the pollen grains in the ditch fills representing the ‘urn/barrow period’ has been confirmed by several investigations. Bakels for example compared the pollen composition of ditch fills with control samples, taken from the undisturbed subsoil next to the ditches and taken from the soil on top of the ditches (Bakels 1975). The control samples from the undisturbed subsoil did not contain any pollen, making it unlikely that older pollen that was already present in the subsoil (the material the ditch was filled with) influenced the pollen composition of the ditch fill. The control samples from the soil above the ditch showed a different and younger pollen composition than the ditch fill, indicating that infiltration of younger pollen from above is negligible. In addition, 14C dates from the ditches were in agreement with the age indicated by the pollen composition of the ditch fill.
Another example is given by Casparie and Groenman-van Waateringe (1980). This example concerns the ditch around barrows from the Middle Bronze Age period (“Alphen Op De Kiek”). Samples were taken from both the old surface and the ditch fill. Pollen spectra of the two samples are quite similar (see figure 4.4), indicating that they indeed represent the same period, the period the barrow was built.
4.1.5�The�sampling�of�posthole�fills
Another rather new approach was applied by taking samples from the filling of postholes found in the neighbourhood of barrows. In figure 4.5 a hypothesis is described to explain the pollen spectrum derived from such a posthole fill and how it would be interpreted. Before the post was placed a surface was present where pollen grains could precipitate on. Pollen could infiltrate into the soil and pollen stratification, as has been described in section 4.1.3 and Chapter 5, could be the result. When the post was going to be placed a hole was dug into this soil. The soil material coming out of the hole contains the pollen grains that were previously present in these stratigraphic layers, now mixed up, representing different times of periods before the hole was dug. The post was placed into the soil and it is very likely that the remaining hole was filled with the soil material that came out of the hole in the first place. This soil material contains a mixture of pollen grains. The soil next to the post continued to develop, with new pollen precipitating on and infiltrating into the soil. In time, the length of which is usually unknown, the post will decay or be pulled out. A post could have decayed due to the attack of soil fauna and fungi. When a post has decayed the part of the post that was below surface would have been slowly filled up with mostly material from above. Sediment from above would probably have filled the spaces that emerged due to the decay since the soil will most likely collapse a little. Younger pollen could infiltrate into the soil with this incoming sediment. In addition younger pollen probably has infiltrated with the micro-organisms that were responsible for the decay. The postpipe will still be visible as a darker coloration in the soil. The sediments of which this postpipe consists will most likely now contain a mixture of pollen that mostly represents the period when the post was subject of decay. With the post decayed, soil development can now also take place from the surface downwards at the location the post was placed. New pollen precipitates also on this location and will be transported downwards. However, when the postpipe itself is still clearly visible in the soil profile, most likely some distance below the surface as a darker coloration of the soil, it is probable that the soil development has not reached this depth yet. Assuming that the transportation of pollen grains downwards into the soil is correlated to the soil development (as will be discussed in Chapter 5), it is also likely that newly precipitated pollen grains (i.e. pollen
mixture A & B
A
B
mixture A & B
pollen in�ltration mixture of pollenin�ltrated duringdecay of post
mixture A & B mixture A & B mixture of pollenin�ltrated duringdecay of post
mixture A & B
A
mixture A & B and in�ltrated pollenBottom of posthole:mixture A & B and pollen in�ltrated closest to period of pull-out
A
B
mixture A & B
mixture A & B and in�ltrated pollen
B
pollen rain
decaying post postpipe
44 ancestral heaths
grains that precipitated on the surface since the post had disappeared) did not reach this depth yet. A sample that is taken in the centre at the bottom of this clearly visible postpipe contains then pollen grains that were present during the decay of the post. The pollen spectrum would then represent a mixture of time periods, but only (or at least mostly) from the time after the post was placed, when it was subject to decay, until the post had completely decayed. A possible dating based on the pollen spectrum would give a terminus�post�quem date.
When a post had been pulled out of the soil a hole was left behind. It is likely that the hole collapsed and that sediment from the sides and from above filled up at least part of the hole. The filling of this hole now contains pollen that is mixture of pollen that was originally present in the posthole-fill (older than the pulling out of the post) and younger pollen that precipitated on the soil after the post was placed. The situation is now comparable to when a ditch was dug (see section 4.1.4). When the post was immediately backfilled, the latest pollen precipitation was archived underneath. When the posthole was filled slowly, new pollen could infiltrate again and rejuvenate the pollen spectrum more easily than when the posthole was filled fast. When a post has been pulled out, the place where the post was present can often not be distinguished from the original post
Figure 4.5. An illustration that shows the theory of pollen distribution in postpipes and posthole fills. A: decaying of the post. B: pulling out of the post.
45sampling and treatment of soil samples
hole in which the post was placed. Pollen grains at the centre of the bottom of the post hole will probably provide information about the period that is closest to the period that the post was pulled out. An example of sampling posthole fills and the interpretation of their pollen spectra will be discussed in section 8.1.
Based on the hypothesis above it is best to take samples from the centre of the bottom of the postpipe or from the centre of the bottom of the posthole fill, providing a terminus�ante�quem date for the placing of the post.
4.2 Chemical treatment and analysis of palynological soil samples
Pollen was extracted by adding potassium hydroxide (KOH) to 1 cm3 of the sediments to remove humic acids. To every sample one to five Lycopodium tablets were added as a marker, in case pollen concentrations need to be calculated. Heavy liquid separation, using a mixture of bromoform (CHBr3) and alcohol with a specific gravity of 2.0, was performed to separate the inorganic material from the organic material. Finally the samples were acetolysed with a mixture of sulphuric acid (H2SO4) and acetic anhydride, to remove the large plant remains. Grains were identified with the aid of the keys of Beug (2004), Faegri and Iversen (Faegri and Iversen 1989), Moore et�al. (1991), Punt et�al. (1976, 1980, 1981, 1984, 1988, 1991, 1995, 2003, 2007, 2009) supplemented by Reille (1992, 1995, 1998), several lists set up by van Geel (van Hoeve and Hendrikse 1998) and the reference collection of the Faculty of Archaeology of Leiden University. The spectra were calculated using a pollen sum of ∑AP–Betula (Van Zeist 1967a). A minimum of 300 arboreal pollen grains (excluding Betula) per sample were counted. For more information about the pollen sum see section 4.3. Pollen spectra and diagrams have all been plotted with the Tilia software, version 1.7.16 (Grimm 1992).
47the palynology of mineral soil profiles
Chapter�5
The palynology of mineral soil profiles
5.1 The theory behind the palynology of mineral soils
Pollen grains are very resistant to decay and often well preserved across a range of circumstances. They can, however, be subject to degradation. Pollen is best preserved under waterlogged (anaerobic) conditions. In aerobic conditions pollen grains oxidize, causing thinning of the sporopollenin wall of the grains (Havinga 1964). Besides oxidation, the degradation of pollen by biological activity such as bacterial attack is probably at issue under aerobic conditions (Havinga 1967, 1984). In addition, pollen can be mechanically damaged during transport (Holloway 1989). When pollen grains have precipitated on the surface of a mineral soil, and hence under aerobic circumstances, they will be subject to corrosion and they will wash away (outwash). However, there will be an equilibrium between the disappearance of pollen grains due to corrosion or outwash and the supply of pollen to the surface. In addition pollen grains are incorporated into the faeces of the soil fauna that is responsible for the decomposition of the litter layer on the soil (van Mourik 2003; this process of incorporation will be discussed in detail in the following paragraphs). Faeces provide good conditions for preservation of pollen grains. As a consequence the top soil will contain an assemblage of pollen grains that represents the surrounding vegetation. After construction of a barrow the surface containing this pollen assemblage has been covered and protected from the air, reducing microbiological activity and thus corrosion of the pollen grains. In addition, the outwash of pollen has been diminished. Therefore, the construction of a barrow provides good circumstances for preservation of the pollen grains in the top soil underneath a barrow that had been precipitated on the surface shortly before the barrow was built. This allows for reconstructing the vegetation of the barrow building period by sampling the old surface underneath and the sods from the barrow as has been described in sections 4.1.1 and 4.1.2.
As explained in section 4.1.3, a pollen sequence can be extracted from the soil profile underneath a barrow providing a pollen diagram that shows a vegetation development from the period before the barrow was built. Ideally pollen diagrams are derived from samples taken from peat or lake sediments. The formation of peat and lake sediments is well known. Both peat and lake sediments are formed by accumulation processes. Peat is formed by the accumulation of partially decayed vegetation matter. Organic materials can accumulate when the production of biomass is greater than its chemical breakdown. Lake sediments consist of accumulated organic and inorganic material, forming layers containing an environmental archive. In both peat and lake sediment pollen was caught in each layer. There is hardly any vertical movement of material and therefore pollen from the lower layers represents the oldest vegetation. The anaerobic condition found in both peat and lake sediment enable good preservation of pollen grains, in contrast to mineral soils. Mineral soils do, however, often show a pollen stratigraphy. Several investigations have shown that mineral soil pollen grains can provide a vegetation history (Havinga 1963, Munaut 1967, Dijkstra and van
48 ancestral heaths
Mourik 1995, van Mourik 2003). Van Zeist (1967) published a mineral soil pollen diagram with a clear vegetation development that generally corresponded to the known vegetation history of the Netherlands, which was reconstructed from peat pollen analysis. The value of mineral soil diagrams has been the subject of much discussion. This discussion has mainly revolved around two issues: the conservation of pollen grains in a mineral soil, and the distribution of pollen grains in a mineral soil. Does pollen show a real stratigraphic organization and can they be used to reconstruct a vegetation development? Several theories have been suggested about the processes taking place in a mineral soil that influence the distribution of pollen in the soil and their possible stratigraphy. It was thought for some time that a similar process of accumulation like in peat and lakes also took place in mineral soils (Beijerinck 1933, Benrath and Jonas 1937, Florschütz 1941). However, Dimbleby (1952, 1957, 1961) and Havinga (1962) concluded that processes of sand accumulation by drifting or by soil fauna are of minimal significance for the development of pollen stratigraphy, since the pollen concentration decreased significantly with depth. Munaut similarly disagreed with the theory, showing in his thesis that most Pleistocene cover sands do not contain contemporary pollen from this period and pollen grains from other periods must have infiltrated into these layers (Munaut 1967, 136-137). There is indeed an influx of organic material in mineral soils, but it are soil forming processes and not accumulation processes that cause decomposition and transportation of pollen material deeper into the soil. Other theories involved the infiltration of pollen into the soil as the underlying process that causes pollen distribution in the soil.
Mothes, Arnoldt and Redman thought percolating water to be the cause of pollen grain infiltration into the soil (Mothes� et� al. 1937). Their experiments showed a selective penetration of pollen grains, with large pollen grains such as Pinus being transported much more slowly than smaller pollen grains such as Quercus. Mothes et�al.’s conclusions are discussable, since their laboratory situation was not adequately representative of natural conditions. According to Munaut (1967, 138) they ignore the influence of organic material in the soil. He states that pollen grains are incorporated into aggregates of organic material and very fine mineral particles, causing pollen grains not being able to move around freely in between the soil particles. In addition, Munaut showed that the infiltration speed differed between sites with comparable soil types, which should not be the case when percolating water had been responsible for this (Munaut 1967, 138-139). Firbas et�al. and Trautman considered percolating water as cause for selective infiltration of pollen into the soil as well (Firbas�et�al. 1939, Trautmann 1952). However, Munaut found no examples of the expected high concentration of small pollen grains at the lowest parts of the soil and has mentioned that the differences in the diagrams these authors based their conclusions on, could very well be the result of differences in local vegetation (Munaut 1967, 144-145).
Havinga, like Munaut, disagreed with the theories of percolating water being the main cause of pollen distribution into the soil (Havinga 1962). In his thesis he explained the distribution of pollen grains into the soil by intense biological activity during the homogenization phase preceding soil formation, especially podsolization. Pollen are incorporated in the faeces of burrowing animals such as earthworms and transported into the soil by these animals. A mixture of older and recently precipitated pollen grains is the result. During this phase pollen grains disappear due to corrosion and the pollen assemblage is constantly rejuvenated. During the podsolization phase the homogenization depth decreases due to decrease of biological activity and pollen below this homogenization depth was preserved (see figure 5.1). At the top the process of rejuvenation of the pollen assemblage continues and a pollen profile with at the bottom older and at the top
49the palynology of mineral soil profiles
younger pollen assemblages evolves. This means that during the homogenization phase and cases of incipient soil formation a homogenous pollen assemblage is present, showing a similar vegetation pattern in the top as well as deeper in the soil.
Havinga also discussed selective corrosion of pollen grains in mineral soils. Selective corrosion could be responsible for changes in a pollen profile, mistakenly interpreted as changes in vegetation. Selective corrosion would more easily take place in sandy soils than in peat. Based on differences between pollen diagrams of a mineral soil and a peat bog Havinga concluded that Quercus pollen is largely destroyed in sand under dry conditions (Havinga 1962, 70-76), but these differences could also have been the result of local vegetation differences, caused by edaphic differences between the soil types (Munaut 1967, 145). Havinga showed that pollen grains that have been oxidized are more easily destroyed by subsequent microbial attack (Havinga 1964). Later on, Havinga tested selective oxidation in a laboratory situation, showing a relation between corrosion by oxidation and the amount of sporopollenin in a pollen grain (Havinga 1967, 1984). This implies that some pollen grains are more susceptible to oxidation hence corrosion than other pollen grains, causing selective corrosion. Havinga emphasises that his investigations were not carried out under perfectly natural conditions. However, differences in susceptibility for corrosion should be accounted for when interpreting pollen spectra from mineral soils.
Munaut (1967) agreed with Havinga that the depth of infiltration of pollen grains into the soil is related to the depth of homogenization by biological activity. However, he found no homogenous pollen profiles as described by the theory of Havinga, not even in little developed soils. He also found sharp transitions from one to another pollen association (Munaut 1967, 141). The research of Munaut also showed that in less developed soils, those with high biological activity, the infiltration speed of pollen is higher and the disappearance of older pollen spectra by microbial attacks is more pronounced. Despite this, Munaut concluded that biological activity is not the only driving mechanism behind the pollen distribution. He assumed that the most likely explanation is a combination of both percolating water and biological activity being responsible for the distribution of pollen in the soil (Munaut 1967, 141-142), as was suggested by Erdtman (1943). Munaut concluded that percolating water could be primarily responsible for the depth of pollen distribution, but that the biological activity is probably responsible for the activation, delay and stop of this process. Pollen grains are incorporated into organic aggregates by soil fauna and thereby fixed at a certain level in the soil. When a pollen grain is freed from its organic aggregate by microbial attack it can be transported deeper into the soil by percolating water and decomposed or re-incorporated again. According to Munaut this explains the higher infiltration speed and shorter vegetation history in less developed soils, where humic complexes are less stable and easier to decompose by microbial attack. However, Guillet states
Figure 5.1. The change of a pollen profile under the influence of homogenisation. On the left: the homogenisation depth is the same during period B as during the preceding period A. On the right: the homogenisation depth is less during period B than during period A. The pollen composition a represents the vegetation during the older period A, while the pollen composition b represents the vegetation during the younger period B. Figure after Havinga (1962, figure 4).
50 ancestral heaths
that soil infiltrating water could not be responsible for pollen transport because pollen grains have hydrophobic properties and their mean grain size does not allow vertical transport in single grain conditions through soil pores (Guillet 1970). Van Mourik (1985, 1986) continued the discussion about pollen infiltration and conservation in mineral soils (van Mourik 1985, 1986). He studied pollen and spores micromorphologically in thin sections from several mineral soils. Like Havinga, he concluded that the distribution of pollen in various mineral soils is directly correlated with the distribution of soil fauna activity. Pollen grains incorporated into faunal excrements, were protected from decay. Van Mourik did not find free pollen grains in the pores of the soil, as would be expected if transport by percolating water, as suggested by Munaut, had taken place. In addition van Mourik differentiated syn-sedimentary and post-sedimentary pollen; syn-sedimentary pollen being present in the sediment when deposited and post-sedimentary pollen being that which is brought into the sediment by soil fauna during soil formation, both being present in excrement. Syn-sedimentary pollen would be present in a constant concentration throughout the sediment and give information about the vegetation present at the time of sediment deposition, while post-sedimentary pollen would decrease in concentration with depth and give information about the vegetation present at the time of soil formation. This could be much later then the time of deposition. They can be differentiated from each other because excrement containing syn-sedimentary pollen is randomly distributed in the matrix, while the excrement containing post-sedimentary pollen is mainly concentrated in burrow 1channels. A good interpretation of mineral soil pollen diagrams makes the distinction between syn- and post-sedimentary pollen.
The topic of distribution and conservation of pollen grains in a mineral soil has also been the focus of recent studies. Davidson concluded that the activity of soil fauna, mainly earthworms, is an important factor in the redistribution of pollen (Davidson� et� al. 1999). Pollen that has been precipitated on the soil surface is consumed, digested and excreted by soil fauna. He claimed that the depth of incorporation of the pollen grains is dependent on the depth of the soil fauna activity. However, he also stated that the result is a mix-age pollen assemblage and that age-stratification of pollen assemblages is only possible in the top surface organic horizon of a podzol or soils with accumulating organic horizons like peaty soils. Van Mourik showed that the vegetation development from heathland to closed (planted pine) forest was recorded in pollen assemblages in undisturbed acid soil profiles that had developed underneath the forest at several locations in the Netherlands (Dijkstra and van Mourik 1995, Dijkstra and van Mourik 1996, van Mourik 2003). These soils could develop after plantation of a pine forest on a former heath area. Pollen zonation was already visible in the organic top layer (F, H and A horizons, see figure 5.2) of the soil. The pollen content of terrestrial humic soils like these is post-sedimentary (van Mourik 2001), meaning that the pollen assemblage represents the vegetation that was present during the development of these soils, since they infiltrated into the soil during this process. Micromorphological observations of thin sections from these soils revealed that when pollen grains precipitated on the surface, they were incorporated in excrements from soil fauna in the upper part of the F horizon. The pollen grains were then released again in the lower part of the F horizon and the H and A horizons. Then they were reincorporated again in small excrements of soil fauna. These excrements, which are very stable and are only slowly decomposed by
1 Soil fauna burrows channels while moving through the soil leaving their excrements behind in these channels.
51the palynology of mineral soil profiles
fungal attack, preserved good conservation conditions for pollen grains. Pollen grains that were not reincorporated were destroyed by microbial consumption (van Mourik 2003). When soil-mixing animals were absent a pollen stratification representing the vegetation development was present. In layers where soil-mixing animals were present pollen were easier oxidized and the pollen distribution was more even throughout the soil layer (Dijkstra and van Mourik 1996). Pollen grains are transported deeper into the soil, into the B-horizon or even the C-horizon by the activity of soil fauna like earthworms. Since they show a retrogressive activity during the soil formation the oldest pollen assemblages will be found at the lowest parts (van Mourik 1999).
How can this principle of mineral soil pollen palynology be used in the palynological research of barrows? During pedogenesis pollen grains are transported deeper into the soil. However, this process is interrupted when the soil was covered by a burial mound and the soil was well preserved until excavation. The soil profile that had developed before the barrow was built is often still recognizable. This indicates that after the construction of the barrow the soil profile had not or hardly been disturbed. This furthermore indicates that the pollen profile that was present in the soil before the barrow was built was also preserved. When a barrow was built the soil was sealed away from outside influences. As a consequence, biological activity decreased, creating a more stable environment for pollen conservation and preventing homogenization of the soil that would consequently disturb the soil profile. In addition, the barrow also prevented pollen from precipitating on the soil. Podzols found underneath barrows have often developed in the top of Pleistocene cover sands. These sediments were originally free from pollen (Koster 1978), so the pollen content of the soil underneath barrows is mainly post-sedimentary (van Mourik 2001). This means that pollen infiltrated into the soil during pedogenesis. Infiltration of younger pollen grains into the soil can alter the composition of the pollen assemblage and as a consequence the interpretation on which the vegetation reconstruction is based. It is likely that there is a mix of pollen grains of different ages in each zone, but it is also likely that the majority of the youngest pollen grains will be in the top the soil and the deeper into the soil the higher the average age of the pollen grains will be.
In conclusion, based on the results of previous investigations described above it seems to be possible to read a rough vegetation history from a mineral soil pollen diagram from underneath a barrow, however, with the usual caveats.
Figure 5.2. Pollen diagram from a micropodzol that had developed underneath a Larix forest. Incipient pollen zonation is visible in the top organic layer (F, H, AE and AB horizons). Figure after van Mourik (2001).
52 ancestral heaths
5.2 The time represented in a mineral soil pollen diagram
What stretch of time is represented in pollen diagrams derived from mineral soils is important for dating and linking a vegetation development to a certain period. The duration of the downward movement of pollen in the soil indicates the period that is represented in a mineral soil pollen diagram. For the most part, it is not possible to date the soil using dating techniques like 14C or OSL (optically stimulated luminescence). It has been suggested, however, that the infiltration speed of pollen grains into the soil can be generalised. Dimbleby (1985) suggested that the average rate of downward movement of pollen in a mineral soil is about 10 cm in 300 years. Although he stated that this rate could vary according to prevailing pedological conditions, this average rate is still often used in the interpretations of mineral soil pollen diagrams (Groenman- van Waateringe 1986, de Kort 2002). As has been explained in the previous paragraph, the downward movement is dependent on the activity of the soil fauna, which is active during pedogenesis. The speed at which soil fauna moves through the soil distributing the pollen grains incorporated in their excrements is highly dependent on several factors such as the hydrology, the acidity, and compaction of the soil. As a consequence it is highly unlikely that the speed at which soil fauna distributes pollen grains into the soil is similar across different locations. The 300 years in 10 cm Dimbleby found may very well have been true in that particular situation, this cannot however be applied to every mineral soil. A few examples now follow of cases that contradict 10 cm/300 years downward rate of pollen in mineral soils.
Example 1: The Laarder Wasmeren area
That the formation of a podzol is a complex process and can differentiate even in a small area can be seen in the Laarder Wasmeren (LWM) area. The Laarder Wasmeren area is a nature reserve in the Netherlands (see figure 5.3). The area had been used to discharge waste water in the 20th century, polluting the area with heavy metals and toxic organic compounds. In 2003, remediation of the area
Figure 5.3. Location of the nature reserve area Laarder Wasmeren, Weerterbergen and Gieten.
53the palynology of mineral soil profiles
started by ending the discharge and thus draining the area, and subsequent removal of polluted sludge and soil. Underneath this soil a Holocene drift sand landscape was discovered. The complex stratigraphy and genesis of this landscape, with four drift sand phases, two lacustrine phases and five phases of soil formation, was studied in detail by Sevink et�al. (in press) who investigated several representative soil profiles in the area. The soil profiles showed three or four podzols on top of each other separated by layers of drift sand. Every time, during a period with stable conditions, soil formation led to the development of a podzol, which was buried under drift sand during the next phase of landscape instability. During the stable phase, the local vegetation caused a constant precipitation of pollen grains on the soil surface. Over time these pollen grains were transported deeper into the soil by soil fauna as has been explained above. Due to unstable conditions that probably resulted from land use impacts, vegetation would become scarce and under the influence of wind the topsoil of bare surfaces was blown away. When the surface of the LWM area was being covered by sand, pedogenesis and pollen distribution in the soil stopped. When circumstances were stable again vegetation could establish itself on the newly deposited sand and pedogenesis and pollen transportation could take place again. The pollen spectra that are recorded in a buried soil thus represent the vegetation history of the stable period until the surface was being covered. Likewise, pollen spectra from the soil underneath a barrow represent the vegetation history of the landscape in the period before the barrow was built. The duration of this period is dependent on the time the soil had to develop. The buried soils in the LWM area, unlike the soil underneath barrows, could be dated. This was accomplished by taking OSL samples. The various phases that formed this landscape could be dated providing information about the length of the period that is represented by the pollen record in which a certain vegetation development has taken place. In addition all major soil profiles have been sampled for pollen analysis. Monoliths were taken from the profiles and from these monoliths every second centimetre a sample of 1 cm was taken for analysis. For an exact overview of the site, sample locations and methods of preparation see Sevink et�al. (in press). Prepared slides were provided by van Geel to the author of this thesis for pollen analysis. For this research two profiles have been selected to analyse. Profile II and Profile V consist of respectively four and three podzol soils on top of each other.
Based on the OSL dates a reconstruction of soil formation and drift sand phases in time could be made. For a detailed discussion see Sevink et� al.� (in press). A summary of these results is shown in figure 5.4. Profile II consists of four podzols. The first phase of soil formation (S1) has taken place in Pleistocene cover sand, deposited around 11500 years BP. A drift sand phase took place broadly between 6500-8500 years BP, which means that the development of S1 could have taken 3000-5000 years. In the drift sand layer D1 a second soil (S2) could develop. This soil was covered by a new drift sand layer approximately around 5800-6400 years BP, after which the development of S2 stopped. This indicates that the time span S2 represents has a length of approximately 100-2400 years. According to Sevink et�al. (in press) the soil phase S2 was probably rather short (a few hundred years), based on the poor development of the podzol.
The second drift sand period started around 5800-6400 years BP. In this sand layer, S3 developed until it was covered by a third sand layer (D3). D3 was deposited between approximately 4800-5300 years ago. This leaves 500-1600 years for soil phase S3. A fourth podzol (S4) could develop in D3 until it was covered by another, more regional phase of aeolian activity (D4), which dates from the Late Middle Ages or even more recent. However, D4 is missing in LWM
54 ancestral heaths
II and hence information about the exact time span of S4 in LWM II is lacking. Profile IV consists of 3 podzols. In this profile S1 and S2 have merged together, representing a period of about 3100-7400 years. The results of the pollen analysis are shown in figure 5.5a and 5b. The vegetation development shown by the pollen diagram will be discussed in detail in section 10.2. Since both profiles are situated close together and both represent the same soil development phases they would be expected to be identical. The vegetation development shown by the pollen diagrams derived from the two profiles is indeed similar. However, the time represented per centimetre in each profile is not alike (see figure 5.6 and table 5.1). S3 in profile II and V represent the same period of time (500-1600 years), but the thickness of S3 in profile II is 27.5 cm, while only 14 cm in profile V. The Dimbleby factor of 30 years per centimetre could be applicable to profile II (this would indicate that soil phase S3 would have taken around 825 years), but not to profile V. When applying the Dimbleby-factor to profile V, the middle podzol would have been estimated to represent about 400 years, while according to the reconstruction by Sevink et�al. this podzol represents about 500-1200 years (Sevink�et�al. in press.). Koster (2005) has argued that the rate of pedogenesis in drift sands is highly dependent on the origin of the drift sand. Drift sand can consist of former A and E horizon material (like S2), in which a new podzol can form relatively fast. When the deposited sand originally was C material, development of a podzol is a much slower process (like S3 and S4).
340
330
230
240
250
260
270
280
290
300
310
320
D-3
S-1/2CS
S-3D-2
S-2Bh1
Bhb2
Eb2
Ahb2
Eb1
Ahb1
BC2
BC1
Bh2
ELWM VOSL340
230
240
250
260
270
280
290
300
310
320
330
D-3
S-1CS
S-2D-1
S-3D-2
S-4
Bh1b3
Eb3
Ahb3
Eb2
Ahb2
Bhb1
Eb1
Ahb1
BC
Bh1E
BCb3
Bh2b3
LWM IIOSL
4,8 ± 0,2
5,8 ± 0,3
5,8 ± 0,3
6,5 ± 0,4
8,8 ± 0,4
5,3 ± 0,2
6,4 ± 0,3
Age (ka) Age (ka)
Figure 5.4. Cross sections of the Laarder Wasmeren II and V profiles with the according soil formation and drift sand periods. The location of the samples for OSL dating have been indicated with the corresponding OSL dates (see also figure 5.6). Figure after Sevink et al., in press., figure 5 and 7.
Profile LWM, soil phases
Estimated time per soil fase based on OSL (yr)
Thickness of deposit (cm) Estimated year/cm
LWM-II-4 S4 in D3 ? 25-0 cm
LWM-II-3 S3 in D2 500-1600 52,5-25 cm 18-58
LWM-II-2 S2 in D1 100-2400 66-52,5 cm 7.4-177
LWM-II-1
S1 in coversand 3000-5000 x-66 cm
LWM-V-4 S4 in D3 ? 43-0 cm
LWM-V-2 S3 in D2 500-1600 57-43 cm 36-114
LWM-V-1/2 S1/2 in coversand/D1 3100-8000 x-57 cm
Table 5.1. The estimated time that is represented per centimetre in every soil phase of Laarder Wasmeren II and V.
A 70 year old forest soil in the forestry of Gieten (the Netherlands, see figure 5.3) was investigated by van Mourik (van Mourik 2003). The age of the soil is known because a former heath area (originally formed on Pleistocene cover sand) which had been used for sod taking, had been deeply ploughed to prepare ‘fresh’ parent material after which the area had been reforested around 1930. After plantation of Larix and Fagus trees a forest soil started to develop. This forest soil is described by van Mourik as ‘micropodzol’ with well-developed humus forms (mormoders). At the time of the investigation the soil formation had reached a depth of 10 centimetres. During the formation of this soil pollen grains had been distributed in this soil by the soil fauna by processes of incorporation, release and reincorporation into faeces as has been described in the previous paragraph. The soil profile was palynologically investigated and showed the vegetation development since the reforestation. With an age of 70 years and a decimetre in depth it is implied that every cm of soil represents an average of 7 years.
Example 3: Weerterbergen
In another study van Mourik et� al. (2010, 2012a) investigated a polycyclic Holocene soil-drift sand sequence near Weerterbergen (the Netherlands, see figure 5.3). The investigated profile shows a sequence of four phases with drift sand deposits in which podzols had developed. Two nearly identical profiles are involved in this research. In 2002 a profile was sampled for OSL dating. The OSL ages were used to compare the different soil phases and the time they represent (see table 5.2). The youngest soil formation phase shows an average of 18 yr/cm, while the next two phases respectively show 16.7, 75 and 266 yr/cm. Once again, these data differ from the Dimbleby-factor as well.
cmaboveNAP340
320
300
280
260
240
220
200
II V4.8
5.8
5.8
6.5
8.8
5.3
6.4
OSL OSL
D-3
D-2
D-1
CS
Figure 5.6. Cross sections of LWM II and V with profiles, phases and OSL datings. Figure after Sevink et al., in press., figure 2A.
Table 5.2. The OSL dates of the Weerterbergen profile and the according estimated time that is represented per centimetre in every soil phase (based on van Mourik et al. 2010, 2012a and van Mourik pers.comm., September 2013)
Profile Weerterbergen, soil formation phases
Estimated time per soil formation phase based on OSL
Thickness of soil phase (cm)
Estimated year/cm based on OSL
4 90 5 18
3 250 15 16.7
2 3370 45 75
1 5320 20 266
58 ancestral heaths
Conclusions
These examples show that the ‘Dimbleby-factor’ of 1 cm/30 years cannot be used as standard. The thickness of a soil and soil pedogenesis is probably highly dependent on local circumstances. These circumstances are variable through time and place, even very locally. Hence, the vegetation developments from soil profiles underneath barrows below cannot be placed in time without additional dating.2 To estimate the age of a soil underneath a barrow dating techniques are necessary.
The best technique for dating phases of soil formation is probably OSL (van Mourik�et�al. 2010, van Mourik�et�al. 2011, Sevink�et�al. in press). However, in order to do this at least two podzols should be present on top of each other. This is usually not the case underneath barrows. Radiocarbon dating of organic soil layers might also be possible, although precaution should be taken when interpreting these dates. This is clearly shown by the study of van Mourik described in example 3, where in addition to OSL radiocarbon dates have been determined based on samples from different fractions (humin and humic acid, see van Mourik� et� al. 2010) of the soil organic matter taken from the buried A horizons in this profile. The OSL samples provided ages of the sedimentation and soil formation phases. The radiocarbon dating however did not correspond with the OSL dating, which is probably due to the presence of older charcoal particles in organic aggregates, causing an overestimation of the 14C age. Underestimation of the 14C age is possible when younger organic particles have infiltrated. Van Mourik concludes that due to the complexity organic matter of the soil radiocarbon ages of buried horizons cannot be used to date drift sand and soil formation phases (van Mourik�et�al. 2010).
5.3. Absence of pollen grains in barrows
As has been described in section 5.1 the soil underneath barrows (and the soil the barrow has been constructed of ) often provides good pollen preservation conditions and consequently contains fossil pollen. Professor Waterbolk (University of Groningen) for example, who has palynologically investigated a great number of barrows, has never encountered barrow sediments that did not contain pollen grains (H.T. Waterbolk pers.comm., August 2011). However, pollen is not present under/in every barrow. In this study we have encountered the problem of a total absence of pollen grains even under comparable conditions. In Chapter 8 (Case studies) the palynological results will be discussed of several barrows that did contain pollen. One of these case studies concerns two barrows in the region of Apeldoorn at a location called the Echoput, excavated in 2007. The Echoput barrows did contain reasonably preserved pollen, sufficient for a vegetation reconstruction that will be discussed in section 8.1. Close to the Echoput barrows, about four kilometres to the northeast, three more barrows situated at a location called the Wieselse Weg (WW) were excavated in 2008 and 2009 (Fontijn and Louwen in prep.). Given that the WW barrows are situated in the same geographic region as the Echoput barrows, it was expected that they would contain pollen. However, in contrast to the Echoput, the WW barrows had little or no pollen. An explanation for the absence of pollen in the WW barrows could possibly be found in the differences in soil texture between the two locations. Although in general soil textures were very similar (the soil at both locations was classified as
2 In order get an even more exact image of the time represented in a mineral soil pollen diagram, one should also account for syn- and post-sedimentary pollen (see section 5.1, p.50-51).
59the palynology of mineral soil profiles
an Umbric Podzol (ISRIC-FAO 20063) (Dutch classification: Holtpodzol, gY30 [see Bodemkaart van Nederland4], according to soil scientist J. Boerma the soil of the Echoput barrows was loamier than the soil at the Wieselse Weg. In addition, the podzol underneath the WW barrows was much harder to recognize. Contrary to the barrows of the Echoput sods were not recognizable and also the old surface was hard to detect. Possibly the soil on which the WW barrows were constructed consisted of a somewhat coarser sediment than the Echoput barrows, favouring a better aeration of the soil which caused the pollen grains of the WW barrows to be subject of oxidation (Havinga 1984). Besides oxidation, pollen grains were more easily outwashed as a consequence of a higher susceptibility of the soil. To test this hypothesis, soil samples of the Echoput and the WW barrows were selected and analysed for grain size. In addition, soil samples from a barrow with a well-preserved soil profile and well-preserved pollen from another region, Barrow 7 from the barrow group of Oss-Zevenbergen (section 12.1), were analysed for comparison (see figure 5.7). Can the results of sediment observations be used to determine in advance the utility of conducting pollen analysis? Eight soil samples from the WW barrows, eight samples from the Echoput barrows and four samples from the Oss-Zevenbergen barrow were selected and analysed for grain size by the Sediment Analysis Laboratory of the Free University Amsterdam with a Laser Particle Sizer Helos KR Sympatec. An overview of the selected samples is given in table 5.3.
A summary of the results is shown in figure 5.8. This figure shows the distribution frequency q3 of all samples plotted against particle size. To discuss the results in detail, percentages per classification of the three sites have been compared with each other (see table 5.4a-b). Figure 5.8 and table 5.4a show that there are hardly any differences between the Wieselse Weg and the Echoput
3 All soil types have been classified according to the World Reference Base (ISRIC-FAO 2006), unless indicated otherwise.
4 Bodemkaart van Nederland 1:50.000 toelichting kaartblad 33 west Apeldoorn, p. 27, 67-8.
Figure 5.7. The locations of the barrows that have been used for grain size analysis.
60 ancestral heaths
barrows. This is also demonstrated in table 5.4b, which shows the statistical results. No significant differences can be detected between WW and Echoput, with exception of the Middle Coarse Sand fraction. However, almost all fractions
Nr. Location Barrow Sample location Sample name
1 Echoput barrow 1 sod 1 MT 266
2 sod 2 MT 267
3 old surface 1 MT 268
4 old surface 2 MT 269
5 barrow 2 sod 1 VNR 99
6 sod 2 VNR 100
7 old surface 1 A2.1 old surface 2
8 old surface 2 A2.1 old surface 1
9 Wieselse Weg barrow 1 (p101) profile west sample 1
10 sample 5
11 barrow 2 (p201) profile west sample 1
12 sample 5
13 barrow 3 (p301) MT 801
14 MT 802
15 MT 803
16 MT 804
17 Oss-Zevenbergen barrow 7 sod 1 VNR 275
18 sod 2 VNR 276
19 sod 3 VNR 277
20 sod 4 VNR 279
Table 5.3. Overview of samples that have been analysed for grain size.
Figure 5.8. Results of the grain size analyses, showing the density distribution q3 versus the particle size (μm).
61the palynology of mineral soil profiles
of Oss-Zevenbergen show significant differences compared to both the Wieselse Weg and Echoput. The soil underneath the Oss-Zevenbergen barrow 7 consists mostly of fine sand, while the sediments of the other two sites mainly consist of middle coarse and coarse sand.
The finer composition of the Oss-Zevenbergen sediment could be part of the explanation why pollen grains have been well preserved. However, this does not count for the difference in conservation between the Wieselse Weg and Echoput. Based on these results it is unlikely that differences in particle size of the sediment are the main causes for differences in pollen conservation. Another possible
Table 5.4a. Results of the grain size analyses in percentages per grain size.
62 ancestral heaths
explanation for the relatively good pollen conservation of the Echoput barrows is the locally wet conditions of the Echoput area (Fontijn 2011a, 30) compared to the much drier conditions of the Wieselse Weg. The soil at the location where the Echoput mounds are situated contains some loam which is practically absent at the Wieselse Weg. Although loam has not been shown by grain size analysis, loam might have been present somewhat deeper in the subsoil, causing moist conditions at the Echoput. These moist conditions at the Echoput site could have provided favourable conditions for pollen conservation, reducing the availability of oxygen and the (micro)biological activity (Havinga 1962, 1984), where at the Wieselse Weg the drier conditions favoured the degradation of pollen grains. The soil in Oss-Zevenbergen is also dry, but much poorer in nutrients, which also reduces microbial activity.
Conclusions
The purpose of the soil texture measurements described in the previous section was to determine whether the presence or absence of pollen grains in a soil could be predicted with these relatively simple and quick measurements. However, based on the results it is not possible to differentiate a pollen containing sediment from a non pollen containing sediment only by judging the texture of the sediment. Further research is recommended.
C Echo Oss VFSi Echo Oss FSi Echo Oss
WW x *** WW x *** WW x *
Echo *** Echo *** Echo **
CSi Echo Oss VFSa Echo Oss FSa Echo Oss
WW x *** WW x x WW x ***
Echo *** Echo x Echo ***
MCSa Echo Oss CSa Echo Oss VCSa Echo Oss
WW * *** WW x ** WW x x
Echo **** Echo **** Echo **
Table 5.4b. Results of the statistic analyses (tested with unpaired t-test) after grain size analysis. x means not statistically different, * means statistically different p<0,05), ** means statistically different (p<0,01), *** means statistically different (p<0,001), **** means statistically different (p<0,0001).
63the pollen sum
Chapter�6
The pollen sum
The absolute number of pollen grains found per sample can differ significantly per sediment. To be able to compare pollen spectra, pollen types are usually expressed as percentages of a pollen sum. The pollen sum used can be a total pollen sum, so with all pollen types included, or it can be based on a selection of pollen types. The pollen sum should be chosen in a way to get the most representative reflection of the vegetation composition that produced the pollen. To quote Faegri (1966, 136): “Pollen�sums�must�be�adapted�to�the�problem�they�are�supposed�to�elucidate,�and�then�the�basic�rule�is�extremely�simple:�the�pollen�sum�should�contain�the�pollen�taxa�from�those�plants�that�are�of�interest�in�elucidating�the�actual�question.” For example, when tree abundance in a forest area is of main interest, the pollen sum should only include arboreal pollen taxa and exclude herbal taxa, because the variation in herbal abundance would influence the percentages of the arboreal taxa that are unrelated to differences in tree abundance. However, in areas with little forest, herbal vegetation is of much more importance and when interested in the ratio between arboreal and non-arboreal vegetation herbal taxa should be included in the pollen sum. It would therefore be expected that in barrow palynology the pollen sum would include both arboreal and non-arboreal taxa. However, the pollen sum used in the palynological studies is a tree pollen sum minus Betula�∑AP-B. According to van Zeist this is the most appropriate sum to use. Betula and herbs are excluded because they grow locally at a barrow site and when they are included pollen percentages strongly fluctuate between barrow pollen spectra, even between samples from the same barrow (van Zeist 1967a). Betula is a pioneer tree (see figure 6.1); it settles and flowers easily in an open space and can therefore, like herbs, vary significantly at short distances. The consequence of using relative
Figure 6.1. Young Betula trees appearing as pioneer trees 6 years after the excavation of barrows at Oss-Zevenbergen. Photograph by R. Jansen.
64 ancestral heaths
numbers is that the change in one species affects the percentage of a species that does not change at all. Therefore, to reflect the regional vegetation best species that can vary locally should be left out of the pollen sum. Van Zeist tested several pollen sums for two tumuli originating from the same period and situated in the same area. It is expected that these spectra look very similar at least concerning the regional vegetation. He concluded that ∑AP-B was the most suitable pollen sum indeed. Since then ∑AP-B was commonly used in barrow palynology. However, this pollen sum has only been tested once and needs to be reconsidered.
6.1 Slabroek
As explained above, to get a reliable image of the regional vegetation, species that grow locally on a barrow site should be left out of the pollen sum, since their frequency can differ greatly at short distances. In a barrow pollen spectrum non-arboreal species are in general species that grew close to the sample site. Arboreal species however do not necessarily solely reflect regional vegetation. Van Zeist concluded that besides herbal species, Betula is also a local species and should therefore be excluded from the pollen sum (van Zeist 1967a). However, how can regional vegetation be best ascertained? Pollen diagrams derived from peat are assumed to give a reliable image of regional vegetation. As has also been explained in section 4.1.3, peat is an accumulation of organic material and in each layer pollen grains are caught. Peat provides conditions for good preservation of pollen grains, and since there is no vertical movement of pollen, each layer of peat reflects the vegetation from the period the pollen was caught. By comparing barrow pollen spectra with a contemporaneous pollen spectrum from peat from the same area it should be possible to determine the local vegetation of the barrow site, which can then be excluded from the pollen sum. The peat spectrum gives information about the regional vegetation of the barrow landscape. Species in the
Figure 6.2. Location of Slabroek, the Venloop. Oss-Zevenbergen, Echoput and Hijken.
65the pollen sum
barrow pollen spectrum that differ greatly from the peat spectrum probably are part of the local vegetation at the barrow site. These species can then be excluded from the barrow pollen sum.
To examine this theory a case study was conducted with data from a nature reserve area called the Maashorst, situated in the province of North Brabant, the Netherlands. A prehistoric urnfield at ‘Uden-Slabroekseheide’ (see figure 6.2 and 6.3) was investigated in 1923 by Remouchamps. He discovered 38 barrows from the Iron Age and Early Roman Period (Remouchamps 1924). Due to plans to change the area into a nature reserve and to reconstruct the urnfield, the area was reinvestigated by Archol (the excavation unit of the Faculty of Archaeology, University of Leiden, The Netherlands) in 2005 (van Wijk and Jansen 2005b). In 2010 it was decided to excavate the remainder of the urnfield area (Jansen and Louwen in prep.). During this last excavation several ring ditches were found. Two of these ring ditches (43 and 12, see figure 12.17 for the exact locations of the ditches), originally encircling the urnfield barrows, were sampled for pollen analysis. Their history as a pollen trap is the same as that of a ditch around a barrow. Pollen samples taken from the bottom of the ditch fill were analysed (as representing the vegetation of the area at the time of the digging of the ditch, see section 4.1.4). Samples were prepared as described in section 4.2. The pollen spectra from the ditch fills are shown in figure 6.4, percentages are based on a tree pollen sum minus Betula.
About one kilometre from the urnfield at Uden-Slabroekseheide, van Mourik (2011) analysed a peat core taken from the Venloop (van Mourik�et�al. 2012b). The pollen diagram from the Venloop as it has been published by van Mourik is shown in figure 6.5; percentages are based on a total tree pollen sum. It shows the development from a wetland to a peat to a deforested agricultural landscape. The start of the peat accumulation was 14C dated 750-410 cal BC, which is the start of zone 2 in the diagram and is contemporaneous with the urnfield period of Slabroek, which can be placed in the Early Iron Age (800-500 cal BC, see table 2.1) (Jansen and Louwen in prep.). Since vegetation in the pollen diagram does
63 m
0 m
m NAP
1000 m0 500250
Nistelrode
Urn�eld Slabroek
Venloop
Sample location
Figure 6.3. Map with the location of the urnfield at Slabroek and the Venloop. The map is based on digital elevation model of the AHN (copyright www.ahn.nl).
63 m
0 m
m NAP
1000 m0 500250
Nistelrode
Urn�eld Slabroek
Venloop
Sample location
63 m
0 m
m NAP
1000 m0 500250
Nistelrode
Urn�eld Slabroek
Venloop
Sample location
66 ancestral heaths
Ditc
h43_
base
32-3
1cm
Ditc
h43_
base
35-3
2cm
Ditc
h12_
base
45-4
4cm
Ditc
h12_
base
49-4
8cm
2040
6080
100
AP
NAP
2040
60
Alnus
1Carpinus
2040
Corylus
510
Fagus
1
Fraxinus 5Pinus
20
Quercus
5Tilia
1
Ulmus
20
Betula
100
200
300
Ericales
1Artemisia
5Astera
ceaetu
buli�orae
5Cerealia-ty
pe
1Astera
ceaelig
uli�orae
1Plantagolanceolata
510
Poaceae
1Rumexacetosa-type
5Succisa
1Cuscutaeuropaea-ty
pe
5Cyperaceae
5Monoletepsil
atefern
spores
1Polypodiumvulgare
1
Sphagnum
361
412
407
327
Pollensu
m(A
P-Betula)
741
707
1081
1349
Totalp
ollensu
m
Tree
san
dsh
rubs
Hea
thA
nthr
.ind
icat
ors
Gra
zing
indi
cato
rsU
plan
dhe
rbsF
erns
and
mos
ses
Figu
re 6
.4. P
olle
n sp
ectr
a of
the
sam
ples
take
n fr
om th
e di
tche
s 12
and
43
of t
he u
rnfie
ld a
t Sla
broe
k. S
pect
ra a
re g
iven
in %
bas
ed o
n a
tree
po
llen
sum
min
us B
etul
a po
llen.
In th
e to
tal A
P (=
arbo
real
pol
len)
Be
tula
is in
clud
ed. I
n th
e to
tal N
AP
(= n
on a
rbor
eal p
olle
n) s
pore
s ar
e in
clud
ed, n
on p
olle
n pa
lyno
mor
phs
are
excl
uded
. Diff
eren
t sca
les
have
be
en u
sed,
indi
cate
d w
ith d
iffer
ent c
olou
rs.
67the pollen sum
not seem to vary greatly around this period (see figure 6.4), a more exact dating of the ditches is not necessary and their pollen spectra can be compared with the pollen diagram.
The pollen spectra from the two ditch fills and the pollen diagram from the Venloop peat core provide information about the local and regional vegetation in the area in the Early Iron Age. By comparing the Venloop pollen diagram with the ditch pollen spectra it is possible to determine regional and local vegetation and therefore which pollen sum should be used to best display this in the ditch pollen spectra. To be able to compare the peat diagram with the ditch pollen spectra percentages should be based on a similar pollen sum. In table 6.1 average percentages of zone 2 of the peat diagram (VL) and percentages of both ditch pollen spectra (43 and 12) are shown based on similar pollen sums and tested with several pollen sums. The first pollen sum tested is ∑AP-B that, according to van Zeist, should show similar percentages of tree pollen between both the ditch spectra as well as the peat diagram. What can be seen is that there are clear differences in percentages of Quercus and Corylus between the ditch spectra and the peat spectrum. When Betula is included in the pollen sum the differences do not disappear. The assumption that Alnus is overrepresented in the Venloop diagram is easily made, as this is a dominant species in the wetland shown in the diagram. When Alnus is left out of the pollen sum however, differences in Corylus and Quercus�become greater. Several pollen sums have been tested, shown in table 6.1, but no pollen sum could be found to match the ditch spectra to zone 2 of the peat diagram. Based on these results it is not possible to come to a conclusion about which pollen sum is most suitable for barrow pollen analysis and in section 6.3 another case-study is carried out.
Furthermore, the origin of the differences between Venloop and the ditch spectra is not clear. This could indicate that the ditch spectra and zone 2 of the pollen diagram are not contemporaneous and that they reflect two periods with different vegetation composition. However, based on the 14C-dating of the diagram and
Table 6.1. Pollen percentages of the samples taken from the ditches 12 and 43 at the urnfield at Slaboek and the average percentages of zone two of the Venloop pollen diagram.
68 ancestral heaths
Figu
re 6
.5. P
olle
n di
agra
m o
f th
e Ve
nloo
p. F
igur
e af
ter
van
Mou
rik
(201
2, fi
gure
5).
69the pollen sum
the minimal change in vegetation around this 14C-date and the rather narrow archaeological dating of the ditches, this is not very likely.
Another possibility is that the distance between the Venloop and the urnfield is too great. This would imply that the Venloop diagram and the ditch spectra both show local vegetation, since they are only one kilometre apart from one another. This is surprising in regard to the peat diagram, since the assumption has always been that pollen diagrams derived from peat reflect regional vegetation composition. This would have implications for reconstructions of regional vegetation history in the Netherlands, which are mainly based on peat and lake sediment analyses. To (dis)prove this further research is necessary.
6.2 Contemporaneous barrow pollen spectra
In this paragraph another approach to reconsider the pollen sum ∑AP-Betula will be discussed. First the data used by van Zeist will be re-inspected in detail. Van Zeist based his conclusions on the results of pollen analysis of two contemporaneous barrows at Hijken. Since these two tumuli originate from the same period and are situated in the same area it is expected that their pollen spectra are similar. The original complete spectra of the barrow cemetery of Hijken were published in van Zeist (1955). Pollen percentages based on several pollen sums are shown in table 6.2. In addition the standard deviation is calculated based on the pollen percentages from both barrows to show the variation in the data. The lower the standard deviation, the less variation in pollen percentages is present. Van Zeist only looked at two species, Alnus and Corylus. His conclusion that least variability is shown when a tree pollen sum minus Betula is used is true concerning Alnus. Other arboreal species, including Corylus, however are least variable when a total pollen sum5 is used. In addition, percentages of the non-arboreal species Calluna and Poaceae are least variable with a total pollen sum. This still does not exclude n thBetula as the best pollen sum to use, since it is very unlikely that Alnus was growing on the barrow site, being more likely to have grown at the lake side about five kilometres from the barrows (van Zeist 1955). Differences in the other species should then be caused by locally varying appearance, meaning that especially Betula trees were growing on the barrow site. This is very likely, since Betula is a very common tree in heathland areas. When Betula is included in the arboreal pollen sum the variability of Alnus indeed increases. The lower variability of other arboreal species with a total pollen sum can be explained by the high numbers of Calluna, suppressing the percentages of species present in a lower abundance. The higher variability of percentages of Calluna and Poaceae with ∑AP-Betula can, as has been explained by van Zeist, be caused by local differences (van Zeist 1955).
Another case study used to investigate the pollen sum is located at the Echoput near Apeldoorn, the Netherlands. Two barrows were excavated and samples were taken from the old surface and some sods of both barrows for pollen analysis. The barrows both dated to the 4th or 3rd century cal BC, and were probably built at the same time or one relatively quickly after the other one (Fontijn 2011b, 153). For a full description of the site, the barrows, sampling for pollen analysis and a more detailed discussion of the results, see Chapter 8, case-study Echoput. The results of the pollen analysis are shown in table 6.3. Percentages are based on several pollen sums. It is expected that both barrows, since they were built in the same period, show a comparable regional vegetation pattern and even locally they are not expected to differ greatly since they were built less than 20 m apart from each
5 The total pollen sum includes all arboreal pollen taxa, all herbal pollen taxa and all spores from ferns and mosses.
other. Samples originate from the old surface and from several sods of which the barrows were constructed. Pollen spectra from the sods could possibly show some dissimilarity in local vegetation, since they could originate from a wider area. Pollen spectra from the old surface samples however, should be identical, since the barrows were built very close together.
As can be seen in table 6.3 differences between arboreal pollen spectra are smallest when a total pollen sum is used. This also counts for Alnus, in contrary to the pollen spectrum of Alnus in the Hijken barrows (see 6.2). Since pollen spectra are expressed in percentages, species that occur in large numbers have great influence on percentages of other species when this species is included in the pollen sum. In this case, when Calluna is included in the pollen sum, the percentages of other species automatically decrease, since very high numbers of Calluna pollen have been found in the Echoput samples. With these large numbers of Calluna included in the pollen sum the variance of other species automatically decreases. To avoid this effect Calluna should be left out of the pollen sum and an arboreal
% AP-Betula-Corylus
A B C Q T Ca P
Tum 5 o.s. 83.1 18.2 28.9 8.8 4.4 51.0 66.7
sod 1 73.7 38.0 19.2 22.6 1.0 64.3 25.8
sod 2 86.2 17.7 30.9 8.7 3.1 140.2 34.6
Tum 6 o.s. 81.5 31.4 25.0 13.0 3.8 63.0 82.5
sod 1 76.8 48.0 25.3 19.1 1.0 123.7 34.3
sod 2 86.4 101.2 22.7 9.7 0.7 61.8 51.1
sod 3 85.3 72.6 28.3 9.6 1.7 84.4 61.9
S.D. 4.9 30.6 4.0 5.6 1.5 34.5 20.6
% AP-Alnus
A B C Q T Ca P
Tum 5 o.s. 129.8 28.4 45.2 13.7 6.9 79.6 104.2
sod 1 88.3 45.5 23.0 27.1 1.1 77.0 31.0
sod 2 138.2 28.4 49.6 13.9 5.0 224.8 55.5
Tum 6 o.s. 108.8 41.9 33.4 17.4 5.0 84.1 110.2
sod 1 79.6 49.7 26.2 19.8 1.0 128.3 35.5
sod 2 62.8 73.6 16.5 7.0 0.5 44.9 37.2
sod 3 73.7 62.7 24.5 8.3 1.4 72.9 53.5
S.D. 28.9 16.8 12.2 6.9 2.5 59.6 32.9
% AP-Betula-Alnus
A B C Q T Ca P
Tum 5 o.s. 181.4 39.7 63.1 19.2 9.6 111.3 145.6
sod 1 162.0 83.5 42.1 49.7 2.1 141.4 56.8
sod 2 193.0 39.6 69.2 19.4 7.0 313.8 77.4
Tum 6 o.s. 187.4 72.1 57.5 29.9 8.6 144.8 189.7
sod 1 158.3 99.0 52.1 39.4 2.1 255.2 70.7
sod 2 238.2 279.1 62.5 26.7 2.0 170.3 140.9
sod 3 197.9 168.5 65.8 22.3 3.9 195.8 143.8
S.D. 26.6 85.8 9.3 11.4 3.3 71.4 49.5
Table 6.2. Pollen percentages of Hijken.
72 ancestral heaths
pollen sum should be applied. In addition, when expressed as a percentage based on a total pollen sum the variation in Calluna is not as obvious as when expressed as percentage based on a tree pollen sum since it is then bound to a maximum of 100%. Therefore, to reflect local variability in herbal vegetation it is best to use an arboreal pollen sum. Since there are only a few Betula pollen grains present in the samples it is not possible to judge the exclusion of this species as has been suggested by van Zeist (1967).
A third case-study that is valuable in the question about the pollen sum is a barrow complex near Oss in the province of North Brabant in the Netherlands (see fig 6.1). Several barrows are situated here, which have been excavated during several campaigns. During these excavations most barrows were sampled for pollen analysis. Two barrows of this barrows complex are similar in age, dating to the Hallstatt C period (Fokkens� et� al. 2009b, Fokkens� et� al. 2012). Hence, pollen spectra should display similar results in at least the regional vegetation pattern. In chapter 12, case study Oss-Zevenbergen, the site will be discussed more in detail, along with an extended overview and discussion of palynological results.
As can be seen in table 6.4 all tested species showed the least variance when a total pollen sum is used. The variance is slightly higher when an arboreal pollen sum is used. This also accounts for the herbal species, probably meaning that there is not much local variability in herbal vegetation. As in the case of the Echoput, an
Table 6.4. Pollen percentages of barrows 3 and 7 of Oss-Zevenbergen.
Pollensum
% AP-Betula
Alnus Corylus Quercus Fagus Calluna Poaceae
Barrow 3 o.s. 50.8 43.5 3.6 0.0 56.5 3.3
Barrow 3 sod1 55.3 21.9 13.7 3.6 79.3 4.6
Barrow 3 sod2 55.9 24.5 10.6 5.4 75.2 3.6
Barrow 3 sod3 52.8 39.0 3.6 0.5 48.9 41.7
Barrow 7 sod1 56.8 27.8 11.2 0.0 76.4 5.1
Barrow 7 sod2 52.0 28.1 16.3 0.0 65.7 4.9
S.D. 2.4 8.5 5.2 2.4 12.2 15.3
75the pollen sum
arboreal pollen sum can be used to show (lack of ) variations in both regional and local vegetation. Since Betula pollen is rare in these samples it is hard to verify van Zeist’s assumption that Betula should be excluded from the arboreal pollen sum.
Determining the pollen sum is determining the way to look at the landscape. In the reconstruction of barrow landscapes several approaches are of interest: what did the immediate surroundings of the barrow look like, what was the vegetation character of the open place in which the barrow has been built? Knowing the local vegetation is indispensible. Besides characterising the immediate surroundings, knowing what the further surroundings, the regional vegetation, looked like is necessary to be able to say something about the significance of barrows in the landscape. What did the wider landscape look like? When trying to determine the vegetation composition in a wider area it is best to leave the local vegetation species out of the pollen sum, since they can vary at short distances. An arboreal pollen sum would then be appropriate to answer these questions. Whether to in- or exclude Betula from the pollen sum seems to be site dependent. There is no reason to exclude Betula from the tree pollen sum according to the case-studies of Echoput and Oss-Zevenbergen. However, not many pollen grains of Betula have been found in the samples from these sites. Based on the results of Hijken, Betula is indeed very variable and of a probably local origin.
When having several contemporaneous samples from one site, information is provided about the heterogeneity of the herbal vegetation in the immediate surroundings of the site. In the case of Oss-Zevenbergen the variability of all species is least when a total pollen sum is used, but when an arboreal pollen sum is employed the variability is not much higher. Assuming that, besides the regional vegetation, the local herbal vegetation, which is most likely Calluna, probably is also very similar, indicates that the area around Oss-Zevenbergen was a quite homogenous heathland. In the case of the Echoput barrows the situation is different. Although also showing least variability of all species when a total pollen sum is used, the variability of especially Calluna is much higher when an arboreal pollen sum is used. Arboreal species show also higher variability, but the differences compared with a total pollen sum are small. It is likely that the variability in Calluna is caused by local variance of the species at the barrow site, indicating a more heterogeneous heathland.
Conclusions
In conclusion, since herbal vegetation can vary significantly even at short distances, the best pollen sum to use in barrow palynology is an arboreal pollen sum. Whether to in- or exclude Betula in this pollen sum seems to be site dependant, but one has to take into account that beside herbs also arboreal species can vary locally.
Although ∑AP seems to be the most useful pollen sum to apply in reconstructing the barrow landscape, percentages based on a total pollen sum do give valuable additional information about the barrow landscape. In barrow landscape reconstructions it is also of interest to estimate the size of the open place where the barrow has been built. The ratio between forest and herbal vegetation is a first indication and a total pollen sum should be applied to get this information. However, one has to take into account that the non-arboreal pollen percentage can fluctuate locally and preferably such an estimate should not be based on one sample. The ratio arboreal versus non arboreal pollen in relation to the size of the open space will be elaborated in the following chapter.
77the size of an open place where a barrow was built
Chapter�7
The size of an open place where a barrow was built
Previous research has indicated that barrows were built in open places (see Chapters 2 and 3), mostly with heath vegetation, surrounded by forest. Knowing the size of these open spaces would give a more detailed vision of what a barrow landscape looked like, giving valuable information about the visibility of barrows in the landscape and about interaction of prehistoric man with the landscape (see section 3.3). As has been pointed out in Chapter 2, not much is known about the dimensions of the heathland area a burial mound was constructed in. In this research it has been attempted to reconstruct the open space the barrows were built in. Not only by determining the vegetation that was present, but also the distance of the open vegetation to the forest edge.
In this investigation three steps were taken to ascertain the size of the open spaces surrounding the barrows. The first step was to determine the minimum size of the open area, by analysing the construction of the barrow itself (section 7.1). The second step involved the comparison of pollen spectra of barrow soil samples with pollen spectra of present Dutch heathland areas (section 7.2). The third step expands on step two by involving palynological models into the reconstruction of the barrow landscapes (section 7.3).
7.1 The size and the number of sods used in a barrow
A first indication about the size of the open space can be obtained from the barrow itself. Barrows were built from sods and these sods were generally taken from treeless vegetation areas. When the original size of the barrow is still preserved or can be reconstructed and the size of the sods can be determined, these data can be used to calculate the treeless area that had been used for sod taking to build the barrow. Barrows were built in an open area. It is generally assumed that sods were taken in the direct surroundings of the place the barrow was going to be built, which can be tested by comparing pollen spectra from the sods and from the old surface beneath the barrow. In addition the sediment of the sods and the barrows should be similar when sods were cut close to the barrow location. When sods were indeed taken in the vicinity of the barrow, the size of the barrow and the sods can be used to reconstruct the minimum size of the open place where the barrow was built in as has been suggested by de Kort (1999). The assumption has to be made that the barrow was a smoothly shaped spherical segment (see figure 7.1). The volume of this spherical segment can be calculated by the following formula:
Knowing the thickness of the sods, the area that needed to be stripped for 1 m3 of barrow can be calculated.
Vss = Volume spherical segmenth = height of the barrowr = radius of the barrow
Vss = • π • h • (3r²�+�1h²)16_
78 ancestral heaths
7.1.1�An�example:
Two barrows are situated at a location called the Echoput near Apeldoorn (see also 8.1). The measurements of the barrows are (van der Linde and Fontijn 2011, 33; Bourgeois and Fontijn 2011, 65):
Barrow 1: r=9.5 m (d=19 m), h=1.08 mBarrow 2: r=7.25 m (d=14.5 m), h=1.0 mSods: average h=0.25 m
These measurements can be used to calculate the area to be stripped for both barrows with the formula discussed above, which represents the minimum size of the open space. For barrow 1 an area of 615 m2 was stripped and for barrow 2 an area of 332 m2. These results will be further discussed in section 8.1.
7.2 The size of an open heathland area - examples from present Dutch heathland areas
A second indication about the extent of the open area is provided by the palynological analyses. Palynological analysis gives insight in the type of landscape that has been present at the time the pollen precipitated. The quality of the landscape can be determined by the achieved pollen spectra of an area. In addition, the quantitative reconstruction of past landscape has been an important goal in many palynological researches. To achieve this goal it is important to understand the relation between pollen and vegetation. A pollen spectrum cannot be directly translated into a vegetation composition, with other words; there is not a simple linear relationship between pollen and vegetation. Since (most) barrows were built in heath vegetation, it is the relation between pollen from a heathland area and its vegetation that is of interest in this study; or, to be more precise, the size of the heathland area and the position of the barrow inside. A comparative study has been conducted in Dutch heathland areas to investigate the relation between the pollen spectra from barrows and the distance from the barrow to the forest. Heath areas have been selected based on a few criteria. Since the purpose is a comparison of barrow landscapes, the vegetation composition from the recent heathland areas should be similar to the heathland of the barrow period. This implies that the main vegetation of the area should be Calluna� vulgaris and that the heath should be surrounded by forest. Forest in the barrow periods consisted mainly of deciduous trees, coniferous trees were not present in large numbers yet, given that most were planted in the Netherlands from the 19th century onwards (Janssen 1974, 57). At present most forests consist for a significant part of coniferous trees. To make the comparison as realistic as possible heathland areas was selected with a minimal amount of coniferous trees in and around them. Surface samples were taken in the heath area with several distances from the forest edge and analysed for pollen. Pollen spectra and the distance from the sample location to the forest edge were tested for correlation.
sod
h
r
Figure 7.1. A schematic drawing of a barrow. To calculate the minimum area that has been used for sod cutting to build a barrow, a barrow can be seen as a smoothly shaped spherical segment, which has been built with uniform sized sods. Figure after Doorenbosch 2011, figure 5.6 by J. Porck.
79the size of an open place where a barrow was built
Sites�and�sampling�methods
Herikhuizerveld I (HHV1)
Herikhuizerveld is an extensive heathland area in the National Park Veluwezoom in the east of the Netherlands (see figure 7.2). The heath vegetation is dominated by Calluna�vulgaris. The forest surrounding the open heathland area is a mixture of deciduous and coniferous trees. At the edge of the forest one single common hazel (Corylus�avellana) was present. Corylus�avellana was a very common shrub in the barrow periods and pollen of hazel were often found in considerable numbers in barrow pollen spectra. Nowadays, the shrub is much scarcer and finding a heathland area with common hazel in the close surroundings was very difficult. The presence of the species in this heathland area, even if it was just one single shrub, was an important selection criterion for this area. The area is being grazed by sheep, horses and Highland cattle. A transect of twelve moss surface samples was taken (see figure 7.3), or when moss was not present some litter was collected from the surface. Samples were prepared by the method described in section 4.2.
Herikhuizerveld II (HHV2)
Another transect of eleven moss/litter samples was taken in the Herikhuizerveld, about 1 km east from the first transect (see figure 7.3). The vegetation criteria were also applicable here, except for Corylus�avellana, which was not present close to this transect. Samples were prepared by the method described in section 4.2.
Zuiderheide (ZH)
The Zuiderheide is an area in a nature reserve called the Goois�Natuurreservaat in the middle of the Netherlands (see figure 7.2). It is an area of about 300 ha with forest, heath, drift sand areas and some small lakes. The area is grazed by sheep and cattle (mostly Highland Cattle). Pollen samples were taken along a transect
Figure 7.2. The locations of the heath areas at Herikhuizerveld (HHV), Zuiderheide (ZH) and St Anthonisbos (StA).
80 ancestral heaths
through heath vegetation, from one forest edge to another (see figure 7.4). Heath mainly consists of Calluna� vulgaris, the forest is a mixture of deciduous (Fagus�sylvatica,� Betula� pendula,� Quercus� robur,� Amelanchier� lamarckii) and coniferous trees (Pinus� sylvestris). Sixteen moss surface samples were taken, or when moss was not present some litter was collected from the surface. Samples were prepared according to the method described in section 4.2.
Sample location HHV2
Bare ground
Calluna heath
Calluna heath with Vaccinium myrtillus (blue berry)
Erica heath with Vaccinium myrtillus
Mixed heath (Calluna and Erica)
Erica heath
Poaceae (grass)
Ulex europaeus (common gorse)
Pteridium (common bracken)
Cytisus scoparius (common broom)
Mixed forest (deciduous and coniferous)0 125 250 500m
Sample location HHV1
Figure 7.3. Map of the transect of pollen samples taken at Herikhuizerveld I and II.
Mixed forest (deciduous and coniferous)
Drift sand
Mixed heath (Calluna and Poaceae)0 75 150 300 m
Sample location ZH
Sample location HHV2
Bare ground
Calluna heath
Calluna heath with Vaccinium myrtillus (blue berry)
Erica heath with Vaccinium myrtillus
Mixed heath (Calluna and Erica)
Erica heath
Poaceae (grass)
Ulex europaeus (common gorse)
Pteridium (common bracken)
Cytisus scoparius (common broom)
Mixed forest (deciduous and coniferous)0 125 250 500m
Sample location HHV1
Mixed forest (deciduous and coniferous)
Drift sand
Mixed heath (Calluna and Poaceae)0 75 150 300 m
Sample location ZH
Figure 7.4. Map of the transect of pollen samples taken at Zuiderheide.
Bare ground
Grassland
Shrubs
Alder carr
Betula-Quercus forest
Quercus-Fagus forest
Wet grassland
Sample location StA
Erica heath
Calluna heath
Mixed heath (Calluna and Poaceae)
Calluna heath, moderately grassy
Grassy Calluna heath
Water
Aquatic vegetation
Mixed forest (deciuous and coniferous)
0 250 500 1000 mFigure 7.5. Map of the sample locations at St Anthonisbos.
81the size of an open place where a barrow was built
Sint Anthonisbos
In 1999 de Kort analyzed the Sint Anthonisbos (forestry of Sint Anthonis) as part of his MA-thesis. The forestry of Sint Anthonis is a roughly 800 ha nature reserve area in the province of North Brabant in the Netherlands (see figure 7.2). It is a varied landscape of production forest for the most part, coniferous alternating with deciduous trees, and also having heath, fields and pasture areas. In the forest a heath-drift sand area of approximately 150 ha is situated, dominated by Calluna�vulgaris. The area is currently being grazed by sheep and Highland Cattle. North of this area an alder brook forest is situated. Eight samples were taken in different characteristic parts of this landscape (see figure 7.5). Surface samples were taken from the upper litter layer. Sample preparation and analysis were performed by J.W. de Kort (for methods see de Kort 1999).
Methods�of�analysis
Pollen samples were analysed as described in section 4.2. A pollen sum of total pollen minus the coniferous trees has been used. Pinaceae have been left out of the pollen sum since they were rarely present at the time the barrows were built. In addition pollen from Pinaceae are known to be transported over long distances and can therefore influence the arboreal pollen percentage, while not coming from within the nearest forest (Pidek� et� al. 2010). The percentages of arboreal (AP) and non-arboreal pollen (NAP) have been calculated based on this total pollen sum. From every sample point the distances to the surrounding forest edges were measured and the average distance to the forest edge (ADF) was determined. Using SPSS 19 Pearson product-moment correlation was carried out to identify significant positive relationships between the percentage of NAP and the ADF (obvious outliers have been removed from the data), which was the case in all of the sites. Then regression analysis was applied to the data to show the correlation between the percentage of NAP and the ADF. It was tested with Graph Pad Prism 5 whether the lines of best fit were significantly different or whether one line could fit all data sets.
Results�and�discussion
There has been discussion whether pollen percentages can be correlated with vegetation openness. Sugita et� al. state that pollen percentages are insufficient to quantify the percentage of land cover in open to semi-open land (Sugita� et�al. 1999). Svenning however, found good correlation of NAP percentage with vegetation openness in interglacial sites (Svenning 2002). This was independently confirmed by data from beetle, molluscs and plant macro fossils. In this investigation arboreal percentages and the ADF were significantly positively correlated per site and these data will be used to estimate the size of an open place. In table 7.1 arboreal pollen percentages for each sample per site are presented based on a total pollen sum minus Pinaceae. In addition the ADF per sample is shown. The AP was plotted against ADF and the line of best fit, which is a log-linear function, shows the relationship between the AP and the ADF (see figure 7.6). The lines of best fit of Sint Anthonisbos and Goois Natuurreservaat did not differ significantly from each other (p=0.26), the lines that best fit the data of Herikhuizerveld 1 and Herikhuizerveld 2 were significantly different from each other and from the other two data sets. However, the lines of best fit of HHV1 and ZH were almost significantly similar (p=0.0495). The differences between the lines become clear when applied to high percentages of non arboreal pollen. Since most barrow pollen spectra show AP percentages between 30% and 60%
82 ancestral heaths
(see Chapter 8) these differences do not have great influence on the interpretation of the barrow pollen spectra in relation to the size of the open space which line of best fit will be used.
Hypothetical arboreal percentages from 0 to 100% and the according average distance to the forest edge based on the best fit lines shown in figure 7.6 are presented in table 7.2. Most barrow pollen spectra show AP percentages between 30% and 60%. This corresponds with small open spaces with a radius of 25-100 m for 60% AP and rather large open spaces with a radius up to 500 m for 30% AP.
Other studies have investigated the relation between pollen percentages and land cover. These studies gave comparable results as described above. Contemporary moss polster pollen data indicate that closed canopy forests produce arboreal
HHV 1 HHV2 StA ZH
ADF (m) AP (%) ADF (m) AP (%) ADF (m) AP (%) ADF (m) AP (%)
93.5 58.4 10 64.4 10 81.1 10.0 93.4
146.3 40.1 392.5 42.8 123 38.2 260.0 52.7
142.1 43 391.25 26.4 318.75 25.5 266.7 34
140.4 53.5 372.5 45.5 325 16 258.3 26.7
139.5 57.4 360 15.6 370 11.2 271.7 19.2
144.8 44.9 350 41 313.75 22.7 270.0 18
149.7 62.2 337.5 28.2 316.25 23.5 280.0 19.8
156.0 57.5 320 39.7 318.75 26 285.0 38.6
163.4 42.6 295.0 34.3
270.7 24.4 298.3 27
272.7 18.6 303.3 20.1
263.3 17.1
16.7 78.3
31.7 76.6
221.7 38.5
232.3 31.9
Table 7.1. Average distance to the forest (ADF) and arboreal pollen (AP) percentages for each sample per site, based on a pollen sum minus Pinaceae.
y = -38,68ln(x) + 241,58
y = -8.4095Ln(x) + 83.675
y = -17,43ln(x) + 121,7
y = -19,51ln(x) + 138,25
0
10
20
30
40
50
60
70
80
90
100
0 50 100 150 200 250 300 350 400 450
AP
(%)
ADF (m )
HHV1
HHV2
StA
ZH
Figure 7.6. AP’s plotted against ADF, showing the lines of best-fit. HHV=Herikhuizerveld, StA=St Anthonisbos, ZH=Zuiderheide
83the size of an open place where a barrow was built
pollen percentages of 60-90%. Completely open sites showed arboreal pollen percentages of less than 50% (Mitchell 2005). Tinsley and Smith took surface samples across a woodland/heath transition in northern England (Nidderdale, Yorkshire; Tinsley and Smith 1974). The results showed that close to the woodland (oak) edge arboreal pollen percentages exceeded 50%. They also showed a rapid decline of arboreal pollen percentage within 100 m from the forest edge. The results in this investigation also show a fast decline of arboreal pollen when the distance to the forest increases, although not as extreme as in Nidderdale. Arboreal pollen percentages of less than 20% have not been found in the Dutch heathland areas. This can be explained by the fact that average distances to the forest edge do not exceed 400 m in the investigated Dutch heathland areas. The woodland may be further away in one direction, but then in another direction other woodland would be nearer. Another research by Tinsley in southwest England again showed a rapid decline in tree pollen with increasing distance from the woodland edge (Tinsley 2001) and also Lanner showed the main decrease of arboreal pollen to lie within 160 m from the woodland (Lanner 1966).
When interpreting a pollen spectrum one has to take into account that individual trees present in an open space have a great influence on the percentage of arboreal pollen. For example HHV2 sample 10 was taken very close to an oak tree (Quercus) and the according arboreal pollen percentage is 74.1%. This is a solitary tree in the heathland area, with the closest forest edge at approximately 250 m, so the distance to the forest edge and the size of the open space would be clearly underestimated in this case. This is a problem that is difficult to avoid; in this case study this sample was excluded. In all of the Dutch heathland areas of this investigation solitary trees were present and it is likely that these trees have increased the percentage of arboreal pollen. As a consequence the distance to the forest edge would be overestimated when applying these lines of best fit to data where no individual trees are present. However, when assuming prehistoric heathland areas also contained solitary trees, this effect would be compensated. On the other hand, in the case of an individual tree in close proximity to a barrow, the arboreal pollen percentage would be too high and the distance to the woodland edge would be underestimated.
This investigation has focussed on pollen spectra from heathland areas, since most barrow pollen spectra show considerable percentages of heath pollen. Precaution has to be taken when the non-arboreal component of a pollen spectrum is dominated by grasses (Poaceae) instead of heath in combination with high arboreal percentages. Groenman-van Waateringe has investigated the
Site AP (%) ADF (m) AP (%) ADF (m) AP (%) ADF (m) AP (%) ADF (m)
HHV1 0 516 30 237 60 109 90 50
HHV2 118845 552 26 1
StA 1077 193 35 6
ZH 1195 257 55 12
HHV1 10 398 40 183 70 84 100 39
HHV2 4272 198 9 0.4
StA 607 109 19 3.5
ZH 716 154 33 7
HHV1 20 307 50 142 80 65
HHV2 1536 71 3
StA 342 61 11
ZH 429 92 20
Table 7.2. Hypothetical non arboreal percentages from 0 to 100% and the according average distance to the forest edge (ADF) based on the best fit models (see figure 7.6).
84 ancestral heaths
effect of heavy grazing of sites dominated by Poaceae on the pollen production (Groenman-van Waateringe 1993). Heavy grazing prevents grasses from flowering and as a consequence from dispersing pollen grains. Pollen spectra from these sites can display very high percentage of arboreal pollen, since the percentage of the main herbal vegetation (Poaceae) is kept low by grazing. Consequently, a pollen spectrum with a high arboreal pollen percentage in combination with Poaceae being the main component of the non-arboreal pollen can indicate a site in or close to the forest, but it can also indicate a larger open grassland area that is heavily grazed.
Conclusions
This research has shown a positive correlation between the percentage of arboreal pollen and the distance to the forest edge in Dutch heathland areas. Although the relation seemed to be complicated and precautions must be taken, based on these results it seems that most barrows, showing arboreal percentages between 30% and 60%, have been built in open places varying in size from rather extended to narrow. The larger open spaces used for barrow building would have had a radius of 200-500 m, the smaller open places a radius of 25-100 m. The ratio of AP versus NAP should only be used as a rough approximation of the size of an open place. The pollen spectra from the two barrows at the Echoput (see also 8.1) will serve as an example. In table 7.5, the ratios of AP versus NAP for samples taken from barrow 1 and barrow 2 are shown. The average arboreal percentages for each barrow (30% and 27%) imply an open space of 200-500 m (see table 7.2).
7.3 The distance of a barrow to the forest edge - palynological modelling
Palynological analysis gives insight in the type of landscape that has been present at the time the pollen precipitated. As has also been demonstrated in section 7.2 the relation between pollen and vegetation is quite complicated. The relation is highly dependent on the dispersal of pollen grains from the pollen source into the surroundings. An important factor that determines the dispersal of pollen is the pollen productivity of a taxon. Other factors include pollen-specific characteristics (size, weight, shape), wind speed, height of the vegetation in the surroundings, etc. In the last few decades models of pollen dispersal and deposition have been developed, improving the understanding of this pollen-vegetation relationship. These models could be of great value when reconstructing barrow landscapes, possibly offering the opportunity to show a more detailed view of the vegetation in the surroundings of a barrow and the size of the open space.
Extended R value (ERV) models have been developed to convert pollen percentages into relative plant abundances. These models have been based on the R-value model developed by Davis, Ri=pi,k/vi,k, describing the linear relationship between the pollen percentage (pi,k) and the vegetation cover percentage (vi,k) of taxon i at site k (Davis 1963). This model has been adjusted in the following decades to account for background pollen. This resulted in the ERV-model. The basic assumption of the ERV-model is that the pollen loading (number of pollen grains) of taxon i at site k (γi,k) is linearly related to the distance-weighted plant abundance (in kg/m2 or m2/m2) of taxon i around site k (xi,k), γi,k�=�αixi,k�+�ωi. The pollen productivity of taxon i (α) and the background pollen loading of taxon i (ωi) are constant for every taxon (Prentice and Parsons 1983). Since pollen loadings can vary greatly within sites and are often not available (for example in fossil samples) percentage data have to be used. However, interdependence of pollen
85the size of an open place where a barrow was built
percentages can cause non-linearity of the relationship between pollen and vegetation percentages (Fagerlind-effect; Fagerlind 1952). The ERV-model has taken the Fagerlind-effect into account by introducing so-called site-factors to be able to relate pollen percentages to vegetation percentages. There are three submodels of the ERV-model that have different assumptions about the background pollen loading. In submodel 1 (Parsons and Prentice 1981), the background pollen loading (ωi) is assumed a constant proportion of the pollen loading of all pollen taxa γk (ωi�=�zi�•�γk, where zi is the background pollen percentage). Submodel 2 (Prentice and Parsons 1983) assumes constant background pollen percentage relative to the total plant abundance of all taxa φk (ωi�=�zi�•�φk). Submodel 3 (Sugita 1994) relates the pollen percentage to the absolute vegetation abundance, where submodels 1 and 2 used vegetation percentages. This model assumes constant background pollen loading ωi for each taxon. Distance weighing of the vegetation data is necessary, since plants close to the sampling point contribute more pollen than plants further away. The simplest way to weigh the vegetation is by dividing the plant abundance by the distance d between the plant and the sampling point, 1d_ (Prentice and Webb 1986), or by the square of the distance, (Webb� et�al. 1981). Two other models use a weighting method that is based on Sutton’s (1953) equations for dispersal of small particles in the atmosphere (Sutton 1953). These models are referred to as the Prentice/Sugita models (Prentice 1985, Sugita 1993). In these models the pollen loading is dependent on the distance, atmospheric conditions and taxon-specific properties.
The parameters α and ω can be estimated using maximum likelihood methods (Parsons and Prentice 1981), meaning that the values of these parameters are the most likely of having produced the observed values. The lower the maximum likelihood function score, the better the fit of the observed data to the model estimated data. Because the pollen assemblage is a distance-weighted function of the plant abundance, the maximum likelihood function score should decrease and approach an asymptote as the vegetation area increases. The relevant source area of pollen (RSAP), the area beyond which goodness of fit between pollen and vegetation data does not improve (Sugita 1994), can be determined. The pollen coming from beyond the RSAP can be estimated as the background pollen loading. The pollen productivities should be estimated at or beyond the RSAP (Broström�et�al. 2008). When the vegetation data are properly distance weighted the slope of the ERV-models represents an estimate of the pollen productivity (PPE=pollen productivity estimate), the y-intercept represents the background pollen loading.
Barrow�landscape�simulation
Software, called HUMPOL (Middleton and Bunting 2004), has been developed in which vegetation cover maps can be used to generate modelled pollen assemblages. This allows for comparing multiple landscape scenarios to fossil pollen spectra (Nielsen 2004, Gaillard�et�al. 2008, Soepboer and Lotter 2009). The openness of the landscape around a barrow based on the ratio NAP versus AP (see section 7.2) can be tested when PPEs are known. PPEs have been calculated for several sites throughout Europe based on the theory described above. An overview has been published by Broström et�al. (2008). Differences in PPEs between sites are not unusual. Several explanations for these variances are given. Environmental factors such as climate, vegetation structure and vegetation composition have influence on the pollen production. In addition, different vegetation survey methods
1d2_
86 ancestral heaths
(visual estimate of cover, modified circle walking 6and rooted frequency) result in differences in PPEs, so PPEs should only be compared when the vegetation survey method is similar (Bunting and Hjelle 2010). Also the method of pollen collection (moss polsters, lake sediments) can cause differences in PPE (Broström�et�al. 2008). A third factor that can cause differences is the reference taxon. PPEs are calculated relative to a reference taxon (the pollen productivity of the reference taxon is set to 1). Poaceae has become a standard reference taxon (Broström�et�al. 2008), since it is a widespread taxon and present in most vegetation communities. However, it is very likely that the pollen production of Poaceae differs between sites, causing differences in PPEs relative to the PPE of Poaceae. When comparing PPEs between sites, the reference taxon should be similar, but the variability of the reference PPE should be borne in mind. PPEs have not yet been determined in the Netherlands. Detailed vegetation and pollen data are necessary to determine PPEs for a certain region. After intensive search, it would appear that such a combination of data is not possible for Dutch heathland areas at the moment. As an alternative, PPEs from a comparable region should be used for testing the Dutch barrow landscapes. PPEs derived from Southern Sweden and Norway are probably best comparable to Dutch PPEs. Although southern Sweden has longer days in summer and temperatures in western Norway are slightly lower than in the Netherlands, both regions have a moderate maritime climate like the Netherlands. Since in southern Sweden PPEs have been calculated for herbal as well as arboreal taxa, these data will be used to simulate a Dutch heathland area to test whether these PPEs can be applied in simulating barrow landscape scenarios. However, PPEs for tree taxa were originally based on Juniperus and later recalculated for Poaceae as reference taxon (Sugita�et�al. 1999, Broström�et�al. 2008). This should be kept in mind when interpreting the results. The software that has been used in this simulation is HUMPOL (Middleton and Bunting 2004).
St Anthonisbos
The St Anthonisbos (see section 7.2) seemed to be appropriate for simulation. A digital vegetation cover map from the area was provided by Staatsbosbeheer. This digital vegetation map was converted into ASCII for the HUMPOL software to process it (see figure 7.7). Vegetation communities have been simplified based on the available PPEs. Fall speeds of the included taxa have been based on Sugita et�al. (1999) and Broström et�al. (2004). See for an overview of used PPEs and fall speeds table 7.3. Wind speed was set to 4.05 m s-1 according to the daily mean wind speed measured at the Bilt from 1904-2012. The wind rose was set in 16 directions according to the frequency distribution of daily mean wind direction at the Bilt (The Netherlands) from 1904-2012. Both wind speed and wind rose are based on data provided by the Royal Netherlands Meteorological Institute7. It is often assumed that the prevailing wind direction in the Netherlands is south-southwest. The mean frequency distribution of the wind direction for the last century shows that this is not entirely correct (see figure 7.8). November, December and January have been excluded for the calculation of the mean wind speed and wind rose, since the majority of plants do not produce pollen during these months8.
6 Within a series of concentric rings around the sample point a visual estimate of cover for each taxon within each full ring is recorded.
7 (http://climexp.knmi.nl)8 Corylus (hazel) is one of the earliest to flower in February, while Ericaceae (heath) can still flower up
to October (Weeda�et�al. 1988, 37).
87the size of an open place where a barrow was built
Pollen spectra have been determined from eight sample locations in the area by de Kort (see also 7.2). Simulated pollen percentages of these eight locations have been calculated by the simulation program based on PPEs from south Sweden. The simulated and the percentage data observed in the real samples for the taxa used in the simulation are shown in table 7.4 (simulation 1 versus observed 1). As can be seen the simulated data fit the observed data considerably well. Although the ratio between Calluna and Poaceae (see table 7.4) appears to fall short of accurately portraying the situation, the ratio between arboreal and non arboreal pollen percentages seems to be appropriate, with exception of samples 5, 6 and 7. This is probably due to pine trees close to these sample locations (de Kort 1999). When Pinus is left out of the simulation, the simulated data fit the observed pollen data very well (see table 7.4). The ratio Calluna versus Poaceae not being
0 250 500 1000 m
Betula-Quercus
Bare
Alder carr
Dry heath
Dry heath, slightly grassy
Dry heath, moderately grassy
Dry heath, grassy
Wet heath
Grass
Figure 7.7. Vegetation cover map of St Anthonisbos as used in the simulations. Betula-Quercus=15% Betula, 30% Quercus, 10% Poaceae ; Bare= no vegetation; Alder carr= 70% Alnus, 5% Salix, 10% Poaceae , Dry heath= 90% Calluna; Dry heath, slightly grassy= 70% Calluna, 10% Poaceae ;Dry heath, moderately grassy= 60% Calluna, 30% Poaceae; Dry heath, grassy= 40% Calluna, 30% Poaceae; Wet heath= 30% Calluna, 20% Poaceae ; Grass= 90% Poaceae.
Figure 7.8. Wind rose according to the frequency distribution of daily mean wind direction at the Bilt (The Netherlands) from 1904-2012. November, December and January have been excluded.
PPE Fall speed (m/s)
Alnus 4.2 0.021
Betula 8.9 0.024
Corylus 1.4 0.025
Fagus 6.7 0.057
Quercus 7.6 0.035
Salix 1.3 0.022
Tilia 1.3 0.032
Calluna 4.7 0.038
Poaceae 1 0.035
Table 7.3. Pollen productivity estimates (PPE) and fall speeds of the pollen from the taxa used in the simulations.
88 ancestral heaths
sample 1 sample 2
Sim. 1 real 1 sim. 2 real 2 sim. 1 real 1 sim. 2 real 2
AP 26.02 42.70 19.07 22.22 29.52 42.01 21.96 25.77
Table 7.4. Simulated and real pollen percentages for St Anthonisbos. Simulation 1 is including Pinus, simulation 2 excluding Pinus.
89the size of an open place where a barrow was built
accurate can be explained by the vegetation data of the vegetation cover map not being detailed enough.
Echoput
As a pilot study the PPEs from south Sweden will be applied to a barrow landscape. The assumption has to be made that PPEs did not change through time. Two barrows are situated near Apeldoorn at a location called the Echoput. These barrows have been excavated and palynologically investigated. The case study will be extensively discussed in chapter 8 (see 8.1; see also 5.3 and 7.2). In MOSAIC (part of the HUMPOL software) a barrow landscape of 1.5 by 1.5 km has been designed based on the palynological results of the Echoput barrows. The taxa considered in this simulation are Calluna,�Poaceae,�Alnus,�Corylus,�Fagus and Quercus.�The average percentage of AP in the pollen spectra based on the taxa used in the simulation is 30% (see table 7.5). Based on the results this open space consisting of a mixture of Calluna heath and grasses was created with a radius of 300 m (see table 7.2).
The Echoput samples showed rather high percentages of Corylus. Corylus is a tree that requires light conditions to grow and it will not be able to survive in the reduced light conditions in a closed forest. This indicates that the open space was probably surrounded by a mantle vegetation mainly consisting of Corylus, shown by a white ring in the simulation landscape (see figure 9a). Based on the observed pollen percentages in the Echoput samples, the surrounding forest consisted mainly of Quercus and some Fagus. In the simulation landscape a hypothetical mixture based on an educated guess (e.g. observed pollen percentages and fall speed of the taxa) of 75% Quercus and 15% Fagus was created, surrounding the Corylus vegetation mantle. The last species to add to the simulation landscape is Alnus. Alnus is a tree that requires moist conditions to grow and it is most likely that alder carr was present in the lower and wetter brook valleys in the environment. Since these were located south and west of the Echoput barrows this is where alder carr was placed in the simulation landscape. The simulation landscape with the according vegetation communities is shown in figure 7.9a. Fall speed and PPEs from southern Sweden have been applied to simulate pollen assemblages at the locations of the two Echoput barrows. The wind rose has been set as it was in the St Anthonis simulation.
Table 7.6 shows the simulated (e.g. the percentages that were obtained by the simulation) and the observed (e.g. in the ‘real’ Echoput samples) pollen percentages, based on a total pollen sum of taxa used in the simulation. The total arboreal (AP) and non-arboreal pollen (NAP) percentages have been calculated as well. Note how the simulated AP and observed AP are very different from one another. This indicates that the size of the open space was overestimated in the first simulation. To improve the simulation, the open space in the simulation landscape was decreased to a radius of 200 m, all other components being left unchanged (figure 7.9b). In table 7.5 can be seen that the percentage of AP now fits the observed AP percentage. However, the composition of the vegetation communities seems not to be accurate. Several simulation landscapes with varying vegetation compositions were tested to come to a possible landscape scenario where the simulated data fit the observed data. Such a possible landscape scenario is shown in figure 7.10.
AP (%) NAP (%)
Barrow 1 31.25 68.75
Barrow 2 28.37 71.63
Table 7.5. Average arboreal percentages (AP) and non arboreal percentages (NAP) for the two Echoput barrows.
90 ancestral heaths
This landscape shows an open place with a grassy heathland. The alder forest is adjacent to this heathland open space. A wide forest edge consisting of Corylus surrounds the open space. The surrounding forest is quite open, with only 50% Quercus and 15% Fagus. However, this is not a very realistic landscape. The geology of the environment is also of great influence on the landscape. To create a more realistic landscape a digital elevation map of the environment (Dutch: AHN Actueel�Hoogtebestand�Nederland) was combined with the simulation landscape in figure 7.10. The result is shown in figure 7.11. In this scenario the heath area is not circular, but stretched along the top of the plateau the Echoput barrows were built on. This grassy heathland, 40% Calluna and 50% Poaceae, is approximately 700 m long and 300 m wide. The barrows are not located in the centre, but in the southwest; the ADF is approximately 250 m. Alder carr is situated in the lowest areas, the brook valleys. The heath is surrounded by a zone of Corylus of approximately 150 m in width. This zone gradually shades into the forest, which is very open with 30% Quercus and 5% Fagus. Simulated pollen percentages show that the alder carr is greatly underestimated and that the abundance of Quercus is slightly overestimated. It is however not very likely that the alder carr was situated closer to the barrows. It is possible that the PPE of Alnus used in this simulation was too low. A study performed in England has for example calculated a PPE for Alnus of 11.4 (Broström�et�al. 2005) and in Estonia an Alnus PPE of 13.92 was found (Poska�et�al. 2011). When the PPE of Alnus in this simulation is set to 11.4 the simulated pollen percentages are indeed much more similar to the real pollen percentages (see table 7.5).
The investigation gives promising results for the use of models in the reconstruction of past barrow landscapes. Quantitative reconstructions of barrow landscapes would be very useful to enhance our knowledge about the environments that the barrows were built in. These simulations were based on pollen productivity estimates (PPEs) that have been determined in southern Sweden. As has been shown by Broström et al. (2008) PPEs can differ between sites. Although the PPEs from southern Sweden seem to be fairly applicable in Dutch simulations it is very likely that the actual PPEs in the Netherlands were not exactly alike, as has also been been shown in the last simulation. Even within the Netherlands PPEs could show variations between different types of landscapes. Barrows were mainly been built in heath vegetation. It is therefore recommended to have detailed vegetation surveys and collection of pollen data in Dutch heathland areas to be able to achieve PPEs of the major Dutch heathland taxa. The vegetation survey area should be large enough to cover the RSAP of the pollen. Bunting and Hjelle showed that the relevant source area of non-arboreal pollen in heathland areas is less than 4 m (Bunting and Hjelle 2010). This would make the achievement of PPEs of the herbal heathland taxa relatively simple. For the determination of arboreal PPEs
Alder carr
Quercus
Fagus
Bare
Corylus forest edge
Dry heath, moderately grassy100 300m0100 300m0
Figure 7.9a-b. Simulated landscape for the Echoput barrows with different sizes of heathland (a=300m and b=200m). Alder carr=90% Alnus; Quercus=100% Quercus; Fagus=100% Fagus; Corylus forest edge= 70% Corylus, 10% Calluna, 10% Poaceae; Dry heath= 50% Calluna, 40% Poaceae.
91the size of an open place where a barrow was built
Figure 7.11. Example for an Echoput landscape based on the AHN. Alder carr= 90% Alnus; Background forest= 30% Quercus, 5% Fagus, 20% Poaceae; Corylus heath edge= 70% Corylus, 10% Calluna, 10% Poaceae; Corylus forest edge= 70% Corylus, 5% Quercus, 10% Poaceae; Dry heath= 40% Calluna, 50% Poaceae.
Alnus
real sim. 1 sim. 2 sim. 3 sim. 4 sim. 5
barrow 1 19.88 3.00 2.86 12.17 6.05 14.87
barrow 2 16.30 2.98 2.84 12.92 5.66 14.01
Corylus
barrow 1 4.76 0.39 0.54 2.13 3.93 3.56
barrow 2 4.91 0.39 0.54 2.02 4.35 3.97
Quercus
real sim. 1 sim. 2 sim. 3 sim. 4 sim. 5
barrow 1 16.59 23.63 11.4 10.89 9.87 16.59
barrow 2 16.56 23.59 11.01 11.37 10.36 16.56
Poaceae
real sim. 1 sim. 2 sim. 3 sim. 4 sim. 5
barrow 1 16.15 11.30 10.14 19.01 17.08 15.47
barrow 2 19.26 11.31 10.15 18.95 16.99 15.48
Fagus
real sim. 1 sim. 2 sim. 3 sim. 4 sim. 5
barrow 1 0.53 1.97 2.86 1.94 1.03 0.93
barrow 2 0.31 1.96 2.85 1.87 1.07 0.98
Calluna
real sim. 1 sim. 2 sim. 3 sim. 4 sim. 5
barrow 1 52.60 66.75 59.98 53.35 61.03 55.3
barrow 2 52.59 66.79 60.03 53.22 60.55 55.2
AP
real sim. 1 sim. 2 sim. 3 sim. 4 sim. 5
barrow 1 31.25 21.95 29.89 27.64 21.9 29.23
barrow 2 28.15 21.89 29.82 27.82 22.45 29.32
Table 7.6. Simulated and real (average) pollen percentages for the two Echoput barrows. Sim1=landscape shown in fig.7.10a (ADF=300 m); sim2= landscape shown in fig.7.10bx (ADF=200 m); sim3= landscape shown in fig. 7.11; sim4=landscape shown in fig. 7.12 (based on AHN) ; sim5=landscape shown in fig.12, with PPE for Alnus adjusted to 11.4. Wind speed was set to 4.05 and wind rose according to the Dutch growing season for all simulations.
92 ancestral heaths
the survey area should be much wider, approximately 1500-2000 metre radius (Broström�et�al. 2008). A relatively simple approach of modelling landscape has been used here as a pilot study to test PPEs on a barrow landscape scenario. When Dutch PPEs are known this approach might be extended by using the ‘Landscape Reconstruction Algorithm’ (LRA) developed by Sugita (2007a, b). The inverse forms of the ERV-models can be used to reconstruct past vegetation abundance. With an estimate of the pollen productivity and known pollen proportions, vegetation proportions can be calculated. However, the background pollen component is not constant and changes over time. This change in background pollen can be estimated when regional plant abundance and the pollen source area are known. For that reason the LRA has been developed, estimating regional and local vegetation abundance. To obtain a reliable estimate of the regional vegetation it is advisable to use pollen assemblages from large sites (>100-500 ha) or when such large sites are not available, from as many smaller sites as possible. It would be of value to investigate whether this approach can be applied to Dutch barrow landscapes.
7.4 Discussion
In this chapter an attempt was made to give an estimate of the size of the open space barrows were built in. The number of sods that were used to construct a barrow can provide a first indication of the minimum size of this open spot (section 7.1). The ratio between AP and NAP has been used to get a second approximation of the size of the heath area a barrow was built in, by estimating the Average Distance to the Forest (ADF; section7.2). A positive correlation between the size of an open place and the percentage of NAP was found, but there are differences present between the sites and the relation was therefore complicated. Also Broström et�al. showed the ratio AP versus NAP cannot be simply translated in vegetation openness, and that differences in background pollen appear to play an important role in the relative representation of NAP (Broström�et�al. 1998). Sugita et� al. too underline the importance of background pollen coming from the regional vegetation (Sugita� et� al. 1999). The landscape simulation models and software that have been developed could give better insight in the relation between Non Arboreal Pollen percentage and landscape openness and enhance our understanding on what a barrow landscape looked like (7.3). To apply these models properly to Dutch barrow landscapes further research is recommended. This study will therefore not test further barrow landscape scenarios with the palynological modelling methods, excepting the Echoput.
The three approaches have been applied to the Echoput case study. The first approach suggested a minimum size of the open space of about 615 m2 for barrow 1 and 332 m2 for barrow 2. This could indicate a circular open spot with an ADF of about 14 m and 10 m respectively, which seems rather small. The second approach yielded an ADF of approximately 300 m, which is indeed much greater. The third approach indicated that an ADF of 300 m might be an overestimation. The ADF was corrected to approximately 250 m. The following chapters of this thesis will discuss several case studies and for each case study the size of the open space a barrow was built in will be estimated. Since the palynological modelling approach still needs further research, the second approach (e.g. AP:NAP) will be used as a standard in the following chapters. It should be kept in mind though that a slight overestimation of the size of the open space could occur.
Part Three
Case–studies
Part 3 will discuss several case studies, gathering information in answer to the questions that were put forward in the beginning of this thesis (Chapter 3): what did the barrow landscape look like? An answer to this question is needed in order to understand the function of barrows in the landscape and how barrows relate with the natural and cultural landscape surrounding them. What was the original impetus behind the creation of the open space a barrow was built in, and what was that open space used for? Human activity played an important role in the history of an open space. An open space could for example have been used as a grazing area, for the cultivation of crops, or it could have served as settlement location.
In part 2, Chapters 4-7, several methodological aspects of pollen sampling in barrow research have been described and discussed. In addition the uncertainties, assumptions and consequences for the results were discussed as well as how to interpret the results. All have a bearing on part three of this thesis. In Chapter 6 it was concluded that the best pollen sum to use in barrow research is an Arboreal Pollen (AP) sum. Inclusion of Betula (birch) should be decided per site.. To be able to compare all sites with one another it has been decided to apply an arboreal pollen sum minus Betula to all sites. The percentages of arboreal and non arboreal pollen have been calculated based on a total pollen sum (see sections 6.2 and 7.2).
In Chapters 8-12 several case-studies are discussed. Chapters 8-10 consider three research areas that are all situated on the push moraines that were formed during the Early and Middle Pleistocene in the northern half of the Netherlands. Chapters 11 and 12 will study two research areas that are situated in the southern part of the Netherlands, where cover sand was deposited during the Late Pleistocene. Most of the palynological data discussed in Chapters 8-12 were originally obtained by other researchers (for references see the corresponding case-studies). For the case-studies most of the data were re-analysed and pollen spectra and/or pollen diagrams were re-plotted. In some cases pollen percentage data had to be recalculated based on the appropriate pollen sum for the present barrows study (e.g.� tree pollen sum minus Betula, see Chapter 6). Subsequently all (re-analysed) data have been reinterpreted by the author of the present work.
Not all methods described in Chapters 4-7 could be applied to all case-studies. As has been mentioned above, much of the palynological data used in the following chapters were obtained by other researchers many years ago. It is often the case that documentation about the sampling method and the exact sample locations is not available, especially when dealing with older excavations. Many burial mounds were excavated in the 1920s-1940s. Knowledge about barrows has grown enormously since then and excavation methods are much more detailed now. The older excavations sometimes lack proper documentation, and when
this is available, is sadly incomplete. Dating of the excavated barrows was usually based on grave goods, but the exact location of these finds was not always well documented. Multi-period barrows were often not recognized, while stratigraphic differences were not distinguished. Hence, it is difficult to relate grave goods to proper dating of the barrow. Many of these barrows were re-excavated during the 1970s. These re-excavations were mostly based on the documentation of the older excavations, which we now know was not always correct or complete. Many samples for pollen analysis were taken during these re-excavations. Since (the original) documentation was not always accurate it is not in all cases clear what the exact sample location was in a barrow. It is therefore hard to establish the relation of the samples to the dating of the barrow. The old surface of the second period of barrow at Stroe (section 8.10), for example, was sampled following the documentation, while with the present knowledge it cannot be confirmed that there was indeed a second period in that barrow. In such a case it is hard to specify the exact sample location and to say more on the dating of the according pollen spectrum. However, since it is not always possible to retrieve the necessary information to clarify this relation, one has to rely on data that are available. As a consequence one has to assume that not all pollen spectra are correctly dated. However, only about 5% of the barrows discussed in this thesis seem to have encountered this problem and this will be accounted for in the discussion of the corresponding case-studies (e.g.� 8.3 Ermelo,� 8.10 Stroe, 8.11 Uddelermeer, 9.1 Warnsborn and 9.1 Wolfheze). For a more extensive discussion about the reliability of older excavations and consequences for interpretation in present research see Bourgeois (2013, p.47-48).
As a final introductory note to the case-study chapters, it should be mentioned that many barrows are known by several names. Barrows were often re-excavated and across several publications the same barrows were assigned different names. For this thesis all the barrows that are discussed have been given a new name. In Appendix I an overview can be found of the other names and numbers a given barrow was assigned in the several publications from which data were extracted for use in the following chapters.
95northern and central veluwe
Chapter�8
Northern and central Veluwe
In the northern and central part of the Veluwe (the Netherlands), palynological data was obtained from several barrows that exist in an area of approximately 20 by 20 km (see figure 8.1). In the following sections the palynological results of these barrows will be described and discussed, based on the theory set out in part two of this thesis (Chapter 4–7). This chapter will start with two barrows at the Echoput. All the data from these barrows were collected by the author. Most of the methods described in Chapters 4-7 have been applied to the barrows of the Echoput and therefore these barrows will feature first. The second group of barrows that will be discussed in this chapter is located at Niersen-Vaassen. The data from two barrows of Niersen were collected by the author. The data of all other barrows in this chapter were obtained from other researchers and they will be discussed after the discussion of the Echoput barrows and the barrows of Niersen-Vaassen. At the end of this chapter a pollen diagram derived from a lake sediment (Uddelermeer, see section 8.11) will be presented after all the barrows have been discussed. This pollen diagram will provide more information about the vegetation in the wider surroundings of the barrows.
Echoput
Niersen
Celtic Field
Vaassen
Ermelo
Putten
Boeschoten
Stroe
Uddelermeer
Ugchelen
Vierhouten Emst
6000 m0 1500 3000
150 m
0 m
m NAP
Other barrows
Sampled barrow
Celtic �eldFigure 8.1. Detailed map of the Echoput and surroundings with the location of all discussed barrows. The map is based on digital elevation model of the AHN (copyright www.ahn.nl).
96 ancestral heaths
8.1 Echoput
Close to Apeldoorn two barrows are situated on a small hilltop. The site that these barrows are located at is known as the Echoput. Excavation of these barrows took place in the summer of 2007 (see figure 8.2). For an extensive description of the excavation results see Fontijn et�al. (Fontijn�et�al. 2011)
8.1.1�Site�description
Both barrows showed similarities in construction and soil properties. They were both built on a surface in which an Umbric Podzol (Dutch soils classification: Holtpodzol�gY30 [see Bodemkaart�van�Nederland9]) had developed. The barrows were constructed of sods that were still clearly visible, which were taken from a Holtpodzol identical to the one they were placed on top of. The old surface was well recognizable in the soil profile (see figure 8.3). The barrows were dated to
9 Bodemkaart van Nederland 1:50.000 toelichting kaartblad 33 west Apeldoorn, p. 27, 67-8.
Figure 8.2. The Echoput barrows one year after they were excavated.organic layer
A horizon on top of barrow
barrow, with sods visible
A horizon under barrow
B horizon under barrow
(B)/C horizon under barrow
old surface
Figure 8.3. A section of Echoput barrow 2 (section 2.1 of barrow 2 in trench 2) with the old surface clearly visible. Photograph by Bourgeois 2012, figure 3.2).
97northern and central veluwe
the Middle or Late Iron Age, based on 14C of charcoal from both ring ditches: 2225±30 BP (GrA-44706; 331-203 cal BC, calibrated with Oxcal 4.2; mound 1) and 2240±35 BP (GrA-44879; 326-204 cal BC, calibrated with Oxcal 4.2; mound 2) as post quem dates. In addition, a terminus�ante�quem date for mound 1 of 2190±35 BP (GrN-32158; 376-171 cal BC, calibrated with Oxcal 4.2) was derived from charcoal from a pit (S1) that was dug into the mound. The combination of post and ante� quem� dates and the similarity of both mounds make it likely that both mounds were constructed in the 4th or 3rd century cal BC (Fontijn 2011, 152-153).
Excavation of the surroundings revealed a large amount of features including a round post structure and two other post structures (see figure 8.4). Traces dating to the Late Mesolithic and the Late Neolithic B period have been found underneath both mounds (van der Linde and Fontijn 2011, 60-61; Bourgeois and Fontijn 2011, 85).
The Echoput is a somewhat aberrant place in the local environment. It is one of the highest places in this part of the Veluwe (95 m above Amsterdam Ordnance Datum). The Veluwe�exhibits an average yearly precipitation sum that is considerably higher than in most parts of the Netherlands, since orographic precipitation occurs on the elevated parts, like at the Echoput. The moist air is forced to ascend where the landscape is elevated, causing the air to cool down, form clouds and rain out. The local (loamy) soil conditions prevents the water from draining off immediately, which makes the Echoput hill a rather wet place, with pools of water forming regularly (see for a more detailed description Fontijn 2011a, 29-31). The surrounding area is covered with mixed forest (deciduous and coniferous forest). The modern deciduous forest consists mainly of oak coppice (Quercus� sp.), with an undergrowth of blueberries (Vaccinium� myrtillus)� and grasses, but also birches (Betula�sp.) and beeches (Fagus�sylvatica) are present. The
Figure 8.4. Plan of all trenches of the excavation of the Echoput barrows. Trench numbers are indicated. The P-numbers indicate the post features of which the fills have been sampled for pollen analysis. Figure by P. Valentijn/ M. Doorenbosch.
9
16 17
18 19
20
4
5
24
21
10
11
13
6
14
8
7
23
22
15
P27
P10
P1
P12P5
P7
P2 1
2
3
Barrow 1
Barrow 2
12
10 m0
98 ancestral heaths
95.367 m NAP
95.367 m NAP
NW
SEpr
o�le
1.9
1m0
o.s.
1o.
s. 2
sod
1so
d 2
pro�le 1.9
dist
urba
nce
soil
on to
p of
bar
row
{ tree
-tru
nk
feat
ure
sod
(veg
etat
ion
side
is d
arke
r)
char
coal
natu
ral s
ub-s
oil
rest
aura
tion
sand
pro�
le p
olle
n sa
mpl
es
{5m
0
pro�
le 1
polle
n sa
mpl
es
Figu
re 8
.5a-
c. P
rofil
e se
ctio
ns o
f Ech
oput
ba
rrow
1 (a
-b) a
nd b
arro
w 2
(c) w
ith th
e lo
catio
n of
the
polle
n sa
mpl
es in
dica
ted.
Fi
gure
4a-
b af
ter
van
der
Lind
e an
d Fo
ntijn
201
1, fi
gure
2.1
7 an
d 2.
18
with
cha
nges
; figu
re a
fter
Bour
geoi
s an
d Fo
ntijn
(201
1, fi
gure
3.8
A w
ith
chan
ges)
.
Figu
re 8
.5a
99northern and central veluwe
95.366 m NAP
95.366 m NAP
NE
SWpr
o�le
1.1
0
1m0
sod
3so
d 4
o.s.
3o.
s. 4
pro�l
e 1.10
5m0
Figu
re 8
.5b
100 ancestral heaths
94.779 m NAP
94.821 m NAP
NW
SEpr
o�le
3.1
pro�
le 2
.1
1m0
pro�
le 2
pro�le 3.1
pro�le 2.1
sod
3so
d 2
sod
1
o.s.
3o.
s. 2
o.s.
1
5m0
Figu
re 8
.5c
101northern and central veluwe
coniferous forest consists mostly of pines (Pinus�sp.), together with some Douglas-firs (Pseudotsuga�menziesii) and Larches (Larix�sp.). The barrows were located in the forest, overgrown with trees and other vegetation, making them difficult to spot. In 1999 both barrows were consolidated. The above ground parts of the trees found on and around the barrows were removed, and the barrows were covered with white sand to regain their presumed original shape.
8.1.2�Pollen�sampling�and�analysis
During the excavation samples were collected for pollen analysis. For each mound, individual samples were taken from different locations in and under the barrows by Bakels and Achterkamp (University of Leiden, the Netherlands). From each mound several samples were taken from the old surface underneath the mounds, where the old surface was clearly visible. In addition several samples from the top (e.g. the old surface) of different good recognizable sods of both mounds were taken. The bottom of the ditch around mound 1 and the fill of a small pit (structure 17) that was found underneath mound 1 were also sampled. Sampling was done using methods described in Chapter 4. From these samples a selection was made for analysis, based on the quality (colour and texture) of the soil. An overview of the samples that were taken and analysed is shown in table 8.1. The location of the analysed samples in the mounds is given in figure 8.5. In addition samples were taken from the soil profile underneath both mounds. Samples were collected as has been described in 4.1.3 over a length of 30 cm, containing the A and most of the B horizon (see figure 8.5). In addition many samples were taken from the fill of post features that were found in the surroundings of which four
Sample location Sample name
Echoput1 Profile 1.9 Soil profile series 1-19
20-35
Profile 1.9 Sod samples Echoput1_sod1
Echoput1_sod2
Old surface samples Echoput1_os1
Echoput1_os2
Profile 1.10 Ditch samples Echoput1_ ditch
Sod samples Echoput1_sod 3
Echoput1_sod 4
Old surface samples Echput1_os 3
Echoput1_os 4
Level 10 Structure 17 Pit 1
Echoput 2 Profile 2.1 Soil profile series 1-24
Profile 2.1 Soil profile series 25-29
Profile 2.1 Sod samples Echoput2_ sod 1
Echoput2_ sod 2
Echoput2_ sod 3
Old surface samples Echoput2_ os 1
Echoput2_ os 2
Echoput2_ os 3
Trench 9 Level 1 Post 10
Post 27
Trench 16 Level 1 Post 1
Trench 18 Level 1 Post 2
Trench 21 Level 1 Post 5
Post 12
Table 8.1. Overview of the samples taken from the Echoput barrows and their surroundings. The samples that have been analysed are indicated by a shade. Those with a darker shade did not contain any or not enough pollen. For the exact location of the analysed samples, see figure 8.4 and 8.5. os = old surface underneath mound.
102 ancestral heaths
were analysed. These four post features belonged to four different structures (see figure 8.4). A description of the sampling method and discussion can be found in 4.1.5. Chemical treatment and analysis of the samples took place as described in 4.2. For all pollen spectra a pollen sum of ∑AP–Betula (chapter 6) has been used, except for the AP and NAP. These percentages have been based on a total pollen sum. A minimum of 300 arboreal pollen grains (excluding Betula) per sample have been counted by the author of the present work.
8.1.3�Results
For mound 1 four samples of the old surface, four sod samples, a sample taken from the ditch (profile 1.10) and a sample from a small pit (level 10, structure 17) underneath mound 1 have been analysed (see table 8.1). Sample 2 from the old surface did not contain enough pollen to count, as did the ditch sample and the sample from the pit. The remaining samples contained sufficiently preserved pollen. In addition the soil profile underneath mound 1 was sampled, from which pollen could be obtained from 1 to 19 cm below the old surface. From mound 2 the three samples from the old surface and the three sod samples gave good results, although pollen preservation was relatively poor. From the pollen series that was taken the soil profile underneath mound 2 results could be obtained from 1 until 25 cm below the old surface. The samples derived from 25-29 cm were very poor in pollen numbers. Below the results will be described.
Pollen from the old surface underneath the mounds and from the sods
The pollen spectra from the two barrows show no clear differences and therefore they will be discussed together. In addition, no differences could be noted between the pollen spectra from the old surface and the sods of both mounds, so the result description below counts for both the old surface and the sod spectra. The percentage of non arboreal pollen (NAP) exceeds the percentage of arboreal pollen (AP) in all samples (see figure 8.6). Especially heather (Calluna�vulgaris)�and less but still in considerable amounts Poaceae (grasses) show high percentages. The most abundant tree pollen types are Alnus�(alder, 35-70%),�Quercus�(oak, 15-40%) and Corylus (hazel, 15-25%). The presence of Carpinus (hornbeam) in some of the spectra should be noted. Some Pinus (pine) pollen is present, but it is unlikely that this tree was present in the surrounding forest. Pinus is not a common native tree in the Netherlands in the time period after the Boreal but before the large scale Pinus plantation starting in the 19th century AD (Janssen 1974, 57) and therefore the Pinus pollen in the pollen spectra most likely came from long-distance. This accounts for all pollen spectra that will be discussed. Anthropogenic indicators (cf. Behre 1986) and grazing indicators (cf. Hjelle 1999) are present in all the samples. One pollen grain of Secale (rye) was found in one of the sods (2) of mound 2. Non-pollen palynomorphs were mostly represented by Sphagnum (peat moss) and moss spores, but also algae like Debarya�glyptosperma�and Zygnema�type 314 (van Geel in: van Hoeve and Hendrikse 1998) are notable.
103northern and central veluwe
MIA
/LIA
2040
6080
100
AP
NAP
2040
6080
Alnus
1
Carpinus
2040
Corylus
5Fagus
5Fraxinus 1
Hederaheli
x
5Pinus
2040
Quercus
1
Rubus-type 1
Salix
5Tilia
5Betula
100
200
300
400
Callunavulgaris
5Vaccinium-type
1Arte
misia 5Aste
race
aetubuli�
orae
1
Chenopodiaceae
1
Secale
20
Astera
ceaelig
uli�ora
e
1
Galium-ty
pe
5Plantagolanceolata
5010
015
0
Poaceae
1
Ranunculusacris-ty
pe
1
Rumexacetosa
/R. acetosella
-type
5Succisa
1
Angelicaarchangeli
ca-type
1
Anthriscu
ssylvestris
1
Apiaceae 1
Astragalus-ty
pe
1
Cannabissativ
a
1
Caryophylla
ceae
1
Chrysosp
lenium
1
Cuscutaeuropaea-ty
pe
5Cyperaceae
1
Filipendula-ty
pe
1
Hypericum
perfora
tum-type
1
Jasio
ne
1
Liliace
ae 1
Mentha-ty
pe
1
Prunella
-type
1
Spergularia
arvense
1
Trifoliu
m-type
1
TypeA
1
Huperzia
20
Monolete
psilate
fernsp
ores
1
Monolete
verruca
tefern
spore
s
5Polypodiumvulgare
5Trilete
fernsp
ores
20
Sphagnum 5Concentric
ystes
1
Debarya 5Zygnemataceae
1
BvGt1
1
BvGt159 5BvGt333 1BvGt58 1
BvGt731 5BvGtA
20
Indeterm
inable
544
309
316
309
362
310
313
328
312
318
315
338
220
Pollensum
(AP-Betula)
2103 95
2
1069 98
7
1152
1165 93
8
1549
1016
1327
1259
1076 73
4
Totalpollensu
m
Hea
thA
nthr
opog
enic
indi
cato
rs
Upl
and
herb
sFe
rns
and
aqua
ticm
osse
sA
lgae
Non
polle
npa
lyno
mor
phs
Gra
zing
indi
cato
rsEc
hopu
tBa
rrow
1an
d2,
old
surf
ace
and
sods
Echo
put1
_sod
1
Echo
put1
_sod
3
Echo
put1
_sod
4
Echo
put1
_os1
Echo
put1
_os2
Echo
put1
_os3
Echo
put1
_os4
Echo
put2
_sod
1
Echo
put2
_sod
2
Echo
put2
_sod
3
Echo
put2
_os1
Echo
put2
_os2
Echo
put2
_os3
Figu
re 8
.6. P
olle
n sp
ectr
a fr
om th
e so
d an
d ol
d su
rfac
e sa
mpl
es ta
ken
from
Ech
oput
ba
rrow
1 a
nd 2
. Spe
ctra
are
giv
en in
%
base
d on
a tr
ee p
olle
n su
m m
inus
Bet
ula
polle
n. In
the
tota
l AP
(=ar
bore
al p
olle
n)
Betu
la is
incl
uded
. In
the
tota
l NA
P (=
non
ar
bore
al p
olle
n) s
pore
s ar
e in
clud
ed, n
on
polle
n pa
lyno
mor
phs
are
excl
uded
. Diff
eren
t sc
ales
hav
e be
en u
sed,
indi
cate
d w
ith
diffe
rent
col
ours
. MIA
= M
iddl
e Ir
on A
ge,
LIA
= La
te Ir
on A
ge.
104 ancestral heaths
Pollen from the soil profile underneath mound 1
The zones described below are biostratigraphical units, based on palynological changes in the diagram (see figure 8.7). This means they are not automatically equivalent to geochronological zones.
Zone�1
A slight decrease in the arboreal pollen component from approximately 40 to 25% can be seen. This is mainly due to a decrease in Tilia pollen, which starts at 20% and decreases to around 2%. The forest cover in the surroundings of the Echoput was dominated by Alnus. In addition the forest consisted mainly of Quercus and Corylus. A high percentage of heather is present which even starts to expand further at the end of this zone. Besides Calluna�vulgaris grasses (Poaceae) were present in considerable amounts as well as Polypodium vulgare�(common polypody). Pollen of anthropogenic and grazing indicators such as Artemisia (mugwort) and Plantago lanceolata (ribwort plantain) are present in low amounts.
Zone�2
The expansion of Calluna�vulgaris, which started in Zone 1, continues followed by an expansion of Poaceae. The forest cover does not appear to be subject to extreme changes in total, there is however an increase in Quercus and a decrease in Corylus pollen percentage. In addition an increase in Fagus pollen is shown. The anthropogenic and grazing indicators have expanded to some extent.
Zone�3
In zone 3 an increase in Tilia pollen percentage can be seen, together with a decrease in Calluna�vulgaris. Poaceae shows an increase as well as most other herbs and ferns.
Pollen from the soil profile underneath mound 2
The zones described below are biostratigraphical zones, based on palynological changes in the diagram (see figure 8.8). This means they are not automatically equivalent to geochronological zones.
Zone�1
In this oldest part of the diagram, a decrease in AP can be seen, from 40% to 20%. The forest at the beginning of this period consisted mainly of Tilia�(lime), Quercus� and Alnus. A decline of Tilia pollen is notable in this zone, as well as the appearance of Fagus�(beech)�pollen. The percentage of Alnus pollen shows an increase as well. Heather shows an expansion, as well as Poaceae. Anthropogenic indicators, like Artemisia�and Asteraceae tubuliflorae are present in low amounts, grazing indicators like Poaceae, Asteraceae liguliflorae and Plantago�lanceolata are present in higher amounts.
Zone�2
In Zone 2 Tilia decreases further until almost no Tilia�pollen is found. Corylus shows an increase and the other tree species remain quite stable. Calluna�vulgaris�fluctuates between 100 and 200%, Poaceae between 50 and 100%. Anthropogenic and grazing indicators are present in higher amounts than in Zone 1. The percentages of ferns and mosses have decreased, as well as Sphagnum.
105northern and central veluwe
Zone�3
Zone 3 shows a peak in Tilia�pollen numbers and a decrease of Calluna�vulgaris. This is also shown in Zone 3 of Diagram 1. Zone 3 of Diagrams 1 and 2 is based on the top samples taken from the soil profile and it is very well possible that part of the sod above the old surface has been included in these samples. This sod also contains a soil profile, similar to the soil profile underneath the barrow. As a consequence it is likely that these samples do not represent the youngest vegetation composition in this diagram, but older, comparable to part of Zone 2 in the diagram.
In all samples from both soil profiles particles of charcoal have been found.
Pollen from the post features
Trench�9
A very low percentage of arboreal pollen grains, 15-20%, can be seen (see figure 8.9). The absence of Tilia is notable in comparison to the pollen spectra obtained from the barrows, as well as fairly high percentages of Fagus pollen and the presence of Carpinus. The herb pollen types are dominated by Calluna�vulgaris, with percentages over 500%. Grasses show high percentages as well, around 70%. Anthropogenic indicators are present in low amounts; however, the percentage of Secale is relatively high.
Trench�16
This spectrum also shows a low percentage of arboreal pollen, around 15%. Tilia is absent, Fagus and Carpinus are present in considerable amounts. Calluna vulgaris is the dominating species, together with a high percentage of Poaceae. The presence of Fagopyrum and Centaurea cyanus (cornflower) should be noted.
Trench�18
This spectrum is similar to the spectrum from Trench 16, except for a lower percentage of Poaceae.
Trench�21
These spectra looks very much like the spectrum of Trenches 16 and 18 as well, including the presence of Fagopyrum�and Centaurea�cyanus. Remarkable is the very high percentage of Calluna�vulgaris found in one of the spectra.
The�size�of�the�open�space
The minimum size of the open space can be estimated by the amount of sods that was used to build the barrows as has been explained in section 7.1. Knowing the height and the diameter of the mounds and the thickness of the sods the minimum size of the open area that was stripped can be calculated (see also table 8.2).
The measurements of the barrows are (van der Linde and Fontijn 2011, 33; Bourgeois and Fontijn 2011, 65):
Barrow 1: r=9.5 m (d=19 m), h=1.08 mBarrow 2: r=7.25 m (d=14.5 m), h=1.0 mSods: average h=0.25 m
The calculated area to be stripped for Mound 2 is 332 m2. For Mound 1 a correction should be made, because this barrow was not completely spherical, but had a flattened top. Taking this into account, the stripped area for Mound 1 was 902 m2. A total area of 1234 m2 was used for sod cutting (see figure 8.10).
The size of the open space can also be estimated by the percentage of arboreal pollen as has been described and discussed in section 7.2. The arboreal pollen percentage of the Echoput barrows is on average only 29%. This implies an open space with an average distance to the forest (ADF) of approximately 300 m.
8.1.4�Discussion
Dating the barrows
The first thing to point to in the palynological results is the resemblance between the two barrows. Pollen spectra from the old surfaces indicate a similar vegetation pattern at the time the barrows were built, which makes it likely that they were built in the same period. This is in line with what was expected on the basis of the 14C-datings and the general similarities between the mounds. The occurrence of Carpinus�suggests that this period can be placed in the Iron Age (Janssen 1974). Both their contemporaneity as well as their Iron Age dating are in agreement with the excavation results, on the basis of which the dating could be further specified to the late Middle or earlier Late Iron Age (van der Linde and Fontijn 2011, 62; Bourgeois and Fontijn 2011, 87).
Old surface underneath barrow
Area used for sod cutting
0 25 50metersold surface underneath barrow
area used for sod cutting
50 m0
98 m
91 mNAP
N
Figure 8.10. View of the Echoput hill with the two excavated barrows, based on digital elevation model of the AHN (copyright www.ahn.nl), with around each barrow an indication of the area that had to be used for sod cutting.
110 ancestral heaths
The barrow landscape
The similarity of the pollen composition of the old surface and the sods indicates that the sods were cut in the close surroundings of the barrows, where vegetation composition was similar to the spot where the barrows were built. The following discussion about the barrow landscape is based on the results of the samples of both the old surface and the sods of the two mounds, which represent the vegetation composition at the time just before the barrows were built.
Figure 8.6 shows the pollen spectra of the mentioned samples. They indicate that herbs are much more abundant than trees. Especially heather (e.g. Calluna�vulgaris)�and less, but still in considerable amounts, grasses (e.g. Poaceae) dominate the herb species. Heather pollen tends not to spread outside the heathland where the pollen is produced (de Kort 2002). This implies that the Echoput barrows were built in an open spot, where heather was the most dominant species. Non-pollen palynomorphs such as Debarya�glyptosperma�and Zygnema type 314 (van Hoeve and Hendrikse 1998) suggest the presence of some water at the site, at least part of the year, conditions which nowadays still exist (the pools of water that remain after rain for some time). Anthropogenic indicators are present amongst the herbal pollen. These are dominated by Plantago� lanceolata and Asteraceae tubuliflorae. Remarkable is the find of one pollen grain of Secale�in the pollen spectrum from sod 2 of Mound 2. This cereal species (rye) had not been commonly introduced in the Netherlands during the Iron Age yet, however, some early Iron Age finds in northern and western Europe have been reported (van Zeist 1976, Behre 1992). The anthropogenic indicators suggest the presence of human activity at the site, which is consistent with the find of pottery sherds and flint fragments in the sods and the old surface (van der Linde and Fontijn 2011, 59-60; Bourgeois and Fontijn 2011, 87). However, the pollen percentages of anthropogenic indicators are too low to conclude the site was a settlement area or with (former) arable fields nearby. This is consistent with the data from the excavations in the close surroundings of the barrows (Valentijn and Fontijn 2011).
The tree pollen that is present in the pollen spectra is mainly Alnus,�Quercus�and Corylus.�Alnus�is likely to have grown on the lower sites in the surroundings of the heathland, where hydromorphic soils occurred like Gleyic Podzols, Umbric and Histic Gleysols. This indicates that alder carr was probably present in the stream valleys in the surroundings of the Echoput hill. The dominance of Alnus pollen within the total arboreal pollen content could imply an open landscape where the alder pollen was free to travel in from out of the alder carr, since no other sizeable forest blocked their way. In addition, Alnus blooms before Quercus and Corylus get their leaves, making it easier for Alnus pollen to travel freely. Corylus is a tree that requires light conditions to grow; it will not be able to survive in the reduced light conditions in a closed forest. The tree requires moist soil, but not wet conditions. It is very likely that Corylus�grew on the slopes around the Echoput hill, together with Quercus, a tree that has also has a preference for soil that is not very wet (Weeda�et�al. 1985, 113). The presence of alder carr in the valleys and the more open vegetation in the surroundings of the barrows indicates that forest clearing had only taken place in the higher and drier places around the Echoput hill. The forest was not cleared recently before the barrows were built, indicated by the presence and the diversity of the herb vegetation. The herb vegetation had already had some time to establish and to develop and the open place must have existed some time before the mounds were constructed. Heath vegetation is not a natural vegetation type in the Netherlands (with exception of the coastal area). This implies that the barrow landscape was already managed to maintain the heathland. The amount of grasses (Poaceae) together with Plantago�lanceolata,
111northern and central veluwe
Asteraceae liguliflorae, Succisa�( and Galium-type could be an indication that the heathland was kept open by grazing (Hjelle 1999) and as such was part of the economic zone of settlements.
The size of the open space
It has already been mentioned that the barrows were built at the same time, or one relatively quickly after the other. The similarity of the pollen spectra from the old surface and the sods indicates that the sods were taken in the near surroundings of the place where the barrows were built. In addition, the similarities between pollen from sods and the old surface underneath the mound and in lithology of sods and the Echoput hilltop all imply that the sods were cut from the Echoput hilltop and not from the hill flanks. Regeneration of heath after sod-cutting takes a period of 5-40 years, depending on the thickness of the sods. Thin sods, preferably containing only the F horizon of the soil, were traditionally used as fuel or as bedding in stables. Regeneration after cutting thin sods takes only 5-8 years (Pape 1970). When thicker sods were cut, containing the A- and E-horizon, regeneration takes up to 40 years. Such sods were for example used as construction material (Stoutjesdijk 1953, cf. Bakels and Achterkamp 2013). Assuming that the period between the construction of the first and the second burial mound had been too short for the heath vegetation to regenerate the open place had to be large enough to cut sods for building two barrows. The soil profile shows that the surface beneath both barrows was not used for sod cutting (Fontijn 2011b, 154), which also implies that the barrows were built at the same time or that at least part of the area had already been kept free from sod-cutting as a reservation for the construction of the second burial mound.
As has been shown in the results, the area to be stripped for Barrow 1 is 902 m2 and for barrow 2 332 m2, so a total area of 1234 m2 was used for sod-cutting. This implies that a minimum area of 1683 m2, the surface beneath the barrows included, consisted of open vegetation. Based on the arboreal percentage the open space had an ADF of approximately 300 metre, implying an open area of about 28 ha (πr2 = π . 3002 = 282743 m2). Although this size could have been overestimated (see section 7.3, according to palynological modelling the ADF was probably about 200 m) the open space is considerably larger than based on the amount of sods that had been used to construct the burial mounds. The combination of these two methods builds an image of how the burial mounds were situated in the landscape. The barrows were located in an area that was dominated by a heath and grass vegetation. Trees could probably not be found in the first 200 to 300 metre around the mounds. The barrows, already located on a relatively high place in the environment, were probably even more prominent in the landscape, knowing that the direct surroundings were cleared from both vegetation and the topsoil, creating a bare environment (see figure 8.10). This will have increased their visibility in the surrounding landscape.
The pre-barrow landscape
Based on the theory presented in Chapter 5, the pollen diagrams derived from the soil under Barrows 1 and 2 represent the vegetation development of a certain period before the barrows were built. Since the soil profiles have not been dated the duration of the period represented is not clear (see Chapter 5). The pollen diagrams show that heath was already present at the place where later on the barrows were built since at least the time span that is represented by the diagrams. The presence of an Umbric Podzol (Dutch classification: Moderpodzol) suggests that heath vegetation could not have been present for a very long time, since
112 ancestral heaths
underneath heath vegetation a Carbic Podzol (Dutch classification: Humuspodzol) soil would develop. This could however take several centuries (Andersen 1979). During the oldest zone represented in the diagram the AP is higher than at the time the barrows were built, 40% compared to 20%. The forest was mainly dominated by Tilia�and Quercus at the drier sites and Alnus at the wetter sites. Despite the low pollen counts in some of the lower samples of diagram 2 clear trends can be seen in both diagrams. A decline of Tilia is indicated by decreasing Tilia�pollen percentages. Such developments in forest cover is presumed to have taken place generally in the Netherlands as has been shown by several pollen analyses of lake and peat sediments (Janssen 1974, van Geel 1978). At the same time an increase of Fagus�is visible in the diagram, comparable to the general increase of Fagus in several parts of the Netherlands, since its arrival between ca. 3700 cal BC and ca. 500 cal BC (Fanta 1995). An increase of Alnus�pollen that can be noticed might be primarily related to the decrease of Tilia or could indicate an expansion of the wet forest. The decrease of forest cover seems to go hand in hand with an expansion of the heath vegetation.
At the time the barrows were built vegetation was dominated by heather, at least locally. It is not entirely clear how the open place was created nor what it was used for in the period before the barrows were built. Indications of the presence of human activities at the site in several periods before the barrows were built are evidenced by finds from below and beyond the mounds, although they certainly do not indicate a very intensive use of this site in the Bronze Age or early Iron Age (Louwen�et�al. 2011, 141). The absence of cereal pollen grains and low amounts of arable weeds like Artemisia�vulgaris in the diagram demonstrate that the location had not been used for crop cultivation. The size of the heathland can be estimated. Based on the ratio of arboreal pollen versus non arboreal pollen, the size of the open space is estimated to have been from approximately 200 metre ADF to approximately 300 metre ADF at the moment the barrows were built. To maintain the heath, the landscape must have been managed. Methods of heath management can involve sod-cutting, grazing, mowing and burning (Stortelder�et�al. 1996, 287).
Sods were cut in the area, at least with the purpose of building barrows. With sod cutting the soil is stripped from all vegetation. For heath to recover it is dependent on re-establishment by seeds that were present in the deeper soil layers or by expansion of surrounding heath vegetation. Recovering of the heath vegetation after sod cutting will take 5-40 years, depending on the thickness of the sods that were removed (see above). The area needed for building the barrows was most likely much smaller than the total heath area in which the barrows were built (see above, r=200 to 300 m). Consequently, sod cutting for the purpose of building the barrows would not be sufficient to maintain the entire heath area. Large scale sod cutting in heathland areas is mainly known from the Medieval Period into the 19th century, when the sods were laid in stables to catch animal dung and subsequently were used on arable fields as fertilizer. Small scale practise of this way of farming may have taken place at the time the Echoput barrows were built. There are however no indications of such arable fields in the environment. In addition, manual sod cutting is quite labour-intensive and it is not likely that this heath area was managed by sod cutting alone.
The amount of grasses (Poaceae) together with Plantago�lanceolata, Asteraceae liguliflorae, Succisa and Galium type could be an indication that the heathland has been grazed (Hjelle 1999). Mowing and grazing are comparable since they both keep the plants down. Grazing is more selective than mowing, with animals having a preference for certain species. Sheep prefer young Calluna heath and grass and herb vegetation in between the heath vegetation. They are not very
113northern and central veluwe
fond of older Calluna plants (Elbersen� et� al. 2003). Cattle eat mainly grasses, although some landraces also eat young Calluna plants (cf.�Lake et�al. 2001, 31). Archaeozoological evidence from several excavations suggests that prehistoric farming communities kept mainly sheep and cattle (Brinkkemper and van Wijngaarden-Bakker 2005, 493). Both sheep and cows are used in present times to maintain heathland areas by grazing. Historical data show that in Medieval Period grazing using only sheep was sufficient to maintain heathland vegetation. A stocking rate of 1 sheep/ha is assumed (Piek 2000). Also in present heathlands several studies mention that an average of 1 sheep/ha/yr should be sufficient to manage the heathland (Elbersen�et�al. 2003, Verbeek�et�al. 2006). The size of the stocking rate of cattle in the past is not clear, although it is clear that cattle grazing in Dutch heathlands occurred on large scale before the 18th century (Bieleman 1987). Bokdam en Gleichman investigated the influence of grazing cattle on the development of Calluna heath (Bokdam and Gleichman 2000). A stocking rate of 0.2 livestock unit per hectare per year appeared not to be adequate against invasion by grasses and tree growth. Natuurmonumenten, a Dutch organization that protects and manages nature reserves in the Netherlands, has over 30 years of experience with grazing in heathland areas. They experienced that in dry heathland areas 1 head of cattle per 5-6 ha is sufficient to prevent grasses from getting dominant in heathland areas (Siebel and Piek 2001). This is however in the present environmental circumstances with higher deposition of nutrients, and it is likely that in the past less cattle would have been adequate enough for maintaining heathland vegetation. When an indication of the minimum size of livestock from a prehistoric farming community should be calculated that was responsible for managing the heathland area where the barrows are being built in, an average of 1 sheep per hectare and/or 1 head of cattle per 6 hectare will be used. At the Echoput, based on the ratio of arboreal versus non arboreal pollen grains the area that was covered with heath vegetation at the time the barrows were built is estimated to have been 28 hectare (π . 3002), implying a livestock size of approximately 28 sheep and/or 4-5 head of cattle. Mowing can be seen as a kind of grazing, although grazing is more selective.
Regular burning is also a traditional way of heath management. When the heath is being burnt every 10-20 years the heath vegetation can be maintained by rejuvenating the heath (Mallik and FitzPatrick 1996, Yallop� et� al. 2006). A combination of burning and grazing is nowadays often applied, which seems to be very effective. Small scale burning provides young vegetation, which is more nutritious to the grazing stock. The remains of charcoal found in all the pollen samples from the Echoput barrows may be an indication that human burnt the heath vegetation. Particles of charcoal have been found elsewhere as well during excavations of barrows and in soil samples that were taken for palynological analyses (Karg 2008). A combination of grazing and burning and perhaps some sod cutting seems a plausible explanation of how the heath was managed at the Echoput.
Posts at the barrow site
The pollen spectra from the four possible structures that have been sampled have a different composition than the barrow spectra. As was discussed in section 4.1.5 the posts might be dated based on their pollen spectra. The pollen spectra from the four posthole structures (see figure 8.4) show a vegetation composition that can be dated to a much younger period than the period the barrows were mainly built in. This is implied by the presence of Secale, which is known as a common crop in the Netherlands only after being introduced during the Roman Period (Behre 1992,
114 ancestral heaths
RADAR 2006). In addition, the relatively high percentages of Carpinus and Fagus�indicate a rather young pollen composition. Both species show an increase during the Holocene vegetation development in the Netherlands since the Subatlantic period up to the Medieval Period (Janssen 1974). In addition, all posthole fillings, with exception of the postholes from Trench 9, contained pollen from Fagopyrum�and Centaurea�cyanus, which are only present in the Dutch pollen spectra from the Late Medieval period (Bakels 2000, 2012). However, can the dating of the pollen spectra be coupled to the dating of the posts? In other words, can the posts also be dated in the Late Medieval Period? As has been discussed in section 4.1.5, the Medieval pollen could have come from the vegetation that was present at the Echoput hill at the time the posts were placed or they could have infiltrated in the soil from some time after the posts were placed. The posts could then be dated in the Late Medieval Period or later (as a terminus�ante�quem date). The pollen spectrum from the posthole from Trench 9 lacked pollen that indicates the Late Medieval Period and consequently the Roman Period can be assessed as a terminus�post�quem date for this posthole filling.
What did the landscape look like at the time the posts were placed? The posthole fill pollen spectra indicate a landscape that was more open than during the time the barrows were built. The amount of Alnus�had decreased. This implies deforestation of the lower sites as well, or a change in soil water content. The barrow site was at this time an open spot as well, but the character of the place had slightly changed compared to the barrow landscape. Calluna�had expanded at the cost of the forest. The diversity and quantity of other herbs increased. At Trench 21 a very high percentage of Calluna�pollen can be seen, which is not visible in any of the other samples. This could indicate a local abundance of heather, for example the covering of the roof of the structure could have been made of it.
It is generally assumed that most barrows were built in open spaces in a forest area. However, the origin of these open spaces is little known. The pollen analyses of two barrows at the Echoput show the vegetation history of the open space from a period before the barrows were built. This showed that the clearing in the forest was indeed much older than the barrow, as has been suggested in section 2.3. When and how the open space was created is not known.
From the beginning of the period that our data represent, the open spot was mainly covered by heath vegetation mixed with grasses and several other herbs. The open space, surrounded by a forest of Tilia and Quercus, had been used for at least a few centuries by prehistoric man. This is indicated by several features dating to the Middle Bronze Age period. The presence of anthropogenic indicators confirms the influence of prehistoric man in the environment. Mesolithic and Bell Beaker features were also present (Louwen� et� al. 2011), though it is not known if the forest was already cleared by then. Although we did not uncover any evidence for a settlement near the mounds, it is clear that the area has been used by prehistoric man. However, what did they use the open place for since the Bronze Age? It is very likely that it was included in the economic zone of farming communities as grazing grounds, keeping the vegetation open. Based on the high percentage of pollen from Poaceae, in combination with the presence of Plantago� lanceolata, Asteraceae liguliflorae, Succisa and Galium type, the use of this open spot as pasture is very plausible (following Hjelle 1999). Furthermore, regular burning of heath could have occurred, indicating that a form of heath management was used to keep the area open. The use of fire is indicated by the amounts of charcoal found in the pollen records.
115northern and central veluwe
Before the barrows were built the open area seems to have been used solely as a place for the living, since no indications have been found that people were buried there. This changed when the burial mounds were constructed in the later Middle Iron Age or early Late Iron Age. At this time the vegetation surrounding the Echoput hill had changed. The Tilia dominated forest had shrunk and forest with a more open character mainly consisting of Quercus and Corylus had taken its place. The heath vegetation at the open place at the top of the Echoput hill had expanded. This change in vegetation was probably due to human activities, such as burning and cattle grazing. The upper surface of a large part of the heathland at the Echoput hill was stripped in order to get sods for the construction of the barrows. The surface where the barrows were going to be located was left untouched. Whether the barrows were built at exactly the same time or with a short period in between does not change the fact that both places had already been designated as barrow location, based on the observation that the surface underneath both barrows were not used for sod-cutting. The two barrows must have been quite pronounced features in the landscape; placed on one of the highest locations in the area, cleared from surrounding vegetation. It is unknown whether the surrounding landscape was kept open after the barrows were built. However, one of the mounds had been re-used as a burial location (van der Linde and Fontijn 2011, 64). In addition, during the Roman Period and the Late Medieval period (based on palynological dating of the post hole fillings) there was a very large open spot covered with heath vegetation. It is likely that the place had been kept open all this time.
8.2 Niersen-Vaassen
In the north-eastern part of the Veluwe several barrow alignments are situated. Several of these barrows were excavated over a series of campaigns. An extensive description and analysis of the barrow alignments have been made by Bourgeois (2013). Barrows not part of alignments are also present in this area. Dating and palynological data are available for five barrows in the area, of which two were part of a larger alignment. In addition palynological data are available from samples taken from a Celtic field present in the same area (see figure 8.11). Combining these data makes it possible to reconstruct the vegetation development in this area from the Neolithic until the Iron Age.
8.2.1�Site�description�and�sample�locations�
Niersen, barrow 4 and 6
The two investigated barrows of Niersen form part of a 6 km long alignment containing at least 46 barrows (Bourgeois 2013). The original excavation of Niersen 4 and 6 took place in 1907 by Holwerda (Holwerda 1908). Holwerda described Niersen 4 as a Bell Beaker tumulus with a height of 1.65 m and a diameter of 36 m. He noticed that this barrow was situated approximately 2.25 m higher than the other barrows in this area. In the barrow a grave was found in which skeletal remains of more than one individual were present. Holwerda decided to take out the entire grave-area after plastering to be able to examine the remains later. This plaster box has recently been rediscovered in the collection of the National Museum of Antiquities in Leiden and has been subject of research by the museum in cooperation with the University of Leiden (Bourgeois�et�al. 2009). They dated the grave, on the basis of stylistic parallels, to the late Neolithic period (2600-2200 cal BC). Samples for pollen analysis were taken from the sediment in between
116 ancestral heaths
the skeletal remains, but unfortunately pollen could not be obtained from these samples. In 1984 the Niersen 4 barrow was consolidated by the ROB (presently known as the Cultural Heritage Agency of the Netherlands). They described the tumulus as a bank-and-ditch barrow with a diameter of 28 m. Niersen 6 was a barrow with a height of 1.50 m and a diameter of 16 m. The tumulus probably dates to the early Bronze Age (Bourgeois 2013). The ROB report corrects the size of the barrow to a diameter of 19 m. During the conservation carried out on the barrow, pollen samples were taken from the old surface underneath both mounds and from the mounds themselves by Groenman-van Waateringe10. One sample of the old surface per mound was prepared and analysed by the author. Methods of sample preparation have been described in Chapter 4.
10 Due to poor documentation it is not completely certain that during reconstruction of the barrows by the ROB the barrows were identified correctly as barrow 4 and 6 (Bourgeois et al. 2009). Samples for pollen analysis were taken during this reconstruction.
Niersen 4
Niersen 6
Celtic Field
Vaassen II
Vaassen 1 Vaassen 3
Vaassen 2
0 250 500 1000 m
Other barrows
Sampled barrow
100 m
0 m
m NAP
Vaassen IIIVaassen I
Celtic Field
Figure 8.11. Detailed map of the Niersen-Vaassen area with the locations of the barrows of Vaassen and Niersen and the Celtic Field of Vaassen. The map is based on digital elevation model of the AHN (copyright www.ahn.nl).
117northern and central veluwe
Vaassen, barrows 1-3
Three barrows at Vaassen were excavated by Bursch and Tromp in 1941; re-excavation took place in 1970-1971 by Lanting and van der Waals (1971). During that last excavation samples were taken and analysed for pollen by Casparie and Groenman- van Waateringe (1980, 28, 35).
Vaassen 1 (V1) is a single period barrow radiocarbon dated to 2850-2600 cal BC (Bourgeois 2013, 53). Underneath V1 a sherd of a PF beaker and some flint was found. The original dimensions of the barrow were probably a diameter of 13 meter with a height of approximately 1 metre. Samples for pollen analysis were taken from the old surface. Vaassen 2 (V2) is a two-period barrow of which the first period can be dated to the Bell Beaker Period based on the find of a Veluvian Bell Beaker (Lanting and van der Waals 1971a). The second period is dated to the Middle Bronze Age. The primary barrow was approximately 8 m in diameter and approximately 30 cm high. For the secondary period the barrow was expanded to a diameter of approximately 15 m and a height of 1.40 m. The thickness of the sods used for the second period is approximately 25 cm. Samples were taken from the old surface of the primary mound and from sods belonging to the second period. Vaassen 3 (V3) is also a two-period barrow of which the first period has been radiocarbon dated to 2885-2625 cal BC (Bourgeois 2013, 53). The second period has been dated to the Bell Beaker period. The diameter of the barrow is not known; its surrounding feature measured approximately 7.5 m across. The height
Figure 8.12. Sample locations in the sections Vaassen I, II and III at the Celtic Field at Vaassen. Figure redrawn after Brongers (1976), plate 13.
118 ancestral heaths
of the barrow was about 0.3 m. Samples for pollen analysis have been taken from the first period from the intermediate ditch and the outermost palisaded ditch (Casparie and Groenman-van Waateringe 1980, 28).
Vaassen, Celtic Field
In the woods west of Vaassen (municipality of Epe), a Celtic field is situated on a 15 hectare heathland and continuing over a surface of almost 100ha. Three parts of the Celtic field were excavated: Vaassen I, II and III (Brongers 1976). Vaassen I was situated at the south boundary of the Celtic field, Vaassen II was situated west of Vaassen I and Vaassen III could be found at the east side of the heathland (see figure 8.12). Sections were made at these locations, revealing a sequence of several layers. These layers, an old surface and three agricultural layers, represent several phases. Local agricultural activities started on an old surface that became partly denuded. Part of the A-horizon of the podzol belonging to this old surface was homogenized and changed into an arable layer. The remaining part of the A-horizon of this podzol is called the denuded�old�surface (DOS). The arable layer, which does not belong to the bank system of the Celtic field (CF), is called the pre-Celtic�field�(PCF)�layer. On top of the PCF-layer a bank system was constructed, forming a Celtic Field. At Vaassen III an older arable layer was present (OAL) on top of the DOS and underneath the PCF layer. This OAL layer was not present at the other two locations. Underneath the banks the DOS and/or OAL, PCF and CF layers were clearly visible. In between the banks the DOS was seriously disturbed and the PCF and CF layer could not be differentiated from each other. Soil samples were taken for pollen analysis from all layers (see figure 8.12). At Vaassen I samples were taken from or underneath a bank. Three samples were taken from the DOS, one sample from the PCF and one sample from the CF. At Vaassen II a sample was taken from the DOS, underneath a PCF layer that was covered by a bank. At Vaassen III two samples were taken. One sample was derived from the OAL layer that was overlain by the PCF layer. The second sample was taken from the CF layer in the bank that covered this PCF layer. The samples were analysed by Casparie. The pollen data that were published in 1976 (Casparie 1976) were re-used in this research, in addition to the barrow data in the Epe area.
Dating the Celtic Field
Several locations in the Celtic field and the layers underneath were sampled for
14C. Remains of a farmhouse (Haps type) were discovered at Vaassen I. The house plan was covered by the CF-layer and possibly also the PCF layer (CF and PCF could not be differentiated here). The house was dated by fragments of charcoal to 2420 ± 65 BP (GrN-5498; 671-396 cal BC, calibrated with Oxcal 4.2), dating the part of the Celtic field that was situated on top of the house to 671-396 cal BC terminus� post� quem. Such farming houses were often found associated with Celtic fields and it well is possible that part of the Celtic field had already been developed when the farmhouse was still in use (Brongers 1976). The DOS is difficult to date and the dating of the samples from the DOS depends on the depth at which they are taken. At Vaassen I the dating of the house plan can be interpreted as a terminus�ante�quem date for the DOS layer (e.g. 671-396 cal BC); samples were taken approximately 25m west of the house. The pollen spectra, which will be discussed in more detail below, show the presence of Fagus and Carpinus. Carpinus appears in the Netherlands around 1500 cal BC and both
119northern and central veluwe
CF8
CF5
PCF
7O
AL
4D
OS
6D
OS
2D
OS
3D
OS
1Va
asse
n2so
d1_p
er2
Vaas
sen2
sod2
_per
2N
iers
en6_
osVa
asse
n2_o
s_pe
r1Va
asse
n2_s
od_p
er1
Nie
rsen
4_os
Vaas
sen3
_out
ert
Vaas
sen3
_int
ert1
Vaas
sen3
_int
ert2
Vaas
sen1
_os1
Vaas
sen1
_os2
800-
150
BC
1000
-400
BC
1600
-140
0BC
2000
-180
00BC
2500
-220
0BC
2800
-260
0BC
2040
6080
100
AP
NAP
1Acer
2040
6080
Alnus
1
Andromeda-type
5Carpinus 2040
Corylus
5Fagus
1Fraxinus 1Hedera
1Ilex
1
Myrica
1Picea
5Pinus
2040
Quercus
5Salix
5Sorbus-type 20
Tilia
5Ulmus
2040
6080
Betula
100
200
Callunavulgaris
1Erica
5Vaccinium-type
5Artemisia 20
Astera
ceae
tubuli�
orae
20
Cerealia
20
Chenopodiace
ae
1Plantagomedia
1Urtica
20
Astera
ceae
liguli�
orae
1Galium-ty
pe
20
Plantagolanceolata
100
200
Poacea
e
20
Rumexacetosa/R.acetosella-ty
pe
Succisa
Tree
sand
shru
bsH
eath
Ant
hrop
ogen
icin
dica
tors
Gra
zing
indi
cato
rs
1Apiaceae 1Bra
ssica
ceae
1Campan
ulaceae
20
Caryophylla
ceae
2040
Cyperaceae
1
Dipsacus 1Fabac
eae 1Geraniac
eae
1Humulus 1Jasio
ne 5
Lonerica 1Mentha-ty
pe
5Polygonumpersic
aria-type
1Potentilla-ty
pe
1Ranunculaceae
1
Sanguisorbam
inor
20
Spergula
1Thalictru
m 5Trifoliu
m 1Sparganium-type
1Typhaangustifolia
20
Dryopteris
20
Monoletepsil
atefern
spores
5Polypodiumvulgare
5Pteridium 20
Anthoceroslaevis
5Anthocerospunctatus
20
Sphagnum 1BvGt314 1BvGt1a
20
BvGt58
20
BvGt159
20
Indeterminable
329
385
539
535
1140 39
951
741
611
3211
40 315
685
519
301
685
520
399
284
291
Pollensu
m(A
P-Betula)
971
1839
1289
1512
1593 65
492
859
519
9822
38 570
1399
1117 95
913
79 959
769
818
695
Totalpolle
nsum
Upl
and
herb
sA
quat
iche
rbs
Fern
sand
mos
ses
Figu
re 8
.13.
Pol
len
spec
tra
from
sam
ples
ta
ken
from
the
barr
ows
at V
aass
en, t
he
barr
ows
at N
iers
en b
arro
ws
and
the
Cel
tic F
ield
at V
aass
en. S
pect
ra a
re g
iven
in
% b
ased
on
a tr
ee p
olle
n su
m m
inus
Be
tula
pol
len.
In th
e to
tal A
P (=
arbo
real
po
llen)
Bet
ula
is in
clud
ed. I
n th
e to
tal
NA
P (=
non
arb
orea
l pol
len)
spo
res
are
incl
uded
, non
pol
len
paly
nom
orph
s ar
e ex
clud
ed. D
iffer
ent s
cale
s ha
ve b
een
used
, in
dica
ted
with
diff
eren
t col
ours
.
120 ancestral heaths
species are known to expand in the Netherlands since the Iron Age (Janssen 1974). Since the percentages of Fagus and Carpinus are still low (<1.5%) a dating of around 1000 – 400 cal BC is suggested.
Traces of post holes have also been found at Vaassen III, covered by the OAL-layer. Charcoal from one of the post holes was dated to 3020 ± 55 BP (GrN-5895, 1418-1114 cal BC, calibrated with Oxcal 4.2). This implies that the first agricultural activities started after 1418-1114 cal BC. The presence of Fagus and Carpinus (respectively 1.5 and 1.3%) suggests a date around 1000 cal BC.
The third date is provided by charcoal found in a pit underneath the CF layer. The pit was dug into the CF layer, since part of the arable layer (PCF and/or CF) had sunk down into the pit. The 14C-date of 1800 ± 55 BP (GrN-5495, 82-352 cal AD, calibrated with Oxcal 4.2) can be considered as a terminus�post�quem date for the end of the agricultural activities at the Celtic Field. Brongers (1976, 64) argued that this date coincides with the period the Celtic Field came to an end, since this disturbance of the arable layer is probably the result of unstable times during the Roman occupation.
8.2.2�Results
Figure 8.13 shows the results of the pollen analyses of all barrows and the Celtic field. The pollen spectra were placed in chronological order to see the vegetation development in the area. It should be noted that the different phases show some gaps or overlap in time, so the spectra do not show a continuous vegetation development. Secondly, the spectra belonging to the Celtic field could only very roughly be dated (see above). Although the spectra have been derived from different types of samples (barrow versus agricultural layers) it has been decided by the author to all compare them with each other. All Celtic Field spectra probably represent a longer period of time, since the soil has been mixed up due to agricultural activities. The herbal vegetation composition shown by the spectra is very local and cannot be expanded to the barrow sites nearby, but the extra-local and regional forest vegetation probably can.
Phase 1: 2800-2600 cal BC
Vaassen�1
The amount of forest pollen represents approximately 57% of all pollen (including spores). The herbal vegetation consisted mainly of grasses and Calluna heath. The surrounding forest mainly consisted of Betula with some Quercus and Tilia, although Betula might also have been present locally on the heathland. Corylus was present in high amounts. In the wetter areas Alnus was the dominating tree.
Vaassen�3,�period�1
The ratio between arboreal and non-arboreal pollen is the same as that of barrow of Vaassen I. There seem to be some differences in the forest composition: Quercus decreased, while Tilia increased. There is a considerable decrease in Betula pollen. Grasses have decreased, while heather was able to expand a little. Together with the decline of Betula this could indicate some heath management, for example by grazing activity. This prevented new Betula trees from establishing and grasses from flowering.
121northern and central veluwe
Phase 2: 2500-2200 cal BC
Niersen�4�
Compared to the barrows at Vaassen, which are at almost 2 km of distance apart, there is a great difference in the vegetation composition at Niersen. At Niersen there seems to have been a larger open space, dominated by heather (Calluna�vulgaris), in which the barrow has been built (AP=32%). There were hardly any Betula trees present and the amount of grass was considerable, indicated by pollen percentages of 25-50%. This species-poor heathland could have been maintained by heath management, preventing Betula�to re-establish and Calluna�to expand. The surrounding forest consisted mainly of Quercus,�Tilia�and Corylus. In addition, some peaks can be seen in Succisa pollen and fern spores, indicating moist conditions. The Alnus forest in the stream valleys seems not to show any differences with that of Vaassen.
Vaassen�2,�period�1
The vegetation character derived from the pollen analysis of Vaassen 2 is comparable to Vaassen 1 and 3. The percentage of Betula pollen� is comparable to Vaassen 3. This means that the percentage of Betula is higher than in Niersen, but considerably lower than at Vaassen 1. There seems to be a slight increase in Quercus pollen compared to the other barrows of Vaassen.
Phase 3: 2000-1800 cal BC
Niersen�6�
Compared to the other barrow at Niersen, Niersen 4, there has been an increase in trees (AP=57%). The percentage of tree pollen is comparable to Vaassen II. This increase of trees is probably mainly caused by a decrease in heather pollen. An increase of Betula can be seen, although the amount of Betula pollen is still very low compared to Vaassen. Re-establishment of Betula might have been possible because heath management has been less intensive, also causing the heathland to decrease in size.
Phase 4: 1600-1400 cal BC
Vaassen�2,�period�2
There has been an increase of tree pollen, compared to all previous phases (both Niersen and Vaassen). All arboreal pollen has increased, except Quercus� and Corylus. Heath seems to remain unchanged. Some Cerealia pollen is present, but only in very low amounts and other anthropogenic indicators are also not very numerous.
Phase 5: 1000-400 cal BC
DOS,�Celtic�field
The percentage of tree pollen is high, accompanied by a low percentage of herbal pollen. The percentage of anthropogenic indicators is very low as well. This suggests that forest was present at this site before the start of agricultural activities. This forest, with mainly Quercus and Corylus, might have been present when the barrows were constructed, although at that time Carpinus and Fagus were not part
122 ancestral heaths
of it. Tilia pollen�is present in very low amounts and might have been replaced by Fagus�and Carpinus, confirming a younger dating than the barrows.�Alder carr is present in the stream valleys, as in the barrow period.
Phase 6: 1000 cal BC- 150 cal AD
OAL,�Celtic�field
The pollen spectrum of the OAL might represent a period that is older than the period represented by the DOS samples, since this arable layer was present at another location. However, the higher percentage of Carpinus and Fagus suggests that this spectrum represents a slightly younger period (see also 2.1 and 8.1.4). The percentage of arboreal pollen is considerably lower than in the DOS-spectra, while the amount of cereal pollen and other anthropogenic indicators is much higher. Calluna is also present in considerable amounts.
PCF,�Celtic�Field
The sample from the Pre Celtic Field layer is taken from the layer above one of the DOS-samples at Vaassen I described above (DOS1). Compared to this spectrum the percentage of arboreal pollen has decreased, while the percentage of anthropogenic indicators and Poaceae has increased. The amount of cereal pollen is in contrast to the OAL-spectrum very low.
CF,�Celtic�Field
One CF-sample is taken from the layer above the PCF-layer, the spectrum of which is described in the previous paragraph; the other sample is coming from Vaassen III, from the layer covering the PCF layer above the OAL. At both locations the amount of tree pollen has further declined. The Alnus forest had not changed or increased some, but the dry forest had decreased in size. Cerealia and other anthropogenic indicators are present, but there is a difference between the CF at Vaassen I and the CF at Vaassen 3: at Vaassen 3 the percentage of cereals is much higher than at Vaassen 2.
The size of the open spaces
The minimum size of the open spaces can be estimated by the measurements of the barrows and the height of the sods that had been used in the construction of the mounds (see 7.1).
The height of the sods is only known for the second period of the Vaassen 2 barrow (0.25 m). Fontijn et� al. (2013, 99-100, figure 4.25) have measured the length and thickness of many sods at a barrow site called Oss-Zevenbergen (see also 12.1) and concluded that the average thickness of sods used at that site was on average 20-35 cm. In addition, the thickness of the sods of the Echoput was approximately 0.25 m as well and apparently this is a suitable thickness to build barrows. For the calculations of the other barrows a height of 0.25 m will be assumed as well. This leads to the following minimum areas to be stripped per barrow (see also table 8.2):
Niersen4: 2041 m2, ropenarea≈25.5 m, based on a circular open spotNiersen6: 858 m2, ropenarea≈16.5 mV1 540 m2, ropenarea≈13 mV2 period 1: 30 m2, ropenarea≈3 mV2, period 2: 268 m2, ropenarea≈9 mV3: 30m2, ropenarea≈3 m
123northern and central veluwe
These numbers indicate minimum areas. The dating of the barrows is not detailed enough to determine whether some of the barrows were built at the same time as was probably the case with the Echoput barrows (see 8.1). Hence, the calculated areas of the Vaassen 1 and Vaassen 3 barrows cannot be added together. Based on the ratio of arboreal versus non arboreal pollen percentages (see 7.2) the open spaces were larger than the stripped area. The ADF of the Vaassen open spot is estimated at 25-100 m. The ADF of the open area at Niersen was at the oldest phase (Niersen 4) 100- 200 m and was somewhat smaller (around 50-100m) when Niersen 6 was built.
8.2.3�Discussion�
The pollen spectra show that the barrows at both Vaassen and Niersen were built in open places with heath vegetation. The barrows of Vaassen were built in an open spot with an ADF of approximately 100 m based on the ratio AP versus NAP. The open place in which the Niersen barrows were built was larger with an ADF of more than 100 m. Both open spaces were dominated by Calluna heath and grasses. The arboreal pollen percentage is dominated by Alnus, which is probably the result of an alder carr in the lower and wetter parts of the area. The forest of the drier area consisted mainly of Quercus and Corylus, the latter likely to be found at the forest rim. The vegetation of the open space seems stable, since the barrow spectra from all represented periods show similar vegetation patterns: an open place with species-poor grassy heathland surrounded by oak forest with an alder carr nearby. Some Neolithic finds underneath barrow V1, together with the relatively high percentage of anthropogenic indicators in the samples from V1 might indicate that the open space of the Vaassen barrows was used as a settlement area prior to the barrow building. After the barrow was built archeologically visible human activity decreased, leading to the decreased amount of anthropogenic indicators present at the when time barrow V2 was built. This could be an indication of change in function: a place for the living changed into a place for the dead with only the necessary management activities being maintained. The continued maintenance of the heath vegetation from when the oldest barrows (V1, V3) were built continuing to when the younger barrow (V2) was constructed strongly indicates conscious management. This also accounts for the Niersen barrow area in an even more pronounced way. The Niersen barrows formed a long alignment of barrows11 (Bourgeois 2013, 51-66). From this alignment only two barrows were analysed for pollen. However, based on the results of barrows that formed part of other alignments (see Chapter 9) and on the palynological data of all other barrows in the southern and central Netherlands (see the remaining of this chapter and Chapters 9-12), it can be assumed that all barrows belonging to the Niersen alignment were built amongst heath vegetation. During the earliest phase (late Neolithic A) the alignment was at least 1.6 km long containing 6 barrows. With an ADF of 100-200 m it is very likely that the heath areas the barrows were built in were connected to each other, forming a long-stretched heath area. The alignment was extended in the Bell Beaker phase implying an even more extended heath area; Heath that had to be managed to remain in existence. Comparable to the Echoput, barrow management could have taken place by grazing, burning and/or sod cutting. It is not clear from the results whether there are indications of burning the heath. Grazing is indicated by the presence of Poaceae in combination with Plantago� lanceolata, Asteraceae liguliflorae and Succisa (Hjelle 1999). A notable difference between the Vaassen
11 The alignment might even have been more extended while part of it might have been destroyed by modern land use
124 ancestral heaths
and the Niersen barrows are the high amounts of Betula pollen at Vaassen and the almost absence of this taxon at Niersen. Betula is a pioneer tree, meaning that it is one of the first to appear when no management is applied to prevent the tree from establishing. Young Betula trees are easily removed by grazers. This could indicate a difference in grazing intensity or management method (grazing versus not grazing) between the two barrow locations. Either this could mean that the barrows of Niersen belonged to another community with different management regimes or perhaps this could mean a difference in importance between Niersen and Vaassen is indicated. Niersen being part of a barrow alignment, while the Vaassen barrows might not be related to this.
The next phase is represented by the DOS (denuded old surface) layer, the surface at which the first cultivation of crops started. This phase shows a higher percentage of arboreal pollen compared to the barrow phases. Although the dating of this layer is very coarse it is likely that this pollen spectrum represents the phase prior to the arable activities, since the amount of cereals and arable weeds is still very low. Probably forest was present at this site, which might very well be the forest that has been recorded in the barrow pollen spectra. The amount of anthropogenic indicators is very low. This could indicate that there was not a lot a human activity in the area. The absence of human influence in the area is also indicated by the sparseness of archaeological finds in the area. From the Middle Bronze Age period onwards there is hardly any evidence for the building of new barrows (Bourgeois 2013). However, older barrows have been frequently used for secondary graves indicating not a total absence of humans in the area. In addition urnfields have been found in the area, including one in the Celtic field of Vaassen.
At the Celtic field sections of Vaassen III the first agricultural activities have been recorded (OAL). The forest had probably decreased in size and at least this site was cleared of trees. The amount of anthropogenic indicators, including Cerealia, and arable weeds like Artemisia, is a clear indication for crop cultivation and more specifically the cultivation of cereals. Heather is well represented in the pollen spectrum. Since this spectrum probably represents a longer period, it is likely that heath vegetation was present at the site before agricultural activities started or perhaps during times when the arable fields were abandoned. Another possibility is the presence of heath very close to the agricultural field.
At the Pre-Celtic Field phase the forest that was first present (Vaassen I, DOS) was cleared and agricultural activities were started. The amount of cereals is not very high, but considering that prehistoric cereal pollen do not spread (Diot 1992) it is likely that this spot was used for crop cultivation. The agricultural activities were probably expanded during the next phase, when the Celtic Field system was created. The forest clearance had been furthered at this stage. At Vaassen III cereal cultivation was continued (started at the OAL) and at Vaassen I other crops might have been cultivated.
8.3 Ermelo
In the area of Ermelo over a hundred barrows are known to be located, of which 55 have been excavated. During a great campaign in 1952, Modderman excavated 34 of these barrows (Modderman 1954) providing high-quality information on the mounds (Bourgeois 2013). In 1971 a re-excavation took place by Lanting and van der Waals during which two barrows (Ermelo I and III) were sampled and analysed for pollen (Casparie and Groenman-van Waateringe 1980, 29-30, 31).
125northern and central veluwe
8.3.1�Site�description�and�sample�locations
Several barrow alignments were recognized in this region. The two investigated barrows formed part of one of these alignments and are situated about 125 m from each other (Bourgeois 2013, 78-88; figure 8.14). This barrow alignment is situated at the bottom of a valley on the northern slope of the ice-pushed ridge of Garderen. Ermelo I is a single period barrow, originally excavated by Modderman (1954). The mound probably was surrounded by a palisaded ditch (diameter=5.5 m), that consisted of a broad trench which was filled up after posts were placed. Part of an AOO-beaker was found in the upper part of the ditch fill (see figure 8.15), dating the barrow to the late Neolithic A. The barrow was re-excavated by Lanting and van der Waals in 1971 (Lanting and van der Waals 1971b, 1976). Samples for pollen analysis were taken from the old surface in and outside the encircling ditch, from the ditch fill (referred to as turfs by Casparie and Groenman-van Waateringe 1980) and from upper part of the ditch fill (referred to as the old surface by Casparie and Groenman-van Waateringe 1980, 31; see figure 8.15). Ermelo III
Other barrows
Sampled barrows
Ermelo III Ermelo I
Barrow alignment of Ermelo
0 125 250 500 m
60 m
0 m
m NAP
Figure 8.14. Detailed map of the Ermelo area with the locations of the barrows from the Ermelo barrow alignment that were sampled for pollen analysis. The map is based on digital elevation model of the AHN (copyright www.ahn.nl).
Other barrows
Sampled barrows
Ermelo III Ermelo I
Barrow alignment of Ermelo
0 125 250 500 m
60 m
0 m
m NAP
126 ancestral heaths
is a single period barrow. The barrow was originally excavated by Modderman (1954). Two PF-beakers and a flint blade have been found, dating the barrow to the Neolithic A. This barrow is like Ermelo I approximately 0.5 m of height and has a diameter of about 6.5 m. The barrow was re-excavated by Lanting and van der Waals in 1971 (Lanting and van der Waals 1971b). Samples for pollen analysis were taken from the old surface underneath the mound (Casparie and Groenman-van Waateringe 1980, 29-30).
8.3.2�Results
Results will be described per barrow in chronological order. See figure 8.16.
Ermelo III (2900-2500 cal BC)
The pollen spectra from the old surface of Ermelo III show an arboreal percentage of approximately 50%. This arboreal pollen percentage consists mainly of Alnus. Corylus is present in considerable amounts of approximately 35%. Other trees are Quercus (5-10%), Tilia (10-15%) and Betula (5%). The herbal vegetation is dominated by Calluna�vulgaris and Poaceae. Some anthropogenic indicators are present in the form of Chenopodiaceae and Asteraceae tubuliflorae. A few pollen grains of Cerealia were also noticed. Grazing indicators are mainly represented by Poaceae and Plantago�lanceolata.
Figure 8.15. Ermelo barrow I with the probable sample locations. 1= old surface inside encircling ditch, 2= old surface outside encircling ditch, 3= ditch fill, 4= upper part ditch fill. Figure redrawn after Modderman (1954, plate XXXIV).
127northern and central veluwe
Erm
elo
I_d
itch
(up
)
Erm
elo
I_d
itch
Erm
elo
I_o
s (o
ut)
Erm
elo
I_o
s (in
)
Erm
elo
III_
os3
Erm
elo
III_
os2
Erm
elo
III_
os1
260
0-2
500
BC
290
0-2
500
BC
2040
60
80
10
0
AP
NAP
2040
60
Alnus
2040
Corylus
1
Fagus
1Fraxinus 1
Picea
20
Pinus
20
Quercus
1Salix
20
Tilia
5Ulmus
2040
Betula
50
10
01
50
Callunavulgaris
5Asterac
eaetu
buli�ora
e
1Cereali
a 5Asterac
eaelig
uli�ora
e
5Plantagolanceolata
2040
Poaceae
1
Rumexace
tosa
/R.a
cetose
lla-ty
pe
5
Succisa 1Apiaceae 1
Brassi
cace
ae
5Caryophyll
acea
e
1Chenopodiaceae
1
Fabac
eae 1
Hypericum
perfora
tum
-type
5Lam
iaceae
1Ranuncu
laceae
1Scrophular
iaceae
2040
Dryopteris
5Polypodiumvulg
are
5Pteridiu
m 20
Sphagnum 59
4
68
6
11
86
68
6
478
459
329
Pollen
sum
(AP-B
etula)
16
47
13
57
2626
16
44
10
84
96
9
65
9
Totalp
ollensu
m
Tree
san
dsh
rub
sH
eath
An
thr.
ind
.U
pla
nd
her
bs
Fern
san
dm
oss
esG
razi
ng
ind
icat
ors
Erm
elo
Figu
re 8
.16.
Pol
len
spec
tra
from
sam
ples
take
n fr
om
the
Erm
elo
barr
ows.
Spe
ctra
are
giv
en in
% b
ased
on
a tr
ee p
olle
n su
m m
inus
Bet
ula
polle
n. In
the
tota
l A
P (=
arbo
real
pol
len)
Bet
ula
is in
clud
ed. I
n th
e to
tal
NA
P (=
non
arb
orea
l pol
len)
spo
res
are
incl
uded
, non
po
llen
paly
nom
orph
s ar
e ex
clud
ed. D
iffer
ent s
cale
s ha
ve b
een
used
, ind
icat
ed w
ith d
iffer
ent c
olou
rs.
128 ancestral heaths
Ermelo I (2600-2500 cal BC)
Compared to Ermelo III the arboreal pollen percentage seems to have slightly increased to 55%. The main tree is still Alnus. Corylus is also still present in high amounts (35%). The amount of Tilia seems to have decreased to 5-10%; the amount of Quercus seems to have slightly increased to 10-15%. Fagus has appeared, although still in very low numbers. Betula expanded from 5% at Ermelo III to 20% at Ermelo I. The heather seems to have expanded with percentages up to 125% at cost of Poaceae. No indications of Cerealia have been found. Other anthropogenic indicators such as Asteraceae tubuliflorae and Chenopodiaceae are present in low amounts.
The size of the open space
Based on the measurements of the barrows the minimum size of the open area has been calculated (see also table 8.2). Since the height of the sods is not known a standard height (known from the Echoput and Vaassen barrows) of 0.25 m has been applied. This gives the following estimates of open area:
Ermelo I: 33.4 m2, ropenarea≈3.3 m, based on a circular open spotErmelo III: 24 m2, ropenarea≈2.7 m
Based on the ratio AP:NAP, the open space had an ADF of approximately 50-100 m. The open spot might have decreased a little at the time Ermelo I was built (AP=55% for Ermelo I and AP=50% for Ermelo III). The relation found between arboreal pollen percentage and size of the open space (see 7.2) is not detailed enough to explain this difference in percentage by a difference in distance to the forest.
8.3.3�Discussion�
The vegetation composition in the area of the Ermelo barrows in the late Neolithic seems to be quite similar to the late Neolithic phase of Vaassen (8.1.2). The barrows were built in an open space with an ADF of 50-100 m with a vegetation cover of mainly heather and grasses. When the first barrow (Ermelo III) was built the heath seemed to more grassy than when Ermelo I was built. The two investigated barrows were part of a barrow alignment implying that they were built in a long-stretched heath area (see also 8.2.3 and chapter 9). Management is required to maintain such areas of heath. The increased amount of Betula could indicate a change in management regime making it possible for Betula to expand. This is also indicated by a slight decrease in anthropogenic and grazing indicators. An extensive alder carr must have been present in the stream valleys close to the barrows indicated by Alnus pollen percentages of approximately 45%. The dry forest was most likely quite open with mainly Corylus and some Quercus and Tilia.
8.4 Putten
8.4.1�Site�description�and�sample�locations
Close to the village of Putten, approximately 5 km to the southwest of the Ermelo barrows, a burial mound is situated (see figure 8.1). This barrow was excavated by van Giffen in 1947 and a sample from the old surface was analysed for pollen by Waterbolk (1954, 93-94). During this excavation a PF-beaker was found together with a battle axe, a Grand Pressigny dagger, a flint axe and four flint flakes. Three secondary interment Bell Beakers were buried in the mound
129northern and central veluwe
Putt
en_o
s(W
)
Putt
en_o
s1
Putt
en_o
s2
LNEO
-A
2040
6080
100
AP
NAP
2040
60
Alnus
2040
Corylus
2040
Quercus
20
Tilia
5Ulmus
5
Betula
20
Callunavulgaris
1
Artemisi
a 5Asteraceaetu
buli�orae
1Chenopodiaceae
1Cerealia 5Asteraceaelig
uli�orae
20
Plantagolanceolata
2040
6080
Poaceae
5Rumexacetosa/R.acetosella
-type
1
Succisa
1Brassicace
ae 20
Caryophyllaceae
1Geraniaceae
1
Polygonumpersi
caria
5Ranunculaceae
2040
6080
100
Dryopteris
20
Polypodiumvulgare
20
Pteridium
2040
Sphagnum
20
Varia
193
361
319
Pollensu
m(A
P-Betula)
240
1234
1022
Totalpolle
nsum
Tree
san
dsh
rubs
Hea
thA
nthr
opog
enic
indi
cato
rsU
plan
dhe
rbs
Fern
san
dm
osse
sG
razi
ngin
dica
tors
Putt
en
Vier
hout
enLN
EO-B
Vier
hout
en
2040
6080
100
AP
NAP
2040
Alnus
2040
Corylus
1
Fagus
1
Ilex
5Pinus
20
Quercus
20
Tilia
20
Betula
2040
6080
Ericace
ae
1
Asteraceaetubuli�
orae
1
Plantagolanceolata
5Poaceae 1
Ranunculaceae
1
Scrophularia
ceae
5Dryopteris 1
Polypodiumvulgare
5Sphagnum
545
Pollensu
m(A
P-Betula)
1090
Totalpolle
nsum
Tree
san
dsh
rubs
Hea
thAn
thr.
ind.
Upl
.her
bsFern
san
dm
osse
sG
raz.
ind.
Figu
re 8
.17.
Pol
len
spec
tra
from
the
sam
ples
take
n fr
om th
e Pu
tten
barr
ow. S
pect
ra a
re g
iven
in %
ba
sed
on a
tree
pol
len
sum
min
us B
etul
a po
llen.
In
the
tota
l AP
(=ar
bore
al p
olle
n) B
etul
a is
incl
uded
. In
the
tota
l NA
P (=
non
arb
orea
l pol
len)
spo
res
are
incl
uded
, non
pol
len
paly
nom
orph
s ar
e ex
clud
ed.
Diff
eren
t sca
les
have
bee
n us
ed, i
ndic
ated
with
di
ffere
nt c
olou
rs. L
NEO
-A=
Late
Neo
lithi
cum
A.
Figu
re 8
.18.
Pol
len
spec
tra
from
the
sam
ples
take
n fr
om
the
Vier
hout
en b
arro
w. S
pect
ra a
re g
iven
in %
bas
ed o
n a
tree
pol
len
sum
min
us B
etul
a po
llen.
In th
e to
tal A
P (=
arbo
real
pol
len)
Bet
ula
is in
clud
ed. I
n th
e to
tal N
AP
(= n
on a
rbor
eal p
olle
n) s
pore
s ar
e in
clud
ed, n
on p
olle
n pa
lyno
mor
phs
are
excl
uded
. Diff
eren
t sca
les
have
bee
n us
ed, i
ndic
ated
with
diff
eren
t col
ours
.
130 ancestral heaths
(Waterbolk 1954, 93). The old surface contained fragments of PF-Beakers that might indicate a former settlement site (Casparie and Groenman-van Waateringe 1980, 30). Re-excavation of the barrow took place in 1971 for pollen sampling. Samples were taken from the old surface. Results have been published by Casparie and Groenman-van Waateringe (1980, 30). Measurements of the mound are not known.
8.4.2�Results�and�discussion
See figure 8.17
The first thing to notice is the difference in pollen spectra from the sample published by Waterbolk and those published by Casparie and Groenman-van Waateringe. The Waterbolk spectrum shows an arboreal pollen percentage of approximately 75%, while the arboreal pollen percentage in the spectrum published by Casparie and Groenman-van Waateringe is only 30%. The differences seem mainly to have been caused by high percentages of Poaceae and ferns in the Casparie and Groenman-van Waateringe spectra, which are very low or absent in the Waterbolk spectrum. Waterbolk mentioned the bad conservation of pollen in his sample. He did not reach a pollen sum of 300 arboreal pollen grains and as a consequence this spectrum might not be representative. However, it is difficult to conclude this being the cause of the dissimilarities. Yet, it is difficult to interpret these results. Some similarities can be seen. All pollen spectra show very low percentages of Calluna�vulgaris, indicating that the open space did not contain a lot of heather. This could be the result of a small open space (as in the Waterbolk spectrum) or a larger open space that was dominated by grasses (as in the Casparie and Groenman-van Waateringe spectra).
8.5 Vierhouten
8.5.1�Site�description�and�sample�locations
Close to Vierhouten (see figure 8.1) a single period barrow was excavated in 1939 by A.E. van Giffen. Two Veluvian Bell Beakers and a wrist guard were found dating the barrow to the late Neolithic B period (2500-2000 cal BC, see table 2.1). Measurements of the mound are not known. In 1972 a re-excavation took place by Lanting and van der Waals (1972c). At that time samples for pollen analysis were taken from the old surface. One sample was analysed and published by Casparie and Groenman-van Waateringe (1980, 36).
8.5.2�Results�and�discussion
The pollen spectrum (see figure 8.18) shows an arboreal pollen percentage of approximately 56%, which indicates an open place with an ADF of approximately 50-100m. Trees in the surroundings are dominated by Alnus and Corylus, which both occur with pollen percentages of approximately 40%. Quercus, Tilia and Betula�are present in less but still considerable amounts of circa 10%. The open spot was mainly covered with Ericaceae, most likely Calluna�vulgaris. Other herbs were almost absent. The situation is comparable to the late Neolithic B-phase of Niersen-Vaassen.
131northern and central veluwe
LNEO
-B
Unk
now
n
Emst
_sur
_per
4
Emst
_os_
per4
Emst
_os_
per3
Emst
_os_
per2
Emst
_os_
per1
2040
6080
100
AP
NAP
1
Abies
2040
6080
Alnus
2040
60
Corylus
1
Fagus
1
Fraxinus 1
Hedera
5Pinus
20
Quercus
1
Salix
5
Tilia
1
Ulmus
2040
Betula
5010
015
0
Ericace
ae
1
Artem
isia 5Asterace
aetubuli�
orae
1Cerealia 1Chenopodiaceae
1Asterace
aeliguli�
orae1
Galium-ty
pe5Plantagolanceolata
20Poac
eae
1
Rumexacetosa
/R.acetosella
-type
5Succisa
1Brassica
ceae
1Caryophylla
ceae
1Cyperace
ae
1
Filipendula 1Lamiace
ae 1Papaveraceae
1Ranuncu
laceae
1Rosace
ae 5Scrophulariace
ae
1
Thalictru
m 20
Dryopteris
1
Polypodiumvulgare
1
Pteridium 5
Sphagnum
580
529
594
417
620
Pollensu
m(A
P-Betula)
1642
1218
1096 807
1219
Totalpolle
nsum
Tree
sand
shru
bsH
eath
Anth
r.in
d.U
plan
dhe
rbs
Fern
sand
mos
ses
Gra
zing
indi
cato
rsEm
st
Figu
re 8
.19.
Pol
len
spec
tra
from
the
sam
ples
take
n fr
om
the
Emst
bar
row
. Spe
ctra
are
gi
ven
in %
bas
ed o
n a
tree
po
llen
sum
min
us B
etul
a po
llen.
In th
e to
tal A
P (=
arbo
real
pol
len)
Bet
ula
is
incl
uded
. In
the
tota
l NA
P (=
no
n ar
bore
al p
olle
n) s
pore
s ar
e in
clud
ed, n
on p
olle
n pa
lyno
mor
phs
are
excl
uded
. D
iffer
ent s
cale
s ha
ve b
een
used
, ind
icat
ed w
ith d
iffer
ent
colo
urs.
Udd
eler
mee
r 1
Udd
eler
mee
r 2
LNEO
-B
2040
6080
100
AP
NAP
2040
6080
Alnus
2040
60
Corylus
1
Fagus
5Pinus
20
Quercus
5Tilia
1
Ulmus
5Betula
2040
6080
Callunavulgaris
5Asteraceaetu
buli�orae
5Asteraceaelig
uli�orae
1
Plantagolanceolata
2040
Poaceae
Succisa
1
Caryophylla
ceae
1
Huperzia
20
Monoletepsil
atefern
spores
1
Polypodiumvulgare
1
BvGt314
2040
Indeterminable
332
337
Pollensu
m(A
P-Betula)
535
737
Totalpollensu
m
Tree
san
dsh
rubs
Hea
thA
nthr
.ind
.U
pl.h
erbs
Alg
aeG
razi
ngin
d.Fe
rns
and
mos
ses
Udd
eler
mee
r
Figu
re 8
.20.
Pol
len
spec
tra
from
the
sam
ples
take
n fr
om th
e U
ddel
erm
eer
barr
ows.
Spe
ctra
are
giv
en in
% b
ased
on
a tr
ee p
olle
n su
m m
inus
Bet
ula
polle
n. In
the
tota
l AP
(=ar
bore
al p
olle
n) B
etul
a is
incl
uded
. In
the
tota
l NA
P (=
non
arb
orea
l pol
len)
spo
res
are
incl
uded
, non
pol
len
paly
nom
orph
s ar
e ex
clud
ed. D
iffer
ent s
cale
s ha
ve b
een
used
, ind
icat
ed w
ith d
iffer
ent c
olou
rs.
132 ancestral heaths
8.6 Emst
8.6.1�Site�description�and�sample�locations
Near Emst a barrow of probably four periods is situated. The barrow was first excavated in 1932 by J. Butter. The first period was dated to the late Neolithic B period based on the bodies being buried semi-flexed (Hulst 1972). The original measurements of the barrow are not known. Samples for pollen analysis were taken from the old surface of all periods. The results were published in Casparie and Groenman-van Waateringe (1980, 36-37).
8.6.1�Results�and�discussion
See figure 8.19
The pollen spectrum of the late Neolithic B period shows an arboreal pollen percentage of approximately 65% dominated by Alnus (60%) and Corylus (30%). This indicates an open space with an ADF of approximately 50 m at the oldest phase, which is very small compared to most of the other barrows in this region. This open spot is mainly covered with heath vegetation and grasses and most likely some Betula trees. In the next periods (which are not dated) the amount of arboreal pollen decreases, accompanied by an increase of heath. This indicates an increase of the open spot to an ADF of approximately 150m.
8.7 Uddelermeer
8.7.1�Site�description�and�sample�locations
Two barrows at the edge of the Uddelermeer (see figure 8.1) were excavated in 1911 by Holwerda. Uddelermeer 1 measured approximately 20 m in diameter and 1.0 m in height. Uddelermeer 2 was approximately 18 m in diameter and 1.5 m high. Both barrows were dated to the late Neolithic B period based on sherds from Bell Beaker pottery (Holwerda 1912), however, since these finds were small this dating could be questioned (Q. Bourgeois pers. comm., October 2012). In 1989 both mounds were the focus of conservation by the ROB (presently known as Cultural Heritage Agency of the Netherlands). Samples for pollen analysis have been taken from the profile in trenches during consolidation. The soil samples were taken in small glass tubes, which were sealed and sent to the University of Amsterdam, to Prof. Groenman-van Waateringe. The samples were stored until July 2009 and then taken to Leiden University for analysis. From both mounds a sample from the old surface was prepared and analysed by the method described in Chapter 4. It should be noted that samples were derived from trenches. This makes it is difficult to relate these samples exactly to the barrow, since only a small part of the barrow was exposed. Therefore properly dating of the pollen spectra is difficult as well, what with the dates of the barrows themselves being already in doubt.
8.7.2�Results�and�discussion
The preservation of pollen was poor in both samples resulting in a high amount of indeterminable pollen grains. The ratio arboreal versus non arboreal pollen is approximately 65-35% for Uddelermeer 1 and approximately 45-55% for Uddelermeer 2 (see figure 8.20). When an average thickness of 0.25m for the sods is assumed (see 8.2.2) the area that needed to be stripped to build Uddelermeer 1
133northern and central veluwe
is approximately 630 m2 indicating an open space with a radius of approximately 14 m. To build Uddelermeer 2 approximately 770 m2 (radius ≈ 15.5 m) was necessary. Based on the arboreal pollen percentage the size of the open area had an ADF of approximately 50 m for Uddelermeer 1 and approximately 150 m for Uddelermeer 1. This might indicate that Uddelermeer 1 was built first in a small open space and that Uddelermeer 2 was constructed later when the open space had expanded. Both barrows were built in heath and grass vegetation. The forest in the surroundings was probably quite open and consisted mainly of Corylus. Alder carr was present in the wetter areas.
8.8 Boeschoten
8.8.1�Site�description�and�sample�locations
In de area of Boeschoten (see figure 8.1) a barrow was excavated by Glasbergen and van der Waals in 1952. The old surface contained lots of charcoal particles. The excavators dated the barrow to the Early Bronze Age or the late Neolithic B period, based on sherds of ceramics found in the old surface. Measurements of the barrow are not known. Samples for pollen analysis were taken from the old surface underneath the mound and from the fill of the ditch surrounding the barrow. The results of the pollen analysis were published by Waterbolk (1954, 93-95).
8.8.1�Results�and�discussion
The pollen spectra from both samples show rather similar results (see figure 8.21). The arboreal pollen percentage is approximately 65%. This indicates a small open space with an estimated ADF of approximately 50 m. The surrounding forest consisted mainly of Quercus and Corylus with nearby an alder carr in the wetter parts of the area. The amount of herbal pollen is low and consists of 13-28% Calluna and approximately 15% Poaceae. The pollen spectra show very poor variety of species. Some anthropogenic indicators are present, however, in such low amounts that they cannot be linked to the activity of man.
8.9 Ugchelen
8.9.1�Site�description�and�sample�locations
Near Ugchelen four barrows were excavated in 1947. All barrows were heavily damaged prior to the excavation and the original measurements of the barrows could not be reconstructed. Two of the barrows (Ugchelen 1 and 4) could be sampled for pollen analysis. These barrows could not be dated. The obtained pollen spectra from the old surfaces of both barrows have been published by Waterbolk (1954, 94-95).
8.9.1�Results�and�discussion
See figure 8.22
Like the barrow of Boeschoten, the barrows of Ugchelen were built in a small open space with an ADF of approximately 50 m covered with heather and grasses surrounded by a forest of mainly Quercus and Corylus. Alder carr in the wetter surroundings was probably responsible for the high percentage of Alnus pollen in the spectra. A remarkable difference in Tilia pollen between the two barrows (approximately 20% for Ugchelen 1 and approximately 2% for Ugchelen 4) makes
134 ancestral heaths
Boes
chot
en_o
s
Boes
chot
en_d
itch
LNEO
-B/E
BA
2040
6080
100
AP
NAP
2040
60
Alnus
2040
Corylus
5Pinus
20
Quercus
5Tilia
5Betula
2040
Callunavulgaris
1Asteraceaetu
buli�orae
1Cerealia
1Chenopodiaceae
5Asteraceaelig
uli�orae
5Plantagolanceolata
20
Poaceae
1
Rumexacetosa/R.acetosella
-type
20
Succisa
1Caryophyllaceae
1Ranunculaceae
20Dryopteris
1
Polypodiumvulgare
20
Pteridium
5Sphagnum 211
476
Pollensu
m(A
P-Betula)
316
866
Totalpollensu
m
Tree
sand
shru
bsH
eath
Anth
r.in
d.U
pl.h
erbs
Fern
sand
mos
ses
Gra
zing
ind.
Boes
chot
en
Ugc
hele
n 1
Ugc
hele
n 4
2040
6080
100
AP
NAP
2040
60
Alnus
2040
Corylus
5Pinus
2040
Quercus1
Salix
20
Tilia
20
Betula
2040
Callunavulgaris
1Asterace
aetubuli�
orae
5Cereali
a 1Chenopodiaceae
5Asterace
aeliguli�
orae
20
Poaceae
20
Plantagolanceolata
1
Rumexacetosa/R.acetosella
-type
5Succisa
5Caryophyllace
ae
1Ranunculac
eae
20
Dryopteris
1
Polypodiumvulgare
20
Pteridium
20
Sphagnum 5Varia
160
476
Pollensu
m(A
P-Betula)
264
866
Totalpolle
nsum
Tree
san
dsh
rubs
Hea
thA
nthr
opog
enic
ind.
Upl
and
herb
sFe
rns
and
mos
ses
Gra
zing
ind.
Ugc
hele
n
Figu
re 8
.21.
Pol
len
spec
tra
from
the
sam
ples
take
n fr
om th
e Bo
esch
oten
ba
rrow
. Spe
ctra
are
giv
en in
% b
ased
on
a tr
ee p
olle
n su
m m
inus
Bet
ula
polle
n.
In th
e to
tal A
P (=
arbo
real
pol
len)
Bet
ula
is in
clud
ed. I
n th
e to
tal N
AP
(= n
on
arbo
real
pol
len)
spo
res
are
incl
uded
, no
n po
llen
paly
nom
orph
s ar
e ex
clud
ed.
Diff
eren
t sca
les
have
bee
n us
ed, i
ndic
ated
w
ith d
iffer
ent c
olou
rs.
Figu
re 8
.22.
Pol
len
spec
tra
from
the
sam
ples
take
n fr
om th
e U
gche
len
barr
ows.
Spe
ctra
are
giv
en in
% b
ased
on
a tr
ee p
olle
n su
m m
inus
Bet
ula
polle
n. In
the
tota
l AP
(=ar
bore
al p
olle
n)
Betu
la is
incl
uded
. In
the
tota
l NA
P (=
no
n ar
bore
al p
olle
n) s
pore
s ar
e in
clud
ed,
non
polle
n pa
lyno
mor
phs
are
excl
uded
. D
iffer
ent s
cale
s ha
ve b
een
used
, ind
icat
ed
with
diff
eren
t col
ours
.
135northern and central veluwe
it unlikely that they were built in the same period. Although the barrows have not been dated, Barrow 1 can be assumed the older of the two based on the rather high percentage of Tilia pollen. However, based on only one sample this cannot be concluded with certainty. Also remarkable are the high percentage of Plantago�lanceolata in the spectrum from Barrow 1 and the presence of Cerealia. This may indicate an increase in human activity in the area around the period Barrow 1 was constructed than when Barrow 4 was built.
8.10 Stroe
Near Stroe (see figure 8.1) a barrow is located that was excavated several times (by Pleyte and Nairac in 1877, by Westendorp in 1926-1929 and by Lanting and van der Waals in 1971). The barrow might contain two periods, although this cannot be confirmed with certainty based on the excavation data. The first (?) period of the barrow was dated to the Late Neolithic B, based on the find of a copper tanged dagger, a wrist guard and a Veluvian Bell Beaker. Below the mound some PFB sherds were found. Some fragments of charcoal that were scattered on the old surface were 14C-dated to 3955 ± 55 BP (GrN-6350; 2600-2287 cal BC, calibrated with Oxcal 4.2) and might be associated to the PFB material. The barrow was re-excavated by Lanting and van der Waals in 1971 (Lanting and van der Waals 1971c, 1976). Samples for pollen analysis were taken from the old surface of the primary mound and from the old surface of the presumably secondary mound in 1971. The results of the pollen analysis were published by Casparie and Groenman- van Waateringe (1980, 34).
8.10.1�Results�and�discussion
The barrow was built in a very small open place with an ADF of less than 50 m. In contrast to all other analysed barrows this mound was not built in heath vegetation (see figure 8.23). Instead, the vegetation at the open spot was probably covered with grass, indicated by the relatively high percentages of Poaceae found in the pollen spectra (ca. 15%). The forest in the surrounding area mainly consisted of Corylus, Quercus and probably also Betula. Alder carr was present in the wetter parts of the area. The barrow was possibly built on a former settlement, given the finds of PFB material. The presence of heath and grazing indicators suggests that the site was used as pasture before the barrow was built and after abandonment of the settlement.
Stroe_os1_per2
Stroe_os2_per2
Stroe_os_per1LNEO-B
Unknown
20 40 60 80 100
AP NAP
20 40 60 80
Alnus
20 40
Corylus
20
Quercus
20
Tilia
20 40
Betula
5
Ericaceae
20
Asteraceae tu
buli�orae
1
Asteraceae lig
uli�orae
5
Plantago lanceolata
20
Poaceae
1
Succisa
1
Caryophyllaceae
1
Ranunculaceae
20
Dryopteris
5
Polypodiumvulgare
5
Pteridium
5
Sphagnum
346
335
326
Pollen su
m(A
P-Betula)
554
550
528
Total pollen su
m
Trees and shrubs HeathAnthr. ind. Grazing ind. Ferns and mossesUpl. herbsStroe
Figure 8.23. Pollen spectra from the samples taken from the Stroe barrow. Spectra are given in % based on a tree pollen sum minus Betula pollen. In the total AP (=arboreal pollen) Betula is included. In the total NAP (= non arboreal pollen) spores are included, non pollen palynomorphs are excluded.Different scales have been used, indicated with different colours.
136 ancestral heaths
8.11 Palynological results from peat and lake sediments
8.11.1�Site�description�and�sample�locations�
The Uddelermeer is one of the largest pingo ruins in the Netherlands created in the Last Glacial period of the Pleistocene. It is very deep, around 17 m, and has slowly been filled up with organic mud. Pollen was caught in every layer of organic mud and an archive of vegetation development was formed. Polak took samples for pollen analysis at four places, the results of which were published in Polak (1959).
8.11.2�Results�and�discussion
Polak (1959) made several pollen diagrams that show the regional vegetation development of the area. In figure 8.24 a summarized pollen diagram of the Polak diagrams is shown. The diagram is based on the results of two different sample locations: a deeper location with the older organic layers, the results of which are shown in the part below the dashed line. The part above the dashed line shows the more recent vegetation development, derived from the upper organic layers. The pollen sum used in this diagram is based on the arboreal pollen sum minus Betula to be able to compare it to the barrow pollen spectra. The total arboreal and non arboreal percentages are based on a total pollen sum of which the aquatic vegetation has been left out (Poaceae are included although the marsh plant reed belongs to this family and could have been locally present). Although the diagrams have not been 14C-dated, pollen zones according to Jessen and Iversen have been applied to the lake samples, based on the stratigraphy of the lake sediments and the palynological results. The results from the Preboreal (zone IV) until the Subatlantic (zone IX) will be discussed here. The pollen diagram shows the regional vegetation development of the area where the barrows described above are situated in. Although not directly linked in time to the barrows due to the lack of exact dating, the pollen diagram shows the general development of the environment of the barrows.
Table 8.2. The minimum size of the open space per barrow based on the sods used to build the barrows.
137northern and central veluwe
1.8
5.1Depth
(m)
850
BC-(
pres
ent)
3750
-850
BC
7000
-375
0BC
8000
-700
0BC
(900
0)-8
000
BC20
4060
8010
0
AP
NAP
2040
60
Alnus
5Carpinus
1Cornussanguinea
2040
60
Corylus
20
Fagus 1Frangulaalnus
5Fraxinus 20
Juniperus 1Lych
nis-type
5Picea
2040
6080
Pinus
1Populus 2040
Quercus
2040
Quercetummixtum
1Rhamnuscath
artica
20
Salix
1Sambucus
5Tilia
5Ulmus
5010
015
0Betu
la20
4060
Ericaceae
20
Artemisia 1Asteraceae
tubuli�orae
20
Cerealia 1Chenopodiaceae
1Fagopyrum
20
Secale
1Urtica 1Asteraceae
liguli�
orae
5Galium 20
Planta
golanceolata
2040
Poaceae
20
Rumex 1Succisa
Tree
san
dsh
rub
sH
eath
An
thro
pog
enic
ind
icat
ors
Gra
zin
gin
dic
ator
sUd
dele
rmee
rA
fter
Pol
ak (1
957)
5Apiaceae
1Brassicaceae
1Campanula 50
100
150
Cyperaceae
1Digitalis-
type
1Euphorbia
1Fabaceae
1Filipendula
5Galeopsis-ty
pe
1Geranium
5Geum 1Helianthemum
nummularium
20
Humulus/Cannabissativ
a
1Jasione 20
Littorella 1Lotus 1Lysim
achia
1Lythrum 1Melampyrum
1Mentha-type
1Polygonumbistorta
1Polygonumpersic
aria
1Potentilla
5Ranunculusbatrach
ioides
1Solanum
dulcamara
1Stellaria
-type
1Thalictru
m
1Valeriana
1Caltha 1Cladium 1Drosera
rotundifolia
1Hottonia 1Hydrocotyle
2040
Isoëtes
1Menyanthestrifolia
ta
1Myriophyllu
malte
rni�orum
1Nuphar 1Nymphaea
2040
Potamogeton 5Spargan
ium
1Typhalatifolia
1Botrychium
5Equisetu
m
1Lycopodiella
inundata
1Lycopodium
annotinum
1Lycopodium
clavatu
m
5Monoletepsila
tefern
spores
1Osmunda
1Polypodiumvulgare
5Pteridium 1Selaginella 20
Sphagnum 2040
60
Botryoco
ccus
2040
Pediastrum
2040
60
Scenedesmus
5Tetraedron 54
0
858
918
636
439
391
635
644
1168
1932
1521
2043 85
975
4
1127
1092
1053 86
298
592
710
65 907
1800
1610
1078
1231 15
9
Pollensum
(AP-Betula)
1472
2105
2120
1478
1056 89
112
1511
0518
91
3165
2433
3140
1435
1307
1692
1788
1732
1263
1604
1367
1471
1230
2367
2153
1326
1582 62
2
Totalpollensu
m
Zone
IXSu
batla
ntic
VIIIS
ubbo
real
VIIA
tlant
ic
VIBo
real
VBo
real
IVPr
ebor
eal
Up
lan
dh
erb
sA
qua
tich
erb
sFe
rns
and
mos
ses
Alg
ae
Figu
re 8
.24.
Pol
len
diag
ram
fr
om th
e U
ddel
erm
eer,
com
pose
d an
d re
draw
n fr
om
thre
e po
llen
diag
ram
s by
Pol
ak
(195
9, d
iagr
ams
I, V
I and
V
II).
Polle
n zo
nes
have
bee
n ap
plie
d ac
cord
ing
to Je
ssen
and
Iv
erse
n. A
per
cent
age
diag
ram
is
sho
wn,
with
% b
ased
on
a tr
ee p
olle
n su
m m
inus
Bet
ula.
In
the A
P (=
arb
orea
l pol
len)
Be
tula
is in
clud
ed. I
n th
e to
tal
NA
P (=
non
arb
orea
l pol
len)
sp
ores
are
incl
uded
, non
pol
len
paly
nom
orph
s ar
e ex
clud
ed.
Diff
eren
t sca
les
have
bee
n us
ed,
indi
cate
d w
ith d
iffer
ent c
olou
rs.1.
8
5.1Depth
(m)
850
BC-(
pres
ent)
3750
-850
BC
7000
-375
0BC
8000
-700
0BC
(900
0)-8
000
BC20
4060
8010
0
AP
NAP
2040
60
Alnus
5Carpinus
1Cornussanguinea
2040
60
Corylus
20
Fagus 1Frangulaalnus
5Fraxinus 20
Juniperus 1Lych
nis-type
5Picea
2040
6080
Pinus
1Populus 2040
Quercus
2040
Quercetummixtum
1Rhamnuscath
artica
20
Salix
1Sambucus
5Tilia
5Ulmus
5010
015
0
Betula
2040
60
Ericaceae
20Arte
misia 1Asteraceae
tubuli�orae
20
Cerealia 1Chenopodiaceae
1Fagopyrum
20
Secale
1Urtica 1Asteraceae
liguli�
orae
5Galium 20
Planta
golanceolata
2040
Poaceae
20
Rumex 1Succisa
Tree
san
dsh
rub
sH
eath
An
thro
pog
enic
ind
icat
ors
Gra
zin
gin
dic
ator
sUd
dele
rmee
rA
fter
Pol
ak (1
957)
5Apiaceae
1Brassicaceae
1Campanula 50
100
150
Cyperaceae
1Digitalis-
type
1Euphorbia
1Fabaceae
1Filipendula
5Galeopsis-ty
pe1Gera
nium5Geum 1Helia
nthemumnummulariu
m
20
Humulus/Cannabissativ
a
1Jasione 20
Littorella 1Lotus 1Lysim
achia
1Lythrum 1Melampyrum
1Mentha-type
1Polygonumbistorta
1Polygonumpersic
aria
1Potentilla
5Ranunculusbatrach
ioides
1Solanum
dulcamara
1Stellaria
-type
1Thalictru
m
1Valeriana
1Caltha 1Cladium 1Drosera
rotundifolia
1Hottonia 1Hydrocotyle
2040
Isoëtes
1Menyanthestrifolia
ta
1Myriophyllu
malte
rni�orum
1Nuphar 1Nymphaea
2040
Potamogeton 5Spargan
ium
1Typhalatifolia
1Botrychium
5Equisetu
m
1Lycopodiella
inundata
1Lycopodium
annotinum
1Lycopodium
clavatu
m
5Monoletepsila
tefern
spores
1Osmunda
1Polypodiumvulgare
5Pteridium 1Selaginella 20
Sphagnum 2040
60
Botryoco
ccus
2040
Pediastrum
2040
60
Scenedesmus
5Tetraedron 54
0
858
918
636
439
391
635
644
1168
1932
1521
2043 85
975
4
1127
1092
1053 86
298
592
710
65 907
1800
1610
1078
1231 15
9
Pollensum
(AP-Betula)
1472
2105
2120
1478
1056 89
112
1511
0518
91
3165
2433
3140
1435
1307
1692
1788
1732
1263
1604
1367
1471
1230
2367
2153
1326
1582 62
2
Totalpollensu
m
Zone
IXSu
batla
ntic
VIIIS
ubbo
real
VIIA
tlant
ic
VIBo
real
VBo
real
IVPr
ebor
eal
Up
lan
dh
erb
sA
qua
tich
erb
sFe
rns
and
mos
ses
Alg
ae
138 ancestral heaths
In the Preboreal (IV) the percentage of arboreal pollen increased due to a decrease of herbs like Poaceae, Cyperaceae and Artemisia. The arboreal pollen percentage consisted mainly of Pinus and Corylus, of which the latter appeared in the preceding period. In the Boreal (V&VI) period percentages around 80% of total pollen (minus aquatic plants) were reached. During this period Alnus and Quercetum-mixtum (e.g. tall deciduous dryland trees) appeared. Alnus reached percentages of around 25-30% and Quercetum-mixtum increased even further until 35-40%. At the same time Pinus,�probably a long distance element at this time, decreased to around 5% (of ∑AP-Betula). Corylus decreased as well, although less dramatically until around 20%. Tilia,�Ulmus�and Fraxinus�appeared in this period. Ericaceae were present with percentages of approximately 2-4%. This situation remained quite stable until the last part of the Subboreal period, although the amount of herbs gradually increased. This is mainly due to the increase of Poaceae until percentages of around 10-15%. The amount of Ericaceae increased slightly too up to 10%. Anthropogenic indicators like Plantago�lanceolata�and Rumex rose up to around 3%. Cereal pollen grains increased until 3-4%.
Towards the end of the Subboreal period (which ends at 800 cal BC, see table 2.1) the arboreal-non arboreal ratio changed in favour of the non-arboreal pollen. The percentage of non-arboreal pollen increased until around 45%. This is mainly caused by the further increase of grasses (until around 30%) and Ericaceae (around 25%). A slight decrease in Quercetum-mixtum pollen can be seen, while the percentage of Alnus pollen seemed to increase slightly. This change in vegetation composition could be indicative for the influence of humans in the area.
The Subatlantic (zone IX, from 800 cal BC, see table 2.1) started with a further decrease of total arboreal pollen and an expansion of Ericaceae and Poaceae. Cereal pollen grains continued to increase slowly as well. Halfway through this zone Secale appears in the diagram, which probably coincides with the Roman Iron Period (Behre 1992). At this time there seems to be a slight regeneration of the forest (mainly Quercetum-mixtum) and some decrease of heath. Then the non arboreal vegetation expanded again at cost of the forest, with further increase of heath and cereal pollen, including Secale. The end of the diagram probably represents the early Middle Ages (according to Polak 1959).
8.12 Summary: the barrow landscape of northern and central Veluwe
In this chapter the palynological results of barrows at the northern and central part of the Veluwe have been discussed in order to answer the question: What did a barrow landscape look like before and after the barrows were built? And, what was the role of prehistoric human?
Barrows from the late Neolithic A period until the Iron Age were built in open spaces that generally had an average distance to the forest (ADF) of approximately 50-100m, shown by arboreal pollen percentages of 55-60%. Most herb pollen is coming from local vegetation. All barrows except one (Stroe; 8.10) were built in a heath vegetation type, according to the percentages of Calluna�vulgaris� found in all pollen spectra. These percentages are on average lowest in the oldest barrow spectra (around 20%) and highest in the youngest, with percentages up to 100%. However, percentages over 100% did also occur during the late Neolithic, shown by the pollen spectra from Ermelo (8.3). This implies that heath was present in the whole area during the entire period. These heath areas varied from small to rather large, and in general the heath areas expanded over time. Besides Calluna�vulgaris, the heath vegetation consisted for a considerable part of grasses. Anthropogenic
139northern and central veluwe
indicators are present in all barrow spectra, although in low percentages. The most dominant anthropogenic indicator is Plantago� lanceolata, indicating that the area had been significantly disturbed by human hands. The open places with heath vegetation where the barrows were built in were not recorded as such in the Uddelermeer diagram, indicating the local spread of pollen of heath species. The Uddelermeer diagram suggests that the vegetation consisted of mainly forest and human activity was slight. The barrow pollen spectra however, indicate otherwise. Open places with heath vegetation must have been present in considerable numbers from the Neolithic onwards.
In all pollen spectra Alnus was the dominant arboreal pollen type. It is very likely that alder carr forests were present in the wetter parts of the area, probably the stream valleys. The drier forest in the surroundings consisted mainly of Tilia, with pollen percentages of 5-20%, Quercus, with pollen percentages of approximately 10% and Corylus at the forest edge, with pollen percentages of 30-40%. The remaining tree species occur with somewhat fluctuating but low percentages during the entire period. This general view on forest composition in the area is also shown by the pollen diagram from the Uddelermeer, where zone VI-VIII probably represent the situation that has also been registered in the barrow pollen spectra: the high percentages of Alnus in the wetter parts of the area; the drier forest consisting mainly of Quercus and Corylus.
In the Middle/Late Iron Age the barrow landscape seems to have changed, according to the palynological data of the Echoput barrows (8.1). These barrows were built in much larger open spaces, with an ADF of approximately 200-300 m (arboreal pollen percentage is around 20%). Calluna� vulgaris� and Poaceae�are, as at the older barrow locations, the dominating species at the open space. Percentages of Calluna� vulgaris� now substantially exceed 100%, while grasses (Poaceae) fluctuate around 60%.
The forest composition in the Middle/Late Iron Age period at the Echoput was slightly different from the forest composition shown by the older barrows in the area. The amount of Tilia (pollen percentages of 1-2%) and Corylus (pollen percentages of less than 20%) seem to have decreased, while Quercus� (pollen percentages until 40%) and Fagus (pollen percentages until 5%) seem to have increased. In addition, Carpinus has appeared in the pollen spectra. Alder carr is still present in the wetter areas.
As mentioned above, at the time the Echoput barrows were built, heath vegetation had expanded in the area. This spreading out of heath vegetation most likely continued. At the time posts were placed close to the Echoput barrows, probably in the Medieval period (see 8.1.4), arboreal pollen percentages were only around 15%. These low percentages indicate an ADF over 600 m (see table 7.2). This large scale expansion of heath in the Medieval Period is also recorded in the Uddelermeer diagram (when Fagopyrum and Secale have appeared as well). This is most likely due to the large scale opening up of the landscape caused by intensified human activities.
In this chapter it has been shown that the barrows from the Late Neolithic A period until the Late Iron Age were built in heath vegetation. It was also shown that during the late Neolithic A period long alignments of barrows were present (8.2 Niersen-Vaassen and 8.3 Ermelo). These barrows alignments were probably built in long stretched heathland areas, where visibility from one barrow to the next is likely (Bourgeois 2013, 154-155). The fact that heath and herb vegetation had already developed at the barrow places, suggests that these long stretched heath areas were already present some time before the barrows were built. Moreover, these open spaces must have been kept open until the barrows were
140 ancestral heaths
built. This also accounts for the smaller heath areas where barrows were built in that not formed such alignments. It is important to realise that management was required to maintain these heath areas. This indicates the activity of humans in the area, at least and perhaps specifically at the places where the barrows were going to be built. Some open spaces might have been used as settlement area prior to the barrow building (8.2 Vaassen I and 8.4 Putten). These sites must have been abandoned for some time before the mounds were raised. For the other barrows in this region no such indications have been found, nor for the cultivation of crops. As has been discussed extensively in paragraph 8.1.4 (Echoput) it is likely that most of these open spaces have been kept open by grazing.
141the renkum stream valley
Chapter�9
The Renkum stream valley
In Chapter 8 palynological analyses of barrows at the northern and central part of the Veluwe have shown a barrow landscape that was dominated by heath vegetation that must have been managed for several millennia (from the late Neolithic A period until the Late Iron Age). In this chapter another group of barrows will be discussed. These barrows are located in a region further to the south that is very much comparable to the northern and central Veluwe. This region is also situated on the Pleistocene push moraine complexes. In Chapter 8 two alignments of barrows have been discussed and in Chapter 9 another example of a barrow alignment will be shown.
This alignment with a length of at least 4.5 km12 is situated in a stream valley near Renkum (Bourgeois 2013, 67-77), in the southern part of the Veluwe (see figure 9.1). Several of the barrows of the alignment have been excavated and sampled for pollen analysis as well as three barrows in the same region outside this alignment. The barrows were all analysed by Casparie and Groenman-van Waateringe (1980, 24-36), with the exception of Bennekom 1. Bennekom 1 was published by van Giffen (1954). Section 9.2 presents a new interpretation of the data retrieved by the above mentioned researchers.
9.1 Site description and sample locations
Burial�mounds�belonging�to�the�barrow�alignment
Renkum 1: A single-period barrow that was excavated in 1929 by Bellen. The barrow was dated to the late Neolithic A based on the find of a PF Beaker. Originally the barrow measured approximately 9 m in diameter and 0.80 m in height. Lanting and van der Waals re-excavated the barrow. Samples were then taken from the old surface for pollen analysis (Lanting and van der Waals 1972b, Casparie and Groenman-van Waateringe 1980, 28).
Renkum 2: A single-period barrow in which a PF Beaker was found when it was excavated in 1929 by Bellen. Based on this PF Beaker the barrow was dated to the late Neolithic A. During a re-excavation in 1972 by Lanting and van der Waals samples were taken for pollen analysis (Lanting and van der Waals 1972b). Samples from the old surface have been analysed (Casparie and Groenman-van Waateringe 1980, 29).
Renkum 3: A two-period barrow that has been excavated in 1975 by Bakker and Groenman-van Waateringe (1980, 29). A PF Beaker has been found in the primary mound, dating it to the late Neolithic A. The barrow measured 15 m in diameter and 1.8 m in height. Samples that have been analysed were taken from the old surface of the primary mound and from a sod of the secondary mound.
12 According to Bourgeois (2013, 74 ), two alignments are situated in the stream valley of Renkum, that possibly formed one long alignment of at least 4.5 km in length.
142 ancestral heaths
Renkum 4: A single-period barrow that has been excavated in 1929 by Bellen. Lanting and van der Waals have re-excavated the barrow in 1972 and at that time samples from the old surface were taken for pollen analysis (Lanting and van der Waals 1972b, Casparie and Groenman-van Waateringe 1980, 29). The barrow was dated to the late Neolithic A based on the find of a PF Beaker. A 14C-date of charcoal derived from sods, 2866-2472 cal BC (4065 ± 55 BP, GrN-6712C, calibrated with Oxcal 4.2), can be used as a terminus�post�quem date. The barrow was 15 m in diameter and 1.0 m high.
Renkum 5: A two-period barrow that was excavated in 1958 by van Giffen. A Veluvian Bell Beaker was found dating the barrow to the Late Neolithic B period. Measurements of the barrow are unknown. A sample for pollen analysis was taken from the old surface (Casparie and Groenman-van Waateringe 1980, 36).
Ede 1: A single-period barrow in which a Veluvian Bell Beaker was found and twelve amber beads during its excavation in 1927 by Bellen. The barrow was dated to the late Neolithic B. The barrow measured 11 m in diameter and approximately
60 m
0 m
m NAP
Other barrows
Sampled barrow
Ede 1
Ede 2
Bennekom Oostereng
Bennekom 1
Renkum 2Renkum 1
Renkum 4
Renkum 3
Renkum 5
Doorwerth
Wolfheze
Warnsborn
0 750 1500 3000 m
Figure 9.1. Location of the Renkum barrow alignment. The sampled barrows of this alignment have been indicated, as well as the sampled barrows outside this alignment. The map is based on digital elevation model of the AHN (copyright www.ahn.nl).
143the renkum stream valley
0.70 m in height. The mound was re-excavated by Lanting and van der Waals (1971a). At that time samples were taken for pollen analysis from the old surface (Casparie and Groenman-van Waateringe 1980, 36).
Ede 2: A barrow that was originally excavated by Bellen in 1927 and re-excavated by Lanting and van der Waals (1976). The barrow was dated to the late Neolithic B based on the find of a Maritime Bell Beaker and a 14C-date of 2890-2580 cal BC (4155 ± 60 BP, GrN-6688C, calibrated with Oxcal 4.2) as a terminus�post�quem date for the grave. The diameter of the barrow was approximately 12 m and the height approximately 0.60 m. Two samples were taken from the old surface, which were analysed for pollen (Casparie and Groenman-van Waateringe 1980, 34).
Bennekom 1: A multi-period barrow of which the first period most probably dates to the late Neolithic B. Measurements of the barrow’s size after the fourth period have been determined to have been approximately 23 m in diameter and 1.70 m in height. Samples for pollen analysis were taken from the old surface of period 1-5, from a sod of period 1 and from the ditch belonging to period 4 (van Giffen 1954).
Bennekom Oostereng: A three-period barrow that was excavated in 1929 by Bursch. The primary mound contained a Veluvian Bell Beaker, a wrist guard and several flint artefacts, dating the barrow to the Late Neolithic B period. Samples for pollen analysis were taken during re-excavation in 1972 by Lanting and van der Waals (1972a). Samples that were analysed originated from the old surface and a sod of period I, the old surface of the second period and the old surface of period III (Casparie and Groenman-van Waateringe 1980, 35).
Burial�mounds�outside�the�barrow�alignment
Warnsborn (Warnsborn 1-6): Six barrows that were situated near Arnhem were excavated in 1947 and 1948 by Glasbergen and Waterbolk (Waterbolk 1954, 95-99; Glazema 1951). Barrow 1 was dated to the Late Neolithic A period, based on the find of a PF Beaker, a flint axe and a flint blade. Barrow 2 could not be dated, but Waterbolk mentions that this barrow was similar in structure to barrow 1 and possibly also originated from the Late Neolithic A period. Both barrows were small and the old surface was barely recognisable. Barrows 3-6 were all dated to the Early Bronze Age, based on burial typology. This dating, however, is questionable, given that secure dating is not possible based on burial typology. The barrows were built of recognisable sods on a Carbic Podzol (Dutch classification: Humuspodzol). Samples for pollen analysis were taken from the old surface of Barrows 1-4. Barrow 5, which was a two-period barrow, was sampled at the old surface and two sods (one sod from each period). From Barrow 6, a three-period barrow, samples were taken from the old surface of all three periods. All samples were analysed and published by Waterbolk (1954, 95-99). In 1972 Lanting and van der Waals re-excavated barrow 1. Charcoal from the primary grave was 14C dated 3822-2290 cal BC (4435 ± 320 BP, GrN-318, calibrated with Oxcal 4.2). Samples for pollen analysis were taken by W. Groenman-van Waateringe from the old surface and from a Bronze Age interment (Casparie and Groenman-van Waateringe 1980, 24).
Doorwerth: A two- or possibly a multi-period barrow excavated by Hulst in 1972 (Hulst� et� al. 1973). Grave-goods of the first period included an AOO Beaker, dating the mound to the late Neolithic B period. Samples for pollen analysis were taken from the old surface and from a sod from the primary mound (Casparie and Groenman-van Waateringe 1980, 31).
144 ancestral heaths
Wolfheze: A two-period barrow at Wolfheze. The barrow was excavated in 1971 by Hulst (Hulst 1971). The first period of the mound was dated to the Bronze Age based on the find of a Drakenstein urn. Samples for pollen analysis were taken from the old surface and a sod of period 1, the old surface of period 2 and the old surface of the secondary mound (Casparie and Groenman-van Waateringe 1980, 37).
9.2 Results and discussion
The analysed barrows belonging to the alignment are all from late Neolithic origin and they all indicate being surrounded by a rather similar vegetation pattern. All barrows were built in an open space with heath and grasses. For the Neolithic A period the ratio AP versus NAP is different between barrows (see figure 9.2 and 9.3), indicating a difference in size of the open space the barrows were built in. Arboreal percentages fluctuate from around 45% to around 75% suggesting very small open spaces of approximately 30 m in diameter to larger open spaces with a diameter of approximately 250 m. A barrow also dating to the late Neolithic A period that is situated approximately 6 km to the east of the alignment (Warnsborn 1) shows an arboreal pollen percentage in the spectrum derived by Casparie and Groenman-van Waateringe of approximately 75%. This high percentage suggests a very small open space of approximately 30 m in diameter. The spectra of barrow 1 and 2 obtained by Waterbolk (Warnsborn 1 and Warnsborn 2) show even higher numbers of AP, but Waterbolk (1954, 98) mentions that herbal pollen from these barrows were not investigated with enough care. The AP might have been lower. As expected, the composition of the forest in the surroundings is similar for all barrows. Alnus pollen, probably coming from an alder carr in the wetter parts of the area, dominates the arboreal pollen spectra with 45-50%. The drier forest consists mainly of Corylus (30%), Quercus (10%) and Tilia (5%). Betula was present in fluctuating amounts, indicating that solitary Betula trees were probably present in the heathland area. Barrow 1 of Warnsborn (Warnsborn 1) shows a slightly lower percentage of Alnus. This could indicate that the barrows belonging to the alignment were situated closer to an alder carr than the Warnsborn barrow. The open space this barrow was built in differs also from the alignment barrows while grasses are the dominating herbs instead of Ericaceae.
In the next phase (late Neolithic B period) the vegetation composition seems not to have changed in the alignment. Apparently the forest composition remained unaltered and the open spaces the barrows were built in consisted of mainly heath and grasses. The size of the open spaces seems in general to be smaller than during the preceding period with an ADF of approximately 25-50 m. The late Neolithic B barrow of Doorwerth, situated east of the barrow alignment shows a similar vegetation composition as Warnsborn 1 with low percentages of Ericaceae.
The vegetation development in the following periods is hard to reconstruct. Barrows belonging to the Bronze Age period were not investigated in the alignment. The Bronze Age barrows at Warnsborn (Warnsborn 3-6) show an expansion of heath at cost of mainly Poaceae compared to the Late Neolithic A period of Warnsborn 1. The BA barrows of Warnsborn show a similar vegetation composition as the Neolithic barrows in the barrow alignment discussed above. Secondary and tertiary periods (undated) of the Warnsborn mounds show a slight decrease in AP and a slight increase in Ericaceae pollen. A two-period barrow that is situated approximately 3 km to the east of the alignment (Wolfheze) was dated to the Bronze Age period as well (the primary mound). This barrow also shows a similar pollen spectrum. The secondary mound has not been dated. The pollen spectrum of this period suggests a slight decrease of forest cover and an
145the renkum stream valley
Benn
ekom
1_os
_per
5Be
nnek
om1_
ditc
h_pe
r4Be
nnek
om1_
os_p
eri
Benn
ekom
1_os
_per
3Be
nnek
om1_
os_p
erBe
nnek
om1_
sod_
peri
Benn
ekom
1_os
_per
1Re
nkum
5_os
_per
1Be
nnek
om_o
ost_
os_p
er3
Benn
ekom
_oos
t_os
_per
2Be
nnek
om_o
ost_
sod_
per1
Benn
ekom
_oos
t_os
_per
iEd
e1_o
s2Ed
e1_o
s1Ed
e2_o
s2Ed
e2_o
s1Re
nkum
3_os
_per
2Re
nkum
3_os
2_pe
r1Re
nkum
3_os
1_pe
r1Re
nkum
4_os
2Re
nkum
4_os
1Re
nkum
2_os
2Re
nkum
2_os
1Re
nkum
1_os
2Re
nkum
1_os
1
LNEO
-B
LNEO
-A
Un
know
n
2040
6080
100
AP
NAP
1Acer
2040
6080
Alnus
2040
Corylus
5
Fagus
1Fraxinus 5
Pinus
20
Quercus
5Salix
20
Tilia
5Ulmus
2040
6080
100
Betula
5010
015
0
Ericaceae
1
Artemisi
a
20
Astera
ceaetu
buli�ora
e
5Cerealia
5Chenopodiaceae
5Fagopyrum 1
Urtica
20
Astera
ceaelig
uli�ora
e
1
Galium-ty
pe
510
Plantagolanceolata
2040
6080
Poaceae
20
Rumexacetosa
/R.acetosella-ty
pe
20
Succisa
Tree
san
dsh
rub
sH
eath
Anth
rop
ogen
icin
dica
tors
Gra
zing
ind
icato
rsRe
nkum
alig
nmen
t
1Apiaceae 5Brassicaceae
5Campanula-type
5Caryophylla
ceae
1Cyperaceae
1
Fabaceae 1Filipendula 1
Lamiaceae 1Lythru
m
1
Polygonumpers
icaria
5Ranunculaceae
5Rosace
ae 1Scrophularia
ceae
1
Thalictru
m 1Typhaangustifolia
20
Dryopteris
1
Lycopodium 20
Polypodiumvulgare
20
Pteridium
20
Sphagnum 665
718
485
601
550
775
533
728
636
632
549
704
177
120
499
611
251
231
285
577
615
610
700
496
494
Pollensum
(AP-Betula)
1625
1473
1258 99
811
8114
2110
3811
2811
8711
96 956
1144
317
266
977
1327 57
662
479
413
8412
1411
5312
7311
5410
90
Totalpollensu
m
Up
lan
dh
erb
sFe
rnsa
nd
mos
ses
Aqua
ticp
lant
s
Figu
re 9
.2. P
olle
n sp
ectr
a fr
om th
e sa
mpl
es ta
ken
from
the
barr
ows
of th
e R
enku
m a
lignm
ent.
Spec
tra
are
give
n in
% b
ased
on
a tr
ee p
olle
n su
m m
inus
Be
tula
pol
len.
In th
e to
tal A
P (=
arbo
real
po
llen)
Bet
ula
is in
clud
ed. I
n th
e to
tal
NA
P (=
non
arb
orea
l pol
len)
spo
res
are
incl
uded
, non
pol
len
paly
nom
orph
s ar
e ex
clud
ed. D
iffer
ent s
cale
s ha
ve b
een
used
, in
dica
ted
with
diff
eren
t col
ours
.
146 ancestral heaths
Wol
fhez
e_os
_per
2W
olfh
eze_
os_p
er2
Wol
fhez
e_so
d_pe
r1
Wol
fhez
e_os
_per
1W
arns
born
_6_o
s_pe
r3W
arns
born
_6_s
od_p
er2
War
nsbo
rn_6
_os_
per2
War
nsbo
rn_6
_os_
per1
War
nsbo
rn_5
_sod
_per
3
War
nsbo
rn_5
_os_
per2
War
nsbo
rn_5
_os_
per1
War
nsbo
rn_4
_os
War
nsbo
rn_3
_os
Doo
rwer
th_o
s_pe
r2D
oorw
erth
_sod
_per
1
War
nsbo
rn_1
_os2
War
nsbo
rn_2
_os
War
nsbo
rn_1
_os
BA
LNEO
-B
LNEO
-A
2040
6080
100
AP
NAP
2040
6080
Alnus
1
Carpinus
2040
Corylus
5
Fagus
1
Fraxinus 1
Ilex
5Pinus
20
Quercus
5
Salix
2040
60
Tilia
5
Ulmus
2040
Betula
5010
015
0
Ericac
eae1
Artemisia 5Asterac
eaetu
buli�orae
5Cerealia
1
Chenopodiaceae
1
Plantagomajor/P
.media-type
5Asterac
eaelig
uli�orae
1
Galium-ty
pe
5
Plantagolance
olata
2040
60
Poaceae
1
Rumexacetosa/R.acetose
lla-ty
pe
510
Succisa
Tree
san
dsh
rubs
Hea
thA
nthr
opog
enic
indi
cato
rsG
razi
ngin
dica
tors
Renk
umBa
rrow
sout
side
the
alig
nmen
t
105Aste
raceae 1
Brassi
caceae
1
Caryophylla
ceae
1
Cyperaceae 1Fabac
eae 1
Geraniac
eae 1
Lamiace
ae 1
Ranunculace
ae
1
Rosacea
e 1
Scrophular
iaceae
1
Thalictru
m 20
Dryopteris
1Lycopodium 20
Polypodiumvulgare
1Pteridium 5
Sphagnum
653
624
511
634
472
505
415
504
506
223
167
224
219
693
406
459
126
107
Pollensu
m(A
P-Betula)
1695
1189 88
5
1002 89
080
9
780
858
881
321
235
356
322
1203 74
8
774
140
121
Totalpolle
nsum
Upl
and
herb
sFe
rns
and
mos
ses
Figu
re 9
.3. P
olle
n sp
ectr
a fr
om th
e sa
mpl
es ta
ken
from
the
barr
ows
outs
ide
the
Ren
kum
alig
nmen
t. Sp
ectr
a ar
e gi
ven
in %
bas
ed o
n a
tree
pol
len
sum
min
us
Betu
la p
olle
n. In
the
tota
l AP
(=ar
bore
al
polle
n) B
etul
a is
incl
uded
. In
the
tota
l N
AP
(= n
on a
rbor
eal p
olle
n) s
pore
s ar
e in
clud
ed, n
on p
olle
n pa
lyno
mor
phs
are
excl
uded
. Diff
eren
t sca
les
have
bee
n us
ed,
indi
cate
d w
ith d
iffer
ent c
olou
rs.
147the renkum stream valley
expansion of heath. Another multi-period barrow in the alignment (Bennekom 1) of which the first period was dated to the late Neolithic B, shows in the fourth period (which was not dated) a similar decrease of arboreal pollen. In this case it is not the heath that increases, but the grasses and other grazing indicators (e.g. Rumex, Asteraceae liguliflorae). While this indicates a change in grazing regime, the development cannot be placed in time.
Most of the barrows discussed above are part of a long alignment of many barrows. In Chapter 8 it was shown that it is likely that all barrows of a barrow alignment were built in heath vegetation. The Renkum alignment confirms this conclusion. Nine out of about 20 barrows of this alignment (Bourgeois 2013, 71-74) were analysed for pollen and the results have shown they were all built in heath vegetation as well. In addition, all barrows that do not form part of an alignment, both in the area of Renkum as well as the barrows discussed in the previous chapter, were built in open spaces that were covered with heath vegetation. This leads to the conclusion that all other barrows of the Renkum alignment were built in similar heathland open spaces with an ADF up to 250 m. The barrows of the Renkum alignment were built quite close together with distances varying between 1030 m to 500 m (Bourgeois 2013, 74) and it is likely that the open spaces were connected to each other. If this holds true, there would have been a long and narrow stretched area of heath vegetation with a length of at least 4.5 km. This type of landscape existed for hundreds or perhaps thousands of years (spanning the period the barrows were built) and during this long period the heath must have been maintained by human interference, in spite of the pollen spectra under discussion, which have not all been dated properly. As has been explained in section 8.1.4, management is likely to have taken place by grazing, sod cutting and/or burning. Based on the pollen spectra, grazing seems probable, as indicated by the presence of Poaceae, Plantago� lanceolata and Succisa� in the barrows belonging to the alignment (Hjelle 1999). Assuming an area of 4.5 km long (Bourgeois 2013), with a width of approximately 60 m (≈27 ha), a live-stock herd of 27 sheep and/or 4-5 head of cattle is indicated (see section 8.1.4). Indicators of heath burning have not been recorded. Sod cutting is indicated at
Diameter (m) Height (m)Sod thick-ness (m)
Diameter 4th period (m)
Height 4th period (m)
Sod area (m2) Radius (m)
Sod area 4th period (m2) Radius (m)
Renkum 1 9 0.8 0.25 102.86 5.72
Renkum 2 unknown
Renkum 3 15 1.8 0.25 648.39 14.37
Renkum 4 15 1 0.25 355.52 10.64
Renkum 5 unknown
Ede 1 11 0.7 0.25 133.76 6.53
Ede 2 12 0.6 0.25 136.17 6.58
Bennekom 1 0.25 23 1.7 1422.91 21.28
Bennekom Oostereng unknown
Warnsborn 1 unknown
Warnsborn 2 unknown
Warnsborn 3 unknown
Warnsborn 4 unknown
Warnsborn 5 unknown
Warnsborn 6 unknown
Doorwerth unknown
Wolfheze unknown
Table 9.1. The minimum size of the open space per barrow based on the sods used to build the barrows.
148 ancestral heaths
least for the purpose of barrow building. Based on the measurement of the barrows, 100-1500 m2 areas were stripped by sod taking to build these barrows (see table 9.1). The method aside, management of such vast heath areas must have involved a long lasting special interest of prehistoric man at least for the period the barrows were built. What about the period prior to the barrow building? Heathland was already present when the oldest mounds were constructed. Heathland vegetation with Calluna� vulgaris and other herbs had developed, indicating that the area must have been open for some time before. It is not clear when and how this open area had been created, neither what it had been used for until the barrows were built. Traces of a settlement have not been found close to the barrow sites and there are no indications that crop cultivation had taken place prior to the barrow building. The activity of man is required however, to manage the heath and it is likely that grazing took place before the mounds were constructed. As has been discussed for the Echoput and surroundings in Chapter 8, this area too was most likely part of the economic zone of a farming community, keeping the area open before, and after, the barrows became part of the landscape.
To recapitulate, in addition to Chapter 8, in this chapter another example of a barrow alignment has been shown that was built in heath vegetation, possibly forming a long stretched heathland area that already was in place in the Late Neolithic A period, an area where grazing might have been important for the maintenance of the heath.
149gooi
Chapter�10
Gooi
The previous two chapters have shown many examples of barrows, including several barrow alignments, on the push moraine complexes of the Veluwe that were all built in heath vegetation. In the following chapter another three groups of barrows (and one solitary barrow) will be discussed. These barrows are situated in a region in the centre of the Netherlands called Het Gooi (see figure 10.1). These barrows were also built on a push moraine complex. A more regional vegetation development covering most of the Holocene could be reconstructed based on a recently investigated sequence of podzols that was discovered in a nature reserve area, called the Laarder Wasmeren area (Sevink�et�al. in press). This area is situated very close to one of the barrow groups (Hilversum, see figure 10.1).
10.1 Site description and sample locations
Baarn�Group
Close to the Lage Vuursche, a small village in the municipality of Baarn, 6 barrows are situated of which three have been sampled and analysed for pollen (Baarn 1-3). The results of these analyses have been published by Casparie and Groenman-van Waateringe (1980, 30-31, 36). Baarn 1-3 were originally excavated in 1927 by van Giffen (van Giffen 1930) and re-excavated and sampled for pollen in 1965 by Addink-Samplonius and Glasbergen. Two barrows (Baarn 1 and 2) are single-period barrows that were dated to the Late Neolithic A period. From Baarn 1 two samples were taken from the old surface. From Baarn 2 one sample from the old surface and two sod samples were taken. The third (Baarn 3) barrow is according to Casparie and Groenman-van Waateringe a two-period barrow, although this could not be confirmed by excavation data. This barrow could not be dated since no grave goods were found. Samples were taken from the old surfaces of each period, a sod and a later interment.
Hilversum�Group
The second group of barrows is situated in Hilversum. The barrows have been excavated in 1934 by Bursch (Bursch 1935). Samples for pollen analysis have been taken from the old surface and sods of three single-period barrows (Hilversum 1-3) during a re-excavation that has taken place in 1965 by van Giffen and Bakker (Bakker and van Giffen 1965). Pollen spectra have been published in 1980 by Casparie and Groenman-van Waateringe (1980, 31-32, 37). Hilversum 1 was dated to the Late Neolithic B period based on the find of a copper tanged dagger. Hilversum 2 was dated to the Late Neolithic A or B period based on the type of burial (northeast-southwest orientated crouched inhumation burial; pers. comm. Bourgeois). It should be noted that according to Casparie and Groenman-van Waateringe (1980, 37) this barrow was dated to the Bronze Age, which is now known to be incorrect. The third barrow (Hilversum 3) was dated to the Bronze Age, based on a 14C-date of 1609-1436 cal BC (3240 ± 35 BP, GrN-4885, calibrated with Oxcal 4.2). Measurements of the barrow could not be reconstructed.
150 ancestral heaths
Laren�Group
The third group consists of 10 barrows and is located near Laren. Three of these barrows (Laren 1-3) were sampled and analysed for pollen (Casparie and Groenman-van Waateringe 1980, 30, 31, 34). The barrows were originally excavated in 1925/1926 by Remouchamps (1928). The oldest barrow (Laren 1) is a two-period barrow of which the first period was dated to the Late Neolithic A period based on the find of PF Beaker and a terminus�post�quem 14C date of 3139-2890 cal BC (4385 ± 75 BP, GrN-6683C, calibrated with Oxcal 4.2). During re-excavation by Lanting and van der Waals in 1971 pollen samples were taken from the old surface and sods belonging to the first period and from the old surface beneath the secondary mound. Laren 2 is also a two-period barrow. The old surface and a sod belonging to the first period were dated to the Late Neolithic B period (based on a copper tanged dagger), and were sampled for pollen analysis in 1958 (Lanting and van der Waals 1976). The third barrow (Laren 3) is represented by a pollen spectrum from the old surface underneath the mound. This is a single-period
300 m
0 m
m NAP
Sampled barrow
Baarn 3
Roosterbos
Hilversum 1
Baarn 2
Baarn1
Hilversum 2 & 3
Laren 1Laren 2
Laren 3
Laarder Wasmeren V
Laarder Wasmeren II
Sample location LWM
0 250 500 1000 m
Figure 10.1. Locations of the barrows in the Gooi area that were sampled for pollen analysis and the location of the Laarder Wasmeren. The map is based on digital elevation model of the AHN (copyright www.ahn.nl).
151gooi
barrow that was dated to the Late Neolithic B period (based on V-perforated amber buttons). Sampling took place in 1958 by Bakker and Casparie (Lanting and van der Waals 1976).
Roosterbos�
Approximately 4 km to the northeast of the Lage Vuursche barrows a single-period barrow is situated in a forest called the Roosterbos. This barrow was excavated in 1926 by van Giffen. A PF Beaker and a flint scraper were found dating this barrow to the Late Neolithic A period. The barrow was re-excavated in 1970 for the collection of palynological samples only. Samples were taken from the old surface and from a sod. The pollen spectrum of one old surface sample (other samples were too poor in pollen for pollen analysis) was published by Casparie and Groenman-van Waateringe (1980, 30).
The�Laarder�Wasmeren�area
In the same region in which the above described barrows were situated, very close to the barrows of Laren, a nature reserve called the Laarder Wasmeren is situated. The soil in this area shows three or four podzols on top of each other developed in layers of drift sand, which were discovered and studied by Sevink et�al. (in press). The Laarder Wasmeren data on soil and sand drifting used in the following are derived from this study. Based on OSL dates (see table 5.1) a reconstruction of soil formation and drift sand phases in time could be made. Profile II consisted of four podzols (S1-S4). S1 has developed in Pleistocene cover sand that was deposited around 11500 years BP. Around 8800-6500 years BP this soil was covered by drift sand. In this sand layer another podzol was formed (S2) until it was also covered by a new layer of drift sand around 6400-5800 years BP. A distinct podzol (S3) could develop in this layer, which was marked by bioturbation in the form of presumed beetle burrows. Around 5300-4800 years BP a third layer of drift sand was deposited on S3. S4 developed in this layer. Profile V consists of three layers; S1 and S2 probably have merged together at this location (Sevink�et�al. in press). Both profiles were sampled for pollen analysis by van Geel (Sevink�et�al. in press). The prepared samples were kindly provided to the author of the present work who (re-)analysed the samples. The results of these analyses are shown in figure 10.3. The theory and discussion of pollen diagrams derived from mineral soils have been extensively described in Chapter 5. The site and methods of sampling have been described more in detail in section 5.2.
10.2 Results and discussion
What now follows is first a reinterpretation of all barrow pollen data, followed by a presentation of pollen data from the Laarder Wasmeren area analysed by the author. Following this, all data is combined with the results of the study by Sevink et�al. (in press) and discussed.
Gooi�area
The barrow pollen spectra (see figure 10.2a-c) represent three periods: the late Neolithic-A period, the late Neolithic-B period and the Bronze Age period. The oldest barrows show an arboreal pollen percentage of 30% (Roosterbos) – 55% (Baarn 1 and 2 and Laren 1). This indicates open spaces with an ADF of approximately 100 m for the barrows of Baarn and Laren (see table 7.1). The barrow of Roosterbos possibly was built in a large open space with an ADF that could reach up to 500 m. However, there seems to be an overrepresentation of
152 ancestral heaths
Baar
n3_i
nt
Baar
n3_s
od
Baar
n3_o
s2
Baar
n3_o
s1
Roos
terb
os_o
s
Baar
n1_o
s2
Baar
n1_o
s1
Baar
n2_s
od2
Baar
n2_s
od1
Baar
n2_o
s
Unk
now
n
LNEO
-A
2040
6080
100
AP
NAP
2040
6080
Alnus
5
Carpinus 2040
Corylus
510
Fagus
1
Fraxinus 5Pinus
20
Quercus
20
Tilia
1
Ulmus
20
Betula
5010
015
020
0
Ericace
ae
1
Artem
isia 5Aste
raceaetu
buli�orae
1Cerealia 1Chenopodiaceae
1
Plantagomajor/P.m
edia-type
1
Urtica
5Asterace
aeliguli�
orae
510
Plantagolanceolata20
4060
Poaceae
1
Rumexacetosa
/R.acetosella
-type
1Brassica
ceae
5Caryophylla
ceae
5Cyperace
ae
1
Filipendula 5Ranuncu
laceae
1Rosace
ae
5010
015
0
Dryopteris
20
Polypodiumvulgare
20
Sphagnum 469
368
464
653
151
723
474
706
683
278
Pollensu
m(A
P-Betula)
1595
602
787
1330
505
1429
945
1387
1190
639
Totalpolle
nsum
Tree
sand
shru
bsH
eath
Ant
hrop
ogen
icin
dica
tors
Fern
sand
mos
ses
Upl
and
herb
sG
razi
ngin
dica
tors
Baar
n
Hilv
ersu
m
Hilv
ersu
m3_
os
Hilv
ersu
m3_
sod1
Hilv
ersu
m3_
sod2
Hilv
ersu
m1_
os
Hilv
ersu
m2_
os1
Hilv
ersu
m2_
os2
Hilv
ersu
m2_
sod
BA
LNEO
-B
LNEO
-A/B
2040
6080
100
AP
NAP
2040
6080
Alnus
2040
Corylus
1Fagus
5Fraxinus 1Hedera5Pinus
20
Quercus
510
Tilia
5Ulmus
2040
60
Betula
5010
015
0
Ericaceae
1Artemisia 5Asteraceaetu
buli�orae
1Cerealia 1Chenopodiaceae
1Urtica
1Galium-ty
pe
5Plantagolanceolata
2040
Poaceae
1Rumexacetosa/R.acetosella
-type
1Succisa 1Apiaceae 1Brassicace
ae
1Caryophyllaceae
1Cyperaceae
1Fabaceae 1Filipendula 1Geraniaceae
1Lamiace
ae
1Ranunculaceae
1Typhaangusti
folia
5Dryopteris 5Polypodiumvulgare
1Pteridium 5Sphagnum
594
510
683
333
656
265
486
Pollensu
m(A
P-Betula)
1515
1128
1643
758
1516
776
1201
Totalpollensu
m
Tree
san
dsh
rubs
Hea
thA
nthr
opog
enic
indi
cato
rsG
razi
ngin
dica
tors
Upl
and
herb
sA
quat
icpl
ants
Fern
san
dm
osse
s
153gooi
Lare
n 3_
os
Lare
n 2_
os
Lare
n 1_
os_p
er2
Lare
n1_s
od_p
er1
Lare
n1_o
s2_p
er1
Lare
n1_o
s1_p
er1
LNEO
-B
Unk
now
n
LNEO
-A
2040
6080
100
AP
NAP
2040
60
Alnus
2040
Corylus
1Fagus
1Fraxinus 1Pinus
2040
Quercus
1Salix
20
Tilia
1Ulmus
20
Betula
2040
6080
Ericaceae
1Artemisia 5Asteraceaetu
buli�orae
1Chenopodiaceae
1Cerealia 1Urtica
5Asteraceaelig
uli�orae
1Galium-ty
pe
20
Plantagolanceolata
2040
60
Poaceae
1Rumexacetosa/R.acetosella
-type
2040
60
Succisa
1Apiaceae 1Brassicace
ae
1Campanula-type
5Caryophyllaceae
5Cyperaceae
1Lamiace
ae
1Ranunculaceae
1Rosaceae 1Scrophularia
ceae
20
Dryopteris
1Equisetu
m 20
Polypodium vulgare
5Pteridium 5Sphagnum
606
220
742
462
373
241
Pollensu
m(AP-Betula)
1361 44
6
1035
863
746
577
Totalpollensu
m
Tree
san
dsh
rubs
Hea
thA
nthr
opog
enic
indi
cato
rsG
razi
ngin
dica
tors
Fern
san
dm
osse
sU
plan
dhe
rbs
Lare
n
Figu
re 1
0.2a
-c. P
olle
n sp
ectr
a fr
om th
e sa
mpl
es ta
ken
from
the
barr
ows
in th
e G
ooi a
rea.
Spe
ctra
are
giv
en in
% b
ased
on
a tr
ee
polle
n su
m m
inus
Bet
ula
polle
n. In
the
tota
l AP
(=ar
bore
al p
olle
n)
Betu
la is
incl
uded
. In
the
tota
l NA
P (=
non
arb
orea
l pol
len)
spo
res
are
incl
uded
, non
pol
len
paly
nom
orph
s ar
e ex
clud
ed. D
iffer
ent s
cale
s ha
ve b
een
used
, ind
icat
ed w
ith d
iffer
ent c
olou
rs.
154 ancestral heaths
Dryopteris spores, since the percentage is extremely high compared to all other pollen spectra. When Dryopteris spores are left out of the pollen sum the arboreal percentage is 57%. This indicates an open spot with an ADF of approximately 100 m, which is comparable to the barrows of Baarn and Laren. In the Neolithic A period the forest consisted of mainly Corylus (with a pollen percentage of 20-30%), Quercus (pollen percentage = 15-20%) and Tilia (pollen percentage = 2-5%), with an alder carr (Alnus) nearby. The pollen spectra from Baarn show a higher pollen percentage of Alnus (55-70%) than Laren and Roosterbos (45%). It is possible that the Baarn barrows were situated close to an alder carr. The open spaces the barrows were built in were covered with mixed heath-grass vegetation at Laren and Baarn, while grasses and ferns are dominant at Roosterbos. In the following period (late NEO-B) some changes are visible. Two barrows were built in the area of Laren (Laren 2 and 3). The open spots were probably larger than around the older Laren barrows, with an ADF of approximately 100-150 m. Two late Neolithic-B barrows were built in the group of Hilversum (Hilversum 1 and 2) in an open place with an ADF of approximately 100-150 m. The heath vegetation was still a mixture of Calluna�vulgaris and grasses, their ratio more in favour of Calluna. Betula trees were probably present as solitary trees in the heathland, indicated by the fluctuating amounts of Betula in the pollen spectra from Hilversum (10-60%). The composition of the dry forest was comparable to the late Neolithic A period with mainly Corylus, Quercus and Tilia. Remarkable is the high percentage of Alnus in one of the Hilversum barrows (Hilversum 1). Perhaps an alder carr was situated very close to this barrow, which had then retreated when Hilversum 2 was built. This barrow shows similar percentages of Alnus as the Bronze Age barrow of Hilversum (Hilversum 3). This barrow was built in an open space with an ADF of approximately 50-100 m in heath vegetation that was dominated by Calluna�vulgaris. Baarn 3 could not be dated, but it shows in general a similar vegetation pattern as the dated barrows of Baarn. A difference can be noticed in the composition of the herbal vegetation. At the time Baarn 3 was constructed it was dominated by grasses and contained very little Calluna�vulgaris. Since the barrows of Baarn are located quite close together (about 100 m apart from each other, see figure 10.1b) it can be assumed that they were all built in the same open space covered with heath vegetation. This would indicate that Baarn 3 was not built contemporary with the other two barrows, since the herbal vegetation composition seems to have been fairly different when barrow 3 was built. Another possibility is that the open space Baarn 3 was built in was situated separate from Baarn 1 and 2. In that case nothing can be said about the simultaneity of the barrows. A sample taken from the grave pit of the barrow shows an increase in non arboreal pollen and Calluna�vulgaris. However, it is not very clear where exactly this sample came from, yet it is difficult to draw any conclusions on this pollen spectrum. It could indicate an expansion of the open space, with an expansion of Calluna�vulgaris. However, it is also possible that the deceased was buried on top of a layer of heather twigs.
Clearly open spaces with heath vegetation were present in this area since the late Neolithic A period. From this period onwards to the Bronze Age not much changed in vegetation composition. The open spaces varied from approximately 50 to 150 m ADF and consisted mostly of heath and grasses. The surrounding forest was dominated by Corylus, Quercus and Tilia and alder carr(s) were present in the environment. Comparable to the Echoput and surroundings (Chapter 8) and Renkum and surroundings (Chapter 9) this was a landscape that was managed to maintain its heath vegetation. The method of management could not be deduced from the pollen spectra. Some anthropogenic indicators were present, but only
155gooi
in very low amounts. Grazing could be indicated by the presence of Poaceae and, although in low amounts, Plantago lanceolata and Succisa.
Laarder�Wasmeren�area
The pollen diagrams from the Laarder Wasmeren (LWM) area (figure 10.3) show the vegetation development from approximately 8700 BP onwards, long before the first barrows were built in the area. The vegetation development per soil phase, consisting of a phase of deposition and a phase of soil development, can be reconstructed. The soil phases have been plotted continuously after each other. It should be noted however that each soil phase ended with a sand drifting period, probably resulting in a gap in vegetation development between each soil phase.
LWM II – S1 (before 8700 years BP, ca. 6700 cal BC)
The first phase in profile II shows a period in which Pinus was the dominant species. The presence of large amounts of Botryococcus and ferns suggest the presence of shallow water at the site. When Pinus and Botryococcus decreased, Corylus increased. More open vegetation developed with first an expansion of Poaceae, followed by an expansion of Calluna�vulgaris.
LWM II – S2
Arboreal species are dominant in the pollen diagram, with total AP percentages around 80%. An alder carr developed, as shown by the increasing percentages of Alnus. A dry forest was present in the surroundings, which consisted mainly of Quercus, Tilia and Ulmus, with Corylus at the forest edge. Heath vegetation was present, starting with low amounts (pollen percentages around 10%) and gradually increasing to pollen percentages around 50%. At the end of this phase AP had decreased to approximately 50%.
LWM II – S3
AP decreased further until percentages around 40%; the composition of the forest remained unchanged with mainly Corylus, Quercus, Tilia and Ulmus in the drier part of the area and alder carr in the wetter surroundings. Heath expanded together with Poaceae. At the end of this phase Calluna� vulgaris is represented with percentages of more than 100% in the pollen diagram, Poaceae fluctuates around 30%. Other anthropogenic indicators were present in the area, but only in small amounts (pollen percentages <1%). Grazing indicators were present as well, in slightly higher amounts (pollen percentages <5%). This part of the soil
Table 10.1. The minimum size of the open space per barrow could not be determined for the barrows of the Gooi case-study, since measurements of the barrows were unknown.
profile showed bioturbation. Consequently this part of the pollen diagram could be showing a mixture of the original vegetation development during this phase. S3 of profile LWM V, however, shows similar vegetation development and in this profile bioturbation was not recorded.
LWM II – S4
This phase started 5400 years BP and during it barrows were built in the Netherlands, including in the surroundings of the Laarder Wasmeren (see above). In this phase an open landscape existed with non arboreal pollen percentages of approximately 70%. Heath expanded further with pollen percentages around 200-300% and even a peak of over 1000%. The forest in the surroundings consisted mainly of Corylus, Quercus,�Ulmus and Tilia, with alder carr in the wetter areas, as also shown by the barrow pollen spectra. The levels of anthropogenic and grazing indicators had increased slightly.
LWM V
In profile V the soil phases S1 and S2 probably have merged together. The oldest period, with a dominant Pinus presence, appears to be missing in this diagram. Alder carr in the surrounding area had already developed, as well as the deciduous forest with Corylus, Quercus, Tilia and Ulmus. The heathland is represented by pollen of Calluna vulgaris with percentages fluctuating around 50%. The soil phases S3 and S4 show, as expected, similar vegetation development as LWM II.
The�(pre)barrow�landscape�of�the�Gooi
The pollen diagrams of the Laarder Wasmeren show a ‘normal’ Holocene forest development as has been described in section 2.1, starting with high percentages of Pinus, which decreased at the beginning of the Holocene. When Pinus decreased Corylus expanded and a deciduous forest developed with mainly Quercus, Tilia and Ulmus (see Chapter 2). Striking is the relatively open landscape with relatively high percentages of Calluna�vulgaris already before the first sand drift phase around 6500-8800 years BP (4500-6800 cal BC), since the landscape in the Netherlands was assumed not to have been opened up before the Late Neolithic period (see also section 2.3.1).
The previous chapters have mentioned the presence of considerable heathland areas in the Late Neolithic, since the first barrows were built. This investigation places the occurrence of heath much earlier, to the Mesolithic (Boreal). In addition, periods of sand drifting as early as 8800-6500, 6400-5800 and 5300-4800 years BP (based on OSL, Sevink et�al. in press; see table 5.1) are remarkable. Sand drifting could only occur when conditions are unstable. Due to unstable conditions vegetation becomes scarce and is not able to stabilize the soil. Under the influence of wind the topsoil is blown away. Periods of sand drifting are generally linked to human activities. For example due to extensive exploitation of the soil for crop cultivation, intensive grazing by cattle or sod cutting activities vegetation disappears, giving wind free play.
The first man-induced sand drifts in the Netherlands are known to have occurred since the Early Middle Ages (Castel� et� al. 1989, Riksen� et� al. 2006), but perhaps prehistoric man was inducing sand drifts long before then. This has also been suggested by Willemse and Groenewoudt (2012), who recorded prehistoric sand drifts along Dutch river valleys. They concluded that these sand drifts were mainly anthropogenic in the area north of the LWM area (the Wester- and Bussumerheide) some Mesolithic artefacts and flint fragments have been
161gooi
found, indicating the use of the area by prehistoric man. For the Early and Middle Neolithic no archaeological finds have been reported (Wimmers�et�al. 1993) and also in the LWM area itself no Meso- or Neolithic archaeological artefacts were found (Sevink� et� al. in press). The third sand drifting period (5300-4800 years BP) occurred around the time the first barrows were built a few hundred metres from the LWM area. Prehistoric man’s activities probably intensified, indicated by the slightly increased percentages of anthropogenic indicators. It cannot be determined whether the recorded human activities could induce sand drifting. The pollen diagrams and barrow pollen spectra only show few anthropogenic indicators and there are no indications that the area was used for crop cultivation. Therefore, it is not likely that the area was intensively used. However, given the constant presence of Calluna�vulgaris, the maintenance of the heath by humans is indicated. This might have been accomplished by grazing, burning or sod cutting, as has been explained in Chapter 8. Grazing is slightly indicated in the LWM pollen diagrams and the barrow pollen spectra and it is not unlikely that the heath area was grazed. Perhaps overexploitation of the heathland was the cause of the sand drifting. However, Jungerius and Riksen state that these agricultural activities alone were probably not sufficient to cause large scale sand drifts (Jungerius and Riksen 2010). They emphasize the role that climate played. A dramatic shift in climate could bring with it adverse conditions for vegetation establishment and maintenance, such as in the case of drought. However, in general the Holocene climate was relatively stable and fluctuations in temperature and precipitation were probably not sufficient to destroy the vegetation cover (Jungerius and Riksen 2010). Therefore, it is not likely that severe climate change was the cause of the sand drifts in the LWM area. Jungerius and Riksen (2010) stress that climatic events such as violent storms were of great importance for the origin of sand drifts. However, this theory is purely hypothetical (Sevink�et�al. in press). At this moment the origin of the sand drifts in the LWM area, anthropogenic or natural or a combination of both, cannot be determined, although anthropogenic seems the most plausible explanation (in accordance with Sevink et�al. in press).
In the preceding chapters it has been shown that from the Late Neolithic period onwards, barrows, including long alignments of barrows, were built in heath vegetation that must have been kept and maintained by human activities. In general it is assumed that before the Neolithic vegetation was dominated by forest, with man adjusting their way of life to the landscape. In this chapter it has been shown that the landscape was already open long before the first barrows were built, and that Calluna�vulgaris was the prevalent species in the investigated area. This implies a landscape that was managed. The study in this chapter has also shown that very early periods of sand drifting have occurred in this area of which the cause may have been anthropogenic. Possibly overexploitation of the landscape resulted in sand drifting. If Late Neolithic barrow landscape management in itself was already a remarkable conclusion, it is even more surprising that heath management probably took place long before. This topic will be returned to in Chapter 13.
163toterfout-halve mijl and surroundings
Chapter�11
Toterfout-Halve Mijl and surroundings
In Chapters 8-10 a number of barrows in three research areas in the northern half of the Netherlands have been discussed. In the following two chapters the discussion on the barrows landscape will be continued by investigating several barrows that are situated in two regions in the southern half of the Netherlands.
Chapter 11 is on the barrows of Toterfout-Halve Mijl and numerous other barrows situated in an area of about 30 by 20 km (see figure 11.1). A large number of these mounds have been visited by several researchers performing palynological analyses (for references see the corresponding sections). In this chapter the palynological data will be described and discussed to determine the barrow landscape in the area.
11.1 Toterfout-Halve Mijl
In an area southwest of Eindhoven, close to the two villages of Toterfout and Halve Mijl, 34 barrows are situated on high cover-sand ridges along a large lake (the now-drained Postelse Weijer, which still existed up to the 19th century, Glasbergen 1954, 17; see figure 11.1 and 11.2). These barrows were excavated and all dated to the Bronze Age (Bourgeois 2013, 91-92). More than half of the barrows in this area have been sampled and analysed for pollen analysis by Waterbolk (Glasbergen 1954, 105-122; Waterbolk 1954, 101-104).
11.1.1�Site�description�and�sample�locations
The barrows of Toterfout-Halve Mijl are situated on cover-sand ridges. The old surface underneath all barrows was the top of a Carbic Podzol (Dutch classification: Humuspodzol). Samples were taken by Waterbolk from the old surface underneath the barrows, the sods the mound was constructed of and from the fill of surrounding ditches. Besides determining the surrounding landscape, the barrows were sampled with the purpose of dating them (Glasbergen 1954, 28). The relative chronology based on the palynological results was for a great deal rejected by radiocarbon dates13 and the surrounding features. Following the well substantiated chronology proposed by Bourgeois (2013, 93-96), three groups can be distinguished based on 14C-dating. The first group represents the oldest barrows. In contrary to several barrows that form part of barrow alignments, described in chapters 8 and 9, these barrows are extensively dispersed (Bourgeois 2013, 102). Based on 14C dates these barrows (14, 4 and 1B) were built roughly between 1850 and 1600 cal BC. The second group represents the youngest barrows (8, 17, 15, 12), which were built between 1500 and 1250 cal BC. The third group consists of 9 barrows that were dated in between the first two groups. However, overlap with both occurs. Then
13 Theunissen suggested a relative chronological order based upon radiocarbon dates (Theunissen 1993). These radiocarbon dates have been further calibrated by Bourgeois (2013) based on the detailed dating program developed by Lanting and van der Plicht (2001/2002).
164 ancestral heaths
there are 18 barrows that have not been dated by 14C. They have been dated based upon the surrounding features resulting in a broad spectrum of dates. Some of these barrows may belong to the group of the oldest barrows, while others might be relatively young. Not included in the barrow group of Toterfout Halve Mijl by Bourgeois, but situated in this area and sampled for pollen analysis (Glasbergen 1954, 95-97), is an urnfield. The pollen spectrum of this sample is considered to represent the youngest period (approximately 800-500 cal BC). An overview of barrows that have been sampled and the location of the samples in the barrows (e.g.�the old surface, sod and ring ditch) is given in table 11.1. The barrows are placed
Figure 11.1. Location of the barrows at Toterfout-Halve Mijl, Hoogeloon, Knegsel, Steensel, Eersel and Bergeijk. The map is based on digital elevation model of the AHN (copyright www.ahn.nl).
40 m
0 m
m NAP
Other barrows
Sampled barrows
Hoogeloon 1
Hoogeloon 2
Toterfout-Halve Mijl
Knegsel 1
Knegsel 2 Knegsel Moormanlaan
Steensel
Eersel
Bergeijk
0 1000 2000 4000 m
165toterfout-halve mijl and surroundings
in chronological order as determined by Bourgeois. Based on their geographical location the barrows can roughly be divided into three groups (see figure 11.1c). An easterly group consists of barrows 1-3 (including 1A and 1B), a central group of barrow 5-11 (including 8A) and a western group of barrow 12-30 (including 22A). All barrows have been extensively described by Glasbergen and Waterbolk (Glasbergen 1954), some findings should be noted. Glasbergen mentions that two barrows (12 and 18) were built on and of former arable soil:
It is however uncertain that such disturbed soil indeed can be interpreted as old arable, since no plough marks are present.�The second finding to be noticed is the traces of fences that have been found underneath three barrows (14, 20 and 21).
35 m
15 m
m NAP
2224
2325
0 250 500125 m
4
2
3 1b1a
1
56
8A9
78
101112
1314
1516
1820
1719
22a
21
30
27
26
2829
Barrows Toterfout-Halve Mijl
Urn �eld
Postelse Weijer
35 m
15 m
m NAP
2224
2325
0 250 500125 m
4
2
3 1b1a
1
56
8A9
78
101112
1314
1516
1820
1719
22a
21
30
27
26
2829
Barrows Toterfout-Halve Mijl
Urn �eld
Postelse Weijer
Figure 11.2. Locations of the barrows belonging to the Toterfout-Halve Mijl group in detail. The map is based on digital elevation model of the AHN (copyright www.ahn.nl).
Toterfout Tumulus 1b old surface, sod, presentpodsolized surface
Toterfout Tumulus 1 old surface 2x
Toterfout Tumulus 2 ditch
Toterfout Tumulus 4 old surface, ditch
Toterfout Tumulus 6 old surface
Toterfout Tumulus 7 old surface, sod
Toterfout Tumulus 8A old surface
Toterfout Tumulus 9 old surface, sod
Toterfout Tumulus 11 old surface
Toterfout Tumulus 13 old surface
Toterfout Tumulus 14 old surface
Toterfout Tumulus 15 old surface
Toterfout Tumulus 17 old surface
Toterfout Tumulus 20 old surface
Toterfout Tumulus 21 old surface, sod
Toterfout Tumulus 22A ditch
Toterfout Tumulus 23 old surface
Toterfout Tumulus 24 old surface
Toterfout Tumulus 25 old surface
Toterfout Tumulus 26 old surface
Toterfout Tumulus 28 old surface
Toterfout Tumulus 29 old surface
period 2
Toterfout Tumulus 10 period 1
Toterfout Tumulus 5 old surfaceperiod 1
period 2
Toterfout Tumulus 16 sodperiod 1
period 2
Toterfout Tumulus 19 sodperiod 1
period 2
Toterfout Tumulus 22 old surfaceperiod 1
period 4
Toterfout Tumulus 8 old surfaceperiod 1
sod
old surface
sod
sod
old surface
ditch
old surface
Table 11.1. Overview of samples taken at the Toterfout-Halve Mijl barrows. Dating ranges for each barrow have been indicated. Figure after Bourgeois (2013, table 5.5).
170 ancestral heaths
11.1.2�Results�and�discussion
Figure 11.3a shows the pollen spectra of the sampled mounds in the relative chronological order proposed by Bourgeois.
The oldest group shows the highest arboreal percentages from 55% to almost 80%. The open spaces these barrows were built in had an ADF that varied from 25 to 100 m. The herbal vegetation at these open spots consisted mainly of Calluna�vulgaris and grasses. An exception is barrow 4, which is actually not part of one of the (geographical) barrow groups, but situated approximately 300 m north of the central group. Here the vegetation in the open space is a mixture of some Calluna, grasses and ferns. The youngest barrows show an AP of approximately 55%, so the open spaces seem to be slightly larger in this period (ADF=50-100 m), indicating an expansion of the heath in the area. The sample of the urnfield shows that the heath at the location of one of the oldest barrows (1B) indeed expanded (AP=35%) with a Calluna percentage of more than 100%. Not many changes in landscape seem to have occurred in the period in between. The barrows that were roughly dated to this period show a similar vegetation pattern. Only tumulus 4 shows a different vegetation composition of the open space with a low percentage of heath. This barrow might have been constructed at the edge of the open space where the heath was grassier. This pollen spectrum was derived from a ditch sample and the spectrum shows a remarkable high percentage of Pteridium (bracken) spores. This is also the case for another ditch sample of Toterfout-Halve Mijl (barrow 22A). Possibly Pteridium was one of the first species to grow on the barrow after it was built. The ferns might already have shed spores before the ditches of barrow 4 and 22A were filled up. Close to the barrows alder carr must have been present, represented in the pollen spectra by high percentages of Alnus. Surrounding forest consisted of mainly Corylus, Quercus, Tilia�and Fagus. Betula�is present in all the pollen spectra in fluctuating percentages. Probably birch trees were present in the surrounding forest. In addition they were probably also present in the heathland area close to some of the barrows, causing percentages of over 100% in for example the pollen spectrum of barrow 13.
Open spaces fluctuated between approximately 25 m and 250 m in ADF. Barrows 1A, 1B, 2 and 3 were built very close together. So were barrows 5–8, 10 and 11. They were most likely built in one open place with heath vegetation. Barrow 13-16, 17-20 and 21-29 were also built close together and perhaps these three groups were built in one large area with heath vegetation. It is not unlikely that all barrows in the Toterfout-Halve Mijl group (except for barrow 4) were constructed in one and the same heathland: in a long stretched open space with a minimum length of approximately 1.5 km. Whether one large heath area or several smaller heath areas, the heath must have been managed throughout the barrow building period, as has been discussed for the more northern areas (Chapter 8-10). Grazing being part of the heath management is likely. This is indicated by the presence of herbal species such as Plantago� lanceolata, Succisa and Asteraceae� liguliflorae, although only represented in low amounts. No evidence for burning of the heath was found. Charcoal that was found at the site was probably related to funeral activities, since charcoal was mostly found together with bone material (Glasbergen 1954, Theunissen 1993). Sod-cutting could have been a heath-management activity, while sods were cut to build the barrows (see table 11.2). Since the amount of barrows is enormous, and that a large number of them were built in a relatively short time period, sod-cutting must have been a regular activity.
171toterfout-halve mijl and surroundings
Not much is known about the open spaces for the period prior to the barrow building. The open spaces were not created just before the mounds were constructed, since the herbal vegetation had already had some time to develop. Some of the barrows (12 and 18) were possibly built on of former arable land, indicating that at least part of the area had been used for crop cultivation prior to the barrow building. Unfortunately samples taken from these barrows were unsuitable for palynological analysis. In some of the barrows some cereal pollen grains and arable weeds like Rumex were found, although in such low amounts that it cannot be concluded that they were linked to crop cultivation at or close to the barrow spots. Traces of fences have been found underneath barrow 14, 20 and 21 and could be associated with crop cultivation as well, indicating the boundaries of a field. Pollen analyses of these barrows show that heath vegetation was present at the time the barrows were raised and no crops were cultivated close before the building. Yet, another possibility is that the fences indicate grazing within enclosures. In all cases it is clear that the area was heavily influenced by human activities and the area was most likely part of the economic zone of a farming community. The presence of prehistoric man in the area long before the barrows were built is also indicated by traces of a late Neolithic B settlement that were found approximately 60 m northeast of barrow 5 (Glasbergen 1954, van Beek 1977). A small part of the original soil was preserved. At this location the old surface, which was overblown by sand shortly after abandonment of the settlement
Table 11.2. The minimum size of the open space per barrow based on the sods used to build the barrows.
172 ancestral heaths
(for argumentation see van Beek 1977, 48-49), was still recognizable. The old surface was sampled for pollen analysis by Groenman-van Waateringe. The pollen spectra are likely reflection of the vegetation composition that was present shortly after abandonment of the settlement. These pollen spectra show that heath was already present at that time, although the herbal vegetation was dominated by grasses (see figure 11.3b). Grazing may have already taken place by then. It is not clear whether the presumed arable field and the fence traces underneath some of the barrows, which were found approximately 0.5 km to the southwest, belonged to Neolithic settlement. It is also not clear where the community moved to after abandonment of this settlement. Evidence for a Bronze Age settlement that might belong to the builders of the barrows was not found. Although the function of the area changed from settlement to burial site it stayed part of the economic zone of the community living in the area, while the heath was probably grazed.
11.2 Hoogeloon
Approximately 6 km southwest of the Toterfout-Halve Mijl barrow group two barrows are situated close to Hoogeloon (Hoogeloon 1 and 2; see figure 11.1).
11.2.1�Site�description�and�sample�locations
A barrow near Hoogeloon, approximately 4 km from Toterfout-Halve Mijl, called the ‘Zwartenberg’ (Hoogeloon 1) was excavated in 1950 by Brunsting on behalf of the ROB (presently known as Cultural Heritage Agency of the Netherlands, RCE). The mound was dated to the Middle Bronze Age A, based on the find of a bronze axe in 1846 by Panken. The barrow was constructed of sods that were still clearly visible during the excavation. Measurements were 18 m in diameter and 1.4 m in height (Waterbolk 1954, 108; Beex 1964a). A sample from the old surface was analysed by Waterbolk and published in his thesis (Waterbolk 1954, 103).
Approximately 150-200 m to the west of Hoogeloon 1 a small barrow was located called the ‘Smousenberg’ (Hoogeloon 2). This barrow was a two-period barrow of which the first period was dated to the Middle Bronze Age. Its diameter was approximately 4 m. The barrow was excavated by Beex and a pollen sample from the old surface was analysed by Waterbolk (Beex 1954).
11.2.2�Results�and�discussion
Hoogeloon 1 was built in an open space with the forest at an average distance of approximately 50-100 m. The open space was covered with heath vegetation that was dominated by Calluna� vulgaris� (see figure 11.4). The heath was very poor in other herbal vegetation, including anthropogenic indicators. The area that was used for sod cutting had a radius of approximately 15 m (based on an average sod thickness of 0.25 m, see also 8.2.2). Hoogeloon 2, which was probably younger than Hoogeloon 1, was built in a much smaller open space with an ADF of approximately 25 m. Calluna� vulgaris was also the dominant species in this small open space. The surrounding forest consisted mainly of Quercus and Tilia. Fagus was also present in low amounts. Corylus was most likely present at the edge of the forest. Some Betula trees were probably present as solitary trees in the heathland or were perhaps part of the forest. In the lower and wetter parts of the area alder carr was present, represented by high percentages of Alnus in the pollen spectra from both mounds.
173toterfout-halve mijl and surroundings
Stee
nsel
_ditc
hSt
eens
el_o
sK
negs
el_d
itchd
Kne
gsel
_ditc
hbK
negs
el_d
itchc
Kne
gsel
_ditc
haK
negs
el(F
)_79
_ditc
h_up
per
Kne
gsel
(F)_
79_d
itch_
mid
dle
Kne
gsel
(F)_
79_d
itch_
unde
rK
negs
el(F
)_79
_os
Hoo
gelo
on(s
m)_
138_
osK
negs
el(E
)_78
_sod
Kne
gsel
(E)_
78_o
sEe
rsel
_133
__ol
dar
able
2Ee
rsel
_133
_old
arab
le1
Eers
el_1
33_s
od2
Eers
el_1
33_s
od1
Eers
el_1
33_o
s2Ee
rsel
_133
_os1
Hoo
gelo
on(z
w)_
137_
osK
negs
el(m
oor)_
113_
o.s.
Kne
gsel
(moo
r)_11
3_so
dB
erge
ijk_4
03_s
odB
erge
ijk_4
03_o
s2B
erge
ijk_4
03_o
s1
IA
MB
A/L
BA
MB
A
MB
A-B
MB
A-A
EBA
/MB
A
LNEO
-A
2040
6080
100
AP
NAP
1
Acer
2040
60
Alnus
2040
60
Corylus
5Fagus
5Fraxinus 1
Hedera
1
Picea
20
Pinus
2040
Quercus
510
Salix
2040
Tilia
12
Ulmus
20
Viscum
2040
Betula
5010
015
0
Callunavulgaris
5010
015
0
Ericace
ae
1
Artemisia 1Asterac
eaetubuli
�orae
1Cereali
a 1Chenopodiacea
e
5
Tree
san
dsh
rubs
Hea
thA
nthr
opog
enic
indi
cato
rsSu
rrou
ndin
gsTo
terf
out-H
alve
Mijl
Ber
geijk
,Kne
gsel
(Moo
rman
laan
),Ee
rsel
,K
negs
el,H
ooge
loon
,Ste
ense
l
15Aste
raceae
liguli�
orae
1
Galium-ty
pe 20
Plantagolanceolata
2040
60
Poaceae
20
Rumexacetosa/R.acetosella-ty
pe
5Succisa
1Brassic
aceae
1Campan
ulaceae
1Caryophyll
aceae
1Cyperacea
e 20
Fabace
ae
1
Genist
a-type
1
Gentiana 1
Geranium 1Lam
iaceae 1
Melampyrum
1
Polygonumpersic
aria
1
Potentilla
-type
5
Ranuncu
laceae
1
Rosacea
e 1
Trifoliu
m-type
1
Sparganium-type
5Dryopteris-type
5Lycopodium 1
Polypodiumvulgare
2040
60
Pteridium
5Sphagnum 1
Varia
5
Indeterm
inable
196
494
649
517
490
470
576
533
462
546
663
474
506
622
526
605
522
885
539
488
424
332
1017
1005 99
6
Pollensu
m(A
P-Betula)
741
1296
1124
1037
1095 90
910
56 915
1006
1027
1005
1097 87
813
6411
9910
2710
3716
4810
12 982
850
690
1560
1567
1403
Totalpo
llen
sum
Gra
zing
indi
cato
rsU
plan
dhe
rbs
Aqu
atic
herb
sFe
rns
and
mos
ses
Figu
re 1
1.4.
Pol
len
spec
tra
from
the
sam
ples
take
n fr
om th
e ba
rrow
s at
H
ooge
loon
, Kne
gsel
, Ste
ense
l, Ee
rsel
an
d Be
rgei
jk. S
pect
ra a
re g
iven
in
% b
ased
on
a tr
ee p
olle
n su
m m
inus
Be
tula
pol
len.
In th
e to
tal A
P (=
arbo
real
po
llen)
Bet
ula
is in
clud
ed. I
n th
e to
tal
NA
P (=
non
arb
orea
l pol
len)
spo
res
are
incl
uded
, non
pol
len
paly
nom
orph
s ar
e ex
clud
ed. D
iffer
ent s
cale
s ha
ve b
een
used
, ind
icat
ed w
ith d
iffer
ent c
olou
rs.
174 ancestral heaths
11.3 Knegsel-Urnenweg
Circa 2 km south of Toterfout-Halve Mijl a cemetery complex is located. An urnfield was constructed around and partially on top of several older barrows. The cemetery complex is situated around a small pool, which was drained around 1930. Over several excavations the urnfield was excavated including five of the older barrows (Braat 1936, Glasbergen 1954). Two of these barrows (Knegsel 1 and 2) and four ring ditches belonging to the urnfield (Knegsel ditch a-d) had been sampled and analysed for pollen by Waterbolk, with results being published in his thesis (Waterbolk 1954, 104-108; see figure 11.1).
11.3.1�Site�description�and�sample�locations
Knegsel 1 is a three-period barrow of which the first and the second period are dated to the Middle Bronze Age B. The third period dates to the Early Iron Age. The diameter of the first period is 7.5 m, of the second 10 m and of the third 8 m. The height of the barrow is unknown, which makes it impossible to calculate the sod-area. Samples were taken from the old surface of the primary mound and from a sod originating from the grave pit, belonging to the first period.
Knegsel 2 is a two-period barrow. The first period dates to the Middle Bronze Age, the second period to the Late Bronze Age/Early Iron Age. The diameter of the first period barrow is 8 m and of the second 5.4 m. The barrow was 0.28 m high. Samples were taken from the old surface of the primary mound and from three consecutive humic layers in the ring ditch.
In addition samples were taken from the fills of four ring ditches that belonged to the urnfield. Ditch (a) was a circular ring ditch, ditch (b) and (c) belonged to two long beds (oblong barrows, belonging to an urnfield) and ditch (d) was a rounded rectangular ring ditch with posts.
11.3.2�Results�and�discussion
Knegsel 1 and 2 show similar pollen spectra (see figure 11.4). They were both dated to the Middle Bronze Age-A and it is possible they were built (almost) at the same time. They were built in an open space with an ADF of approximately 50-100 m. About 28 m2 of heath area needed to be stripped to build the primary Knegsel 2 barrow (based on an average sod thickness of 0.25 m, see also 8.2.2). The secondary mound required about 13 m2. The vegetation of the open space was dominated by Calluna� vulgaris with most likely some Betula trees nearby. Other herbs were almost absent, also Poaceae were only present in low amounts. Alder carr was present in the river valleys in the environment. Corylus, Quercus�and Tilia�were the main trees in the forest that could be found in the drier areas. Other samples that were taken from this site came from urnfield ditches. Three of them (a-c) show almost similar AP as Knegsel 1 and 2 indicating an ADF of approximately 50-100 m. The fourth ditch showed a higher arboreal pollen percentage of 65%, indicating an open space of approximately 30-50 m. The forest composition seemed slightly different with a relatively high percentage of Quercus (30%) at cost of Corylus.
11.4 Knegsel-Moormanlaan
Approximately 3 km southeast of the Toterfout-Halve Mijl barrow group and approximately 2 km east of the Knegsel barrows a tumulus is located at the Moormanlaan, a sandy road close to Knegsel (see figure 11.1).
175toterfout-halve mijl and surroundings
11.4.1�Site�description�and�sample�locations
The barrow at the Moormanlaan is a 2 or 3 period barrow of which the first period was dated to the Early Bronze Age/Middle Bronze Age-A (diameter=6 m). The second (and third) period was dated to the Middle Bronze Age (diameter=5.4 m/6 m). The barrow was excavated by Modderman, Verwers and Boogerd in 1967. Samples for pollen analysis were taken from a sod and from the original surface in the north-west quadrant by Bakels (Modderman and Bakels 1971).
11.4.2�Results�and�discussion
The pollen spectra (see figure 11.4) show an arboreal pollen percentage of approximately 50%, indicating that the barrow was built in an open spot with an ADF of approximately 100 m. This open spot was mainly covered with heath vegetation (Calluna�vulgaris). Other herbal species are present in very low amounts, including Poaceae. The surrounding forest consisted of Quercus, Tilia and Fagus with Corylus�and possibly Salix at the forest edge. Alder carr was present in the wetter parts of the area.
11.5 Steensel
Circa 4 km southeast of Toterfout-Halve Mijl, close to Steensel, an urnfield with over 100 (urnfield) barrows is situated at a locality called the ‘Heibloem’. This cemetery has been the subject of several excavations since the first in 1844 by Panken. In 1948 van Giffen decided to undertake there a trial-excavation to rescue the cemetery (Modderman and Louwe Kooijmans 1966). At that time samples for pollen analysis were taken by Waterbolk from one of the ‘long beds’ in the cemetery, the results of which were published in his thesis (Waterbolk 1954, 103, 109-110; see figure 11.1).
11.5.1�Site�description�and�sample�locations
The cemetery is situated on the northern half of a ridge consisting of loamy, fine sand deposited by wind (Modderman and Louwe Kooijmans 1966). Samples for pollen analysis were taken by Waterbolk from the old surface and the fill of a ditch belonging to one of the long beds (Waterbolk 1954, 103, 109-110). No dating is known for this barrow, but in general long beds are dated to the Late Bronze Age/Early Iron Age.
11.5.2�Results�and�discussion
The barrow was built in an open place with an ADF of approximately 125 m, based on the percentage of arboreal pollen observed in a sample from the old surface. The pollen spectrum of the ditch seems to represent a slightly younger period with a higher percentage of herbal pollen, like Poaceae, Rumex and Plantago lanceolata�(see figure 11.4). A high percentage of Pteridium in the ditch spectrum possibly is the result of a Pteridium being present on top of the barrow, as a pioneer species, after construction of the barrow and shedding spores before the ditch was filled up (see also 11.1, p.46-47). Calluna�vulgaris was the dominating species at the open place, indicated by the high percentages of this species in both samples. Compared to the other barrows in the region the heath was grassier, indicated by percentages of Poaceae of 20-50%. Betula�trees were probably present in or close to the heathland.
176 ancestral heaths
11.6 Eersel
Approximately 5 km to the south of Toterfout-Halve Mijl, close to Eersel a ring and ditch barrow called ‘De Gloeiende Engelsman’ is situated (Beex 1964b; see figure 11.1).
11.6.1�Site�description�and�sample�locations
The barrow was dated to the Middle Bronze Age-A, based on 14C-dating (3460 ± 35 BP, GrN-5350; 1777-1603 cal BC, calibrated with Oxcal 4.2) and the find of a Drakenstein urn. The barrow measured 20.2 m in diameter and approximately 1 m in height. It was built partially on an undisturbed Carbic Podzol (Dutch classification: Humuspodzol) and partially on grey, fairly homogenous soil, interpreted by van Zeist (1967) as former arable land. This interpretation can be questioned, given the absence of ploughing marks (see also section 11.1.1) The tumulus was excavated in 1966 by the ROB and sampled for pollen analysis by van Zeist (van Zeist 1967b). Samples were taken from the old arable land, from the old surface underneath the mound (the Carbic Podzol) and from sods with which the mound was constructed.
11.6.2�Results�and�discussion
The pollen spectra show that the barrow was built in an open space that was covered in heath vegetation (see fig 11.4). If the open space had been used for agricultural activities as was suggested by van Zeist (see 11.6.1), the old arable was at the time the barrow was built no longer in use as such, indicated by the high percentage of Calluna� vulgaris and the absence of cereal pollen and other indicators of crop cultivation. Based on the arboreal pollen percentage the average distance to the forest was approximately 150-300 m. The minimum area that was used for sod cutting to build the barrow could be calculated. This was an area of circa 643 m2, indicating a radius of approximately 14 m. Alder carr must have been present in the neighbourhood of the barrow shown by percentages of approximately 30% Alnus. Forest in the drier regions mainly consisted of Quercus and Tilia with Corylus present at the forest edge. The pollen spectra of the old arable land show higher percentages of Tilia than the other pollen spectra and also Fagus is present in both samples. Since these samples came from disturbed soil, the relatively high number of Tilia pollen can be attributed to an older sediment that was mixed with younger sediment.
11.7 Bergeijk
Approximately 15 km south of Toterfout-Halve Mijl a barrow, close to Bergeijk is located (see figure 11.1).
11.7.1�Site�description�and�sample�locations
The barrow is situated on a high sandy ridge. The barrow was dated to the late Neolithic-A period based on 14C-dating (3950 ± 150 BP, GRO 381; 2707-2460 cal BC, calibrated with Oxcal 4.2). This is the oldest barrow that will be discussed in this chapter. The centre of the barrow was sandy and had a diameter of approximately 3-4 m. Around the centre of the barrow a small ditch was dug from which the sand was accumulated, forming a small bank encircling the barrow. On top of this bank a second bank was constructed with sods expanding the diameter of the monument to approximately 8 m. On top of this bank and barrow a layer of sand was deposited, enlarging the total tumulus to a diameter of approximately
177toterfout-halve mijl and surroundings
20 m and a height of 0.70 m. Samples for pollen analysis were taken by Beex from the old surface underneath the barrow, from the old surface outside the secondary bank and from a sod belonging to this bank. The samples were analysed by Waterbolk (Beex 1957, Waterbolk 1957).
11.7.2�Results�and�discussion
The mound was probably built in a small open space with an ADF of approximately 25-50 m, based on the high percentage of arboreal pollen (70%; see figure 11.4)). Part of this open place was probably used for sod cutting. A minimum area of approximately 630 m2 was required to build the barrow, indicating a radius of approximately 14 m. The small open place was covered with species-poor heath vegetation that was dominated by Calluna� vulgaris. Quercus and Tilia�were the main species of the surrounding forest, with Corylus dominating at the forest edge. Alder carr was present in the wetter parts in the surroundings.
11.8 Alphen
A barrow called ‘Op de Kiek’ (Alphen 1) is located approximately 30 km west of the Toterfout-Halve Mijl barrow group. The barrow was excavated in 1955 by Modderman (Modderman 1955; see figure 11.5).
Circa 3.5 km to the southwest of Alphen 1 another barrow is present called ‘The Kwaalburg (Alphen 2). It was excavated in 1964 by Beex (1964c; see figure 11.5).
11.8.1�Site�description�and�sample�locations
Alphen 1 is a multi-period barrow that was dated to the Middle Bronze Age-A period based on 14C-dating of the primary cremation (3450 ± 60 BP, GrA-15479; 1922-1618 cal BC, calibrated with Oxcal 4.2). The inner diameter of the encircling ditch was approximately 6 m and the original barrow was approximately 1 m of height. Samples for pollen analysis were taken by Modderman from the old surface underneath the primary mound, outside the primary mound, from the ring ditch and from the old surface underneath the secondary mound. Results were published by Casparie and Groenman-van Waateringe (1980, 37, 40).
Alphen 2 was dated to the Middle Bronze Age-A period based on a bronze flanged axe. This barrow was a so-called bank-and-ditch barrow, meaning that the original barrow was surrounded by a circular bank and ditch. Alphen 2 was built of sods and had a diameter of approximately 15 m. At a distance of approximately 1 m a circular bank with sods of approximately 4 m wide was placed. At approximately 1.5 m from this bank another surrounding bank of approximately 3.5 m wide was made. The complete monument had a diameter of approximately 41 m. Samples for pollen analysis were taken during the excavation from the old surface, a sod and from the encircling ditch and primary bank (Casparie and Groenman-van Waateringe 1980, 38).
11.8.2�Results�and�discussion
The pollen spectrum of Alphen 1 and 2 both showed an arboreal pollen percentage of approximately 70% (see fig 11.6). This indicates that the barrows were built in a small open space with an ADF of approximately 25-50 m. The vegetation at the open space was dominated by Calluna�vulgaris with most likely some solitary trees of Betula. Other herbs are, including Poaceae, are only present in very low amounts. The samples from the ditch and the bank of Alphen 2 show a slightly different (younger?) vegetation composition, with an expansion of the heath.
178 ancestral heaths
Comparable to Toterfout-Halve Mijl and surroundings, the forest in the environment consisted of mainly Quercus� and Tilia. Corylus was present in considerable amounts at the forest edge. In the lower and wetter parts of the area Alnus was the dominating tree.
11.9 Goirle
Approximately 2 km to the east of the barrow ‘Op de Kiek’ an alignment of barrows on a cover sand ridge close to a river valley is situated in an area called ‘Rechte Heide’. Along approximately 1.5 km of this barrow alignment a barrow is situated that was excavated in 1949 by Glasbergen and Waterbolk (Glasbergen 1954; see figure 11.5).
35 m
15 m
m NAP
Other barrows
Sampled barrows
Alphen 2
Alphen 1
Goirle
0 500 1000 2000 m
Figure 11.5. Location of the Alphen and Goirle barrows. The map is based on digital elevation model of the AHN (copyright www.ahn.nl).
35 m
15 m
m NAP
Other barrows
Sampled barrows
Alphen 2
Alphen 1
Goirle
0 500 1000 2000 m
179toterfout-halve mijl and surroundings
11.9.1�Site�description�and�sample�locations
A two-period barrow (h=0.90 m, d=15 m) of which the primary mound was dated to the Middle Bronze Age. The secondary mound was probably almost similar in age (Bourgeois 2013). From the mound a number of large wall and rim fragments of a Drakenstein urn were recovered. The monument was heavily damaged by deep ploughing. The old surface underneath the barrow was strongly affected by rabbits and intrusion of tree roots. A sample for pollen analysis was taken from one of the clearly recognizable sods (Waterbolk 1954, 103, 111).
11.9.2�Results�and�discussion
This barrow was constructed in an open space with an ADF of approximately 100 m. The open space was covered with heath vegetation that was, when compared to the other barrows discussed in this chapter, quite grassy with a percentage of Poaceae of 30% (see figure 11.6). Calluna vulgaris is the dominating species with 75%. This barrow was probably situated close to an alder carr, indicated by the high percentage of Alnus (60%). Sods were cut to build the barrow; a minimum area of approximately 320 m2 was required to obtain the sods.
11.10 Summary: the barrow landscape of Toterfout-Halve Mijl and surroundings
From the area around Toterfout-Halve Mijl pollen data are available from the late Neolithic-A to the Iron Age. The vegetation in the surroundings of the discussed barrows seems not to have differed greatly from each other during this entire period. Barrows were built in open spaces with heath vegetation which was dominated by Calluna�vulgaris with in most cases probably some solitary Betula trees. All other herbal vegetation, including Poaceae, was very low in number. These heath areas formed, in the case of the Toterfout-Halve Mijl group, most likely long stretched areas in which groups of barrows were built in the Bronze Age period. The forest in this area could be divided into two components. In the lower and wetter parts alder carr was present, indicated by the high percentage of Alnus in all of the pollen spectra. The forest at the drier parts in the area consisted mainly of Quercus and Tilia and in the Bronze Age also of some Fagus. As has been discussed in the previous chapters as well, the activity of man is required to manage the heath. The method of management in this area is not easy to deduce from the pollen spectra. Anthropogenic indicators are very low in amount. Some grazing indicators have been found in the barrows from Toterfout-Halve Mijl. There is no evidence for burning. Sod cutting is indicated by the barrows, while they were built of sods. Especially for the amount of barrows being built at Toterfout-Halve Mijl sod-cutting could certainly been part of the heath maintenance.
One of the research questions concerns the origin of the open spaces the mounds were raised in. For the Toterfout-Halve Mijl group the history of its open spaces is available. Some of the barrows were built on possibly former arable land (although questionable, see sections 11.1.1 and 11.6.1) and traces of a Neolithic settlement have been found nearby. After abandonment of the settlement an open area covered with grasses and some heath was left behind. Possibly the area was grazed at that time, causing an expansion of the heath in which later the barrows were built. The construction of the mounds in the area did not stop prehistoric man from using the area as pastoral grounds, because the heath could only be maintained by human interference. The destination of the area changed through time from settlement area with agriculture, to pastoral area, to burial site combined with pastoral area. On the other barrows discussed in this region no
180 ancestral heaths
Goi
rle_
os
Alp
hen
(Kie
k)_o
s_pe
r2
Alp
hen
(Kie
k)_d
itch
Alp
hen
(Kie
k)_o
s_pe
r1
Alp
hen
(Kw
aal)_
sod_
bank
Alp
hen
(Kw
aal)_
sod_
ditc
h
Alp
hen
(Kw
aal)_
sod
Alp
hen
(Kw
aal)_
os2
Alp
hen
(Kw
aal)_
os1
Alp
hen
(Kie
k)_o
utsi
dem
ound
MBA
MBA
-A
Unk
now
n
2040
6080
100
AP
NAP
2040
6080
Alnus
2040
60
Corylus
5
Fagus
1
Fraxinus 1
Hedera
1
Picea
5
Pinus
20
Quercus
1
Salix
2040
Tilia
1
Ulmus
2040
60
Betula
2040
6080
Callunavulgaris
2040
6080
100
Ericac
eae
1
Artemisia 5Asterace
aetubuli�
orae
1
Cerealia
1
Urtica
Tree
san
dsh
rubs
Hea
thA
nthr
opog
enic
indi
cato
rsSu
rrou
ndin
gsTo
terf
out-
Hal
veM
ijlA
lphe
n,G
oirle
5Asterace
aeliguli�
orae
1
Galium-ty
pe 20
Plantagolanceolata
2040
Poaceae
5
Rumexacetosa
5Succisa
1Brassica
ceae
1Caryophylla
ceae
1Cyperaceae
1
Fabaceae 1Rosace
ae 5Dryopteris 5
Polypodiumvulgare
2040
Pteridium
5
Sphagnum
449
691
587
519
526
567
521
616
507
516
Pollensu
m(A
P-Betula)
1207
1500
1224
1124
1004
1044 90
3
949
1068
1195
Totalpolle
nsum
Gra
zing
indi
cato
rsU
plan
dhe
rbs
Fern
san
daq
.mos
ses
Figu
re 1
1.6.
Pol
len
spec
tra
from
the
sam
ples
take
n fr
om th
e ba
rrow
s at
Alp
hen
and
Goi
rle.
Spe
ctra
are
giv
en in
% b
ased
on
a tr
ee p
olle
n su
m m
inus
Bet
ula
polle
n. In
the
tota
l AP
(=ar
bore
al p
olle
n)
Betu
la is
incl
uded
. In
the
tota
l NA
P (=
no
n ar
bore
al p
olle
n) s
pore
s ar
e in
clud
ed,
non
polle
n pa
lyno
mor
phs
are
excl
uded
. D
iffer
ent s
cale
s ha
ve b
een
used
, ind
icat
ed
with
diff
eren
t col
ours
.
181toterfout-halve mijl and surroundings
data are available that can reveal the origin of the open places these barrows were built in. It is clear that the open spaces were already present some time before the barrows were built, since heath vegetation had already developed, a process that in general takes approximately 40 years (Stoutjesdijk 1953). It is likely that grazing was involved in the maintenance of the heath vegetation already before the barrows were constructed.
Table 11.3 The minimum size of the open space per barrow based on the sods used to build the barrows.
183oss-zevenbergen and surroundings
Chapter�12
Oss-Zevenbergen and surroundings
Near the town of Oss, encompassing an area of approximately 7.5 km2, several burial complexes are situated from which palynological data have been obtained (see figure 12.1). The palynological results of these barrows will be described and discussed to reconstruct the barrow landscape in this area. At the end of this chapter three pollen diagrams derived from a palaeosoil and peat sediments (Schaijksche heide, Sint Annabos and Venloop, see section 12.5) will be discussed. These pollen diagrams will provide more information about the vegetation in the wider surroundings of the barrows.
12.1 Oss-Vorstengraf area and Oss-Zevenbergen
Close to the town of Oss two burial complexes are situated, Oss-Zevenbergen and the grave field of the Chieftain’s Grave of Oss (Dutch: Oss-Vorstengraf ). These two sites have been the subject of various excavations since 1933 when the Chieftain’s Grave of Oss was discovered. Especially in the last 15 years detailed research has taken place, revealing that these two sites might actually form one large burial complex. This will be further discussed in section 12.1.3.
The sites of Oss-Vorstengraf and Oss-Zevenbergen have a long and rather complex research history, the results of which have been published in several publications (Verwers 1966, Fokkens and Jansen 2004, Jansen and Fokkens 2007, Fokkens�et�al. 2009b, Fontijn and van der Vaart 2013). For a detailed report of all the research on the two sites the reader is referred to those publications. A short overview of the several research campaigns and a summary of their findings will be given in table 12.1. Then a more detailed description per barrow will be given.
12.1.1�Site�description�and�sample�locations
Oss-Zevenbergen and the Oss-Vorstengraf area are situated on the northwest edge of the Peel Blok, a by tectonics elevated (uplifted) area. The grave fields in this area are for the most part located on a ridge of cover sands. Along the side of the Peel Block area groundwater seepage wetland occur, causing locally very wet conditions west, north and east of the cemetery area (Dutch: wijstgronden; see figure 12.2). The higher parts of the terrain consist of a Carbic Podzol (Dutch classification: Haarpodzol, while the lower and wetter areas consist of Gleyic Podzols (Dutch classification: Veldpodzol). Thin layers of wind-blown sand can be found all over the terrain, especially at the flanks of the barrows. Along the southeast-side of the terrain an extended drift-sand layer is located (van der Linde and Fokkens 2009, Jansen and van der Linde 2013)
184 ancestral heaths
35 m
0 m
m NAP
Venloop
Slabroek
Schaijkse heide
Schaijk
Uden
Nistelrode
Vorssel
‘Bursch’ barrows
Oss-ZevenbergenChieftain’s grave
St Annabos
2000 m0 500 1000
Barrow
Groundwater seepage wetland
Possible settlement location
Sampled palaeosoil/peat/lake
Figure 12.1. Locations of the barrows in the case-study area of Oss-Zevenbergen and surroundings. In addition the location of a possible Middle Bronze Age settlement has been indicated, as well as the locations where groundwater seepage wetlands occur. The map is based on digital elevation model of the AHN (copyright www.ahn.nl).
185oss-zevenbergen and surroundings
Oss-Vorstengraf area
Chieftain’s grave of Oss
In 1933 a large barrow with a diameter of approximately 53 m, surrounded by a circular ditch, was discovered in which a rich Hallstatt C (Early Iron Age) grave was found: a bronze situla containing amongst others cremation remains, a Mindelheim sword (an iron sword with a hilt inlaid with gold) and many small bronze objects. Because of the grave good’s richness the grave was named the Chieftain’s Grave (Dutch: Vorstengraf) (Bursch 1937). Later research revealed that the cremation remains were of an older, disabled man, although recent research showed that he
Year of excavation Excavator Results Oss-Vorstengraf area Results Oss-Zevenbergen
1933 Bursch Discovery of the rich Oss-Vorstengraf
1935 Bursch Excavations of 3 other mounds at Oss-VG complex, one dat-ing to the Late Neolithic and two to the Middle Bronze Age
1964-1965 Modderman & Verwers Analysis of the cremation remains of Oss-VG: a disabled, older individual
Research into Oss-Zevenbergen mounds: at least 2 of the 7 mounds are barrows (mound 3 and 7), 5 other mounds were not excavated.
1969 Beex 10 barrows at Oss-Zevenbergen, of which 6 were shown to be built of sods and 4 appeared to be built of drift sand. 5 mounds are barrows, 5 belong to an urnfield.
1972 Urns were found in the area. 4 ring ditches were observed, of which one was rectangular.
1978 Van Alphen Discovery of post alignments just north of Oss-Z (part of a Medieval ‘landweer’: a defence wall)
1994 – 1997 ROB decided that re-excavation would be best to preserve the archaeological information
1997 Leiden University A survey of the VG area with test trenches: • Rediscovery of the VG: a Hallstatt C grave dug into a Bronze Age barrow, covered with a new mound.• Six-post structure• Urnfield (2 ring ditches)Re-analysis of cremation remains: male, disabled, 40-60 years.
2002 Leiden University Discovery 3rd ring ditch, 4 urns and a post alignment underneath the Hallstatt C burial. 4th (rectangular) ditch was probably too recent to be part of the urnfield.
1998-2005 Leiden University A survey with test trenches north and northwest of the VG complex was carried out: a Bronze axe deposition was found in 2003
2004-2007 ARCHOL BV/ Leiden University
A survey of the Oss-Z area: all barrows were (re-) investigated: 3 MBA barrows (4, 2, 6), 2 LBA/EIA barrows (8,1), 1 Hallstatt C barrow (mound 3). Barrow 7 could not be excavated yet.Remains of 5 additional small monuments (ring ditches) and 4 secondary burials in older barrows were discovered. Discovery of 5 post alignments.
2007 University of Leiden Re-excavation of barrow 6Excavation of barrow 7: Hallstatt C barrow. Double post alignment underneath barrow 7
2012 Re-analysis of cremation remains VG: possibly younger and less disabled than previously thought
1933-2012 Several Several restorations of the grave goods, new discoveries were made each time.
Table 12.1. Overview of the research history of the Chieftain’s grave of Oss and the Oss-Zevenbergen area.
186 ancestral heaths
might have been much younger and healthier than previously thought (Lemmers et�al. in prep). The bronze objects were probably the remains of bronze horse gear (Fokkens and Jansen 2004, Jansen and Fokkens 2007, Fokkens�et�al. 2012). The Chieftain’s Grave was rediscovered in 1997, although it was heavily disturbed at this time. The mound itself had disappeared and only the remains of ditches and posts were preserved. The re-excavation nevertheless revealed that the grave was a secondary burial into a smaller Bronze Age barrow, which had an original diameter of 16 m and was surrounded by a ditch. A new barrow was built on top with the Chieftain’s Grave positioned off-centre in relation to the Bronze Age barrow, possibly to respect the older grave. The Hallstatt C barrow had a diameter of 53 m. It was probably 1 m in height above the older mound and flattened at the top. During the 1997 excavation a fallen tree that had grown on top of the barrow was investigated. It was discovered that in its fall, the tree had retained a small intact part of the barrow in between its roots (see figure 12.3 and 12.4). Although the original mound was levelled in the past, the part of the barrow that was captured by the tree roots contained a fraction of the old surface, the soil below and some sods. Samples for pollen analysis were taken from here by de Kort (1999): three samples from the old surface and four samples from the sods. In addition two monolith tins were hammered into the section of which samples could be taken from the old surface downwards to provide a pollen diagram as has been described in chapter 5. Samples were also taken from the ditch belonging to the original Bronze Age barrow and from the ditch belonging to the Chieftain’s Grave. All samples were analysed and published by de Kort as part of his MA thesis (de Kort 1999).
Three barrows
In 1935 Bursch excavated three other barrows that were situated close to the Chieftain’s Grave (see figure 12.1). Just south of it a barrow was located that was dated to the Late Neolithic, based on the find of a Veluvian Bell Beaker. Two other barrows were surrounded by multiple post circles, which date them to the Middle Bronze Age. In addition an undecorated Middle Bronze Age urn was discovered in one of the mounds (Bursch 1937, Fokkens�et�al. 2012). No samples for pollen analysis were taken from these barrows.
Urnfield
Some urns were found in 1972 and the discovery of three small circular ring ditches and four urns without monumental structures in 1997 and 2002 indicated the presence of a small urnfield southeast of the Middle Bronze Age barrows. Two ring ditches were found in 1997 just east of the Chieftain’s Grave and had a diameter of respectively 10 and 7 m. The largest ditch was located about 15 m east
Figure 12.2. Groundwater seepage wetlands at the Peel blok. Figure after van der Laan et al. (2011).
187oss-zevenbergen and surroundings
Excavated
Disturbed
Ring ditch
(Flat) grave
Postholes
Tree fall
Chieftain’s grave
Bronze Age ditch
Chieftain’sgrave ditch
Tree fall
Sample location
1
1
2
2
10 m0
A
BCD
EF1 F2
F3
F4
0
50
100
200
150
Excavated
Disturbed
Ring ditch
(Flat) grave
Postholes
Tree fall
Chieftain’s grave
Bronze Age ditch
Chieftain’sgrave ditch
Tree fall
Sample location
1
1
2
2
10 m0
Figure 12.3. Location of the barrows in the Chieftain’s grave of Oss area. Figure after Fokkens and Jansen (2004, figure 4.5).
Figure 12.4. Tree fall at the Chieftain’s grave of Oss that had captured a small intact section of the barrow. A fraction of the old surface, the soil below and some sods were remained in this section. A indicates the uprooted subsoil from underneath the tree. B, C, D and E together form the original podsolic soil, with the original topsoil (E), a leached horizon (D) and the zone with iron pan formation (C). F1, F2, F3 and F4 are sods from the barrow, laid down with the turf upwards. Figure by H. Fokkens.
188 ancestral heaths
of the Chieftain’s Grave and had a maximum depth of 25 cm. A cremation was found in the centre of the (now disappeared) barrow. The other ditch was located about 25 m east of the Chieftain’s Grave. A cremation was not found in the centre, but eccentric at only about 1 m from the ditch. This was probably a secondary burial, dating the ditch to the Late Bronze Age/Early Iron Age. The northern part of a third ring ditch was discovered in 2002. In addition the remains of 4 urns without monumental structures were found (Fokkens and Jansen 2004, Jansen and Fokkens 2007, Fokkens�et�al. 2012). Samples for pollen analysis were taken from the two ring ditches that were found in 1997 (see figure 12.3). One of the samples from the northern ditch (urnfield ditch sample 2) was useless for pollen analysis (de Kort 1999).
4165
0041
6400
4163
0041
6200
4161
00
167800 167900 168000 168100 168200 168300
17.2
16
15
14
13
12.2m
+NAP
1
76
8
24
3
511
1210 9
Figure 12.5. Location of the Oss-Zevenbergen barrows and surrounding features. Figure after van der Linde and Fokkens (2009, figure 4.4).
189oss-zevenbergen and surroundings
Posts
In 1997 a double and partly triple post alignment was found. This post alignment was located partially underneath the eastern part of the Chieftain’s Grave, dating the post alignment before the Hallstatt C period. The alignment is probably related to the Bronze Age burial underneath the Chieftain’s Grave (Fokkens and Jansen 2004, Jansen and Fokkens 2007, Fokkens�et�al. 2012).
A six-post structure was found directly north of one of the ring ditches, which was interpreted as a mortuary house. It was not possible to date this post structure (Fokkens�et�al. 2012). None of the posts were sampled for pollen analysis.
Oss-Zevenbergen
Approximately 350 m east of the Chieftain’s Grave a barrow complex including at least seven burial mounds and several post structures is located (see figure 12.5), called Oss-Zevenbergen. The barrows date from the Middle Bronze Age to the Early Iron Age. They are situated on a ridge of cover sands in a southwest to northeast alignment. Below follows a description per barrow. All information about these barrows is based on the publication of van Wijk et�al. (2009), unless stated otherwise.
Oss-Zevenbergen 1
In 2004 Barrow 1 was the first to be excavated. The mound itself had mostly disappeared, but the ditches were for the greater part still recognizable. Barrow 1 is a long bed that measured 4.7 m by at least14 23.5 m. Its height was probably between 30 and 50 cm. It probably dated to the Late Bronze Age/Early Iron Age (van Wijk�et�al. 2009, 73-74). The soil underneath the barrow was a Carbic Podzol (Dutch classification: Haarpodzol). De Kort took five samples for pollen analysis, of which three were analysed: two pollen samples of the old surface and a sample from the fill of the lower part of the surrounding ditch (de Kort 2009, 158).
Oss-Zevenbergen 2
Barrow 2 was recognized as a burial mound in 1964/1965, but not excavated until 2004. It was situated on the highest part of the cover sand ridge. The barrow appeared to be a two-period barrow. The primary mound was built on top of a pit that was filled with thin (5-10 cm) sods. No skeletal remains have been found in this pit. The mound was constructed of sods with a thickness of 10-15 cm and an average length of 34 cm. The diameter of the first period was approximately 12.5 m. Its height was probably approximately 60 cm. The mound was surrounded by a closed spaced single post circle, probably dating the mound to 1700-1300 cal BC (cf. Bourgeois 2013, 34). The old surface belonging to period 1 was, different from what was underneath the other barrows, an Umbric Podzol (Dutch classification: Moderpodzol). The secondary mound was also constructed of sods of which the thickness is unknown. The mound was increased to a height of approximately 1.2 m and a diameter of approximately 17.5 m. No grave was found. A closely spaced double post circle was placed around the mound probably preceding the sod placing (the mound seemed to cover the post holes), dating the second phase of mound building also to the Middle Bronze Age (1700-1300 cal BC, cf. Bourgeois 2013, 34). The barrow was re-used in the Iron Age, when an Iron Age urn with cremation remains was placed in the mound. In the Medieval
14 The barrow was heavily damaged and exact measurements could not be reconstructed (Fokkens et�al. 2009).
190 ancestral heaths
Period another three graves were dug at the base of the mound. Barrow 2 has been sampled for pollen analysis by de Kort (2009). Samples were taken from the E- and B-horizon underneath the primary mound, from 2 sods belonging to the first period, from the old surface underneath the secondary mound and from a sod belonging to the second period. Another sample was taken from underneath a grey layer that covered the sods of period 1, but since it is not very clear what this sample represents it will not be discussed.
Oss-Zevenbergen 3
Barrow 3 is located approximately 40 north of the barrow alignment and situated in a lower part of the area. It was first discovered in 1964/1965 and excavated in 2004. It is a single-period barrow with a diameter of approximately 30 m. Its original height is not exactly known but is conservatively estimated to have been approximately 90 cm. The mound was constructed of sods with an average thickness of 8-18 cm and an average length of 50 cm. The central grave consisted of a large burnt oak plank, some smaller pieces of charcoal, a piece of burned bone, a small fragment of a bronze sword and fragments of one bronze and two iron objects; probably a pars�pro� toto�deposition (only parts of an object and/or the deceased have been buried representing a whole object and/or person). The barrow was dated to the Hallstatt C period (Early Iron Age), based on 14C dating of the oak plank and might be contemporary to the Chieftain’s Grave. The soil underneath the barrow was a Gleyic Podzol (Dutch classification: Veldpodzol). Samples for pollen analysis have been taken from the old surface and from three sods by de Kort (2009).
Oss-Zevenbergen 4
Barrow 4 was heavily disturbed and not recognized as a barrow before the excavation in 2004. Barrow 4 concerns a barrow that was built in four phases. The first phase consists of a sod layer with a thickness of approximately 15 cm. Before adding a new layer of sods (phase 2) burning seems to have taken place, indicated by a high concentration of charcoal fragments in the old surface underneath phase 2. Phase 2 consists of another layer of 10-15 cm thick sods (length about 80 cm). After phase 2 the mound measured approximately 14.5 m in diameter and approximately 50 cm in height. Another burning event seems to have taken place after phase 2 as indicated by fragments of charcoal. Charcoal fragments 14C date this layer to phase 2 to the Middle Bronze Age A (1530-1390 cal BC). The barrow was increased to a height of approximately 60 cm in phase 3, while the diameter of the mound was not enlarged. No sods have been recognized in this layer. In the fourth phase the mound was probably enlarged to a diameter of about 16 m, while the mound was not heightened. After the last period the mound was covered with a layer of drift sand. Underneath the barrow a disturbed brown layer was found on top of which the old surface belonging to the primary mound was situated. This layer was probably anthropogenic and was interpreted as an old arable layer. Five samples have been analysed for pollen by de Kort (2009). One sample was taken from the old surface underneath the drift sand layer at the southern part of the barrow. Four samples were taken from the old surface belonging to phases 2, 3 and 4. A fifth sample was taken from the disturbed brown layer underneath the old surface.
191oss-zevenbergen and surroundings
Mound 5
Mound 5 was recorded as a barrow in 1964/1965. During the excavation in 2004 it appeared not to be a barrow but a natural hill formed of drift sand. Two samples for pollen analyses were taken from the old surface underneath the hill (de Kort 2009).
Oss-Zevenbergen 6
Barrow 6 was first excavated in 1964/1965 by Verwers. The data from this excavation were reinterpreted by Valentijn (2013). It was discovered that a round mound was built on top of an oblong monument. Next to the ditch a closely spaced multiple post setting was found. Pottery sherds together with cremation remains were found. In 2004 the eastern part of the barrow was re-excavated. The western part of the monument could not be excavated yet since this part was situated in a protected zone due to a badger sett in barrow 7 (see next section). It was concluded that barrow 6 was constructed in two or three phases, but possibly these construction phases occurred in the same period (the Late Bronze Age/Early Iron Age). The first (and possibly second) phase consisted of an oblong ditch and a double ring of posts with a length of 27 m and width of 7.5 m. In the next phase a round barrow was erected within the eastern part of the oval monument (van Wijk�et�al. 2009).
In 2007 the remaining part of the monument could be excavated, revealing that the oldest peripheral structure is the double post setting, which measures 28.5 by 8.5 m. The post setting probably dates to the Middle Bronze Age B or Late Bronze Age. During the second phase an oval ditch was dug that cut the inner post-setting. It was also shown that the round mound probably was the remains of a disturbed long mound. The long mound was extended on the southern side, covering the oblong ditch (Valentijn 2013). In 2007 one single sample for pollen analysis was taken from the ditch, which was analysed by Bakels (Bakels and Achterkamp 2013).
Oss-Zevenbergen 7
Barrow 7, a large mound with a diameter of about 36 m and a height of 1.5 mm, was first discovered in 1964/1965. During the excavation campaign of 2004, when most of the other barrows at Oss-Zevenbergen were investigated, this barrow had to be left alone. A badger family made the barrow their home and since badgers are a protected species in the Netherlands Barrow 7 (and part of Barrow 6) could not be excavated before the badgers had been relocated. Finally, in 2007 the barrow could be thoroughly investigated. It appeared to be built of sods on a naturally formed small hill of cover sand and the actual barrow did not measure 36 m in diameter, but 22.8 m, and was 80 cm high15. On the northern side of this hill wind-blown sand was deposited in the Middle Neolithic16. Underneath the burial mound a Carbic Podzol (Dutch classification: Humuspodzol) had developed in the cover sand. An Early Iron Age urn (Schräghals type) was excavated near the centre of the mound. The urn was half-filled with cremation remains that appeared to be from a male in the age of 23-40 years. The bone was 14C dated to the Hallstatt C period (794-538 cal BC) (Fontijn�et�al. 2013a, 96; Smits 2013). Very close to the urn more than 1000 small, bronze studs and large amounts of scattered charcoal
15 The original height of the mound could not be exactly reconstructed, but it was presumed that at least 30 cm of the original top was absent (Fontijn et�al. 2013a, 70).
16 Based on OSL dating by Wallinga and Lemmers, reported in an unpublished thesis (Lemmers 2008), the deposition took place around 5000 BC.
192 ancestral heaths
were found. Since the bronze and wood items appeared to be very fragile it was decided to lift the area with its finds, covering an area of approximately 10 m2, in blocks to allow for further treatment, preservation and excavation in a laboratory 17(cf.�Fontijn�et�al.�2013a , 80-81).
The charred wood consisted of oak (94%), ash (5%) and willow (<1%). In the centre of the mound three charcoal pieces were recovered from the find assemblage. These charcoal fragments were 14C dated to the Hallstatt C period (Fontijn�et�al. 2013a, 115-116). Several fragments of burned bone were found in between the pyre remains as well as two pieces of decorated (animal) bone and an undefined iron object. The burned bone most likely belonged to the same individual as the remains in the urn that was buried next to the pyre debris, although this cannot be confirmed with absolute certainty (van der Vaart�et�al. 2013, 138-139). The bronze items probably were the remains of a wagon/horse-gear (yoke decoration) that was dismantled and then partly burned with the deceased. The burned remains were partly deposited a little to the east of the pyre and partly left behind (Fontijn and van der Vaart 2013, 191, 193). The A-horizon was missing under the centre of the barrow, indicating that the surface was stripped before the pyre was built (Fontijn�et�al. 2013a, 114). Altogether, Barrow 7 appeared to be a rich Hallstatt C burial mound, broadly contemporaneous with the Chieftain’s Grave and Barrow 3.
In the corner of the southwest quadrant traces of an oval pit containing a large amount of charcoal were discovered underneath the barrow. The pit was dated to the Middle Bronze Age A based on 14C dating of a piece of charcoal that was retrieved from the pit fill (Fontijn�et�al. 2013a, 111-112). Close to this pit, traces of an (pre-barrow) eight-post structure were found. This feature was interpreted as an allée, a corridor related to funerary activities, comparable to the post alignment that was found underneath the Chieftain’s Grave (see 12.1). The allée might have been related to the funeral activities of Mound 6 (Fontijn et�al. 2013a, 110-111).
Samples for pollen analysis were taken from several locations in the barrow. As a large part of the top surface of the hill was stripped before the barrow was erected on top of it, sampling of the old surface was difficult, but on top of the wind-blown sand dune part of the old surface was preserved. A monolith tin that was driven in this section contained two soils on top of each other of which the lowest probably contained the old surface underneath the dune and the upper the old surface underneath the actual barrow. The lower soil did not reveal pollen. From the results of the upper soil a pollen diagram was derived, based on the theory described in Chapter 5. In addition eight samples that were taken from sods were analysed for pollen. Sampling and analysis of these samples was done by Achterkamp as part of her research master’s thesis (Achterkamp 2009, Bakels and Achterkamp 2013). In 2009 a bulk sample was taken from the central grave assemblage by Restaura, the laboratory at which the lifted blocks were investigated. This sample was analysed for pollen by the author of the present work.
Oss-Zevenbergen 8
Barrow 8 was for a great part excavated in 1964/1965 by Modderman and Verwers. The last part (northwest quadrant) was excavated in 2004. The results of both excavations show that Barrow 8 is a single period barrow that measured approximately 12 m in diameter and 0.6 m in height. It was built of sods, covering an inhumation grave. The barrow was dated to the Early or Middle Bronze Age, based on the stretched position of the deceased. The barrow contained two
17 Laboratory of Restaura.
193oss-zevenbergen and surroundings
secondary interments (urns) of which the oldest dates to the Middle Bronze Age and the youngest to the Early Iron Age. An encircling ditch with a diameter of 9.5 m was dug into the barrow probably when the youngest urn was buried. The ditch was most likely part of the urnfield that was located northwest of Barrow 8 (see next section; van Wijk et�al. 2009, 121-126). Samples were taken for pollen analysis: two samples from the old surface, one from the ditch fill and one from a sod18. In addition a monolith tin was driven into the soil underneath the barrow of which three samples have been analysed (de Kort 2009).
Urnfield, Oss-Zevenbergen 9-12
North of the barrow alignment the remains of a small urnfield were found (see figure 12.5). In addition to the Early Iron Age ditch at Barrow 8 (the remains of ) four ring ditches were found, called Barrow 9 (d=5 m), 10 (d=7.5 m), 11 (d=4 m) and 12 (d=2.5-2.8 m). Fragments of urns were found in Barrows 10 and 11, which were dated to the Early Iron Age (van Wijk et�al. 2009, 126-131). Samples for pollen analysis were taken from the ditch belonging to Barrow 10, 11 and 12. One sample from the ditch of Barrow 12 has been analysed by de Kort (2009). The samples of the ditch of Barrow 10 have not been analysed and the samples from the ditch of Barrow 11 did not contain enough pollen for analysis.
Post alignments and post structures
Five post alignments and four post structures were revealed during the excavation in 2004 (see figure 12.5). Post alignment 1 is situated east of Barrow 3 and about 116 m long. At the southern part of the alignment (close to Barrow 3) some additional posts were found, belonging to post structures 1 and 2 (see figure 12.5). Post alignment 2 is situated in extension of alignment 1, but with different orientation. Its length is unknown, but at least 18 m and probably 32 m. Post alignment 3 was found east of barrow 4 and has a length of 58 m. Two extra posts were placed parallel to the alignment, forming post structure 3. A 17 m long alignment of posts is situated between Barrows 6 and 8. The fifth post alignment is located between Barrow 8 and Mound 5. At the end of this 8 m long alignment post structure 4 is situated, consisting of 4 posts. The dating of the post alignments and structures is unknown, but van Wijk et�al. argue that they belong to the urnfield and that they date to the Early Iron Age (van Wijk et�al. 2009). The fill of one of the post features of alignment 1 was sampled and analysed for pollen by de Kort (2009).
Drift sand layer
Thin layers of drift sand were present throughout the entire Oss-Zevenbergen area, probably the result of (post) Medieval small scale sand drifting due to the intensive use of roads. An older layer of drift sand was found in the southeast of the area. A sample from the old surface underneath this sand layer was analysed for pollen by de Kort (2009).
18 At the time the samples were taken it was not entirely clear yet whether the barrow was built in one phase or in two phases. In between the sods a layer with grey-yellow sand was present. It was not clear whether this layer represented a second building period or that sods were taken from less developed podzol or that the barrow was built of sods and sand. It was later concluded that the barrow was built in one phase. The pollen sample was taken from one of the sods taken from less developed soil/sand layer.
194 ancestral heaths
One barrow complex or not?
The Oss-Vorstengraf area was at first believed to be separate from the Oss-Zevenbergen barrows. However, it has also been assumed that they formed one large barrow complex (Fokkens� et� al. 2009a, 223-224). The area was probably first used for barrow building in the Late Neolithic, when a barrow was built in the Oss-Vorstengraf area. In the Middle Bronze Age (A) the burial complex got its shape, with probably six barrows dating to this period: the Bronze Age mound underneath the Chieftain’s Grave, two additional barrows nearby and Barrow 2, 4 and 8 in the Oss-Zevenbergen area. In the following period several barrows were enlarged and/or used for secondary burials. In the Late Bronze Age/Early Iron Age two additional mounds were constructed (Barrows 1 and 6) and in the Hallstatt C period (Early Iron Age) three more barrows were added to the now already extensive burial complex (Barrow 3, 7 and the Chieftain’s Grave). Two small urnfields were probably contemporaneous to the Hallstatt barrows.
The barrow complex of the Oss-Vorstengraf area and the Oss-Zevenbergen area might certainly have formed one barrow complex, since they are similar in time depth. It is however not likely that they physically formed one complex. West, east and south of the Oss-Zevenbergen area seepage of groundwater occurs, causing these areas to be very wet. The occurrence of seepage water west of the Oss-Zevenbergen area creates a natural boundary between the barrow complex of Oss-Zevenbergen and the Vorstengraf area (R. Jansen pers.comm., March 2013; see also the introduction of section 12.1.1 and figure 12.1).
12.1.2�Results
Now follows a description of the results per barrow/sampled feature of which the data have been produced by several researchers mentioned in the previous section. The data have been reprocessed and reinterpreted by the author. After this section this reinterpretation will be discussed in section 12.1.3.
Oss-Vorstengraf area
Chieftain’s Grave, old surface and sods (see figure 12.6a)
The pollen spectra from the old surface and sods are very similar, indicating that sods belong to the same environment as the barrow. They show arboreal pollen percentages of approximately 55% (ADF= 100 m), except for sod 1 that shows an arboreal pollen percentage of almost 70%. The arboreal pollen component is very much dominated by Alnus pollen with percentages of over 65%, indicating an alder carr was present in the near surroundings. Corylus is well represented with percentages of 10-20%, being present in the drier parts of the surrounding forest. Quercus (ca. 5%), Tilia (1-2%) and Fagus (1-3%) pollen, also representing components of the dry forest, are present in low percentages. Herbal pollen consists of almost only Ericales, showing that a species-poor heathland was present at the site.
Chieftain’s Grave, tree fall section (see figure 12.6b)
The pollen diagram shows a vegetation development from the period before the construction of the Chieftain’s Grave. Arboreal pollen percentages fluctuated through time between 40% and 80%, indicating a fluctuating ADF between 25 and 150 m. This is mainly caused by fluctuating percentages of Ericales pollen. Other herbs are almost absent. Alnus shows an increase from about 40% to 60%, Corylus decreases from 45% to 25%. Tilia decreases while Fagus appears. The
oldest samples show percentages of up to 20% while this species has decreased to less than 5% at the time the barrow was built.
Bronze Age ditch (see figure 12.6c)
The Bronze Age ditch (underneath the Chieftain’s grave) shows an arboreal pollen percentage of approximately 60% (ADF is around 50 m). The two dominating tree pollen species are Alnus (~45%) and Corylus (~35%). Quercus pollen is present with a percentage of 10%. Other trees are present in percentages less than 2%. Herbal pollen mainly consists of Ericales with a percentage of 55%.
Urnfield
The ditches belonging to the urnfield of the Oss-Vorstengraf area show arboreal percentages of about 55%, indicating an open space with an ADF of approximately 75-100 m. The herbal vegetation is dominated by Ericales with pollen percentages of 70-80%. The arboreal pollen component is dominated by Alnus (35-45%), Corylus (35-45%) and Quercus (5-10%).
Oss-Zevenbergen
Oss-Zevenbergen 1 (see figure 12.7)
The pollen spectra taken from the old surface, and the ditch belonging to arrow 1, show arboreal pollen percentages of 45-60% (ADF=50-125 m). Tree pollen is dominated by Alnus�(ca. 50%), indicating that an alder carr was present nearby. Corylus (ca. 30%) and Quercus pollen (5-10%) represent the forest in the higher and drier environment. Herbal pollen is dominated by Ericales with percentages from 60-120%. Other herbs, including anthropogenic indicators, are almost absent.
Oss-Zevenbergen 2 (see figure 12.8)
The oldest period, which is represented by the sample from the B-horizon, shows a non arboreal pollen percentage (NAP) of about 70%, indicating the open space had an ADF of approximately 300-500 m. The high NAP is mainly the result of a very high percentage of Ericales pollen of over 200%. Some other herbs like Poaceae are present although only in low percentages of less than 5%, indicating that the heathland was poor in species. The arboreal pollen component consists of mainly Alnus (ca. 45%), Corylus (ca. 30%), Quercus (ca. 10%) and Tilia (ca. 3%). The following period, represented by the sample taken from the E-horizon, shows a higher arboreal pollen percentage of about 70%, indicating that the open space was probably much smaller at this time. The arboreal component is comparable to the B-horizon, except for an increased percentage of Corylus (ca. 45%). The percentage of Ericales decreased to about 40%. The following periods, represented by respectively the sods of period 1 and the old surface and sod belonging to period 2, show similar pollen spectra as the E-horizon with an AP of about 55-70%. Only Corylus has decreased slightly till around 35% at the youngest period in favour of Alnus, which has increased to approximately 50%. The old surface belonging to period 2 shows a peak of 20% in Poaceae pollen.
Oss
Z1_o
s1
Oss
Z1_o
s2
Oss
Z1_d
itch
LBA
/EIA
2040
6080
100
AP
NAP
2040
60
Alnus
2040
Corylus
5Fagus
5Fraxinus 1
Lonicera 5Pinus
20
Quercus
1
Salix
510
Tilia
1
Ulmus
5Betula
5010
015
0
Ericales
1
Artemisia
5Asterace
aetubuli�
orae
20
Asterace
aeliguli�
orae
5Plantagolanceolata
5Poaceae 1
Cyperaceae
1
Rosace
ae 1Monoletepsil
atefern
spores
1
Polypodiumvulgare
5Sphagnum 1Indeterminab
le
322
314
291
Pollensu
m(A
P-Betula)
734
533
520
Totalpolle
nsum
Tree
san
dsh
rubs
Hea
thA
nthr
.ind
.U
pl.h
erbs
Fern
san
dm
osse
sG
razi
ngin
d.O
ss-Z
even
berg
enBa
rrow
1Fi
gure
12.
7. P
olle
n sp
ectr
a fr
om th
e sa
mpl
es ta
ken
from
Oss
-Zev
enbe
rgen
ba
rrow
1. S
pect
ra a
re g
iven
in %
bas
ed
on a
tree
pol
len
sum
min
us B
etul
a po
llen.
In th
e to
tal A
P (=
arbo
real
pol
len)
Be
tula
is in
clud
ed. I
n th
e to
tal N
AP
(=
non
arbo
real
pol
len)
spo
res
are
incl
uded
, no
n po
llen
paly
nom
orph
s ar
e ex
clud
ed.
Diff
eren
t sca
les
have
bee
n us
ed, i
ndic
ated
w
ith d
iffer
ent c
olou
rs. L
BA=
Late
Bro
nze
Age
, EIA
= Ea
rly
Iron
Age
.
199oss-zevenbergen and surroundings
Oss
Z2_s
od_p
er2
Oss
Z2_o
s_pe
r2
Oss
Z2_s
od1_
per1
Oss
Z2_s
od2_
per1
Oss
Z2_E
h_pe
r1
Oss
Z2_B
h_pe
r1
MBA
Unk
now
n
2040
6080
100
AP
NAP
2040
60
Alnus
2040
60
Corylus
1
Fagus
1
Fraxinus 1Lonicera
20
Pinus
20
Quercus
1
Salix20
Tilia1
Ulmus
5Betula
100
200
300
Ericales
1
Artemisia
1
Asterace
aetu
buli�orae
1
Chenopodiaceae
5Asterace
aelig
uli�orae
2040
Poaceae
5Rumexacetosa-ty
pe
1
Succisa
1
Apiaceae 1
Caryophyllace
ae
1
Cyperace
ae
1Rosaceae 1
2
Monoletepsil
atefern
spores
5Monoleteverru
catefern
spores
1Polypodiumvulgare
5Sphagnum 1
Zygnemataceae
322
331
315
398
414
317
Pollensu
m(A
P-Betula)
476
609
466
571
640
1080
Totalpolle
nsum
Tree
sand
shru
bsH
eath
Anth
r.in
d.U
plan
dhe
rbs
Ferb
sand
mos
ses
Gra
zing
indi
cato
rsO
ss-Z
even
berg
enBa
rrow
2
Figu
re 1
2.8.
Pol
len
spec
tra
from
the
sam
ples
take
n fr
om O
ss-Z
even
berg
en b
arro
w 2
. Oss
Z2_
Bh_p
er1
and
Oss
Z2_
Eh_p
er1
are
sam
ples
take
n fr
om th
e Bh
and
Eh
hori
zons
of t
he s
oil p
rofil
e un
dern
eath
the
barr
ow.
Spec
tra
are
give
n in
% b
ased
on
a tr
ee p
olle
n su
m m
inus
Bet
ula
polle
n. In
the
tota
l AP
(=ar
bore
al p
olle
n)
Betu
la is
incl
uded
. In
the
tota
l NA
P (=
non
arb
orea
l pol
len)
spo
res
are
incl
uded
, non
pol
len
paly
nom
orph
s ar
e ex
clud
ed. D
iffer
ent s
cale
s ha
ve b
een
used
, ind
icat
ed w
ith d
iffer
ent c
olou
rs. M
BA=
Mid
dle
Bron
ze A
ge.
200 ancestral heaths
Oss-Zevenbergen 3 (see figure 12.9)
The sods and old surface show similar pollen spectra, indicating that the sods were cut in the near vicinity of the barrow location. The old surface and sods of Barrow 3 show arboreal pollen percentages of approximately 55-60%, indicating an open space with an ADF of approximately 75-100 m. The main tree species is Alnus with percentages of more than 50%. Corylus is also present in high amounts (20-45%), together with Quercus (3-15%). Ericales pollen dominates the non arboreal pollen component with percentages of 50-80%. Other herbs are almost absent, except for Poaceae with a percentage of 40% in sod 3.
Oss-Zevenbergen 4 (see figure 12.10)
The oldest sample, from the anthropogenic layer underneath the mound, shows an arboreal pollen percentage of approximately 50% (ADF is around 100 m). This arboreal pollen component consists of Alnus (ca. 40%), Corylus (ca. 40%), Quercus (ca. 10%) and Tilia (ca. 10%). The herbal pollen component is mainly Ericales (ca. 50%) and Poaceae (ca. 10%). There are few other herbal pollen species, which are present albeit in very small amounts.
The pollen spectra from the barrow period and the following periods show a decrease in the arboreal pollen percentage, indicating an increasing ADF of the open space. At the time the barrow was built AP was around 60%, which decreased to 15% just before the wind-blown sand covered the barrow. This is mainly due to an increase of Ericales pollen, which increases to over 500%. At that time some changes are visible in the arboreal pollen composition: Quercus has increased to approximately 25%, while Corylus has decreased to around 20% and Tilia has disappeared.
Mound 5 (see figure 12.11)
Pollen spectra from the old surface underneath this naturally formed hill show arboreal pollen percentages of 40-55%. Arboreal pollen is mainly Alnus (ca. 45%) and Corylus (ca. 45%). Quercus is present in percentages of about 10%. Ericales is the dominant herbal pollen with percentages of 75 to 150%.
Oss-Zevenbergen 6 (see figure 12.12)
The ditch of Barrow 6 shows an arboreal pollen percentage of 50% (ADF is around 100 m). Ericales (ca. 90%) is dominant in the non arboreal pollen component. Dominant trees are Alnus (ca. 50%) and Corylus (ca. 40%). Pollen from other trees like Quercus, Tilia and Ulmus are present in lower percentages (3-5%).
Oss-Zevenbergen 7, sods and grave (see figure 12.13a)
Pollen spectra from the sods and the grave show arboreal pollen percentages of 40-60%, indicative of an open space with an ADF of 75-150 m. The arboreal pollen component consists mainly of Alnus (45-65%), indicating an alder carr in the surroundings. Some difference between the sods in the percentages of Alnus might indicate that some were taken closer to an alder carr than others. The arboreal component representing the drier forest is dominated by Corylus (25-40%) and Quercus (5-15%). The herbal pollen component is dominated by Ericales with percentages of 65-150%.
201oss-zevenbergen and surroundings
Oss
Z3_o
s
Oss
Z3_s
od1
Oss
Z3_s
od2
Oss
Z3_s
od3
Hal
lsta
tt C
2040
6080
100
AP
NAP
2040
60
Alnus
Carpinus 2040
60
Corylus
510
Fagus
5Fraxinus 5
Pinus
20
Quercus
1
Salix
5
Tilia
1
Ulmus
20
Betula
2040
6080
Ericales
1
Artemisia 1
Asteraceaetu
buli�orae
1
Chenopodiaceae
1
Asteraceaelig
uli�orae
1
Plantagolanceolata
2040
60
Poaceae
5Rumexacetosa
-type
1
Caryophyllace
ae
5Cyperaceae
1
Knautia
1
Monoletepsil
atefern
spores
1
Monoleteverru
catefern
spores
1
Polypodiumvulgare
5
Sphagnum 1
Debarya 1
Zygnema 329
329
331
415
Pollensu
m(A
P-Betula)
544
632
617
831
Totalpolle
nsum
Tree
sand
shru
bsH
eath
Ant
hr.i
nd.
Upl
and
herb
sFe
rnsa
ndm
osse
sA
lgae
Gra
zing
indi
cato
rsO
ss-Z
even
berg
enBa
rrow
3
Figu
re 1
2.9.
Pol
len
spec
tra
from
the
sam
ples
take
n fr
om O
ss-Z
even
berg
en
barr
ow 3
Spe
ctra
are
giv
en in
% b
ased
on
a tr
ee p
olle
n su
m m
inus
Bet
ula
polle
n. In
the
tota
l AP
(=ar
bore
al p
olle
n)
Betu
la is
incl
uded
. In
the
tota
l NA
P (=
no
n ar
bore
al p
olle
n) s
pore
s ar
e in
clud
ed,
non
polle
n pa
lyno
mor
phs
are
excl
uded
. D
iffer
ent s
cale
s ha
ve b
een
used
, ind
icat
ed
with
diff
eren
t col
ours
.
202 ancestral heaths
Oss
Z4_o
s_dr
ift
Oss
Z4_o
s_pe
r4
Oss
Z4_o
s_pe
r3
Oss
Z4_o
s_pe
r2
Oss
Z4_b
row
n
Unk
now
n
MBA
Unk
now
n
2040
6080
100
AP
NAP
2040
60
Alnus
2040
60
Corylus
510
Fagus
5
Fraxinus 5
Pinus
2040
Quercus
1
Salix
510
Tilia
1
Ulmus
510
Betula
100
200
300
400
500
600
Ericales
1
Artemisi
a 5Asteraceaetu
buli�orae
5Asteraceaelig
uli�orae
1
Plantagolanceolata
20
Poaceae
20
Rumexacetosa-ty
pe
1
Succisa
1
Apiaceae 1Cyperaceae
5
Knautia
1
Rosaceae 1
Monoletepsil
atefern
spores
1Monoleteverru
cate
fernsp
ores
1
Polypodiumvulgare
5
Sphagnum 1
Debarya 1
Zygnemataceae
159
314
326
365
352
Pollensu
m(A
P-Betula)
1054
633
648
619
719
Totalpolle
nsum
Tree
san
dsh
rubs
Hea
thA
nthr
.ind
.U
plan
dhe
rbs
Fern
san
dm
osse
sA
lgae
Gra
zing
indi
cato
rsO
ss-Z
even
berg
enBa
rrow
4
Figu
re 1
2.10
. Pol
len
spec
tra
from
the
sam
ples
take
n fr
om O
ss-Z
even
berg
en b
arro
w 4
. Oss
Z4_
brow
n is
the
polle
n sa
mpl
e ta
ken
from
the
dist
urbe
d br
own
laye
r un
dern
eath
the
old
surf
ace.
Oss
Z4_
os_d
rift
is th
e po
llen
sam
ple
take
n fr
om th
e ol
d su
rfac
e un
dern
eath
the
drift
san
d la
yer
at th
e so
uthe
rn p
art o
f the
bar
row
s. S
pect
ra
are
give
n in
% b
ased
on
a tr
ee p
olle
n su
m m
inus
Bet
ula
polle
n. In
the
tota
l AP
(=ar
bore
al p
olle
n) B
etul
a is
in
clud
ed. I
n th
e to
tal N
AP
(= n
on a
rbor
eal p
olle
n) s
pore
s ar
e in
clud
ed, n
on p
olle
n pa
lyno
mor
phs
are
excl
uded
. D
iffer
ent s
cale
s ha
ve b
een
used
, ind
icat
ed w
ith d
iffer
ent c
olou
rs. M
BA=
Mid
dle
Bron
ze A
ge.
203oss-zevenbergen and surroundings
Oss
Z6_d
itch
LBA/
EIA
2040
6080
100
AP
NAP
2040
60Alnus
2040
Corylus
1
Fraxinus 5Pinus
5Quercus 1
Rhamnuscathartic
a
5Tilia
5Ulmus
20
Betula
2040
6080
100
Ericales
5Chenopodiaceae
1
Asterace
aeliguli�
orae
1
Plantagolanceolata
20
Poaceae
1
Rumexacetosa/R.acetosella
-type
1
Succisa
1Brassica
ceae
5Monoletepsil
atefern
spores
1
Pteridium 1
Sphagnum
335
Pollensu
m(A
P-Betula)
713
Totalpolle
nsum
Tree
san
dsh
rubs
Hea
ths
Anth
r.in
d.G
razi
ngin
d.Fe
rns
and
mos
ses
Upl
.her
bsO
ss-Z
even
berg
enBa
rrow
6
Figu
re 1
2.12
. Pol
len
spec
tra
from
th
e sa
mpl
es ta
ken
from
Oss
-Z
even
berg
en b
arro
w 6
. Spe
ctra
ar
e gi
ven
in %
bas
ed o
n a
tree
po
llen
sum
min
us B
etul
a po
llen.
In
the
tota
l AP
(=ar
bore
al p
olle
n)
Betu
la is
incl
uded
. In
the
tota
l N
AP
(= n
on a
rbor
eal p
olle
n)
spor
es a
re in
clud
ed, n
on p
olle
n pa
lyno
mor
phs
are
excl
uded
. D
iffer
ent s
cale
s ha
ve b
een
used
, in
dica
ted
with
diff
eren
t col
ours
. LB
A=
Late
Bro
nze A
ge, E
IA=
Earl
y Ir
on A
ge.
Oss
Z5_o
s1
Oss
Z5_o
s220
4060
8010
0
AP
NAP
2040
60
Alnus
2040
60
Corylus
1
Fraxinus 5Pinus
20
Quercus
5Tilia
1
Ulmus
20
Betula
5010
015
020
0
Ericales
1
Asteraceaetu
buli�orae
1Plantagolanceolata
20Poac
eae
1
Apiaceae 1
Caryophyllaceae
5Jasione
1
Monoletepsil
atefern
spores
1
Debarya 1
Zygnemataceae
330
360
Pollensu
m(A
P-Betula)
888
660
Totalpollensu
m
Tree
sand
shru
bsH
eath
Ant
hr.i
nd. G
raz.
ind.
Upl
and
herb
sFe
rnsA
lgae
Oss
-Zev
enbe
rgen
Mou
nd 5
Figu
re 1
2.11
. Pol
len
spec
tra
from
the
sam
ples
take
n fr
om
Oss
-Zev
enbe
rgen
mou
nd 5
. Sp
ectr
a ar
e gi
ven
in %
bas
ed o
n a
tree
pol
len
sum
min
us B
etul
a po
llen.
In th
e to
tal A
P (=
arbo
real
po
llen)
Bet
ula
is in
clud
ed. I
n th
e to
tal N
AP
(= n
on a
rbor
eal
polle
n) s
pore
s ar
e in
clud
ed,
non
polle
n pa
lyno
mor
phs
are
excl
uded
. Diff
eren
t sca
les
have
bee
n us
ed, i
ndic
ated
with
di
ffere
nt c
olou
rs.
204 ancestral heaths
Figu
re 1
2.13
a-b.
Pol
len
spec
tra
from
the
sam
ples
take
n fr
om O
ss-Z
even
berg
en b
arro
w 7
. 12
.13a
: pol
len
spec
tra
from
the
sam
ples
take
n fr
om th
e so
ds a
nd th
e gr
ave.
12.
13b:
pol
len
diag
ram
from
the
sect
ion
take
n un
dern
eath
bar
row
7. S
pect
ra a
re g
iven
in %
bas
ed o
n a
tree
pol
len
sum
min
us B
etul
a po
llen.
In th
e to
tal A
P (=
arbo
real
pol
len)
Bet
ula
is in
clud
ed.
In th
e to
tal N
AP
(= n
on a
rbor
eal p
olle
n) s
pore
s ar
e in
clud
ed, n
on p
olle
n pa
lyno
mor
phs
are
excl
uded
. Diff
eren
t sca
les
have
bee
n us
ed, i
ndic
ated
with
diff
eren
t col
ours
.
Oss
Z7_s
od1
Oss
Z7_s
od2
Oss
Z7_s
od.3
Oss
Z7_s
od4
Oss
Z7_s
od5
Oss
Z7_s
od3
Oss
Z7_s
od7
Oss
Z7_s
od8
Oss
Z7_g
rave
Hal
lsta
tt C
2040
6080
100
AP
NAP
2040
6080
Alnus
2040
Corylus
5
FagusFagus
1
Fraxinus 5
Pinus
20
Quercus
1
Salix
1
Tilia
5Ulmus
20
Betula
5010
015
020
0
Ericales
1Arte
misia 1
Astera
ceaetu
buli�orae
1Chenopodiaceae
1
Astera
ceaelig
uli�orae
1
Plantagolanceolata
20
Poaceae
1
Rumexacetosa/R.acetosella
-type
1
Succisa
1
Cuscutaeuro
paea-type
1
Potentilla 5Monolete
psilate
fernsp
ores
1
Polypodiumvulgare
1
Pteridium 1
Sphagnum 1
BvGt5
8 305
316
308
338
344
305
342
312
329
Pollensu
m(A
P-Betula)
712
618
607
769
657
783
629
545
580
Totalp
ollensu
m
Tree
sand
shru
bsH
eath
Ant
hr.i
nd.
Gra
zing
ind.
Fern
sand
mos
ses
NPP
Upl
.her
bsO
ss-Z
even
berg
enBa
rrow
7,ol
dsu
rfac
ean
dso
ds
Figu
re 1
2.13
a
205oss-zevenbergen and surroundings
14 16 18 20 21.5
Depth(cm)
2040
6080
100
AP
NAP
2040
60
Alnus
2040
60
Corylus
1
Fagus
5Pinus
20
Quercus1
Salix
20
Tilia
1
Ulmus
5Betula
5010
015
0
Ericales
1
Asteraceaelig
uli�orae
5Poaceae
1
Caryophyllaceae
1
Polygonum 1
Sparganium 20
Monoletepsil
atefern
spores
5Polypodiumvulgare
1
Sphagnum 1
BvGt5
8 317
317
319
304
313
Pollensu
m(A
P-Betula)
578
419
479
731
690
Totalpollensu
m
Tree
sand
shru
bsH
eath
Upl
.her
bsFe
rnsa
ndm
osse
sA
q.he
rbs
NPP
Gra
z.in
d.O
ss-Z
even
berg
enBa
rrow
7,di
agra
m
Figu
re 1
2.13
b
206 ancestral heaths
Oss-Zevenbergen 7, pollen diagram (see figure 12.13b)
The pollen diagram shows a vegetation development from the period before the barrow was constructed. The arboreal pollen percentage fluctuated between 42% and 77% and at the time the mound was built an arboreal pollen percentage of approximately 55% can be seen, indicating an ADF of approximately 75-100 m. The herbal vegetation is dominated by Ericales, which fluctuates from over 100% to 30%. The arboreal pollen percentages fluctuate some with Alnus (35-50%), Corylus (35-45%), Quercus (5-20%) and Tilia (2-10%) being the main components.
Oss-Zevenbergen 8 (see figure 12.14)
The arboreal pollen percentage fluctuates between 35 and 60%, indicating a fluctuating size of the open space with an ADF of 50-250 m. Percentages of Ericales fluctuate between 65-180%. Other herbal species show only low pollen percentages, indicating the presence of a species-poor heathland. The arboreal pollen component is dominated by Alnus, which seems to increase from about 25% to 45-50%. Corylus is fluctuating between 35-45%. Percentages of Quercus (5-15%) and Tilia (0.5-10%) show a slight decline. Remarkable is the high percentage of Betula in the oldest sample, while Betula pollen only occurs in low amounts in all other pollen spectra from all mounds. Perhaps a Betula tree was standing nearby.
Oss-Zevenbergen 12 (see figure 12.15)
The pollen spectrum derived from the ditch that remained from barrow 12 shows an AP of approximately 50% (ADF is around 100 m). Alnus (ca. 60%) and Corylus (ca. 30%) are the main components of this arboreal pollen percentage, while Ericales is the dominating herb (ca. 80%).
Post alignment 1 (see figure 12.15)
The pollen spectrum from one of the posts from the post alignment shows an arboreal pollen percentage of 40%. The main trees are Alnus and Corylus with a pollen percentage of 45%. Herbs are dominated by Ericales with a percentage of 150%.
Drift-sand layer (see figure 12.15)
The pollen spectrum from underneath the drift-sand layer shows an arboreal pollen percentage of 45%. Alnus (ca. 55%) and Corylus (ca. 35%) are the main trees, while Ericales (ca. 120%) pollen dominates the herbal vegetation.
Size of the open space
The minimum size of the open spaces can be estimated by the measurements of the barrows and the height of the sods that had been used in the construction of the mounds (see section 7.1 and table 12.2). This leads to the following estimates of sod-cut area:
Chieftain’s Grave: 11036 m2, ropenarea≈59 m, based on a circular open spotOss-Zevenbergen 1: 442 m2, ropenarea≈12 mOss-Zevenbergen 2: 284 m2, ropenarea≈9.5 mOss-Zevenbergen 3: 24504 m2, ropenarea≈28 m
Based on the ratio AP versus NAP of the old surfaces the open spaces the barrows were built in had an ADF of 50-150 m. The sizes of the open spaces will be discussed more in detail in section 12.1.3.
12.1.3�Discussion
The barrow landscape
Middle Bronze Age (Oss-Zevenbergen 2, 4 & 8)
The oldest group of barrows at Oss-Zevenbergen that was sampled for pollen analysis (Barrow 2: sods and old surface period1&2; Barrow 4: period2; Barrow 8: Ah, sods) shows that the mounds were built in species-poor heathland. Based on the similarity of the pollen spectra from the sods and the old surface, the sods that were used to build the barrows were probably cut in the near surroundings of the barrow location. Since the barrows were located close together they were probably constructed in one open space with an ADF of about 25-100 m, based on arboreal pollen percentages of 50-70%. The forest in the environment was probably quite open with a high percentage of Corylus at the forest edge. Besides Corylus the forest’s main components were Quercus and some Tilia.
Betula is present in all spectra, which could indicate its presence in the forest or perhaps some individual trees in the heathland area. In the wetter parts of the area most likely alder carr was present. This might have been a few hundred metres north of the barrows, the lowest part in the area based, or at the ‘groundwater seepage wetland areas’ in the area (see figure 12.2).
The Bronze Age ditch of the Chieftain’s Grave shows an arboreal percentage of about 60%, indicating an open place at the Oss-Vorstengraf area with an ADF of approximately 50 m. The barrow was built in heath vegetation with mainly Ericales. The forest in the surroundings is, as expected, comparable to the forest around the Oss-Zevenbergen barrows. The heath in which Barrows 2, 4 and 8 were situated was most likely separate from the heath in which the Bronze Age barrow of the Vorstengraf area is situated. As has been mentioned in 12.1.1, seepage water occurs in between the Oss-Zevenbergen and the Vorstengraf area, causing conditions that were probably too wet for heath vegetation. One heathland area stretching from the Oss-Zevenbergen area to the Vorstengraf area is therefore very unlikely.
Late Bronze Age/Early Iron Age (Oss-Zevenbergen 1&6)
Compared to the Middle Bronze Age not much seems to have changed. Barrows 1 and 6 were built in an open space covered with species-poor heath vegetation. The estimated ADF of the open space was approximately 50-100 m (AP= 45-60%). The composition of the forest seems unchanged with mainly Quercus and Tilia. Corylus was present at the forest edge. Alder carr was present in the lower and wetter parts of the area. The spectrum of barrow 6 might represent a slightly older period than the spectrum of Barrow 1, since Fagus is not present here.
208 ancestral heaths
Oss
Z8_s
od
Oss
Z8_o
s1
Oss
Z8_o
s2
Oss
Z8_E
h_di
tch
Oss
Z8_E
h
Oss
Z8_E
B
Oss
Z8_B
2h
EBA/
MBA
2040
6080
100
AP
NAP
2040
60
Alnus
2040
60
Corylus
1Fagus
1Fraxinus 5Pinus
20
Quercus
Salix
5Tilia
1Ulmus
20
Betula
5010
015
020
0
Ericales
1
Asteraceaetu
buli�orae
1Chenopodiaceae20
Asteraceaelig
uli�orae
5Plantagolanceolata
20
Poaceae
1Rumexacetosa
-type
1Apiaceae 1Caryophyllaceae
5Cyperaceae
1
Jasio
ne
1Potentilla 1Rosa
ceae 1
Monoletepsil
atefern
spores
1
Monoleteverru
cate
fernsp
ores
1
Polypodiumvulgare
1Sphagnum 1Debarya 1Zygnemataceae
1Indeterminable
327
329
403
309
309
342
192
Pollensu
m(A
P-Betula)
503
682
711
532
908
680
560
Totalpolle
nsum
Tree
sand
shru
bsH
eath
Anth
r.in
d.G
razi
ngin
dica
tors
Upl
and
herb
sFe
rnsa
ndm
osse
sAl
gae
Oss
-Zev
enbe
rgen
Barr
ow 8
Figu
re 1
2.14
. Pol
len
spec
tra
from
the
sam
ples
take
n fr
om O
ss-Z
even
berg
en
barr
ow 8
. Oss
Z8_
Eh ,
Oss
Z8_
EB a
nd O
ssZ
8_B2
h ar
e sa
mpl
es ta
ken
from
th
e pr
ofile
und
erne
ath
the
barr
ow, a
t res
pect
ivel
y 6
cm, 1
0cm
and
14
cm
unde
rnea
th th
e ol
d su
rfac
e. O
ssZ
8_Eh
_ditc
h is
a s
ampl
e ta
ken
from
the
E ho
rizo
n in
the
ditc
h fil
l. S
pect
ra a
re g
iven
in %
bas
ed o
n a
tree
pol
len
sum
m
inus
Bet
ula
polle
n. In
the
tota
l AP
(=ar
bore
al p
olle
n) B
etul
a is
incl
uded
. In
the
tota
l NA
P (=
non
arb
orea
l pol
len)
spo
res
are
incl
uded
, non
pol
len
paly
nom
orph
s ar
e ex
clud
ed. D
iffer
ent s
cale
s ha
ve b
een
used
, ind
icat
ed w
ith
diffe
rent
col
ours
. EBA
= Ea
rly
Bron
ze A
ge, M
BA=
Mid
dle
Bron
ze A
ge.
209oss-zevenbergen and surroundings
Oss
Z_dr
iftsa
nd
Oss
Z_po
st10
1
Oss
Z12_
ditc
h
ME?
EIA
?
EIA
2040
6080
100
AP
NAP
2040
6080
Alnus
2040
60
Corylus
5
Fagus
1
Fraxinus 5Pinus
20
Quercus
1
Salix
5
Tilia
5
Betula
5010
015
020
0
Ericales
1Arte
misia1
Astera
ceaetu
buli�orae
1
Chenopodiaceae
1
Astera
ceaelig
uli�orae
1
Plantagolanceolata
20
Poaceae
1
Rumexacetosa-ty
pe
1
Succisa
1
Potentilla 5Monolete
psilate
fernsp
ores
1
Monoleteverru
catefern
spores
1
Sphagnum 1
Debarya 1
Zygnemataceae
390
313
307
Pollensu
m(A
P-Betula)
905
821
596
Totalp
ollensu
m
Tree
san
dsh
rubs
Hea
thA
nthr
.ind
.G
razi
ngin
d.U
pl.h
erbsFe
rns
and
mos
ses
Alg
aeO
ss-Z
even
berg
enU
rn�e
ld,p
osta
lignm
enta
nddr
iftsa
nd
Figu
re 1
2.15
. Pol
len
spec
tra
from
the
sam
ples
take
n fr
om u
rn fi
eld
barr
ow 1
2,
the
post
hole
filli
ngs,
and
from
the
old
surf
ace
unde
rnea
th th
e dr
ift s
and
laye
r. Sp
ectr
a ar
e gi
ven
in %
bas
ed o
n a
tree
pol
len
sum
min
us B
etul
a po
llen.
In
the
tota
l AP
(=ar
bore
al p
olle
n) B
etul
a is
incl
uded
. In
the
tota
l NA
P (=
non
ar
bore
al p
olle
n) s
pore
s ar
e in
clud
ed, n
on p
olle
n pa
lyno
mor
phs
are
excl
uded
. D
iffer
ent s
cale
s ha
ve b
een
used
, ind
icat
ed w
ith d
iffer
ent c
olou
rs. E
IA=
Earl
y Ir
on A
ge, M
E= M
edie
val P
erio
d.
210 ancestral heaths
Early Iron Age (Hallstatt C) (VG, Oss-Zevenbergen 3 & 7, urnfield)
The younger barrows in the Oss-Zevenbergen area (3, 7) were built in open spaces that were perhaps slightly larger than the older ones were built in (AP=40-60%, ADF≈50-150 m). The composition of the heath vegetation had not changed considerably and it was still poor in species. The forest seemed not to have changed very much, except for Tilia being partly replaced by Fagus. Some differences can be seen between sods belonging to the same barrow. This could be the result of different locations the sods were been taken from. Some sods might have been taken closer to the alder carr than others.
The Chieftain’s Grave, about 500 m to the west, shows a similar picture. It was probably erected at approximately 50-100 m from the forest. Especially an alder carr must have been reasonably close, indicated by high percentages of Alnus.
In addition, the pollen spectrum of the ditch of Barrow 12, belonging to the urnfield near Barrow 3, indicates a vegetation composition as described above.
Two of the Bronze Age barrows (2 and 8) provide information about the landscape before barrow building took place. These spectra show that the open space already existed and that it was covered with heath vegetation before the barrows were built. The forest does not seem to differ greatly from later periods with alder carr in the lower parts of the region and Quercus and Tilia being the main components of the drier forest. However, Tilia seems to have a higher share in the forest at the oldest spectra of Barrows 2 (e.g.� Bh_per1; see figure 12.8) and 8 (e.g.� Eh,�EB and B2h; see figure 12.14). The size of the open space might even have been larger than when the Middle Bronze Age barrows were built, with an ADF up to 200-500 m (AP barrow 2 Bh_per1 and barrow 8 B2h≈30%, see figure 12.8 and section 12.14). A barrow in the Oss-Vorstengraf area that dates to the late Neolithic B period was situated about 200 m southwest of the Chieftain’s Grave (figure 12.1b). Although no palynological data are available from this barrow it can be assumed that this barrow was built in heath vegetation as well, based on palynological data discussed in chapter 8-12, showing that all barrows were built in heath vegetation. This could indicate that all barrows were built in a narrow, but long-stretched heath area with a length of about 1 km that was already present in the Neolithic. However, since the area in between the Vorstengraf area and the Oss-Zevenbergen area probably was very wet due to seepage, it is more likely that there were two separate heath areas. In one heath area the Neolithic barrows of the Vorstengraf area were built, in the other heath area the first barrows of the Oss-Zevenbergen group were built.
Barrow 2 was built on an Umbric Podzol (Dutch classification: Moderpodzol). All other investigated barrows were built on a Carbic Podzol (Dutch classicifation: Humuspodzol). It was suggested by de Kort that the open space in which Barrow 2 was built was created from forest recently, since heath vegetation would have caused degradation of the soil to a Carbic Podzol (de Kort 2009). This could indicate that Barrow 2 was one of the first barrows that was built at Oss-Zevenbergen, before the heath vegetation could change the soil into a Carbic Podzol. However, since the formation of a Carbic Podzol underneath heath vegetation can take 250 years (and most likely takes even a longer period; Andersen 1979), it is not likely that the open space was created very recently or for the intention of building a barrow there.
211oss-zevenbergen and surroundings
What the heath areas were used for prior to the barrow building is not known. Flint artefacts, dating to the Mesolithic, have been found during the excavation campaigns in 2004 and 2007 (van Hoof 2009, 186), suggesting that the area was in use by prehistoric man long before the first barrows were erected. Indications for a settlement have only been found for the Middle Bronze Age south of the burial complex (see figure 12.1b; Fokkens and Jansen 2004, Jansen and van der Linde 2013a, 43-44). It was suggested that part of the area might have been used as an agricultural field, indicated by the brown layer that was present underneath Barrow 4. This can however not be confirmed by pollen analysis (see figure 12.10). All pollen spectra show that a heath vegetation was present that was comparable to that of the barrow period: very poor in species other than Ericaceae. Based on the arboreal pollen percentages the ADF of the open space has probably fluctuated through time before the barrows were built and probably at some point in time, the ADF was larger than when the barrows were built (e.g.�maximum AP= 30%-35% in the pollen spectra Bh_per1 of Barrow 2 and B2h of Barrow 8, indicating an ADF of approximately 250-500 m). The fluctuating size of the open space could have been the result of fluctuating human related activities.
As has been explained in previous chapters, to maintain the heath it was probably managed. Changes in grazing pressure could have caused varying ADF, although grazing indicators are not present in high amounts in the pollen spectra. Particles of charcoal that were found in the soil profiles throughout the entire area could indicate that heath vegetation was regularly burned. The heath could also have been managed by sod-cutting. From the Middle Bronze Age onwards sods were cut in the area for the building of barrows, but it is not known whether sods were already cut in the area before. The anthropogenic activities might even have caused local sand drifting events. A layer of wind-blown sand was revealed underneath Barrow 7, indicating such a period of sand-drifting probably in the Neolithic period. This could have been a direct result of (too extensive) heath maintenance activities in the area. When sods are cut a bare soil is left behind. Possibly in combination with intensive grazing activities vegetation was not able to stabilize the soil and the topsoil could be blown away locally. The Middle Neolithic sand-drifting event recorded at Barrow 7 predates the barrow building activities and it is not known whether sod cutting already took place there at that time. Later events of sand-drifting were recorded in the area as well. For example mound 5 appeared to be a natural hill formed of wind-blown sand. Although the mound has not been dated, the pollen spectra from the old surface underneath the sand suggest that the sand was deposited in the Middle Bronze Age (Fagus is still absent). The activity of barrow building might very well have contributed to this sand drifting event.
Pollen spectra showing the vegetation composition from before the Iron Age barrows were built can be obtained from Barrow 7 and the Chieftain’s Grave. Although the pollen spectra from underneath Barrow 7 and the Chieftain’s Grave have not been dated, the pollen composition of both diagrams suggests that they go back to before the Bronze Age barrows were constructed. The lower parts of the diagrams show relatively high percentages of Tilia, reaching 5-10%. These percentages can also be observed in the older spectra of the soil underneath Barrow 2 (e.g.�Bh_per1) and 8 (e.g. B2s). Bakels and Achterkamp (2013) suggest that the lowest spectra from the soil underneath Barrow 7 date to the Early Bronze Age, which indeed precedes the Middle Bronze Age barrow building. Then Tilia decreases and Fagus increases, probably representing the replacing of Tilia by Fagus.
212 ancestral heaths
The pollen diagrams of Barrow 7 and the Chieftain’s grave both show a fluctuating ADF much like the older barrows. The species-poor heathland areas were probably fluctuating in size and at some point in time larger than when the Hallstatt C barrows were built (minimum AP≈40%, ADF≈150 m).
Post-barrow landscape
What happened to the area after the barrows were built is only partially known. In the Medieval Period the barrow complex of Oss-Zevenbergen was probably used as an execution site. Two inhumation graves dated to the 13th and 14th century cal AD were found dug into Barrow 2 and a 15th century cal AD inhumation grave was found in Barrow 7 (Fontijn�et�al. 2013b, 313). There are no archaeological traces that could indicate what the area was used for before the Late Medieval Period, but the continued pressure by man is indicated by the pollen spectrum from a sample taken underneath a drift sand layer that had covered Barrow 4. This spectrum shows that the open space had increased, possibly by increased grazing and/or burning activities. Layers of wind-blown sand that were found at the flanks of the barrows could have been the result of this increased activity. It is suggested that they are related to the intensive use of roads in the (post) medieval period (van der Linde and Fokkens 2009, 51).
A species-poor heathland area was present on top and at the side of a ridge of cover sand in the Oss-Zevenbergen area, long before the first barrows were built. Two heath areas had probably developed, separated by a due to seepage very wet area. The ADF of the open space at Oss-Zevenbergen was probably fluctuating through time and might have reached a maximum of approximately 500 m already long before the barrows were built, according to the pollen spectra of Barrows 2 and 8 (e.g.�b2:�Bh_per1 and b8: B2h). Grazing and burning activities and possibly sod-cutting were probably involved in maintenance of the heath vegetation and varying pressure in these human related activities might have been responsible for the varying heathland size and perhaps even some local sand drifting when the pressure by grazing, sod-cutting and/or burning became too high.
Some indications for a Middle Bronze Age settlement have been found south of Oss-Zevenbergen (see figure 12.1b) and it can be assumed that the community responsible for heath management activities were settled at this location. Alder carr was present in the lower and wetter areas in the region, probably a few hundred metres to the north of the Oss-Vorstengraf area. The forest in the drier surroundings consisted of mainly Quercus and Tilia with Corylus present at the forest edge. In the Middle Bronze Age barrows (barrow 2, 4 and 8) were built in an open space with Ericaceae as the main vegetation and an ADF of approximately 25-100 m. Since they were located on one of the highest locations in the area the barrows were probably highly visible in the landscape. The heathland had perhaps slightly expanded when the youngest group of barrows was built during the Early Iron Age. Not only were new barrows constructed but also present barrows were re-used. The construction of the very rich Chieftain’s Grave emphasises the importance of this grave field. At this time the forest had undergone some slight changes and Fagus had partly replaced Tilia. After this period the area was probably kept in use for grazing. There are no indications that the area had been used as settlement area or for other activities like crop cultivation. All this time the barrows must have occupied a prominent place in the landscape while situated on a relatively high location with the vegetation kept low by management activities.
213oss-zevenbergen and surroundings
12.2 Vorssel
Close to Heesch a group of six barrows is located called the Vorssel. One of these barrows was palynologically investigated by de Kort in 2005 after it was reported disturbed (de Kort 2005).
12.2.1�Site�description�and�sample�locations
Mound 2 of the barrow complex was built from sods on top of a Carbic Podzol (Dutch classification: Humuspodzol). The mound has not been dated. Two other barrows in the complex contained Drakenstein urns, dating them to the Bronze Age. Samples were taken from the old surface and from one of the sods of arrow 2. Two samples were prepared and analysed described by the methods Chapter 4.
12.2.2�Results�and�discussion
See figure 12.16
The barrow was built in an open space with an ADF of about 50-100 m (AP≈55%) covered with heath vegetation. There were only few other herbs besides Ericales present amongst which some grasses. The dry forest in the surroundings consisted mainly of Quercus and Tilia with Corylus at the forest edge. Alder carr was present in the wetter parts of the region and the main contributor to the arboreal pollen component.
12.3 Slabroek
A grave field that is located at Uden-Slabroekse heide (see figure 12.1) has been partially excavated in 1923 by Remouchamps (Remouchamps 1924, Jansen and Louwen in prep.). After the excavation the area has been partially used for crop cultivation until 2003, when it was bought by Staatsbosbeheer to turn it into a nature reserve area. The grave complex was supposed to form part of the area. It was supposed to be presented and to be visible to the public as an archaeological monument and as such to contribute to the cultural tourism. The area was therefore archaeologically investigated in 2005 (prospectively) and excavated in 2010 (van Wijk and Jansen 2005, Jansen and Louwen in prep.). Several samples for pollen analysis have been taken and analysed.
12.3.1�Site�description�and�sample�locations
The area is centrally located on the plateau of the Peel Blok, about 4 km south of the Oss-Zevenbergen complex (see section 12.1.1). The urn field is located on a ridge of cover sand. The size of the complex is unknown, but based on present knowledge it should at least have been 250 by 200 m. The soil is classified as a Carbic Podzol (Dutch classification: Haarpodzol). During the Medieval Period the area was covered with heath vegetation until it was used for crop cultivation between the early 20th century and 2003 (see previous section).
The area was first excavated in 1923. At that time 38 burial mounds were discovered. Most of them were built of sods and they were all surrounded by a ditch. In many of the barrows urns were found that were usually placed on the old surface (some were dug into the old surface) before they were covered with a barrow.
In 2005 and 2010 the area was re-investigated. The area was highly disturbed by the cultivation activities during the last century and in 2005 the remains of only 10 of the 38 monuments recorded by Remouchamps were rediscovered. On the other hand, 26 ‘new’ ring ditches and the remains of two burial mounds were
Vors
sel_
os
Vors
sel_
sod
Unk
now
n
2040
6080
100
AP
NAP
2040
60
Alnus
2040
60
Corylus
1
Fagus
1
Fraxinus 5Pinus
20
Quercus
5
Tilia
1
Ulmus
20
Betula
2040
6080
100
Ericales
1
Asterace
aetubuli�
orae
20
Poaceae
5
Rumexacetosa-ty
pe1
Succisa1
Apiaceae 1
Cyperaceae
1
Potentilla 1
Monoletepsil
atefern
spores
1
Polypodiumvulgare
1
Zygnemataceae
417
317
Pollensu
m(A
P-Betula)
749
626
Totalpolle
nsum
Tree
san
dsh
rubs
Hea
thAn
thr.
ind.
Upl
and
herb
sFe
rns
Alga
eG
raz.
ind.
Vors
sel
Figu
re 1
2.16
. Pol
len
spec
tra
from
the
sam
ples
take
n fr
om th
e V
orss
el b
arro
w.
Spec
tra
are
give
n in
% b
ased
on
a tr
ee
polle
n su
m m
inus
Bet
ula
polle
n. In
the
tota
l A
P (=
arbo
real
pol
len)
Bet
ula
is in
clud
ed. I
n th
e to
tal N
AP
(= n
on a
rbor
eal p
olle
n) s
pore
s ar
e in
clud
ed, n
on p
olle
n pa
lyno
mor
phs
are
excl
uded
. Diff
eren
t sca
les
have
bee
n us
ed,
indi
cate
d w
ith d
iffer
ent c
olou
rs.
214 ancestral heaths
found (van Mourik 2005, 43). The excavation campaign in 2005 revealed that the preservation of all archaeological features was very poor. To document all traces an area of almost two hectares was completely excavated in 2010, when all archaeological features were excavated and recorded. Several ‘new’ burial monuments were discovered in 2010, amongst which a rich Iron Age inhumation grave and several burials from the Roman Period. This excavation revealed that the cemetery must originally have existed of more than hundred burial monuments and probably has been in use from the Bronze Age until the Roman Period (Jansen and Louwen in prep.). From all the burial monuments and features found during the excavations in 2005 and 2010 several samples for pollen analysis have been taken and analysed of which the details will be described below.
Slabroek 39 and 40
In 2005 the remains of two burial mounds were excavated, Slabroek 39 and 40. Slabroek 39 appeared to be a barrow with a diameter of about 30 m and a height of about 50-60 cm. The burial mound was built of sods that had an average length of 50 cm and were between 7 and 29 cm thick. The central grave was looted. The base of the barrow was dated by OSL to the Middle Bronze Age (1765-1500 cal BC; van Mourik 2005). Samples for pollen analysis were taken and analysed by de Kort and van Mourik. De Kort analysed a sample from a sod and a sample from the old surface underneath the mound (de Kort and van Mourik 2005). Van Mourik analysed a sample from the old surface and two samples were taken respectively 5 and 10 cm below the old surface underneath the mound (de Kort and van Mourik 2005).
Slabroek 40 was heavily disturbed and only 10 cm of its original height had been preserved. It could still be observed that the barrow was built of sods and was surrounded by a ditch with a diameter of 12 m. Three samples were taken from this ditch by de Kort of which two were analysed for pollen: one sample from the base of the primary ditch fill and one sample from the B horizon that had developed in the ditch fill (see figure 12.17; de Kort and van Mourik 2005).
Urnfield
During the excavation of 2005, 26 new ring ditches were discovered. At the north of the burial complex three ring ditches were found, of which one, Slabroek ditch 43 (see figure 12.17) the ditch fill has been sampled for pollen analysis by de Kort (de Kort and van Mourik 2005).
In 2010 all discovered ring ditches belonging to the urnfield have been excavated and recorded. Ditch 43 has been sampled for pollen analysis again and in addition samples were taken from Slabroek ditch 12 (see figure 12.17) by the author of this thesis (see also 6.1). Although none of the ring ditches has been dated urnfields are generally assumed to date to the Late Bronze Age/Early Iron Age. The dating of the urn field of Slabroek can probably be further specified to the Early Iron Age, based on the finds of several Early Iron Age pottery by Remouchamps (Remouchamps 1924).
Slabroek ditch 43 and 12
Ditch 43 has a diameter of 13-14 m. De Kort has taken four samples from the northern part of the ditch. Three of these samples have been analysed: one sample from the B horizon that had developed in the ditch fill, one sample from the base
215oss-zevenbergen and surroundings
of the E horizon and one sample from the top of the Eh (de Kort and van Mourik 2005). In 2010 ditch 43 has been sampled for pollen again, but this time samples were taken from the southern part of the ditch (referred to as ditch 43A).
Ditch 12 has a diameter of 7 m. This ring ditch had already been discovered by Remouchamps in 1923, who found an urn that was most likely filled with cremation remains19. From the section of the ditch fill of both ditches 43 and 12 samples were taken from the top to the bottom every cm downwards. Samples from the bottom of the fill have been analysed since it has been argued that samples from the bottom of the ditch fill will probably provide the most reliable information about the period that is closest to the period the ditch was dug (see for argumentation 4.1.4).
Ditch ‘landweer’
At the western part of the burial complex a 340 m long ditch was discovered in 2005 that was partially filled with sods. The ditch was probably part of a Late Medieval defence system called ‘landweer’ generally dating to around 1400 cal AD. Three samples were taken for pollen analysis by de Kort. One sample from the bottom of the primary fill and one sample from bottom of the secondary fill were analysed (de Kort and van Mourik 2005).
12.3.2�Results�and�discussion
All pollen spectra (fig 12.18) show heath vegetation with mainly Ericales (most likely Calluna as has been found in the urnfield ditches 12 and 43) and some grasses. Through time, the heath area varied in size and was probably smallest at the time (Middle Bronze Age) barrow 39 was built with an ADF of approximately 50 m (AP=60%). The heath expanded in the following period when several ditches were dug in the area during the Early Iron Age, although ditch 12 seemed to have been dug closer to the forest. The heath was probably larger than in the period the ditch of the landweer was dug. AP was only 10-30% in the samples from the B-horizon in that ditch. The pollen spectra are in agreement with the Late Medieval dating suggested by the excavators (see section 12.3.1). This is indicated by the relatively high percentage of Secale, which was not commonly introduced in the Netherlands before the Roman Period (van Zeist 1976, Behre 1992). The find of this species and some other Cerealia indicate that crop cultivation took place nearby. There are no indications that this was also the case in the earlier periods, when the Iron Age ditches and the Middle Bronze Age barrow were created. Some anthropogenic indicators were found, but only in very low numbers.
During the entire period represented by the samples the forest composition did not seem to change much. Alder carr was present in the surroundings on the lower and wetter locations (probably west of the area, see figure 12.1b). Corylus and Quercus dominated the forest on the higher and drier areas. Betula might have been part of the forest or have been present in the heathland area as individual trees. Although not all pollen spectra can be placed exactly in time, it is likely that the area was covered with heath vegetation for centuries and that the area must have been kept open to maintain this heath vegetation.
19 Cremation remains were not considered interesting at that time and were often discarded.
216 ancestral heaths
25 m
Excavation 1923
Trenches 2005
Excavation 2010
Ring ditch
Barrow without surrounding features
Possible burial monument
Grave ‘Prince(ss) of the Maashorst
Urn
Cremation remains
Posts
Ditch landweer
Middle/ Late Bronze Age
Early Iron Age
Middle Iron Age
Roman Period
barrow 40
barrow 39
ditch 43
ditch 12
Pollen samples 2005
Pollen samples 2010
0
Figure 12.17. Locations of the samples taken at Slabroek. Figure after Jansen and Louwen (in prep.).
217oss-zevenbergen and surroundings
Slab
roek
_Ditc
h'la
ndw
eer'_
topB
/Ch
Slab
roek
_Ditc
h'la
ndw
eer'_
_bas
eB/C
h
Slab
roek
_Ditc
h12_
base
32-3
1cm
Slab
roek
_Ditc
h12_
base
35-3
2cm
Slab
roek
_Ditc
h43_
base
45-4
4cm
Slab
roek
_Ditc
h43_
base
49-4
8cm
Slab
roek
_Ditc
h43_
TopE
h/A
h
Slab
roek
_Ditc
h43_
Eh
Slab
roek
_Ditc
h43_
Bh
Slab
roek
39_s
od
Slab
roek
39_o
s
Slab
roek
40_B
h_di
tch�
ll
Slab
roek
40_b
ase_
ditc
h�ll
1400
calA
D
EIA
MBA
Unk
now
n
2040
6080
100
AP
NAP
2040
6080
Alnus
1Carpinus 2040
60
Corylus
20
Fagus
1
Fraxinus
20
Pinus
20
Quercus
12
Salix
5Tilia
5Ulmus
20
Betula
500
1000
1500
Ericale
s5Arte
misia 5Aste
raceae
tubuli�
orae
20
Cerealia-ty
pe 5Chenopodiaceae
20
Secale
5Asterac
eaelig
uli�orae
1Plantagolanceolata
2040
Poaceae
20
Rumexacetosa-type
5Succisa
Tree
san
dsh
rubs
Hea
thA
nthr
opog
enic
indi
cato
rsG
razi
ngin
dica
tors
5Apiaceae 1Bra
ssicacea
e
1
Caryophylla
ceae
1Cuscutaeuropaea-ty
pe
5Cyperaceae 1
Knautia
5Polygonumav
iculare
1Rosacea
e 1
Scabiosa 1Spergular
ia-type
5Monoletepsila
tefern
spore
s
1Monoleteverru
catefern
spores
1Polypodiumvulgare
1Trilete
spores
5Sphagnum 1
Debarya 5Zygnematac
eae
91 285
361
412
407
327
326
356
326
358
340
334
324
Pollensu
m(A
P-Betula)
1175
1066 74
1
707
1081
1349
1305
1357
1037 75
5
587
826
956
Totalpolle
nsum
Upl
and
herb
sFe
rns
and
mos
ses
Alg
ae
Slab
roek
Figu
re 1
2.18
. Pol
len
spec
tra
from
the
sam
ples
take
n at
Sla
broe
k. S
pect
ra a
re
give
n in
% b
ased
on
a tr
ee p
olle
n su
m
min
us B
etul
a po
llen.
In th
e to
tal A
P (=
arbo
real
pol
len)
Bet
ula
is in
clud
ed.
In th
e to
tal N
AP
(= n
on a
rbor
eal
polle
n) s
pore
s ar
e in
clud
ed, n
on p
olle
n pa
lyno
mor
phs
are
excl
uded
. Diff
eren
t sc
ales
hav
e be
en u
sed,
indi
cate
d w
ith
diffe
rent
col
ours
.
218 ancestral heaths
12.4 Schaijk
12.4.1�Site�description�and�sample�locations
Near Schaijk five barrows were excavated in 1937 by van Giffen (van Giffen 1949). The old surface of one of these barrows (Tumulus 3) was sampled and analysed for pollen by Waterbolk (van Giffen 1949, Waterbolk 1954). This barrow has not been dated.
12.4.2�Results�and�discussion
See figure 12.19
The barrow was built in an extensive heath area with an ADF that could have reached approximately 500 m (AP≈25%). Other herbs besides heath were practically absent. The forest in the surroundings was dominated by alder carr in the wetter regions. The drier regions were covered with mainly Tilia, Quercus and Betula with Corylus present numerously at the forest edge.
12.5 Palynological results from palaeosoils, peat and lake sediments
In the environment of the Slabroekse heide van Mourik has palynologically investigated several palaeosols (fossilized soils), peat and lake sediments (see figure 12.1; van Mourik et�al. 2012b). In addition he applied OSL-dating to these soils and sediments and in combination with 14C-dating he could make a reconstruction of the evolution of agricultural soils and land forms in the area. The data of his results will be used by the author to make a regional vegetation reconstruction of the area around Oss-Zevenbergen from around 4700 cal BC.
12.5.1�Site�description�and�sample�locations
Schaijksche heide
The Schaijksche heide is a former heath area that was used for sod cutting in the 12th and 13th century AD. The most part of the area has been planted with pine forest in the early 20th century, which is the main vegetation at present times. It is located approximately 5.5 km southeast of Oss-Zevenbergen and about 2.5 km northeast of the urnfield of Slabroek (see figure 12.1). The profile that was sampled for pollen analysis consists of a podzol, developed in wind-blown sand, which was deposited on top of a podzol developed in cover sand. The wind-blown sand deposits were dated to around 4700 BC by OSL (three OSL dates were determined: 4790 ± 308 BC, 4666 ± 377 BC, 4684 ± 337 BC). Samples for pollen analysis were taken at 5 cm interval (van Mourik 1985).
Sint Annabos
Sint Annabos is a wetland nature reserve that used to be an extensive alder carr. It is situated about 7 km south of Oss-Zevenbergen and about 3.5 km southwest of the urnfield of Slabroek (see figure 12.1). Peat formation has taken place in the area, which started between 4710 and 4530 cal BC. The profile that was sampled for pollen consisted of three layers. The 2A layer developed in cover sand; the H2 and H1 horizons consisted of peat. The H2 layer consisted of humified
Scha
ijk
2040
6080
100
AP
NAP
2040
Alnus
1
Carpinus
20
Corylus
5Fagus
5Pinus
5Quercus
20
Tilia
510
Betula
100
200
300
400
Ericaceae
5Cerealia
5Poaceae 5Succisa
5Varia
1Sphagnum
126
Pollensu
m(A
P-Betula)
578
Totalpolle
nsum
Tree
sand
shru
bsH
eath
Ant
hr.i
nd.
Gra
z.in
d.
Upl
.her
bs Aq.
mos
ses
Scha
ijkFi
gure
12.
19. P
olle
n sp
ectr
um fr
om th
e sa
mpl
e ta
ken
the
Scha
ijk b
arro
w. T
he s
pect
rum
is g
iven
in %
bas
ed
on a
tree
pol
len
sum
min
us B
etul
a po
llen.
In th
e to
tal
AP
(=ar
bore
al p
olle
n) B
etul
a is
incl
uded
. In
the
tota
l N
AP
(= n
on a
rbor
eal p
olle
n) s
pore
s ar
e in
clud
ed, n
on
polle
n pa
lyno
mor
phs
are
excl
uded
. Diff
eren
t sca
les
have
be
en u
sed,
indi
cate
d w
ith d
iffer
ent c
olou
rs.
219oss-zevenbergen and surroundings
organic plant remains and the H1 horizon consisted of humified plant remains with blown in mineral grains (see figure 12.21,). Samples were taken every 5 cm (van Mourik 1987).
Venloop
The Venloop is a stream valley where peat formation had taken place on top of a mineral soil (cover sand). Most of the peat had disappeared due to drainage of the area. At some locations the peat was preserved and one of these locations was sampled for pollen analysis (van Mourik and Pet 2001). Samples were taken every 5 cm. According to the 14C-dating peat formation started between 750 and 410 cal BC. The sampled profile was situated approximately 5 km southwest of Oss-Zevenbergen and 1 km southwest of the urnfield of Slabroek (see figure 12.1).
12.5.2�Results�and�discussion
See figure 12.20-12.22
At the Schaijksche heide, about 3 km west of the Slabroekse heide, a deciduous forest developed after the wind-blown sand event of around 4700 cal BC. This forest was dominated by Corylus and Quercus. Some Alnus was present in the environment, but probably not in the form of the extended alder carrs that were recorded in the barrow pollen spectra. Heath was already present in considerable amounts. Around 4700 cal BC a short period of sand drifting occurred. Very interesting is to realise that such early events of sand drifting have also been recorded in the Laarder Wasmeren area (see 10.2) and as has been discussed in Chapter 10, this might indicate an over-exploitation of the soil. The cause of the sand drifting can however not be deduced from the pollen data. Sand drifting might have been a local event; it has not been recorded at St Annabos, which is located about 5.5 km southwest of Schaijksche heide. At the time peat started to accumulate (between 4710 and 4539 cal BC) at St Annabos a birch carr (cf.�high percentages of Betula) was present, which probably evolved into an alder carr. The development of an alder carr is probably reflected in the pollen diagram of Schaijksche heide as well, shown by an increase in Alnus pollen. Also at the Venloop, approximately 2.5 km southwest of Schaijksche heide and 1 km south of Slabroekse heide alder carr was dominating the local vegetation when peat accumulation started between 750 and 410 cal BC.
The extensive heath areas that must have been present from the Late Neolithic onwards according to the barrow pollen spectra have not been recorded in the peat diagram of St Annabos as such. This confirms that peat diagrams are not suitable for a total landscape reconstruction, as has already been subject of discussion in section 6.1. Expansion of heath is not recorded before deforestation started accompanied by an expansion of grasses and some Cerealia, shown by all three diagrams. The appearance of Fagopyrum in the diagrams of Venloop and St Annabos indicates that the vegetation development of the area is recorded at least until far into the Medieval period.
12.6 Summary: the barrow landscape of Oss-Zevenbergen and surroundings
The barrow landscape of Oss-Zevenbergen and surroundings is, like the barrow landscapes discussed in the previous chapters, a landscape dominated by open spaces with heath vegetation.
220 ancestral heaths
When and how these heath areas came into existence is not known, but an anthropogenic origin is indicated. Heath vegetation was probably part of the landscape already long before the first barrows were built, as has been recorded for instance in the pollen diagram of the Schaijksche heide. The area might even have been intensively exploited, causing sand-drifting as early as around 4700 cal BC. Such early sand-drifting is also known for the Laarder Wasmeren area (see section 10.2) and is remarkable for this period, since man-caused sand-drifting was assumed to have started not before the Early Middle Ages (Castel�et�al. 1989, Riksen�et�al. 2006). Heath was able to regenerate at the Schaijksche heide and it is likely that heath was also present at other locations in the area. This is at least the case for the Early and Middle Bronze Age period when several barrows were constructed. It is not known whether the heath at the burial complexes around Oss-Zevenbergen originated from the same early period as at the Schaijksche heide, but heath was probably present at that location since the Late Neolithic, when the first barrows were built. This heath area remained until at least the Iron Age, when the Hallstatt C barrows were created. At that time, when the burial complexes of Oss-Zevenbergen and Oss-Vorstengraf were at their most extensive size, an extensive heath area must have been present.
To conclude, heath was present in the area for thousands of years. To maintain such areas heath management must have taken place, which probably involved grazing and burning. Other human activities were hardly recorded in the area. It is not exactly clear where people lived and where they cultivated their crops. Indications for crop cultivation have hardly been found in the barrow pollen spectra, so it is not very likely that crop cultivation took place close to the burial complexes.
Forest was also part of the barrow landscape. Before the barrows were built, at the time of the sand-drifting (around 4700 cal BC), forest mainly consisted of Quercus and Corylus,�with birch carr in the wetter surroundings. Alder brook was starting to expand at the wetter areas like Sint Annabos. At the time the barrows were built extensive alder carrs were present as has been shown by the high amounts of Alnus pollen in all the pollen spectra. These alder carrs could most likely be found at locations like Sint Annabos and Venloop. In the dry forest dominating trees were now Quercus and Tilia with high amounts of Corylus at the forest edge.
Figure 12.20. Pollen diagram from the Schaijkse Heide. Redrawn from the pollen diagram of van Mourik et al. (2012b, figure 9). A percentage diagram is shown, with % based on a total tree pollen sum.
221oss-zevenbergen and surroundings
Figu
re 1
2.21
. Pol
len
diag
ram
from
St A
nnab
os.
Red
raw
n fr
om th
e po
llen
diag
ram
of v
an M
ouri
k (1
987,
figu
re 6
). A
per
cent
age
diag
ram
is s
how
n,
with
% b
ased
on
tota
l tre
e po
llen
sum
.
222 ancestral heaths
Figu
re 1
2.22
. Pol
len
diag
ram
from
the
Venl
oop.
Red
raw
n fr
om th
e po
llen
diag
ram
of v
an M
ouri
k et
al.
(201
2b, fi
gure
5).
A p
erce
ntag
e di
agra
m is
sho
wn,
with
% b
ased
on
tota
l tre
e po
llen
sum
.
223oss-zevenbergen and surroundings
In conclusion, the barrow landscape of Oss-Zevenbergen and surroundings was a managed landscape of heath areas that could be quite extended, surrounded by Corylus, Quercus and Tilia forest at the drier regions and alder carr in the brook valleys. Part of this managed landscape had its origin probably thousands of years before the first barrows became part of it (in the fifth millennium, see section 12.5). The barrow landscape existed as such for at least several centuries and seems to have been a very stable element in the landscape.
Table 12.2. The minimum size of the open space per barrow based on the sods used to build the barrows.
225ancestral heaths: understanding the barrow landscape
Chapter�13
Ancestral heaths: understanding the barrow landscape
In Chapter 8-12 several case-studies have been described and discussed. In this chapter these chapters will be summarized and interpreted in relation to the role of barrows in the landscape.
In Chapters 8-12, 97 barrows and 11 urnfield barrows have been discussed in 5 regions on the Pleistocene soils in the central and southern Netherlands. It was concluded that all barrows were built in open spaces that were covered with heath vegetation. Barrows were built in open spaces that varied in size from small, with an average distance to the forest (ADF) of 50-100 m, to rather large (ADF=300-500 m), although the latter were only been found in the relatively young Middle-Late Iron Age barrows of the Echoput. Besides the barrows that were discussed in the case-studies (Chapters 8-12) palynological data are known from 21 more barrows in the central and southern Netherlands (see Appendix I) which show that these barrows too, were built in heaths. Nevertheless, palynological data are only available for a small part of the barrows that are still present in the Netherlands. As has been shown in figures 3.1, 8.1b, 9.1b, 10.1b, 11.1b-d and 12.1b there are numerous barrows in the investigated regions. Bourgeois suggests that only a fraction of the barrows has been preserved, and that the original number of barrows in the Netherlands was higher (Bourgeois 2013, 40). All investigated barrows were built in heath vegetation and it is therefore probable that the non-investigated barrows on the Pleistocene coversand areas in the Netherlands were built in a setting featuring heath vegetation as well. As a consequence, the Dutch barrow landscape must have been dominated by patches of heathland. The open spaces seem to be small, however, and this in itself could be misleading. Many barrows are often situated close to other barrows and sometimes forming long alignments. It is therefore likely that many barrows were not built in their own small patch of heathland, but clustered in larger open spaces that were long and narrow. This has already been found to be the case for the oldest barrows. For example at Renkum (Chapter 9) a long alignment of barrows can be seen. Not all barrows in this alignment have been dated, at least 12 barrows can be placed in the late Neolithic A period. Assuming that these barrows were all built in heath vegetation, as has been demonstrated for four of them, it is likely that the open spaces were connected to each other, forming a long-stretched heathland area with a length of about 4.5 km (see figure 13.1a-c). These long-stretched heath areas could possibly be seen as corridors in the landscape, although this research has only focussed on the barrow landscape and not on the greater landscape. Other examples of this barrow alignment can also be seen at Vaassen-Nierssen (Chapter 8, see figure
226 ancestral heaths
Figure 13.1a-b. Barrow alignment of Renkum at two consecutive phases Late Neolithic A and Late Neolithic B. The modeled heath area around each barrow is indicated. Based on digital elevation model of the AHN (copyright www.ahn.nl). Figure after Doorenbosch (2013), figure 11.a-b. Figure by Q. Bourgeois and M. Doorenbosch.
60 m
0 m
m NAP
0 1000 2000 m
Unexcavated or undated mounds
LN A barrows
Modelled heath area
227ancestral heaths: understanding the barrow landscape
Figure 13.1b.
60 m
0 m
m NAP
Modelled heath area
Unexcavated or undated mounds
Older barrows
LN B barrows
LN A or B barrows
0 1000 2000 m
228 ancestral heaths
Figure 13.1c. Barrow alignment of Renkum, situated in a (hypothetical) long-stretched heath area surrounded by forest. The vegetation reconstruction is based on palynological data from barrows. An exact reconstruction of the forest area is therefore not possible (indicated by the question mark), since barrows are not present in those areas. The figure is based on digital elevation model of the AHN (copyright www.ahn.nl).
0 1000 2000 m
?
Modelled heath area
Unexcavated or undated mounds
Older barrows
LN B barrows
LN A or B barrows
Modelled forest area
229ancestral heaths: understanding the barrow landscape
Figure 13.2a-b. Barrow alignments of Vaassen-Niersen at two consecutive phases Late Neolithic A and Late Neolithic B. The modeled heath area around each barrow is indicated. Based on digital elevation model of the AHN (copyright www.ahn.nl). Figure after Doorenbosch (2013), figure 10.a-b. Figure by Q. Bourgeois and M. Doorenbosch.
80 m
0 m
m NAP
0 1000 2000 m
Unexcavated or undated mounds
LN A barrows
Modelled heath area
230 ancestral heaths
13.2a-c), Toterfout-Halve Mijl (Chapter 11) and Oss-Zevenbergen (Chapter 12). The formation of barrow alignments have been extensively investigated and discussed by Bourgeois (2013). He has found many other examples of barrow alignments, indicating that this was a fairly common way to spatially order burial mounds in the barrow landscape. Not all barrows, however, were built into such alignments. Alignments were mainly a feature of barrows constructed during the Late Neolithic A, while from the Late Neolithic B onwards barrows are also found outside the alignments at presumably more random places in the landscape (Bourgeois 2013). These dispersed barrows were built in heath as well as has been shown at for example Toterfout-Halve Mijl (Chapter 11). Altogether, the barrow landscape must have been dominated by patches of heath, which all contained one or more barrows, and which were possibly often connected to each other, forming corridors in the landscape.
Figure 13.2b. Barrow alignment of Vaassen-Niersen during the late Neolithic B.
80 m
0 m
m NAP
Modelled heath area
Unexcavated or undated mounds
Older barrows
0 1000 2000 m
LN B barrows
LN A or B barrows
80 m
0 m
m NAP
Modelled heath area
Unexcavated or undated mounds
Older barrows
0 1000 2000 m
LN B barrows
LN A or B barrows
231ancestral heaths: understanding the barrow landscape
Although dominated by heath, forest was also part of the barrow landscape. This forest can be divided into two main components. In the lower and wetter parts of the area extensive alder carrs could be found. At the drier locations a mixed oak forest was present. This forest was probably fairly open and consisted mainly of Quercus. Tilia was part of the forest as well, especially during the Neolithic and Bronze Age. Fagus appeared later. Fagus could be noticed in the Bronze Age period at Toterfout-Halve Mijl. It had partially replaced Tilia in the Iron Age period as shown at the Echoput barrows (chapter 8) and at Oss-Zevenbergen (chapter 12). Corylus, a light demanding tree, was dominant close to the barrows and profusely growing at the edge of this forest.
Figure 13.2c. Barrow alignments of Vaassen-Niersen, situated in a (hypothetical) long-stretched heath area surrounded by forest. The vegetation reconstruction is based on palynological data from barrows. An exact reconstruction of the forest area is therefore not possible (indicated by the question mark), since barrows are not present in those areas. The figure is based on digital elevation model of the AHN (copyright www.ahn.nl).
Modelled heath area
Unexcavated or undated mounds
Older barrows
LN B barrows
0 1000 2000 m
LN A or B barrows
?
Modelled forest area
232 ancestral heaths
As has been explained in Chapter 2 it was previously thought that differences in barrow landscapes were culturally linked (Waterbolk 1954, van Zeist 1967a). Casparie and Groenman-van Waateringe already concluded that this assumption could not be true and that differences between sites were caused by differences in soil type and hydrology (Casparie and Groenman-van Waateringe 1980). They emphasized the uniformity of the barrow landscape for all barrows. This uniformity has been confirmed by this research, where (part of ) the data collected by Casparie and Groenman-van Waateringe have been supplemented and re-interpreted.
A mosaic managed heath open-forest passage landscape
As has been extensively discussed in Chapters 8-12 the heath vegetation the barrows were built in must have been managed to persist. Management activities could involve grazing (or mowing), burning and/or sod-cutting (Stortelder�et�al. 1996, 287). Indications for large scale sod-cutting have not been found, but sod-cutting must certainly have taken place as sods were used as construction material for the burial mounds and could therefore have contributed in the maintenance of the heath vegetation. Grazing has been indicated in most of the case-studies. During the Neolithic, prehistoric man in the Netherlands switched from hunter-gatherer to farming activities, including crop cultivation and animal husbandry. Faunal evidence from shows that the livestock of farming communities mainly consisted of cattle and sheep (Fokkens 2005a, 409, 427; Brinkkemper and van Wijngaarden-Bakker 2005, 493). The heath in the barrow landscape was consequently most likely being grazed by these animals (see figure 13.3a-b). The number of livestock belonging to late Neolithic farming communities has not been estimated, but for the Middle Bronze Age B has been suggested that a livestock of up to 30 animals could be kept per household. It has been suggested that these animals were mainly grazing at natural pasture areas in the stream valleys (IJzereef 1981, Fokkens 1991, 2005a).
Another possibility is that they were grazing the barrow heath areas. To maintain a heath area about 1 sheep per hectare and/or 1 head of cattle per 5-6 hectare is required. The heath area around a barrow with an estimated ADF of about 100 m could be simplified to a (hypothetical) circular patch of heath with an estimated radius of 100 m, indicating an area of about 3 ha. Each barrow requires then about 3 sheep or 0.5 head of cattle to maintain this heath area. It
Figure 13.3a-b. 13.1a: Grazing sheep at the Tafelbergheide, a heatland area near Huizen (the Netherlands). 13.1b: Grazing cattle at the Zuiderheide, a heathland area near Laren (the Netherlands).
233ancestral heaths: understanding the barrow landscape
has been estimated that in the area of Ermelo 52 barrows were built in the Late Neolithic A, 26 barrows in the Late Neolithic B, 7 barrows in the Early Bronze Age and 48 barrows in the Middle Bronze Age. This assumes that in total about 134 barrows were present at Ermelo in the Middle Bronze Age (Bourgeois 2013, table 8.1, p. 178). Assuming that all barrows were situated in heath vegetation in the Middle Bronze Age, this implies a total estimated heath area of about 420 ha. To maintain such a heath area about 420 sheep are required and/or 70 head of cattle. Alternatively, when assumed that one household kept 20 head of cattle and 10 sheep, 3-4 households were able to maintain the heath. When the average ADF in an area for each barrow is 250 m, around 2630 ha of heathland should be maintained, requiring 20 households with each 20 head of cattle and 10 sheep. This implies that several households, forming heath communities, must have worked together to maintain the heathland.
Grazing in relation to the barrow landscape is also mentioned in barrow research from for other regions in Europe. Andersen showed that barrows in West Jutland (Denmark) were built in open places that were used as pasture (Andersen 1996-97). The oldest barrows (3500-3300 cal BC) were built in open places in birch woodland that was grazed and from the Early Middle Neolithic barrows (3300-3100 cal BC) onwards they were often built in heathland that served as pasture. Bunting and Tipping concluded for a Middle Bronze Age barrow cemetery (1500-900 cal BC) in Orkney (Scotland) that the burial mounds were constructed on pasture land (Bunting and Tipping 2001).
Burning is the third heath management method. Indications for burning have only been found in a few case-studies in this research by the recording of charcoal that was probably not just related to the burial itself. At the Echoput and Oss-Zevenbergen for example (chapter 8.1 and 12) small fragments of charcoal were found throughout the entire profile underneath the barrows. Karg showed for a barrow in Western Jutland (Denmark) dating to the 14th century cal BC that it was built in a heathland where burning had taken place. In addition the heathland had been managed by grazing and sod-cutting (Karg 2008).
It should be noticed that the heath management activities described above, especially grazing, might not have been practiced by prehistoric man with the aim of managing the heath. They might just have been carried out by the barrow builders as part of their daily (agricultural) activities. Managing the heath at the
Figure 13.3b
234 ancestral heaths
same time might just have been incidental. Nevertheless, whether deliberately managed or as an additional consequence of other activities, heath vegetation was a very important if not the most important component of a barrow landscape. To conclude, the barrow landscape must have been a very characteristic landscape. A landscape that could perhaps best be described as a mosaic managed heath open forest-passage landscape.
In five cases it has been shown that this heath vegetation was already present some time before the barrow was built by pollen diagrams derived from the soil profile underneath the barrow (2 barrows at the Echoput, chapter 8.1; Oss-Zevenbergen barrow 2, 7 and 8 and the Chieftain’s Grave, chapter 12.1). In other cases the presence of diverse herbal vegetation suggests that the area must have been open for some time. Otherwise this vegetation would not have had the chance to get established. No indications have been found that the open space was created recently before a barrow was built. Some barrows were built on top of an Umbric Podzol (Dutch classification: Moderpodzol; Echoput, chapter 8.1; Oss-Zevenbergen Barrow 2, Chapter 12), which is common underneath forest vegetation. It has been suggested that this could be an indication that heath vegetation had not been present for a very long time, since underneath heath vegetation eventually a Carbic Podzol (Dutch classification: Humuspodzol) would develop (de Kort 2009). It should be noted that this is only relative to the length of time soil development can take; heath vegetation can transform an Umbric Podzol into a Carbic Podzol in approximately 250 years (Andersen 1979) which is rather long relative to a human life. To conclude, in most cases the open spaces were present well before the construction of the barrow and it is therefore unlikely that they were created specifically for funerary purposes. When, how and why the clearings have been created is unknown. The open spaces might have originally been natural open spaces in the forest (see 2.3.1) and turned into heathland by human influence. They might also have been man-made clearings from the start. It is also not easy to reconstruct what the open spaces have been used for prior to the barrow building. Possible traces of abandoned settlements have been found underneath a barrow in only a few cases (Vaassen, chapter 8.1; Putten, chapter 8.4; Stroe, chapter 8.10) and only in some cases barrows were possibly (although questionable) constructed on former arable land (Toterfout-Halve Mijl barrow 12 and 18, chapter 11.1; Eersel, chapter 11.6). Besides, Casparie and Groenman-van Waateringe (1980) conclude that barrows were seldom constructed on or close to arable land that was in use when the barrows were built, a conclusion that was confirmed by the present research. It is therefore not likely that the barrow builders had a preference for (recently abandoned) settlement sites and/or arable fields. On the other hand it is clear that in all cases prehistoric man must have been present at the sites prior to the barrow building, since at least some management was required to maintain the heath vegetation. Probably most open spaces were used as pasture already before the barrows were built, since grazing is indicated in several cases (Echoput, section 8.1; Oss-Zevenbergen Chapter 12).
13.1.3�What�does�this�mean?
The Late Neolithic landscape in the southern and central Netherlands is often seen as dominated by a fairly closed forest. As has been described in Chapter 2, deciduous forest is in general assumed to be the natural landscape in the Netherlands that had developed since the start of the Holocene. During the
235ancestral heaths: understanding the barrow landscape
Neolithic prehistoric man started to interfere with the landscape when they started to clear the forest to expand their agricultural activities. This was assumed to have happened only at local scale, in the close surroundings of a settlement site (Waterbolk 1954, Groenman-van Waateringe 1978). In general the open spaces were small and did not have a great impact on the landscape yet. Casparie and Groenman-van Waateringe (1980) concluded from their research that large open areas did not yet occur during the Neolithic in the central Netherlands. During the Bronze Age and Iron Age the Dutch landscape was transformed into a cultural open landscape, with heath and fields replacing the forest. During the Neolithic period man also started to build barrows to bury their dead. Neolithic barrows were pictured as being in small man-made open spaces in the forest, but it is not clear how these fitted in the landscape organization at large. The results described in Chapters 8-12 suggest that the landscape was probably already more open than previously thought. Based on the reconstructions from barrows the landscape must certainly have been open. All barrows were built in heath vegetation and the surrounding forest was open in character. Barrows were numerous and plentiful from the earliest Neolithic period. All these barrows being built in heath paint a different picture of the landscape than a closed forest with some small, open spaces.
For the Bronze Age it has long been thought that a barrow’s location was determined by the location of the settlement (Roymans and Fokkens 1991). This theory was mainly based on sites like Elp, where a barrow was located close to Middle Bronze Age houses (see figure 13.4). Bourgeois and Fontijn showed that this theory could not be confirmed (Bourgeois and Fontijn 2008). Most barrows predate the Middle Bronze Age houses, and settlements dating to the late Neolithic and Early Bronze Age, the period in which most barrows were built, have rarely been found (see also 2.3.2). In fact, it is not known where the people who built the barrows and who were buried in the barrows lived. Settlements have rarely been found close to barrows (Bourgeois 2013). In addition, this research has shown that palynological data seldom show the presence of arable fields in the near surroundings of a barrow, which are generally assumed to be located close to settlements (van Gijn and Louwe Kooijmans 2005, 338-340).
The barrow landscape was a managed landscape, with numerous patches of heath. As was previously thought that prehistoric man just started to interfere with the landscape during the Neolithic, these managed barrow landscapes assume large scale control of the landscape by man. And even long before the barrows were built, prehistoric man may have already overexploited some areas, as indicated by very early sand-drifting events at Oss-Zevenbergen in de Middle Neolitic (Chapter 12), the Schaijksche heide around 4700 cal BC (Chapter 11) and the Laarder Wasmeren area around 4000 cal BC (Chapter 10). Although the cause of these sand-drifts is unknown, they show that the landscape was open and that heath vegetation was already present by then. This is further indication of the presence and activity of man and implies a landscape that was maintained by this activity of man and even perhaps overexploited by him.
To summarize, despite not being built very close to settlements, the barrows seem to be integrated into the everyday life of prehistoric man. The barrow landscape was a managed landscape, which most likely was at least partially maintained by grazing, and seems to form as such part of the economic zone of the people living in the area. It is however not clear where the settlements of these communities were located. The evidence for settlements is elusive for the late Neolithic and the first half of the Middle Bronze Age. It seems likely that settlements were located not too far away, at ‘grazing’ distance from the barrows.
236 ancestral heaths
237ancestral heaths: understanding the barrow landscape
Grazing grounds, ancestral grounds?
One of the questions this research is trying to answer is whether the barrow builders had a preference for ancestral grounds to place their mounds. Based on the data that are available now, discussed above and in the previous chapters, this question can most likely be answered affirmatively. In general barrows were built on grazing grounds. Grazing took place concurrently and prior to the barrows being built. The barrows that were investigated were never built in areas that were recently cleared and it is not very likely that the barrow builders created heath areas especially for the construction of a burial mound. Instead, all barrows were built in areas that had been in use by prehistoric (heath) communities for a long period of time. These communities might very well have consisted of the ancestors of the people who built the barrows. The heathland areas where barrows were built in can be considered as ancestral heaths: not only did they serve as burial places for ancestors, they had also been used by these ancestors prior to the barrow building. The builders of the barrows built on the investment of their ancestors.
Barrows were often located in alignments in long-stretched heath areas. It is not hard to imagine that visibility must have played an important role in the placement of the mounds as has already been suggested in Chapter 2. From one mound the next mound could be seen and so on. Such corridors/passageways in the landscape must have been an impressive sight. Bourgeois (2013, Chapters 6 and 8) investigated visibility for several barrow alignments and clusters. He performed view-shed analyses to determine whether barrows were built on visible places in the landscape. How visible was a barrow in the landscape and what part from the landscape could be seen from a barrow? Besides the land relief (elevation, slope and orientation of terrain features) the vegetation and especially the trees are determining factors on the degree of visibility. The vegetation data that were derived from the pollen analyses described in Chapter 8-12 provided valuable information in this respect. Models have been developed to get a better grip on the relation between pollen spectra and the corresponding vegetation abundance. In Chapter 7 these models have been applied to barrow pollen spectra to be able to improve our visualization of a barrow landscape. Based on these models, barrows in the view-shed analysis were placed in (hypothetical) circular heathland areas with an average radius of 250 m. In addition the vegetation reconstructions have shown that alder carr made up a considerable part of the forest in the lower and wetter surroundings of all investigated barrows. For the view-shed analyses alder carr with a height of 15 m was placed at locations with high groundwater level, taking the recent lowering of groundwater by modern canalization and use of groundwater into account (Bourgeois 2013, 132). The dry Quercus forest obviously would also be of influence and although its exact location cannot be determined a forest with a height of 30 m was placed at the places that were not covered with heath or alder carr to get a rough impression of the visibility of barrows. Bourgeois concluded that barrows were more visible than their environment, but not all barrows were equally visible from their environment. Some barrows were highly visible and could probably be seen from long distances, while other barrows were only visible from the edge of the heath area. Also in alignments visibility varied between barrows. Some barrows could be seen from anywhere in the alignment, while others could only be seen from the barrow next to it and still others appeared only at the skyline from specific positions in the landscape. As Bourgeois (2013, 156) puts it: “Especially�in�the�case�of�the�alignments,�visibility�was�manipulated�in�order�to�reveal�a�succession�of�monuments.” Although the degree of visibility seems
Figure 13.4. Excavation plan of the barrow and settlement of Elp. The barrow was found very close to the settlement. Figure after Fokkens (2005a, figure 18.4).
238 ancestral heaths
to have differed between barrows it cannot be denied that visibility must have played an important role in the placement of barrows. Even when a barrow could only be seen when entering the heath area it was built in, it was probably still an eye catcher within that heath area. Visibility played an important role in the placement of the barrows. Their visibility might have been enhanced when the sods for barrow construction were taken in the direct environment of the barrow, as has been shown at the Echoput (Section 8.1). These barrows were located on one of the highest places in the environment in an open area that was covered with heath vegetation, while the direct surroundings were completely stripped from vegetation. This might have been undertaken to emphasize their characteristic sight in the landscape.
Barrows and the importance of visibility have also often been discussed in barrow research outside the Netherlands. Early Bronze Age Barrows in Thy, Denmark, were all built in a rather treeless landscape that was used as pastureland (Andersen 1996-97). Hannon et�al. showed that five Bronze Age mounds (1800-500 cal BC) at the Bjäre peninsula (southern Sweden) were built in an open landscape that was probably grazed (Hannon� et�al. 2008). They concluded that these barrows were probably designed to be visible in the landscape. Also Downes suggested that the location of barrows in Orkney (Scotland) were probably related to visibility (Downes 1994). Dreibrodt disagreed with the theory that all barrows were built in an open landscape (the landscape openness hypothesis; Dreibrodt�et�al. 2009). He showed that some barrows were built on hilltops while the hill flanks were probably covered with forest, since no soil erosion had taken place at these hills. However, he also mentions the possibility of a well suited system of pasture that could have maintained a vegetation cover preserving the hill from soil erosion. Fyfe rejected the landscape openness hypothesis as well (Fyfe 2012). He stated that there is no single blueprint for the vegetation composition on and around a barrow site and that barrows were built in landscapes that varied from very open to forested. He also mentions however, that barrows were built in the relatively most open places in the environment. Casparie and Groenman-van Waateringe (1980, 61) conclude: “The� environment� in� the� immediate� vicinity� of�a�barrow�varied�from�only�slightly�degraded�forest�to�extremely�degraded,�heath-rich�vegetations,�with�all�possible�intermediate�stages.” The research in this thesis shows that barrows were built in open spaces that varied in size from small to large. Besides, it was shown that visibility could still have played a role in small open spaces especially while they might have been connected forming a narrow long-stretched corridor heathland. In addition, a forested site does not necessarily imply that visibility played no role in the barrow building. Especially when multiple barrows were built in a region small views might even have emphasised their special place in the landscape (figure 13.5). Visibility was maintained while the heathland was managed. This could have been a ritual activity purely to preserve the visibility of the barrows in the landscape, it is however much more likely that the management also had an economic aspect. As has been discussed above and in the Chapters 8-12 grazing was probably involved and to maintain such extensive areas of heathland considerable livestock was necessary. It is therefore expected that the barrow landscape was in use as part of the agricultural organization of the prehistoric farmers.
To conclude, the role of barrows in the landscape of the central and southern Netherlands seemed to be twofold. On the one hand they were assigned a special place in the landscape, separate from settlements and fields, where visibility seemed to have played an important role. On the other hand they were integrated into everyday life, while they formed part of the economic zone of the people living in the area. Prehistoric landscape undergoes impressive changes from the Neolithic
239ancestral heaths: understanding the barrow landscape
to the Iron Age (and further on), when prehistoric man gradually changed it to a cultural landscape. The heaths of the barrow landscape, however, were very stable elements in this changing landscape that existed as such for thousands of years.
13.2 The heath open-forest passage landscape as part of the Dutch prehistoric landscape
Peat and lake sediments have been proven to be good pollen preservers, as has been explained in section 2.2.1. Therefore, information about the Dutch prehistoric landscape is mainly derived from palynological analyses of peat and lake sediments. Pollen in peat and lake sediments is assumed to represent the regional vegetation. However, this mainly accounts for the arboreal pollen component. Most herbal pollen does not travel long distances and therefore open places in the region of the peat or lake will be underrepresented or not be recorded at all. As has been shown by the palynological analyses of the Venloop and Slabroek (see chapter 6.1) a peat diagram does not necessarily represent the vegetation composition of a burial complex at only 1 km distance. It is therefore not realistic to generalize the landscape that was shown by peat and lake sediment analyses, since they only represent a specific type of landscape. For Late Neolithic times, when barrows were started being built, the general view of the Dutch landscape is that it is dominated by deciduous woodland (see 2.1). This research has shown that this view should be reconsidered and that the landscape was probably already more open than previously thought. In addition, palynological analyses of barrows only show a particular part of the landscape and the landscape picture drawn from this research can certainly not just be extended to for example settlements sites, neither can it be applied to sites with completely different environmental circumstances like wetland sites. Other researchers have argued that palynological sampling of peat and lake sediments alone are not suitable for a detailed vegetation reconstruction. Behre (1986) for example has reconstructed the development of landscape and prehistoric habitation within an isolated (surrounded by bogs) prehistoric settlement area called Flögeln (Northwest Germany) by creating a dense network of ten pollen diagrams. Palynological data were collected from
Figure 13.5. A small alignment of barrows at Toterfout-Halve Mijl. The small view emphasizes the ‘specialness’ of barrows.
240 ancestral heaths
a large raised bog just north of the settlement area, which provided the history of a regional vegetation development. However, habitation phases were hardly reflected in these diagrams. Only pollen diagrams derived from kettle-hole bogs within the settlement area showed a detailed overview of the several habitation phases in the area. Behre concluded that many pollen diagrams only show part of the (settlement) landscape, even when a settlement area was situated very close to the sample location. To get a most complete reconstruction of landscape and habitation development sampling at multiple locations in the area is necessary. Also Groenewoudt et� al. stated that the distance of most peat remnants to settlement areas is too large to provide reliable data about them (Groenewoudt�et�al. 2007). They collected palynological data from (man-made) pools and wells in or close to Late Bronze Age to Medieval settlements in a small-scale cover sand area in the eastern part of the Netherlands to get a more detailed understanding of the vegetation development in that settlement area. They concluded that during the Neolithic the settlements were situated in natural open spaces as islands in a forest landscape, after which rapid deforestation reversed the landscape structure with islands of woodland in a cultivated landscape. This was already established during the Iron Age, much earlier than suggested by most peat pollen diagrams. The data used in their research still do not provide a complete picture of the total landscape, since these samples were all taken in a settlement setting and as a consequence all represent a by humans influenced vegetation composition. Nevertheless this research is another confirmation that peat and lake pollen diagrams do not necessarily reflect a complete image of a landscape, since they might miss valuable local information.
The prehistoric landscape did not just consist of deciduous woodland, neither does deciduous woodland with settlement islands show the whole picture or is the barrow heathland landscape representative for the total landscape. To get a complete image of a landscape sampling of multiple locations in different settings is necessary. The sampling of barrows has proven to be a valuable addition to reconstruct the landscape at a more local level.
In conclusion, the barrow landscape was a landscape dominated by heath. Heath communities worked together for many generations to maintain these heathland areas. These heaths were not only the final resting places for their ancestors, but they had also been used and maintained by these ancestors. These ancestral heaths were very stable elements in the landscape and were kept in existence as such for thousands of years, forming the most important factor in structuring the barrow landscape.
241conclusions
Chapter�14
Conclusions: answers to the research questions
14.1 What did a barrow landscape look like and what was the vegetation (history) around barrows?
From the Late Neolithic onwards barrows were built in open spaces that were covered with heath vegetation. The heath the barrows were raised in originated from before the barrows were built and must have been maintained by heath management activities before and after the barrows were built. Management activities most likely involved grazing and possibly also burning and sod cutting. On the one hand these activities might have been applied intentionally to maintain the heath. On the other hand maintenance of the heath might have been a side-effect to the agricultural activities prehistoric man carried out in their everyday life. The oldest barrows were built in heath areas with an average distance to the forest (ADF) varying from 50 m up to 150 m. These heath areas were often connected to each other, forming long-stretched heath areas with a length of several kilometres, while in the late Neolithic A long alignments of barrows were formed. From the Late Neolithic B barrows onwards barrows were also built outside these alignments. These barrows too were built in heath areas with an ADF of 50 to 150 m. At the same time the long-stretched heath areas were maintained as well, while barrows in the alignments were re-used or new barrows were added to the alignments. The open spaces the youngest (Middle to earlier Late Iron Age) barrows were built in might have been larger in size, with an ADF that could reach 500 m. The barrow heath was surrounded by deciduous forest. In the relatively dry parts of the environment this deciduous forest was fairly open of character and consisted mainly of Quercus (oak) and Tilia (lime; from the Bronze Age onwards partly replaced by beech e.g. Fagus) with probably Corylus (hazel) profusely present at the forest edge. The forest in the wetter parts of the area was dominated by Alnus (alder).
In summary, the barrow landscape must have been dominated by managed patches of heath surrounded by open forest. These heath areas contained one or more barrows and were often connected to each other, forming passage ways in the landscape. The barrow landscape was a stable, managed mosaic heath open-forest passage landscape that was must have been maintained as such for many generations.
14.2. Were barrows built on ancestral grounds? What is the relationship with pastoral zones?
Based on the data that are currently available, discussed in the previous chapters, it is most likely that barrows indeed were built on ancestral grounds. Most barrows were situated in pastoral areas that were not only grazed when the barrows had been built, but probably also prior to the barrow building. None of the investigated barrows was built in areas that were very recently cleared especially
242 ancestral heaths
for the construction of a burial mound. No indications have been found that barrows were built in the near vicinity of a settlement or an arable field, but in all cases barrows were built on land that had been in use by prehistoric man who could very well be the ancestors of the builders.
14.3 What was the size of the open space barrows were constructed in and what was the distance to the forest?
Open spaces barrows were built in varied in size from small, with an average distance to the forest of 50-100 m, until rather large, with an average distance from the barrow to the forest of 300-500 m, although the latter has only been found in the relatively young Early Iron Age barrows of the Echoput. Most barrows were probably built in open spaces with an ADF of approximately 50-150 m. Although the forest might have been rather close to most barrows, the heathland area barrows were built in could still have been relatively extended. Long-stretched heathland areas with a length of several kilometres were probably not exceptional. Such extensive heathland areas already existed in the Late Neolithic and continued to exist for thousands of years.
14.4 What was the role of barrows in the landscape? How can the history of the barrow environment be linked to that of the natural and cultural landscape in the surroundings?
The role of barrows in the landscape of the central and southern Netherlands appeared to have been twofold. First, they occupied a special place in the landscape. Barrows were built in heath areas that were probably at a distance from settlements and arable fields. Visibility seemed to have played an important role. Second, they were part of the daily life of prehistoric man. The barrow landscape was included in the economic zone of farming communities in the area, while the heath areas were used as grazing grounds. Prehistoric landscape seems to undergo impressive changes from the Neolithic to the Iron Age (and further on), when prehistoric man gradually changed it to a cultural landscape. The heaths of the barrow landscape, however, probably were very stable elements in this changing landscape that existed as such for thousands of years.
14.5 Supplying Staatsbosbeheer with advice and suggestions, to aide in reconstructing the original environment around barrows for purposes of tourism
In the previous chapters has been attempted to sketch what the barrow landscape of the 3rd and 2nd millennium BC in the central and southern Netherlands looked like. In Chapter 1 (1.2) the societal significance of this barrow research has been stated. Combined with the theses of Bourgeois (on the genesis of the barrow landscape; Bourgeois 2013) and Wentink (on the social and ideological identity of the dead; Wentink in prep.) this thesis should provide a most detailed possible story about the barrow landscape, the barrows, who and what is buried inside the barrows and who built them: a story that could be told to the public. The owners of Dutch nature reserves want to present the barrows to the public in their original environmental context (if possible). Therefore they are interested in what the original environment looked like, information which would enable them to adjust their management and development regime [to achieve this original environment as much as possible].
243conclusions
The barrow landscape as reconstructed in the previous chapters has provided a general view on what it must have looked like in reality. The reconstruction pictures with circular patches of heath are simplifications of what the barrow landscape must have been looked like in reality. Nevertheless, they must certainly give a good impression of the visual impact of the heathlands barrows were built in. For the owners of nature reserve areas that want to include barrows in their development and management this would be a good starting point. To show the public what the barrow landscape looked like they should be situated in a heathland area in such a way that the barrow (or barrows) is well visible when entering that heathland area. The size of the heathland differed from case to case and the size of the area that should be reconstructed is probably more dependent on present day environmental and logistical circumstances. Current environmental circumstances are different than they were in the barrow period. Present day acidification, fertilization and dehydration have changed the soil conditions. Consequently, these factors will be of great influence on the maintenance of heath areas and surrounding forest. As for heritage management: only the barrow itself is considered a monument and in some cases the area around the barrow to a maximum of 10 metres (see 1.2). This research has shown that a barrow was inextricably linked to the heathland around it. The heath was most likely wider than 10 m around the monument. In addition, the excavation of Oss-Zevenbergen (Chapter 12.1) and the Echoput (Chapter 8.1) have shown that the area around a barrow could be of great archaeological value (post hole structures) and it does make sense to enlarge the protected environment around the barrow to preserve valuable Dutch cultural heritage. This thesis provides a guide line of what the barrow landscape probably looked like in general and it is now up to the landowners (and the cultural heritage management) how to use it.
245references
References
Achterkamp, Y. 2009. Separating�heather�from�the�Ling.�An�archaeopalynological�investigation�and�its�development�at�Oss-Zevenbergen�during�and�before�the�Early�Iron�Age. Universtity of Leiden.
Adams, S.N. 1975. Sheep and cattle grazing in forests: a review. Journal�of�Applied�Ecology�12(1), 143-152.
Andersen, S.T. 1979. Brown earth and podzol: soil genesis illuminated by microfossil analysis. Boreas�8(1), 59-73.
Andersen, S.T. 1988. Pollen spectra from the double passage-grave, Klekkendehøj, on Møn. Evidence of swidden cultivation in the Neolithic of Denmark. Journal�of�Danish�Archaeology�7, 77-92.
Andersen, S.T. 1992. Early and Middle-Neolithic agriculture in Denmark: Pollen spectra from soils in burial mounds of the Funnel Beaker Culture. Journal� of� European�Archaeology�1, 153-180.
Andersen, S.T. 1994-95. Pollen analytical investigations of barrows from the Funnel Beaker and Single Grave Cultures in the Vrouwe area, West Jutland, Denmark. Journal�of�Danish�Archaeology�12, 107-132.
Andersen, S.T. 1996-97. Pollen analyses from Early Bronze Age barrows in Thy. Journal�of�Danish�Archaeology�13, 7-17.
Arnoldussen, S., de Kort, J.W., Bourgeois, Q. 2009. A barrow for a camp-site? The disturbed barrow of Rhenen-Elsterberg (Unitas 4). Lunula.�Archaeologica�protohistorica�XVII, 177-187.
Averdieck, F.-R. 1980. Zum Stand der palynologischen Untersuchungen an Erdbauten in Schleswig-Holstein. Offa�37, 384-393.
Bakels, C.C. 1975. Pollenspectra from the Late Bronze Age urnfield at Hilvarenbeek-Laag Spul, Prov. Noord-Brabant Netherlands. Analecta�Praehistorica�Leidensia�8, 45-51.
Bakels, C.C. 1978. Four�Linearbandkeramik�settlements�and�their�environment. University of Leiden.
Bakels, C.C. 2000. Pollen diagrams and prehistoric fields: the case of Bronze Age Haarlem, the Netherlands. Review�of�Palaeobotany�and�Palynology�109, 205-218.
Bakels, C.C. 2012. The early history of Cornflower (Centaurea� cyanus L.) in the Netherlands. Acta�Palaeobotanica�52(1), 25-31.
Bakels, C.C., Achterkamp, Y. 2013. The local vegetation at the time of the construction of the Oss-Zevenbergen mounds 7 and 6. In: D.R. Fontijn, S.A. van der Vaart, R. Jansen (eds.). Transformation� through� Destruction.� A� monumental� and� extraordinary�Early�Iron�Age�Hallstatt�C�barrow�from�the�ritual�landscape�of�Oss-Zevenbergen.�Leiden: Sidestone Press, 239-248.
Bakker, J.A., van Giffen, A.E. 1965. Hilversum, grafheuvels 5 en 6 bij de Erfgooiersstraat. Nieuwsbulletin�KNOB�9, 120-121.
Bakker, R. 2003. The�emergence�of�agriculture�on� the�Drenthe�Plateau.�A�palaeobotanical�study�supported�by�high-resolution�14C�dating. University of Groningen.
Bastiaens, J., Deforce, K. 2005. Geschiedenis van de heide. Eerst natuur en dan cultuur of andersom? Natuurfocus�4(2), 40-44.
van Beek, B.L. 1977. Sporen van een Neolithische nederzetting tussen Toterfout en Halve Mijl. Gemeente Veldhoven (N.Br.). In: N. Roymans, J. Biemans, J. Slofstra, W.J.H. Verwers (eds.). Brabantse�Oudheden�(Bijdragen�tot�de�studie�van�het�Brabants�Heem�16,�opgedragen�aan�Gerrit�Beex�bij�zijn�65ste�verjaardag).�Eindhoven, 43-54.
246 ancestral heaths
Beex, G. 1954. Twee bronstijdgrafheuvels en enige graven uit de merovingische tijd te Casteren (gemeente Hoogeloon C.A.). Brabants�Heem�6, 57-65.
Beex, G. 1957. Een Neolitische grafheuvel met beker en vuursteendolk bij Witrijt (gem. Bergeijk). In: G. Beex (ed.). Twee�grafheuvels�in�Noord-Brabant�(Bijdragen�tot�de�studie�van�het�Brabanste�Heem�deel�IX).�Eindhoven, 7-23.
Beex, G. 1959. Onderzoek van Grafheuvels te Weelde. Archaeologica�Belgica�47, 1-29.
Beex, G. 1964a. Archeologisch overzicht van de gemeente Hoogeloon C.A. Brabants�Heem�XVI, 99-110.
Beex, G. 1964b. Archeologische vondsten te Eersel. Brabants�Heem�XVI, 9.
Beex, G. 1964c. Ringwalheuvel te Alphen, prov. Noord-Brabant. Berichten� van� de�rijksdienst�voor�het�oudheidkundig�bodemonderzoek�14, 53-65.
Behre, K.-E. 1992. The history of rye cultivation in Europe. Vegetation� History� and�Archaeobotany�1, 141-156.
Beijerinck, W. 1933. Die mikropaläontologische Untersuchung äolischer Sedimente und ihre Bedeutung für die Florengeschichte und die Quartairstratigraphie. Proceedings�Koninklijke�Akademie�van�Wetenschappen�36, 107-115.
Benrath, W., Jonas, F. 1937. Zur Entstehung der Ortstein-Bleichsandschichten an der Ostseeküste. Planta�26(4), 614-630.
Berendsen, H.J.A. 2004. De�vorming�van�het�land:�inleiding�in�de�geologie�en�de�geomorfologie,�4th ed. Assen: Koninklijke Van Gorcum.
Beug, H.-J. 2004. Leitfaden� der� Pollenbestimmung� für� Mitteleuropa� und� angrenzende�Gebiete. München: Verlag Dr. Friedrich Pfeil.
Bieleman, J. 1987. Boeren�op�het�Drentse�Zand�(1600-1900).�Een�nieuwe�visie�op�de�‘oude’�landbouw. PhD-thesis. Wageningen.
Bokdam, J., Gleichman, J.M. 2000. Effects of grazing by free-ranging cattle on vegetation dynamics in a continental north-west European heathland. Journal�of�Applied�Ecology�37, 415-431.
Bourgeois, Q. 2008. Grafheuvelonderzoek in Nederland: een gedane zaak? Vitruvius�4, 16-21.
Bourgeois, Q., Amkreutz, L., Panhuysen, R. 2009. The Niersen Beaker burial: A renewed study of a century-old excavation. Journal� of� Archaeology� in� the� Low� Countries� 1-2, 83-105.
Bourgeois, Q.P.J. 2013. Monuments�on�the�horizon.�The�formation�of�the�barrow�landscape�throughout�the�3rd�and�2nd�millennium�BC. PhD thesis. University of Leiden.
Bourgeois, Q.P.J., Fontijn, D.R. 2008. Houses and barrows in the Low Countries. In: S. Arnoldussen, H. Fokkens (eds.). Bronze�Age�settlements�in�the�Low�Countries.�Oxford: Oxbow Books, 41-56.
Braat, W.C. 1936. Een urnenveld te Knegsel (gem. Vessem). Oudheidkundige�Mededelingen�van�het�Rijksmuseum�van�Oudheden�te�Leiden�17, 38-46.
Bradshaw, R.H.W., Hannon, G.E., Lister, A.M. 2003. A long-term perspective on ungulate–vegetation interactions. Forest�Ecology�and�Management�181, 267-280.
247references
Brinkkemper, O., van Wijngaarden-Bakker, L. 2005. All-round farming. Food production in the Bronze Age and the Iron Age. In: L. Louwe Kooijmans, P.W. van den Broeke, H. Fokkens, A. van Gijn (eds.). The�prehisotry�of�the�Netherlands.�Amsterdam: Amsterdam University Press, 491-512.
Van den Broeke, P.W. 2005. A prehistory of our time. In: L.P. Louwe Kooijmans, P.W. van den Broeke, H. Fokkens, A.L. van Gijn (eds.). Prehistory�of�the�Netherlands.�Amsterdam Amsterdam University Press, 17-32.
Brongers, J.A. 1976. Air� photography� and� Celtic� Field� research� in� the� Netherlands. PhD thesis. University of Groningen. Amersfoort: ROB.
Broström, A., Gaillard, M.-J., Ihse, M., Odgaard, B. 1998. Pollen-landscape relationships in modern analogues of ancient cultural landscapes in southern Sweden - a first step towards quantification of vegetation openness in the past. Vegetation� History� and�Archaeobotany�7(189-201).
Broström, A., Nielsen, A.B., Gaillard, M.-J., Hjelle, K., Mazier, F., Binney, H., Bunting, J., Fyfe, R., Meltsov, V., Poska, A., Räsänen, S., Soepboer, W., von Stedingk, H., Suutari, H., Sugita, S. 2008. Pollen productivity estimates of key European plant taxa for quantitative reconstruction of past vegetation: a review. Vegetation� History� and�Archaeobotany�17, 461-478.
Broström, A., Sugita, S., Gaillard, M.-J. 2004. Pollen productivity estimates for the reconstruction of past vegetation cover in the cultural landscape of southern Sweden. The�Holocene�14, 368-381.
Broström, A., Sugita, S., Gaillard, M.-J., Pilesjö, P. 2005. Estimating the spatial scale of pollen dispersal in the cultural landscape of southern Sweden. The�Holocene�15(2), 252-262.
Bunnik, F.P.M. 1999. Vegetationsgeschichte�der�Löβbörden�zwischen�Rhein�und�Maas�von�der�Bronzezeit�bis�in�die�frühe�Neuzeit. PhD thesis. University of Utrecht.
Bunting, M.J., Hjelle, K.L. 2010. Effect of vegetation data collection strategies on estimates of relevant source area of pollen (RSAP) and relative pollen productivity estimates (relative PPE) for non-arboreal taxa. Vegetation�History�and�Archaeobotany�19, 365-374.
Bunting, M.J., Tipping, R. 2001. ‘‘Anthropogenic’’ Pollen Assemblages from a Bronze Age Cemetery at Linga Fiold, West Mainland, Orkney. Journal�of�Archaeological�Science�28, 487-500.
Bursch, F.C. 1933. Het urnenveld op het landgoed Oostereng onder Bennekom. OMROL�14, 26-38.
Bursch, F.C. 1935. Oudheidkundige onderzoekingen te Hilversum, 1934. OMROL�16, 45-63.
Bursch, F.C. 1937. Grafheuvels te Oss. Oudheidkundige�Mededelingen�van�het�Rijksmuseum�van�Oudheden�te�Leiden�18, 1-3.
Butler, J.J., van der Waals, J.D. 1967. Bell Beaker and early metal-working in the Netherlands. Palaeohistoria 12, 41-139.
Casparie, W.A. 1976. Palynological investigation of the celtic field near Vaassen, the Netherlands. In: J.A. Brongers (ed.). Air� photography� and�Celtic� field� research� in� the�Netherlands.�(PhD�thesis,�University�of�Groningen).�Amersfoort: ROB, 105-113.
Casparie, W.A., Groenman-van Waateringe, W. 1980. Palynological analysis of Dutch barrows. Palaeohistoria�22, 7-65.
Castel, I.L.Y., Koster, E.A., Slotboom, R.T. 1989. Morphogenetic aspects and age of Late Holocene aeolian drift sands in Northwest Europe. Zeitschrift� für� Geomorphologie,�Neue�Folge�33, 1-26.
248 ancestral heaths
Davidson, D.A., Carter, S., Boagc, B., Longa, D., Tipping, R., Tyler, A. 1999. Analysis of pollen in soils: processes of incorporation and redistribution of pollen in five soil profile types. Soil�Biology�and�Biochemistry�31, 643-653.
Davis, M.B. 1963. On the theory of pollen analysis. American� Journal� of� Science� 261, 897-912.
Dijkstra, E.F., van Mourik, J.M. 1995. Palynology of young acid forest soils in the Netherlands. Meded.�Rijks�Geol.�Dienst�52, 283-296.
Dijkstra, E.F., van Mourik, J.M. 1996. Reconstruction of forest dynamics based on pollen analysis and micromorphological studies of young acid forest soils under Scots pine plantations. Acta�Botanica�Neerlandica�45(3), 393-410.
Dimbleby, G.W. 1952. Soil regeneration on the North-East Yorkshire Moors. Journal�of�Ecology�40(2), 331-341.
Dimbleby, G.W. 1957. Pollen Analysis of Terrestrial Soils. New�Phytologist�56, 12-28.
Dimbleby, G.W., Evans, J.G. 1974. Pollen and land-snail analysis of calcareous soils. Journal�of�Archaeological�Science�1(2), 117-133.
Diot, M.-F. 1992. Etudes palynologiques de ble´s sauvages et domestiques issus de
cultures expe´rimentales. In: P.C. Anderson (ed.). Préhistoire de l’agriculture. Monographie du CRA 6. CNRS, Paris, 107-111.
Doorenbosch, M. 2011. An environmental hisotry of the Echoput barrows. In: D.R. Fontijn, Q.P.J. Bourgeois, A. Louwen (eds.). Iron� Age� Echoes.� Prehistoric� land�management�and�the�creation�of�a�funerary�landsacpe�-�the�“twin�barrows”�at�the�Echoput�in�Apeldoorn.�Leiden: Sidestone Press, 111-128.
Doorenbosch, M. 2013. A history of open space. Barrow landscapes and the significance of heaths - the case of the Echoput barrows. In: D. Fontijn, A.J. Louwen, S. van der Vaart, K. Wentink (eds.). Beyond� barrows.� Current� research� on� the� structuration�and�perception�of�the�prehistoric�landscape�through�monuments.�Leiden: Sidestone Press, 197-224.
Downes, J. 1994. Excavation of a Bronze Age burial at Mousland, Stromness, Orkney. Proceedings�of�the�Society�of�Antiquaries�of�Scotland�124, 141-154.
Dreibrodt, S., Nelle, O., Lütjens, I., Mitusov, A., Clausen, I., Bork, H.-R. 2009. Investigations on buried soils and colluvial layers around Bronze Age burial mounds at Bornhöved (northern Germany): an approach to test the hypothesis of ‘landscape openness’ by the incidence of colluviation. The�Holocene�19(3), 487-497.
Elbersen, B.S., Kuiters, A.T., Meulenkamp, W.J.H., Slim, P.A. 2003. Schaapskuddes�in�het�natuurbeheer.�Alterra-rapport 735.�Wageningen: Alterra, Research Instituut voor de Groene Ruimte.
Erdtman, G. 1943. An�introduction�to�pollen�analysis. Waltham, Massachusetts: Chronica Botanica Company.
Faegri, K. 1966. Some problems of representativity in pollen analysis. Palaeobotanist�15, 135-140.
Faegri, K., Iversen, J. 1989. Textbook�of�pollen�analysis,�4th ed. Chichester: Joh Wiley and sons.
Fagerlind, F. 1952. The real signification of pollen diagrams. Botaniska� notiser� 105, 185-224.
249references
Fanta, J. 1995. Beuk (Fagus sylvatica L.) in het Nederlandse deel van het nw-Europees diluvium. Nederlands�Bosbouw�Tijdschrift�1995, 225-234.
Field, D. 1998. Round barrows and the harmonious landscape: placing Early Bronze Age burial monuments in South-East England. Oxford�Journal�of�Archaeology�17(3), 309-326.
Firbas, F., Losert, H., Broihan, H. 1939. Untersuchungen zur jüngeren Vegetationsgeschichte im Oberharz. Planta�30(3), 422-456.
Florschutz, F. 1941. Resultaten van microbotanisch onderzoek van het complex loodzand-oerzand en van daaronder en daarboven gelegen afzettingen. Besprekingen� over� het�Heidepodsolprofiel.� 10e� bijeenkomst� sectie� Nederland� Internationale� Bodemkundige�Vereeniging.�18-19 april 1941. Utrecht: Hoitsema, 1-21.
Fokkens, H. 1991. Verdrinkend�landschap.�Archeologisch�onderzoek�van�het�westelijk�Fries-Drents�Plateau�4400�BC�tot�500�cal�AD. PhD thesis. University of Groningen.
Fokkens, H. 2005a. Longhouses in unsettled settlements settlements in Beaker period and Bronze Age. In: L.P. Louwe Kooijmans, P.W. van den Broeke, H. Fokkens, A. van Gijn (eds.). The�Prehistory�of�the�Netherlands.�Amsterdam: Amsterdam University Press, 407-428.
Fokkens, H. 2005b. Mixed farming societies: synthesis. In: L.P. Louwe Kooijmans, P.W. van den Broeke, H. Fokkens, A.L. van Gijn (eds.). Prehistory� of� the� Netherlands.�Amsterdam Amsterdam University Press, 463-474.
Fokkens, H., van der Vaart, S.A., Fontijn, D.R., Lemmers, S.A.M., Jansen, R., Valentijn, P. 2012. Hallstatt burials of Oss in context. Analecta�Praehistorica�Leidensia�in press.
Fokkens, H., Jansen, R. 2004. Het�vorstengraf�van�Oss.�Een�archeologische�speurtocht�naar�een�prehistorisch�grafveld. Utrecht.
Fokkens, H., Jansen, R., van Wijk, I.M. 2009a. Monumenten en herinnering; het grafveld Oss-Zevenbergen in samenhang. In: H. Fokkens, R. Jansen, I.M. van Wijk (eds.). Oss-Zevenbergen:�de�langetermijn-geschiedenis�van�een�prehistorisch�grafveld.�Leiden: Archol rapport 50, 209-224.
Fokkens, H., Jansen, R., van Wijk, I.M. (eds.) 2009b. Oss-Zevenbergen:�de�langetermijn-geschiedenis�van�een�prehistorisch�grafveld.�Leiden: Archol Rapport 50.
Fontijn, D.R. 2007. Ancestral Mounds. The social and ideological significance of barrows, 2900-1100 BC. Project Proposal N.W.O. - programmatic research. Leiden.
Fontijn, D.R. 2011a. Barrow excavations at the Echoput. Problem, research aims and methods of the 2007 fieldwork campaign. In: D.R. Fontijn, Q.P.J. Bourgeois, A. Louwen (eds.). Iron� Age� Echoes.� Prehistoric� land� management� and� the� creation� of� a�funerary� landscape� -� the� “twin� barrows”� at� the� Echoput� Apeldoorn.� Leiden: Sidestone Press, 13-32.
Fontijn, D.R. 2011b. The genesis and history of the Echoput�barrows. In: D.R. Fontijn, Q.P.J. Bourgeois, A. Louwen (eds.). Iron�Age�Echoes.�Prehistoric�land�management�and�the� creation�of�a� funerary� landsacpe� -� the�“twin�barrows”�at� the�Echoput� in�Apeldoorn.�Leiden: Sidestone Press, 149-162.
Fontijn, D.R., van der Vaart, S.A. 2013. Dismantled, transformed and deposited - prehistoric bronze from the centre of mound 7. In: D.R. Fontijn, S.A. van der Vaart, R. Jansen (eds.). Transformation�through�Destruction.�A�monumental�and�extraordinary�Early�Iron�Age�Hallstatt�C�barrow�from�the�ritual�landscape�of�Oss-Zevenbergen.�Leiden: Sidestone Press, 151-194.
250 ancestral heaths
Fontijn, D.R., Jansen, R., Bourgeois, Q.P.J., van der Linde, C. 2013a. Excavating the seventh mound. In: D.R. Fontijn, S.A. van der Vaart, R. Jansen (eds.). Transformation�through�Destruction.�A�monumental�and�extraordinary�Early�Iron�Age�Hallstatt�C�barrow�from�the�ritual�landscape�of�Oss-Zevenbergen.�Leiden: Sidestone Press, 69-118.
Fontijn, D.R., Jansen, R., van der Vaart, S.A., Fokkens, H., van Wijk, I.M. 2013b. Conclusion: The seventh mound of seven mounds – long-term history of the Zevenbergen barrow landscaoe. In: D.R. Fontijn, S.A. van der Vaart, R. Jansen (eds.). Transformation� through� Destruction.� A� monumental� and� extraordinary� Early� Iron� Age�Hallstatt� C� barrow� from� the� ritual� landscape� of� Oss-Zevenbergen.� Leiden: Sidestone Press, 281-316.
Fontijn, D.R., Louwen, A. (eds.) in prep. Re-united� in� death.� Collective� burials� in� the�Bronze�Age�barrow�landscape�of�Apeldoorn-Wieselse�Weg.�Leiden: Sidestone Press.
Fyfe, R.M. 2012. Bronze Age landscape dynamics: spatially detailed pollen analysis from a ceremonial complex. Journal�of�Archaeological�Science�39(8), 2764-2773.
Gaillard, M.-J., Sugita, S., Bunting, M.J., Middleton, R., Broström, A., Caseldine, C., Giesecke, T., Hellman, S.E.V., Hicks, S., Hjelle, K., Langdon, C., Nielsen, A.-B., Poska, A., von Stedingk, H., Veski, S., POLLANDCAL-members. 2008. The use of modelling and simulation approach in reconstructing past landscapes from fossil pollen data: a review and results from the POLLANDCAL network. Vegetation�History�and�Archaeobotany�17, 419-443.
van Geel, B. 1978. A palaeoecological study of Holocene peat bog sections in Germany and the Netherlands, based on the analysis of pollen, spores and macro- and microscopic remains of fungi, algae, cormophytes and animals. Review�of�Palaeobotany�and�Palynology�25, 1-120.
van Giffen, A.E. 1949. Een vierperioden-tumulus met primaire klokbekerheuvel bij Schaaik, Ge. Oss, N.Br. Brabants�Heem�1, 71-74.
van Giffen, A.E. 1954. Een Meerperioden-heuvel, Tumulus I te Bennekom, gem. Ede. Bijdragen�en�Mededelingen�van�de�Vereniging�Gelre�LIV, 1-21.
van Giffen, A.E. 1958. Renkum. Archeologisch�Nieuws�in�het�Bulletin�van�de�Koninklijke�Nederlandse�Oudheidkundige�Bond�11(4), 66.
van Gijn, A., Louwe Kooijmans, L.P. 2005. The first farmers: synthesis. In: L.P. Louwe Kooijmans, P.W. van den Broeke, H. Fokkens, A. van Gijn (eds.). The�prehistory�of�the�Netherlands.�Amsterdam: Amsterdam University Press, 337-356.
Glasbergen, W. 1954. Barrow�excavations�in�the�Eight�Beatitudes.�The�Bronze�Age�cemetery�between�Toterfout�&�Halve�Mijl,�North-Brabant.
Glazema, P. 1951. Oudheidkundige onderzoekingen in de provincie Gelderland, gedurende de jaren 1946 tot en met 1950. Gelre�51, 1-120.
Grimm, E.C. 1992 Published. Tilia�and�Tilia-graph:�pollen�spreadsheet�and�graphic�programs. 8th International Palynological Congress, Aix-en-Provence (France), September 6-12, 56.
Groenewoudt, B., van Haaster, H., van Beek, R., Brinkkemper, O. 2007. Towards a reverse image. Botanical research into the landscape history of the Eastern Netherlands (1100 B.C. - A.D. 1500). Landscape�History�29, 17-33.
Groenman- van Waateringe, W. 1977. Palynologisch onderzoek van grafheuvels te Weelde, Belgische Kempen. Archaeologica�Belgica�193, 42-49.
Groenman- van Waateringe, W. 1979. Palynological investigations of five German burial mounds. Archaeo-Physica�8, 69-84.
251references
Groenman- van Waateringe, W. 1983. Appendix II: Pollen and seeds. In: G. Eogan (ed.). Excavations� at� Knowth� 1:� Smaller� Passage� Tombs,� Neolithic� Occupation� and� Beaker�Activity.�Dublin: Royal Irish Academy, 325-329.
Groenman- van Waateringe, W. 1986. Grazing possibilities in the Neolithic of the Netherlands based on palynological data. In: K.-E. Behre (ed.). Anthropogenic�Indicators�in�Pollen�Diagrams.�Rotterdam: Balkema, 187-202.
Groenman- van Waateringe, W., Voorrips, A., Van Wijngaarden-Bakker, H. 1968. Settlements of the Vlaardingen Culture at Voorschoten and Leidschendam (Ecology). Helenium�7, 105-130.
Groenman-van Waateringe, W. 1978. The impact of Neolithic man on the landscape in the Netherlands. In: Limbrey (ed.). The� effect� of�man�on� the� landscape:� the�Lowland�Zone.�London: Council for British Archaeology.
Groenman-van Waateringe, W. 1993. The effects of grazing on the pollen production of grasses. Vegetation�History�and�Archaeobotany�2, 157-162.
Guillet, B. 1970. Etude palynologique des podzols. Pollen�et�Spores�XII, 45-69.
Hannon, G.E., Bradshaw, R.H.W., Nord, J., Gustafsson, M. 2008. The Bronze Age landscape of the Bja¨re peninsula, southern Sweden, and its relationship to burial mounds. Journal�of�Archaeological�Science�35, 623-632.
Havinga, A.J. 1963. A palynological investigation of soil profiles developed in cover sand. Mededelingen�van�de�Landbouwhogeschool�Wageningen�63(1), 1-93.
Havinga, A.J. 1964. Investigation into the differential corrosion susceptibility of pollen and spores. Pollen�et�Spores�6(2), 621-635.
Havinga, A.J. 1984. A 20-year experimental investigation into the differential corrosion susceptibilty of pollen and spores in various soil types. Pollen� et� Spores� 26(3-4), 541-558.
Hjelle, K.L. 1999. Modern pollen assemblages from mown and grazed vegetation types in western Norway. Review�of�Palaeobotany�and�Palynology�107, 55-81.
van Hoeve, M.L., Hendrikse, M. (eds.) 1998. A�study�of�non-pollen�objects�in�pollen�slides.�The�types�as�described�by�Dr.�Bas�van�Geel�and�colleagues.�.�Utrecht.
Holloway, R.G. 1989. Experimental mechanical pollen degradation and its application to quaternary age deposits. The�Texas�journal�of�science�41, 131-145.
Holwerda, J.H. 1907. Grafheuvels bij Hoogsoeren. Oudheidkundige�Mededelingen�van�het�Rijksmuseum�van�Oudheden�te�Leiden�I, 7-10.
Holwerda, J.H. 1912. Opgravingen aan het Uddelermeer. Oudheidkundige�Mededelingen�van�het�Rijksmuseum�van�Oudheden�te�Leiden�VI, 1-16.
van Hoof, L. 2009. Vuurstenen en natuurstenen artefacten uit het mesolithicum. In: H. Fokkens, R. Jansen, I.M. van Wijk (eds.). Oss-Zevenbergen:�de�langetermijn-geschiedenis�van�een�prehistorisch�grafveld.�Leiden: Archol rapport 50, 183-186.
Hulst, R.S., Lanting, J.N., van der Waals, J.D. 1973. Grabfunde mit frühen Glochenbechern aus Gelderland und Limburg. Berichten� van� de� rijksdienst� voor� het� oudheidkundig�bodemonderzoek�23, 77-101.
IJzereef, G.F. 1981. Bronze� Age� animal� bones� from� Bovenkarspel.�The� excavation� at� Het�Valkje. PhD thesis. University of Amsterdam.
van Impe, L., Beex, G. 1977. Grafheuvels�uit�de�vroege�en�midden-bronstijd�te�Weelde 193. Brussel.
ISRIC-FAO, 2006. World Reference Base for Soil Resources 2006. World� soil� resources�reports 103.
Iversen, J. 1941. Land occupation in Denmark’s Stone Age. A pollen-analytical study of the influence of farmer culture on the vegetational development Danmarks�Geologiske�Undersøgelse�II�66, 5-23.
Iversen, J. 1973. The development of Denmark’s nature since the Last Glacial. Danmarks�Geologiske�Undersøgelse�V. Række. Nr. 7-C, 1-126.
Jansen, R., van der Linde, C. 2013. The physical and archaeological “landscape” of the Zevenbergen barrow group. In: D.R. Fontijn, S.A. van der Vaart, R. Jansen (eds.). Transformation� through� Destruction.� A� monumental� and� extraordinary� Early� Iron� Age�Hallstatt� C� barrow� from� the� ritual� landscape� of� Oss-Zevenbergen.� Leiden: Sidestone Press, 35-46.
Jansen, R., Fokkens, H. 2007. Het� vorstengraf� van� Oss� re-reconsidered.� Archeologisch�onderzoek�Oss-Vorstengrafdonk�1997-2005. Leiden: Archol rapport 49.
Jansen, R., Louwen, A. (eds.) in prep. Heidense�heuvels�op�de�Slabroekse�heide.
Janssen, C.R., Ten Hove, H.A. 1971. Some late-Holocene pollen diagrams from the Peel raised bogs (Southern Netherlands) Review�of�Palaeobotany�and�Palynology�11, 7-53.
Johansen, K.L., Laursen, S.T., Holst, M.K. 2004. Spatial patterns of social organization in the Early Bronze Age of South Scandinavia. Journal�of�Anthropological�Archaeology�23, 33-55.
Jonassen, H. 1950. Recent pollen sedimentation and Jutland heath diagrams. Dansk�Botanisk�Arkiv�13(7), 1-168.
Jungerius, P.D., Riksen, M.J.P.M. 2010. Contribution of laser altimetry images to the geomorphology of the Late Holocene inland drift sands of the European Sand Belt. Baltica�23(1), 59-70.
Karg, S. 2008. Direct evidence of heathland management in the early Bronze Age (14th century B.C.) from the grave-mound Skelhøj in western Denmark. Vegetation�History�and�Archaeobotany�17, 41-49.
de Kort, J.-W. 1999. Een�reconstructie�van�de�vegetatie�rond�het�Vorstengraf�van�Oss�in�de�Vroege�IJzertijd�University of Leiden.
de Kort, J.-W. 2002. Schapen op de heide. Een vegetatiereconstructie van de omgeving van het vorstengraf van Oss in de Vroege IJzertijd. In: H. Fokkens, Jansen, R. (ed.). 2000�jaar�bewoningsdynamiek.�Brons-�en�ijzertijdbewoning�in�het�Maas-Demer-Scheldegebied.�Leiden: Leiden University, 341-353.
de Kort, J.W. 2005. Palynologisch�onderzoek�van�een�grafheuvel�uit�de�Midden�Bronstijd�bij�de�Vorssel,�gemeente�Bernheze.�Amsterdam: RAAP-notitie 1276.
de Kort, J.W. 2009. Palynologisch onderzoek Zevenbergen. In: H. Fokkens, R. Jansen, I.M. van Wijk (eds.). Oss-Zevenbergen:�de�langetermijn-geschiedenis�van�een�prehistorisch�grafveld.�Leiden: Archol rapport 50, 155-182.
253references
de Kort, J.W. 2010. Palynologisch onderzoek Slabroekse Heide. In: I.M. van Wijk, R. Jansen (eds.). Het� urnenveld� Slabroekse� Heide� op� de� Maashorst.� Leiden: Archol bv, 57-66.
de Kort, J.W., van Mourik, J.M. 2005. Palynologisch onderzoek Slabroekse Heide. In: I.M. van Wijk, R. Jansen (eds.). Het�urnenveld�Slabroekse�Heide�op�de�Maashorst.�Een�verkennend�en�waarderend�archeologisch�proefsleuvenonderzoek.�Leiden: Archol rapport nummer 72, 57-66.
Koster, E.A. 1978. De�stuifzanden�van�de�Veluwe:�een�fysisch-geografische�studie. PhD thesis. University of Amsterdam.
van der Laan, K., Jansen, R., de Kort, J.W., van Eijk, G. 2011. Natuurgebied de Maashorst. In: R. Jansen, K. van der Laan (eds.). Verleden�van�een�bewogen�landschap.�Landschaps-�en�bewoningsgeschiedenis�van�de�Maashorst.�.�Utrecht, 8-19.
Lake, S., Bullock, J.M., Hartley, S. 2001. Impacts�of�livestock�grazing�on�lowland�heathland�in�the�UK.�English Nature Research Reports, 422.�Peterborough: NERC Centre for Ecology and Hydrology and Sussex University.
Lanner, R.M. 1966. Needed: a new approach to the study of pollen dispersion. Silvae�Genetica�15, 50-52.
Lanting, J.N., van der Waals, J.D. 1971a. Ede. Nieuwsbulletin�KNOB�70, 125-126.
Lanting, J.N., van der Waals, J.D. 1971b. Ermelo. Nieuwsbulletin�KNOB�70, 126.
Lanting, J.N., van der Waals, J.D. 1971c. Laat-Neolithische grafheuvels bij Vaassen en Maarsbergen. OMROL�52, 93-127.
Lanting, J.N., van der Waals, J.D. 1971d. Stroe. Nieuwsbulletin�KNOB�70, 126.
Lanting, J.N., van der Waals, J.D. 1971e. Vaassen. Nieuwsbulletin�KNOB�70, 53-54.
Lanting, J.N., van der Waals, J.D. 1972a. Bennekom. Nieuwsbulletin�KNOB�71, 129.
Lanting, J.N., van der Waals, J.D. 1972b. Renkum. Nieuwsbulletin�KNOB�71, 131-132.
Lanting, J.N., van der Waals, J.D. 1972c. Vierhouten. Nieuwsbulletin�KNOB�71, 132.
Lanting, J.N., van der Waals, J.D. 1976. Beaker culture relations in the lower Rhine basin. In: J.N. Lanting, J.D. van der Waals (eds.). Glockenbecher�symposion,�Oberried,�1974.�Haarlem: Fibula-van Dishoeck, 1-80.
Lawson, A.J., Martin, E.A., Priddy, D. 1981. The barrows of East Anglia. East�Anglian�Archaeology�Report�12.
Lemmers, P. 2008. Investigating� optically� stimulated� luminescence� in� naturally� occurring�quartz�with�the�purpose�of�dating�man-made�burial�mounds. Unpublished MSc thesis. University of Delft.
Lemmers, S.A.M., Janssen, M., Waters-Rist, A., Grosskopf, B., Hoogland, M., Amkreutz, L. in prep. The Chieftain of Oss: New perspectives on an Iron-Age individual with DISH.
van der Linde, C., Fokkens, H. 2009. Het landschappelijk kader van De Zevenbergen. In: H. Fokkens, R. Jansen, I.M. van Wijk (eds.). Oss-Zevenbergen:� de� langetermijn-geschiedenis�van�een�prehistorisch�grafveld.�Leiden: Archol rapport 50, 37-52.
van der Linde, C., Fontijn, D.R. 2011. Mound 1- A monumental Iron Age barrow. In: D.R. Fontijn, Q.P.J. Bourgeois, A. Louwen (eds.). Iron� Age� Echoes.� Prehistoric� land�management�and�the�creation�of�a�funerary�landscape�-�the�“twin�barrows”�at�the�Echoput�Apeldoorn.�Leiden: Sidestone Press, 33-64.
Louwe Kooijmans, L.P. 1974. The� Rhine/Meuse� delta.� Four� studies� on� its� prehistoric�occupation�and�holocene�geology. University of Leiden.
254 ancestral heaths
Louwe Kooijmans, L.P. 1979. Opgraven in Nederland. Het werk van de archeoloog. Staatsuitgeverij�‘s�Gravenhage.
Louwen, A., Fontijn, D.R., Valentijn, P., van der Linde, C., Verbaas, A. 2011. Finds. In: D. Fontijn, Q. Bourgeois, A. Louwen (eds.). Iron� Age� Echoes.� Prehistoric� land�management�and�the�creation�of�a�funerary�landsacpe�-�the�“twin�barrows”�at�the�Echoput�in�Apeldoorn.�Leiden: Sidestone Press, 129-141.
Mallik, A.U., FitzPatrick, E.A. 1996. Thin section studies of Calluna heathland soils subject to prescribed burning. Soil�Use�and�Management�12(3), 143-149.
Mellars, P. 1976. Fire ecology, animal populations and man. Proceedings�of�the�Prehistoric�Society�42, 15-45.
Middleton, R., Bunting, M.J. 2004. Mosaic v1.1: landscape scenario creation software for simulation of pollen dispersal and deposition. Review�of�Palaeobotany�and�Palynology�132, 61-66.
Mitchell, F.J.G. 2005. How open were European primeval forest? Hypothesis testing using palaeoecological data. Journal�of�Ecology�93, 168-177.
Modderman, P.J.R. 1954. Grafheuvelonderzoek in Midden-Nederland. Berichten�van�de�rijksdienst�voor�het�oudheidkundig�bodemonderzoek�V, 7-44.
Modderman, P.J.R. 1955. Het onderzoek van enkele Brabantse en Utrechtse grafheuvels. Berichten�van�de�rijksdienst�voor�het�oudheidkundig�bodemonderzoek�VI, 44-65.
Modderman, P.J.R. 1964. De verspreiding van de Bekerculturen op de Veluwe. Berichten�van�de�rijksdienst�voor�het�oudheidkundig�bodemonderzoek�5, 7-44.
Modderman, P.J.R., Bakels, C.C. 1971. A Bronze Age barrow on the Moormanlaan near Knegsel, prov. Noord-Brabant. Analecta�Praehistorica�Leidensia�4, 52-56.
Modderman, P.J.R., Louwe Kooijmans, L.P. 1966. The Heibloem, a Cemetery from the Late Bronze Age and Early Iron Age between Veldhoven and Steensel, Prov. Noord-Brabant. Analecta�Praehistorica�Leidensia�II, 9-26.
Mothes, K., Arnoldt, G., Redmann, H. 1937. Zur Bestandesgeschichte ostpreussicher Wälder. Schriften�der�Physikalisch-Ökonomischen�Gesellschaft�zu�Königsberg�in�Preussen�69, 267-282.
van Mourik, J.M. 1985. Een eeuwenjong podzolprofiel op de Schaijksche heide. Geografisch�Tijdschrift�XIX(2), 105-112.
van Mourik, J.M. 1986. Pollen�profiles�of�slope�deposits�in�the�Galicean�area�(N.W.�Spain). PhD thesis. University of Amsterdam.
van Mourik, J.M. 1987. Laat glaciaal veen en holoceen stuif-zand bij de Peelbreuk tussen Nistelrode en Uden. Geografisch�Tijdschrift�XXI, 421-436.
van Mourik, J.M. 1999. The use of micromorphology in soil pollen analysis The interpretation of the pollen content of slope deposits in Galicia, Spain. Catena�35, 239-257.
van Mourik, J.M. 2001. Pollen and spores, preservation in ecological settings. In: E.G. Briggs, P.R. Crowther (eds.). Palaeobiology�II.�Oxford: Blackwell Science, 315-318.
van Mourik, J.M. 2003. Life cycle of pollen grains in mormoder humus forms of young acid forest soils: a micromorphological approach. Catena�54, 651-663.
van Mourik, J.M. 2005. Resultaten van het dateringsonderzoek van grafheuvel 39 op de Slabroekse Heide. In: I.M. van Wijk, R. Jansen (eds.). Het�urnenveld�Slabroekse�Heide�op� de� Maashorst.� Een� verkennend� en� waarderend� archeologisch� proefsleuvenonderzoek.�Leiden: Archol rapport nummer 72, 67-74.
255references
van Mourik, J.M., Nierop, K.G.J., Vandenberghe, D.A.G. 2010. Radiocarbon and optically stimulated luminescence dating based chronology of a polycyclic driftsand sequence at Weerterbergen (SE Netherlands). Catena�80, 170-181.
van Mourik, J.M., Pet, A. 2001. Natuurontwikkeling in het dal van de Venloop. Broekbos of ecobeek? Nederlands�Bosbouw�Tijdschrift, 12-15.
van Mourik, J.M., Seijmonsbergen, A.C., Jansen, B. 2012a. Geochronology of soils and landforms in cultural landscapes on aeolian sandy substrates, based on radiocarbon and optically stimulated luminescence dating (Weert, SE-Netherlands). InTech, Weert, SE-Netherlands. Radiometric�Dating, 75-114.
van Mourik, J.M., Seijmonsbergen, A.C., Slotboom, R.T., Wallinga, J. 2012b. The impact of human land use on soils and landforms in cultural landscapes on aeolian sandy substrates (Maashorst, SE Netherlands). Quarternary�International�265, 74-89.
van Mourik, J.M., Slotboom, R.T., Wallinga, J. 2011. Chronology of plaggic deposits; palynology, radiocarbon and optically stimulated luminescence dating of the Posteles (NE-Netherlands). Catena�84(1-2), 54-60.
Müller, P.E. 1884. Studier over skovjord, som bidrag til skovdyrkningens theori. II. Tidsskrift�for�Skovbrug�7, 1-232.
Munaut, A.V. 1967. Recherches paleo-ecologiques en basse et moyenne Belgique. Acta�Geographica�Lovaniensia�6.
Nielsen, A.B. 2004. Modelling pollen sedimentation in Danish lakes at c. AD 1800: an attempt to validate the POLLSCAPE model. Journal�of�Biogeography�31, 1693-1709.
Odgaard, B. 1988. Heatland History in Western Jutland, Denmark. In: H.H. Birks, H.J.B. Birks, P.E. Kaland, D. Moe (eds.). The�cultural�landscape:�the�past,�present�and�future.�Cambridge: Cambridge University Press, 311-320.
Odgaard, B.V. 1994. The Holocene vegetation history of northern West Jutland, Denmark. Opera�Botanica�123, 1-171.
Odgaard, B.V., Rostholm, H. 1987. A single grave barrow at Harreskov, Jutland. Journal�of�Danish�Archaeology�6, 87-100.
Out, W.A. 2009. Sowing the seed? Human impact and plant subsistence in Dutch wetlands during the late Mesolithic and Early and Middle Neolithic (5500-3400 cal. B.C.). Archaeological�Studies�Leiden�University.�vol.�18.�Leiden: Leiden University Press.
Ovrevik, S. 1990. The second millennium and after. In: A.C. Renfrew (ed.). The�prehistory�of�Orkney.�Edinburgh.
Pape, J.C. 1970. Plaggen soils in The Netherlands. Geoderma�4(3), 229-255.
Parsons, R.W., Prentice, I.C. 1981. Statistical approaches to R-values and the pollen-vegetation relationship Review�of�Palaeobotany�and�Palynology�32, 127-152.
Pidek, I.A., Piotrowska, K., Kasprzyk, I. 2010. Pollen-vegetation relationships for pine and spruce in southeast Poland on the basis of volumetric and Tauber trap records. Grana�49, 215-226.
Piek, H. 2000. 30 jaar begrazing bij Natuurmonumenten.
Polak, B. 1959. Palynology of the Uddelermeer. Acta�Botanica�Neerlandica�9, 547-571.
Poska, A., Meltsov, V., Sugita, S., Vassiljev, J. 2011. Relative pollen productivity estimates of major anemophilous taxa and relevant source area of pollen in a cultural landscape of the hemi-boreal forest zone (Estonia). Review�of�Palaeobotany�and�Palynology�167(1-2), 30-39.
Prentice, I.C. 1985. Pollen Representation, Source Area, and Basin Size: Toward a Unified Theory of Pollen Analysis. Quaternary�Research�23, 76-86.
256 ancestral heaths
Prentice, I.C., Parsons, R.W. 1983. Maximum Likelihood Linear Calibration of Pollen Spectra in Terms of Forest Composition. Biometrics�39(4), 1051-1057.
Prentice, I.C., Webb, T., III 1986. Pollen percentages, tree abundances, and the Fagerlind effect. Journal�of�Quaternary�Science�1, 35-43.
Punt , W., Blackmore, S., Clarke, G.C.S. 1976. Northwest�European�flora 1. Amsterdam: Elsevier.
Punt , W., Blackmore, S., Clarke, G.C.S. 1980. Northwest� European� pollen� flora 2. Amsterdam: Elsevier.
Punt , W., Blackmore, S., Clarke, G.C.S. 1981. Northwest� European� pollen� flora 3. Amsterdam: Elsevier.
Punt , W., Blackmore, S., Clarke, G.C.S. 1984. Northwest� European� pollen� flora 4. Amsterdam: Elsevier.
Punt , W., Blackmore, S., Clarke, G.C.S. 1988. Northwest� European� pollen� flora 5. Amsterdam: Elsevier.
Punt , W., Blackmore, S., Clarke, G.C.S. 1991. Northwest� European� pollen� flora 6. Amsterdam: Elsevier.
Punt , W., Blackmore, S., Clarke, G.C.S. 1995. Northwest� European� pollen� flora 7. Amsterdam: Elsevier.
Punt , W., Blackmore, S., Clarke, G.C.S. 2003. Northwest� European� pollen� flora 8. Amsterdam: Elsevier.
Punt , W., Blackmore, S., Clarke, G.C.S. 2009. Northwest� European� pollen� flora 9. Amsterdam: Elsevier.
Punt , W., Hoen, P.P., Blackmore, S., Nilsson, S., Le Thomas, A. 2007. Glossary of pollen and spore terminology. Review�of�Palaeobotany�and�Palynology�143, 1-81.
RADAR. 2006. Dutch Relational Archaeobotanical Database version 2006.
Reille, M. 1992. Pollen�et�spores�d’Europe�et�d’Afrique�du�Nord. Marseille: Laboratoire de Botanique historique et Palynologie.
Reille, M. 1995. Pollen�et�spores�d’Europe�et�d’Afrique�du�Nord.�Supplement 1. Marseille: Laboratoire de Botanique Historique et Palynolgie.
Reille, M. 1998. Pollen�et�spores�d’Europe�et�d’Afrique�du�Nord. Supplement 2. Marseille: Laboratoire de Botanique Historique et Palynologie.
Remouchamps, A.E. 1924. Opgravingen van een urnenveld te Uden. Oudheidkundige�Mededelingen�van�het�Rijksmuseum�van�Oudheden�te�Leiden�5, 69-76.
Renes, J. 1988. De�geschiedenis�van�het�Zuidlimburgse�cultuurlandschap. Assen-Maastricht: Van Gorcum.
Riksen, M., Ketner-Oostra, R., van Turnhout, C., Nijssen, M., Goossens, D., Jungerius, P.D., Spaan, W. 2006. Will we lose the last active inland drift sands of Western Europe? The origin and development of the inland drift-sand ecotype in the Netherlands. Landscape�Ecology�21, 431-447.
Roymans, N., Fokkens, H. 1991. Een overzicht van veertig jaar nederzettingsonderzoek in de Lage Landen. . In: H. Fokkens, N. Roymans (eds.). Nederzettingen� uit� de�bronstijd� en� de� vroege� ijzertijd� in� de� Lage� Landen.� Amersfoort: Rijksdienst voor het Oudheidkundig Bodemonderzoek, 1-19.
257references
Sarauw, G.F.L. 1898. Lynheden i oldtiden. Iagttagelser fra gravhöje. Aarbøger�for�Nordisk�Oldkyndighed�og�Historie.
Sevink, J., Koster, E.A., van Geel, B., Wallinga, J. in press. Drift sands, lakes and soils: the multiphase Holocene history of the Laarder Wasmeren area near Hilversum, The Netherlands.
Siebel, H., Piek, H. 2001. Veranderde inzichten over begrazing bij natuurbeheerders. Vakblad�Natuurbeheer�4, 45-49.
Simmons, I.G., Innes, J.B. 1987. Mid-Holocene adaptations and later Mesolithic forest disturbance in Northern England. Journal�of�Archaeological�Science�14, 385-403.
Simmons, I.G., Innes, J.B. 1996a. Disturbance phases in the Mid-Holocene vegetation at North Gill, North York Moors: form and process. Journal�of�Archaeological�Science�23(2), 183-191.
Simmons, I.G., Innes, J.B. 1996b. Prehistoric charcoal in peat profiles at North Gill, North Yorkshire Moors, England. Journal�of�Archaeological�Science�23(2), 193-197.
Smits, L. 2013. Analysis of the cremated bone from mound 7. In: D.R. Fontijn, S.A. van der Vaart, R. Jansen (eds.). Transformation� through� Destruction.� A� monumental�and�extraordinary�Early� Iron�Age�Hallstatt�C�barrow� from� the� ritual� landscape�of�Oss-Zevenbergen.�Leiden: Sidestone Press, 257-262.
Soepboer, W., Lotter, A.F. 2009. Estimating past vegetation openness using pollen–vegetation relationships: A modelling approach. Review�of�Palaeobotany�and�Palynology�153, 102-107.
Stoutjesdijk, P. 1953. Vegetatiekundig onderzoek van Veluwse heidevelden. Studiekring voor de Veluwe, heeft onze heide nog toekomst ? De� Studiekring� voor� de� Veluwe�Arnhem, 15-32.
Sugita, S. 1993. A model of pollen source area for an entire lake surface. Quaternary�Research�39, 239-244.
Sugita, S. 1994. Pollen Representation of Vegetation in Quaternary Sediments: Theory and Method in Patchy Vegetation. Journal�of�Ecology�82(4), 881-897.
Sugita, S. 2007a. Theory of quantitative reconstruction of vegetation I: pollen from large sites REVEALS regional vegetation composition. The�Holocene�17(2), 229-241.
Sugita, S. 2007b. Theory of quantitative reconstruction of vegetation II: all you need is LOVE. The�Holocene�17(2), 243-257.
Sugita, S., Gaillard, M.-J., Broström, A. 1999. Landscape openness and pollen records: a simulation approach. The�Holocene�9(4), 409-421.
Sutton, O.G. 1953. Micrometeorology:�a�study�of�physical�process�in�the�lowest�layers�of�the�earth’s�atmosphere. New York: McGraw-Hill.
Svenning, J.-C. 2002. A review of natural vegetation openness in north-western Europe. Biological�Conservation�140, 133-148.
Theunissen, E.M. 1993. Once again Toterfout-Halve Mijl. An attempt to demonstrate vertical stratification in the burial evidence of a Bronze Age cemetery. Analecta�Praehistorica�Leidensia�26, 29-43.
Tinsley, H.M. 2001. Modern pollen deposition in traps on a transect across an anthropogenic tree-line on Exmoor, southwest England: a note summarising the first three years of data. Review�of�Palaeobotany�and�Palynology�117(1-3), 153-158.
258 ancestral heaths
Tinsley, H.M., Smith, T.R. 1974. Surface pollen studies across a woodland/heath transition and their application to the interpretation of pollen diagrams. New� Phytologist� 73, 547-565.
Trautmann. 1952. Pollenanalytische Untersuchungen über die Fichtenwälder des Bayerischen Waldes. Planta�41, 83-124.
Troels-Smith, J. 1953. Ertebøllekultur-Bondekultur. Resultaten af de sideste 10 aars undersøgelser i Aamosen, Vestsjælland. Aarbøger�for�Nordisk�Oldkyndighed�og�Historie�1953, 5-62.
van der Vaart, S.A., Fontijn, D.R., Valentijn, P. 2013. The central find assemblage of mound 7. In: D.R. Fontijn, S.A. van der Vaart, R. Jansen (eds.). Transformation�through�Destruction.�A�monumental�and�extraordinary�Early�Iron�Age�Hallstatt�C�barrow�from�the�ritual�landscape�of�Oss-Zevenbergen.�Leiden: Sidestone Press, 119-140.
Valentijn, P. 2013. “Mound” 6: a post and ditch aligned long barrow. In: D.R. Fontijn, S.A. van der Vaart, R. Jansen (eds.). Transformation�through�Destruction.�A�monumental�and�extraordinary�Early� Iron�Age�Hallstatt�C�barrow� from� the� ritual� landscape�of�Oss-Zevenbergen.�Leiden: Sidestone Press, 47-69.
Valentijn, P., Fontijn, D.R. 2011. Excavating the surroundings of the barrows. In: D.R. Fontijn, Q.P.J. Bourgeois, A. Louwen (eds.). Iron� Age� Echoes.� Prehistoric� land�management�and�the�creation�of�a�funerary�landscape�-�the�“twin�barrows”�at�the�Echoput�Apeldoorn.�Leiden: Leiden Press, 91-110.
Verwers, G.J. 1966. Tumuli at the Zevenbergen near Oss, Gem. Berghem, Prov. Noord-Brabant. Analecta�Praehistorica�Leidensia�2, 27-32.
Verwers, G.J. 1972. Das Kamps Veld in Haps in Neolithikum, Bronzezeit und Eisenzeit. Analecta�Praehistorica�Leidensia�V.
Waterbolk, H.T. 1954. De�praehistorische�mens�en�zijn�milieu.�Een�palynogisch�onderzoek�naar� de� menselijke� invloed� op� de� plantengroei� van� de� diluviale� gronden� in� Nederland. University of Groningen.
Waterbolk, H.T. 1957. Pollenanalytisch onderzoek van twee Noordbrabantse tumuli. In: G. Beex (ed.). Twee�grafheuvels� in�Noord-Brabant�(Bijdragen�tot�de� studie�van�het�Brabantse�heem�deel�IX).�Eindhoven, 34-39.
Waterbolk, H.T. 1964. The Bronze Age settlement of Elp. Helinium�4, 97-131.
Webb, T., III, Howe, S.E., Bradshaw, R.H.W., Heide, K.M. 1981. Estimating plant abundances from pollen percentages: the use of regression analysis Review� of�Palaeobotany�and�Palynology�34, 269-3600.
Weeda, E.J., Westra, R., Westra, C., Westra, T. 1985. Nederlandse� Oecologische� Flora.�Wilde�planten�en�hun�relaties�1. Haarlem.
Weeda, E.J., Westra, R., Westra, C., Westra, T. (eds.) 1988. Nederlandse� Oecologische�Flora.�Wilde�planten�en�hun�relaties�Haarlem.
Wentink, K. in prep. The�biographies�of�grave�goods�and�the�identity�of�the�dead�(working�title),�Sidestone Press, Leiden. (PhD thesis).
Whitehouse, N.J., Smith, D. 2010. How fragmented was the British Holocene wildwood? Perspectives on the “Vera” grazing debate from the fossil beetle record. Quarternary�Science�Reviews�29(3-4), 539-553.
259references
van Wijk, I.M., Fokkens, H., Fontijn, D.R., de Leeuwe, R., Meurkens, L., van Hilst, A., Vermeeren, C. 2009. Resultaten van het definitieve onderzoek. In: H. Fokkens, R. Jansen, I.M. van Wijk (eds.). Oss-Zevenbergen:� de� langetermijn-geschiedenis� van� een�prehistorisch�grafveld.�Leiden: Archol rapport 50, 69-140.
van Wijk, I.M., Jansen, R. 2005a. Archeologisch onderzoek Uden-Slabroekse Heide 2005. In: I.M. van Wijk, R. Jansen (eds.). Het�urnenveld�Slabroekse�Heide�op�de�Maashorst.�Een� verkennend� en� waarderend� archeologisch� proefsleuvenonderzoek.� Leiden: Archol rapport nummer 72, 43-56.
van Wijk, I.M., Jansen, R. (eds.) 2005b. Het�urnenveld�Slabroekse�Heide�op�de�Maashorst.�Een� verkennend� en� waarderend� archeologisch� proefsleuvenonderzoek.� Leiden: Archol rapport nummer 72.
Willemse, N.W., Groenewoudt, B.J. 2012. Resilience of Meta-Stable Landscapes? The Non-
Linear Response of Late Glacial Aeolian Landforms to Prehistoric Reclamation along Dutch River Valleys. eTopoi,�Journal�for�Ancient�Studies Special Volume 3, 1007-1037.
Wimmers, W.H., Groenman- van Waateringe, W., Spek, T.H. 1993. Het culturele erfgoed van een natuurgebied. Historisch�Geografisch�Tijdschrift�11e jaargang(2), 53-74.
Yallop, A.R., Thacker, J.I., Thomas, G., Stephens, M., Clutterbuck, B., Brewer, T., Sannier, C.A.D. 2006. The extent and intensity of management burning in the English uplands. Journal�of�Applied�Ecology�43(6), 1138-1148.
van Zeist, W. 1955. Pollenanalytical investigations in the northern Netherlands. Acta�Botanica�Neerlandica�25, 1-81.
van Zeist, W. 1959. Studies on the post-Boreal vegetational history if south-eastern Drenthe (Netherlands). Acta�Botanica�Neerlandica�8, 156-185.
van Zeist, W. 1963. Het stuifmeelonderzoek van de grafheuvel te Mol. Archaeologica�Belgica�72, 20-22.
van Zeist, W. 1967a. Archaeology and palynology in the Netherlands Review�of�Palaeobotany�and�Palynology�4, 45-65.
van Zeist, W. 1967b. Palynologisch onderzoek van een ringwalheuvel bij Eersel. Berichten�van�de�rijksdienst�voor�het�oudheidkundig�bodemonderzoek�17, 53-58.
van Zeist, W. 1976. To early rye finds from the Netherlands. Acta�Botanica�Neerlandica�25, 71-79.
261appendix 1
Appendix�1
Nor
ther
n an
d Ce
ntra
l Vel
uwe
Barr
ow n
ame
Coor
dina
tes
Barr
ow ID
Bo
urge
ois
(201
3)
Syno
nym
Cas
pari
e an
d G
roen
man
-van
Waa
teri
nge
1980
Ori
gina
l syn
onym
sO
rigi
nal p
olle
n da
ta
Boes
chot
enBo
esch
oten
1740
40/4
6984
4 ?
-
tum
ulus
Hun
eweg
(Wat
erbo
lk 1
954)
Wat
erbo
lk 1
954
Echo
put
Echo
put 1
1884
31/4
7210
0-
m
ound
1 (F
ontij
n et
al.
2011
)D
oore
nbos
ch (t
his
volu
me)
Echo
put 2
1884
40/4
7208
0-
m
ound
2 (F
ontij
n et
al.
2011
)D
oore
nbos
ch (t
his
volu
me)
Emst
, Lan
gew
egEm
st19
1868
/482
135
ID 6
31
S30
Emst
(Hul
st 1
972)
Casp
arie
and
Gro
enm
an-v
an
Waa
terin
ge 1
980
Erm
elo
Erm
elo
III17
4832
/478
453
ID 3
26
S9ba
rrow
III (
Mod
derm
an 1
954)
Casp
arie
and
Gro
enm
an-v
an
Waa
terin
ge 1
980
Erm
elo
I17
4949
/478
453
ID 3
24
S15
barr
ow I
(Mod
derm
an 1
954)
Casp
arie
and
Gro
enm
an-v
an
Waa
terin
ge 1
980
Epe
Vaas
sen
119
2215
/477
315
ID 2
73
S2tu
mul
us I
(Lan
ting
and
van
der W
aals
19
71d)
Casp
arie
and
Gro
enm
an-v
an
Waa
terin
ge 1
980
Vaas
sen
219
2262
/477
262
ID 2
74
S24
tum
ulus
II (L
antin
g an
d va
n de
r Waa
ls
1971
d)Ca
spar
ie a
nd G
roen
man
-van
W
aate
ringe
198
0
Vaas
sen
319
2251
/477
294
ID 2
75
S3
tum
ulus
III (
Lant
ing
and
van
der W
aals
19
71d)
Casp
arie
and
Gro
enm
an-v
an
Waa
terin
ge 1
980
Nie
rsen
Nie
rsen
419
1092
/478
801
ID 6
35
G
alge
nber
g 4
(Hol
wer
da 1
908)
Doo
renb
osch
(thi
s vo
lum
e)
Nie
rsen
619
1226
/479
004
ID 6
37
G
alge
nber
g 6
(Hol
wer
da 1
908)
Doo
renb
osch
(thi
s vo
lum
e)
Putt
enPu
tten
1708
00/4
7620
0ID
409
S12
Putt
en (W
ater
bolk
195
4)W
ater
bolk
195
4
Stro
eSt
roe
1787
59/4
6680
1-
S21
Stro
e (B
utle
r and
van
der
Waa
ls 1
967,
124
)Ca
spar
ie a
nd G
roen
man
-van
W
aate
ringe
198
0
Udd
eler
mee
rU
ddel
erm
eer 1
1804
11/4
7337
9-
ba
rrow
223
(RO
B 19
89)
Doo
renb
osch
(thi
s vo
lum
e)
Udd
eler
mee
r 218
0441
/473
390
-
barr
ow 2
24 (R
OB
1989
)D
oore
nbos
ch (t
his
volu
me)
Ugc
hele
nU
gche
len
119
1550
/465
163
?-
ba
rrow
1 (W
ater
bolk
195
4, 9
5)W
ater
bolk
195
4
Ugc
hele
n 4
1915
50/4
6516
3 ?
-
barr
ow 4
(Wat
erbo
lk 1
954,
95)
Casp
arie
and
Gro
enm
an-v
an
Waa
terin
ge 1
980
Vier
hout
enVi
erho
uten
1859
41/4
8308
1 ?
-S2
6Vi
erho
uten
(Lan
ting
and
van
der W
aals
19
72c)
Casp
arie
and
Gro
enm
an-v
an
Waa
terin
ge 1
980
262 ancestral heaths
Renk
um
Barr
ow n
ame
Coor
dina
tes
Barr
ow ID
Bo
urge
ois
(201
3)
Syno
nym
Cas
pari
e an
d G
roen
man
-van
Waa
teri
nge
1980
Oth
er s
ynon
yms
Ori
gina
l pol
len
data
Doo
rwer
thD
oorw
erth
1817
48/4
4382
0ID
400
S16
Doo
rwer
th (H
ulst
et a
l. 19
73)
Casp
arie
and
Gro
enm
an-v
an
Waa
terin
ge 1
980
Renk
umBe
nnek
om 1
1786
38/4
4602
3ID
322
Be
nnek
om K
wad
e O
ord,
tum
ulus
I (v
an
Giff
en 1
954)
Van
Giff
en 1
954
Benn
ekom
Oos
tere
ng17
8750
/446
501
ID 4
27S2
5 Be
nnek
om O
oste
reng
, heu
vel 1
2 (B
ursc
h 19
33)
Casp
arie
and
Gro
enm
an-v
an
Waa
terin
ge 1
980
Ede
117
9301
/449
114
ID 4
103
S27
Heu
vel A
mbe
r, Ed
e 5
(Lan
ting
and
van
der
Waa
ls 1
971a
)Ca
spar
ie a
nd G
roen
man
-van
W
aate
ringe
198
0
Ede
217
9234
/448
629
ID 4
010
S20
Girh
en (L
antin
g an
d va
n de
r Waa
ls 1
976)
Casp
arie
and
Gro
enm
an-v
an
Waa
terin
ge 1
980
Renk
um 1
1789
25/4
4498
2ID
410
6 S4
Kw
aden
oord
, heu
vel Q
(Lan
ting
and
van
der W
aals
197
2b)
Casp
arie
and
Gro
enm
an-v
an
Waa
terin
ge 1
980
Renk
um 2
1789
33/4
4500
0ID
410
7 S6
Kw
aden
oord
, heu
vel S
(Lan
ting
and
van
der W
aals
191
972b
)Ca
spar
ie a
nd G
roen
man
-van
W
aate
ringe
198
0
Renk
um 3
1789
80/4
4407
0ID
450
1S7
Keye
nber
g (M
odde
rman
196
4)Ca
spar
ie a
nd G
roen
man
-van
W
aate
ringe
198
0
Renk
um 4
1789
75/4
4470
2ID
400
2 S8
Kw
aden
oord
Casp
arie
and
Gro
enm
an-v
an
Waa
terin
ge 1
980
Renk
um 5
1793
40/4
4315
0ID
452
4S2
8 Ke
tsbe
rg (v
an G
iffen
195
8)Ca
spar
ie a
nd G
roen
man
-van
W
aate
ringe
198
0
War
nsbo
rn, A
rnhe
mW
arns
born
118
7220
/446
888
?-
S1Sc
haar
sber
gen,
bar
row
1 (W
ater
bolk
195
4,
95-9
8)Ca
spar
ie a
nd G
roen
man
-van
W
aate
ringe
198
0
War
nsbo
rn 2
1871
16/4
4700
9 ?
-
Scha
arsb
erge
n, b
arro
w 2
(Wat
erbo
lk 1
954,
95
-98)
Wat
erbo
lk 1
954,
Cas
parie
and
G
roen
man
-van
Waa
terin
ge 1
980
War
nsbo
rn 3
1870
00/4
4708
0 ?
-
Scha
arsb
erge
n, b
arro
w 3
(Wat
erbo
lk 1
954,
95
-98)
Wat
erbo
lk 1
954
War
nsbo
rn 4
1869
08/4
4705
4 ?
-
Scha
arsb
erge
n, b
arro
w 4
(Wat
erbo
lk 1
954,
95
-98)
Wat
erbo
lk 1
954
War
nsbo
rn 5
1868
91/4
4703
3 ?
-
Scha
arsb
erge
n, b
arro
w 5
(Wat
erbo
lk 1
954,
95
-98)
Wat
erbo
lk 1
954
War
nsbo
rn 6
1868
08/4
4694
1-
Sc
haar
sber
gen,
bar
row
6 (W
ater
bolk
195
4,
95-9
8)W
ater
bolk
195
4
Wol
fhez
eW
olfh
eze
1834
91/4
4600
4-
S31
Wol
fhez
e (H
ulst
197
1)Ca
spar
ie a
nd G
roen
man
-van
W
aate
ringe
198
0
263appendix 1
Goo
iBa
rrow
nam
eCo
ordi
nate
sBa
rrow
ID
Bour
geoi
s (2
013)
Syno
nym
Cas
pari
e an
d G
roen
man
-van
Waa
teri
nge
1980
Oth
er s
ynon
yms
Ori
gina
l pol
len
data
Baar
n (G
root
Dra
kens
tein
/La
ge V
uurs
che)
Baar
n 1
1442
40/4
6604
0ID
414
S13
Gro
ot-D
rake
nste
in, t
umul
us I
(van
Giff
en 1
930)
Casp
arie
and
Gro
enm
an-v
an W
aate
ringe
198
0
Baar
n 2
1442
70/4
6608
0ID
415
S1
4G
root
-Dra
kens
tein
, tum
ulus
III (
van
Giff
en 1
930)
Casp
arie
and
Gro
enm
an-v
an W
aate
ringe
198
0
Baar
n 3
1442
31/4
6612
2-
S29
Gro
ot-D
rake
nste
in, t
umul
us V
(van
Giff
en 1
930)
Casp
arie
and
Gro
enm
an-v
an W
aate
ringe
198
0
Hilv
ersu
m (E
rfgo
oier
stra
at)
Hilv
ersu
m 1
1414
00/4
7280
0ID
291
S1
8Er
fgoo
iers
stra
at, h
euve
l 1 (B
ursc
h 19
35)
Casp
arie
and
Gro
enm
an-v
an W
aate
ringe
198
0
Hilv
ersu
m 2
1411
30/4
7113
0ID
295
S3
2Er
fgoo
iers
stra
at, h
euve
l 5 (B
ursc
h 19
35)
Casp
arie
and
Gro
enm
an-v
an W
aate
ringe
198
0
Hilv
ersu
m 3
1411
30/4
7113
0ID
296
S3
3Er
fgoo
iers
stra
at, h
euve
l 6 (B
ursc
h 19
35)
Casp
arie
and
Gro
enm
an-v
an W
aate
ringe
198
0
Lare
nLa
ren
114
3080
/471
890
ID 3
84
S10
t Blu
k, h
euve
l 6 (R
emou
cham
ps 1
928)
Casp
arie
and
Gro
enm
an-v
an W
aate
ringe
198
0
Lare
n 2
1431
40/4
7210
0ID
388
S1
7t B
luk,
heu
vel 1
0 (R
emou
cham
ps 1
928)
; De
Zeve
n Be
rgje
s, he
uvel
10
(Mod
derm
an 1
954)
Casp
arie
and
Gro
enm
an-v
an W
aate
ringe
198
0
Lare
n 3
1434
00/4
7220
0ID
380
S1
9t B
luk,
heu
vel 2
(Rem
ouch
amps
192
8); D
e Ze
ven
Berg
jes,
heuv
el 2
(Mod
derm
an 1
954)
Casp
arie
and
Gro
enm
an-v
an W
aate
ringe
198
0
Roos
terb
osRo
oste
rbos
1465
60/4
6868
0ID
413
S11
Roos
terb
os, G
rabh
ugel
II (v
an G
iffen
193
0)Ca
spar
ie a
nd G
roen
man
-van
Waa
terin
ge 1
980
264 ancestral heaths
Tote
rfou
t-H
alve
Mijl
Barr
ow n
ame
Coor
dina
tes
Barr
ow ID
Bou
rgeo
is
(201
3)
Syno
nym
Cas
pari
e an
d G
roen
man
-van
Waa
teri
nge
(198
0)O
ther
syn
onym
sO
rigi
nal p
olle
n da
ta
THM
eo:
Alp
hen,
de
Kiek
Alp
hen
112
7220
/389
900
ID 9
2 S3
4A
lphe
n O
p de
Kie
k (M
odde
rman
19
55)
Casp
arie
and
Gro
enm
an-v
an W
aate
ringe
198
0
THM
eo:
Alp
hen,
de
Kwaa
lber
gA
lphe
n 2
1239
35/3
8702
0ID
91
S35
Alp
hen
de K
waa
lber
g (B
eex
1964
c)Ca
spar
ie a
nd G
roen
man
-van
Waa
terin
ge 1
980
THM
eo:
Ber
geijk
Berg
eijk
1466
50/3
6725
0ID
403
Berg
eijk
Witr
ijt (B
eex
1957
)Be
ex 1
957,
Wat
erbo
lk 1
957
THM
eo:
Eer
sel
Eers
el15
0620
/376
030
ID 1
33
D
e G
loei
ende
Eng
elsm
an (B
eex
1964
b)Va
n Ze
ist 1
967b
THM
eo:
Goi
rleG
oirle
1292
70/3
8943
0ID
96
barr
ow 1
(Gla
sber
gen
1954
)W
ater
bolk
195
4
THM
eo:
Hoo
gelo
onH
ooge
loon
114
6220
/379
600
ID 1
37
Zwar
tenb
erg
(Wat
erbo
lk 1
954)
Wat
erbo
lk 1
954
H
ooge
loon
214
6500
/379
570
ID 1
38
Sm
ouse
nber
g (B
eex
1954
)Be
ex 1
954
THM
eo:
Kne
gsel
Moo
rman
laan
Kneg
sel,
Moo
rman
laan
1532
75/3
7783
5ID
113
M
oorm
anla
an (M
odde
rman
and
Ba
kels
197
1)M
odde
rman
and
Bak
els
1971
THM
eo:
Kne
gsel
Urn
enw
egKn
egse
l 115
0715
/378
274
ID 7
8
tum
ulus
E (W
ater
bolk
195
4,
104-
108)
Wat
erbo
lk 1
954
Kn
egse
l 215
0738
/378
384
ID 7
9
tum
ulus
F (W
ater
bolk
195
4,
104-
108)
Wat
erbo
lk 1
954
THM
eo:
Ste
ense
lSt
eens
el
Stee
nsel
(Wat
erbo
lk 1
954,
103
, 10
9-11
0)W
ater
bolk
195
4
THM
: Tot
erfo
ut H
alve
Mijl
THM
115
2242
/380
911
ID 6
45
barr
ow 1
(Gla
sber
gen
1954
)G
lasb
erge
n 19
54
TH
M 1
B15
1903
/380
957
ID 1
0
barr
ow 1
b (G
lasb
erge
n 19
54)
Gla
sber
gen
1954
TH
M 2
1519
12/3
8104
4ID
11
ba
rrow
2 (G
lasb
erge
n 19
54)
Gla
sber
gen
1954
TH
M 3
1518
60/3
8093
7ID
12
ba
rrow
3 (G
lasb
erge
n 19
54)
Gla
sber
gen
1954
TH
M 4
1515
11/3
8135
7ID
646
ba
rrow
4 (G
lasb
erge
n 19
54)
Gla
sber
gen
1954
TH
M 5
1512
90/3
8098
4ID
13
ba
rrow
5 (G
lasb
erge
n 19
54)
Gla
sber
gen
1954
TH
M 6
1512
42/3
8098
5ID
14
ba
rrow
6 (G
lasb
erge
n 19
54)
Gla
sber
gen
1954
TH
M 7
1511
76/3
8098
6ID
15
ba
rrow
7 (G
lasb
erge
n 19
54)
Gla
sber
gen
1954
TH
M 8
1511
65/3
8095
0ID
16
ba
rrow
8 (G
lasb
erge
n 19
54)
Gla
sber
gen
1954
265appendix 1
Tote
rfou
t-H
alve
Mijl
Barr
ow n
ame
Coor
dina
tes
Barr
ow ID
Bou
rgeo
is
(201
3)
Syno
nym
Cas
pari
e an
d G
roen
man
-van
Waa
teri
nge
(198
0)O
ther
syn
onym
sO
rigi
nal p
olle
n da
ta
TH
M 8
A15
1176
/381
050
ID 1
7
barr
ow 8
A (G
lasb
erge
n 19
54)
Gla
sber
gen
1954
TH
M 9
1510
67/3
8109
2ID
18
ba
rrow
9 (G
lasb
erge
n 19
54)
Gla
sber
gen
1954
TH
M 1
015
1074
/380
864
ID 1
9
barr
ow 1
0 (G
lasb
erge
n 19
54)
Gla
sber
gen
1954
TH
M 1
115
1087
/380
835
ID 2
0
barr
ow 1
1 (G
lasb
erge
n 19
54)
Gla
sber
gen
1954
TH
M 1
315
0860
/380
713
ID 2
2
barr
ow 1
3 (G
lasb
erge
n 19
54)
Gla
sber
gen
1954
TH
M 1
415
0825
/380
710
ID 2
3
barr
ow 1
4 (G
lasb
erge
n 19
54)
Gla
sber
gen
1954
TH
M 1
515
0793
/380
711
ID 2
4
barr
ow 1
5 (G
lasb
erge
n 19
54)
Gla
sber
gen
1954
TH
M 1
615
0773
/380
706
ID 2
5
barr
ow 1
6 (G
lasb
erge
n 19
54)
Gla
sber
gen
1954
TH
M 1
715
0750
/380
759
ID 2
6
barr
ow 1
7 (G
lasb
erge
n 19
54)
Gla
sber
gen
1954
TH
M 1
915
0723
/380
751
ID 2
8
barr
ow 1
9 (G
lasb
erge
n 19
54)
Gla
sber
gen
1954
TH
M 2
015
0714
/380
771
ID 2
9
barr
ow 2
0 (G
lasb
erge
n 19
54)
Gla
sber
gen
1954
TH
M 2
115
0643
/380
738
ID 3
0
barr
ow 2
1 (G
lasb
erge
n 19
54)
Gla
sber
gen
1954
TH
M 2
215
0610
/380
731
ID 3
1
barr
ow 2
2 (G
lasb
erge
n 19
54)
Gla
sber
gen
1954
TH
M 2
2A15
0640
/380
753
ID 3
2
barr
ow 2
2A (G
lasb
erge
n 19
54)
Gla
sber
gen
1954
TH
M 2
315
0601
/380
713
ID 3
3
barr
ow 2
3 (G
lasb
erge
n 19
54)
Gla
sber
gen
1954
TH
M 2
415
0582
/380
725
ID 3
4
barr
ow 2
4 (G
lasb
erge
n 19
54)
Gla
sber
gen
1954
TH
M 2
515
0572
/380
712
ID 3
5
barr
ow 2
5 (G
lasb
erge
n 19
54)
Gla
sber
gen
1954
TH
M 2
615
0553
/380
734
ID 3
6
barr
ow 2
6 (G
lasb
erge
n 19
54)
Gla
sber
gen
1954
TH
M 2
815
0562
/380
704
ID 3
8
barr
ow 2
8 (G
lasb
erge
n 19
54)
Gla
sber
gen
1954
TH
M 2
915
0546
/380
722
ID 3
9
barr
ow 2
9 (G
lasb
erge
n 19
54)
Gla
sber
gen
1954
266 ancestral heaths
Oss
-Zev
enbe
rgen
Barr
ow n
ame
Coor
dina
tes
Barr
ow ID
Bo
urge
ois
(201
3)
Syno
nym
Cas
pari
e an
d G
roen
man
-van
W
aate
ring
e (1
980)
Oth
er s
ynon
yms
Ori
gina
l pol
len
data
Scha
ijkSc
haijk
1730
60/4
1656
0ID
3
tum
ulus
3 (v
an G
iffen
194
9)Va
n G
iffen
194
9, W
ater
bolk
195
4
Slab
roek
Slab
roek
39
-
he
uvel
39
(van
Wijk
200
5b)
De
Kort
and
van
Mou
rik 2
005
Sl
abro
ek 4
0
-
heuv
el 4
0 (v
an W
ijk 2
005b
)D
e Ko
rt a
nd v
an M
ourik
200
5
Vors
sel
Vors
sel
-
Vo
rsse
l (de
Kor
t 200
5)D
e Ko
rt 2
005
Oss
Vor
sten
graf
Oss
Chi
efta
in’s
grav
e16
7070
/415
780
-
Vors
teng
raf (
Burs
ch 1
937)
De
Kort
199
9
Ch
ieft
ain’
s gr
ave
BA-b
arro
w
-
Bron
stijd
graf
(Fok
kens
and
Jans
en 2
005)
De
Kort
199
9
Oss
Zev
enbe
rgen
Oss
-Zev
enbe
rgen
116
8105
.58/
4161
17.2
4-
he
uvel
1 (F
okke
ns e
t al.
2009
b)D
e Ko
rt 2
009
O
ss-Z
even
berg
en 2
1679
14.4
4/41
6042
.36
-
tum
ulus
III (
Verw
ers
1966
), he
uvel
2
(Fok
kens
et a
l. 20
09b)
De
Kort
200
9
O
ss-Z
even
berg
en 3
1679
30.8
7/41
6129
.25
-
tum
ulus
IV (V
erw
ers
1966
), he
uvel
3
(Fok
kens
et a
l. 20
09b)
De
Kort
200
9
O
ss-Z
even
berg
en 4
1678
67.7
6/41
6087
.00
-
heuv
el 4
(Fok
kens
et a
l. 20
09b)
De
Kort
200
9
O
ss-Z
even
berg
en 6
1680
06.6
1/41
6082
.51
-
tum
ulus
V (V
erw
ers
1966
), he
uvel
6
(Fok
kens
et a
l. 20
09b)
Bake
ls a
nd A
chte
rkam
p 20
13
O
ss-Z
even
berg
en 7
1680
34.3
5/41
6097
.91
-
tum
ulus
VI (
Verw
ers
1966
), he
uvel
7
(Fok
kens
et a
l. 20
09b)
Acht
erka
mp
2009
, Bak
els
and
Acht
erka
mp
2013
O
ss-Z
even
berg
en 8
1679
72.4
8/41
6073
.16
-
tum
ulus
I (V
erw
ers
1966
), he
uvel
8
(Fok
kens
et a
l. 20
09b)
De
Kort
200
9
O
ss-Z
even
berg
en 9
1679
68.6
0/41
6085
.79
heuv
el 9
(Fok
kens
et a
l. 20
09b)
-
O
ss-Z
even
berg
en 1
016
7922
.36/
4160
87.0
0
he
uvel
10
(Fok
kens
et a
l. 20
09b)
-
O
ss-Z
even
berg
en 1
116
7902
.44/
4160
72.7
2
he
uvel
11
(Fok
kens
et a
l. 20
09b)
De
Kort
200
9
O
ss-Z
even
berg
en 1
216
7913
.70/
4160
85.7
7
he
uvel
12
(Fok
kens
et a
l. 20
09b)
De
Kort
200
9
M
ound
516
7953
.77/
4160
63.8
1
tu
mul
us V
(Ver
wer
s 19
66),
heuv
el 5
(F
okke
ns e
t al.
2009
b)D
e Ko
rt 2
009
Tota
l num
ber o
f bar
row
s in
thes
is97
267appendix 2
Appendix�2
Trees and shrubs
Herbs and alga
Scientific English Dutch
Alnus Alder Els
Betula Birch Berk
Carpinus Hornbeam Haagbeuk
Corylus Hazel Hazelaar
Fagus Beech Beuk
Fraxinus Ash Es
Hedera helix Ivy Klimop
Pinus Pine Den
Populus Popular Populier
Quercus Oak Eik
Rubus Bramble Braam
Salix Willow Wilg
Tilia Lime Linde
Ulex Gorse Gaspeldoorn
Ulmus Elm Iep
Castanea Chestnut Kastanje
Sambucus nigra Elder Vlier
Scientific English Dutch
Angelica archangelica Garden angelica Grote engelwortel
Anthriscus sylvestris Cow parsley Fluitenkruid
Apiaceae Umbellifer family Schermbloemenfamilie
Artemisia Mugwort Alsem
Asteraceae Composite family Composietenfamilie
Asteraceae liguliflorae Composite family (liguliflorae refers to morphology) Lintbloemige composieten
Asteraceae tubuliflorae Composite family (tubuliflorae refers to morphology) Buisbloemige composieten
Botryococcus Green microalga Groene algensoort
Brassicaceae Crucifer family Kruisbloemenfamilie
Calluna vulgaris Common heather Struikhei
Cannabis sativa Hemp Hennep
Caryophyllaceae Carnation family Anjerfamilie
Cerealia Cereals Granen
Chenopodiaceae Goosefoot family Ganzenvoetfamilie
Chrysosplenium Golden saxifrage Goudveil
Cyperaceae Sedges Cypergrassenfamilie
Debarya glyptosperma Green alga Groene algensoort
Empetrum nigrum Black crowberry Kraaiheide
Ericaceae Heather Heidefamilie
Galium Bedstraw Walstro
Huperzia selago Fir club moss Dennenwolfsklauw
Jasione montana Sheepsbit Zandblauwtje
268 ancestral heaths
Pollen types
Appendix II. Scientific names of all the taxa that have been identified in the palynological analyses of this thesis. Taxa have been divided into three groups: trees and shrubs, herbs and alga and so-called pollen-types. The pollen-types refer to morphologically similar pollen-types and do not necessarily represent the taxa the types are named after. According to Beug (2004, 33):
Dit proefschrift gaat over de geschiedenis van prehistorische grafheuvelland-schappen in Midden- en Zuid-Nederland, gereconstrueerd door middel van palynologisch onderzoek (onderzoek met behulp van pollenanalyses). Het proefschrift bestaat uit drie delen. In deel 1 wordt de achtergrond van het onderzoek behandeld (hoofdstuk 1). Vervolgens wordt een overzicht gegeven van hoe palynologisch onderzoek van grafheuvels zich ontwikkeld heeft (hoofdstuk 2) en tenslotte worden de onderzoeksvragen die de basis vormen van dit promotieonderzoek uiteengezet (hoofdstuk 3).
In deel 2 wordt de methodologie die gebruikt is om de onderzoeksvragen te kunnen beantwoorden besproken en bediscussieerd. Hoofdstuk 4 geeft een overzicht van de technieken die gebruikt zijn om grafheuvels te bemonsteren. In hoofdstuk 5 komt de discussie over hoe pollendiagrammen gebaseerd op pollen uit minerale bodems gebruikt kunnen worden om een vegetatiegeschiedenis te reconstrueren aan de orde. In hoofdstuk 6 wordt de zogenaamde pollensom die gebruikt wordt in grafheuvel-pollenonderzoek besproken en opnieuw vastgesteld. Hoofdstuk 7 gaat over de vraag hoe je de grootte van een open plek waar een grafheuvel in gebouwd werd kunt bepalen.
In het laatste deel, deel 3, komt het palynologisch onderzoek naar grafheuvels in vijf gebieden aan de orde (hoofdstuk 8-12). In hoofdstuk 13 en 14 worden de resultaten van deze deelonderzoeken samengevoegd en bediscussieerd om zo tot een reconstructie van de geschiedenis van het grafheuvellandschap te komen.
Hieronder volgt een samenvatting per hoofdstuk.
Deel 1
H1: Er zijn in Europa honderdduizenden grafheuvels bekend, waarvan er zo’n 3000 in Nederland liggen. De meeste van deze grafheuvels dateren uit het 3e en 2e millennium voor Christus en in die tijd waren ze zo talrijk dat ze waarschijnlijk hele ‘grafheuvellandschappen’ vormden. Maar welke rol speelden grafheuvels eigenlijk in het landschap en hoe zag zo’n grafheuvellandschap er uit? Er zijn in de vorige eeuw veel reconstructies gemaakt van de vegetatie in de directe omgeving van een grafheuvel, maar een totale landschapsreconstructie ontbreekt. Om te kunnen begrijpen welke betekenis grafheuvels hadden in het landschap is het van belang om niet alleen te kijken naar de locale vegetatiereconstructies, maar om het landschap waarin de grafheuvels gebouwd werden in een breder perspectief te bekijken. Ook is het van belang meer te weten te komen over de ontstaans- en gebruiksgeschiedenis van deze landschappen.
Vragen over deze grafheuvellandschappen komen niet alleen voort uit wetenschappelijke, maar ook uit maatschappelijke interesse. Staatsbosbeheer, als beheerder van vele natuurreservaten in Nederland waar grafheuvels te vinden zijn, is bijvoorbeeld geïnteresseerd in hoe het landschap rond deze heuvels er oorspronkelijk uitzag. De organisatie wil meer informatie aan het publiek kunnen geven over de grafheuvels en ze, indien mogelijk, laten zien in hun oorspronkelijke omgeving. Informatie over het oorspronkelijke landschap waarin heuvels lagen is voor de organisatie van belang om hun (landschappelijk) beleid hierop aan te kunnen passen.
H2: Over het algemeen wordt aangenomen dat het grootste deel van Midden- en Zuid-Nederland (de gebieden waar dit onderzoek zich op gericht heeft) ten tijde dat de eerste grafheuvels gebouwd werden (tijdens het Subboreaal) nog grotendeels bedekt was met bos. In de vorige eeuw is al veel onderzoek gedaan naar de directe
270 ancestral heaths
omgeving van grafheuvels, waaruit is gebleken dat grafheuvels gebouwd werden op open plekken. Over het ontstaan en gebruik van deze open plekken is nauwelijks iets bekend. Wellicht was het landschap van nature in deze tijd al veel meer open dan over het algemeen wordt aangenomen. Daarnaast kunnen bijvoorbeeld storm of overstromingen de oorzaak zijn van open plekken. Een andere mogelijkheid is dat open plekken ontstaan zijn door toedoen van de mens. Zo is in het Neolithicum veel bos verdwenen (bijvoorbeeld gekapt of verbrand) om bijvoorbeeld ruimte te maken voor landbouwactiviteiten, het bouwen van nederzettingen (huizen, schuurtjes, hekwerken etc.) of misschien wel om een open plek te creëren om een grafheuvel in te bouwen. Het is op dit moment niet duidelijk wat voor open plekken gebruikt werden om grafheuvels in te bouwen en of de oorsprong van zo’n open plek belangrijk was voor de grafheuvelbouwers. Wellicht had men een voorkeur voor voorouderlijke gronden, dat wil zeggen gronden die al lange tijd in gebruik waren geweest door de voorouders van de grafheuvelbouwers. Ook is het onbekend hoe groot de open plekken waren die uitgekozen werden voor grafheuvels.
H3: Om antwoord te geven op de vragen die in de voorgaande hoofdstukken naar voren komen is er een vijftal onderzoeksvragen geformuleerd:
Hoe zag een grafheuvellandschap eruit en wat is de ontstaans- en gebruiksgeschiedenis van zo’n landschap?Werden grafheuvels gebouwd op voorouderlijke gronden?Wat was de grootte van een open plek waar grafheuvels in gebouwd werden en wat was de afstand van een grafheuvel tot de bosrand?Welke rol speelden grafheuvels in het landschap? Hoe stond de geschiedenis van een grafheuvellandschap in verband met het natuurlijke en culturele landschap in de omgeving van grafheuvels?Welk advies is te geven aan Staatsbosbeheer en andere instanties met betrekking tot het herstellen van oorspronkelijke grafheuvellandschappen voor publieke doeleinden?
Om deze onderzoeksvragen te beantwoorden is het onderzoek gericht op het midden en zuiden van Nederland, aangezien daar veel grafheuvels te vinden zijn. Deze grafheuvels stammen uit de periode van het Laat-Neolithicum tot de Midden-Bronstijd (2900-1100 BC). Van deze grafheuvels zijn al veel gegevens beschikbaar van waaruit verder onderzoek gedaan kon worden. Om de vragen te beantwoorden is vooral gebruik gemaakt van palynologisch onderzoek. Zowel bestaande als voor dit onderzoek nieuw gegenereerde pollendata zijn gebruikt om uitgebreide vegetatiereconstructies te maken.
Deel 2
H4: Palynologisch onderzoek, oftewel onderzoek met behulp van pollen (stuifmeel) analyses, is gebaseerd op het feit dat pollen over het algemeen erg goed bewaard blijft onder de juiste omstandigheden. Pollenkorrels worden verspreid en komen uiteindelijk terecht op het bodemoppervlak. Dit pollen zal in de loop van de tijd verder de bodem inzakken of verdwijnen door corrosie. Omdat er een evenwicht is tussen het verdwijnen en opnieuw neerregenen van pollen, zullen de pollenkorrels die in de bovenste laag van de bodem te vinden zijn representatief zijn voor de planten die in de (nabije en verdere) omgeving staan en deze pollenkorrels verspreiden. Op het moment dat er een grafheuvel gebouwd wordt, wordt de toplaag van de bodem waarin zich dit pollen bevindt afgesloten van de buitenlucht. Er kunnen geen nieuwe pollenkorrels meer bijkomen en pollenkorrels die al aanwezig zijn zullen niet zo snel meer verdwijnen. Het pollenspectrum dat
1.
2.3.
4.
5.
271samenvatting
verkregen wordt uit pollen dat onder een grafheuvel ligt (van het zogenaamde oud oppervlak) is dus representatief voor de vegetatie die in de omgeving stond op het moment dat de grafheuvel opgeworpen werd. In hoofdstuk 4 wordt de techniek van de pollenbemonstering van de bodem in en onder grafheuvels, van greppels rondom grafheuvels en van sporen in de omgeving van grafheuvels beschreven.
H5: een relatief nieuwe methode is gebruikt om meer informatie te krijgen over de vegetatiegeschiedenis van een open plek. Deze methode houdt in dat een bodemprofiel verticaal centimeter voor centimeter onder een grafheuvel bemonsterd en geanalyseerd wordt op pollen. Er wordt vanuit gegaan dat hoe dieper in de bodem, hoe ouder het vegetatiebeeld is dat een pollenspectrum geeft. Deze methode en de interpretatie ervan worden uitgebreid bediscussieerd in hoofdstuk 5.
H6: Het absolute aantal pollen in een pollenmonster kan aanzienlijk variëren. Om pollenspectra van verschillende monsters met elkaar te kunnen vergelijken worden de pollentypes uitgedrukt als percentages van een zogenaamde pollensom. Deze pollensom kan bestaan uit alle pollentypes of uit een selectie daarvan. Welke pollensom het beste is om te gebruiken is afhankelijk van de onderzoeksvraag en het onderzoeksgebied. De vraag is nu welke pollensom het meest geschikt is om te gebruiken bij het reconstrueren van grafheuvellandschappen. De meest gebruikte pollensom in het grafheuvelonderzoek is de zogenaamde boompollensom minus Betula�(berk). De pollentypes van de kruidenvegetatie en de Betula worden uit de pollensom gelaten, omdat deze soorten lokaal veel voorkomen en daardoor sterk kunnen variëren in pollenspectra, zelfs als deze spectra komen van grafheuvels die dicht bij elkaar liggen of van een en dezelfde grafheuvel. Deze pollensom is echter maar eenmalig vastgesteld en daarna niet meer gecontroleerd. Daarom is besloten om nogmaals onderzoek te doen naar de meest geschikte pollensom voor grafheuvelonderzoek. Dit onderzoek wordt besproken in hoofdstuk 6.
Er zijn twee methoden gebruikt voor dit onderzoek. Als eerste is er een vergelijking gemaakt tussen een pollenspectrum van een monster uit veen en een gelijktijdig pollenspectrum uit een greppel die rondom een nabijgelegen grafheuvel gegraven is. Een pollenspectrum uit veen wordt geacht de regionale vegetatie weer te geven en door dit spectrum te vergelijken met het greppelspectrum zou vastgesteld moeten kunnen worden welke pollentypes de lokale grafheuvelvegetatie weergeven en welke dus uit de pollensom gelaten moeten worden. Ten tweede zijn meerdere pollenspectra van oude oppervlakten vanonder gelijktijdige en bij elkaar in de buurt gelegen grafheuvels met elkaar vergeleken. Deze pollenspectra zouden een (vrijwel) identiek beeld van de vegetatie moeten geven.
Uit het onderzoek is gebleken dat de meest geschikte pollensom voor grafheuvelonderzoek een boompollensom is, dus een pollensom waaruit alle kruiden weggelaten zijn. Of Betula al dan niet ook weggelaten moet worden lijkt te verschillen per site. Om alle grafheuvelpollenspectra met elkaar te kunnen vergelijken is besloten om voor alle pollenanalyses in dit onderzoek een boompollensom minus Betula te gebruiken.
H7: In hoofdstuk 7 worden drie typen onderzoek beschreven naar de grootte van een open plek waar een grafheuvel in gebouwd werd. Bij het eerste type onderzoek wordt er vanuit gegaan dat de plaggen die gebruikt werden om de grafheuvel te bouwen in de directe omgeving gestoken werden. Uit onderzoek is gebleken dat de plaggen gestoken zijn in heidevegetatie. Het aantal plaggen dat nodig is geweest om een grafheuvel te gebruiken kan dan uitgedrukt worden in de oppervlakte die minimaal vrij geweest moet zijn van bomen.
272 ancestral heaths
Voor het tweede type onderzoek zijn er (oppervlakte) pollenmonsters genomen in huidige heidevelden die zoveel mogelijk lijken op de heidevelden ten tijde van de grafheuvelbouw. Deze pollenmonsters zijn op verschillende afstanden van de bosrand genomen om op deze manier de relatie te kunnen bepalen tussen een boompollenpercentage en de afstand van de monsterlocatie tot de bosrand. Dit heeft geresulteerd in een zogenaamde ADF (average distance to the forest) per boompollenpercentage. Op deze manier kan dus bij een bepaald percentage boompollen in een grafheuvelmonster de gemiddelde afstand vanaf de grafheuvel tot de bosrand bepaald worden.
Het derde onderzoek heeft zich gericht op simulatiemodellen die vrij recentelijk ontwikkeld zijn (en nog steeds in ontwikkeling zijn). Met deze simulatiemodellen kunnen landschappen met een bepaalde vegetatiesamenstelling vertaald worden in pollenpercentages die daarbij horen. Voor deze modellen zijn verschillende parameters nodig die kunnen verschillen per regio. Deze parameters zijn nog niet beschikbaar voor Nederland. De parameters die gebruikt zijn voor dit onderzoek zijn afkomstig uit eerder onderzoek uit Zuid-Zweden en voor dit onderzoek getest op een Nederlands landschap met een bekende vegetatiesamenstelling en bijbehorende pollenpercentages. Hieruit bleek dat de Zuid-Zweedse parameters toepasbaar zijn in Nederland. Vervolgens zijn van een van de grafheuvellocaties uit dit onderzoek verschillende landschapsscenario’s gemaakt, met gebruikmaking van de simulatiemodellen. Het landschapsscenario waaruit pollenpercentages kwamen die het dichtst lagen bij de werkelijk gevonden pollenpercentages uit de grafheuvels is gekozen als het meest waarschijnlijke landschapsscenario.
Deel 3
H8-13: In deze hoofdstukken worden vijf verschillende case-studies besproken. Ruim 100 grafheuvels in vijf verschillende gebieden zijn palynologisch onderzocht om een antwoord te krijgen op de onderzoeksvragen uit hoofdstuk 3. Een deel van de pollendata is verkregen uit nieuw onderzoek, gebaseerd op de methoden die beschreven zijn in hoofdstuk 4. Het grootste deel van de pollendata is afkomstig uit eerder onderzoek dat verricht is door verschillende andere onderzoekers. Deze pollendata zijn voor het huidige onderzoek opnieuw geanalyseerd en geïnterpreteerd met behulp van de methoden en theorieën beschreven in hoofdstukken 5-7. In hoofdstuk 13 worden de resultaten van alle case-studies samengevoegd en bekeken in een breder perspectief om een grafheuvellandschap beter te kunnen definiëren.
Het is gebleken dat grafheuvels op de Pleistocene zandgronden van Midden- en Zuid-Nederland gebouwd werden in open plekken die bedekt waren met heide. Deze open plekken varieerden in grootte. De kleinste open plekken hadden een ADF (gemiddelde afstand vanaf de grafheuvel tot de bosrand) van 50-100 m, terwijl de grootste open plekken een ADF hadden van 300-500 m. Het originele aantal grafheuvels in Nederland was nog vele malen groter dan het aantal dat tegenwoordig nog bewaard is gebleven. Er vanuit gaande dat alle niet onderzochte grafheuvels ook in heide opgeworpen zijn, zal het Nederlandse landschap dus vele open plekken met heide gekend hebben. De pollendata geven aan dat de meeste grafheuvels in redelijk kleine open plekken lagen, maar dit kan een misleidend beeld geven. Vele grafheuvels, vooral in het Laat-Neolithicum, werden namelijk gebouwd in zogenaamde alignments, rijen van grafheuvels, die kilometers lang konden zijn. Het is zeer aannemelijk dat de heideveldjes waarin deze grafheuvels gebouwd werden met elkaar verbonden waren, zodat weliswaar redelijk smalle (100-200 m breed), maar kilometers lange heidevelden ontstonden. Dit is waarschijnlijk
273samenvatting
het geval geweest in Renkum (hoofdstuk 8), Niersen-Vaassen (hoofdstuk 8), Toterfout-Halve Mijl (hoofdstuk 11) en Oss-Zevenbergen (hoofdstuk 12).
De heidevelden werden omgeven door bos, dat ook deel uitmaakte van het grafheuvellandschap. De bossen in de drogere delen van het landschap werd over het algemeen gedomineerd door Quercus (eik) met aan de bosranden vooral Corylus (hazelaar). In de nattere gebieden was voornamelijk elzenbroekbos te vinden, gedomineerd door Alnus (els).
Heidevelden, waar het grafheuvellandschap voor het grootste gedeelte uit bestond, hebben een bijzondere eigenschap, namelijk dat ze onderhouden moeten worden om te kunnen blijven bestaan. Als heide niet onderhouden wordt zullen andere plantensoorten de heide verdringen. Heidemanagement kan gedaan worden door middel van begrazen (of maaien), afplaggen en/of afbranden. Het afplaggen op grote schaal is in dit onderzoek niet aangetoond, maar aangezien plaggen gebruikt werden om grafheuvels te bouwen zal dit zeker hebben plaatsgevonden. Ook zijn er geen aanwijzingen dat er op grote schaal heide afgebrand is. Uit dit onderzoek is gebleken dat de grafheuvelheidevelden waarschijnlijk voornamelijk begraasd werden door vee: koeien en schapen. Om een heideveld te onderhouden is 1 schaap per hectare nodig en/of 1 rund per 5-6 hectare. Een gemiddelde ADF van 100 m per grafheuvel staat gelijk aan een heideveldje van 3 ha per grafheuvel. Om zo’n heideveld te onderhouden zijn dus 3 schapen en/of 0.5 runderen nodig. Er is een schatting gemaakt dat in de omgeving van Ermelo ongeveer 134 grafheuvels lagen in de Midden- Bronstijd. Deze grafheuvels lagen waarschijnlijk allemaal in een heideveld, wat neerkomt op een totale oppervlakte aan heide van ongeveer 420 ha. Om deze heide te onderhouden zijn 420 schapen nodig en/of 70 runderen. Waarschijnlijk bezat een huishouden in de Midden-Bronstijd B een veestapel van ongeveer 30 dieren, waarvan 2/3 rund en 1/3 schaap. Dit houdt in dat 3-4 huishoudens een gebied van 420 ha konden onderhouden. Een ADF van 100 m is een voorzichtige schatting. Als uitgegaan wordt van een ADF van 250 m, dan is de oppervlakte aan heidevegetatie 2630 ha geweest. Daarvoor waren 20 huishoudens nodig met elk 20 runderen en 10 schapen. Deze huishoudens zullen samengewerkt moeten hebben als zogenaamde heidegemeenschappen om de heide te kunnen onderhouden.
Het is niet te zeggen of het onderhouden van de heidevelden daadwerkelijk het doel was van de begrazing, het kan ook onderdeel geweest zijn van de dagelijkse agrarische activiteiten van de prehistorische mensen die in dat gebied woonden. In elk geval was dan een bijkomend gevolg dat vele heidevelden onderhouden werden, heidevelden die een zeer belangrijk onderdeel, zo niet het belangrijkste onderdeel, vormden van het grafheuvellandschap.
Dit onderzoek heeft aangetoond dat de open plekken al langere tijd bestonden voordat er grafheuvels in gebouwd werden. Het is niet altijd duidelijk waar deze open plekken voor gebruikt werden, maar in de meeste gevallen lijkt er al langere tijd sprake geweest te zijn van een begroeiing met heidevegetatie die begraasd werd. Dit betekent niet alleen dat het landschap waarschijnlijk al behoorlijk open geweest moet zijn voordat de eerste grafheuvels gebouwd werden, in tegenstelling tot wat over het algemeen aangenomen wordt (zie hoofdstuk 2), maar ook dat grote delen van het landschap (namelijk de heide) al intensief onderhouden werden. De begrazing van heidevelden maakte onderdeel uit van het dagelijkse leven van de prehistorische mensen, al is niet bekend waar zij dan precies woonden. Wel is duidelijk dat ze niet in directe omgeving van een grafheuvel woonden, maar het is aannemelijk dat ze binnen ‘begrazingsafstand’ woonden.
Een van de onderzoeksvragen is of grafheuvels gebouwd werden op voorouderlijke gronden. Het antwoord hierop is hoogstwaarschijnlijk ‘ja’. Grafheuvels werden gebouwd in heidevelden die al lange tijd onderdeel
274 ancestral heaths
uitmaakten van het dagelijkse leven van hun voorouders en de heidevelden kunnen dus gezien worden als voorouderlijke heidevelden. Tevens is aangetoond dat grafheuvels een belangrijke rol gespeeld moeten hebben in het landschap. Het beeld dat we krijgen vanuit de grafheuvel pollenanalyses is natuurlijk niet representatief voor het totale landschap en laat alleen het deel met grafheuvels zien. Maar het maakt wel duidelijk dat grafheuvels een speciale plek innamen. Dit onderzoek heeft aangetoond dat de ligging van grafheuvels niet gebonden is aan de ligging van akkers en nederzettingen en dat de zichtbaarheid van de grafheuvels vaak een belangrijke rol speelde. Tegelijkertijd werden grafheuvels geïntegreerd in het dagelijks leven en maakten ze deel uit van de economische zone (door middel van begrazing) van de prehistorische mens. Het grafheuvellandschap werd gedomineerd door heide. Vele generaties heidegemeenschappen werkten samen om deze heidevelden te onderhouden. Niet alleen vormden heidevelden de laatste rustplaats voor voorouders, ook waren de heidevelden al lange tijd gebruikt en onderhouden door deze voorouders. Terwijl de rest van het landschap enorme veranderingen onderging in de vorm van cultivatie in de periode van het Laat-Neolithicum naar de IJzertijd, vormden de heidevelden waar grafheuvels in lagen een zeer stabiel en structurerend element in het landschap gedurende duizenden jaren.
H14: In hoofdstuk 14 wordt een synthese gegeven op basis van de voorafgaande hoofdstukken. De onderzoeksvragen die in hoofdstuk 3 gesteld zijn worden beantwoord.
Het grafheuvellandschap werd gedomineerd door heidevelden die al langere tijd bestonden voordat er grafheuvels in gebouwd werden. Ze werden omgeven door loofbos. Deze heidevelden moesten onderhouden worden, wat hoogstwaarschijnlijk gebeurde door middel van begrazing. In deze grafheuvel-heidevelden lagen een of meerdere grafheuvels en de heidevelden waren vaak met elkaar verbonden. Op deze manier vormden ze uitgestrekte (smalle) heidevelden, als corridors in het landschap. Het grafheuvellandschap was zeer stabiel en werd gedurende vele generaties in stand gehouden.
Gebaseerd op dit onderzoek is het zeer waarschijnlijk dat grafheuvels op voorouderlijke gronden gebouwd werden. Grafheuvels werden gebouwd in heidevelden die begraasd werden, niet alleen toen de grafheuvel gebouwd was, maar ook al lange tijd daarvoor. Deze heidevelden werden dus al gedurende lange tijd gebruikt door waarschijnlijk de voorouders van de grafheuvelbouwers.
De open plekken waar grafheuvels in gebouwd werden varieerden in grootte van vrij klein (ADF = 50-100 m) tot behoorlijk groot (ADF = 300-500 m), hoewel zulke grote open plekken alleen aangetoond zijn bij de allerjongste onderzochte grafheuvels. Waarschijnlijk werden de meeste grafheuvels gebouwd in open plekken met een ADF van 50-150 m. Deze smalle open plekken konden echter wel vele kilometers lang zijn.
De rol van grafheuvels in het landschap lijkt tweeledig te zijn. Ten eerste namen grafheuvels een speciale plek in. Ze werden gebouwd in heidevelden die waarschijnlijk niet direct bij een nederzetting of akkers lagen en waar zichtbaarheid een belangrijke rol speelde. Ten tweede waren grafheuvels geïntegreerd in het dagelijkse leven van de mensen. Het grafheuvellandschap was onderdeel van hun economische zone en werd gebruikt voor begrazing. In de periode van het Laat-Neolithicum naar de IJzertijd werden grote delen van het landschap steeds meer gecultiveerd. In deze periode van verandering vormden de heidevelden waar grafheuvels in lagen een zeer stabiel element in het landschap gedurende duizenden jaren.
De gebieden waar grafheuvels in liggen maken tegenwoordig vaak onderdeel uit van natuurreservaten. De beheerders van deze natuurreservaten willen de grafheuvels graag zo veel mogelijk in hun oorspronkelijke omgeving aan het publiek tonen. De reconstructie van het grafheuvellandschap zoals hierboven besproken is geeft een goede indicatie van hoe de omgeving van een grafheuvel eruit gezien moet hebben. In elk geval lagen de grafheuvels in heide. De grootte van het heideveld verschilde van grafheuvel tot grafheuvel. De grootte van het heideveld dat om een grafheuvel gerealiseerd kan worden is waarschijnlijk meer afhankelijk van de hedendaagse dan van de vroegere omstandigheden. De huidige omstandigheden verschillen enorm ten opzichte van de grafheuvelperiode. Verzuring, bemesting en uitdroging hebben de conditie van de bodem beïnvloed en zullen dus ook van invloed zijn op het onderhouden van een heideveld en het omliggende bos.
Wat betreft het beheer van het Nederlandse cultureel erfgoed: nu wordt vaak alleen de grafheuvel zelf als monument beschouwd en in sommige gevallen een zone van 10 m rondom een grafheuvel. Dit onderzoek heeft aangetoond dat de heide rondom een grafheuvel onlosmakelijk verbonden was met de grafheuvel en deze heide strekte zich veel verder uit dan 10 m rondom een grafheuvel. Daarnaast is in een aantal grafheuvelgroepen aangetoond (Oss-Zevenbergen, hoofdstuk 12.1 en Echoput, hoofdstuk 8.1) dat de omgeving van een grafheuvel van zeer grote archeologische waarde kan zijn. ZO werden er bijvoorbeeld ceremoniële palenrijen gebruikt. Het is dan ook belangrijk om het te beschermen gebied rondom een grafheuvel te vergroten om waardevol Nederlands cultureel erfgoed te behouden.
277acknowledgments
Acknowledgments
I would like to thank all who helped me accomplishing the task of writing this dissertation. I hope I’m not forgetting anyone.
First of all I would like to thank my colleagues from the Ancestral Mounds Project, Quentin Bourgeois, Karsten Wentink, Corrie Bakels, David Fontijn en Annelou van Gijn. As being a freshman in archeology when I started this project almost 5 years ago they greatly helped me with getting acquainted with this beautiful profession.
By having several discussions on the subject, helping me to solve practical problems, structuring my dissertation, etc., they made a great contribution to the final result of this dissertation. I would like to thank the Netherlands Organisation for Scientific Research (Nederlandse Organisatie voor Wetenschappelijk Onderzoek - NWO) for financing the Ancestral Mounds Project.
I am very thankful to all who made it possible for me to find suitable sample locations for my research and getting permission to get access to these locations: Andre ten Hoedt, Poul Hulzink, Klaas van der Laan, Kroondomein Het Loo and Staatsbosbeheer. I would also like to thank the following for joining me (several times) in the field and/or the laboratory: Eric Dullaert, Goof van Eijk and Wim Kuijper. I’m also very grateful to all who provided me with many data without which it would have been impossible to do this research: Prof. W. Groenman, Prof H.T. Waterbolk, Marjolein Bouman, Bas van Geel and Jan Willem de Kort. Then there are several people who helped me out with several problems and difficulties by advising me in the methodology and having very useful discussions with me on the interpretation of the data: Roy van Beek, Harry Fokkens, Hans Huisman, Richard Jansen, Cris van der Linde, Jan van Mourik, Anne Birgitte Nielsen, Joanne Porck, Jan Sevink and Maarten Wispelwey.
Thanks to several colleagues for having all kind of (ir)relevant discussions during well needed breaks from the work: Stijn van As, Erica van Hees, Arjan Louwen, Sasja van der Vaart and Alexander Verpoorte. Thanks go to Hylke de Jong for proof-reading my thesis and Sidestone for editing and publishing my dissertation. I would like to thank Jelte Rozema and Sjoerd Bohncke for introducing me to palaeoecology and palynology, while I was still a doctoral Biology student at the Free University of Amsterdam.
And last but not least, for all their love and support, I would very much like to thank Zavit, Zev, family and friends.
279curriculum vitae
Curriculum�Vitae
Marieke Doorenbosch was born in 1980 in Amsterdam. From 1992 to 1998 she went to the Gymnasium of the Rijksscholen Gemeenschap Lingecollege in Tiel. In 1998 she started studying Biology at the Free University of Amsterdam from which she graduated in 2003. For her doctoral thesis she studied the effect of UV-B radiation on the vegetation at Svalbard and in addition she studied the vegetation and climate history of Svalbard through palynological analysis.
In 2003-2004 she worked as an adjunct researcher at the Faculty of Systems Ecology at the Free University of Amsterdam and continued the research she started during her doctoral study. As a result she co-authored two articles.
In 2004 she started with the study physical therapy at the Hogeschool Thim van de Laan in Nieuwegein, from which she graduated in 2007. After deciding her heart was still at Biology, she applied for a PhD position in the NWO-funded Ancestral Mounds project at the Faculty of Archeology, Leiden University. Throughout her PhD she wrote a chapter in two books and presented several lectures at national and international conferences. Currently she’s working as a researcher on a project basis.
Changes in the second edition
page 45Line 7: post quem → ante quem
page 81Line 18 of ‘Results and discussion’: arboreal pollen → non arboreal pollen
page 84Line 10 of ‘Conclusions’: table 7.2 → table 7.5Line 12 of ‘Conclusions’: table 7.1 → table 7.2
page 114Line 12: before → afterLine 13: post quem → ante quem
anc
estral h
eaths
Barrows, i.e. burial mounds, are amongst the most important of Europe’s prehistoric monuments. Across the continent, barrows still figure as prominent elements in the landscape. Many of these mounds have been excavated, revealing much about what was buried inside these intriguing monuments. Surprisingly, little is known about the landscape in which the barrows were situated and what role they played in their environment. Palynological data, carrying important clues on the barrow environment, are available for hundreds of excavated mounds in the Netherlands. However, while local vegetation reconstructions from these barrows exist, a reconstruction of the broader landscape around the barrows has yet to be made. This makes it difficult to understand their role in the prehistoric cultural landscape.
In this book a detailed vegetation history of the landscape around burial mounds is presented. Newly obtained and extant data derived from palynological analyses taken from barrow sites are (re-)analysed. Methods in barrow palynology are discussed and further developed when necessary. Newly developed techniques are applied in order to get a better impression of the role barrows played in their environment.
It is argued in this book that barrows were built on existing heaths, which had been and continued to be maintained for many generations by so-called heath communities. These heaths, therefore, can be considered as ‘ancestral heaths’. The barrow landscape was part of the economic zone of farming communities, while the heath areas were used as grazing grounds. The ancestral heaths were very stable elements in the landscape and were kept in existence for thousands of years. In fact, it is argued that these ancestral heaths were the most important factor in structuring the barrow landscape.
Marieke Doorenbosch studied Biology at the Free University of Amsterdam and specialized in paleoecology. From 2008-2013 she worked as a PhD student within the NWO-funded project Ancestral Mounds at the Faculty of Archaeology at Leiden University of which this dissertation is the result.
reconstructing the barrow landscape in the central and southern netherlands
Marieke Doorenbosch
ancestral heaths
Sid
esto
ne9 789088 901928
ISBN 978-90-8890-192-8
ISBN: 978-90-8890-192-8
Sidestone Press
Mar
ieke D
oo
ren
bosc
h
ancestral heathsreconstructing the barrow landscape in the