WORLD BlANK TECHNICAL PAPER NO. 500 Europe and Central Asia Environmentally and Socially Sustainable ,3.f) Development Series Work In progre WTP500 forpublic discussion March 2001 Turkmenistan An Assessment of Leasehold-Based Farm Restructuring Zvi Lerman Aaren Brooks Public Disclosure Authorized Public Disclosure Authorized Public Disclosure Authorized Public Disclosure Authorized
Transcript
WORLD BlANK TECHNICAL PAPER NO. 500
Europe and Central Asia Environmentally and Socially Sustainable
,3.f) Development Series
Work In progre WTP500forpublic discussion March 2001
TurkmenistanAn Assessment of Leasehold-BasedFarm Restructuring
Zvi LermanAaren Brooks
Pub
lic D
iscl
osur
e A
utho
rized
Pub
lic D
iscl
osur
e A
utho
rized
Pub
lic D
iscl
osur
e A
utho
rized
Pub
lic D
iscl
osur
e A
utho
rized
Recent World Bank Technical PapersNo. 417 Rutkowski, Welfare and the Labor Market in Poland: Social Policy during Economic Transition
No. 418 Okidegbe and Associates, Agriculture Sector Programs: Sourcebook
No. 420 Francis and others, Hard Lessons: Primary Schools, Community, and Social Capital in Nigeria
No. 421 Gert Jan Bom, Robert Foster, Ebel Dijkstra, and Marja Tummers, Evaporative Air-Conditioning: Applicationsfor Environmentally Friendly Cooling
No. 422 Peter Quaak, Harrie Knoef, and Huber Stassen, Energyfrom Biomass: A Review of Combustion and Gasifica-tion Technologies
No. 423 Energy Sector Unit, Europe and Central Asia Region, World Bank, Non-Payment in the Electricity Sector inEastern Europe and the Former Soviet Union
No. 425 Mohan, ed., Bibliography of Publications: Africa Region, 1993-98
No. 426 Rushbrook and Pugh, Solid Waste Landfills in Middle- and Lower-Income Countries: A Technical Guide toPlanning, Design, and Operation
No. 427 Marinio and Kemper, Institutional Frameworks in Successful Water Markets: Brazil, Spain, and Colorado, USA
No. 428 C. Mark Blackden and Chitra Bhanu, Gender, Growth, and Poverty Reduction: Special Program of Assistancefor Africa, 1998 Status Report on Poverty in Sub-Saharan Africa
No. 429 Gary McMahon, Jos6 Luis Evia, Alberto Pasc6-Font, and Jose Miguel Sanchez, An Environmental Study ofArtisanal, Small, and Medium Mining in Bolivia, Chile, and Peru
No. 430 Maria Dakolias, Court Performance around the World: A Comparative Perspective
No. 431 Severin Kodderitzsch, Reforms in Albanian Agriculture: Assessing a Sector in Transition
No. 432 Luiz Gabriel Azevedo, Musa Asad, and Larry D. Simpson, Management of Water Resources: Bulk WaterPricing in Brazil
No. 433 Malcolm Rowat and Jose Astigarraga, Latin American Insolvency Systems: A Comparative Assessment
No. 434 Csaba Csaki and John Nash, eds., Regional and International Trade Policy: Lessonsfor the EU Accession in theRural Sector-World Bank/FAO Workshop, June 20-23,1998
No. 435 Iain Begg, EU Investment Grants Review
No. 436 Roy Prosterman and Tim Hanstad, ed., Legal Impediments to Effective Rural Land Relations in Eastern Europeand Central Asia: A Comparative Perspective
No. 437 Csaba Csaki, Michel Dabatisse, and Oskar Honisch, Food and Agriculture in the Czech Republic: From a"Velvet" Transition to the Challenges of EU Accession
No. 438 George J. Borjas, Economic Research on the Determinants of Immigration: Lessonsfor the European Union
No. 439 Mustapha Nabli, Financial Integration, Vulnerabilities to Crisis, and EU Accession in Five Central EuropeanCountries
No. 440 Robert Bruce, loannis Kessides, and Lothar Kneifel, Overcoming Obstacles to Liberalization of the TelecomSector in Estonia, Poland, the Czech Republic, Slovenia, and Hungary: An Overview of Key Policy Concerns andPotential Initiatives to Facilitate the Transition Process
No. 441 Bartlomiej Kaminski, Hungary: Foreign Trade Issues in the Context of Accession to the EU
No. 442 Bartlomiej Kaminski, The Role of Foreign Direct Investment and Trade Policy in Poland's Accession to theEuropean Union
No. 443 Luc Lecuit, John Elder, Christian Hurtado, Francois Rantrua, Kamal Siblini, and Maurizia Tovo,DeMIStifying MIS: Guidelinesfor Management Information Systems in Social Funds
No. 444 Robert E Townsend, Agricultural Incentives in Sub-Saharan Africa: Policy Challenges
No. 445 Ian Hill, Forest Management in Nepal: Economics of Ecology
No. 446 Gordon Hughes and Magda Lovei, Economic Reform and Environmental Performance in Transition Economies
No. 447 R. Maria Saleth and Ariel Dinar, Evaluating Water Institutions and Water Sector Performance
No. 449 Keith Oblitas and J. Raymond Peter in association with Gautam Pingle, Halla M. Qaddumi, and JayanthaPerera, Transferring Irrigation Management to Farmers in Andhra Pradesh, India
No. 450 Andres Rigo Sureda and Waleed Haider Malik, eds., Judicial Challenges in the New Millennium: Proceedingsof the Second Summit of the Ibero-American Supreme Courts
No. 451 World Bank, Privatization of the Power and Natural Gas Industries in Hungary and Kazakhstan
No. 452 Lev Freinkman, Daniel Treisman, and Stephen Titov, Subnational Budgeting in Russia: Preempting aPotential Crisis
(List continues on the inside back cover)
WORLD BANK TECHNICAL PAPER NO. 500
Europe and CentralAsia Environmentally and Socially SustainableDevelopment Series
TurkmenistanAn Assessment of Leasehold-BasedFarm Restructuring
All rights reservedManufactured in the United States of AmericaFirst printing March 20011 23404030201
Technical Papers are published to communicate the results of the Bank's work to the developmentcommunity with the least possible delay. The typescript of this paper therefore has not been prepared inaccordance with the procedures appropriate to forrnal printed texts, and the World Bank accepts noresponsibility for errors. Some sources cited in this paper may be informal documents that are notreadily available.
The findings, interpretations, and conclusions expressed in this paper are entirely those of theauthor(s) and should not be attributed in any manner to the World Bank, to its affiliated organizations,or to members of its Board of Executive Directors or the countries they represent. The World Bank doesnot guarantee the accuracy of the data included in this publication and accepts no responsibility for anyconsequence of their use. The boundaries, colors, denominations, and other information shown on anymap in this volume do not imply on the part of the World Bank Group any judgment on the legal statusof any territory or the endorsement or acceptance of such boundaries.
The material in this publication is copyrighted. The World Bank encourages dissemination of itswork and will normally grant permission promptly.
Permission to photocopy items for internal or personal use, for the internal or personal use ofspecific clients, or for educational classroom use, is granted by the World Bank, provided that theappropriate fee is paid directly to-Copyright Clearance Center, Inc., 222 Rosewood Drive, Danvers, MA01923, U.S.A., telephone 978-750-8400, fax 978-750-4470. Please contact the Copyright Clearance Centerbefore photocopying items.
For permission to reprint individual articles or chapters, please fax your request with completeinformation to the Republication Department, Copyright Clearance Center, fax 978-750 4470.
All other queries on rights and licenses should be addressed to the World Bank at the address aboveor faxed to 202-522-2422.
ISBN: 0-8213-4931-7ISSN: 0253-7494
Zvi Lerman is a professor at Hebrew University of Jerusalem and a consultant to the World Bank'sDevelopment Economics Research Group. Karen Brooks is a lead economist for the Africa region ruraldevelopment and operations sector in the World Bank.
Library of Congress Cataloging-in-Publication Data
Brooks, Karen McConnell.Turkmenistan: an assessment of leasehold-based farm restructuring / Karen Brooks, Zvi Lerman.
p. cm. - (World Bank technical paper; no. 500. Europe and Central Asia environmentallyand socially sustainable development series)Includes bibliographical references.ISBN 0-82134931-71. Land reform-Turkmenistan. I. Lerman, Zvi, 1941- II. Title. Ill. World Bank technical
paper; no. 500. IV World Bank technical paper. Europe and Central Asia environmentally andsocially sustainable rural development series.HD1333.T93 B26 2001333.3'1585-dc2l 2001023391
CIP
Contents
Foreword ......................................................... v
Abstract .......................................................... vi
Preface ......................................................... vii
Executive Summary ......................................................... xi
1. Sectoral Context of Land Reform in Turkmenistan ................................................. IThe Macroeconomic Environment for Agriculture .......................................... 2Sectoral Performance Since Independence ...................................................... 5State Procurement of Wheat and Cotton .......................................................... 7Implicit Taxation of Cotton and Wheat Producers ........................................... 8Processing ......................................................... 1 IAgricultural Inputs .......................................................... 12Credit, Debt, and Arrears . ......................................................... 12
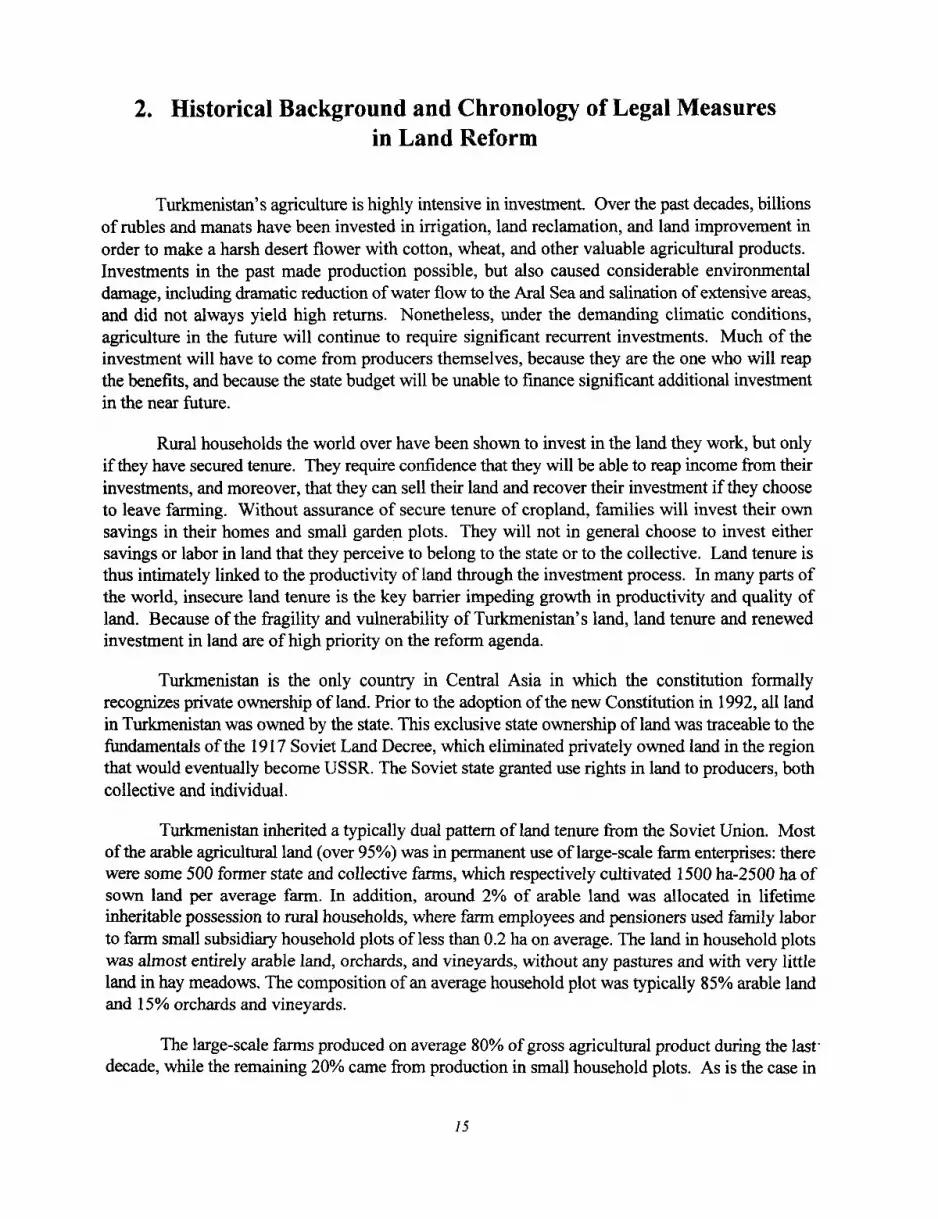
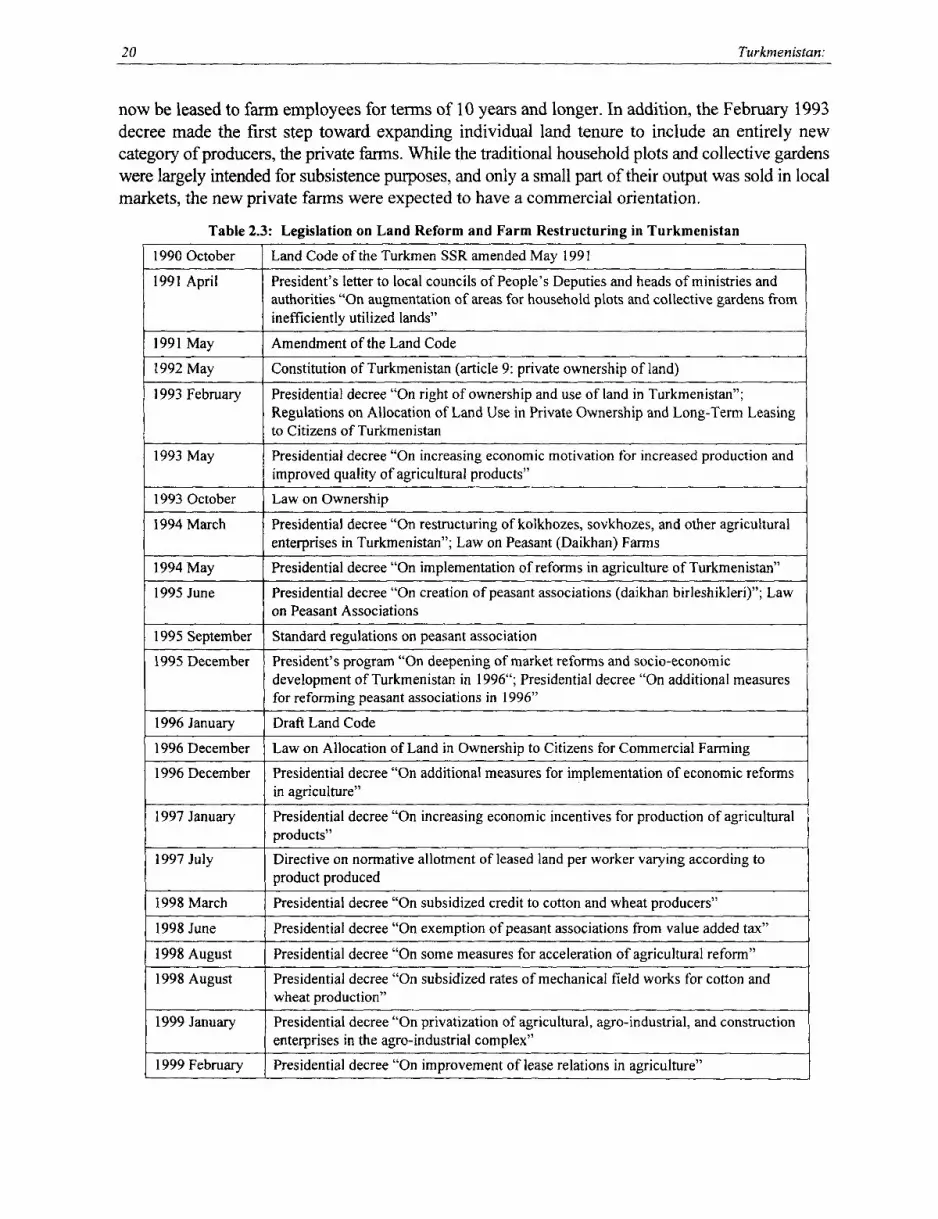
2. Historical Background and Chronology of Legal Measures in Land Reform .. 1. 5
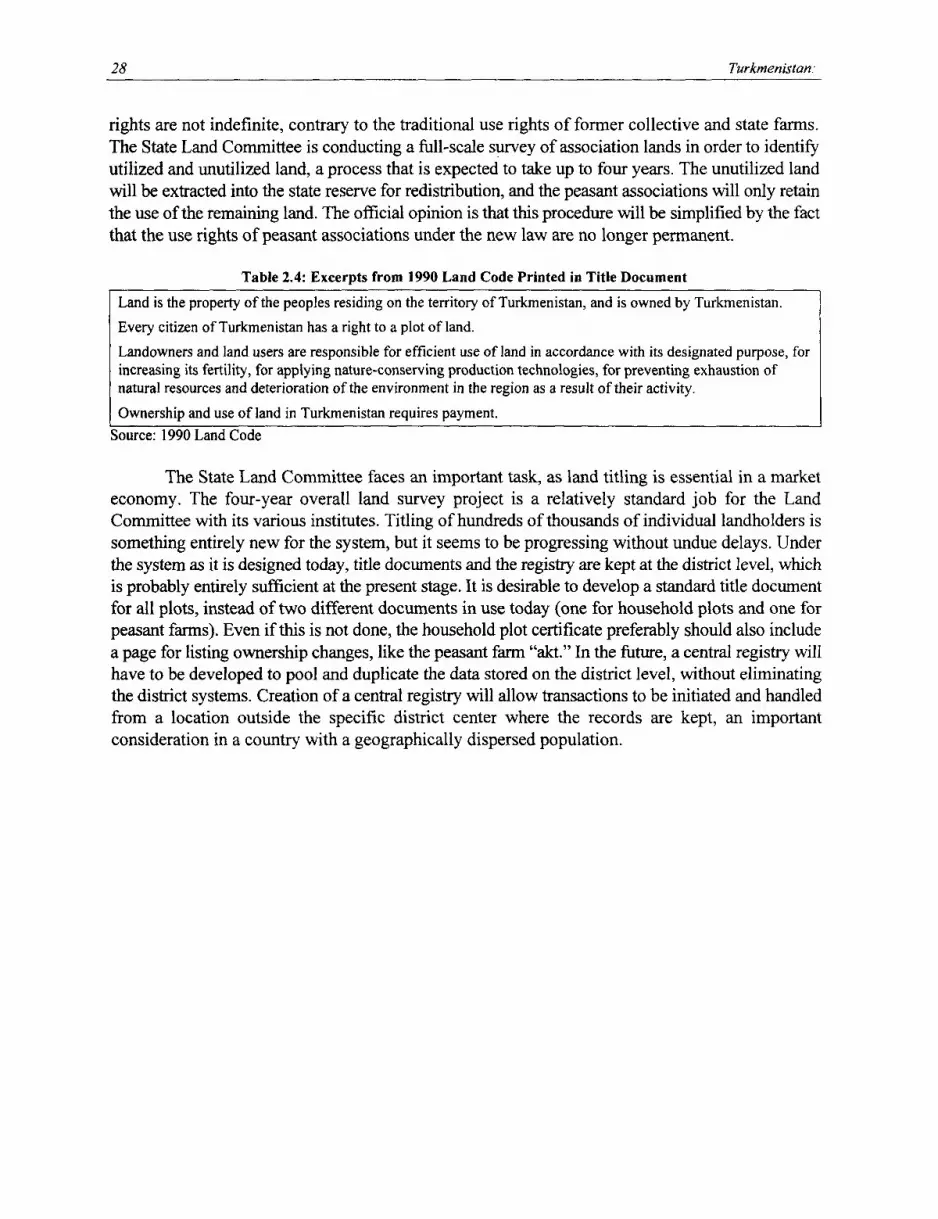
Growth of Individual Sector ......................................................... 16Legal Framework of Land Reform ............................................ ............. 19The Concept of Private Ownership of Land in Turkmenistan ............ ............. 21Restructuring of Traditional Large Farms ........................................................ 22Land Titling ......................................................... 27
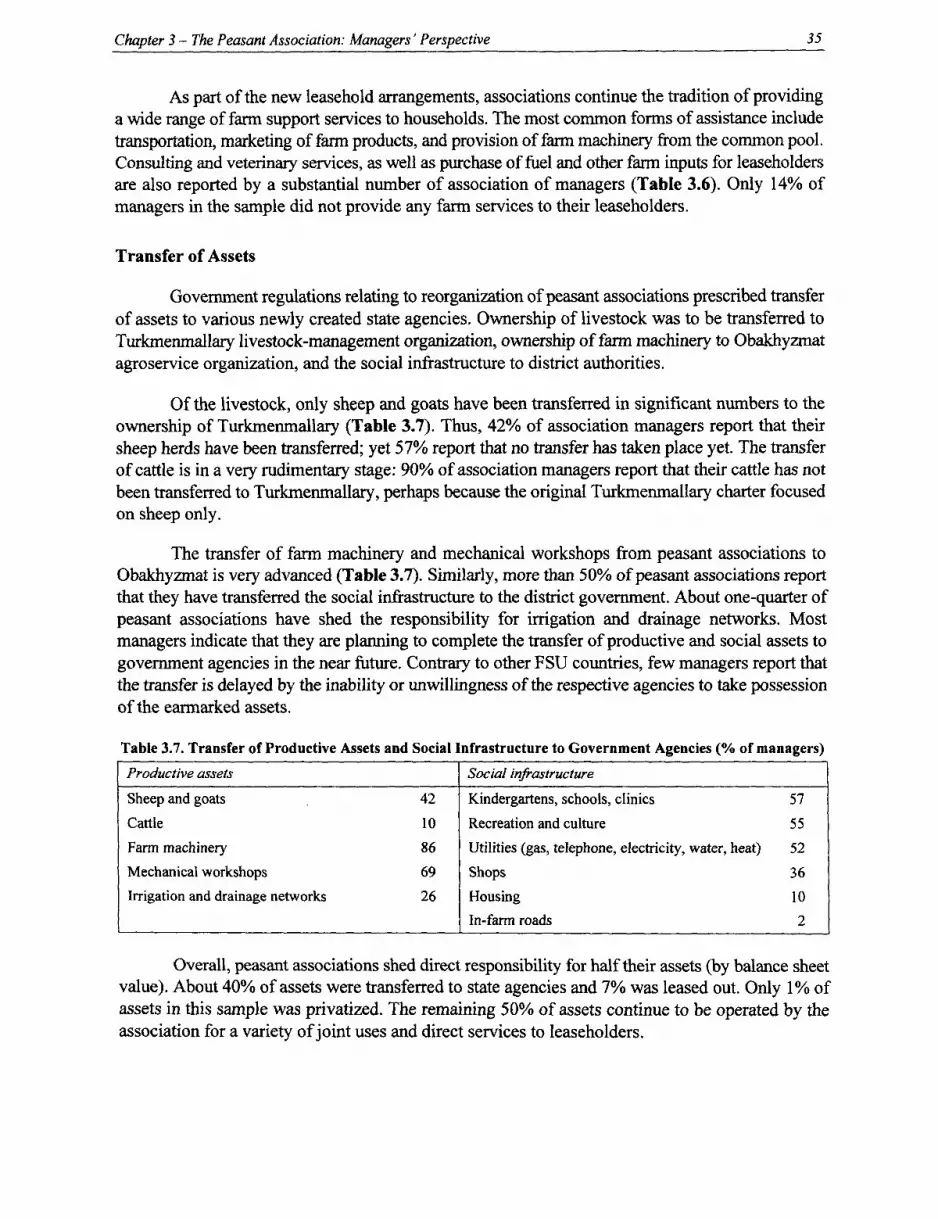
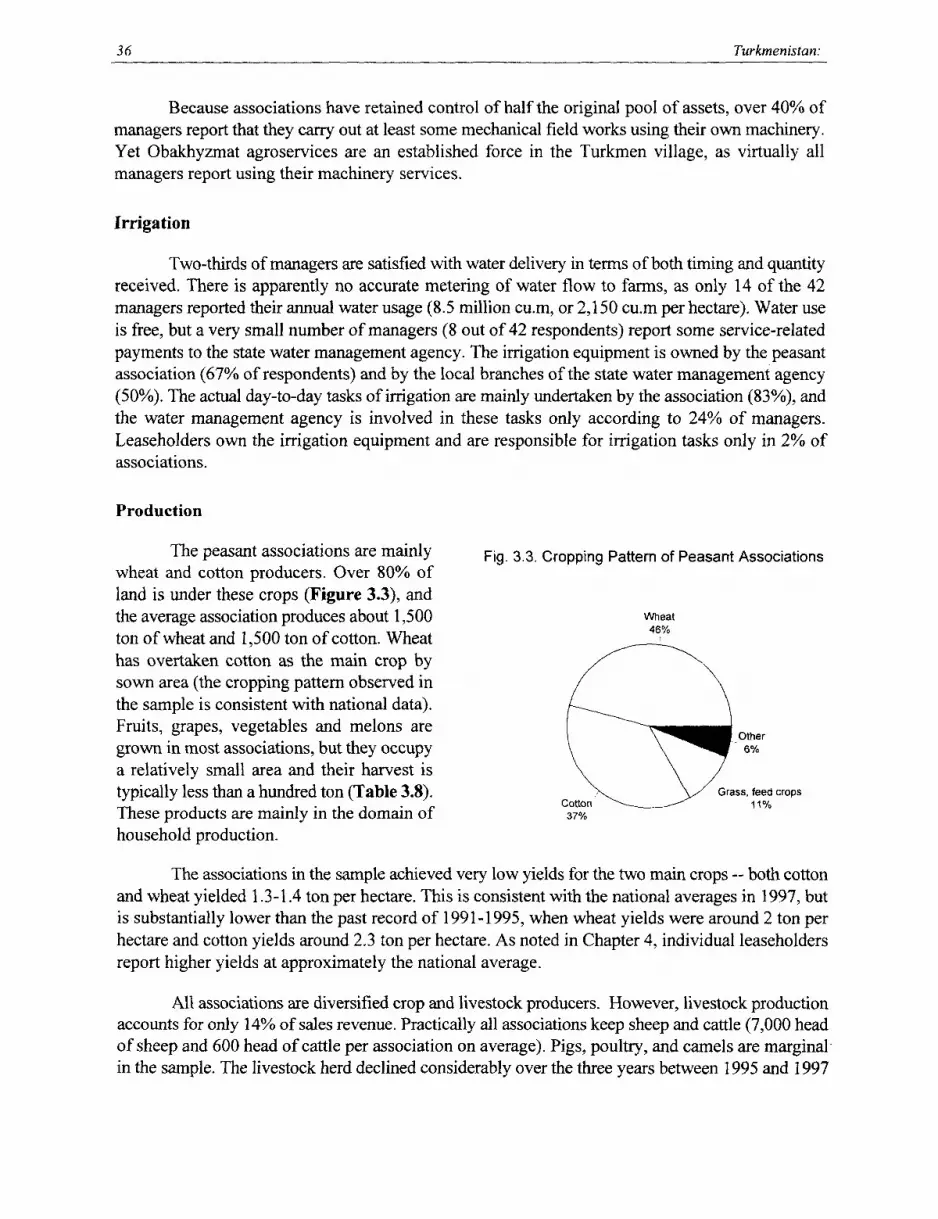
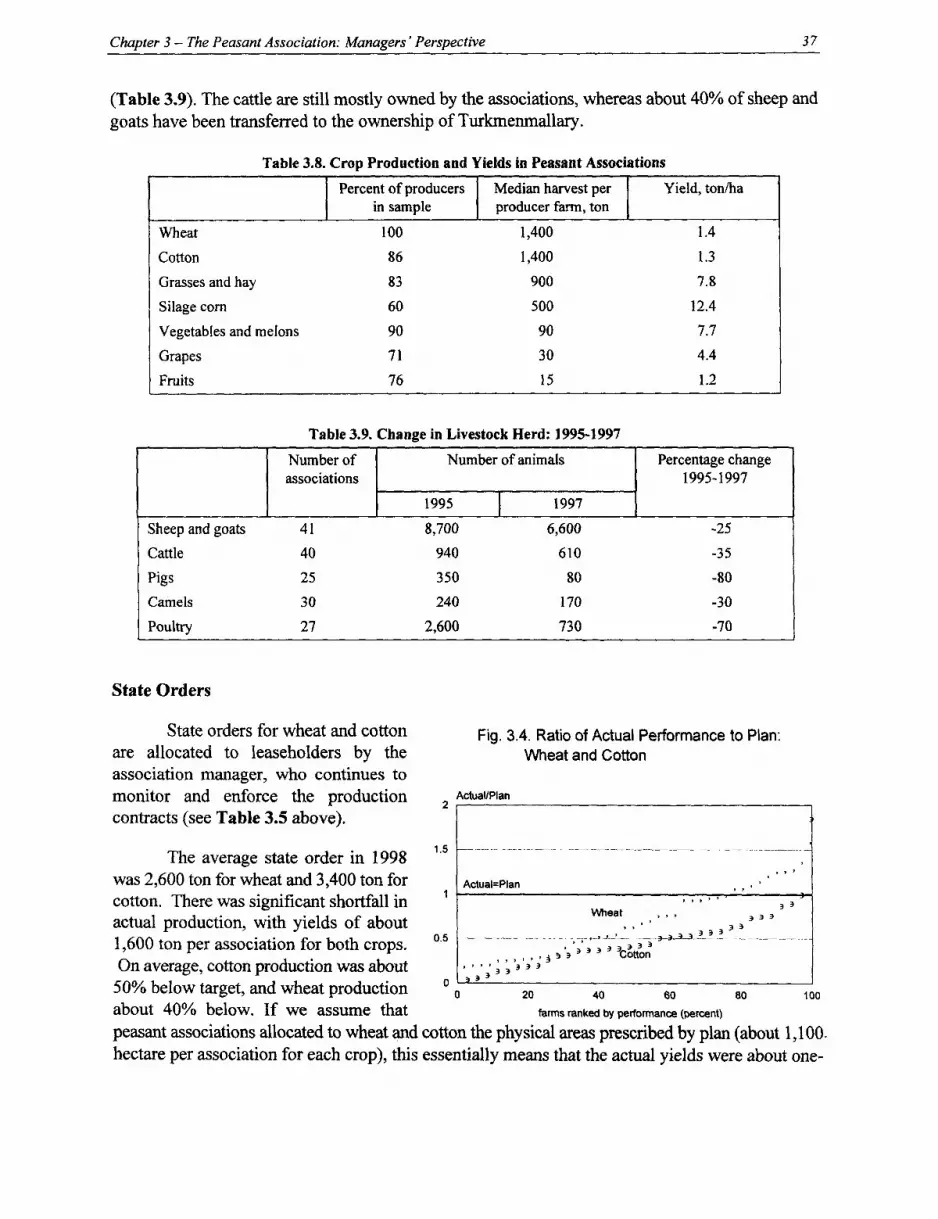
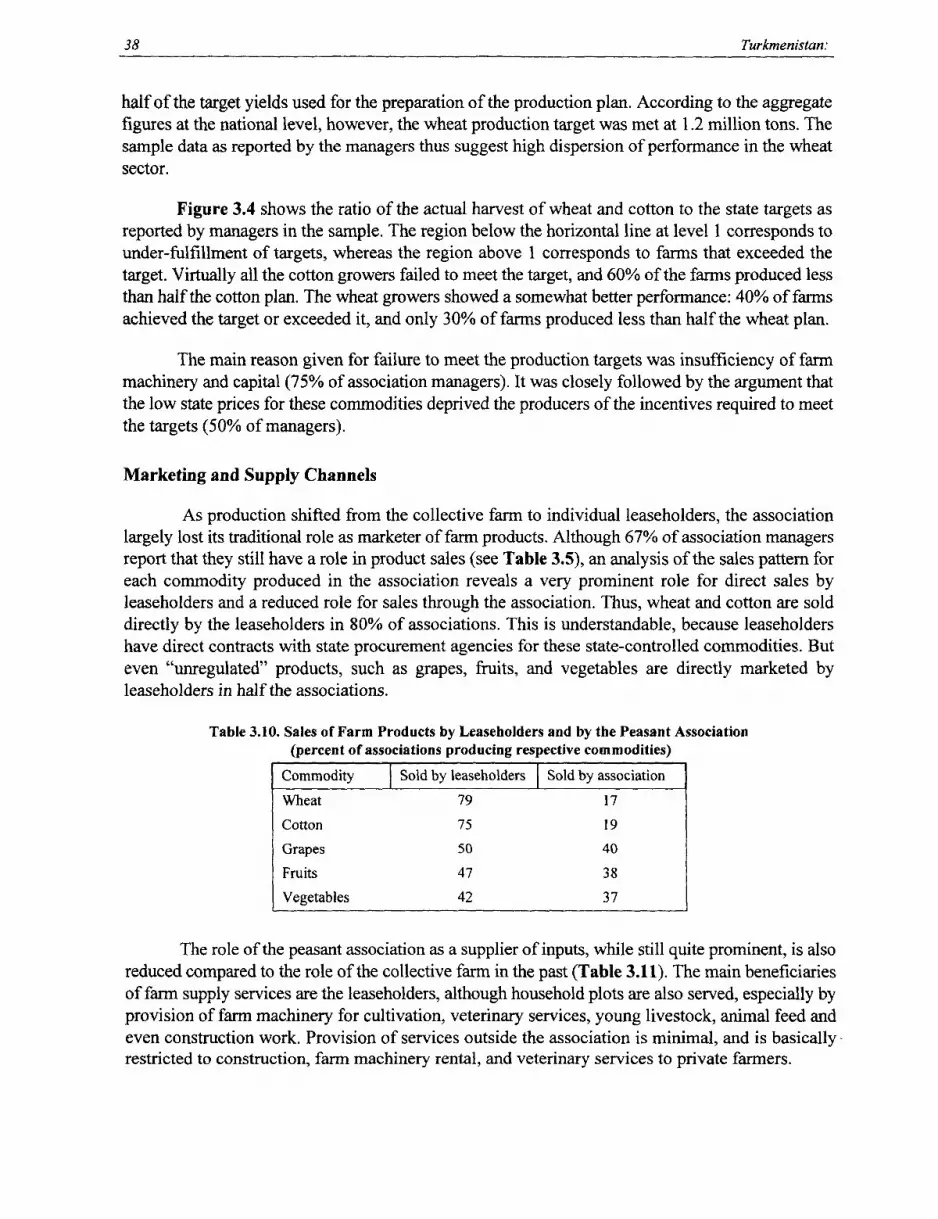
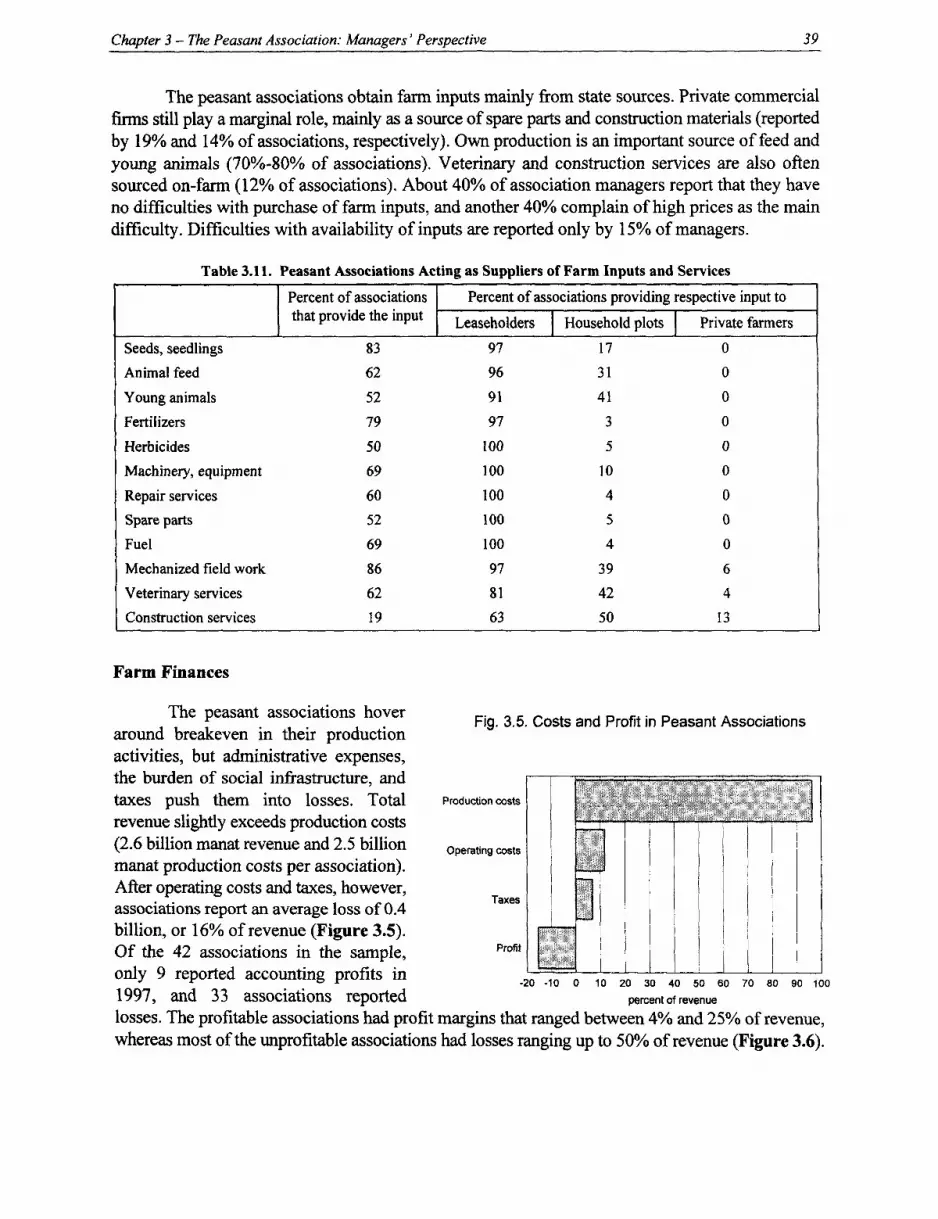
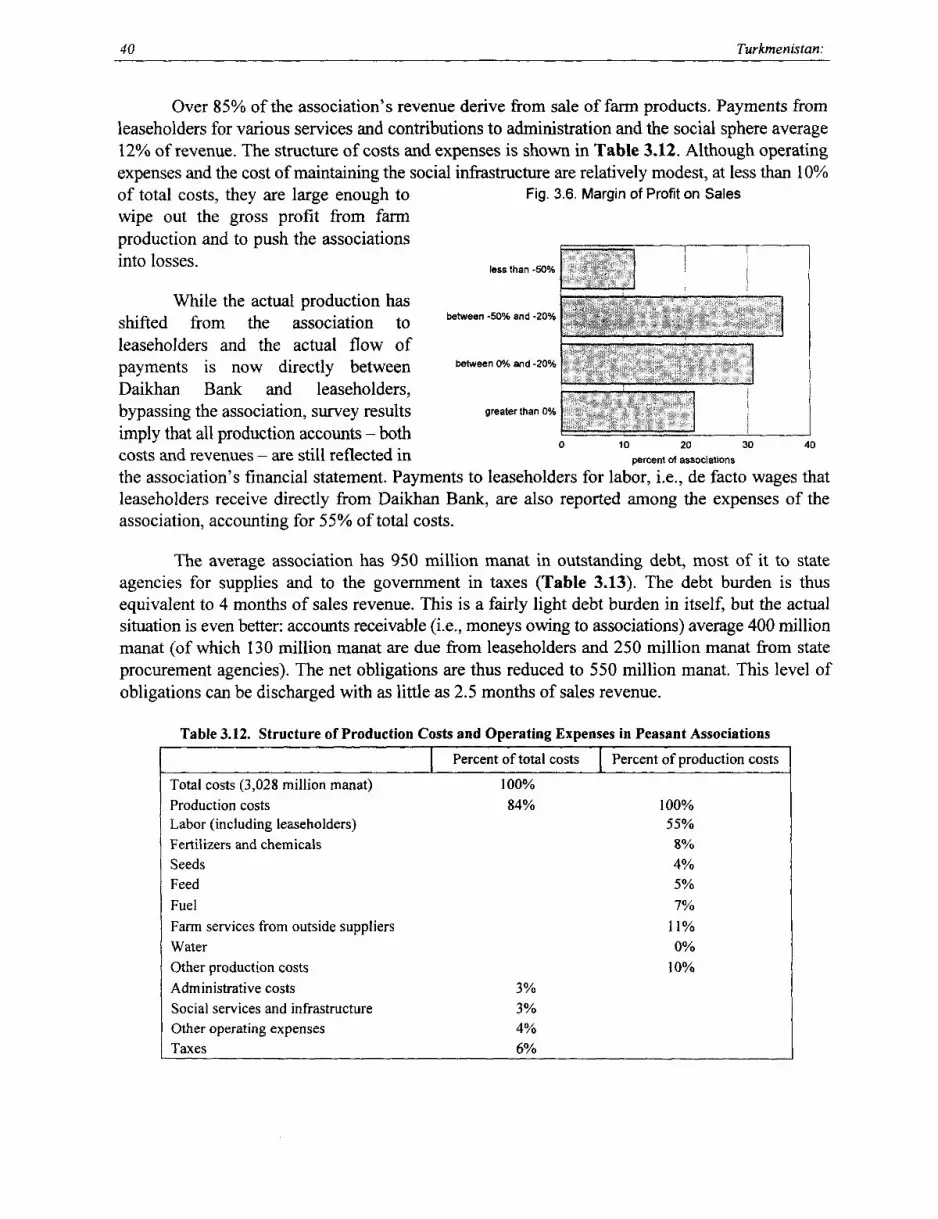
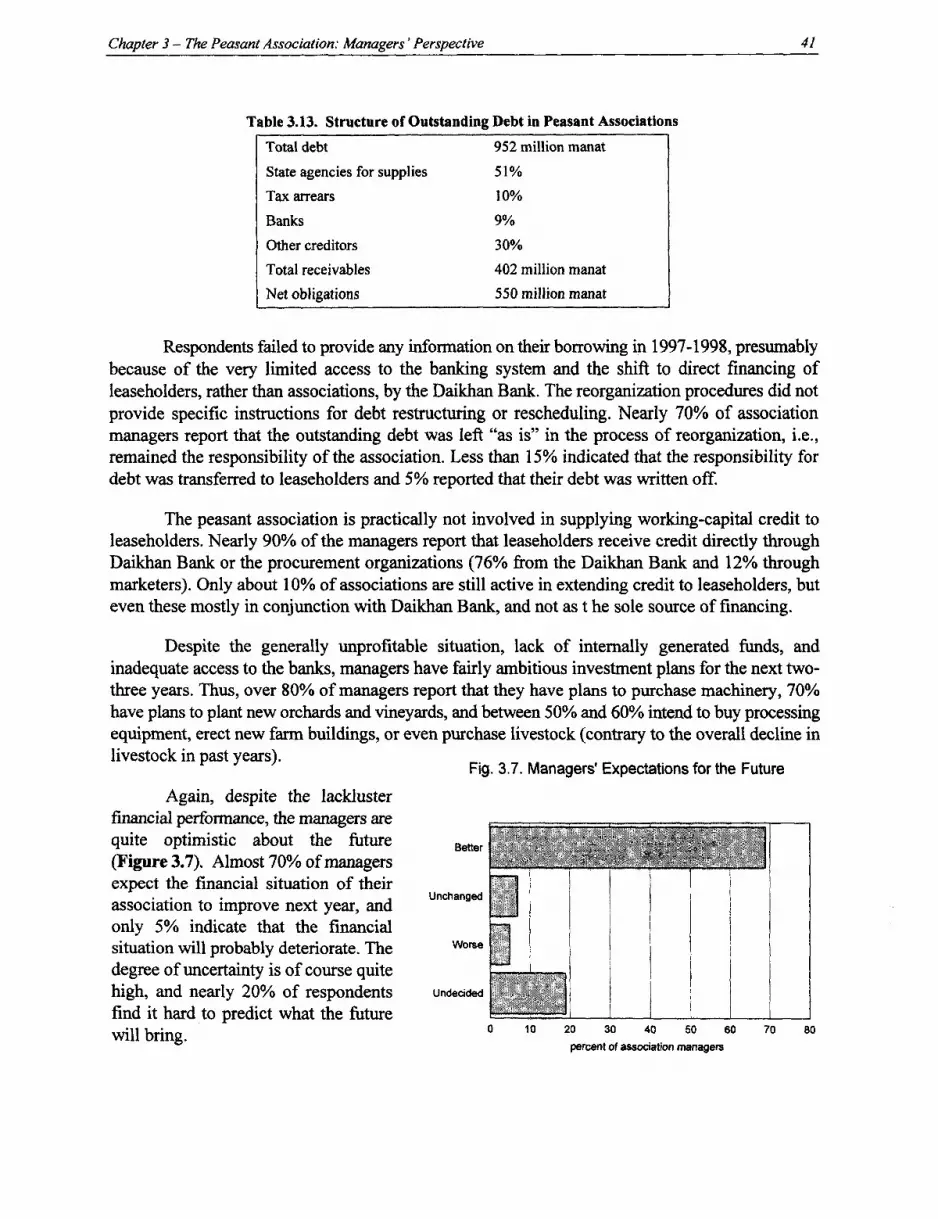
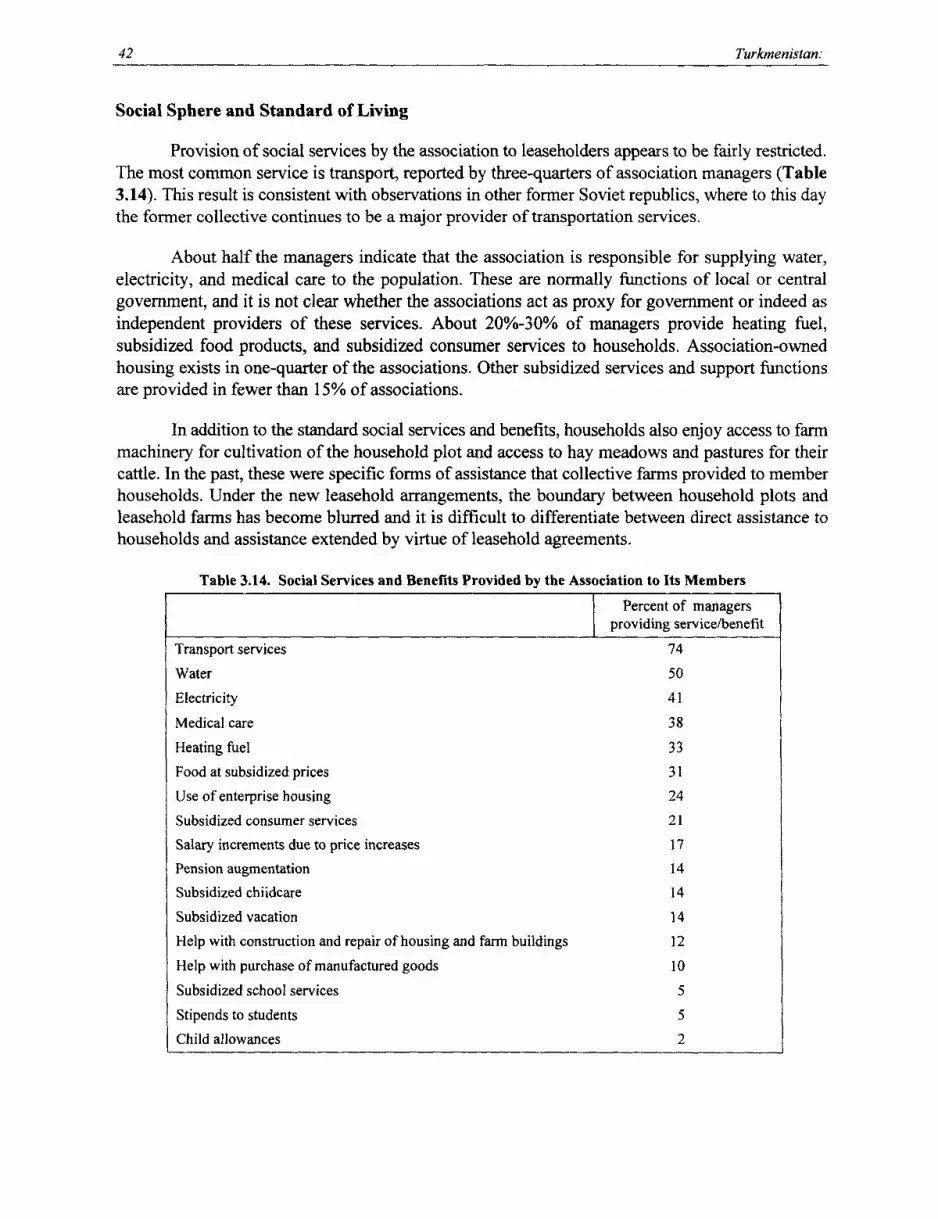
3. The Peasant Association: Managers' Perspective .................................................... 29Land and Labor in Peasant Associations ......................................................... 29Leasing Terms and Rights of Leaseholders ...................................................... 30Impact of Reform ......................................................... 32Transfer of Assets ......................................................... 35Irrigation ......................................................... 36Production ......................................................... 36State Orders ......................................................... 37Marketing and Supply Channels ................................ ......................... 38Farm Finances ......................................................... 39Social Sphere and Standard of Living ......................................................... 42
iii
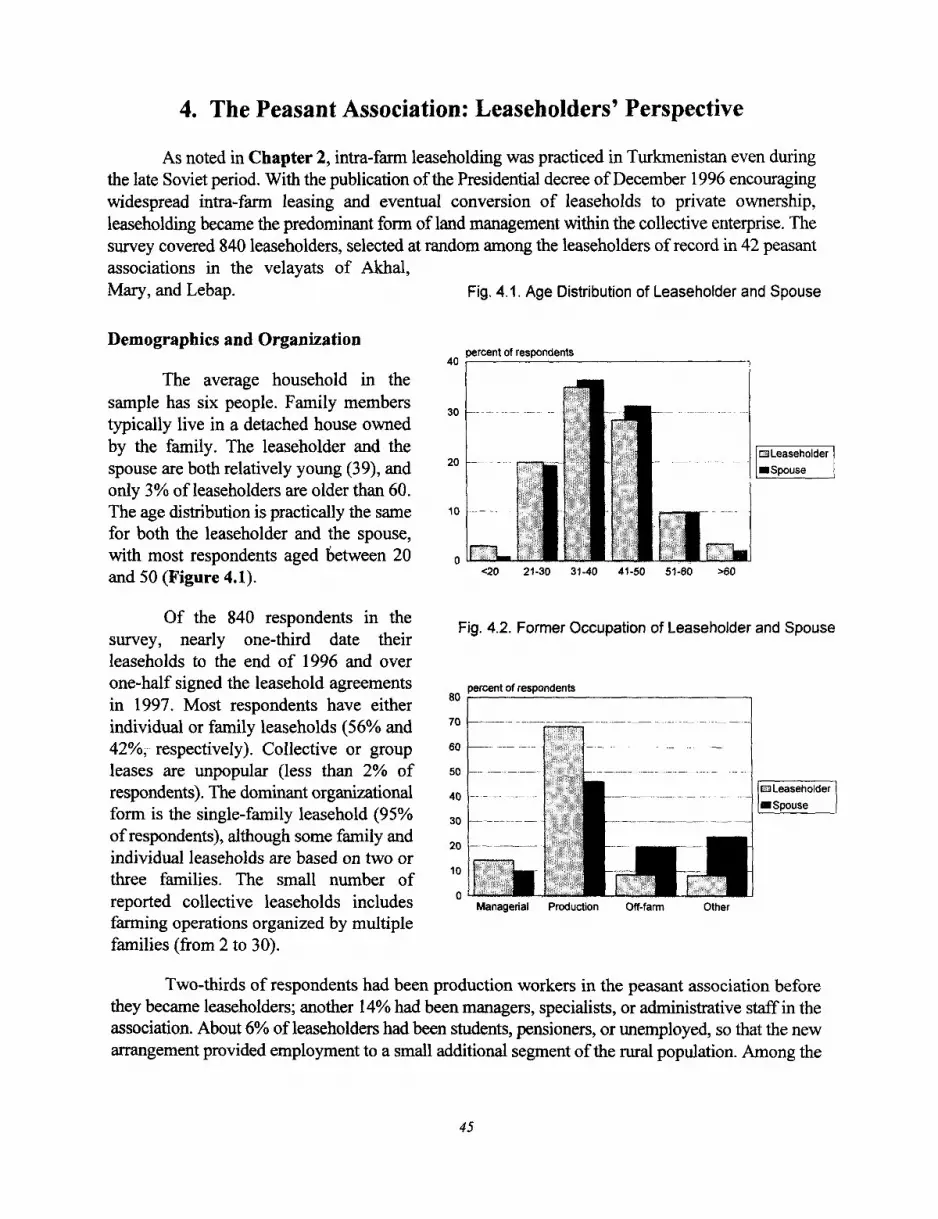
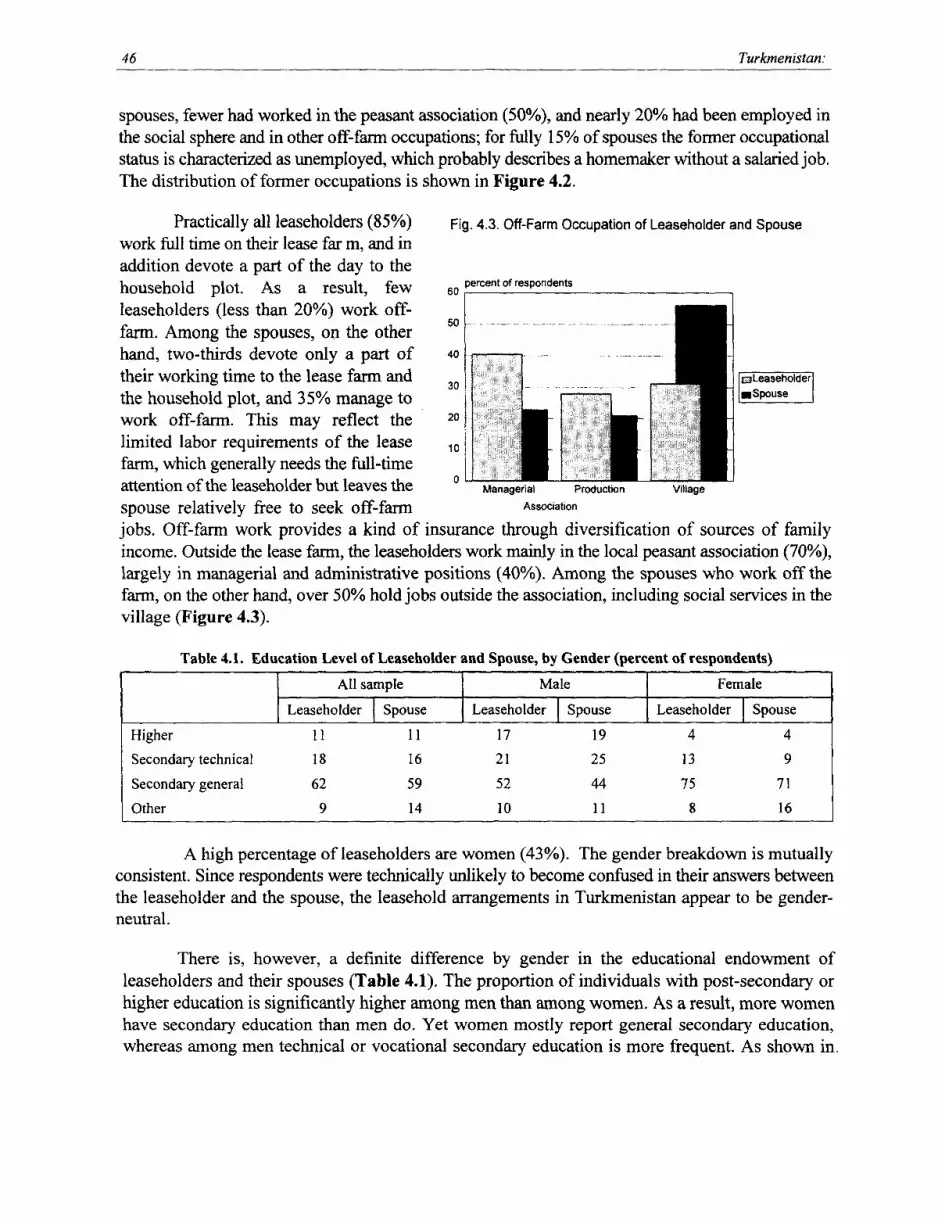
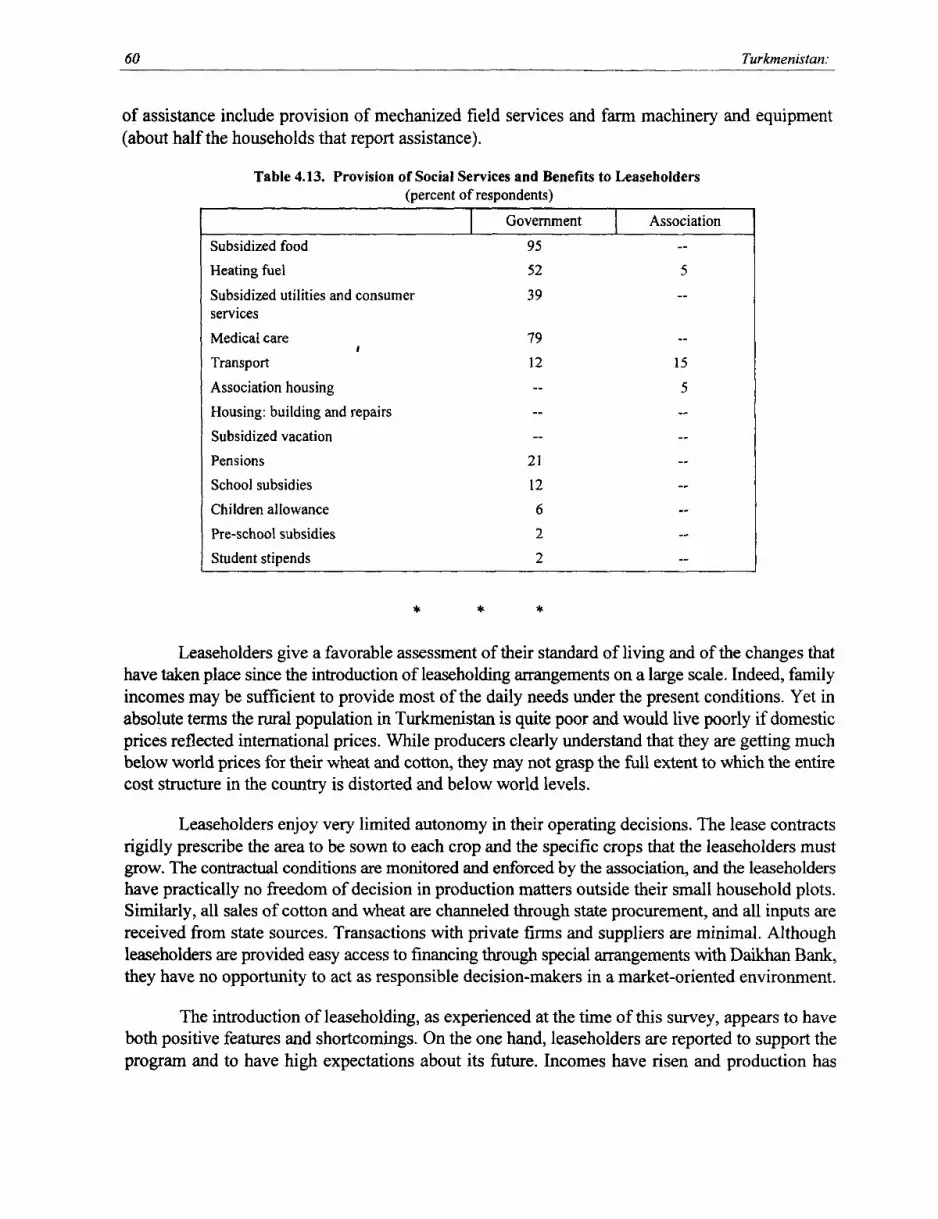
4. The Peasant Association: Leaseholders' Perspective ............................................... 45Demographics and Organization ...................................................... 45Land Holdings ...................................................... 47Rights and Obligations ...................................................... 48Labor and Resources ...................................................... 49Production in Leasehold Farms ........................ .............................. 50Sales ...................................................... 52Input Supply ...................................................... 52Finances ...................................................... 54Debt ...................................................... 55Production and Income from the Household Plot ............................................ 56Standard of Living ...................................................... 57Social Services and Benefits ...................................................... 59
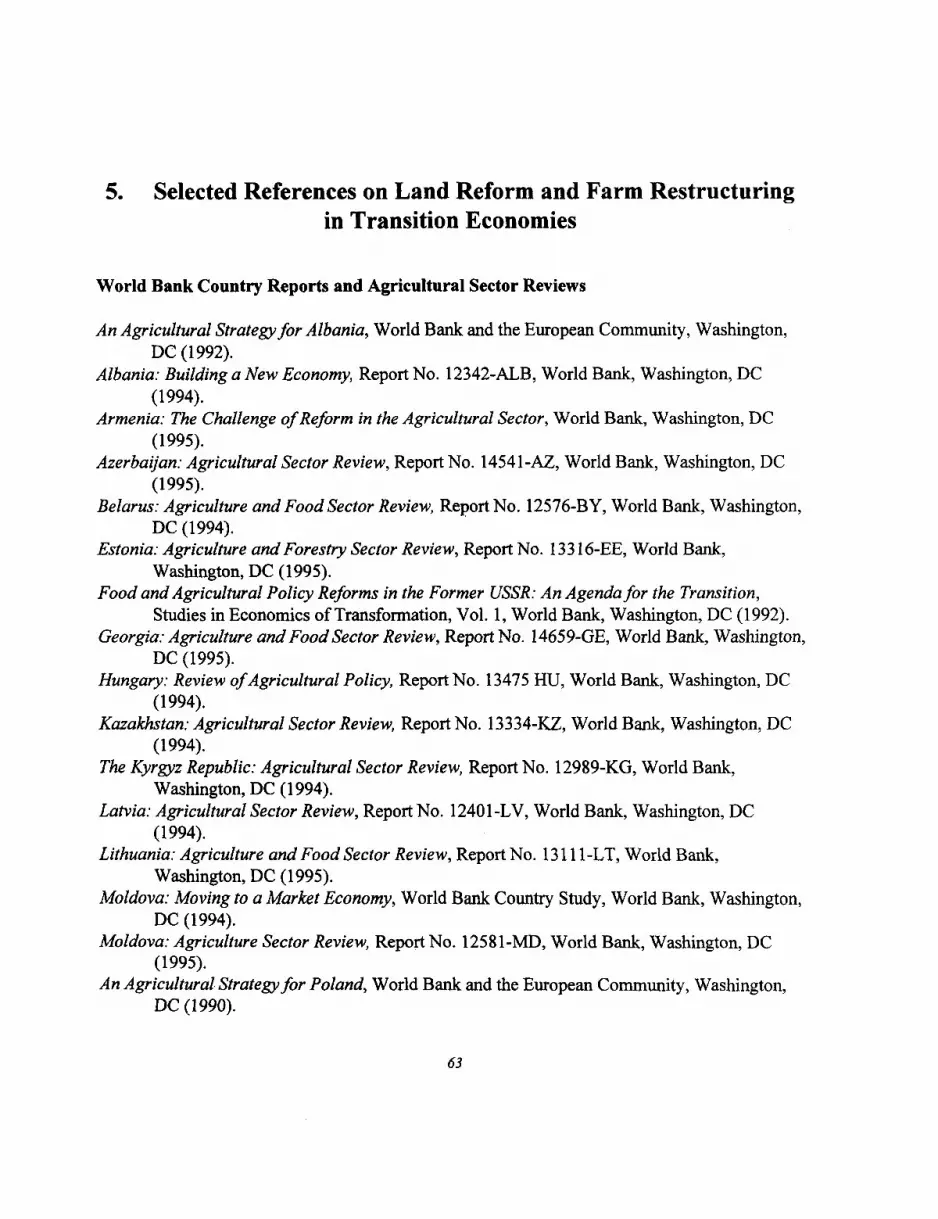
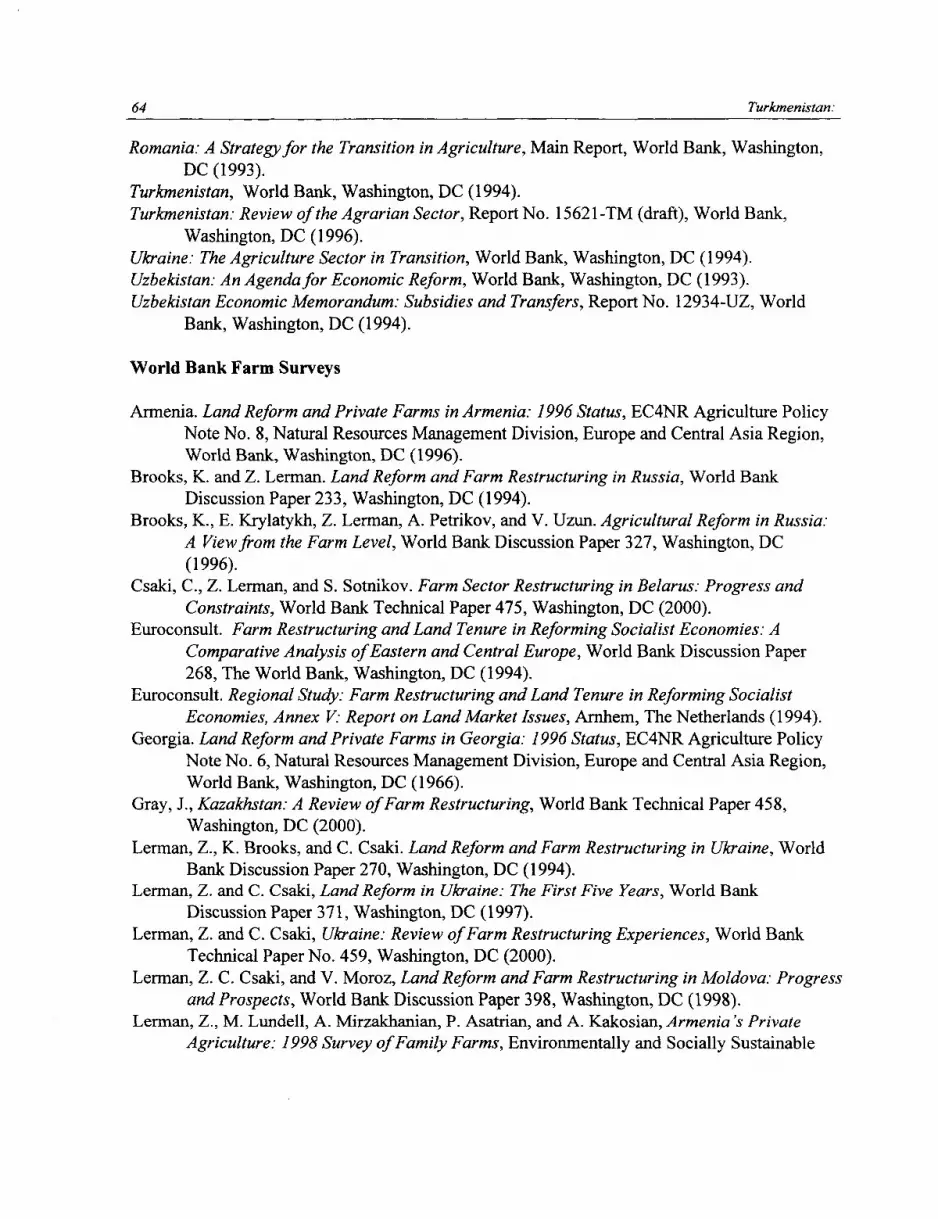
5. Selected References on Land Reform and Farm Restructuring in TransitionEconomies ...................................................... 63
iv
Foreword
Agriculture remains the main source of employment and livelihood for the large ruralpopulation of many transition countries, especially in Central Asia. The World Bank continuouslymonitors the progress of land reform and farm restructuring in the region because of the potentialimpact of these processes on rural development and poverty alleviation in rural areas.
The present study on Turkmenistan is the latest addition to a long and growing series ofWorld Bank publications on land reform and farm restructuring in the former socialist countries ofEurope and Central Asia. The unique features of all these publications is their reliance on first-handempirical information collected through extensive farm surveys of various rural constituencies. Farmsurveys have been conducted by the World Bank in many countries of the CIS (Russia, Ukraine,Moldova, Belarus, Armenia, Georgia, Kazakhstan), and Central and Eastern Europe (Poland,Romania, Bulgaria, Hungary, Albania). Analysis of survey findings enables the World Bank to baseits policy dialogue with governments in the region on solid empirical facts, making the Bank'srecommendation much more credible and relevant. The new findings for Turkmenistan will similarlyprovide a platform for useful policy discussions with this country's government and supply the manyinternational donors active on the local scene with essential information for the design of theirstrategic programs.
Kevin CleaverDirector
Environmentally and Socially Sustainable Rural Development
v
Abstract
The Government of Turkmenistan has chosen a unique approach to land reform and farmrestructuring unlike the procedures and mechanisms adopted by other former Soviet republics. Thecollective land holdings are divided into plots that are leased to families while retaining the overallcollective structure and state ownership of all agricultural land. The leased plots eventually may beprivatized if the leaseholders show a satisfactory record of performance for at least two years. Thedevelopment of this leasehold-based farming system was investigated in a farm survey conductedin the fall of 1998 in three velayats (provinces) Akhal, Lebap, and Mary, that lie in the southern andsouth-eastern parts of the country, stretching from the central regions around the capital to theeastern border with Uzbekistan.
Turkmenistan's unique approach to land reform and farm restructuring has produced asignificant shift to individual or household-based farming, with more than three-quarters of thearable land leased to individual households or small groups. Most leaseholders consider this landto be rightfully theirs, and they expect to keep it in the future, either as private owners, or throughextension of their leasehold. However, individual production is administratively circumscribed bya pervasive system of state orders and central planning. The lease contracts rigidly specify the cropthat each leaseholder is required to produce (typically cotton or wheat) and set a specific quantitytarget for delivery to the state at prices much below the level of prices on international markets.Managers and leaseholders universally express the view that the prices they receive from the statefor wheat and cotton are too low, and identify the chance to sell freely at open market prices as a keyfactor that would improve the economic situation on farms. Both managers and leaseholdersexpressed enthusiasm for the reform at the time of the survey. This is a natural psychologicalreaction to the dramatic transition to a new system, and to avoid disillusionrment, the initial changemust be followed by further meaningful reforms, including abolition of state orders, transfer of landto individual control, and elimination of constraints on individual choice.
vi
Preface
Since 1992, the World Bank (ECSSD) has assisted a number of governments in the formersocialist countries in Europe and Central Asia to monitor the progress of land reform and farmrestructuring. The World Bank's overall purpose in this continuing effort is to understand the extentof restructuring in the agricultural sector and its actual impact on productivity and efficiency. Inaddition to regular sector missions to the target countries and analysis of macro-economic data, themonitoring tools include farm-level surveys of rural populations, which gradually produce acomprehensive picture of the farTn sectors throughout the region. These farm-level surveys provideunique insights into the functioning of farms in transitional economies, and are especially valuablein view of the paucity of statistical data in these countries. The survey results are analyzed andpublished to provide governments, civil society, and the donor community with relevant and timelyempirical information for policy making and design of public investment. Previous farm-surveypublications cover Russia, Ukraine, Moldova, Armenia, and Georgia.
Turkmenistan has adopted a leasehold-based farm-restructuring model essentially differentfrom that used by other former Soviet republics. Yet official statistics on the scope of the reformprocess are extremely limited, and information on farm-level impacts of restructuring is virtuallyunavailable. The World Bank, in cooperation with the government of Turkmenistan, conducted asurvey of peasant associations with the objective of assessing the impact of the govermment's reformprogram on large-scale farms and on rural households. The study was designed to provideinformation on changes in the organization of agricultural production and rural incomes after the firsttwo years of reform and thus fill the gap in official statistics. Strategically, the study was intendedas a tool to facilitate the dialogue with the government of Turkmenistan and form a foundation forplanned CAS discussions.
The present report combines an analysis of the 1998 farm survey with an overview of generalagricultural policies and sectoral performance. The survey was carried out in the fall of 1998 in threevelayats (provinces), Akhal, Lebap, and Mary, covering 42 managers of peasant associations and 840leaseholders in these associations. The sample structure is shown in Table A. The three velayatsparticipating in the survey lie in the southern and south-eastern parts of the country, stretching fromthe central regions around the capital to the eastern border with Uzbekistan.
Table A. Structure of Respondents in the 1998 Farm Survey in Turkmenistan
Velayat Managers of peasant associations Leaseholders in peasant associations
Akhal (central) 12 240
Mary (east-central) 16 320
Lebap (eastern) 14 280
Total 42 840
Source: farm survey results
vii
viii Turkmenistan:
The survey was supported by the World Bank and implemented by a team from the Ministryof Agriculture and Water of Turkmenistan and the Academy of Agricultural Sciences in Ashgabat.The survey was endorsed by the Council of Ministers of Turkmenistan, in anticipation of its potentialto contribute to policy decisions in the agricultural sector. The late Ata N. Nabatov was highlyinstrumental in the preliminary approval and design stages in his capacity first as the Acting Ministerof Agriculture, then as the head of the Agricultural Development Fund, and finally as the Ministerof Agriculture. Deputy Minister of Agriculture Nail T. Israfilov coordinated the project at theMinisterial level from its inception. The local survey team was headed by Orasmurat K. Karakhanov,Deputy Director, Institute of Agriculture and Water Economy in Ashgabat, with the assistance ofKurban 0. Orazov of the same Institute. The World Bank team included Karen Brooks and ZviLerman. Guljahan Kurbanova, Head of the World Bank Liaison Office in Ashgabat, with her staffprovided administrative supervision on behalf of the World Bank and supported communicationsbetween the local team in Ashgabat and the World Bank team.
Survey questionnaires were developed by a steering group of local experts that includedOrazmurat Karakhanov, Buri Karliev, Geldy Muradov, Lado Mkrtchan, and Kurban Orazov, withguidance from Zvi Lerman and Karen Brooks. The steering group also decided on all relevantsampling issues for the survey. Ivan Stanchin provided valuable comments on various drafts of thequestionnaires. The questionnaires, originally developed in Russian, were translated into theTurkmen language by team members in Ashgabat. Valuable technical assistance in Ashgabat wasprovided by Lyudmila Dubinina, who was responsible for preparing the draft Russian questionnaires,by other collegues who prepared the first draft versions of the Turkmen questionnaires, and did ahighly professional job producing the final camera-ready copy of the Turkmen questionnaires forthe field phase of the project.
The actual field work was conducted by etrap-level staff of the Ministry of Agriculture andthe State Land Reform Committee, with supervision by members of the steering group fromAshgabat. The initial database design was developed by Dimitrii Dubinin in Ashgabat with guidancefrom Zvi Lerman. Data entry and database creation after the field phase of the project were managedby Kurbanrnurad Ussaev with the assistance of a teamn of operators at the Institute of Agriculture andWater Economy in Ashgabat.
In this report, the presentation of survey results is preceded by a sectoral review; adescription of the emerging legal framework for land reform and farm restructuring. The data in thereview part of the report (the first two chapters) are based on official statistical publications oninformation collected by the authors in the course of World Bank agricultural sector missions toTurkmenistan from June 1995 to September 1998, and on background reports prepared by Turkmencounterparts in Ashgabat (Orazmurat Karakhanov and Kurban Orazov, of the Institute of Agricultureand Water, and Ivan Stanchin, of the Turkmen State Institute of Statistics and Forecasting). Currentinformation on Turkmenistan was provided by the State Committee for Land Reform, the StateCommittee on Statistics, and the Ministry of Agriculture and Water. Information about latest lawsand decrees on land issues in Turkmenistan was obtained from the compilation Zemlepol 'zovaniei zemlevladenie v Turkmenistane: sbornik normativnykh aktov respubliki Turkmenistan(Ekologicheskii klub Satena, Ashgabat, 1998). Some material of Chapter 2 was previously included
Preface ix
in a chapter written by the authors of the present report for the volume Land Reform in the FormerSoviet Union and Eastern Europe, edited by S. Wegren and published by Routledge, London (1998).
The findings of the 1998 farm survey are presented in the last chapters of the report. Thesurvey data were analyzed by Zvi Lerman with the help of Anja Crommelynck, a research assistantfrom the Catholic University in Leuven, Belgium, funded by FAO/TCD. This version of the reportwas written by Karen Brooks and Zvi Lerman in Washington.
An earlier draft of the report was discussed at a roundtable meeting held in Ashgabat inNovember 1999 with the participation of a group of fifteen local experts and officials. ECSSD wasrepresented at the roundtable by Michel Debatisse and Zvi Lerman. Comments by the roundtableparticipants were incorporated in the final report. Peer reviewers for the report were Csaba Csaki,Thirumangalam Sampath, Tjaart Schillhorn, and Laura Tuck.
It is hoped that the present report, with its solid empirical foundation, will be useful in therenewed policy dialogue between the World Bank and the Government of Turkmenistan. The reportreflects the interpretation of the situation as viewed by the World Bank experts, and thegovernment's interpretation may naturally differ. Yet the empirical facts and survey resultsassembled in this report provide a truthful picture of the current relations and problems in peasantassociations, and the report as such should constitute a useful common platform for mutualdiscussions of policy issues and reform design in agriculture.
All tables and figures in Chapters I and 2 are based on official national-level statistics. Alltables and figures in Chapters 3 and 4 are derived from the 1998 farm survey, representing thesample farms in three velayats. The official exchange rate at the time of the survey was 5,200manatl$, and this rate has remained fixed since the last adjustment in 1998 (a depreciation of about25% from 4,165 manat/$ in 1997). The unofficial exchange rate is considerably higher.
Executive Summary
The present and future well-being of Turkmenistan's majority rural population depends inlarge part on how agricultural reforms are managed. Because of the country's harsh desert climate,successful agriculture requires consistent inflows of investment to maintain soil quality andtopography, and to service and improve the irrigation system. Under the present scarcity ofbudgetary resources, new incentives are needed to encourage private rural households to invest inagriculture. A key measure of success of agricultural reforms, therefore, will be the extent to whichthey create the possibility and inducements for producing sustainable increase in output bystimulating private investment by rural households. Land reform and increased security of tenureare thus at the heart of the reform process.
The objective of this study is to strengthen the understanding of the impact at the farm levelof recent reform measures in agriculture. Agriculture remains highly administered, and changes inpolicy and personnel are frequent. New people moving into responsible administrative positionsneed a good empirical understanding of the strengths and problems of the sector. Yet the statisticalreporting on the sector and analysis are weak. To strengthen the empirical understanding of changesin the rural sector and to clarify how recent policy decisions and programs have affected theopportunities in agriculture, the Government of Turkmenistan, in collaboration with the World Bank,undertook a survey of agricultural producers in 1998. This survey of approximately one thousandleaseholders and managers of peasant associations complements the Living Standards MeasurementSurvey (LSMS) also carried out in 1998, which provides broader coverage of the population at large,but less detail on agricultural issues. The report combines an analysis of the survey findings with anoverview of the macroeconomic and sectoral context in which reforms of land tenure and farmstructure have been designed and implemented.
Leasehold-Based Land Reform
The Government of Turkmenistan has chosen a unique approach to land reform and farnrestructuring unlike the procedures and mechanisms adopted by other former Soviet republics. Thereis no distribution of former collective land into paper certificates of entitlement ("land shares"), asthroughout most of the former Soviet Union, nor is there physical division of agricultural land intoindividual plots leading to abolition of collective structures, as in Armenia, Georgia, and partiallyin Moldova. Instead, the collective holdings are being transformned gradually and from withinthrough a process of dividing collective land into plots that are leased to families while retaining theoverall collective structure. The process does not involve transfer of land ownership from the stateto the collective. All agricultural land remains in state ownership, but the leased plots eventually maybe privatized if the leaseholders show a satisfactory record of performance for at least two years.In the interim, the land remains within the collective structure, but the former collective farm(kolkhoz) is formally reorganized into an entity called peasant association (daikhan berleshik).
xi
xii Turkmenistan:
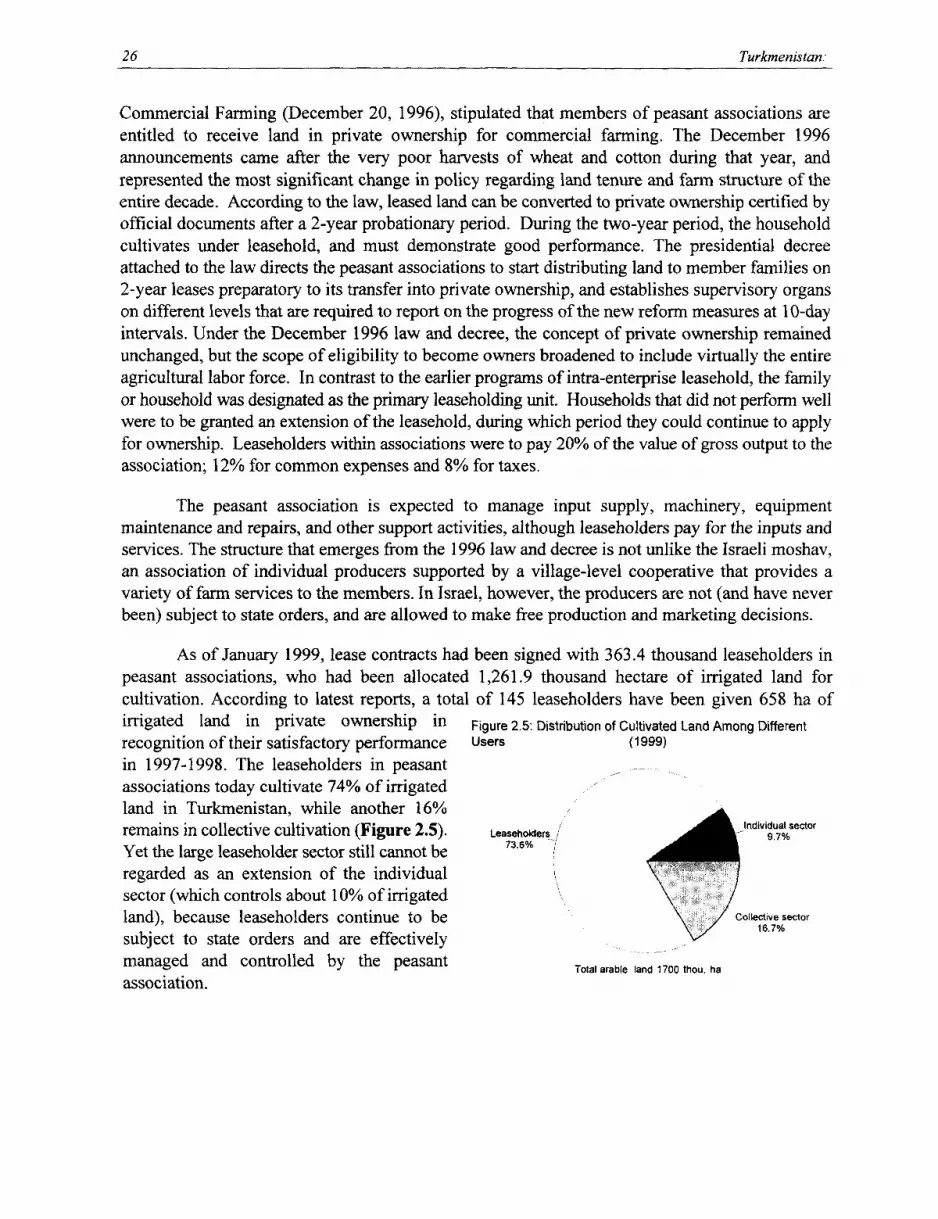
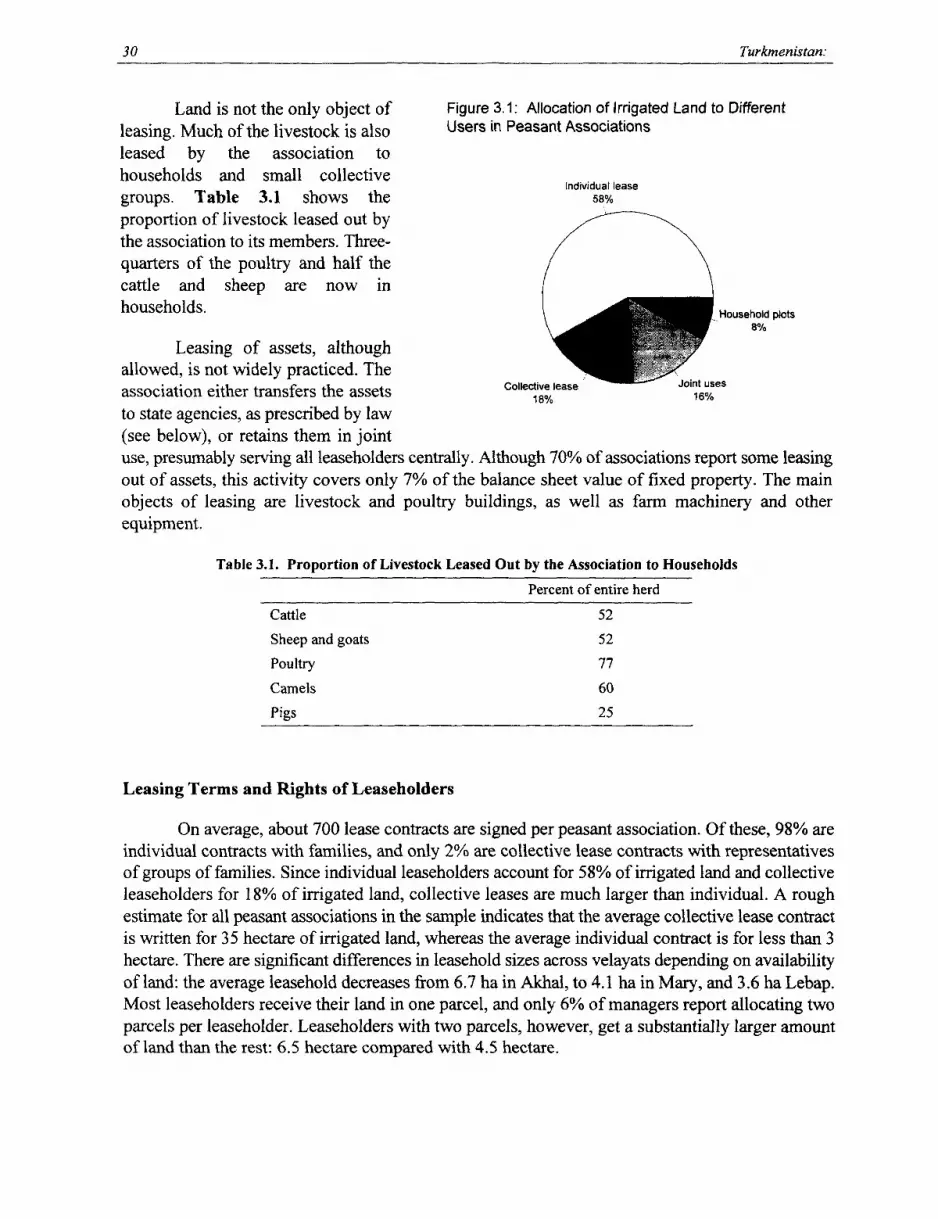
This approach to land reform and farm restructuring has produced a significant shift toindividual or household-based farming. According to the survey of managers, more than three-quarters of the arable land of associations have been leased to individual households or small groups.According to the survey of leaseholders, most consider this land to be rightfully theirs, and theyexpect to keep it in the future, either as private owners, or through extension of their leasehold. Cropproduction has almost entirely shifted from large collectives to family units and small groups withland holdings of 6 hectares on average. Only 16% of land remains in joint use.
Individual Farming Restricted by Persistence of State Orders
The individual production, however, is highly circumscribed by administrative regulationsthat constitute a pervasive system of state orders and central planning. The lease contracts concludedby the peasant association with households rigidly specify the crop that each leaseholder is requiredto produce (almost universally cotton or wheat) and set a specific quantity target for delivery to thestate at prices much below the level of prices prevailing on international markets. Production andmarketing requirements are conditions for gaining access to land, and the few revocations ofleasehold reported in the sample took place because the producer used the land to grow productsother than those specified in the contract.
About 70% of lease contracts in the sample are for cotton and 20% for wheat. Commoditiesfree from state orders (vegetables, fruits, milk, and meat) are produced by a small proportion ofleaseholders. Production of these commodities remains largely in the domain of household plots, asin the past. Thus, although production has been largely individualized through leaseholding, it doesnot entail the managerial decision-making usually associated with small-scale family production ina market economy.
Financial Independence of Leaseholders Strictly Circumscribed
Leaseholders are allowed to have individual accounts and conduct financial transactions onlywith an officially designated bank (Daikhan Bank), and the peasant association retains a role inmanaging the leaseholders' relations with financial institutions. Credit to leaseholders is providedexclusively through special government programs administered by Daikhan Bank. Despite theincreased access to bank accounts, leaseholders' financial autonomy is significantly limited.
Price Distortions Result in Low Family Incomes
While leaseholders are in general satisfied with the standard of living of their families, inabsolute terms the rural population in Turkmenistan is quite poor. The reported actual income forthe average family of 6 is about $1,300 per year, or $215 per person (at the official rate of exchange).The income that families in the survey judge sufficient to maintain a "normal" standard of living is$3,500 per year, or slightly less than $600 per person, which is 2.7 times higher than the actualincome. Household income of less than $600 per person per year would be considered poverty inother parts of the world where domestic prices reflect international prices. In Turkmenistan, $600
Executive Summary xiii
per person per year is considered sufficient and even exceeds actual income levels by a large margin.This fact suggests that the domestic prices in Turkmenistan are still very low relative to internationalprices due to government intervention. While producers clearly understand that they are gettingmuch below world prices for their wheat and cotton, they may not grasp the full extent to which theentire cost structure in the country is distorted and below world levels.
The low level of absolute earnings has a significant implication. Rural people may be ableto maintain an acceptable level of living given current low incomes due to policies that reduce pricesfor essential items, such as flour, electricity, and gas, but subsidies may not be sustainable in thelonger run. Moreover, if yields are to increase from their present low levels in both the crop and thelivestock sector, modem internationally traded inputs, such as improved seeds, veterinary medicines,and plant protection agents will be needed. Low-income producers will have great difficultyadopting higher yielding technology.
State Orders Impose a Severe Tax Burden on Agriculture
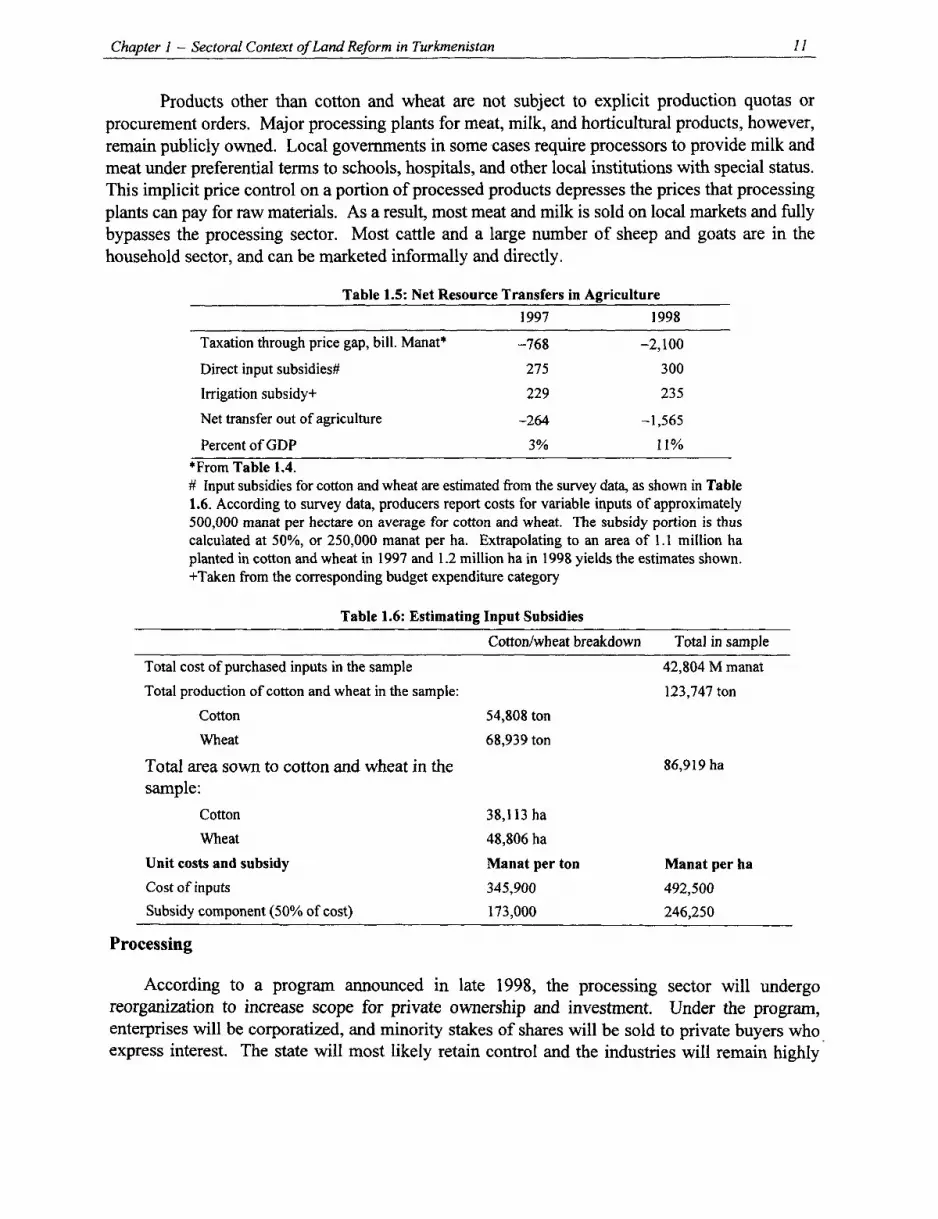
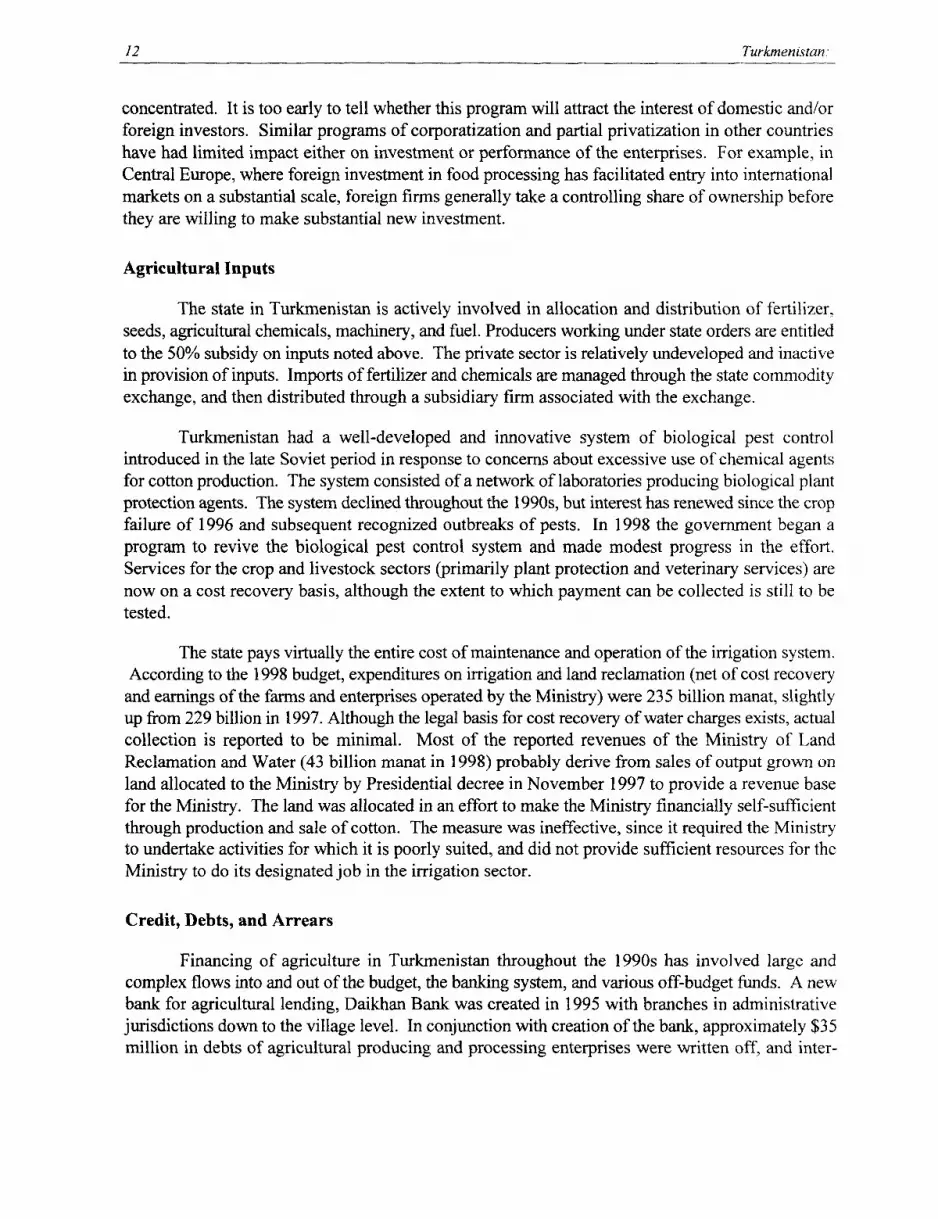
Managers and leaseholders universally express the view that the prices they receive from thestate for wheat and cotton are too low. Conventional measures of distortions used in internationalcomparisons support their view. The state order system in the past three years has extracted between40% and 60% of the international value of cotton and wheat, and reallocated this from primaryproducers to the budget, to consumers, and to other recipients and activities not clearly identified.In exchange, producers received subsidies for inputs and for water, but the aggregate value of thesubsidies did not outweigh the cost of the implicit taxes. At the same time, budget limitationsprevent government from making adequate investments in operation and maintenance of theinfrastructure.
Leaseholders and managers identify the chance to sell freely at open market prices as a keyfactor that would improve the economic situation on farms. They may be less aware of the highercosts they would face for inputs and for water, but on balance producers would gain from a shift tointernational market prices for inputs and output.
Peasant Association Retains Central Role in Monitoring and Control
In this policy environment, peasant associations fulfill a dual function. On the one hand, theydeliver services to producers within the associations. On the other, they enforce the high implicittaxes levied through the system of state orders. The peasant association as the successor of theformer collective farm retains broad central management and control functions. The association isresponsible for allocating cotton and grain state orders to leaseholders, monitoring their contractualobligations, and coordinating production. The association provides management services toleaseholders. It assists leaseholders with product sales and supply of farm inputs. The association,in the tradition of former collective farms, continues to be at least partly responsible for municipaland public services in the village, including maintenance and development of infrastructure, soilamelioration, and planting of new orchards.
xiv Turkmenistan:
Some of the activities of service providers have been moved outside the association, with thetransfer of assets to parastatal organizations off the farms, but the transfer at present is still partial.Overall, peasant associations have shed direct responsibility for half their assets (by balance sheetvalue), and the remaining 50% continue to be operated by the association for a variety of joint usesand direct services to leaseholders. About 70%-80% of associations continues to act as providers offarm inputs to the leaseholders.
The financial accounting of the associations appears to reflect some ambiguity regarding therelationship between leaseholders and the associations. The actual flow of payments is now directlybetween Daikhan Bank and leaseholders, bypassing the association, but all production accounts -revenues as well as all costs, including labor - are still reflected in the financial statements of theassociations. The association accounts thus present a consolidated picture of the financial resultsof production for leaseholders and associations.
The financial results of peasant associations on average show a modest loss. The profit andloss accounting in the associations uses the official domestic prices for inputs, before the governmentsubsidies to wheat and cotton growers. When the 50% subsidy for inputs used in cotton and wheatproduction is included in the calculations, the association accounts show a slight profit. Bothmanagers and leaseholders report that their financial health is better in 1998 than it was in prioryears. This optimism probably derives in part from general satisfaction with the novelty of theleasehold system, and in part because the exceptionally good wheat crop of 1998 had been harvestedjust prior to the fieldwork of the survey.
Unclear Reforms in the Livestock Sector
The land reforms discussed in this report have accomplished a major first step throughallocation of identified plots of land to households within the associations. This has brought asignificant change in the management of the crop sector in Turkmenistan. The livestock sector hasbeen less fundamentally altered. Many of the cattle have been transferred to the household sector,but the households have not been provided with enough land to support an adequate feed base, andas a result livestock productivity is declining. As part of the creation of the associations, much ofthe formerly collective herd was to be transferred to the ownership of the parastatal livestock-management system Turkmenmallary, but the picture that emerges from the association survey withregard to livestock is unclear.
The future evolution of the associations in the context of further development of the landreform will require additional attention to livestock. Like land, livestock should be transferredentirely to household control, together with a sufficient feed base. This is especially important giventhe traditional weight of the livestock sector in the Turkmen rural economy, and its potential futurecontribution.
Executive Summary xv
Need for Transition to Secure Tenure Rights in Land
The Turkmen experience with the leasehold system has provided most rural households withland allotments that they consider will eventually be their own. In this respect, the experience showsmore dynamism than in countries where the share system was used as a mechanism for land reform,such as in Russia and Ukraine. In the latter two countries, the mechanism has been created, but landremains largely in its original configuration of small household plots and large collective holdings.In Turkmenistan, in contrast, most rural households now have household plots plus additionalleaseholds of from 3 to 7 hectares (or as much as 20 hectares if not irrigated). Yet leaseholders arenot free to make their own production decisions on this land, as their lease contract is strictlyconditioned on fulfillment of state orders. Moreover, contrary to Russia and Ukraine, Turkmenistanhas no provisions for leaseholders to exercise their freedom of choice by leaving the association withtheir irrigated land to establish an independent family farm outside the collectivist framework.
The future of the leaseholds is unclear. Rural people who have the leaseholds want themconverted to private ownership, and expect the conversion to take place soon. Association managers,however, are less sanguine about the prospects for conversion according to the findings of thissurvey. The legal framework defining and supporting private ownership of land in Turkmenistanis not yet complete, since the new Civil Code has not yet been adopted in its entirety, and as aconsequence, the new Land Code is still in draft form. The language of the draft Land Codeessentially equates private ownership and inheritable possession, suggesting that ownership will becircumscribed even if it is granted.
Most importantly in the Turkmen context, however, the continued existence of state ordersimpedes conversion.o-land to private ownership. Producers working privately owned land (therelatively few "daikhan farmers," as opposed to leaseholders) are formally exempt from state ordersfor cotton and wheat. As long as the state remains committed to retain state orders, it is doubtful thatthe hopes of rural households to have leaseholds converted to ownership will be met on a large scale.
The state order system thus constrains rural people doubly. State orders tax away a largeportion of the income that they could otherwise use for current consumption and for investment intheir farming operations. In addition, the continuation of the state order system retards theconversion of leaseholds to private ownership, since local officials and association managers wouldlose present instruments for enforcing the orders if land tenure were converted from leasehold toprivate ownership. Establishment of a schedule for phasing out of state orders would provide asignificant basis for the high expectations that rural people now express regarding the land reformprogram.
Need to Ensure Lasting Satisfaction with Reform
At the time of the survey, both managers and leaseholders expressed enthusiasm for thereform. Association managers report that the financial situation of the farms has improved and thatleaseholders now have much greater incentives to work. Leaseholders similarly report that thestandard of living of their families has improved (or at worst remained unchanged) and that theitfamily incomes are generally sufficient to satisfy all their needs.
xvi Turkmenistan:
It is too early to judge if this positive evaluation of the reform is a lasting feature of ruraldevelopment in Turkmenistan. It may reflect mainly a psychological reaction to a dramatic transitionto a new system, which has raised considerable hopes among farm managers and peasants alike.Unless the initial change is followed by further meaningful reforms, including abolition of stateorders, transfer of land to individual control, and elimination of constraints on individual choice, theenthusiasm may give way to disillusionment. The Chinese experience indeed indicates that, after aninitial period of positive response to the new situation, persistence of restrictive governmentintervention may seriously limit agricultural growth.
What Can Turkmenistan Learn from World Experience with Farming Structures?
While Turkmenistan is following its own program of reforms in the rural sector, it may beadvisable to look at the experience with agriculture in market economies throughout the world.Farming structure in market economies is characterized by three basic forms of farm organization:family farms; production cooperatives; and farming corporations. Family farms based on privatelyowned or leased land are the most widespread organizational form in agriculture in marketeconomies. Production cooperatives are the rarest farm structures in market economies: they haveproved to be less efficient and less productive than other forms of agricultural production due toinherent weaknesses in their incentive structure which lead to suboptimal behavior by their members.Farming corporations are not widespread in market economies either. They do exist, but usuallyunder very specific circumstances or in cases when clear economies of scale are observed, e.g.,plantations that require integration between harvesting and shipping, or agro-industrial operations,such as pig farms or poultry factories (which, however, may cause considerable environmentaldamage due to their large size).
The main feature that distinguishes family farms from production cooperatives andcorporations is the ability to monitor labor activities on the farm. On a family farm, people workbecause they feel that it is their duty to the family, and all family members share the risks of failure.In a cooperative or a corporation, workers often do not feel the same commitment to theorganization and do not have the same work ethic as in a family. They do not feel that they have toface the risk of failure of the organization. Corporations therefore must employ managers andsupervisors to monitor the workers and to ensure that they put sufficient effort into their work.Because of difficulties with labor monitoring and supervision in corporate farns, most Americanfarms registered as corporations are simply medium-sized family farms that decided to incorporatemainly for tax reasons: they are operated by family members (with some hired labor, when needed)and are run by the head of the family, not by a hired manager.
Another feature of family farms in market economies is their frequent reliance on servicecooperatives (as distinct from production cooperatives). Family farms overcome difficulties withinput supply, marketing of farm products, and availability of machinery by establishing voluntaryservice cooperatives. These service cooperatives exploit the economies of scale that exist in tradeand processing by transacting for the benefit of their members large volumes of farm-relatedoperations, including joint purchase and operation of farm machinery. Contrary to productioncooperatives, which are a rare phenomenon in market economies, service cooperatives are very
Executive Summary xvii
common throughout the world. They are particularly successful in situations and areas withunderdeveloped market services, when individual farmers face difficulties with access to marketingand supply channels. Service cooperatives are an accepted market mechanism for dealing withdifficulties attributable to small farm sizes.
The fact that family farms are the most popular form in market economies, whilecooperatives and corporations are rare suggests that family farms enjoy a definite performanceadvantage in market economies. Otherwise, they would not be so popular. A family farm is notnecessarily a small farm: there are many examples both in market economies and in transitionaleconomies where an individual farmer starting with a small allotment gradually increases hisholdings through market transactions, which may include both purchase and leasing of land ownedby others. The purpose of land transactions is to enable the farmer to achieve a farm size thatmaximizes the family's income under the specific circumstances. The desired farm size depends onmany factors, which include the climate, the environment, economic conditions, government'spolicies, production technology, relative cost of labor and machinery, but perhaps most importantlythe specific skills and managerial capacity of the family members. A family farm will continuegrowing as long as it can be efficiently managed by the family. As a result, one cannot identify onesingle optimal farm size that would be the best for everybody in all countries. There is no evidenceanywhere in the world that state officials have been successful in dictating the optimal farm size. Itis the farmers themselves who optimize the size of their farm over time in response to marketmechanisms, subject to the constraints of their own skills and preferences.
Different countries in the CIS and Central Eastern Europe and chose different starting pointsfor land privatization and distribution in their land reform strategies. The starting points weredetermined by a combination of cultural, historical, and political considerations. Some countrieschose restitution of land to former owners, other countries distributed land share certificates topeasants representing undefined plots of land, yet others chose the process of physical distributionof land plots to farmers. The experience of a decade of transition makes it impossible to decide ifany particular strategy has worked better than the others. They all provided individuals and familieswith access to a basic allotment of land. Yet it is clear today that, in addition to providing a basicallotment of land, the land reform process must ensure easy transferability of land amongindividuals in the interest of creating optimal farm sizes.
Most land in market economies is privately owned, but farmers do not own all the land theyuse. Land leasing and renting are a wide-spread practice. It is extremely important, therefore, toensure transferability of land after the initial distribution. Privately owned land, as well as landleased from the state, must be easily transferable through market transactions to provide sufficientflexibility for farm size adjustment. The easy transferability of land is an essential means to avoidending up with a locked-in, inefficient farm structure that prevents the country from enjoying the fulleconomic benefits of land privatization.
Hungary is an example of a country where farm size adjustrnent, including consolidation ofhighly fragmented holdings into efficient commercial operations, has progressed significantlythrough a variety of leasing arrangements among individual land owners. But Hungary is not theonly country with positive experience in this direction. Empirical evidence from all transition
xviii Turkmenistan:
countries, including Ukraine, Georgia, Armenia, and Moldova, shows that farmers who increase theirland holdings by leasing land from others at the same time increase their family income and well-being. Individuals who lease out land also benefit: pensioners who otherwise would be unable tocultivate their plots receive useful lease income, while individuals who may be more skilled in non-farm occupations are able to devote their effort to other work while at the same time ensuring thattheir land is not idle. Poland provides an opposite example: here, despite an unbroken tradition ofprivate land ownership, farm sizes have generally failed to adjust so far due to various constraintsand inadequacy of market mechanisms. As a result, Polish farmers have on the whole been unableto fully exploit the potential benefits of private land ownership.
The government has a crucial role to play on two levels: (a) launching the process of landdistribution to families, preferably based on full-fledged private ownership, but without attemptingto decide in advance on an "optimal" farm structure; and (b) facilitating the gradual evolution offarm size through removal of restrictions on transferability of land and establishment of legal andtechnical instruments for the adjustment of the initial farm structure through market mechanisms.The instruments of adjustment should allow free, voluntary decision by families to form groups forworking jointly in partnerships, cooperatives, or incorporated farms.
1. Sectoral Context of Land Reform in Turkmenistan
Turkmenistan is a predominantly desert country in which climatic factors limit theagricultural potential. Land area and sunshine are abundant, but water is scarce. Almost 80% of thecountry is extensively grazed desert pasture. Cropped area is virtually all irrigated, and comprisesonly 3.6% of land area. The endowment of irrigated crop land is less than one hectare per ruralperson. This is similar to the per-capita endowment of crop land in Armenia, Azerbaijan, andMoldova, with one substantial difference: all these are countries with a relatively high populationdensity, while the population density in Turkmenistan turns out to be high only when calculated perunit of irrigated land, and not all agricultural land.
Despite climatic limitations, agriculture is an important sector in the Turkmen economy.Turkmenistan's rich reserves of oil and gas offer potential for substantial growth from sectors otherthan agriculture. However, this potential has not been realized due to large capital investmentrequirements, as well as difficulties with logistics, market access, and low international energyprices. Agriculture therefore remains at present an important source of employment and exportearnings; in 1998 about one quarter of export revenues derived from cotton. Over half of thepopulation is rural, and just less than one half of the labor force is employed in primary agriculture.Yet agriculture contributes only about one quarter of GDP, suggesting that labor employed inagriculture is significantly less productive than in other sectors. However, national accounts are veryapproximate, and agriculture's share may be underestimated.
With the country's high ratios of labor to land, abundant solar radiation, and dependence onirrigation under conditions of water scarcity, economic logic suggests that the sector shouldspecialize in labor intensive products with high yields and high value per hectare. The actual patternof production, in contrast, emphasizes low yielding and low value products. Just under half of theplanted area (45%) is devoted to grains. By international standards, grains offer relatively low valueper hectare, particularly at the yield levels observed in Turkmenistan. Another 38% of the plantedarea is devoted to cotton, a higher value crop, but cotton area is down from 49% of the planted areain 1991. Horticultural products can offer higher value per hectare than grains or cotton, and prior toindependence Turkmenistan was a major producer and exporter of fruits and vegetables for morenortherly regions of the USSR. Production and trade in these products declined markedly in the1990s with the dissolution of the USSR, and has not recovered.
Crop yields show high variability despite the prevalence of irrigation. Although thevariability masks trends, yields appear to be low and declining, particularly since 1995. The 1998wheat harvest was a welcome exception to recent low yields, but much of the improvement isattributable to unusually favorable rains. The 1998 wheat yields, although higher than the prior twoyears, were still low by international standards for irrigated wheat, and may be difficult to sustainin future years with more normal weather patterns. With low yields and increased area devoted tolow value crops, the evolution of Turkmen agriculture is at odds with longer-term trends that couldincrease rural well-being. In addition, present agricultural practices are contributing to depletion of
I
2 Turkmenistan:
soil and water resources, and may undermine the natural resource base for agricultural productionin the future.
Poor performance of agriculture raises important questions regarding the prospects forlonger-term growth in Turkmenistan. The outlook for agriculture and for the rural sector moregenerally depends to an important degree on reforms in land tenure and related decisions regardingagricultural policy. Since 1991, the government has made a number of changes in agriculturalpolicy. Major objectives of agricultural policy have been to achieve self-sufficiency in grains, earnforeign exchange through continued export of cotton, and provide resources to other sectors forinvestment in public buildings, infrastructure, and industry. These multiple roles and ambitiousgoals for the agricultural sector were expected in 1991 to be temporary, since high and early earningsfrom the energy sector were anticipated.
Earnings from the energy sector did not materialize as expected, and agricultural policiesadopted soon after independence became a longer-term framework for the sector. Under thesepolicies, agriculture experienced a gradual decline in performance until 1996, when output droppedprecipitously for a number of reasons. Adjustments in policy and adoption of new programsfollowed after 1996.
Recent developments in the economy as a whole, in particular low revenues from gas exportsand delayed growth in industry and services, imply that agriculture will remain more important forthe foreseeable future than was expected during the optimistic period immediately afterindependence. Indeed, the latest strategy for socio-economic development of Turkmenistan to year2010, adopted in December 1999, projects that agriculture will maintain its share of GDP at around25% at least to year 2004. The efficiency of resource use in agriculture and the impact of policy onsectoral performance is therefore of heightened importance as agriculture's share of the economyremains relatively high.
The Macroeconomic Environment for Agriculture
Changes in Turkmenistan's agricultural sector reflect an approach to reform marked bygradualism, guided by administrative authority, and punctuated by turnover in personnel. As aconsequence of the gradualist approach, the degree of administrative control over the sector remainshigh and retains key elements of central planning, such as administered prices and production quotas.Under present policies a substantial flow of resources is extracted from agriculture, as argued belowin this report. The present position of agriculture as a net contributor to the rest of the economy isin contrast to the situation in the late Soviet period, when agriculture was a net recipient of resourcesthrough investments in land reclamation and irrigation, input subsidies, and subsidized credit, theoverall impact of which exceeded the implicit taxation of state orders.
In the early years after independence in 1991, Turkmen authorities expected to benefit froman improvement in terms of trade, as energy exports sold for higher prices on international marketsthan they had under barter terms of trade in the Soviet system. Although formal terms of trade forenergy were more advantageous in international markets, Turkmenistan could not access the morelucrative sales because the gas pipelines linked them with partners within the former Soviet trading
Chapter 1 - Sectoral Context of Land Reform in Turkmenistan 3
space. With cotton, the situation was reversed. The barter terms of trade for cotton were lessadvantageous on international markets than they had been in the Soviet system, but cotton could beredirected easily to international buyers who paid cash in hard currency. The switch from ruble tradeto dollar trade more than compensated for a decline in the formal relative price of cotton. Thecountry thus entered into independence confident of high economic growth based on exports ofenergy and cotton. Difficulties related to payments for energy exports were expected to betransitory. The Turkmen manat was introduced in November 1993 at an initial exchange rate of 2manat to the US dollar.
Between 1993 and 1995 the outlook dimmed. Real GDP declined by approximately 40% andinflation averaged 1,500% annually. The economy's decline was slow for a period in 1995 and early1996, but then accelerated, spurred by the disastrous harvest of 1996 and sharply lower paymentsfor gas exports. For example, exports of gas fell from approximately 80 billion cubic meters in 1990to 6.5 billion in 1997. The economy declined by 25% in 1997 alone, and then made a partialrecovery in 1998, due largely to a better harvest. Even with the recovery, however, aggregate realGDP remains below that of 1996.
Despite the severe shrinkage of the economy between 1991 and 1998, the government hasmaintained a major program of public investment, financed largely by foreign borrowing, and to alesser extent by redistribution of earnings from the agricultural sector. This included constructingnew public buildings in Ashgabat, grain storage and milling facilities, a new airport, and modernhotels.
The large amount of foreign borrowing has led to substantial obligations for debt service, andthe continuation of the construction program despite the worsening economy places a high burdenon agriculture. Direct and indirect taxes on cotton sales and exports accounted for about 9% ofbudgetary revenues in 1998. This amount is considerably less than the share of the energy sector,at 3 1 % of revenues. A 9% share of budgetary revenues from agriculture may not appear high if thesector in fact contributes about 25% of GDP. Indeed, as noted below, agriculture is exempt froma number of taxes operative for other sectors, such as the value added tax and the profit tax.However, virtually all of the direct tax on agriculture comes from the cotton sector. Moreover, thebudgetary revenues from cotton do not reflect the full burden of taxation on agriculture. Taxes onwheat are implicit, and flow directly to consumers through low bread prices without showing in thebudget. Thus the aggregate tax burden for agriculture is higher than the government's explicit sharereflected in the budget.
The appropriate level and mechanisms for taxation of agriculture could be the subject of aseparate and detailed discussion. As a general principle, the overall level of taxation should beadequate to keep the budget deficit within bounds, the tax rate should be roughly equal across sectorsto avoid swings in investment flows, and the instruments of taxation should be roughly neutral inthe impact on producers' decisions about choice of activities and technology. Taxation of cotton andwheat in Turkmenistan deviates from these general principles. The state purchases wheat under stateorder prices below international prices, and then passes the benefit to consumers.
4 Turkmenistan:
The tax burden and the instruments for extracting tax (production and marketing orders)reduce efficiency and earnings of agriculture. Yet with public finance in a perilous state and thebudget deficit increasing, reducing the tax on cotton and wheat would require either alternativesources of revenue or substantial cuts in public expenditure. Without either of these measures, a cutin the cotton tax would be inflationary. Inflation hovered around 20% annually in 1997 and early1998 after a decline from triple digits in 1996, but the monetary expansion in late 1998 could pushit higher in 1999. Agricultural producers are locked into production quotas and fixed administeredprices for inputs and output, and can do little to protect them if inflation accelerates. Renewedinflation would therefore harm most agricultural producers. They would gain little if the governmenteased the tax burden on cotton but at the same time fueled inflation. Reduced taxation of cottonwould and will require a reassessment of the government's expenditure and investment programsthat has not been undertaken to date. As a consequence mandatory production and marketing ofcotton and wheat remains a major instrument of public finance.
The dual commitment to gradual economic reform and high rates of public investment hascreated tension in the economy throughout the period of independence. High rates of publicinvestment necessitate high growth rates to generate revenues and borrowing capacity. Gradualreform brings slow, or in this case, negative growth. The tension has been resolved in part throughincreased foreign borrowing, and in part through retention of the state order system as a mechanismfor taxation of agriculture.
Although public investment is high, investment in essential public goods and services foragriculture is low. Basic maintenance of the irrigation system, investments in agricultural science,and extension activities have been cut back severely. Public investments related to agriculture havebeen largely to support the government grain program, and have included grain milling capacity, andimportation of combines for harvesting. The policies and programs pursued in the 1 990s have thusresulted in significant net depreciation of the capital stock in primary production and watermanagement. Private investment in agriculture is low now because earnings are low, and is limitedto the household plot, since this is the land for which families have greatest confidence in securityof tenure. To the extent that rural households have resources to invest, they concentrate onhousehold plots and housing. One of the potential advantages of transferring agricultural land toprivate ownership is that land reform serves as a stimulus to private investment in rural areas, ashouseholds invest to improve and utilize their enlarged landholdings.
Depreciation of the capital stock occurs in parallel with degradation of land and waterquality, due to increased soil salinity, lower quality of water, and more erratic timing of delivery.These trends bode ill for the sector and the economy as a whole. Risks of severe revenue shock likethat deriving from the harvest failure of 1996 increase as the resource base deteriorates and thecapital stock ages. Yet with higher debt service requirements, the need for revenue rises. Improvedwheat yields in 1998 provided some breathing space. Paradoxically, the larger than expected harvestalso created difficulties in public finance, since the government had not budgeted adequate resourcesto procure the large crop. Emission of an extraordinary tranche of centralized credit was needed tofinance the larger-than-expected procurement.
Chapter I - Sectoral Context of Land Reform in Turkmenistan 5
Sectoral Performance Since Independence
Overall, Turkmen agriculture has declined about 40% since 1990, as reported to FAO andto the CIS statistical agency. The reported decline was modest until 1996, when a severe drop in thecotton and wheat crops pushed the sectoral total down dramatically. The decline in Turkmenistanhas been roughly equal to that in Kazakhstan and the Kyrgyz Republic, although in the latter growthhas resumed from a low point in 1995. Output in neighboring Tajikistan has dropped even more,largely due to eruption of civil strife. Reported output in Uzbekistan has fallen less, about 20% overthe same period, although statistical reporting on the rural sector in both countries is imprecise.
Approximately 60% of the value of Turkmen agriculture derives from the crop sector. Cottonis the most important crop, followed by wheat. Preliminary reports indicate that 1998 was afavorable year for production of wheat, and a less favorable year for cotton. Neighboring countrieswithin the region also report good crops of wheat, suggesting that weather conditions havecontributed to higher yields of grain in 1998. Wheat production was reported at 1.2 million tons thatyear, the largest harvest to date. The cotton crop was reported to be about 700,000 tons. This ishigher than the exceptionally low crop of 1996 (435,000 tons) and that of 1997 (about 600,000 tons),but it is only about half the level of cotton production reported in the early 1990s.
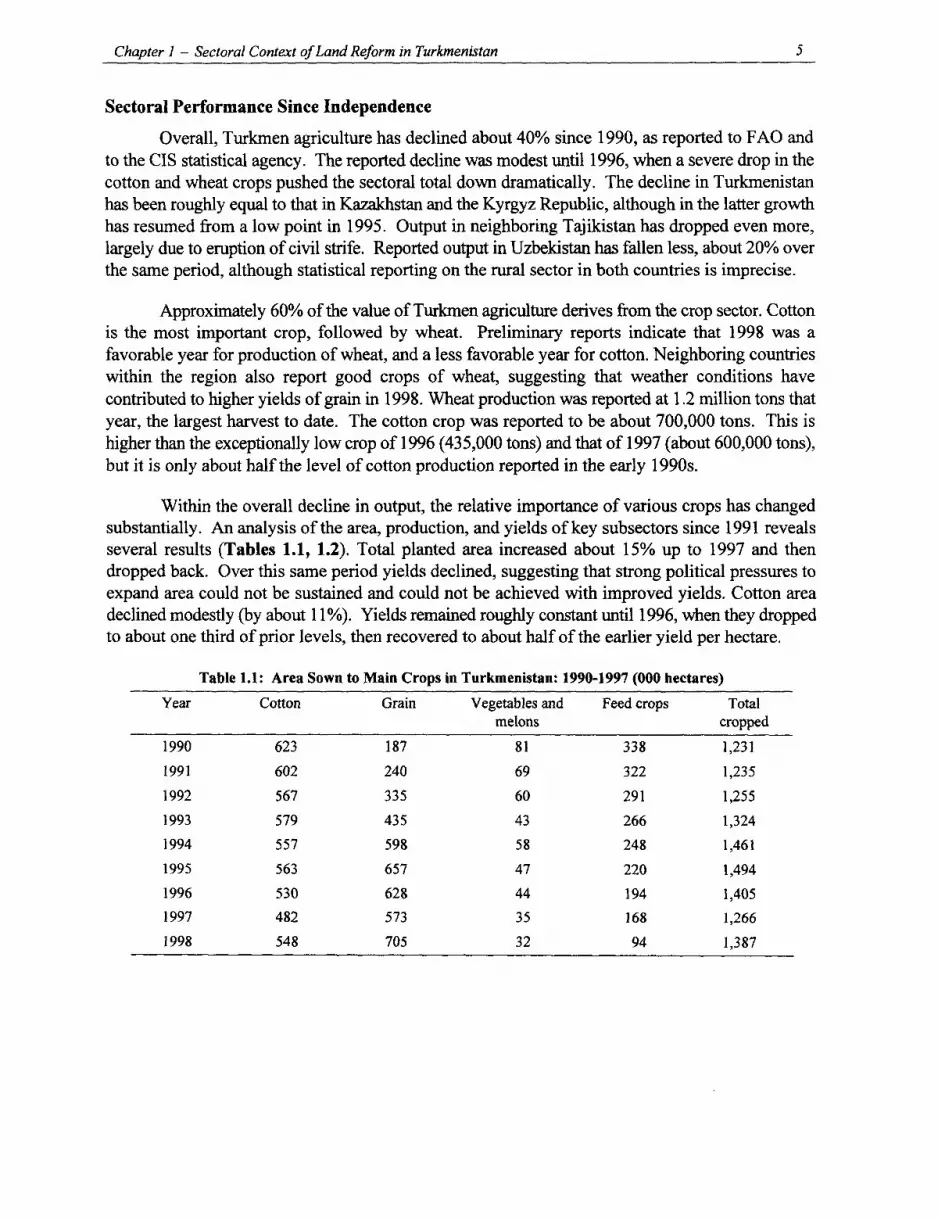
Within the overall decline in output, the relative importance of various crops has changedsubstantially. An analysis of the area, production, and yields of key subsectors since 1991 revealsseveral results (Tables 1.1, 1.2). Total planted area increased about 15% up to 1997 and thendropped back. Over this same period yields declined, suggesting that strong political pressures toexpand area could not be sustained and could not be achieved with improved yields. Cotton areadeclined modestly (by about 11%). Yields remained roughly constant until 1996, when they droppedto about one third of prior levels, then recovered to about half of the earlier yield per hectare.
Table 1.1: Area Sown to Main Crops in Turkmenistan: 1990-1997 (000 hectares)
Year Cotton Grain Vegetables and Feed crops Totalmelons cropped
1990 623 187 81 338 1,231
1991 602 240 69 322 1,235
1992 567 335 60 291 1,255
1993 579 435 43 266 1,324
1994 557 598 58 248 1,461
1995 563 657 47 220 1,494
1996 530 628 44 194 1,405
1997 482 573 35 168 1,266
1998 548 705 32 94 1,387
6 Turkmenistan:
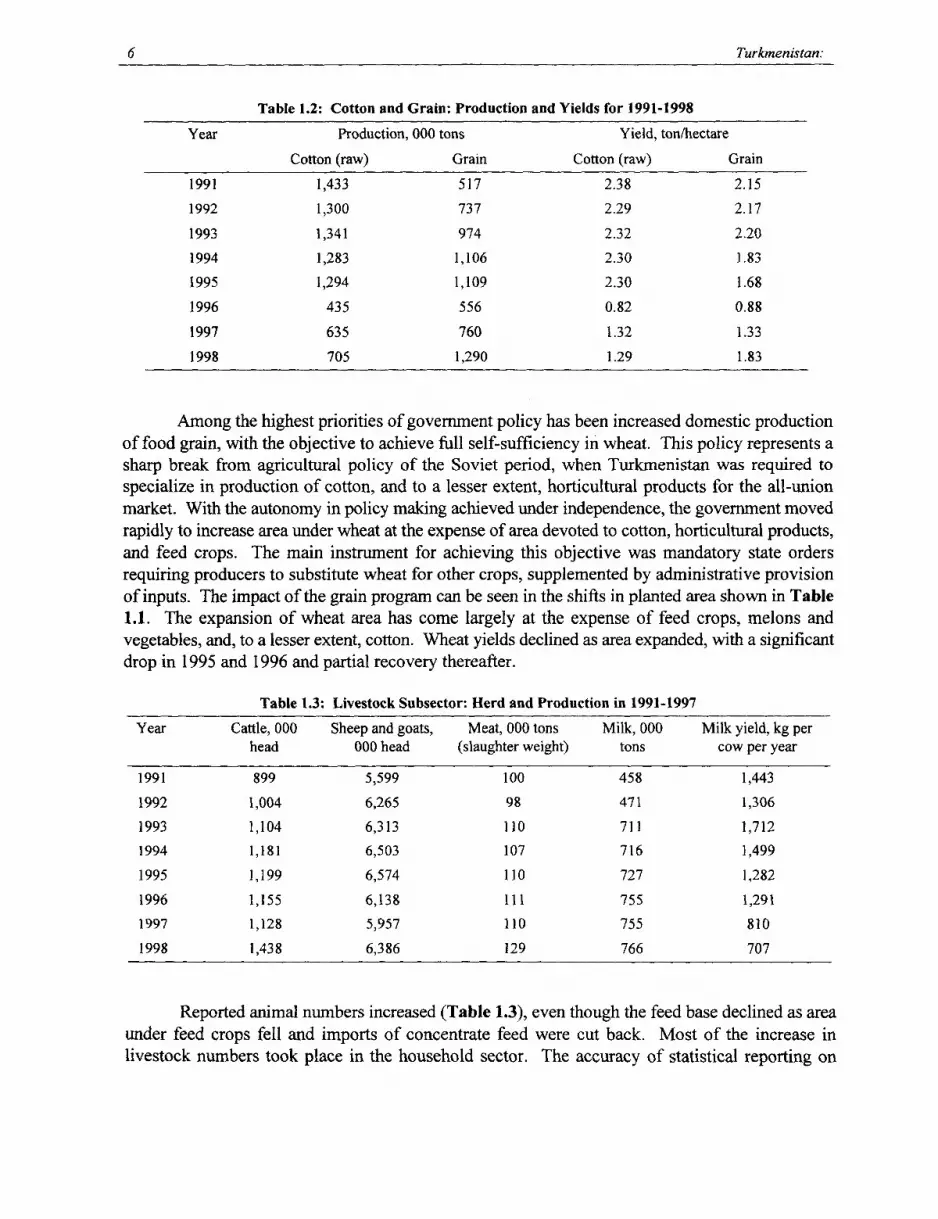
Table 1.2: Cotton and Grain: Production and Yields for 1991-1998
Year Production, 000 tons Yield, ton/hectare
Cotton (raw) Grain Cotton (raw) Grain
1991 1,433 517 2.38 2.15
1992 1,300 737 2.29 2.17
1993 1,341 974 2.32 2.20
1994 1,283 1,106 2.30 1.83
1995 1,294 1,109 2.30 1.68
1996 435 556 0.82 0.88
1997 635 760 1.32 1.33
1998 705 1,290 1.29 1.83
Among the highest priorities of government policy has been increased domestic productionof food grain, with the objective to achieve full self-sufficiency in wheat. This policy represents asharp break from agricultural policy of the Soviet period, when Turkmenistan was required tospecialize in production of cotton, and to a lesser extent, horticultural products for the all-unionmarket. With the autonomy in policy making achieved under independence, the government movedrapidly to increase area under wheat at the expense of area devoted to cotton, horticultural products,and feed crops. The main instrument for achieving this objective was mandatory state ordersrequiring producers to substitute wheat for other crops, supplemented by administrative provisionof inputs. The impact of the grain program can be seen in the shifts in planted area shown in Table1.1. The expansion of wheat area has come largely at the expense of feed crops, melons andvegetables, and, to a lesser extent, cotton. Wheat yields declined as area expanded, with a significantdrop in 1995 and 1996 and partial recovery thereafter.
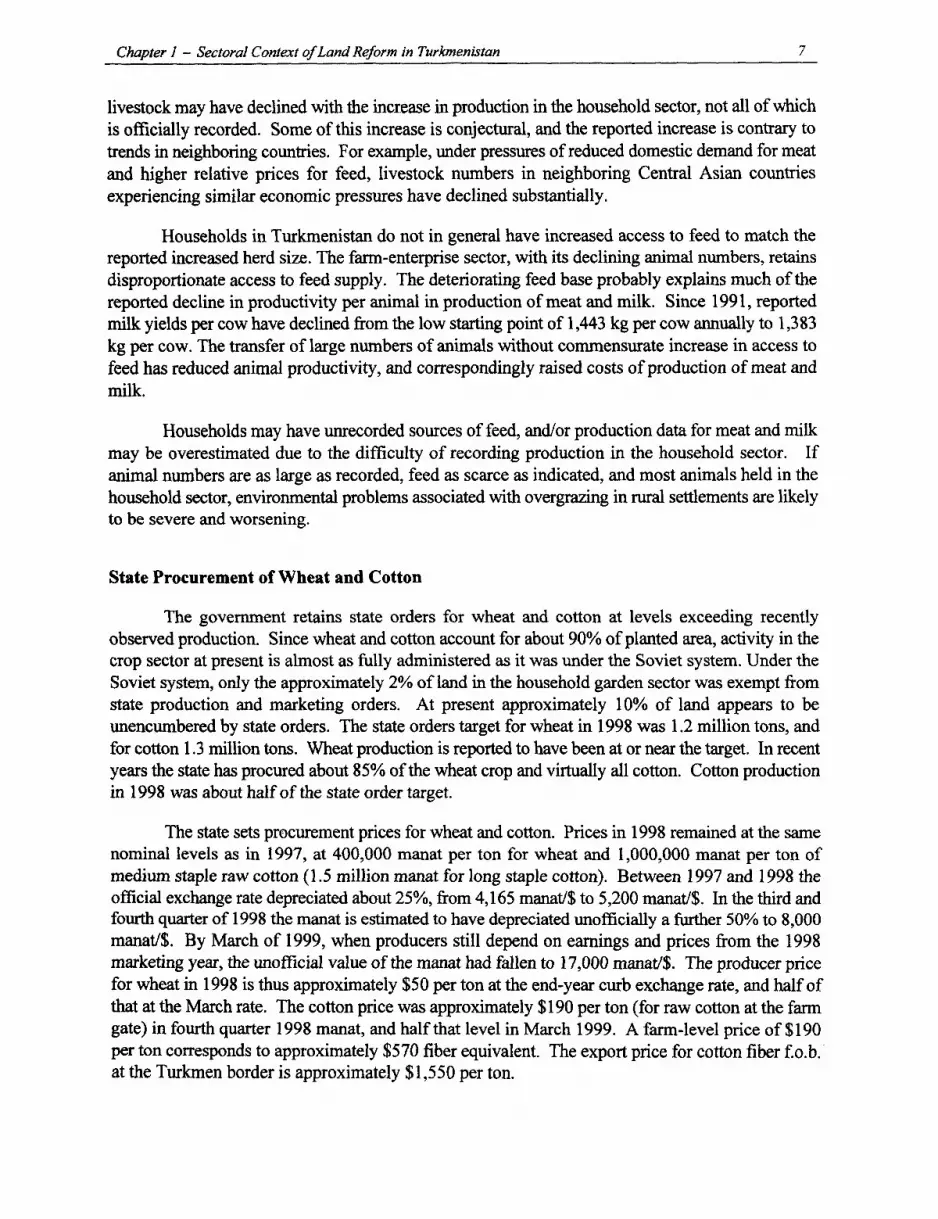
Table 1.3: Livestock Subsector: Herd and Production in 1991-1997
Year Cattle, 000 Sheep and goats, Meat, 000 tons Milk, 000 Milk yield, kg perhead 000 head (slaughter weight) tons cow per year
1991 899 5,599 100 458 1,443
1992 1,004 6,265 98 471 1,306
1993 1,104 6,313 110 711 1,712
1994 1,181 6,503 107 716 1,499
1995 1,199 6,574 110 727 1,282
1996 1,155 6,138 111 755 1,291
1997 1,128 5,957 110 755 810
1998 1,438 6,386 129 766 707
Reported animal numbers increased (Table 1.3), even though the feed base declined as areaunder feed crops fell and imports of concentrate feed were cut back. Most of the increase inlivestock numbers took place in the household sector. The accuracy of statistical reporting on
Chapter 1 - Sectoral Context of Land Reform in Turkmenistan 7
livestock may have declined with the increase in production in the household sector, not all of whichis officially recorded. Some of this increase is conjectural, and the reported increase is contrary totrends in neighboring countries. For example, under pressures of reduced domestic demand for meatand higher relative prices for feed, livestock numbers in neighboring Central Asian countriesexperiencing similar economic pressures have declined substantially.
Households in Turkmenistan do not in general have increased access to feed to match thereported increased herd size. The farrn-enterprise sector, with its declining animal numbers, retainsdisproportionate access to feed supply. The deteriorating feed base probably explains much of thereported decline in productivity per animal in production of meat and milk. Since 1991, reportedmilk yields per cow have declined from the low starting point of 1,443 kg per cow annually to 1,383kg per cow. The transfer of large numbers of animals without commensurate increase in access tofeed has reduced animal productivity, and correspondingly raised costs of production of meat andmilk.
Households may have unrecorded sources of feed, and/or production data for meat and milkmay be overestimated due to the difficulty of recording production in the household sector. Ifanimal numbers are as large as recorded, feed as scarce as indicated, and most animals held in thehousehold sector, environmental problems associated with overgrazing in rural settlements are likelyto be severe and worsening.
State Procurement of Wheat and Cotton
The governrnent retains state orders for wheat and cotton at levels exceeding recentlyobserved production. Since wheat and cotton account for about 90% of planted area, activity in thecrop sector at present is almost as fully administered as it was under the Soviet system. Under theSoviet system, only the approximately 2% of land in the household garden sector was exempt fromstate production and marketing orders. At present approximately 10% of land appears to beunencumbered by state orders. The state orders target for wheat in 1998 was 1.2 million tons, andfor cotton 1.3 million tons. Wheat production is reported to have been at or near the target. In recentyears the state has procured about 85% of the wheat crop and virtually all cotton. Cotton productionin 1998 was about half of the state order target.
The state sets procurement prices for wheat and cotton. Prices in 1998 remained at the samenominal levels as in 1997, at 400,000 manat per ton for wheat and 1,000,000 manat per ton ofmedium staple raw cotton (1.5 million manat for long staple cotton). Between 1997 and 1998 theofficial exchange rate depreciated about 25%, from 4,165 manat/$ to 5,200 manat/$. In the third andfourth quarter of 1998 the manat is estimated to have depreciated unofficially a further 50% to 8,000manat/$. By March of 1999, when producers still depend on earnings and prices from the 1998marketing year, the unofficial value of the manat had fallen to 17,000 manat/$. The producer pricefor wheat in 1998 is thus approximately $50 per ton at the end-year curb exchange rate, and half ofthat at the March rate. The cotton price was approximately $190 per ton (for raw cotton at the farmgate) in fourth quarter 1998 manat, and half that level in March 1999. A farm-level price of $190per ton corresponds to approximately $570 fiber equivalent. The export price for cotton fiber f.o.b.at the Turkmen border is approximately $1,550 per ton.
8 Turkmenistan:
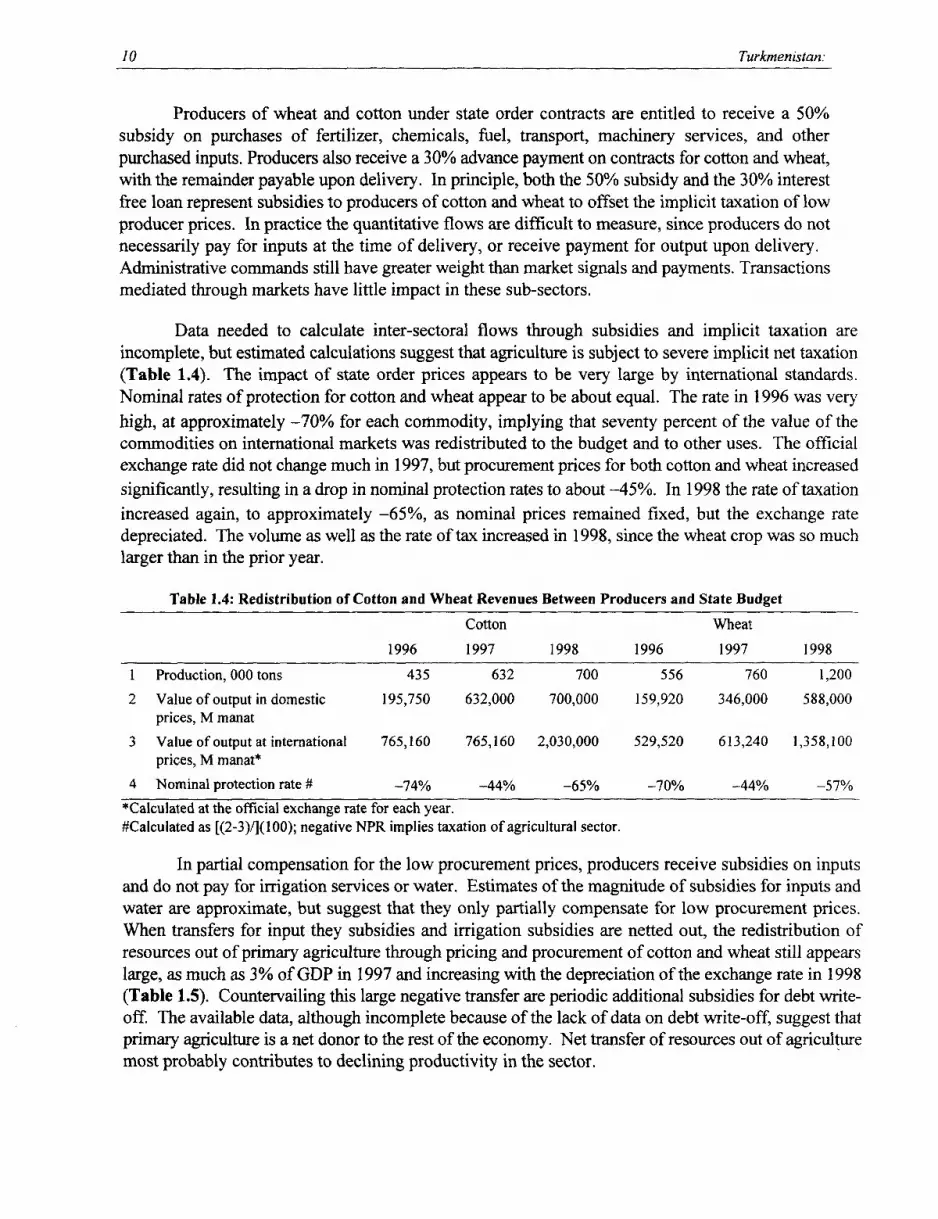
Implicit Taxation of Cotton and Wheat Producers
The low procurement prices for cotton and wheat implies that producers of these productsare subject to high implicit taxation. Producers are implicitly taxed when they are required to sellproducts to the state for less than they could receive if they sold directly to international tradersactive in global markets. The direction and magnitude of implicit taxation of the sector as a wholeand of particular comnmodities is important when agriculture is undergoing major structural change,as, for example, through land reform. Structural change often implies investment on the part ofindividuals who are beneficiaries of the programs of reforn. Patterns of pricing and profitability willinfluence the magnitude and distribution of investment. If taxation is very high or if profitability isdepressed for other reasons, participants in reform programs may withdraw or fail to fulfillobligations incurred under the programs. Distortions and high rates of implicit taxation, therefore,can make otherwise promising reforms fail to deliver expected benefits.
The question of whether agricultural producers are paying high implicit taxes is directlyrelevant to the issues of land reform addressed in this report. In other countries of the former SovietUnion, particularly Russia and Ukraine, producers have been given the legal right to assumeownership of land and to establish new productive enterprises. Few have taken advantage of theopportunity, in part because with poorly developed markets and low prices, the value of landtransferred through the reform programs is low. In contrast, when land reforms began in China in1978, producer prices rose in real terms and implicit taxation of agriculture declined. Householdsmoved rapidly to claim land under the household responsibility system because the land had realvalue under the new economic conditions. In Turkmenistan, as in Russia and in China, the responseof rural people to opportunities created under land reform programs will depend on whether theassociated reforms in pricing and marketing are undertaken simultaneously. Reforms that increasethe value of land, such as changes in marketing rules, can be expected to accelerate land reform.
The beneficiaries of these taxation policies are a diverse group. In particular, breadconsumers benefit from low wheat prices, because they are able to buy bread and flour for reducedprices. Since over half of the population is rural, and many of these people are both producers andconsumers of bread, many rural people sell wheat to the state and later buy it back in the form of lowpriced flour or bread. These transactions are not efficient, and simply impose costs through excessmarketing and waste. Flour consumers who do not grow wheat benefit from the low prices, althoughthey are likely to meet the problems that are well known and associated with bread subsidies; forexample, lines, erratic deliveries, and shortages.
The beneficiaries of low cotton prices are more difficult to identify. The difference betweenthe low domestic cotton price and the international trading price is divided between the cottonmarketing agency, the state budget, and the Agricultural Development Fund in proportions that arenot transparently displayed. The Agricultural Development Fund was founded in April 1996 tomanage centralized investment and repayment of foreign obligations associated with the agriculturalsector. The Agricultural Development Fund inherited debts incurred since 1991 on behalf of theMinistry of Agriculture for purchases of equipment for the grain program and also for other projectsnot necessarily connected to agriculture, such as construction of the Ak-Altyn hotel. The revenues.and expenditures of the Agricultural Development Fund are displayed in aggregate in the 1998
Chapter I - Sectoral Context of Land Reform in Turkmenistan 9
budget, and this allows somewhat greater transparency than in the past, although disaggregatedaccounts of expenditures under the Fund are not yet public.
A portion of the difference between farm gate and export price covers processing andhandling costs of the cotton marketing agency. In the cotton industry in the United States, whereprocessors and handlers are subject to competitive pressures, processing and transport marginsabsorb approximately ten cents per pound, or $220 per metric ton. Producers in a competitiveindustry also receive the monetary value of processing byproducts, such as oil and oilcake. Whereprocessors have monopsony power, processing margins tend to be higher because competitivepressures are not exerted to bring them down. Producer prices are correspondingly depressed. InTurkmenistan the cotton marketing agency is not subject to competitive pressures, and thus couldbe expected to charge relatively high margins. At the same time, the marketing agency providesservices, such as extension advice and provision of some agricultural input, that are not provided bycotton ginning and processing firms elsewhere. A full accounting of the marketing and processingmargins of the cotton agency has not been made public.
The residual price difference between the low payments to farmers, margins retained byprocessors, and the export price of approximately $1,550 per ton is divided between the budget andthe Agricultural Development Fund. In the 1998 budget, the direct budgetary revenues from salesof cotton were projected to be 199 billion manat, and another 355 billion manat were projected toaccrue to the Agricultural Development Fund from export sales of cotton. Yet according to thecalculations shown below, the difference between the value of the cotton crop at the farm level indomestic procurement prices and in international trading prices converted at the end of yearexchange rate is approximately twice the amount projected for budgetary revenues from cotton andfor the Fund.
Part of the difference is explained by the movement in the exchange rate during 1998, buteven at the prior year's exchange rate, the price difference exceeds the projected revenues to thebudget and the Agricultural Development Fund. Some or all of this difference is likely to beabsorbed by the margins of the cotton processing and marketing agency. With greater transparencyof accounting and clarity on how cotton revenues are distributed, producers would be in a betterposition to lobby for retention of a higher share of export earnings, and thus would have higherretained earnings to invest in improved productivity.
The Agricultural Development Fund manages the debt repayment obligations of theMinistry, and also is responsible for financing subsidies for current inputs, such as fertilizer. For1998 revenues into the Fund were budgeted at 419 billion manat (approximately $80 million at theend year official exchange rate), of which 85% were to derive from cotton exports. Expendituresunder the Fund were also budgeted at 419 billion manat in 1998 for agriculture and 602 billionmanat in aggregate. At this level of revenue and expenditure, the Agricultural Development Fundin 1998 would have accounted for approximately 10% of budgetary expenditures, or about 3% ofGDP. Although the 410 billion manat of expenditure is not broken down by category, it presumablyincludes both input subsidies for the 1998 crop year and debt repayment for agricultural investmentin the past. The aggregate expenditure figure may include operating costs of the Fund and debt.service for non-agricultural obligations.
10 Turkmenistan:
Producers of wheat and cotton under state order contracts are entitled to receive a 50%subsidy on purchases of fertilizer, chemicals, fuel, transport, machinery services, and otherpurchased inputs. Producers also receive a 30% advance payment on contracts for cotton and wheat,with the remainder payable upon delivery. In principle, both the 50% subsidy and the 30% interestfree loan represent subsidies to producers of cotton and wheat to offset the implicit taxation of lowproducer prices. In practice the quantitative flows are difficult to measure, since producers do notnecessarily pay for inputs at the time of delivery, or receive payment for output upon delivery.Administrative commands still have greater weight than market signals and payments. Transactionsmediated through markets have little impact in these sub-sectors.
Data needed to calculate inter-sectoral flows through subsidies and implicit taxation areincomplete, but estimated calculations suggest that agriculture is subject to severe implicit net taxation(Table 1.4). The impact of state order prices appears to be very large by international standards.Nominal rates of protection for cotton and wheat appear to be about equal. The rate in 1996 was veryhigh, at approximately -70% for each commodity, implying that seventy percent of the value of thecommodities on international markets was redistributed to the budget and to other uses. The officialexchange rate did not change much in 1997, but procurement prices for both cotton and wheat increasedsignificantly, resulting in a drop in nominal protection rates to about -45%. In 1998 the rate of taxationincreased again, to approximately -65%, as nominal prices remained fixed, but the exchange ratedepreciated. The volume as well as the rate of tax increased in 1998, since the wheat crop was so muchlarger than in the prior year.
Table 1.4: Redistribution of Cotton and Wheat Revenues Between Producers and State Budget
Cotton Wheat
1996 1997 1998 1996 1997 1998
I Production, 000 tons 435 632 700 556 760 1,200
2 Value of output in domestic 195,750 632,000 700,000 159,920 346,000 588,000prices, M manat
3 Value of output at international 765,160 765,160 2,030,000 529,520 613,240 1,358,100prices, M manat*
*Calculated at the official exchange rate for each year.#Calculated as [(2-3)1(100); negative NPR implies taxation of agricultural sector.
In partial compensation for the low procurement prices, producers receive subsidies on inputsand do not pay for irrigation services or water. Estimates of the magnitude of subsidies for inputs andwater are approximate, but suggest that they only partially compensate for low procurement prices.When transfers for input they subsidies and irrigation subsidies are netted out, the redistribution ofresources out of primary agriculture through pricing and procurement of cotton and wheat still appearslarge, as much as 3% of GDP in 1997 and increasing with the depreciation of the exchange rate in 1998(Table 1.5). Countervailing this large negative transfer are periodic additional subsidies for debt write-off. The available data, although incomplete because of the lack of data on debt write-off, suggest thatprimary agriculture is a net donor to the rest of the economy. Net transfer of resources out of agriculturemost probably contributes to declining productivity in the sector.
Chapter I - Sectoral Context of Land Reform in Turkmenistan II
Products other than cotton and wheat are not subject to explicit production quotas orprocurement orders. Major processing plants for meat, milk, and horticultural products, however,remain publicly owned. Local governments in some cases require processors to provide milk andmeat under preferential terms to schools, hospitals, and other local institutions with special status.This implicit price control on a portion of processed products depresses the prices that processingplants can pay for raw materials. As a result, most meat and milk is sold on local markets and fullybypasses the processing sector. Most cattle and a large number of sheep and goats are in thehousehold sector, and can be marketed informally and directly.
Table 1.5: Net Resource Transfers in Agriculture
1997 1998
Taxation through price gap, bill. Manat* -768 -2,100
Direct input subsidies# 275 300
Irrigation subsidy+ 229 235
Net transfer out of agriculture -264 -1,565
Percent ofGDP 3% 11%
*From Table 1.4.# Input subsidies for cotton and wheat are estimated from the survey data, as shown in Table1.6. According to survey data, producers report costs for variable inputs of approximately500,000 manat per hectare on average for cotton and wheat. The subsidy portion is thuscalculated at 50%, or 250,000 manat per ha. Extrapolating to an area of 1.1 million haplanted in cotton and wheat in 1997 and 1.2 million ha in 1998 yields the estimates shown.+Taken from the corresponding budget expenditure category
Table 1.6: Estimating Input Subsidies
Cotton/wheat breakdown Total in sample
Total cost of purchased inputs in the sample 42,804 M manat
Total production of cotton and wheat in the sample: 123,747 ton
Cotton 54,808 ton
Wheat 68,939 ton
Total area sown to cotton and wheat in the 86,919 ha
sample:
Cotton 38,113 ha
Wheat 48,806 ha
Unit costs and subsidy Manat per ton Manat per ha
Cost of inputs 345,900 492,500
Subsidy component (50% of cost) 173,000 246,250
Processing
According to a program announced in late 1998, the processing sector will undergoreorganization to increase scope for private ownership and investment. Under the program,enterprises will be corporatized, and minority stakes of shares will be sold to private buyers whoexpress interest. The state will most likely retain control and the industries will remain highly
12 Turkmenistan:
concentrated. It is too early to tell whether this program will attract the interest of domestic and/orforeign investors. Similar programs of corporatization and partial privatization in other countrieshave had limited impact either on investment or performance of the enterprises. For example, inCentral Europe, where foreign investment in food processing has facilitated entry into internationalmarkets on a substantial scale, foreign firms generally take a controlling share of ownership beforethey are willing to make substantial new investment.
Agricultural Inputs
The state in Turkmenistan is actively involved in allocation and distribution of fertilizer,seeds, agricultural chemicals, machinery, and fuel. Producers working under state orders are entitledto the 50% subsidy on inputs noted above. The private sector is relatively undeveloped and inactivein provision of inputs. Imports of fertilizer and chemicals are managed through the state commodityexchange, and then distributed through a subsidiary firm associated with the exchange.
Turkmenistan had a well-developed and innovative system of biological pest controlintroduced in the late Soviet period in response to concerns about excessive use of chemical agentsfor cotton production. The system consisted of a network of laboratories producing biological plantprotection agents. The system declined throughout the 1990s, but interest has renewed since the cropfailure of 1996 and subsequent recognized outbreaks of pests. In 1998 the government began aprogram to revive the biological pest control system and made modest progress in the effort.Services for the crop and livestock sectors (primarily plant protection and veterinary services) arenow on a cost recovery basis, although the extent to which payment can be collected is still to betested.
The state pays virtually the entire cost of maintenance and operation of the irrigation system.According to the 1998 budget, expenditures on irrigation and land reclamation (net of cost recoveryand earnings of the farms and enterprises operated by the Ministry) were 235 billion manat, slightlyup from 229 billion in 1997. Although the legal basis for cost recovery of water charges exists, actualcollection is reported to be minimal. Most of the reported revenues of the Ministry of LandReclamation and Water (43 billion manat in 1998) probably derive from sales of output grown onland allocated to the Ministry by Presidential decree in November 1997 to provide a revenue basefor the Ministry. The land was allocated in an effort to make the Ministry financially self-sufficientthrough production and sale of cotton. The measure was ineffective, since it required the Ministryto undertake activities for which it is poorly suited, and did not provide sufficient resources for theMinistry to do its designated job in the irrigation sector.
Credit, Debts, and Arrears
Financing of agriculture in Turkmenistan throughout the 1990s has involved large andcomplex flows into and out of the budget, the banking system, and various off-budget funds. A newbank for agricultural lending, Daikhan Bank was created in 1995 with branches in administrativejurisdictions down to the village level. In conjunction with creation of the bank, approximately $35million in debts of agricultural producing and processing enterprises were written off, and inter-
Chapter I - Sectoral Context of Land Reform in Turkmenistan 13
enterprise debts of approximately $128 million were netted out and cleared. Daikhan Bank thusbegan operations in 1995 without a legacy of bad debt.
As part of the administrative changes in 1996, Daikhan Bank was reorganized into threecommodity-specific sub-units: Gallabank serving the wheat sector, Pagtabank serving the cottonsector, and Mallarbank serving the livestock sector. The bank and its subdivisions served in 1997largely as an agent to distribute 30% advance payments against contracted commitments to producewheat and cotton under state orders. The bank engaged in little financial intermediation in ruralareas.
In 1998 the advance payment system was amended and became a program of directedlending to producers, with the interest rate established administratively at 2% annually, and lendingamounts determined according to the state order contracts. The 1998 loans are to individualleaseholders, and are secured by personal property.
Daikhan Bank is also the major financing channel for procurement of the harvest. TheBank's own resources are relatively modest, and insufficient to finance large-scale procurement ofthe wheat and cotton harvests. In an administrative system where the state is the ultimate customer,the state ultimately provides financing to purchase the crop. In 1998 financing appears to have comefrom a special emission of directed credit issued at the end of the year and distributed throughDaikhan Bank.
* * *
The institutional setting for primary agriculture in Turkmenistan remains highlyadministered, with little scope for activities in the private sector. Producers of cotton and wheat aresubject to rules for production, marketing, and pricing that result in a high level of implicit taxationof their potential eamings. The combination of weak development of the private sector and poorincentives for agricultural production will reduce the willingness of rural people to invest in landeven if they are granted secure tenure. As the land reform moves ahead, therefore, changes in theinstitutional arrangements for input supply and marketing as well as changes in price policy couldhave a strong impact on the enthusiasm with which rural people seek land ownership, and theinvestment they are willing and able to apply to their land.
2. Historical Background and Chronology of Legal Measuresin Land Reform
Turkmenistan's agriculture is highly intensive in investment. Over the past decades, billionsof rubles and manats have been invested in irrigation, land reclamation, and land improvement inorder to make a harsh desert flower with cotton, wheat, and other valuable agricultural products.Investments in the past made production possible, but also caused considerable environmentaldamage, including dramatic reduction of water flow to the Aral Sea and salination of extensive areas,and did not always yield high returns. Nonetheless, under the demanding climatic conditions,agriculture in the future will continue to require significant recurrent investments. Much of theinvestment will have to come from producers themselves, because they are the one who will reapthe benefits, and because the state budget will be unable to finance significant additional investmentin the near future.
Rural households the world over have been shown to invest in the land they work, but onlyif they have secured tenure. They require confidence that they will be able to reap income from theirinvestments, and moreover, that they can sell their land and recover their investment if they chooseto leave farming. Without assurance of secure tenure of cropland, families will invest their ownsavings in their homes and small garden plots. They will not in general choose to invest eithersavings or labor in land that they perceive to belong to the state or to the collective. Land tenure isthus intimately linked to the productivity of land through the investment process. In many parts ofthe world, insecure land tenure is the key barrier impeding growth in productivity and quality ofland. Because of the fragility and vulnerability of Turkmenistan's land, land tenure and renewedinvestment in land are of high priority on the reform agenda.
Turkmnenistan is the only country in Central Asia in which the constitution formallyrecognizes private ownership of land. Prior to the adoption of the new Constitution in 1992, all landin Turkmenistan was owned by the state. This exclusive state ownership of land was traceable to thefundamentals of the 1917 Soviet Land Decree, which eliminated privately owned land in the regionthat would eventually become USSR. The Soviet state granted use rights in land to producers, bothcollective and individual.
Turkmenistan inherited a typically dual pattem of land tenure from the Soviet Union. Mostof the arable agricultural land (over 95%) was in permanent use of large-scale farm enterprises: therewere some 500 former state and collective farmns, which respectively cultivated 1500 ha-2500 ha ofsown land per average farm. In addition, around 2% of arable land was allocated in lifetimeinheritable possession to rural households, where farm employees and pensioners used family laborto farm small subsidiary household plots of less than 0.2 ha on average. The land in household plotswas almost entirely arable land, orchards, and vineyards, without any pastures and with very littleland in hay meadows. The composition of an average household plot was typically 85% arable landand 15% orchards and vineyards.
The large-scale farms produced on average 80% of gross agricultural product during the last-decade, while the remaining 20% came from production in small household plots. As is the case in
15
16 Turkmenistan:
other former Soviet countries, the share of subsidiary household plots in gross agricultural productis much higher than their share of land. Household plots were significantly increased in the firststage of land reform after independence in all countries of the former union. Because of the scarcityof irrigated arable land in Turkmenistan, the household plots remain quite small even afteraugmentation (from 0.14 hectares on average prior to reforms to 0.22 hectares at present).
Growth of Individual Sector
With reforms begun in the late Figure2.1:DeclineofCollectivelyCultivatedLand:1985-1998Soviet period and continued afterindependence in 1991, the share of large- 100 share of collectives, in percent
scale farm enterprises in cultivated landin Turkmenistan is shrinking (Figure _2.1). The total land holdings of theindividual sector increased nearly seven- Prna
fold during the last decade: from 36 80 _ _ .
thousand ha in 1985 to 248 thousand hain 1998 (Table 2.1). The share of the 70
individual sector in cultivated landincreased from about 2% to nearly 10%,
80 while the share of the traditional farm 1985 1987 1989 1991 1993 1995 1997
enterprises in cultivated land dropped to90%. The decline of the large enterprisesaccelerated markedly after 1989. Since Figure 2.2 Share of Household Plots in Cultivated Land: 1985-1998total irrigated and cultivated landexpanded after independence from 1.2 percent of total cultivated land
million ha to 1.7 million ha, the decliningshare does not imply decrease of total 6 - ,
land area cultivated by large-scale farms. s _ _ _However, the rate of growth of collective 4
cultivated area is much slower than therate of growth of all cultivated land, 3
which accounts for a pronounced decline 2
in the collective share. Cultivated land is Ishifting from traditional large-scale l _l l lfarms to the individual sector, the share 1985 1987 1989 1991 1993 1995 1997
of which in cultivated land has rapidlyincreased since 1990 (Figure 2.2).
Chapter 2 - Historical Background and Chronology of Legal Measures in Land Reform 17
Table 2.1: Individual Land Use: 1985-1998 (000 ha)
Year Household plots Collective gardens Private farms Total in individual use
1985 35.4 0.7 36.1
1986 36.2 0.7 36.9
1987 38.1 0.8 38.9
1988 45.3 1.3 46.6
1989 47.2 3.3 50.5
1990 51.9 3.1 55.0
1991 88.4 4.5 0.1 93.0
1992 101.5 5.4 1.8 108.7
1993 109.9 5.7 31.1 146.7
1994 117.8 5.8 87.3 210.9
1995 119.6 6.4 98.0 224.0
1996 114.4 5.1 105.5 225.0
1997 128.8 4.9 109.6 243.3
1998 131.1 5.0 116.1 252.2
The individual sector today includes Figure 2.3: Structure of Individual Sector (Jan. 1999)
three distinct categories of producers (Table2.1). The largest category is still the Household plots
household plots, which account for more 52% Collective gardens
than half of all land in the individual sector. 2%
The household plots are cultivated byapproximately half a million rural families,mostly employees and pensioners of large-scale farms. Another 60 thousand urbanfamilies cultivate gardens and vegetablepatches. This category of so-called Peasantfarmscollective gardens is quite small, however, 46%and represents about 2% of all land in the Total land in individual sector 248,200 ha
individual sector. The collective gardens areestablished by associations of city workers, usually affiliated with the same work place, who applyas a group to local government for an allocation of land. These urban groups are allocated contiguoustracts of land not far from the city, which are then subdivided into small individual plots for part-time farming by association members. The third category, which began to emerge as recently as1991-1992, are the private peasant farms (or daikhan farms) established by independent individualsoutside all collective frameworks. The number of independent private farms reached 7,000 by theend of 1998. Land in private farms comprised slightly less than half of the land in the individualsector, but this land is not as intensively farmed as land in household plots. Some land in privatefarms is still in the process of reclamation, and not yet under production. The contribution of private
18 Turkmenistan:
farms to total output is thus minor. Figure 2.3 shows the relative weight of the three components ofthe individual sector in land area.
The first stage of land reform in Turkmenistan, as in other post-Soviet countries, wasexpansion of household plots. The land in household plots doubled within two years, from 52thousand ha in 1990 to 102 thousand ha in 1992 (see Table 2.1). By the end of 1998, it reached 130thousand ha, or an average of 0.22 ha per family. The share of household plots in cultivated landincreased from around 2.5% in the 1980s to nearly 7.5% in 1998 (see Figure 2.2). Collectivegardens of urban workers registered an even more spectacular growth rate: from a mere 700 ha in1985 to 5000 ha in 1990, or an average of 0.08 ha per family. Private farmers, the new thirdcomponent of the individual sector, were allocated 110 thousand ha of land between 1992 and theend of 1998, of which 90 thousand ha are the farmers' property and another 20 thousand ha areleased from the state. An average private farm today is 16 ha.
Table 2.2: Land Holdings of Peasant Farms: 1991-1998 (000, ha)
Year Total land Privately owned Leased
1991 0.1 -- 0.1
1992 1.8 -- 1.8
1993 31.1 25.7 5.4
1994 87.3 69.8 17.5
1995 98.5 83.9 14.6
1996 105.5 89.5 16.0
1997 109.6 90.2 19.4
1998 116.1 93.2 22.9
While household plots and Figure 2.4: Growth of Agricultural Product: Households andcollective gardens comprise mostly Enterprises
irrigated arable land, peasant farms as a 250 percent of 1980
matter of policy are established on Households
marginal virgin land. The peasant 200 .
farmers are expected to convert theirmarginal land into arable land by 150
preparing it for cultivation and pro vidingirrigation. As of October 1995, only 40% 100 -- Enterprises
of the land holdings of private farmswere classified as arable land (39 thou. 50 -
ha of the total of 98 thou. ha allocated at __,0
that time). In order to start producing 1985 1986 1987 1988 1989 1990 1991 1992 1993 1994
before their allocation of private land hasbeen fully prepared for cultivation, many farmers lease arable land from the local farm enterprise,or peasant association as it is now called. Nearly 20% of land holdings in peasant farms is unutilizedland leased from local farm enterprises (Table 2.2). Thus, despite the generous endowment of land,
Chapter 2 - Historical Background and Chronology of Legal Measures in Land Reform 19
private farmers are currently producing less than 1% of agricultural product, mainly because mostof them were established recently and are still not fully operational on their marginal land.
In contrast, the increased allocation of good land to household plots has led to a substantialincrease in their contribution to gross agricultural product. The share of households in grossagricultural product rose from around 17% in 1989-1991 to 30% in 1995, and household plots todayaccount for over 60% of the value of livestock production in Turkmenistan (their share of cropproducts remains below 10%). Household plots are reported to have provided 20% of familyincomes on average for Turkmenistan, up from 5% of incomes prior to independence. Theagricultural production of household plots in constant prices more than doubled between 1980 and1994, while the agricultural production of large-scale farm enterprises declined in recent yearsbasically to the level of 1980 (Figure 2.4). The change is in fact observed since 1990, when largefarms began distributing additional land to households for individual cultivation.
Legal Framework of Land Reform
The legal framework of land reform in Turkmenistan is provided by a long list of presidentialdecrees and laws, some dating back to the Soviet period in 1990 (Table 2.3). The changes in landrelations began in the first half of 1991, primarily with the President's letter of April 1991 instructinglocal councils and ministries to allocate additional arable land for household plots and collectivegardens from underutilized land reserves of large-scale farm enterprises. The jump in the share ofcultivated land in household plots observed between 1990 and 1991 (see Figure 2.2), and theassociated increase in agricultural production of households (see Figure 2.4), are a direct outcomeof this policy decision. The April 1991 decree established a new principle; namely that landoriginally granted to farm enterprises in perpetuity could be reallocated to other users if not utilizedefficiently. This principle has since remained an active component of the land policy.
The augmentation of household plots began before the adoption of the new Constitution ofTurkmenistan. At that time, all land was state-owned, as everywhere in the former USSR, and landtenure was governed by the traditional Soviet forms of permanent use (for farm enterprises) andinheritable lifetime possession or usufruct (for individuals). The May 1992 Constitution (article 9)recognized private ownership of land (and other means of production) by individuals. Theconstitution also allowed corporate ownership of assets, including land, and naturally retained thecategory of state ownership. Furthermore, it is unique among the constitutions of Central Asiancountries (including Kazakhstan) in that it recognizes private ownership of land. The Constitution,however, only sets general principles, and definition of ownership as well as practicalimplementation is left to laws, presidential decrees, and government resolutions. Both the 1990 LandCode, which remained in force after the adoption of the new constitution, and subsequent legislationunequivocally showed that private ownership of land did not carry with it the usual rights to transactin land: privately owned land may not be sold, given away as a gift, or exchanged.
According to the presidential decree of February 1993, published after the adoption of thenew constitution, land in subsidiary household plots and in collective gardens was transferred fromthe old form of inheritable lifetime possession to private ownership. The decree also legalized long--termn leasing of land by individuals and groups of individuals within large-scale farms: land could
20 Turkmenistan:
now be leased to farm employees for terms of 10 years and longer. In addition, the February 1993decree made the first step toward expanding individual land tenure to include an entirely newcategory of producers, the private farms. While the traditional household plots and collective gardenswere largely intended for subsistence purposes, and only a small part of their output was sold in localmarkets, the new private farms were expected to have a commercial orientation.
Table 2.3: Legislation on Land Reform and Farm Restructuring in Turkmenistan
1990 October Land Code of the Turkmen SSR amended May 1991
1991 April President's letter to local councils of People's Deputies and heads of ministries andauthorities "On augmentation of areas for household plots and collective gardens frominefficiently utilized lands"
1991 May Amendment of the Land Code
1992 May Constitution of Turkmenistan (article 9: private ownership of land)
1993 February Presidential decree "On right of ownership and use of land in Turkmenistan";Regulations on Allocation of Land Use in Private Ownership and Long-Term Leasingto Citizens of Turkmenistan
1993 May Presidential decree "On increasing economic motivation for increased production andimproved quality of agricultural products"
1993 October Law on Ownership
1994 March Presidential decree "On restructuring of kolkhozes, sovkhozes, and other agriculturalenterprises in Turkmenistan"; Law on Peasant (Daikhan) Farms
1994 May Presidential decree "On implementation of reforms in agriculture of Turkmenistan"
1995 June Presidential decree "On creation of peasant associations (daikhan birleshikleri)"; Lawon Peasant Associations
1995 September Standard regulations on peasant association
1995 December President's program "On deepening of market reforms and socio-econormicdevelopment of Turkmenistan in 1996"; Presidential decree "On additional measuresfor reforming peasant associations in 1996"
1996 January Draft Land Code
1996 December Law on Allocation of Land in Ownership to Citizens for Commercial Farming
1996 December Presidential decree "On additional measures for implementation of economic reformsin agriculture"
1997 January Presidential decree "On increasing economic incentives for production of agriculturalproducts"
1997 July Directive on normative allotment of leased land per worker varying according toproduct produced
1998 March Presidential decree "On subsidized credit to cotton and wheat producers"
1998 June Presidential decree "On exemption of peasant associations from value added tax"
1998 August Presidential decree "On some measures for acceleration of agricultural reform"
1998 August Presidential decree "On subsidized rates of mechanical field works for cotton andwheat production"
1999 January Presidential decree "On privatization of agricultural, agro-industrial, and constructionenterprises in the agro-industrial complex"
1999 February Presidential decree "On improvement of lease relations in agriculture"
Chapter 2 - Historical Background and Chronology of Legal Measures in Land Reform 21
After February 1993, citizens of Turkmenistan could apply to receive up to 50 ha of land inprivate ownership for commercial farming. This land, however, was not necessarily arable orirrigated land. The presidential decree specifically stipulated that local authorities would allocateland plots for commercial farming from reserve lands, virgin lands, and lands not used by farrnenterprises. The new farmers were thus expected to "open" virgin lands by their own efforts and withtheir own resources. This task would normally involve leveling the rough native terrain, movingaway large volumes of sand, trucking in equally large volumes of fertile soil from afar, andproviding irrigation ditches or pipes from relatively distant water sources. Yet the new farners wereobliged to start producing within two years, and would lose the land if they failed to start farmingcommercially within the stipulated period. This was probably an unrealistic stipulation, given thetremendous difficulties that individuals would face in "opening" virgin lands and providingirrigation. Nevertheless, the "opening" of virgin lands by private farmers since 1993 accounts forpart of the considerable increase in irrigated land observed during the last years. The land receivedfor private farming, although classified as privately owned, could not be sold, given as a gift, orexchanged.
Despite the physical obstacles and the marginal quality of land allocated to private farmning,individuals began to apply in increasing numbers for an independent plot of land outside thecollective framework. As of October 1995, 3237 individuals received a total of 80.3 thousand ha ofvirgin lands in private ownership, and nearly 5000 additional applications were pending. Privatefarmers managed to "open" 31 thousand ha, or nearly 40% of land that they had received. Thegrowing interest in private farming encouraged the preparation of a special law, the Law of Peasant(Daikhan) Farms, which was passed in March 1994, superceding the February 1993 Presidentialdecree.
The Concept of Private Ownership of Land in Turkmenistan
The land reform process in Turkmenistan is mainly guided by presidential decrees. The LandCode presently in effect was passed in 1990, and has been overtaken by the new reality in landrelations. Several drafts of a new Land Code have been submitted for discussion. According to thecurrent legal conception, every citizen of Turkmenistan has a right to private ownership of land.Foreign citizens may not own land, but may lease it. The concept of private ownership containedin the draft Land Code is limited in that it restricts transactions: "land is granted in privateownership in inheritable lifetime possession, without the right to sell, give as a gift, or exchange."This formulation is the same as that in the Land Code of 1990, except for the addition of the clause"private ownership."
Private ownership in the Turkmen context is thus interpreted as secure inheritable tenure.This conception is confirmed in the statement of allowable uses of privately owned land. Whenlisting the legitimate uses for which individuals may be granted land in private ownership (article57), the draft law says (emphasis supplied): "Citizens of Turkmenistan have the right to receive inprivate ownership with lifetime inheritable possession plots of land for the following purposes:commercial farming, peasant farming, free entrepreneurship, and provision of services to the-
22 Turkmenistan:
population; subsidiary household farming; individual residential and summer-home construction;gardening and vegetable growing; etc.
With regard to private farms, the draft law (article 64) reads:
Citizens of Turkmenistan who wish to establish a peasant farm for crop or livestockproduction based predominantly on personal labor and labor of other family memberswill lease land or receive land in private ownership with the right of lifetime inheritablepossession.
Rights of land owners (zemlevladel 'tsy) include the right to transfer the land plot or partthereof in temporary use to other juridical or physical bodies (article 47). Thispresumably includes leasing out land to others. Since no other rights of alienation arementioned, none are allowed by implication. Land users (zemlepol 'zovateli) do not haveany rights of transfer, even temporary.
Private ownership thus appears semantically and legally indistinguishable from traditional"lifetime inheritable possession," in terms of rights usually associated with land tenure. In theTurkmen context of highly administered agricultural markets, however, private ownership hasadditional implications for disposition of the products of land. The President has indicated (inPresidential Decree No. 2694 of 28 June, 1996) that producers working privately owned land are notsubject to state orders for delivery of cotton and wheat, while those working on leasehold are stillsubject to the orders. Other countries in transition, with the exception of Uzbekistan, haveabandoned state orders. In other countries, therefore, forms of land tenure do not carry implicationswith regard to marketing rights. In Turkmenistan, however, where approximately 90% of arable areais still subject to state orders for planting and marketing, exemption of privately owned land fromstate orders can be a meaningful economic distinction, at least in the short run. Producers withprivately owned land can sell wheat on the State Commodity Exchange and cotton to the cottonmarketing agency at negotiated prices, rather than state order prices. The exemption of privatelyowned land from state orders may also explain the reluctance of local and national officials toconvert leaseholds to private ownership until the operators of the land have achieved high productiontargets, since local authorities are still responsible for plan fulfillment according to state orders fortheir regions.
Restructuring of Traditional Large Farms
Large farm enterprises continue to dominate Turkmen agriculture, despite the growth of theindividual sector in household plots, collective gardens, and peasant farms (see Figure 2.1). Landin the large farms is owned by the state, allocated in use to the farm enterprises, and, in many cases,leased to households that comprises the farm work force.
Internal changes in the structure and organization of large farms began in the late 1 980s andearly 1990s, when Mikhail Gorbachev's model of intra-farm lease groups or lease contracts wasadopted in all parts of the Soviet Union. According to this model, a group of farm workers leasedland and equipment from the large-scale enterprise and assumed responsibility for production. Inreturn, the lease group either made a fixed lease payment or shared output with the farm enterprise.
Chapter 2 - Historical Background and Chronology of Legal Measures in Land Reform 23
The lease group (arendnyi podriad in Russian) consisted either of relatives within an extendedfamily or of workers without any blood relation employed in the same section of the farm enterprise.The intra-farm lease model did not prove particularly successful, because in a command economythe lease groups continued to depend on central farm management for input supply and productmarketing, and because their production decisions continued to be dictated by the production planof the large-scale enterprise. Yet it provided an important experiment in small-group or individualinitiative as a departure from large-scale organization and laid the foundation for later approachesto farm restructuring.
Intrafarm leasing was widely adopted in Turkmenistan and retained after independence.Organizing the large farms according to lease brigades was regarded as an instrument to distributeincome within the farm and to motivate workers. Measures announced in May 1993, for instance,limited the share of total value of production of lease groups that could be withheld by the collectivefarm in lieu of lease payments and as a contribution to general expenses of the community (35% ofcotton value, 50% of grain, 50% of grapes, and 20%-25% of fruits, vegetables, and potatoes). Therest was to be used to cover production costs and pay group members for their work. The value ofthe lease contract from which these amounts were withheld was to be based on average yieldsachieved during the previous 3 years in the corresponding section of the collective enterprise beforeit was leased by the group. All production in excess of the contractual obligation remained theproperty of the lease group. The lease group, however, was obliged to sell all its cotton and grain tothe state, and only fruits, vegetables, and melons could be sold on local markets.
A more radical attempt to restructure the large-scale farms beyond intra-farrn leasingarrangements was announced in March 1994 in Presidential Decree No. 1729 "On Restructuring ofKolkhoz, Sovkhoz, and Other Agricultural Enterprises in Turkmenistan." Large-scale farms wereto be transformed into associations of peasant farms, shareholding societies and partnerships,cooperatives, associations, and other farm enterprises of various forms of ownership. The workerswere allowed to choose freely the preferred form of organization. Land was to be transferred inpermanent use to the newly created organizational forms, and assets were to be leased with a rightto buy. This mechanism did not allow privatization of land, nor did it go as far as distribution ofshares in land and assets to individual members. Yet it envisaged a reorganization of existing large-scale enterprises into diverse organizational forms, each exercising direct control of its resources.The decree stipulated that state orders on cotton and grain would remain in force for the neworganizations.
The implementation of the March 1994 decree was entrusted to a joint governmentalcommittee, which proposed a list of 58 farm enterprises in all the five provinces that were to berestructured in 1994. Farms chosen for the first round of restructuring were primarily the weak onesunder financial stress, plus one or two "stars" included in each province. These "stars" had beguntheir own program of internal transformation long before the publication of the decree, and they wereintended to serve as model examples for other farms in the region. The decision to start with weakfarms limited the success of the program. Experience in other countries shows that weak farms arerelatively poor candidates for restructuring, since their assets are often of poor quality and prospectsof financial success even under better organization are often dim. No data are available on the.
24 Turkmenistan:
results achieved with the March 1994 programn. Informal discussions suggest that the program neverreally got off the ground for a variety of reasons.
The government announced a new farm transformation program in June 1995. The newprogram was encapsulated in a very short, two-paragraph presidential decree of June 15, 1995 which(a) abolished the existing large-scale farms (kolkhozes, sovkhozes, and interfarm enterprises) andcreated in their place peasant associations ("daikhan birleshik" in the Turkmen language);(b) transferred the use and management of land and assets from the existing farms to the newassociations. The decree was followed by the Law of Peasant Associations (June 15, 1995) withimplementation regulations (Sept. 15, 1995). The conversion of enterprises to new associations bystroke of the pen implies that the change was one largely of name. Yet the law and the regulationscontain measures intended to move the agricultural sector toward more meaningful and deeperrestructuring.
According to the law, a peasant association takes possession of all land and assets previouslyused by the large-scale farm from which the association is created. The assets are transferred withoutpayment to the ownership of the peasant association, while land remains state property and is givento the association in use. The term for which land is given in use is not specified: neither the law northe regulations say that land is given in "permanent use," as was the traditional practice in the pastfor collective and state farms. According to the State Land Committee, the government hasflexibility to take land away from associations if they misuse the land or do not produce withexpected efficiency.
The peasant association may create a variety of autonomous internal organizational forms,including lease groups, peasant farms, subdivisions, livestock units, and other formations, all ofwhich should operate on profit principles. The association may also establish profit-orientedagroservice operations. The process of reorganization is not limited in time, and apparently may takeplace at any point. In the process of reorganization, the ownership of non-land assets may betransferred from the association to the newly created subunits. Alternatively, the subunits may leasethe assets from the association, as was the former practice. Land, however, cannot be assigned andcan only be leased to the subdivisions. The draft Land Code provides the legal framework for leasingof land by the association to its subdivisions. The draft Land Code states (article 13) that "landowners and land users, regardless of the form of ownership, may give land in use to workers andcollectives in the form of intra-farm lease contracts." This provision is essential to enable allocationof land to autonomous intra-farm subdivisions, because the original 1991 Law on Leasing stipulatesthat an asset can be leased out only by its owner, which in case of land in large enterprises is still thestate.
The association is given rights to manage the entire land area of the former farm enterprise(less unutilized tracts), and is responsible for subleasing. This provision is not commonly foundelsewhere in the world, but it is reminiscent of the practice in Israel, where state land is leased inlarge tracts to the village association (the moshav), which then subleases it to the members. It shouldbe noted, however, that the Israeli practice has increasingly come under attack in recent years, andit will ultimately be changed to allow direct leasing of land by producers from the state. InTurkmenistan, the association is responsible for assurance that land resources are used as designated
Chapter 2 - Historical Background and Chronology of Legal Measures in Land Reform 25
(i.e., for farming), and it is fully accountable for damage caused by inefficient use of land,environmental pollution, and other violations.
Membership in the peasant associations is by law to be completely voluntary. Members havea right of free exit, and they may leave with their personal property and the household plot.However, they do not get a share of the association assets, as these are not divided among themembers. Nor would a person leaving the association get a share of the association land, althoughnon-members can apply to lease land if any is available. A member who exits would be more likelyto apply for a plot of land in virgin areas and other unutilized reserves.
The Law of Peasant Associations creates a framework within which the new organizationscan undergo significant internal restructuring. Households or small groups could achieve a largemeasure of autonomy within this context if the associations became autonomous and less controlledby procurement directives. The associations remained subject to state orders, however, both at thetime of passage of the law in 1995 and at present. Moreover, associations, rather than theirmembers, are responsible for fulfillment of the orders. Thus, although the 1995 law createdpossibilities for change, the economic and administrative environment in which the associationswere created did not encourage change, and little actual restructuring followed passage of the lawin 1995 and throughout most of 1996.
The emphasis on expanding intra-farm lease arrangements is reflected in the President'sprogram on deepening of market reforms and socio-economic development of Turkmenistan in 1996(announced in the President's New Year speech on Dec. 27, 1995) and in the presidential decree "OnAdditional Measures for Reforming Peasant Associations in 1996" based on this program. The draftdecree instructs the Ministry of Agriculture and the local authorities to speed up agricultural reformsby basing in 1996 all intra-farm production relations on contracts with autonomous subdivisions andfamilies. The land and assets of peasant associations are to be assigned on long-term leases for notless than 10 years, a time period intended to ensure sufficient security of tenure. Ten years has beenfound in other parts of the world to be an insufficient period of time to stimulate investment in landor perennial plants. Thus, although ten years is a longer period of leasehold than was permitted inTurkmenistan in the past, the economic impact of leasing for that period of time may not besignificant. Moreover, in practice, the size of holdings leased for the ten year period has beenreported to be adjusted in response to the household's success in managing the land. Some of thearea leased in relatively large holdings of ten hectares or more to households producing wheat hasbeen reallocated where families were perceived to lack sufficient labor to manage the holdingsuccessfully. The reallocation in 1997 and 1998 raises questions as to the security of tenure evenon a ten-year leasehold.
Under terms of the 1996 program, growers of vegetables, melons, fruits, and grapes paidfixed lease payments (in cash or in kind) per unit land area and were allowed to sell their output atfree market prices. Cotton, grain, milk, and meat remained subject to state orders. State orders formeat and milk were removed later in 1996.
The expansion of leasing in early 1996 was followed by additional changes in the programlater in that year. In December 1996, the Law on Allocation of Land in Ownership to Citizens for
26 Turkmenistan:
Commercial Farming (December 20, 1996), stipulated that members of peasant associations areentitled to receive land in private ownership for commercial farming. The December 1996announcements came after the very poor harvests of wheat and cotton during that year, andrepresented the most significant change in policy regarding land tenure and farm structure of theentire decade. According to the law, leased land can be converted to private ownership certified byofficial documents after a 2-year probationary period. During the two-year period, the householdcultivates under leasehold, and must demonstrate good performance. The presidential decreeattached to the law directs the peasant associations to start distributing land to member families on2-year leases preparatory to its transfer into private ownership, and establishes supervisory organson different levels that are required to report on the progress of the new reform measures at 10-dayintervals. Under the December 1996 law and decree, the concept of private ownership remainedunchanged, but the scope of eligibility to become owners broadened to include virtually the entireagricultural labor force. In contrast to the earlier programs of intra-enterprise leasehold, the familyor household was designated as the primary leaseholding unit. Households that did not perform wellwere to be granted an extension of the leasehold, during which period they could continue to applyfor ownership. Leaseholders within associations were to pay 20% of the value of gross output to theassociation; 12% for common expenses and 8% for taxes.
The peasant association is expected to manage input supply, machinery, equipmentmaintenance and repairs, and other support activities, although leaseholders pay for the inputs andservices. The structure that emerges from the 1996 law and decree is not unlike the Israeli moshav,an association of individual producers supported by a village-level cooperative that provides avariety of farrn services to the members. In Israel, however, the producers are not (and have neverbeen) subject to state orders, and are allowed to make free production and marketing decisions.
As of January 1999, lease contracts had been signed with 363.4 thousand leaseholders inpeasant associations, who had been allocated 1,261.9 thousand hectare of irrigated land forcultivation. According to latest reports, a total of 145 leaseholders have been given 658 ha ofirrigated land in private ownership in Figure 2.5: Distribution of Cultivated Land Among Differentrecognition of their satisfactory performance Users (1999)
in 1997-1998. The leaseholders in peasantassociations today cultivate 74% of irrigatedland in Turkmenistan, while another 16%remains in collective cultivation (Figure 2.5). Leaseholders 7ndividual sector
Yet the large leaseholder sector still cannot beregarded as an extension of the individualsector (which controls about 10% of irrigatedland), because leaseholders continue to be Collective sector
subject to state orders and are effectivelymanaged and controlled by the peasant Total arable land 1700 thou ha
association.
Chapter 2 - Historical Background and Chronology of Legal Measures in Land Reform 27
Land Titling
Recent legislation has created three main categories of land users:
* Nearly 600,000 rural and urban residents with small household plots and gardens, totaling over120,000 ha.
* A few thousand private farmers, each with up to 50 ha of land from virgin areas or unutilizedreserves (a total of around 80,000 ha in 3500 farms as of the end of 1995).
* Some 500 peasant associations (forrner kolkhozes and sovkhozes) control 35 million ha ofland.
Land in household plots, gardens, and private farms is classified as privately owned in thesense of the 1992 constitution. As such, more than half a million landowners are entitled to receivean official document confirming title to this land. Before the title document is issued, the specificland plot has to be surveyed, mapped, and officially registered. The surveying and registrationprocess is handled by provincial and district arms of the State Land Committee, which also issue asimple certificate of title. The certificate shows schematically the location of the land plot in relationto the adjoining territory and an outline of the borders and dimensions. The certificate is signed bythe head of the district land management and surveying department, which also keeps track of theindividual titles.
The wording of the certificate highlights the inherent ambiguity toward private ownershipof land in the Turkmen legislation. The certificate confirms "private ownership of land ... with a rightof lifetime inheritable possession". This formula is a mixture of two forms of property rights, whichare usually kept as distinct categories in successor Soviet legislation. Legislation in Russia andUkraine, following the Soviet Civil Code, distinguishes between private ownership (sobstvennost )and lifetime inheritable possession (vladenie). The actual rights of landowners in Turkmenistan aresimilar to those of holders of land in lifetime inheritable possession according to the Soviet CivilCode. Turkmen legislation does not distinguish between these two forms of tenure, and in a uniquemanner combines them into a single category.
Land allocated to private farmers receives a more formal title document (a state "akt"), whichis issued by the State Land Committee and registered in the Registry of State Titles to Right ofPossession and Right of Use of Land. The landowner receives one copy of the title document, andthe other copy is filed at the district level. The title document includes a fairly detailed two-pagemap, drawn to scale and certified by the district land committee, and also space for listing outsideowners and future changes in ownership and use. The preprinted part of the title document does notuse the term "private ownership" (sobstvennost') at all: it only uses the terms "permanentpossession" (postoiannoe vladenie) and "use" (pol'zovanie). The filled-in handwritten part usuallycontains the same formulation as the certificate for household plots: "The land is given in privateownership in lifetime inheritable possession." The front page of the title document contains someexcerpts from the 1990 Land Code (Table 2.4).
Peasant associations created on the basis of former collective and state farms are to receivenew title documents from the State Land Committee conferring use rights to their land. These use
28 Turkmenistan:
rights are not indefinite, contrary to the traditional use rights of former collective and state farms.The State Land Committee is conducting a full-scale survey of association lands in order to identifyutilized and unutilized land, a process that is expected to take up to four years. The unutilized landwill be extracted into the state reserve for redistribution, and the peasant associations will only retainthe use of the remaining land. The official opinion is that this procedure will be simplified by the factthat the use rights of peasant associations under the new law are no longer permanent.
Table 2.4: Excerpts from 1990 Land Code Printed in Title Document
Land is the property of the peoples residing on the territory of Turkmenistan, and is owned by Turkmenistan.
Every citizen of Turkmenistan has a right to a plot of land.
Landowners and land users are responsible for efficient use of land in accordance with its designated purpose, forincreasing its fertility, for applying nature-conserving production technologies, for preventing exhaustion ofnatural resources and deterioration of the environment in the region as a result of their activity.
Ownership and use of land in Turkmenistan requires payment.
Source: 1990 Land Code
The State Land Committee faces an important task, as land titling is essential in a marketeconomy. The four-year overall land survey project is a relatively standard job for the LandCommittee with its various institutes. Titling of hundreds of thousands of individual landholders issomething entirely new for the system, but it seems to be progressing without undue delays. Underthe system as it is designed today, title documents and the registry are kept at the district level, whichis probably entirely sufficient at the present stage. It is desirable to develop a standard title documentfor all plots, instead of two different documents in use today (one for household plots and one forpeasant farms). Even if this is not done, the household plot certificate preferably should also includea page for listing ownership changes, like the peasant farm "akt." In the future, a central registry willhave to be developed to pool and duplicate the data stored on the district level, without eliminatingthe district systems. Creation of a central registry will allow transactions to be initiated and handledfrom a location outside the specific district center where the records are kept, an importantconsideration in a country with a geographically dispersed population.
3. The Peasant Association: Managers' Perspective
The chapters that follow report on the findings of a farm survey carried out in the autumn of1998. At that time, a large number of members of peasant associations had been working underleasehold contracts for almost two years. They had received their leased allotments under theprogram announced in December 1996, and implemented in early 1997. They were thereforedrawing to the close of the first two-year probationary period, at which point the land reformcommissions would have make a determination as to whether or not to convert their tenure to privateownership. The criteria for conversion of tenure were never clearly developed, and the processtherefore entailed a high degree of ambiguity. One of the objectives of the survey was to developan empirical understanding of what the 1996 program meant in practice to those working underleasehold, and what their expectations were with regard to land tenure. The findings of the surveyare presented in two separate chapters, bringing out the view of the changes in peasant associationsfrom the perspective of the association managers and the leaseholders' perspective.
Of the 42 peasant associations participating in the survey, 71% were originally collectivefarms (kolkhozes) and 26% were state farms (sovkhozes). Only one-third of managers report thattheir farm enterprise has an officially approved reorganization document or order (Proektreformirovaniya), yet all are now considered to be peasant associations. The transformation ofcollective and state farns into associations most probably proceeded in response to the Presidentialdecree of June 1995 and the President's program on deepening of market reforms and socio-economic development in 1996 (see Chapter 2).
Land and Labor in Peasant Associations
The mean size of peasant associations in the sample is 58,000 hectares, of which 3,300hectares, or less than 6%, represents irrigated land (3,200 hectare of arable land and 100 hectare oforchards and vineyards). The remaining 54,700 hectares are desert pastures.
The total population of the average peasant association is about 6,000 people, of which 2,000are permanent workers (now mainly cotton/wheat leaseholders and their families) and 500 arepensioners. The remaining 3,500 people are mainly children, as well as some individuals who workoutside the association (in governent o r services).
Households control two-thirds of the irrigated land in the average peasant association (Figure3.1): 8% of the land is in traditional small household plots and 58% is cultivated by householdsunder the new leaseholding arrangements. Yet individual cultivation is not the only form ofproduction in peasant associations. About 18% of irrigated land is allocated to collective leaseholdgroups and 7% is retained in collective cultivation by various subdivisions in the association. Theremaining 9% is characterized as land of poor quality unsuitable for farming; it also remains undercollective control.
29
30 Turkmenistan:
Land is not the only object of Figure 3.1: Allocation of Irrigated Land to Differentleasing. Much of the livestock is also Users in Peasant Associationsleased by the association tohouseholds and small collective
Individual leasegroups. Table 3.1 shows the 58%
proportion of livestock leased out bythe association to its members. Three-quarters of the poultry and half thecattle and sheep are now inhouseholds. Household plots
8%
Leasing of assets, althoughallowed, is not widely practiced. Theassociation either transfers the assets Collectiv8elease uses
to state agencies, as prescribed by law(see below), or retains them in jointuse, presumably serving all leaseholders centrally. Although 70% of associations report some leasingout of assets, this activity covers only 7% of the balance sheet value of fixed property. The mainobjects of leasing are livestock and poultry buildings, as well as farm machinery and otherequipment.
Table 3.1. Proportion of Livestock Leased Out by the Association to Households
Percent of entire herd
Cattle 52
Sheep and goats 52
Poultry 77
Camels 60
Pigs 25
Leasing Terms and Rights of Leaseholders
On average, about 700 lease contracts are signed per peasant association. Of these, 98% areindividual contracts with families, and only 2% are collective lease contracts with representativesof groups of families. Since individual leaseholders account for 58% of irrigated land and collectiveleaseholders for 18% of irrigated land, collective leases are much larger than individual. A roughestimate for all peasant associations in the sample indicates that the average collective lease contractis written for 3 5 hectare of irrigated land, whereas the average individual contract is for less than 3hectare. There are significant differences in leasehold sizes across velayats depending on availabilityof land: the average leasehold decreases from 6.7 ha in Akhal, to 4.1 ha in Mary, and 3.6 ha Lebap.Most leaseholders receive their land in one parcel, and only 6% of managers report allocating twoparcels per leaseholder. Leaseholders with two parcels, however, get a substantially larger amountof land than the rest: 6.5 hectare compared with 4.5 hectare.
Chapter 3 - The Peasant Association: Managers'Perspective 31
Lease contracts are linked to production targets and generally prescribe narrow ranges ofcrop production (Table 3.2). Managers report that 70% of individual leaseholds in peasantassociations are for cotton and 20% for wheat. Among collective leaseholders, the distribution ofcotton and wheat contracts is much more even (one-third in each category). Livestock productionis exclusively practiced by collective leaseholders, 27% of whom report livestock leasing, comparedwith only 2% among individual leaseholders. Vegetables and other "unregulated" crops are grownby 6% of both individual and collective leaseholders.
Leaseholds are assigned to families (69% of associations), individuals (60% of associations),or groups of families (38% of associations). In 20% of associations, land is leased out to wholebrigades. The practice is mixed in all associations, with no clear preference for a particular groupof leaseholders. Based on managers' responses, half of lease contracts are signed by men and halfby women. The leasing program thus emerges from this survey as gender-neutral. Opportunities forwomen to lease land could have a very positive impact on the distribution of land ownership bygender when leaseholds are converted to private ownership, as provided for in the 1996 Presidentialdecree.
Table 3.2: Specialization Profile of Individual and Collective Leaseholders (percent of respondents)
Livestock 2 27Other 6 6Average number of leaseholders per association 690 16
The basic leasing decisions were made by a special internal committee of the association,generally without involving the local authorities or the management. In two-thirds of associationsland was allocated to each household depending on the number of adults of working age. In about20% of associations land was allocated based on the request of each household. The actualdistribution of land plots to leaseholders was generally decided by the same internal committee (70%of associations), although in about 30% of associations land plots were apparently distributed bylottery.
The lease term is typically 10 years (43% of associations) or longer (38%). Only 20% ofassociation managers report lease terms shorter than 10 years. All leaseholders have an official leasecontract, which always specifies the lease term and the rights and obligations of the leaseholder andthe association. In around 80% of associations the lease contract contains a sketch of the plotshowing its area and side lengths, or an outline of plot boundaries. Association managers report thatthe lease contract is usually signed with a representative of the family (80% of associations), but inabout 20% of associations each adult family member signs the contract.
Some cancellations of lease contracts are reported in more than 50% of peasant associations.The average number of canceled contracts is around 30 per association (or 4% of the total numberof leaseholders), most of them canceled at the initiative of the leaseholders, not the management. The
32 Turkmenistan:
exact reasons for cancellation are not clearly specified, but lack of profitability is definitely not oneof them. In those few cases when lease contracts were canceled by management (less than 20% ofcancellations), the main reason was the leaseholders' failure to meet the contractual productiontargets.
Table 3.3. Evaluation of Leaseholder Performance by Association Managers: What Percentage ofLeaseholders Will Get Their Leasehold in Private Ownership Within the Next Two Years?
Proportion of leaseholders entitled to receive land Percent of associationsin private ownership
Nobody 8
Less than 10% of leaseholders 25
From 10% to 25% of leaseholders 24
From 25% to 50% of leaseholders 33
More than 50% of leaseholders 5
Everybody 5
Nearly 90% of association managers are aware that the leaseholders have the right to receivetheir leasehold in private ownership after two years of successful performance. The managers donot give a very favorable evaluation of their leaseholders' performance: only 10% of managers reportthat more than half the leaseholders will be entitled to get their land in private ownership in the year2000 (Table 3.3). Despite the unfavorable prospects of leaseholders to receive their land in privateownership, managers overwhelmingly support the option in principle (over 90% of managers).
Impact of Reform
Two-thirds of association Figure 3.2: Change in Labor Force by Activity: 1995-managers indicate that the financial 1998
situation has improved as a result ofreorganization and the production Total workers l
volume has increased with the i..
transition to leasing arrangements. The Administrative L.work discipline also has improved in Social services F lvirtually all farms (80% ofrespondents). Improved performance is Livestock
probably due to the stronger individual Crops
incentives under the new contractualarrangements, as the conditions for Non-agrcultural
input supply and financing are reported -40 -30 -20 -10 0 10 20
not to have improved. Thus, about half percentage change
the managers indicate that theconditions for purchasing farm inputs and for raising credit have substantially deteriorated under thenew arrangements (Table 3.4). Only the conditions for marketing farm products have improved(85% of respondents).
Chapter 3 - The Peasant Association: Managers' Perspective 33
The reorganization has affected the employment in peasant associations. While the totalnumber of employed changed little, the mix of workers shifted across specializations. Theadministrative staff decreased in all associations with the transition to leasing arrangements. Thenumber of livestock workers also decreased universally, largely due to the reduction in organizedherds. The emphasis on cotton and wheat resulted in an increase of crop workers in 50% of theassociations (Table 3.4). On average, the administrative staff declined from 53 people to 34 peopleafter the creation of associations (35% down), livestock workers declined from 118 to 99 (17%down), and crop workers increased slightly from 874 to 914 (an increase of 5% "before" and"after"). The relative importance of non-agricultural production activities also increasedsignificantly, from 700 to 810 workers (an increase of more than 15%). The changes in employmentare illustrated in Figure 3.2. These shifts in labor specialization do not necessarily imply thatworkers are employed full-time in the reported activities.
Practically all managers (90%) believe that the best way to increase the profitability and wellbeing of leaseholders is by allowing them to sell their products at free,market prices, withoutgovernment-imposed constraints. Other factors, such as improvement of farm services or betterirrigation, are judged to be of marginal relevance.
Table 3.4. Impact of Reform on Various Operating Dimensions of Peasant Associations(% of all respondents)
Farm performance Increased Decreased Unchanged
Financial situation of association 62 26 12
Production volume 67 21 12
Labor Increased | Decreased | Unchanged
Work discipline 81 10 9
Administrative staff 0 100 0
Livestock workers 2 95 2
Crop workers 50 43 7
Environment Better Worse Unchanged
Sale of farm products 83 2 14
Purchase of farm inputs 29 48 24
Access to credit 21 55 24
The leaseholders today enjoy greater independence than in the past, when they were salariedworkers on collective farms (Table 3.4). Yet this independence is only partial and is still severelycurtailed by the association management and local authorities. Thus, only 50% of managers reportthat leaseholders have independence in planning and managing their own production or in hiring andfiring their workers. Even a smaller proportion of association managers indicate that leaseholdershave independence in selling their products and buying farm inputs. The most significant attributesof the new status include the ability to have a personal bank account (over 80% of respondents) andto negotiate credit (60% of respondents).
The limited independence of leaseholders is complemented by major responsibility that the-association retains for crucial aspects of farm operation, such as assisting leaseholders in organizing
34 Turkmenistan:
production, providing professional services, managing product sales for leaseholders, providing farmservices and farm inputs to leaseholders, and even managing relations with banks and other financialinstitutions on behalf of leaseholders (Table 3.5). In addition to these leasehold-level fumctions, theassociation also acts as the representative of the state procurement authorities and the enforcingagency: it allocates cotton and grain targets to leaseholders and monitors the contractual obligationsof the leaseholders. Finally, the association has retained the traditional responsibilities for publicservices, such as maintaining and developing the social infrastructure in the village, implementingsoil amelioration programs and opening of new lands for cultivation, planting orchards, and alsoenforcing law and order in the village (Table 3.5).
Table 3.5. Functions of Association Management (percent of managers)
Leasehold-level functions
Assist leaseholders with organizing production 93
Provide management services to leaseholders 86
Manage product sales for leaseholders 67
Manage relations with banks and financial institutions for leaseholders 57
Provide farm services to leaseholders 45
Provide farm inputs to leaseholders 36
Central enforcementfunctions
Coordinate the production activity of leaseholders 93
Allocate cotton and grain state orders to leaseholders 88
Monitor the contractual obligations of leaseholders 86
Public services
Maintain law and order in the village 83
Maintain and develop the social infrastructure in the village 71
Plant orchards 67
Implement soil amelioration programs and opening of new lands 62
Manage processing and other industries in the village 7
Table 3.6. Farm Services Provided by Associations to Leaseholders (percent of association managers)
Transport for farn needs 76
Sale of farm products 64
Farm machinery for cultivation 62
Consulting services 62
Veterinary services 55
Land for cutting hay and grazing animals 41
Purchase fuel 26
Purchase other farm inputs 12
Provide credit 2
Chapter 3 - The Peasant Association: Managers' Perspective 35
As part of the new leasehold arrangements, associations continue the tradition of providinga wide range of farm support services to households. The most common forms of assistance includetransportation, marketing of farm products, and provision of farm machinery from the common pool.Consulting and veterinary services, as well as purchase of fuel and other farm inputs for leaseholdersare also reported by a substantial number of association of managers (Table 3.6). Only 14% ofmanagers in the sample did not provide any farm services to their leaseholders.
Transfer of Assets
Government regulations relating to reorganization of peasant associations prescribed transferof assets to various newly created state agencies. Ownership of livestock was to be transferred toTurkmenmallary livestock-management organization, ownership of farmn machinery to Obakhyzmatagroservice organization, and the social infrastructure to district authorities.
Of the livestock, only sheep and goats have been transferred in significant numbers to theownership of Turkmenmallary (Table 3.7). Thus, 42% of association managers report that theirsheep herds have been transferred; yet 57% report that no transfer has taken place yet. The transferof cattle is in a very rudimentary stage: 90% of association managers report that their cattle has notbeen transferred to Turkmenmallary, perhaps because the original Turkmernmallary charter focusedon sheep only.
The transfer of farm machinery and mechanical workshops from peasant associations toObakhyzmat is very advanced (Table 3.7). Similarly, more than 50% of peasant associations reportthat they have transferred the social infrastructure to the district government. About one-quarter ofpeasant associations have shed the responsibility for irrigation and drainage networks. Mostmanagers indicate that they are planning to complete the transfer of productive and social assets togovernment agencies in the near future. Contrary to other FSU countries, few managers report thatthe transfer is delayed by the inability or unwillingness of the respective agencies to take possessionof the earmarked assets.
Table 3.7. Transfer of Productive Assets and Social Infrastructure to Government Agencies (% of managers)
Productive assets Social infrastructure
Sheep and goats 42 Kindergartens, schools, clinics 57
Overall, peasant associations shed direct responsibility for half their assets (by balance sheetvalue). About 40% of assets were transferred to state agencies and 7% was leased out. Only 1% ofassets in this sample was privatized. The remaining 50% of assets continue to be operated by theassociation for a variety of joint uses and direct services to leaseholders.
36 Turkmenistan:
Because associations have retained control of half the original pool of assets, over 40% ofmanagers report that they carry out at least some mechanical field works using their own machinery.Yet Obakhyzmat agroservices are an established force in the Turkmen village, as virtually allmanagers report using their machinery services.
Irrigation
Two-thirds of managers are satisfied with water delivery in terms of both timing and quantityreceived. There is apparently no accurate metering of water flow to farms, as only 14 of the 42managers reported their annual water usage (8.5 million cu.m, or 2,150 cu.m per hectare). Water useis free, but a very small number of managers (8 out of 42 respondents) report some service-relatedpayments to the state water management agency. The irrigation equipment is owned by the peasantassociation (67% of respondents) and by the local branches of the state water management agency(50%). The actual day-to-day tasks of irrigation are mainly undertaken by the association (83%), andthe water management agency is involved in these tasks only according to 24% of managers.Leaseholders own the irrigation equipment and are responsible for irrigation tasks only in 2% ofassociations.
Production
The peasant associations are mainly Fig. 3.3. Cropping Pattern of Peasant Associationswheat and cotton producers. Over 80% ofland is under these crops (Figure 3.3), andthe average association produces about 1,500 Wheatton of wheat and 1,500 ton of cotton. Wheathas overtaken cotton as the main crop bysown area (the cropping pattern observed inthe sample is consistent with national data).Fruits, grapes, vegetables and melons are -Othergrown in most associations, but they occupy 6%a relatively small area and their harvest istypically less than a hundred ton (Table 3.8). Grass, feed crops
These products are mainly in the domain of 37%n
household production.
The associations in the sample achieved very low yields for the two main crops -- both cottonand wheat yielded 1.3-1.4 ton per hectare. This is consistent with the national averages in 1997, butis substantially lower than the past record of 1991-1995, when wheat yields were around 2 ton perhectare and cotton yields around 2.3 ton per hectare. As noted in Chapter 4, individual leaseholdersreport higher yields at approximately the national average.
All associations are diversified crop and livestock producers. However, livestock productionaccounts for only 14% of sales revenue. Practically all associations keep sheep and cattle (7,000 headof sheep and 600 head of cattle per association on average). Pigs, poultry, and camels are marginal-in the sample. The livestock herd declined considerably over the three years between 1995 and 1997
Chapter 3 - The Peasant Association: Managers' Perspective 37
(Table 3.9). The cattle are still mostly owned by the associations, whereas about 40% of sheep andgoats have been transferred to the ownership of Turkmenmallary.
Table 3.8. Crop Production and Yields in Peasant Associations
Percent of producers Median harvest per Yield, ton/hain sample producer farm, ton
Wheat 100 1,400 1.4
Cotton 86 1,400 1.3
Grasses and hay 83 900 7.8
Silage corn 60 500 12.4
Vegetables and melons 90 90 7.7
Grapes 71 30 4.4
Fruits 76 15 1.2
Table 3.9. Change in Livestock Herd: 1995-1997
Number of Number of animals Percentage changeassociations 1995-1997
1995 1997
Sheep and goats 41 8,700 6,600 -25
Cattle 40 940 610 -35
Pigs 25 350 80 -80
Camels 30 240 170 -30
Poultry 27 2,600 730 -70
State Orders
State orders for wheat and cotton Fig. 3.4. Ratio of Actual Performance to Plan:are allocated to leaseholders by the Wheat and Cottonassociation manager, who continues tomonitor and enforce the production 2 Actual/Plan
contracts (see Table 3.5 above).
The average state order in 1998was 2,600 ton for wheat and 3,400 ton for Actual=Plan
cotton. There was significant shortfall inactual production, with yields of about Wheat ,, 333
1,600 ton per association for both crops. 05 333
On average, cotton production was about 3 3 3
50% below target, and wheat production ° a 20 40 60 80 100
about 40% below. If we assume that farms ranked by performance (percent)
peasant associations allocated to wheat and cotton the physical areas prescribed by plan (about 1,100.hectare per association for each crop), this essentially means that the actual yields were about one-
38 Turkmenistan:
half of the target yields used for the preparation of the production plan. According to the aggregatefigures at the national level, however, the wheat production target was met at 1.2 million tons. Thesample data as reported by the managers thus suggest high dispersion of performance in the wheatsector.
Figure 3.4 shows the ratio of the actual harvest of wheat and cotton to the state targets asreported by managers in the sample. The region below the horizontal line at level I corresponds tounder-fulfillment of targets, whereas the region above I corresponds to farms that exceeded thetarget. Virtually all the cotton growers failed to meet the target, and 60% of the farms produced lessthan half the cotton plan. The wheat growers showed a somewhat better performance: 40% of farmsachieved the target or exceeded it, and only 30% of farms produced less than half the wheat plan.
The main reason given for failure to meet the production targets was insufficiency of farmmachinery and capital (75% of association managers). It was closely followed by the argument thatthe low state prices for these commodities deprived the producers of the incentives required to meetthe targets (50% of managers).
Marketing and Supply Channels
As production shifted from the collective farm to individual leaseholders, the associationlargely lost its traditional role as marketer of farm products. Although 67% of association managersreport that they still have a role in product sales (see Table 3.5), an analysis of the sales pattern foreach commodity produced in the association reveals a very prominent role for direct sales byleaseholders and a reduced role for sales through the association. Thus, wheat and cotton are solddirectly by the leaseholders in 80% of associations. This is understandable, because leaseholdershave direct contracts with state procurement agencies for these state-controlled commodities. Buteven "unregulated" products, such as grapes, fruits, and vegetables are directly marketed byleaseholders in half the associations.
Table 3.10. Sales of Farm Products by Leaseholders and by the Peasant Association(percent of associations producing respective commodities)
Commodity Sold by leaseholders I Sold by association
Wheat 79 17
Cotton 75 19
Grapes 50 40
Fruits 47 38
Vegetables 42 37
The role of the peasant association as a supplier of inputs, while still quite prominent, is alsoreduced compared to the role of the collective farm in the past (Table 3.11). The main beneficiariesof farm supply services are the leaseholders, although household plots are also served, especially byprovision of farm machinery for cultivation, veterinary services, young livestock, animal feed andeven construction work. Provision of services outside the association is minimal, and is basicallyrestricted to construction, farm machinery rental, and veterinary services to private farmers.
Chapter 3 - The Peasant Association: Managers' Perspective 39
The peasant associations obtain farm inputs mainly from state sources. Private commercialfirms still play a marginal role, mainly as a source of spare parts and construction materials (reportedby 19% and 14% of associations, respectively). Own production is an important source of feed andyoung animals (70%-80% of associations). Veterinary and construction services are also oftensourced on-farm (12% of associations). About 40% of association managers report that they haveno difficulties with purchase of farm inputs, and another 40% complain of high prices as the maindifficulty. Difficulties with availability of inputs are reported only by 15% of managers.
Table 3.11. Peasant Associations Acting as Suppliers of Farm Inputs and Services
Percent of associations Percent of associations providing respective input tothat provide the input Leaseholders Household plots Private farmers
Seeds, seedlings 83 97 17 0
Animal feed 62 96 31 0
Young animals 52 91 41 0
Fertilizers 79 97 3 0
Herbicides 50 100 5 0
Machinery, equipment 69 100 10 0
Repair services 60 100 4 0
Spare parts 52 100 5 0
Fuel 69 100 4 0
Mechanized field work 86 97 39 6
Veterinary services 62 81 42 4
Construction services 19 63 50 13
Farm Finances
The peasant associations hoveraround breakeent insociatheirprod ion Fig. 3.5. Costs and Profit in Peasant Associations
around breakeven in their productionactivities, but administrative expenses,the burden of social infrastructure, and I_taxes push them into losses. Total Production costs
revenue slightly exceeds production costs(2.6 billion manat revenue and 2.5 billion Operating costs lmanat production costs per association).After operating costs and taxes, however, Taxes
associations report an average loss of 0.4 E J I
billion, or 16% of revenue (Figure 3.5).Of the 42 associations in the sample, Profit [lonly 9 reported accounting profits in o0 o -1
20-10 0 10 20 30 40 50 60 70 80 90 1001997, and 33 associations reported percent of revenue
losses. The profitable associations had profit margins that ranged between 4% and 25% of revenue,whereas most of the unprofitable associations had losses ranging up to 50% of revenue (Figure 3.6).
40 Turkmenistan:
Over 85% of the association's revenue derive from sale of farn products. Payments fromleaseholders for various services and contributions to administration and the social sphere average12% of revenue. The structure of costs and expenses is shown in Table 3.12. Although operatingexpenses and the cost of maintaining the social infrastructure are relatively modest, at less than 10%of total costs, they are large enough to Fig. 3.6. Margin of Profit on Saleswipe out the gross profit from farmproduction and to push the associationsinto losses. Issthan-500
While the actual production hasshifted from the association to between -50% and -20%
leaseholders and the actual flow ofpayments is now directly between between 0% and -20%
Daikhan Bank and leaseholders,bypassing the association, survey results greater than 00
imply that all production accounts - bothcosts and revenues - are still reflected in percent 0o associations
the association's financial statement. Payments to leaseholders for labor, i.e., de facto wages thatleaseholders receive directly from Daikhan Bank, are also reported among the expenses of theassociation, accounting for 55% of total costs.
The average association has 950 million manat in outstanding debt, most of it to stateagencies for supplies and to the government in taxes (Table 3.13). The debt burden is thusequivalent to 4 months of sales revenue. This is a fairly light debt burden in itself, but the actualsituation is even better: accounts receivable (i.e., moneys owing to associations) average 400 millionmanat (of which 130 million manat are due from leaseholders and 250 million manat from stateprocurement agencies). The net obligations are thus reduced to 550 million manat. This level ofobligations can be discharged with as little as 2.5 months of sales revenue.
Table 3.12. Structure of Production Costs and Operating Expenses in Peasant Associations
|Percent of total costs Percent of production costs
Total costs (3,028 million manat) 100%Production costs 84% 100%Labor (including leaseholders) 55%Fertilizers and chemicals 8%Seeds 4%Feed 5%Fuel 7%Farm services from outside suppliers 11%Water 0%Other production costs 10%Administrative costs 3%Social services and infrastructure 3%Other operating expenses 4%Taxes 6%
Chapter 3 - The Peasant Association: Managers' Perspective 41
Table 3.13. Structure of Outstanding Debt in Peasant Associations
Total debt 952 million manat
State agencies for supplies 51%
Tax arrears 10%
Banks 9%
Other creditors 30%
Total receivables 402 million manat
Net obligations 550 million manat
Respondents failed to provide any information on their borrowing in 1997-1998, presumably
because of the very limited access to the banking system and the shift to direct financing of
leaseholders, rather than associations, by the Daikhan Bank. The reorganization procedures did not
provide specific instructions for debt restructuring or rescheduling. Nearly 70% of associationmanagers report that the outstanding debt was left "as is" in the process of reorganization, i.e.,remained the responsibility of the association. Less than 15% indicated that the responsibility for
debt was transferred to leaseholders and 5% reported that their debt was written off.
The peasant association is practically not involved in supplying working-capital credit toleaseholders. Nearly 90% of the managers report that leaseholders receive credit directly through
Daikhan Bank or the procurement organizations (76% from the Daikhan Bank and 12% through
marketers). Only about 10% of associations are still active in extending credit to leaseholders, but
even these mostly in conjunction with Daikhan Bank, and not as t he sole source of financing.
Despite the generally unprofitable situation, lack of internally generated funds, and
inadequate access to the banks, managers have fairly ambitious investment plans for the next two-three years. Thus, over 80% of managers report that they have plans to purchase machinery, 70%
have plans to plant new orchards and vineyards, and between 50% and 60% intend to buy processing
equipment, erect new farm buildings, or even purchase livestock (contrary to the overall decline in
livestock in past years). Fig. 3.7. Managers' Expectations for the Future
Again, despite the lackluster
financial performance, the managers are
quite optimistic about the future Better_________
(Figure 3.7). Almost 70% of managers <m.z expect the financial situation of theirassociation to improve next year, and Unchanged I
only 5% indicate that the financialsituation will probably deteriorate. The Worse
degree of uncertainty is of course quite a
high, and nearly 20% of respondents Undecided l
find it hard to predict what the future =- I-l_ I1 I will bring. 0 10 20 30 40 50 60 70 80
percent of association managers
42 Turkmenistan:
Social Sphere and Standard of Living
Provision of social services by the association to leaseholders appears to be fairly restricted.The most common service is transport, reported by three-quarters of association managers (Table3.14). This result is consistent with observations in other former Soviet republics, where to this day
the former collective continues to be a major provider of transportation services.
About half the managers indicate that the association is responsible for supplying water,
electricity, and medical care to the population. These are normally functions of local or central
government, and it is not clear whether the associations act as proxy for government or indeed as
independent providers of these services. About 20%-30% of managers provide heating fuel,
subsidized food products, and subsidized consumer services to households. Association-owned
housing exists in one-quarter of the associations. Other subsidized services and support functions
are provided in fewer than 15% of associations.
In addition to the standard social services and benefits, households also enjoy access to farm
machinery for cultivation of the household plot and access to hay meadows and pastures for their
cattle. In the past, these were specific forms of assistance that collective farms provided to member
households. Under the new leasehold arrangements, the boundary between household plots and
leasehold farms has become blurred and it is difficult to differentiate between direct assistance to
households and assistance extended by virtue of leasehold agreements.
Table 3.14. Social Services and Benefits Provided by the Association to Its Members
Percent of managersproviding service/benefit
Transport services 74
Water 50
Electricity 41
Medical care 38
Heating fuel 33
Food at subsidized prices 31
Use of enterprise housing 24
Subsidized consumer services 21
Salary increments due to price increases 17
Pension augmentation 14
Subsidized chiidcare 14
Subsidized vacation 14
Help with construction and repair of housing and farm buildings 12
Help with purchase of manufactured goods 10
Subsidized school services 5
Stipends to students 5
Child allowances 2
Chapter 3 - The Peasant Association: Managers' Perspective 43
The cost of maintaining the social sphere averages only 3% of total association costs.Managers are uncertain which way these costs may move next year: 52% of respondents could notgive a definite answer to this question, 26% thought the costs next year would be higher, and 20%indicated that the costs would be unchanged or even lower.
The average monthly wage earned by leaseholders is about 120,000 manat. All managers areof the opinion that this is too low for a normal standard of living. In their judgment the averagemonthly wage should be around 400,000 manat, or more than three times the actual amount.Leaseholders receive their wages directly from Daikhan Bank and the marketers: the association isno longer involved in making the actual payments. In one-quarter of the cases, however, leaseholderscan receive advances from the association until their final accounts are settled by the financialinstitutions (which may take anywhere from 1 to 4 months).
Pension arrears are not a major problem in Turkmenistan. Fewer than 25% of associationmanagers reported delays with pensions, mostly of not more than 1 month. There are relatively fewpensioners among the rural population due to the high birth rate (the average association reportsabout 500 pensioners in a population of 6,000).
* * *
Peasant associations as viewed in the sample differ from the predecessor farms largely byhigher frequency of assigning identified plots to households on intra-farm leasehold. This is not arevolutionary departure from the past, but it constitutes a significant and incremental extension ofpractices that were followed on a smaller scale already under the Soviet regime. The associationcontinues to be subject to state orders, and acts as an enforcer of their fulfillment by leaseholders.Accounting practices have changed little, and association accounts still record leaseholders asearning wages.
Peasant associations in Turkmenistan are thus an intermediate form of farm enterprise. Theyare not yet voluntary associations of economically and financially independent smallholders. Norare they unreformed collective enterprises of the past. They have potential to move in eitherdirection, i.e., back toward their collective and rigidly administered predecessors or forward to moregenuinely voluntary and commercially oriented associations of independent small-holders. Theactual direction in which the peasant associations move in the near future will depend on the degreeof autonomy granted to leaseholders and on the schedule for phasing out state orders.
4. The Peasant Association: Leaseholders' Perspective
As noted in Chapter 2, intra-farm leaseholding was practiced in Turkmenistan even duringthe late Soviet period. With the publication of the Presidential decree of December 1996 encouragingwidespread intra-farm leasing and eventual conversion of leaseholds to private ownership,leaseholding became the predominant form of land management within the collective enterprise. Thesurvey covered 840 leaseholders, selected at random among the leaseholders of record in 42 peasantassociations in the velayats of Akhal,Mary, and Lebap. Fig. 4.1. Age Distribution of Leaseholder and Spouse
Demographics and Organization40percent of respondents40
The average household in thesample has six people. Family members 3
30 typically live in a detached house ownedby the family. The leaseholder and the Leaseholderspouse are both relatively young (39), and 20 _ . .Spouse
only 3% of leaseholders are older than 60.The age distribution is practically the same 10 _for both the leaseholder and the spouse,with most respondents aged between 20 0 20 >6*
and 50 (Figure 4.1). <20 21-30 31-40 41-50 51-60 >60
O3f the 840 respondents in thesre nheary onesp-tidedte thei Fig. 4.2. Former Occupation of Leaseholder and Spouse
survey, nearly one-third date theirleaseholds to the end of 1996 and overone-half signed the leasehold agreements percent of respondents
in 1997. Most respondents have either 80
individual or family leaseholds (56% and 70 ____ _
42%, respectively). Collective or group 60 __.
leases are unpopular (less than 2% of 50 - -
respondents). The dominant organizational 40 - -- - cLeaseholder
form is the single-family leasehold (95% 30 _ _Spouse
of respondents), although some family and 20 _
individual leaseholds are based on two or 10three families. The small number of 10
reported collective leaseholds includes Managerial Production Off-farm Other
farming operations organized by multiplefamilies (from 2 to 30).
Two-thirds of respondents had been production workers in the peasant association beforethey became leaseholders; another 14% had been managers, specialists, or administrative staff in theassociation. About 6% of leaseholders had been students, pensioners, or unemployed, so that the newarrangement provided employment to a small additional segment of the rural population. Among the
45
46 Turkmenistan:
spouses, fewer had worked in the peasant association (50%), and nearly 20% had been employed inthe social sphere and in other off-farm occupations; for fully 15% of spouses the former occupationalstatus is characterized as unemployed, which probably describes a homemaker without a salaried job.The distribution of former occupations is shown in Figure 4.2.
Practically all leaseholders (85%) Fig. 4.3. Off-Farm Occupation of Leaseholder and Spousework full time on their lease far m, and inaddition devote a part of the day to thehousehold plot. As a result, few 60 percent of respondents
leaseholders (less than 20%) work off-farm. Among the spouses, on the otherhand, two-thirds devote only a part of 40 _ _
their working time to the lease farm and 30 -XeI
the household plot, and 35% manage to - Spousework off-farm. This may reflect the 20
limited labor requirements of the lease 101farmn, which generally needs the full-time lattention of the leaseholder but leaves the 0 Managerial Production Village
spouse relatively free to seek off-farm Association
jobs. Off-farm work provides a kind of insurance through diversification of sources of familyincome. Outside the lease farm, the leaseholders work mainly in the local peasant association (70%),largely in managerial and administrative positions (40%). Among the spouses who work off thefarm, on the other hand, over 50% hold jobs outside the association, including social services in thevillage (Figure 4.3).
Table 4.1. Education Level of Leaseholder and Spouse, by Gender (percent of respondents)
A high percentage of leaseholders are women (43%). The gender breakdown is mutuallyconsistent. Since respondents were technically unlikely to become confused in their answers betweenthe leaseholder and the spouse, the leasehold arrangements in Turkmenistan appear to be gender-neutral.
There is, however, a definite difference by gender in the educational endowment ofleaseholders and their spouses (Table 4.1). The proportion of individuals with post-secondary orhigher education is significantly higher among men than among women. As a result, more womenhave secondary education than men do. Yet women mostly report general secondary education,whereas among men technical or vocational secondary education is more frequent. As shown in,
Chapter 4 - The Peasant Association: Leaseholders 'Perspective 47
Table 4.1, the educational attainment in general is lower in households where the leaseholder is awoman, and higher where the leaseholder is male.
Land Holdings
The average leasehold farm in the sample is 6 hectare; practically all of it irrigated arableland. In addition, households continue to cultivate their traditional plots of 0.2 hectare, which in mostcases are immediately adjacent to the house. Less than 10% of respondents report an additionalhousehold parcel at the periphery of the village. Accordingly, 85% of leaseholders have only twoland parcels: the 6 hectare lease farm and the 0.2 hectare plot around the house; another 10% reportthree parcels, with a somewhat larger household plot of 0.25 hectare split between the house and theperiphery.
All leaseholders have an official document certifying their new status, which is issued by theinternal reform committee in the association (78% of respondents) or the manager (19%). In mostcases the document contains a map showing the boundaries of the land given in leasehold (68% ofrespondents); in one-quarter of the cases, however, the respondents state that the document does notshow the map of their leased land. Three-quarters of respondents indicate that their leasehold landhas clearly marked boundaries in the field. In addition to the leasehold document, all families havecertificates of private ownership for their household plots.
The leasehold land is usually close to the village. For half the respondents the distance totheir leased land is less than 3 kin, and for another 35% the distance is between 3 km and 10 km.Over 85% of respondents are convinced that they will continue to cultivate their present plot in thefuture. This conviction is based on past experience: nearly 60% of leaseholders leased land in thepast, and three-quarters of this group actually leased the same plot that they are leasing today.
Fully 85% are satisfied with the quality of their leased land. Half the respondents report thatsoil amelioration work is being carried out on their leased land, mainly by the association and thestate. One-third of leaseholders manages the amelioration work themselves, which may be a sign ofconfidence in the future.
More than half the respondents would like to increase their lease farm, mainly because theincome they receive from their present holding is insufficient for the family needs and because theyhope the profitability will improve on a larger plot. The desired augmentation is 9 hectare. Theleaseholders are thus aiming at an optimal farm size of 15 hectare, 2.5 times the present size.
The term of the leasehold is 10 or 15 years (87% of respondents). The long-term nature ofthe lease contracts appears to guarantee security of tenure: over 80% of respondents indicate thatthey cultivate the same plot year after year, and only 14% report annual redistribution of land.Practically everyone expects to receive his or her leased land in private ownership. For about 60%this is expected to happen in the year 2000 or later; 25% are more optimistic, expecting to get theirland in private ownership next year (1999). The leaseholders do not agree on who will actuallydecide on transfer of leased land to private ownership: 40% think the transfer will be decided by aninternal committee in the peasant association and another 40% think the power rests with the local
48 Turkmenistan:
administrator or the state land reform committee. It is clear to everybody, however, that the decisionwill not be made by the association manager or by the general assembly of the leaseholders.
Rights and Obligations
Land distribution to leaseholders was managed by an internal committee in the association(86% of respondents) or the management (9%). The leaseholders generally were not given anopportunity to choose a preferred plot. In half the cases, the leaseholders were offered a specific plotby the committee and simply signed for it. In 40% of the cases, the plots were allocated by lottery.
Leaseholders pay 20% of their gross product for the right to work under the new system. Ofthis, 12% is paid to the association for the services it provides to leaseholders and rural residents and8% is a state tax intended for the government budget. There is virtually no variability in the two ratesas reported by the respondents. This means that everybody knows how much has to be paid, and thepayment rate is fixed for everybody all over the country.
The actual payments are practically equal to the amounts prescribed by the lease contract.No other payments to the association or the budget are reported. The 20% lease payment translateson average into 1.6 million manat per leasehold unit. The variability in absolute amounts isconsiderable, with payments ranging from 3,000 to 30 million manat. The amount of lease paymentsis positively correlated with the amount of irrigated land in leasehold units. As a result, collectiveleaseholds cultivating about 70 hectare of irrigated land pay 5-6 million manat, whereas individualand family units cultivating about 5 hectare in leasehold pay 1.5 million manat. If lease paymentsare indeed set at 20% of the value of output, these numbers seem to indicate that the smallerindividual and family leaseholds produce four times more output per hectare than the largercollective leasehold units (Table 4.2).
Table 4.2. Lease Payments and Productivity for Leaseholds of Different Types
Lease payments, million Irrigated land, hectare Estimated output permanat hectare, million manat*
Individual leasehold 1.56 5 1.6
Collective leasehold 5.25 72 0.4
*Assuming lease payments are at 20% of actual output.
Lease contracts typically specify the production targets for cotton or wheat (both by area andby quantity); a substantially smaller percentage of contracts specify production targets for othercommodities, such as vegetables, fruits, or livestock products (Table 4.3). Only 4% of respondentsdo not report any production targets in their lease contracts. Most leaseholders (70%) actually signa separate annual production agreement with the association in addition to the basic lease contractgiving right to a plot of land.
While specifying production targets for leaseholders, the lease contract also promises supplyof farm inputs and services, the most important being mechanized field services, seeds, andfertilizers (Table 4.4). More than half the leaseholders report that, in addition to input supply, theyalso enjoy state support or subsidies for transportation and credit. On the whole, the state meets its
Chapter 4 - The Peasant Association: Leaseholders' Perspective 49
obligations for delivery of inputs and services to leaseholders: three-quarters of respondents reportthat they received their quota of inputs and services in full, and another 20% report partial fulfillmentof the obligations by the state.
Table 4.3. Frequency of Lease Contracts with Production Targets
Commodity Percent of leaseholders
Cotton 58
Wheat 35
Vegetables 2
Grapes I
Fruits I
Other crops 4
Meat 4
Milk I
Other livestock products 5
Table 4.4. Commitment to Delivery of Inputs and Services to Leaseholders as Reflected in Lease Contracts(percent of respondents)
|Promised by lease |Leaseholders reporting receipt of
contract |inputs and services
Mechanized services 93 91
Seeds 89 88
Fertilizers 87
Chemicals 43 76
Veterinary services 6 --
Other inputs 9 --
Transportation costs for products and inputs -- 64
Credit from Daikhan Bank -- 47
Credit from marketers -- 8
Labor and Resources
An average lease farm employs 2.4 workers year round and another 3.3 seasonal workers.The labor is mainly provided by family members: 95% of the permanent labor force and 70% of theseasonal workers. The seasonal labor needs are satisfied by hired help and the extended family: 20%of seasonal labor are hired workers and 10% are relatives and friends.
Practically all households surveyed (95%) lease land for crop production. Livestock leasingis reported by a mere 5% of households. The two groups of crop and livestock producers in thesample are disjoint: crop producers have no animals, and livestock producers have land only forgrowing animal feed, if at all (40% of livestock producers report that they lease land for feed). While.
50 Turkmenistan:
there is hardly any leasing of livestock in the sample, 85% of respondents have private livestock ontheir household plots.
Table 4.5. Availability of Assets in Leasehold Farms (percent of leaseholders)
Own Leased
Livestock buildings 72 4
Farn buildings 34 2
Fann machinery 4 4
Vehicles 16 1
Farm equipment 15 1
Other 3 1
Leaseholders with farn assets of any kind 78 8
Leasing arrangements do not extend beyond land (and in some case livestock). Only 8% ofhouseholds lease other productive assets from the association. Leaseholders prefer to accumulatetheir own assets, and nearly 80% of respondents actually own productive assets of one kind oranother. Table 4.5 presents data on assets owned or leased by leaseholders. Farm and livestockbuildings are reported fairly frequently. Mechanical equipment, on the other hand, is rare: 4% ofleaseholders have tractors (the only kind of farm machinery available) and 3% have trucks (most ofthe vehicles reported by leaseholders are cars).
Production in Leasehold Farms
Of the leasehold farmns, nearly 95% specialize in crop production, without any livestock and4% specialize in livestock without crops (other than feed crops). Only 2% are mixed farms, withboth crops and livestock. These findings refer to leasehold farms as distinct from the householdplots, most of which report livestock. Land allocation is given as the main reason for not havinganimals in the leasehold farms: according to 70% of respondents land was allocated for cropproduction, and their lease contract obligates them to produce crops, not livestock; another 15%indicate that there is not enough land and thus not enough feed for livestock. Hardly anybody giveslow profitability as the reason for not going into livestock production. Livestock is a relatively morepopular occupation among collective leaseholders: nearly 40% of collective leaseholders have somelivestock, compared with about 15% among individual leaseholders. The total number of collectiveleaseholders in the sample is small, however, and so the overall importance of livestock productionin this sample is low. For the very few leaseholders that report milk production data, milk yields arevery low, at around 900 kg per cow per year (compared with 1,500 kg specified in the livestock leasecontract). This is substantially lower than the milk yields achieved by households with their privatecattle (1,200 kg per cow per year), although this yield too is very low by international standards.
The land received in leasehold from the peasant association is overwhelmingly under wheatand cotton (Table 4.6). Averaged over all farms in this sample, 73% of cropped land is under wheat,21% under cotton, and only 6% is under other crops. The sample of leaseholders is thus biasedtoward wheat producers, as among the peasant associations in the survey (and also nationally) wheataccounts for 46% of cropped land and cotton for 37%. Cotton is grown in the sample only on
Chapter 4 - The Peasant Association: Leaseholders' Perspective 51
irrigated land, whereas wheat is also grown on land without irrigation. Crops other than wheat andcotton are reported only by farms with irrigated land, but even on these farms other crops accountfor less than 10% of cropped land. Irrigated wheat yields are much higher than the yields achievedwithout irrigation (2,400 kg per hectare compared with 900 kg per hectare; see Table 4:6), but arelow by international standards for irrigated wheat. On the whole, cotton and wheat yields achievedby leaseholders are around the long-term averages historically reported for Turkmenistan.
Both cotton and wheat are reported profitable by 85% of leaseholders. In line with thisassessment, about 60% of growers would like to increase the areas under wheat and cotton andanother 30% plan to leave the area unchanged. Very few respondents indicate that they would liketo reduce the area under the two main crops.
Table 4.6. Land Use in Leasehold Farms
All farms Farms with irrigated land Farms without irrigated land
percent of percent of percent of percent of percent of percent ofleasehold cropped leasehold cropped leasehold cropped
Total in leasehold 6,714 ha 4,640 ha 2,074 ha
Total cropped 88 100 100 100 63 100
Wheat 64 73 65 65 63 100
Cotton 18 21 27 27 0
Other crops 6 6 8 8 0
Not cropped 12 0 37
Wheat yield 2,300 kg/ha 2,400 kg/ha 900 kg/ha
Cotton yield 2,400 kg/ha 2,400 kg/ha --
Wheat and cotton are mutually exclusive crops grown by over 90% of leasehold farms. Ofnearly 800 farms that report growing cotton or wheat, only 28 grow both crops. These are specializedfarms that do not grow anything other than the main crops. There is also a clear size differentiationamong farms growing wheat and cotton. Cotton farms average 2.5 hectare, with sizes ranging from0.4 hectare to 27 hectare. Wheat farms, on the other hand, average 10 hectare on irrigated land andover 60 hectare without irrigation. The average wheat farm in the survey has 17 hectare, with sizesranging from about 1 hectare to over 200 hectare. In the small group of farms that grow both wheatand cotton, the area under cotton is the same as in cotton-specializing farms. All these findingssuggest that leaseholders are rigidly assigned one of the two main crops (perhaps allowing for theleaseholder's wishes or perhaps by arbitrary administrative decision), and the land allocation is thenpractically fixed by the choice of the crop.
Given the farm sizes and the yields in the sample, the average wheat farm harvests 23 ton ofwheat and the average cotton farm harvests 6 ton of cotton lint. Farms that grow both wheat andcotton harvest on average 19-ton wheat and 4 ton cotton. Wheat farms are reported to generate largerrevenue and, more importantly, a larger net farm income than cotton farms (Table 4.7). As a result,the total family income of wheat farmers is higher than that of cotton farmers: 7.5 million manat perfamily compared with 5.5 million manat.
52 Turkmenistan:
Among the small remainder of farms that grow neither wheat nor cotton, half specialize inpotatoes, vegetables, and grapes, and the other half grow mainly grasses, hay, and maize silage foranimals. The vegetable and grape farms are very small leaseholds of 1 hectare on average, and theygenerate proportionately low levels of sales and farm income. The farms specializing in feed cropscultivate large areas (over 100 hectare in a number of cases) and manage to generate relatively largenet incomes from the sale of their output. It is interesting to note that despite considerable variationin volume of sales and net income across farms of different specialization, income from all non-farmsources combined contributes about 3 million manat per family in all cases: this is the differencebetween reported family income and farm net income in Table 4.7. Households thus differ by farmincome, and are relatively homogeneous by their non-farming income.
Table 4.7. Comparative Characteristics of Wheat and Cotton Producers
Wheat only Cotton only Wheat + cotton Vegetables, Othergrapes
Percentage in the sample 34% 54% 3% 5% 4%
Farm size, ha 17 2.5 1 1 1 25
Harvest, ton 23 6 19 (wheat) +4 (cotton)
Fann sales, M manat 9.4 5.8 13.7 2.8 34.6
Farm net income, M manat 3.8 2.8 5.0 1.0 8.2
Family income, M manat 7.4 5.6 6.7 4.0 11.2
Sales
Leaseholders deliver their farm products to state marketers in accordance with the contract.This practice is reported by 90% of respondents. Only 5% of households sell most of the farm outputthrough their own efforts, and about 5% sell through the association.
The output of the two main products in leasehold farms, cotton and wheat, is sold in itsentirety. State marketing organizations are the dominant sales channel for these commodities, andthe producers report that they have no option of choosing a buyer for cotton and wheat. Otherproducts are consumed in varying degrees by the family (from 10% to 50% of the output) and thesurplus is sold, but sales are reported by a very small percentage of leasehold farms.
The producers' main complaint is that the prices they receive for cotton and wheat are toolow. The difficulty with prices is raised by 75% of cotton producers and 85% of wheat producers.A lower but still significant percentage of producers complain about delays in receipt of paymentsfrom the marketers (50% of cotton producers and 20% of wheat growers).
Input Supply
Leaseholders use the standard range of purchased inputs and farm services, including seeds,fertilizers, mechanized fields services, and transport (Table 4.8). Inputs specific to livestock
Chapter 4 - The Peasant Association: Leaseholders' Perspective 53
production are purchased by a relatively small subgroup of respondents, as livestock production isnot widespread in the sample. Similarly, inputs associated with the use of farm machinery (fuel,maintenance and repairs, spare parts) are purchased relatively infrequently, as most mechanicalservices are provided on contract by the association or state agencies. Instead of these inputs,virtually all leaseholders report that they purchase mechanized field services for their farms.
Table 4.8. Purchase of Farm Inputs and Services by Leaseholders
Respondents Source of supply (percent of those who buy the Difficulties with purchase ofpurchasing specified input)* inputs (percent of those who buythe input, % the specified input)
State Association Own Private No High Notsupplier production firms difficulties prices available
*May add up to more than 100% because leaseholders use multiple sources of supply.
State agencies and the association are the main suppliers of all inputs and services. They aremutually complementary in their role as suppliers: some inputs are supplied primarily through stateagencies (e.g., mineral fertilizers, herbicides, mechanized field services, seeds), while other inputsare supplied primarily by the peasant association (veterinary drugs and services, construction,consulting by experts). Private individuals and commercial firms are still of marginal importanceas suppliers of farm inputs. Own production is an important source only for manure, young animals,and animal feed, which are anyhow used only by a small proportion of leaseholders.
54 Turkmenistan:
On the whole, leaseholders report that they do not have major difficulties with purchasingfarm inputs and services (Table 4.8). Availability does not appear to be a problem (except to acertain extent for construction materials and spare parts), and high prices are the main complaint.
Finances
Virtually all leaseholders provided detailed data on farm revenues and costs. Cash receiptsfrom sales of farm products averaged 8.4 million manat per leasehold farm. Farm costs ran at 60%of sales, leaving a net margin of 40% or 3.4 million manat per farm. Tax deductions were reportedby less than 10% of leaseholders, and their average impact on farm income was negligible (Figure4.4).
The main components of farm Fig. 4.4. Farm Costs and Net Income in Leasehold Farmscosts are lease payments for land and (in percent of sales)labor, which jointly account for 42% ofthe total (Table 4.9). Charges for .58%
mechanized field work carried out bystate service organizations or theassociation account for an additional14%. Fertilizer costs represent another12% of the total, but there is practicallyno expenditure on plant protection 'chemicals (herbicides and insecticides). 2%
Water use is free at this stage. N Income40%
Average sales per farm 8.4 million manat
Table 4.9. Structure of Farm Costs
Percent of total costs
Labor 16
Land lease payments 26
Livestock lease payments 4
Lease payments for other resources 0
Mechanized field works 14
Transport 3
Fertilizer 12
Plant protection chemicals 0
Feed 8
Hay 8
Veterinary services and drugs I
Water charges 0
Other costs 8
Total farm costs 100
Chapter 4 - The Peasant Association: Leaseholders Perspective 55
Farm income is only one component that contributes to the family budget. It is supplementedby salaries received from other sources, pensions, social support payments, and of course net cashincome from the household plot and from non-farming activities. On average, the total familyincome per household surveyed was 6.5 million manat, and net farm earnings accounted for 54%of this amount. Combined with cash income from the household plot and income from non-farmingbusiness activities, the entrepreneurial income reached 70% of total family budget. The remaining30% of family income is derived mainly from salaries. The structure of family income is shown inTable 4.10. The table also shows the percentage of households reporting income from each source.While income from the leasehold farm is reported by all families, cash income from the householdplot is reported by less than half the families, and income from non-farming activities is reported byabout one-quarter of the families. Salary income is reported by 55% of families surveyed.
Table 4.10 Structure of Family Income
Percent of total family income Percent of households reportingincome from this source
Net farrn income 54 99
Net cash income from household plot 11 46
Net income from non-farming activities 5 24Salaries 25 55
Pensions and social support payments 5 20
Total 100
6.5 million manat
Debt
Only 12% of leaseholders report outstanding debt. In most cases, this is informal debt torelatives, friends, and neighbors (8% of respondents) or to the peasant association (2%). Debt toDaikhan Bank and to state service and marketing organizations is reported only by 2% ofleaseholders. These are the main sources of advances for working capital to leasehold farms, andperhaps respondents did not regard such advances as debt.
Despite the low frequency ofoutstanding dhebt towo-third of Fig. 4.5. Demand for Credit by Leaseholdersoutstanding debt, two-thirds ofleaseholders indicate that they will needcredit for farm operations next year. percent of respondents
The mean expected borrowing is 7million manat, but 75% of respondents
30expect to need between 0.5 and 5.5million manat; the relatively high mean
20 is attributable to about 10% ofleaseholders who expect to borrow
1 0between 10 and 250 million manat(Figure 4.5). The desired borrowing . i
1-2 3-5 6-10 11-20 >20
Manat (millions)
56 Turkmenistan:
term is typically 12 months (50% of respondents) and the acceptable interest rate is between 2% and5% percent annually in nominal terms (70% of respondents).
Despite the significant demand for credit on concessional terms, 70% of leaseholders statethat they do not have any sources for borrowing. Less than 15% indicate possibilities of access toformal borrowing channels (banks or the peasant association), while another 15% believe they canborrow from informal sources (relatives, friends, and neighbors).
Payment arrears for goods and services delivered by leaseholders do not appear to be aproblem. Only 20% report receivables, which average 2.1 million manat. The average sales revenuefor these farms is 9.2 million manat, and arrears are thus equal to about 80 days of sales, or less thanthree months. The peasant association is cited as the main debtor, responsible for 60% of allpayments due to leaseholders. State marketers owe about 20% of leaseholders' receivables.
These rough calculations of the number of days in arrears are inconsistent with theinformation on payment delays provided by the leaseholders in response to a direct question. About20% of leaseholders report the number of months that payments are in arrears from the peasantassociation and other purchasing organizations. Unfortunately, this group only partially overlaps the20% that provided information on the amounts in arrears. Here 30% complain of
Delays of up to 3 months, 30% of delays between 3 and 6 months, 30% of delays between6 and 12 months, and 10% of delays exceeding 12 months (between 1 and 3 years). These delays aremuch longer than previously deduced, but the overall incidence of delays in the sample is small.
Production and Income from the Household Plot
While the leasehold farm is a commercial operation, the household plot provides food forsubsistence as well as some cash income from sale of surplus. Moreover, the product mix ofleasehold farms is rigidly prescribed by the lease agreement with the association, which in turn isdetermined by the system of state orders. Families, on the other hand, are free to produce what theywish on their household plot, be it vegetables, fruits, or livestock.
The small household plot, averaging less than 0.2 ha, is primarily divided between three cropproducts: potatoes and vegetables (38% of the average plot), fruits and grapes (25% of the plot), andgrain for livestock feed (28%). While leasehold farms primarily emphasize crop production, virtuallyall households (85%) keep some livestock on their private plot. The average household plot supports2 cows, I bull, and about 10 sheep. Poultry is not particularly widespread, and only one-quarter ofhouseholds in the survey report any chickens.
On average, the family consumes three-quarters of household production and the remainingone-quarter is sold (Table 4.11). Vegetables, melons, and grapes are the main cash crops fromhousehold plots: nearly 50% of the output of these crops is sold.
Chapter 4 - The Peasant Association: Leaseholders' Perspective S7
Table 4.11. Production and Sales from Household Plots
Commodity Number of Average output, Percentage of output Percentage of output§ households* { kg | consumed by the family sold
Vegetables, melons 586 732 54 48
Milk 581 1582 75 26
Fruits 356 203 84 16
Grapes 352 313 58 46
Meat 345 286 76 29
Potatoes 315 726 75 25
Wheat 292 368 93 6
Eggs 204 311 66 21
Wool 136 42 47 54
Standard of Living Fig. 4.6. How Did the Family Standard of Living Changein Recent Years?
Leaseholding families earnincome from various sources, including Detenorated
the leasehold farm, off-farm I]employment, and transfers. In addition to Aincome from commercial sales of Unchanged .
commodities produced under the
leasehold contract, leaseholding families Ipoe
earn supplementary cash income from ..
sales of farm products produced on their Undecided
household plot. Nearly half the l l_l_lhouseholds report some sales of products 0 10 20 30 40 50 s0
percent of respondents
from their household plots. Famniliesfrom betheir hone-useh plots. Famale Fig. 4.7. How Will the Family Standard of Living Changesell between one-quarter and one-half in the Future?
of the output of some products, such as
vegetables, grapes, milk and meat (see l 1 l -
Table 4.11). The products from the Deteriorate
household plot are sold directly to
consumers in the market. Cash revenue Unchanged
from these sales provides 11% of a_i_Ifamily income. ImproveI
Leaseholders report that their
family incomes increased over the Undecided
period when leaseholding arrangements 0 10 20 30 40 50 60 70 80
became more prevalent in percent of respondents
Turkmenistan. Thus, 50% of
58 Turkmenistan:
respondents report that the family's Fig. 4.8. What the Family Budget Buysstandard of living improved duringthe last three years and another 30%say that it did not change (Figure
Below minimum4.6) . The hopes for the future arealso quite optimistic, as nearly 70%of leaseholders in the sample expect Subsistence
the material situation of the familyto change for the better and only 1% Adequate
have a negative outlook (Figure4.7)C Comfortable
The family's standard of 0 10 20 30 40 50
living was assessed according to percent of respondents
four qualitative categories, based on leaseholders' perceptions. In Figure 4.8, "below minimum" isthe category representing families whose income is not sufficient to buy all the food they need. Forfamilies in the "subsistence" category income is sufficient to meet their food needs, and for thosein the "adequate" category income is sufficient to buy food and other daily necessities, includingclothing; the "comfortable" category describes families that do not experience material difficultiesat present. Based on this qualitative scale, family income is sufficient to satisfy the daily needs forthree-quarters of households, 16% of respondents report that their families at present have nomaterial difficulties, and 12% indicate that their family income is insufficient to buy all the food theyneed. The assessments of past changes and future expectations presented in Figure 4.6 and Figure4.7 above are closely correlated with this assessment of the family's standard of living. The higherthe standard of living, the more optimistic are the expectations for the future and the more positivethe evaluation of changes in recent years.
The actual family income in the sample was 6.5 million manat per year. The mean desiredincome judged sufficient to maintain a "normal" standard of living was 17.7 million manat, a gapof 2.7 times relative to the actual income. The gap between the desired and actual income is greatestfor families whose standard of living is below the necessary minimum and smallest for familieswithout material difficulties (Table 4.12). For a family of 6, an annual income of 17.7 million manattranslates into about $590 per person per year at the official rate of exchange. In other parts of theworld where domestic prices reflect international prices, this level of income would be consideredpoverty. In Turkmenistan, $590 per person per year is considered sufficient and exceeds presentactual levels by a large margin, suggesting that the domestic price structure is still highly distortedrelative to international prices.
There are two additional indications of financial optimism among leaseholder families. First,about half the respondents indicate that they intend to build a new house within the next two years.Second, three-quarters of respondents plan to buy machinery and equipment for their leasehold farmwithin the next two years. Both findings are an expression of confidence in the future, but they aredifficult to reconcile with reported actual income levels.
Chapter 4 - The Peasant Association: Leaseholders' Perspective 59
Table 4.12. Actual and Desired Family Income (in million manat)
Assessment of the family's standard of living Actual income Desired income Desired-to-for "normal" actual incomestandard of living ratio
Below minimum: income not sufficient to buy all the 3.4 22.2 6.6food the family needs
Subsistence: income sufficient to buy food and daily 6.0 18.7 3.1necessities
Adequate: income sufficient to buy clothing, shoes, etc. 6.7 17.5 2.6in addition to food and daily necessities
Comfortable: family does not experience material 10.0 12.4 1.2difficulties
All sample 6.5 17.7 2.7
Leaseholders report that further improvement in their standard of living could be achievedby allowing wheat and cotton to be sold at free market prices (50% of respondents) and by lettingthe producers themselves decide what to grow, without state orders (30% of respondents).Leaseholders thus appear to have an understanding of policies that reduce their income, but do notyet perceive the extent to which domestic prices for inputs and services are distorted relative tointernational prices.
Social Services and Benefits
Contrary to the practice of the past, it is now the state, and not the association that emergesas the main provider of social benefits and services in the village (Table 4.13). Medical care, heatingfuel, subsidized utilities and consumer services are provided by central and local government to alarge segment of the population. Government-subsidized food is enjoyed universally: this probablyrefers to the state program of providing bread and salt for free or at greatly reduced prices.
The association plays a certain role (alongside government) as a provider of transportservices to the rural population. Nobody reports receiving assistance with housing construction ormaintenance; nor does anybody report subsidized vacations or trips to resorts. These benefits hadbeen traditionally provided by collective farms to their employees, and they were probablyeliminated with the transition to peasant associations based on leasehold arrangements. Incomesupport in the form of child allowances or subsidies to childcare and schools also appear to havebeen virtually eliminated. There is no basis for comparison with the pre-reform period, but thepercentage of rural residents enjoying various social services and benefits in Turkmenistan today issubstantially lower than in other former Soviet republics.
Somewhat surprisingly, only 22% of households report that the association assists them withthe household plot. Among these households, the most important areas of assistance includeprovision of mechanized field services and farm machinery and equipment (about half thehouseholds that report assistance). Somewhat surprisingly, only 22% of households report that theassociation assists them with the household plot. Among these households, the most important areas.
60 Turkmenistan.
of assistance include provision of mechanized field services and farm machinery and equipment(about half the households that report assistance).
Table 4.13. Provision of Social Services and Benefits to Leaseholders(percent of respondents)
Government Association
Subsidized food 95 --
Heating fuel 52 5
Subsidized utilities and consumer 39 --
services
Medical care 79 --
Transport 12 15
Association housing -- 5
Housing: building and repairs --
Subsidized vacation -- --
Pensions 21 --
School subsidies 12 --
Children allowance 6 --
Pre-school subsidies 2 --
Student stipends 2 --
* * *
Leaseholders give a favorable assessment of their standard of living and of the changes thathave taken place since the introduction of leaseholding arrangements on a large scale. Indeed, familyincomes may be sufficient to provide most of the daily needs under the present conditions. Yet inabsolute terms the rural population in Turkmenistan is quite poor and would live poorly if domesticprices reflected international prices. While producers clearly understand that they are getting muchbelow world prices for their wheat and cotton, they may not grasp the full extent to which the entirecost structure in the country is distorted and below world levels.
Leaseholders enjoy very limited autonomy in their operating decisions. The lease contractsrigidly prescribe the area to be sown to each crop and the specific crops that the leaseholders mustgrow. The contractual conditions are monitored and enforced by the association, and the leaseholdershave practically no freedom of decision in production matters outside their small household plots.Similarly, all sales of cotton and wheat are channeled through state procurement, and all inputs arereceived from state sources. Transactions with private firms and suppliers are minimal. Althoughleaseholders are provided easy access to financing through special arrangements with Daikhan Bank,they have no opportunity to act as responsible decision-makers in a market-oriented environment.
The introduction of leaseholding, as experienced at the time of this survey, appears to haveboth positive features and shortcomings. On the one hand, leaseholders are reported to support theprogram and to have high expectations about its future. Incomes have risen and production has
Chapter 4 - The Peasant Association: Leaseholders' Perspective 61
grown, albeit from very depressed levels in 1996 and 1997. Most leaseholders want to receive theirland in private ownership and expect conversion of tenure to happen soon. On the other hand, theobjective conditions as described in this survey may not warrant such optimism. Managers are muchless confident that tenure will or should be converted soon. Income levels in dollar terms are amongthe poorest in the world. Leaseholders are still firmly limited by decisions others make regardingwhat to produce and how to market their output.
With respect to the degree of autonomy of small-holder producers, Turkmenistan differsmarkedly from other countries in the post-Soviet region that have undergone significant reform ofland tenure and in which small-holder agriculture predominates. These countries are Armenia,Georgia, and Moldova, where family farms are independent operations not subject to any stateorders. As a result, former collective and state farm employees have evolved in a relatively shorttime into diversified producers who grow several different crops and mix crop production withlivestock. This is in contract to leaseholders in Turkmenistan, who mainly operate as monoculturefarms. Family farmers in Armenia, Georgia and Moldova sell and buy directly in the market,completely bypassing former state channels. Moreover, small-holders in these countries do notenjoy the financial umbrella of a specialized agricultural bank. They may find it more difficult tofinance their farming operations, but on the other hand by forgoing state-directed financial supportthey gain the freedom of decision and choice, which is crucial for the development of market-oriented business entities.
5. Selected References on Land Reform and Farm Restructuringin Transition Economies
World Bank Country Reports and Agricultural Sector Reviews
An Agricultural Strategy for Albania, World Bank and the European Community, Washington,DC (1992).
Albania. Building a New Economy, Report No. 12342-ALB, World Bank, Washington, DC(1994).
Armenia: The Challenge of Reform in the Agricultural Sector, World Bank, Washington, DC(1995).
Azerbaijan: Agricultural Sector Review, Report No. 14541-AZ, World Bank, Washington, DC(1995).
Belarus: Agriculture and Food Sector Review, Report No. 12576-BY, World Bank, Washington,DC (1994).
Estonia: Agriculture and Forestry Sector Review, Report No. 133 16-EE, World Bank,Washington, DC (1995).
Food and Agricultural Policy Reforms in the Former USSR: An Agenda for the Transition,Studies in Economics of Transformation, Vol. 1, World Bank, Washington, DC (1992).
Georgia: Agriculture and Food Sector Review, Report No. 14659-GE, World Bank, Washington,DC (1995).
Hungary: Review ofAgricultural Policy, Report No. 13475 HU, World Bank, Washington, DC(1994).
Kazakhstan: Agricultural Sector Review, Report No. 13334-KZ, World Bank, Washington, DC(1994).
The Kyrgyz Republic: Agricultural Sector Review, Report No. 12989-KG, World Bank,Washington, DC (1994).
Latvia: Agricultural Sector Review, Report No. 1240 1-LV, World Bank, Washington, DC(1994).
Lithuania: Agriculture and Food Sector Review, Report No. 13111 -LT, World Bank,Washington, DC (1995).
Moldova: Moving to a Market Economy, World Bank Country Study, World Bank, Washington,DC (1994).
Moldova: Agriculture Sector Review, Report No. 12581-MD, World Bank, Washington, DC(1995).
An Agricultural Strategy for Poland, World Bank and the European Community, Washington,DC (1990).
63
64 Turkmenistan:
Romania: A Strategy for the Transition in Agriculture, Main Report, World Bank, Washington,DC (1993).
Turkmenistan, World Bank, Washington, DC (1994).Turkmenistan. Review of the Agrarian Sector, Report No. 15621 -TM (draft), World Bank,
Washington, DC (1996).Ukraine: The Agriculture Sector in Transition, World Bank, Washington, DC (1994).Uzbekistan: An Agenda for Economic Reform, World Bank, Washington, DC (1993).Uzbekistan Economic Memorandum: Subsidies and Transfers, Report No. 12934-UZ, World
Bank, Washington, DC (1994).
World Bank Farm Surveys
Armenia. Land Reform and Private Farms in Armenia: 1996 Status, EC4NR Agriculture PolicyNote No. 8, Natural Resources Management Division, Europe and Central Asia Region,World Bank, Washington, DC (1996).
Brooks, K. and Z. Lerman. Land Reform and Farm Restructuring in Russia, World BankDiscussion Paper 233, Washington, DC (1994).
Brooks, K., E. Krylatykh, Z. Lerman, A. Petrikov, and V. Uzun. Agricultural Reform in Russia:A View from the Farm Level, World Bank Discussion Paper 327, Washington, DC(1996).
Csaki, C., Z. Lerman, and S. Sotnikov. Farm Sector Restructuring in Belarus: Progress andConstraints, World Bank Technical Paper 475, Washington, DC (2000).
Euroconsult. Farm Restructuring and Land Tenure in Reforming Socialist Economies: AComparative Analysis of Eastern and Central Europe, World Bank Discussion Paper268, The World Bank, Washington, DC (1994).
Euroconsult. Regional Study: Farm Restructuring and Land Tenure in Reforming SocialistEconomies, Annex V. Report on Land Market Issues, Arnhem, The Netherlands (1994).
Georgia. Land Reform and Private Farms in Georgia: 1996 Status, EC4NR Agriculture PolicyNote No. 6, Natural Resources Management Division, Europe and Central Asia Region,World Bank, Washington, DC (1966).
Gray, J., Kazakhstan: A Review of Farm Restructuring, World Bank Technical Paper 458,Washington, DC (2000).
Lerman, Z., K. Brooks, and C. Csaki. Land Reform and Farm Restructuring in Ukraine, WorldBank Discussion Paper 270, Washington, DC (1994).
Lerman, Z. and C. Csaki, Land Reform in Ukraine: The First Five Years, World BankDiscussion Paper 371, Washington, DC (1997).
Lerman, Z. and C. Csaki, Ukraine: Review of Farm Restructuring Experiences, World BankTechnical Paper No. 459, Washington, DC (2000).
Lerman, Z. C. Csaki, and V. Moroz, Land Reform and Farm Restructuring in Moldova. Progressand Prospects, World Bank Discussion Paper 398, Washington, DC (1998).
Lerman, Z., M. Lundell, A. Mirzakhanian, P. Asatrian, and A. Kakosian, Armenia's PrivateAgriculture: 1998 Survey of Family Farms, Environmentally and Socially Sustainable
Chapter 5 - Selected References on Land Reform and Farm Restructuring in Transition Economies 65
Development Working Paper No. 17, Washington, DC (1999).Romania. Private Agriculture in Romania: Farm Survey, Romanian Ministry of Agriculture and
Food, European Commission, and The World Bank, Bucharest (1997).
Other Sources
Agricultural Situation and Prospects in the Central and Eastern European Countries, SummaryReport and Country Reports, Directorate-General for Agriculture (DG-VI), EuropeanCommission, Brussels (June 1998).
Aves, J., Georgia: From Chaos to Stability, The Royal Institute of International Affairs, London(1996).
Binswanger, H., K. Deininger, and G. Feder. "Power, Distortions, Revolt and Reform inAgricultural Land Relations," in: J. Behrman and T. N. Srinivasan, eds., Handbook ofDevelopment Economics, vol. III, chapter 42, pp. 2659-2772, Elsevier Science (1995).
Brooks, K. and Z. Lerman. "Farm Reform in the Transition Economies," Finance andDevelopment, 31(4): 25-28 (1994).
Brooks, K., and Z. Lerman. "Restructuring of Traditional Farms and New Land Relations inRussia," Agricultural Economics, 13: 11-25 (1995).
Craumer, P., Rural and Agricultural Development in Uzbekistan, The Royal Institute ofInternational Affairs, London (1995).
Csaki, C. "Where is Agriculture Heading in Central and Eastern Europe?" Presidential Address,XXII International Congress of Agricultural Economists, Harare, Zimbabwe, Aug. 22-28,1994.
Csaki, C., M. Debatisse, and 0. Honisch. Food and Agriculture in the Czech Republic: From a"Velvet" Transition to the Challenges ofEUAccession, World Bank Technical Paper437, Europe and Central Asia Environmentally and Socially Sustainable RuralDevelopment Series, Washington, DC (1999).
Csaki, C. and A. Fock, eds. The Agrarian Economies of Central and Eastern Europe and theCommonwealth of Independent States: An Update on Status and Progress,Environmentally and Socially Sustainable Development Working Paper No. 24, TheWorld Bank, Washington, DC (June 2000).
Csaki, C., K. Gray, Z. Lerman, and W. Thiesenhusen. "Land Reform and the Restructuring ofKolkhozes and Sovkhozes," in: Food and Agricultural Policy Reforms in the FormerUSSR: An Agenda for Transition, Background Working Papers, Vol. I, Washington, DC(1992).
Csaki, C., and Z. Lerman. "Land reform and the future role of cooperatives in agriculture in theformer socialist countries in Europe," in: C. Csaki and Y. Kislev, Eds., AgriculturalCooperatives in Transition, Westview, Boulder, CO (1993).
66 Turkmenistan:
Csaki, C. and Z. Lerman. "Land Reform and Farm Sector Restructuring in the Former SocialistCountries in Europe," European Review ofAgricultural Economics, 21(3/4): 555-578(1994).
Csaki, C. and Z. Lerman. "Agricultural transition revisited: issues of land reform and farnrestructuring in East Central Europe and the Former USSR," Quarterly Journal ofInternational Agriculture, 35(3):211-240 (1996).
Csaki, C. and Z. Lermnan. "Land Reform and Farn Restructuring in East Central Europe and theCIS in the 1990s: Expectations and Achievements after the First Five Years," EuropeanReview ofAgricultural Economics, 24(3/4):428-452 (1997).
Csaki, C. and Z. Lernan. "Land Reform in Ukraine: Slow Progress," Society and Economy inCentral and Eastern Europe, 19(4):46-70 (1997).
Csaki, C. and Z. Lerman. "Land Reform and Farm Restructuring in Hungary during the 1990s,"in: S. Wegren, Ed., Land Reform in the Former Soviet Union and Eastern Europe,Routledge, London-New York (1998).
Csaki, C. and Z. Lerman, eds. Structural Change in the Farming Sectors in Central and EasternEurope, Lessons for EUAccession, Second World Bank/FAO Workshop, June 27-29,1999, Warsaw, World Bank Technical Paper No. 465, Washington, DC (2000).
Csaki, C. and J. Nash. The Agrarian Economies of Central and Eastern Europe and theCommonwealth of Independent States: Situation and Perspectives, World BankDiscussion Paper 387, Washington, DC (1997).
Deininger, K. Cooperatives and the Breakup of Large Mechanized Farms: TheoreticalPerspectives and Empirical Evidence, World Bank Discussion Paper 218, Washington,DC (1993).
Delehanty, J. and J. Rasmussen. "Land reform and farn restructuring in the Kyrgyz Republic,"Post-Soviet Geography, 36(9): 565-586 (1995).
Gavrilescu, D. "Romania Facing the European Agrifood Integration: The Shock of Transition,"VIIth EAAE Congress, Stresa, Italy, Contributed Papers, Volume F: AgriculturalDevelopment and Transition, pp. 15-28 (1993).
Hungary. Hungarian Land Reform and Farm Restructuring, EC2AU Agriculture Policy Note,Agriculture and Urban Development Operations Divisions, Europe and Central AsiaRegion, World Bank, Washington, DC (1997).
Jeffries, I. Socialist Economies and the Transition to the Market, Routledge, London (1993).Kazlauskiene, N. and W. Meyers. "Blueprint for accession to the EU: Transition policies for
transition economies," Report 96-BR 23, Center for Agricultural and Rural Development,Iowa State University (July 1996).
Kodderitzsch, S. Reforms in Albanian Agriculture: Assessing a Sector in Transition, World BankTechnical Paper 431, Europe and Central Asia Environmentally and Socially SustainableRural Development Series, Washington, DC (1999).
Koester, U. and K. Brooks. Agriculture and German Reunification, World Bank DiscussionPaper No. 355, Washington, DC (1997).
Kudat, A., S. Peabody, and C. Keyder, eds.. Social Assessment and Agricultural Reform inCentral Asia and Turkey, Washington, DC (2000).
Chapter 5 - Selected References on Land Reform and Farm Restructuring in Transition Economies 67
Lerman, Z. "Experience with Land Reform and Farm Restructuring in the Former Soviet Union,"in: J. Swinnen, A. Buckwell, and E. Mathijs, Eds., Agricultural Privatisation, LandReform and Farm Restructuring in Central and Eastern Europe, Avebury, Aldershot, UK(1998)., "Does Land Reform Matter? Some Experiences from the Former Soviet Union,"European Review ofAgricultural Economics, 25: 307-330 (1998)., "Land Reforn and Farm Restructuring: What Has Been Accomplished to Date?"American Economic Review, 89(2): 271-275 (1999)., "Land Reform and Farm Restructuring in Ukraine," Problems of Post-Communism,46(3): 42-55 (1999)., and K. Brooks. "Russia's legal framework for land reform and farm restructuring,"Problems of Post-Communism, 43(6): 48-58 (1996)., K. Brooks, and C. Csaki. "Restructuring of Traditional Farms and New Land Relationsin Ukraine," Agricultural Economics, 13: 27-37 (1995)., J. Garcia-Garcia, and D. Wicheins. "Land and water policies in Uzbekistan," Post-Soviet
Geography and Economics, 37(3): 145-174 (1996).Lueschen, L. "Problems of Agricultural Policy in East Germany," Agriculture and Human
Values, Winter, pp. 27-39 (1993).Mathijs, E. and J. Swinnen, "The Economics of Agricultural Decollectivization in East Central
Europe and the Former Soviet Union," Economic Development and Cultural Change,47(1): 1-26 (1998).
Meyers, W., N. Kazlauskiene, I. Feiferis, and V. Loko. "Agricultural Transformation andPrivatization in the Baltics," Report 92-BR 7, Center for Agricultural and RuralDevelopment, Iowa State University (December 1992).
Mishev, P. ed. Nature, Evolution and Efficiency of Farm Structures in CEE Countries and FSU,58th EAAE Seminar, Sofia, May 1998, in: Bulgarian Journal ofAgricultural Science,Vol. 5, special issue (April 1999).
Moldova. Moldova Agriculture Policy Update, EC4NR Agriculture Policy Note #5, NaturalResources Management Division, Europe and Central Asia Region, Washington, DC(September 1996).
Moldova. With Farmer's Eyes: A Grassroots Perspective on Land Privatization in Moldova,EC4NR Agriculture Policy Note #7, Natural Resources Management Division, Europeand Central Asia Region, Washington, DC (October 1996).
Moldova. Land Reform and Private Farming in Moldova EC4NR Agriculture Policy Note #9,Natural Resources Management Division, Europe and Central Asia Region, Washington,DC (January 1997).
Mudahar, M. Kyrgyz Republic: Strategyfor Rural Growth and Poverty Alleviation, World BankDiscussion Paper 394, Washington, DC (1998).
Norsworthy, L.A., ed., Russian Views of the Transition in the Rural Sector: Structures, PolicyOutcomes, and Adaptive Responses, Washington, DC (2000).
68 Turkmenistan:
Prosterman, R. and T. Hanstad, eds. Legal Impediments to Effective Rural Land Relations inEastern Europe and Central Asia: A Comparative Perspective, World Bank TechnicalPaper 436, Europe and Central Asia Environmentally and Socially Sustainable RuralDevelopment Series, The World Bank, Washington, DC (1999).
Sarris, A. T. Doucha, and E. Mathijs. "Agricultural Restructuring in Central and EasternEurope," European Review ofAgricultural Economics, 26(3): 305-330 (1999).
Schmitt, G. "Why Collectivization of Agriculture in Socialist Countries Has Failed: ATransaction Cost Approach," in: C. Csaki and Y. Kislev, Agricultural Cooperatives inTransition, Westview, Boulder, Co. (1993).
Schmitz, A., K. Moulton, A. Buckwell, and S. Davidova, Eds., Privatization ofAgriculture inNew Market Economies: Lessons from Bulgaria, Kluwer, Dordrecht (1994).
Swinnen, J. Ed. Political Economy ofAgrarian Reform in Central and Eastern Europe, Ashgate,Aldershot, UK (1998).
Swinnen, J., A. Buckwell, and E. Mathijs, Eds., Agricultural Privatisation, Land Reform andFarm Restructuring in Central and Eastern Europe, Avebury, Aldershot, UK (1998).
Trendafilov, R. and V. Ivanova-Gidikova. "Reform and Market Adjustment of the BulgarianAgricultural Sector," VIIth EAAE Congress, Stresa, Italy, Contributed Papers, Volume F:Agricultural Development and Transition, pp. 1-14 (1993).
Wegren, S. "The development of market relations in agricultural land: the case of KostromaOblast," Post-Soviet Geography, 34(8): 496-512 (1995)., ed., Land Reform in the Former Soviet Union and Eastern Europe, Routledge, London-New York (1998).
Wunderlich, G. ed., Agricultural Landownership in Transitional Economies, University Press ofAmerica, Lanham, MD (1995).
Zile, R. "The Development of Privatization in Latvian Agriculture," Report 93-BR 14, Center forAgricultural and Rural Development, Iowa State University (October 1993).
Distributors of World Bank Group Publications
Pfices and credit tefns vary h-om C7ECH RJCEFLIC tNDUC Eutyoo Pubtishing Co., Ld PERU SWEDENcountry t coumrty.Cansut your USS, NIS Proddina Allied Publishers Ltd. 46-1, Susong-Dong Editorial Desarrollo SA Wennergren-Williams ABlocal disttibutor Wore placing an Havelkova 22 751 Mount Road Jonoro-Gu Apanado 3824. Ica 242 OF. 106 R 0. Box 1305order. 130 00 Prague 3 Madras - 600 002 Tet- Lima 1 T-171 25 Solna
52, You Fang Ha Tong. aaoiiuSA Tel: (81 3) 3818-0861 U w PrmUedP.O. Ban 4199 ZIMBABWXuan Hu Da ng,e 35 Stoumara Str. Fax: (81 3) 3818-0864 Unre Crowns i e h Acadernc and Baobab Books (PvL)19682 Afthens E-mail: ordersesvt-ebs.cojp Un rlpi Jobautnesurg2024 Ld
No. 453 Bartlomiej Kaminski and Michelle Riboud, Foreign Investmenit and Restructitring: The Evidencefrom Huingary
No. 454 Gordon Hughes and Julia Bucknall, Poland: Complying with EU Environmental Legislature
No. 455 Dale F. Gray, Assessment of Corporate Sector Value and Vulnerability: Links to Exchange Rate and FinancialCrises
No. 456 Salman M.A. Salman, ed., Groundwater: Legal and Policy Perspectives: Proceedings of a World Bank Seminar
No. 457 Mary Canning, Peter Moock, and Timothy Heleniak, Reforming Education in the Regions of Russia
No. 458 John Gray, Kazakhstan: A Review of Farm Restructuring
No. 459 Zvi Lerman and Csaba Csaki, Ukraine: Review of Farm Restricturing Experiences
No. 460 Gloria La Cava and Rafaella Y. Nanetti, Albania: Filling the Vulnerability Gap
No. 461 Ayse Kudat, Stan Peabody, and Caglar Keyder, eds., Social Assessment and Agricultutral Reform in CentralAsia and Turkey
No. 462 T. Rand, J. Haukohl, and U. Marxen, Municipal Solid Waste Incineration: Requirementsfor a Successfutl Project
No. 463 Stephen Foster, John Chilton, Marcus Moench, Franklin Cardy, and Manuel Schiffler, Groundwater inRural Development: Facing the Challenges of Supply and Resource Sustainability
No. 465 Csaba Csaki and Zvi Lerman, eds., Structural Change in the Farnming Sectors in Central and Eastern Europe:Lessonsfor EU Accession-Second World Bank/FAO Workshop, Jline 27-29, 1999
No. 466 Barbara Nunberg, Readyfor Europe: Public.Administration Reform and Eutropean Union Accession in Centraland Eastern Europe
No. 467 Quentin T. Wodon with contributions from Robert Ayres, Matias Barenstein, Norman Hicks, Kihoon Lee,William Maloney, Pia Peeters, Corinne Siaens, and Shlomo Yitzhaki, Poverty and Policy in Latin Americaand the Caribbean
No. 469 Laurian Unnevehr and Nancy Hirschhorn, Food Safety Issues in the Developing World
No. 470 Alberto Valdes, ed., Agricultural Support Policies in Transition Economies
No. 471 Brian Pinto, Vladimir Drebentsov, and Alexander Morozov, Dismantling Russia's Nonpayments System:Creatinig Conditionsfor Growth
No. 472 Jit B. S. Gill, A Diagnostic Frameworkfor Revenue Administration
No. 473 Esen Ulgenerk and Leila Zlaoui, From Transition to Accession: Developing Stable and Competitive FinancialMarkets in Bulgaria
No. 474 loannis N. Kessides, ed., Hungary: A Regulatory and Strctutral Review of Selected Infrastruictiure Sectors
No. 475 Csaba Csaki, Zvi Lerman, and Sergey Sotnikov, Farm Sector Restructuring in Belarus: Progress andConstraints