arXiv:1406.4192v1 [cond-mat.soft] 16 Jun 2014 Microscopic Picture of Cooperative Processes in Restructuring Gel Networks Jader Colombo, 1 Asaph Widmer-Cooper, 2 and Emanuela Del Gado 1 1 Department of Civil, Environmental and Geomatic Engineering, ETH Z¨ urich, CH-8093 Z¨ urich, Switzerland 2 School of Chemistry, University of Sydney, NSW 2006, Australia Colloidal gel networks are disordered elastic solids that can form even in extremely dilute particle suspensions. With interaction strengths comparable to the thermal energy, their stress-bearing network can locally restructure via breaking and reforming interparticle bonds. This allows for yielding, self-healing and adaptive mechanics under deformation. Designing such features requires controlling stress-transmission through the complex structure of the gel and this is challenging because the link between local restructuring and overall response of the network is still missing. Here, we use a space resolved analysis of dynamical processes and numerical simulations of a model gel to gain insight into this link. We show that consequences of local bond-breaking propagate along the gel network over distances larger than the average mesh size. This provides the missing microscopic explanation for why non-local constitutive relations are necessary to rationalize the non-trivial mechanical response of colloidal gels. Colloidal suspensions can solidify even if very diluted, because short-range interactions make particles aggre- gate into thin stress-bearing structures [1, 2]. As for other network-forming soft materials, including many with important biological functions or technological po- tential [3, 4], there is still very limited understanding of how local restructuring processes ultimately affect the transmission of stress through the complex microstruc- ture of the network, where weakly connected or soft re- gions may coexist with stiffer domains. Experiments sug- gest that cooperative dynamical processes are responsible for the complex mechanics of gels, which combines both liquid-like and solid-like features and can only be ratio- nalized by non-local constitutive relations [5–7], however a microscopic explanation for this behavior is fundamen- tally lacking. Here we provide such microscopic insight by showing that the breaking of single bonds in the gel network has consequences over large distances, in terms of cooperative particle rearrangements. We do this by studying model restructuring gel networks, via numerical simulations, together with a new space-resolved analysis of dynamical processes. Experiments revealed that the particle coordination in colloidal gels can be very low (2 to 3) [8] and that the bonds between particles can support significant torques [9], thus imparting local rigidity. Hence we con- sider a minimal colloidal model with anisotropic interac- tions that stabilize open particle networks at low volume fraction [10–12]. For a microscopic particle configuration {r i } the interaction energy is: U ({r i })= ǫ i>j U 2 (r ij /σ)+ i j,k=i j>k U 3 (r ij /σ, r ik /σ) , where r ij is the vector connecting particles i and j . U 2 includes a repulsive core and a narrow attractive well, whereas U 3 imposes an angular rigidity [13]. The pa- rameters σ and ǫ define respectively the units of length (equal to the particle diameter) and energy: typical val- 0.1 1.0 10.0 q 1.0 S (q) all nodes Figure 1. Microstructure of the gel for ρ =0.15 and ǫ = 20 kBT . The static structure factor of the whole system (full line), and of the nodes only (dashed line) are depicted. Inset: real-space image of a section. ues for a colloidal system are σ = 10 − 100 nm and ǫ =1 − 100 k B T , k B being Boltzmann constant and T room temperature [1, 14, 15]. The unit of time is mσ 2 /ǫ, m being the particle mass. We perform molec- ular dynamics simulations [16] of systems with N = 4000 to 16384 particles at number density ρ =0.15, i.e., an ap- proximate volume fraction φ ≃ 0.075, with an interaction strength ǫ = 20 k B T such that the particles self-assemble into a persistent spanning network. Although very di- lute, this model gel responds as a solid under mechanical loading, with a finite elastic modulus [17]. The static structure factor S(q)= 1 N ∑ j,k exp[−iq · (r j − r k )] in Fig. 1 quantifies spatial correlations between particle po- sitions over distances ≃ 2π/q (where q is in units of σ −1 ), regardless of whether they are connected or not through the network. This simple model gel is made of chains linked by three-coordinated junctions or nodes, with a typical mesh size l ∗ ≃ 3-4σ. S(q) indicates the bonded
Transcript
arX
iv:1
406.
4192
v1 [
cond
-mat
.sof
t] 1
6 Ju
n 20
14
Microscopic Picture of Cooperative Processes in Restructuring Gel Networks
Jader Colombo,1 Asaph Widmer-Cooper,2 and Emanuela Del Gado1
1Department of Civil, Environmental and Geomatic Engineering, ETH Zurich, CH-8093 Zurich, Switzerland2School of Chemistry, University of Sydney, NSW 2006, Australia
Colloidal gel networks are disordered elastic solids that can form even in extremely dilute particlesuspensions. With interaction strengths comparable to the thermal energy, their stress-bearingnetwork can locally restructure via breaking and reforming interparticle bonds. This allows foryielding, self-healing and adaptive mechanics under deformation. Designing such features requirescontrolling stress-transmission through the complex structure of the gel and this is challengingbecause the link between local restructuring and overall response of the network is still missing.Here, we use a space resolved analysis of dynamical processes and numerical simulations of a modelgel to gain insight into this link. We show that consequences of local bond-breaking propagatealong the gel network over distances larger than the average mesh size. This provides the missingmicroscopic explanation for why non-local constitutive relations are necessary to rationalize thenon-trivial mechanical response of colloidal gels.
Colloidal suspensions can solidify even if very diluted,because short-range interactions make particles aggre-gate into thin stress-bearing structures [1, 2]. As forother network-forming soft materials, including manywith important biological functions or technological po-tential [3, 4], there is still very limited understanding ofhow local restructuring processes ultimately affect thetransmission of stress through the complex microstruc-ture of the network, where weakly connected or soft re-gions may coexist with stiffer domains. Experiments sug-gest that cooperative dynamical processes are responsiblefor the complex mechanics of gels, which combines bothliquid-like and solid-like features and can only be ratio-nalized by non-local constitutive relations [5–7], howevera microscopic explanation for this behavior is fundamen-tally lacking. Here we provide such microscopic insightby showing that the breaking of single bonds in the gelnetwork has consequences over large distances, in termsof cooperative particle rearrangements. We do this bystudying model restructuring gel networks, via numericalsimulations, together with a new space-resolved analysisof dynamical processes.Experiments revealed that the particle coordination
in colloidal gels can be very low (2 to 3) [8] andthat the bonds between particles can support significanttorques [9], thus imparting local rigidity. Hence we con-sider a minimal colloidal model with anisotropic interac-tions that stabilize open particle networks at low volumefraction [10–12]. For a microscopic particle configuration{ri} the interaction energy is:
U({ri}) = ǫ
∑
i>j
U2(rij/σ) +∑
i
j,k 6=i∑
j>k
U3(rij/σ, rik/σ)
,
where rij is the vector connecting particles i and j. U2
includes a repulsive core and a narrow attractive well,whereas U3 imposes an angular rigidity [13]. The pa-rameters σ and ǫ define respectively the units of length(equal to the particle diameter) and energy: typical val-
0.1 1.0 10.0
q
1.0
S(q)
al l
nodes
Figure 1. Microstructure of the gel for ρ = 0.15 and ǫ =20 kBT . The static structure factor of the whole system (fullline), and of the nodes only (dashed line) are depicted. Inset:real-space image of a section.
ues for a colloidal system are σ = 10 − 100 nm andǫ = 1 − 100 kBT , kB being Boltzmann constant andT room temperature [1, 14, 15]. The unit of time is√
mσ2/ǫ, m being the particle mass. We perform molec-ular dynamics simulations [16] of systems with N = 4000to 16384 particles at number density ρ = 0.15, i.e., an ap-proximate volume fraction φ ≃ 0.075, with an interactionstrength ǫ = 20 kBT such that the particles self-assembleinto a persistent spanning network. Although very di-lute, this model gel responds as a solid under mechanicalloading, with a finite elastic modulus [17]. The staticstructure factor S(q) = 1
N
∑
j,k exp[−iq · (rj − rk)] inFig. 1 quantifies spatial correlations between particle po-sitions over distances ≃ 2π/q (where q is in units of σ−1),regardless of whether they are connected or not throughthe network. This simple model gel is made of chainslinked by three-coordinated junctions or nodes, with atypical mesh size l∗ ≃ 3-4σ. S(q) indicates the bonded
particles (qb ≃ 8 corresponds to distances of the order ofthe typical bond length) and the particles separated bydistances ≃ l∗ (q∗ ≃ 2). The contribution to S(q) of thenetwork nodes alone (Fig. 1) indicates long range cor-relations throughout the network structure (low q) andthe presence of clusters of nearby nodes (peak at qb),suggesting that these are unevenly distributed in space.We measure the density of nodes cl0i in the local environ-ment around particle i by counting their number within adistance l0 corresponding to 5 bonds along the network.Its spatial distribution is indeed highly inhomogeneous,ranging from 0 in loosely connected regions to ≈ 20 instrongly connected ones.
The network restructures because thermal fluctuationsfavor breaking of existing bonds and formation of newones. The fractions of two- and three- coordinated par-ticles fluctuate about a value that is constant over oursimulation time window, and that we use to define thetopology of the network. To identify the contribution ofthe restructuring processes to the dynamical propertiesof the gel, we compare the restructuring networks to non-restructuring ones, by turning on a barrier in the inter-action potential that prevents bonds from breaking [18].
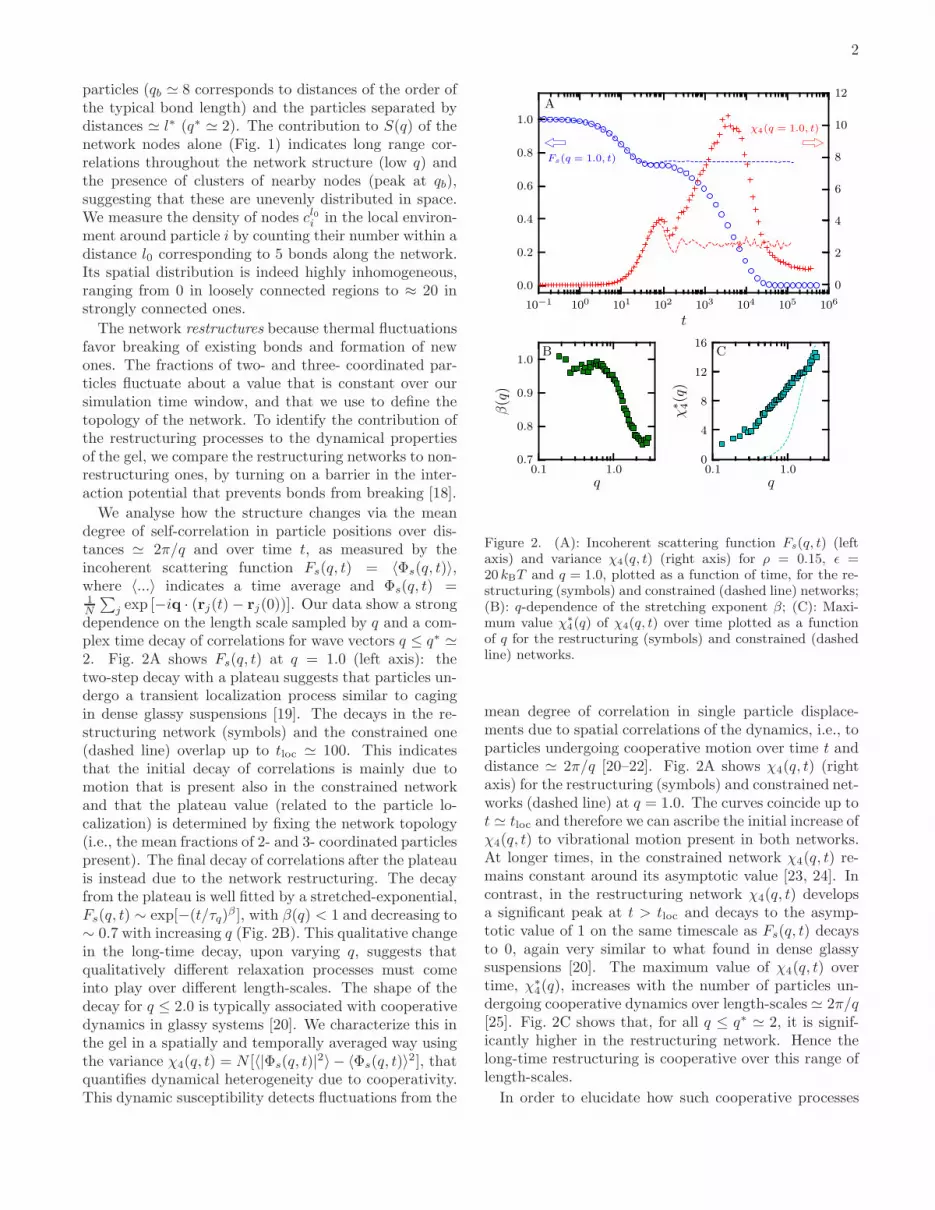
We analyse how the structure changes via the meandegree of self-correlation in particle positions over dis-tances ≃ 2π/q and over time t, as measured by theincoherent scattering function Fs(q, t) = 〈Φs(q, t)〉,where 〈...〉 indicates a time average and Φs(q, t) =1
N
∑
j exp [−iq · (rj(t)− rj(0))]. Our data show a strongdependence on the length scale sampled by q and a com-plex time decay of correlations for wave vectors q ≤ q∗ ≃2. Fig. 2A shows Fs(q, t) at q = 1.0 (left axis): thetwo-step decay with a plateau suggests that particles un-dergo a transient localization process similar to cagingin dense glassy suspensions [19]. The decays in the re-structuring network (symbols) and the constrained one(dashed line) overlap up to tloc ≃ 100. This indicatesthat the initial decay of correlations is mainly due tomotion that is present also in the constrained networkand that the plateau value (related to the particle lo-calization) is determined by fixing the network topology(i.e., the mean fractions of 2- and 3- coordinated particlespresent). The final decay of correlations after the plateauis instead due to the network restructuring. The decayfrom the plateau is well fitted by a stretched-exponential,Fs(q, t) ∼ exp[−(t/τq)
β ], with β(q) < 1 and decreasing to∼ 0.7 with increasing q (Fig. 2B). This qualitative changein the long-time decay, upon varying q, suggests thatqualitatively different relaxation processes must comeinto play over different length-scales. The shape of thedecay for q ≤ 2.0 is typically associated with cooperativedynamics in glassy systems [20]. We characterize this inthe gel in a spatially and temporally averaged way usingthe variance χ4(q, t) = N [〈|Φs(q, t)|
2〉 − 〈Φs(q, t)〉2], that
quantifies dynamical heterogeneity due to cooperativity.This dynamic susceptibility detects fluctuations from the
10−1 100
101
102 103
104 105 106
t
0.0
0.2
0.4
0.6
0.8
1.0
A
Fs(q = 1.0, t)
χ4(q = 1.0, t)
0.1 1.0
q
0.7
0.8
0.9
1.0
β(q)
B
0.1 1.0
q
0
4
8
12
16
χ∗ 4(q)
C
0
2
4
6
8
10
12
Figure 2. (A): Incoherent scattering function Fs(q, t) (leftaxis) and variance χ4(q, t) (right axis) for ρ = 0.15, ǫ =20 kBT and q = 1.0, plotted as a function of time, for the re-structuring (symbols) and constrained (dashed line) networks;(B): q-dependence of the stretching exponent β; (C): Maxi-mum value χ∗
4(q) of χ4(q, t) over time plotted as a functionof q for the restructuring (symbols) and constrained (dashedline) networks.
mean degree of correlation in single particle displace-ments due to spatial correlations of the dynamics, i.e., toparticles undergoing cooperative motion over time t anddistance ≃ 2π/q [20–22]. Fig. 2A shows χ4(q, t) (rightaxis) for the restructuring (symbols) and constrained net-works (dashed line) at q = 1.0. The curves coincide up tot ≃ tloc and therefore we can ascribe the initial increase ofχ4(q, t) to vibrational motion present in both networks.At longer times, in the constrained network χ4(q, t) re-mains constant around its asymptotic value [23, 24]. Incontrast, in the restructuring network χ4(q, t) developsa significant peak at t > tloc and decays to the asymp-totic value of 1 on the same timescale as Fs(q, t) decaysto 0, again very similar to what found in dense glassysuspensions [20]. The maximum value of χ4(q, t) overtime, χ∗
4(q), increases with the number of particles un-dergoing cooperative dynamics over length-scales ≃ 2π/q[25]. Fig. 2C shows that, for all q ≤ q∗ ≃ 2, it is signif-icantly higher in the restructuring network. Hence thelong-time restructuring is cooperative over this range oflength-scales.
In order to elucidate how such cooperative processes
3
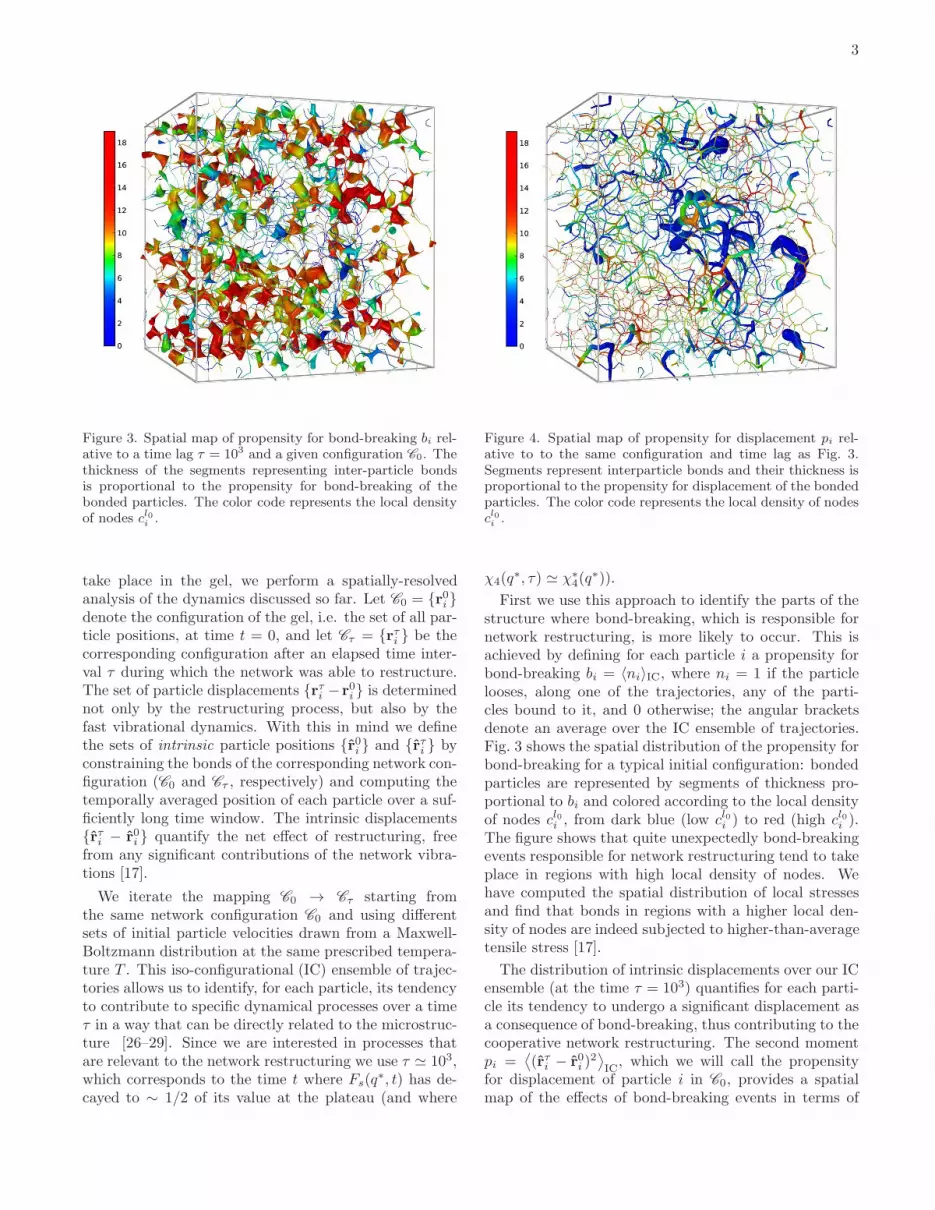
Figure 3. Spatial map of propensity for bond-breaking bi rel-ative to a time lag τ = 103 and a given configuration C0. Thethickness of the segments representing inter-particle bondsis proportional to the propensity for bond-breaking of thebonded particles. The color code represents the local densityof nodes cl0i .
take place in the gel, we perform a spatially-resolvedanalysis of the dynamics discussed so far. Let C0 = {r0i }denote the configuration of the gel, i.e. the set of all par-ticle positions, at time t = 0, and let Cτ = {rτi } be thecorresponding configuration after an elapsed time inter-val τ during which the network was able to restructure.The set of particle displacements {rτi −r0i } is determinednot only by the restructuring process, but also by thefast vibrational dynamics. With this in mind we definethe sets of intrinsic particle positions {r0i } and {rτi } byconstraining the bonds of the corresponding network con-figuration (C0 and Cτ , respectively) and computing thetemporally averaged position of each particle over a suf-ficiently long time window. The intrinsic displacements{rτi − r0i } quantify the net effect of restructuring, freefrom any significant contributions of the network vibra-tions [17].
We iterate the mapping C0 → Cτ starting fromthe same network configuration C0 and using differentsets of initial particle velocities drawn from a Maxwell-Boltzmann distribution at the same prescribed tempera-ture T . This iso-configurational (IC) ensemble of trajec-tories allows us to identify, for each particle, its tendencyto contribute to specific dynamical processes over a timeτ in a way that can be directly related to the microstruc-ture [26–29]. Since we are interested in processes thatare relevant to the network restructuring we use τ ≃ 103,which corresponds to the time t where Fs(q
∗, t) has de-cayed to ∼ 1/2 of its value at the plateau (and where
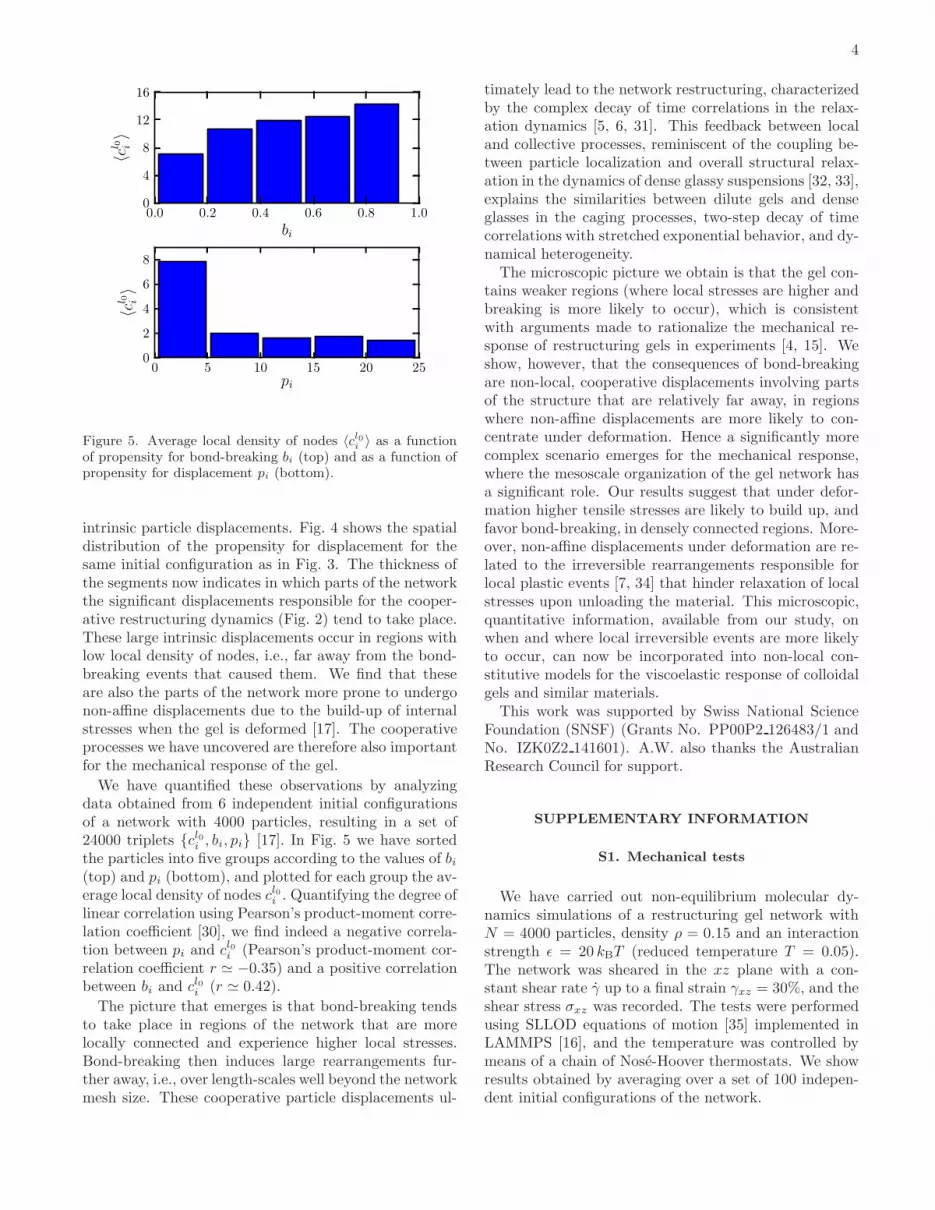
Figure 4. Spatial map of propensity for displacement pi rel-ative to to the same configuration and time lag as Fig. 3.Segments represent interparticle bonds and their thickness isproportional to the propensity for displacement of the bondedparticles. The color code represents the local density of nodescl0i .
χ4(q∗, τ) ≃ χ∗
4(q∗)).
First we use this approach to identify the parts of thestructure where bond-breaking, which is responsible fornetwork restructuring, is more likely to occur. This isachieved by defining for each particle i a propensity forbond-breaking bi = 〈ni〉IC, where ni = 1 if the particlelooses, along one of the trajectories, any of the parti-cles bound to it, and 0 otherwise; the angular bracketsdenote an average over the IC ensemble of trajectories.Fig. 3 shows the spatial distribution of the propensity forbond-breaking for a typical initial configuration: bondedparticles are represented by segments of thickness pro-portional to bi and colored according to the local densityof nodes cl0i , from dark blue (low cl0i ) to red (high cl0i ).The figure shows that quite unexpectedly bond-breakingevents responsible for network restructuring tend to takeplace in regions with high local density of nodes. Wehave computed the spatial distribution of local stressesand find that bonds in regions with a higher local den-sity of nodes are indeed subjected to higher-than-averagetensile stress [17].
The distribution of intrinsic displacements over our ICensemble (at the time τ = 103) quantifies for each parti-cle its tendency to undergo a significant displacement asa consequence of bond-breaking, thus contributing to thecooperative network restructuring. The second momentpi =
⟨
(rτi − r0i )2⟩
IC, which we will call the propensity
for displacement of particle i in C0, provides a spatialmap of the effects of bond-breaking events in terms of
4
0.0 0.2 0.4 0.6 0.8 1.0
bi
0
4
8
12
16
〈cl 0 i〉
0 5 10 15 20 25
pi
0
2
4
6
8
〈cl 0 i〉
Figure 5. Average local density of nodes 〈cl0i 〉 as a functionof propensity for bond-breaking bi (top) and as a function ofpropensity for displacement pi (bottom).
intrinsic particle displacements. Fig. 4 shows the spatialdistribution of the propensity for displacement for thesame initial configuration as in Fig. 3. The thickness ofthe segments now indicates in which parts of the networkthe significant displacements responsible for the cooper-ative restructuring dynamics (Fig. 2) tend to take place.These large intrinsic displacements occur in regions withlow local density of nodes, i.e., far away from the bond-breaking events that caused them. We find that theseare also the parts of the network more prone to undergonon-affine displacements due to the build-up of internalstresses when the gel is deformed [17]. The cooperativeprocesses we have uncovered are therefore also importantfor the mechanical response of the gel.
We have quantified these observations by analyzingdata obtained from 6 independent initial configurationsof a network with 4000 particles, resulting in a set of24000 triplets {cl0i , bi, pi} [17]. In Fig. 5 we have sortedthe particles into five groups according to the values of bi(top) and pi (bottom), and plotted for each group the av-erage local density of nodes cl0i . Quantifying the degree oflinear correlation using Pearson’s product-moment corre-lation coefficient [30], we find indeed a negative correla-tion between pi and cl0i (Pearson’s product-moment cor-relation coefficient r ≃ −0.35) and a positive correlationbetween bi and cl0i (r ≃ 0.42).
The picture that emerges is that bond-breaking tendsto take place in regions of the network that are morelocally connected and experience higher local stresses.Bond-breaking then induces large rearrangements fur-ther away, i.e., over length-scales well beyond the networkmesh size. These cooperative particle displacements ul-
timately lead to the network restructuring, characterizedby the complex decay of time correlations in the relax-ation dynamics [5, 6, 31]. This feedback between localand collective processes, reminiscent of the coupling be-tween particle localization and overall structural relax-ation in the dynamics of dense glassy suspensions [32, 33],explains the similarities between dilute gels and denseglasses in the caging processes, two-step decay of timecorrelations with stretched exponential behavior, and dy-namical heterogeneity.The microscopic picture we obtain is that the gel con-
tains weaker regions (where local stresses are higher andbreaking is more likely to occur), which is consistentwith arguments made to rationalize the mechanical re-sponse of restructuring gels in experiments [4, 15]. Weshow, however, that the consequences of bond-breakingare non-local, cooperative displacements involving partsof the structure that are relatively far away, in regionswhere non-affine displacements are more likely to con-centrate under deformation. Hence a significantly morecomplex scenario emerges for the mechanical response,where the mesoscale organization of the gel network hasa significant role. Our results suggest that under defor-mation higher tensile stresses are likely to build up, andfavor bond-breaking, in densely connected regions. More-over, non-affine displacements under deformation are re-lated to the irreversible rearrangements responsible forlocal plastic events [7, 34] that hinder relaxation of localstresses upon unloading the material. This microscopic,quantitative information, available from our study, onwhen and where local irreversible events are more likelyto occur, can now be incorporated into non-local con-stitutive models for the viscoelastic response of colloidalgels and similar materials.This work was supported by Swiss National Science
Foundation (SNSF) (Grants No. PP00P2 126483/1 andNo. IZK0Z2 141601). A.W. also thanks the AustralianResearch Council for support.
SUPPLEMENTARY INFORMATION
S1. Mechanical tests
We have carried out non-equilibrium molecular dy-namics simulations of a restructuring gel network withN = 4000 particles, density ρ = 0.15 and an interactionstrength ǫ = 20 kBT (reduced temperature T = 0.05).The network was sheared in the xz plane with a con-stant shear rate γ up to a final strain γxz = 30%, and theshear stress σxz was recorded. The tests were performedusing SLLOD equations of motion [35] implemented inLAMMPS [16], and the temperature was controlled bymeans of a chain of Nose-Hoover thermostats. We showresults obtained by averaging over a set of 100 indepen-dent initial configurations of the network.
5
0 5 10 15 20 25 30
γxz[%]
−1
0
1
2
3
4
5
6
7σxz·103
10−5
10−4
10−3
γ
0.0
0.2
0.4
0.6
0.8
1.0
1.2
1.4
G·102
Figure S1. Main plot: shear stress σxz as a function of shearstrain γxz for different values of the shear rate γ (from top tobottom: 2 · 10−3, 10−3, 5 · 10−4, 2 · 10−4, 10−4, 5 · 10−5, 2 ·10−5, 10−5). Inset: shear modulus as a function of shear rate,obtained by fitting a linear function to the stress-strain curvesin the region of small deformation 0 ≤ γxz ≤ 5% (circles);shear modulus of the non-restructuring network (triangles).
The stress-strain curves corresponding to a set of shearrates spanning more than two orders of magnitude – from10−5 to 2 · 10−3 – are presented in Fig. S1. Although forlarge deformations the response of the network dependsmarkedly on the shear rate, there exists a linear elasticregime extending approximately up to γxz ≈ 5% fromwhich we can extract a small, but finite shear modu-lus G ≈ 0.01 ǫ/σ3 for γ ≥ 5 · 10−5 (blue circles in thefigure inset). Hence our gel network has a solid-like elas-tic response at relatively low shear rate. In a typicalcolloidal system characterized by ǫ = 50 kBT , σ = 100nm, this corresponds to a shear modulus G ≈ 2 Pa,which is consistent with what measured in experimentson dilute colloidal gel networks [1, 14]. For even lowershear rates the modulus drops towards zero, presumablydue to thermally activated restructuring of the network.This hypothesis is supported by the comparison with anon-restructuring network, whose shear modulus is ap-proximately constant over the whole range of shear ratesinvestigated (green triangles in the figure inset).
S2. On the propensity for displacement
The iso-configurational analysis was originally intro-duced for dense glassy alloys [26] and needs to be modi-fied for low-density materials. In our low density gel net-work the amplitude of particle vibrations at fixed inter-particle bonds is far bigger than the amplitude of cagerattling in a typical dense system. In order to studynetwork relaxation one needs a way to filter out thesevibrations from the underlying displacements due to re-
Figure S2. Spatial map of propensity for non-vibrational dis-placement for the same initial configuration as Figs. 3 and 4 ofthe main text, but where the bonds have been constrained tonot break. Segments represent interparticle bonds and theirthickness is proportional to the propensity for displacementof the bonded particles; the scale is the same as in Fig. 4 ofthe main text. The color code represents the local density ofnodes.
structuring. As described in the main text, we have ac-complished this task by associating to any given networkconfiguration an intrinsic configuration, that we com-pute by constraining the inter-particle bonds and evalu-ating the average position of each particle during a sim-ulation at constant temperature. Since bond-breakingcannot take place, the time evolution samples the vibra-tional dynamics of the given configuration. We computethe intrinsic positions by averaging over a time window∆tav = 2.5 · 104 in reduced units, which is sufficientlylong for most structural correlations to decay to zero inthe unconstrained system.
As a demonstration that this approach is able to fil-ter out most of the displacements that are not due tonetwork restructuring, we show in Fig. S2 the resultof the iso-configurational analysis performed on a non-
restructuring network. The network configuration is thesame as the one shown in Figs. 3 and 4 of the main text,and the time lag for the isoconfigurational trajectories islikewise τ = 103. Ideally, one would expect each particleto display zero propensity for displacement. In practice, asubset of the particles show a small but non-zero propen-sity: this is due to very slow network rearrangements thatdo not entail breaking of existing bonds or formation ofnew bonds, but still affect the average position of some ofthe particles. For instance, a chain initially confined to aregion of space by the surrounding chains can break freeof its cage and start to oscillate in a different region: thiswould affect the average position of the particles in thechain, even though no restructuring – that is no change of
6
inter-particle bonds – has taken place. The contributionof processes of this latter kind to the propensity, how-ever, are very small compared to the displacements dueto restructuring. By comparing the propensity for dis-placement in the restructuring network, pi, to the samequantity evaluated in the constrained network, pci , onecan define a noise-to-signal ratio as
NSRp =1
N
N∑
i=1
pcipi
.
For the configuration shown in Fig. S2 the NSRp < 1%,i.e. the displacements not directly ascribable to networkrestructuring contribute on average less than 1% of thetotal per-particle signal.
S3. Correlation between propensities and local
density of nodes
In performing the iso-configurational analysis we haveconsidered six independent configurations of a networkwith N = 4000 particles; for each configuration, an en-semble of 100 trajectories has been generated. This al-lowed us to associate to each particle i a local density ofnodes cl0i – a topological attribute of the particle in theinitial configuration – as well as the propensities for non-vibrational displacement (pi) and bond breaking (bi),which are dynamical properties calculated by averagingover the ensemble of trajectories. In this way we gathereda set of 24000 triplets {cl0i , pi, bi}. The raw scatter plots
cl0i vs. pi and cl0i vs. bi are shown in Figs. S3 and S4, re-spectively. It is apparent that particles characterized bya high propensity for displacement tend to be in regionswith low density of nodes; in contrast, particles charac-terized by a high propensity for bond breaking tend tolocalize in regions with high density of nodes. What isalso apparent is that the inverse relationship does nothold, i.e. particles with low (high) cl0i often do not havehigh pi (bi). This indicates that the local particle envi-ronment is not the only structural property that affectswhere relaxation takes place.
S4. Stress distribution
Bond breaking happens preferentially in regions with ahigh density of nodes (i.e. crosslinks). In order to ascer-tain whether this is due to a concentration of stresses inthose regions, we have calculated the stress distributionin the gel.Local stresses are obtained by dividing the simulation
box into a set of nc cubic cells, {Cm}m=1...nc, and associ-
ating with each cell an average stress tensor σmαβ = 〈smαβ〉,
where smαβ is the instantaneous stress tensor correspond-ing to a specific particle configuration, and the angular
Figure S3. Scatter plot cl0i vs. pi.
Figure S4. Scatter plot cl0i vs. bi.
brackets denote a time average. The instantaneous stresstensor for each cell is computed according to the standardvirial formula [36] in the following way:
smαβ = −1
Vm
∑
i∈Cm
wiαβ , (1)
where Vm is the cell volume, the sum runs over the parti-cles contained in the cell, and wi
αβ represents the contri-bution to the stress tensor of the interactions involvingparticle i. The latter is defined by splitting the contribu-tion of each interaction evenly among the particles thatparticipate in it:
wiαβ =
1
2
N2∑
n=1
(riαFiβ + r′αF
′β)+
1
3
N3∑
n=1
(riαFiβ + r′αF
′β + r′′αF
′′β ) .
(2)
In the previous expression the first sum runs over the
7
−0.005 0.000 0.005 0.010 0.015σmαβ
0.01
0.02
0.03
0.04
0.05
0.06
0.07
0.08
0.09
ρm nodes
xxyyzz
xyxzyz
Figure S5. Scatter plot of the components of the local stresstensor σm
αβ vs. the local density of nodes ρmnodes.
N2 pair interactions that particle i is part of, ri and r′
are the positions of the two interacting particles, andFi and F′ are the forces on the two particles resultingfrom the interaction. Along the same lines the secondsum takes into account the N3 three-body interactionsinvolving particle i. [37]
We have applied the analysis just outlined to a gelnetwork with N = 16384 particles, density ρ = 0.15and interaction strength ǫ = 20 kBT (reduced temper-ature T = 0.05). The simulation box has been divided innc = 73 cells, so that each cell contains on average around50 particles. The time window for the temporal averag-ing has been chosen as ∆t = 250, which is long enough toaccount for the vibrational dynamics of the network, butyet short enough for the network structure not to be sig-nificantly perturbed by the restructuring process (duringthe prescribed time window less than 5% of the particleschange neighbors). For each cell we have also computedthe average number density of nodes ρm
nodes, a quantity
that measures the local concentration of crosslinks.
In Fig. S5 we show the scatter plot of the componentsof the local stress tensor vs. the local density of nodes.The shear components xy, xz and yz are on average zeroand do not show any particular correlation with the den-sity of nodes. On the contrary, the diagonal componentsxx, yy and zz are greater than zero and have a positivecorrelation with the density of nodes. This means thatthe cells are under isotropic tension, the tension beinggreater where the density of nodes is higher.
The same trend is evinced from Fig. S6, where thenorm of the local stress tensor is plotted vs. the localdensity of nodes. The positive correlation between thetwo quantities is assessed by a Pearson’s coefficient r =0.47.
0.000 0.005 0.010 0.015 0.020 0.025‖σmαβ ‖
0.01
0.02
0.03
0.04
0.05
0.06
0.07
0.08
0.09
ρm nodes
Figure S6. Scatter plot of the norm of the local stress tensor‖σm
αβ‖ vs. the local density of nodes ρmnodes.
1 2 3 4 5 6 7 8 9 10 11 12 13 14 15
nǫ [%]
−0.36
−0.34
−0.32
−0.30
−0.28
−0.26
−0.24
corr
ela
tion c
oeff
icie
nt
Figure S7. Pearson’s coefficient of correlation between thenorm of the non-affine displacements and the local density ofnodes, r({‖di‖}nε, c
l0i ), plotted as a function of the strain nε.
S5. Non-affine displacements
In order to understand which parts of the gel aremore prone to displacement as a consequence of internalstresses we have performed a quasi-equilibrium deforma-tion of the network at zero temperature and looked atthe non-affine displacement field. The procedure is asfollows.A configuration of the network at finite temperature C0
is first relaxed to the closest minimum in the potential en-ergy landscape C0, i.e. the closest “inherent structure”,by slowly draining energy from the system by means ofa fictitious frictional force proportional to the particles’velocity added on top of the usual interaction. We findthis procedure more effective than a direct energy mini-mization, probably owing to the floppiness of the network
8
translating into large nearly flat regions in the potentiallandscape. Denoting with M the relaxation procedure,we can formally write C0 = MC0.We then apply a small, instantaneous, homogeneous
shear deformation Tε to the simulation box, obtainingthe configuration C1 = TεC0. Finally, we relax the con-figuration to the nearest inherent structure, obtainingC1 = MC1. The non-affine displacement field inducedby the shear strain ε is defined as {di}ε = C1 − C1 =MTεC0 − TεC0, where the difference between configu-rations is to be understood as the set of differences ofthe positions of corresponding particles. This basic stepcan be iterated any number of times to obtain the non-affine displacement field corresponding to a strain nε:{di}nε = (MTε)
nC0 − Tnε C0.
We have performed the analysis on six independent gelconfigurations with N = 4000 particles, deforming withsteps of ε = 1% strain, up to a final strain nε = 15%.The configurations are the same as the ones used for theiso-configurational analysis. We quantify the correlationbetween the magnitude of the non-affine displacementsand the local density of crosslinks by means of Pearson’scoefficient of correlation r({‖di‖}nε; c
l0i ). The correlation
coefficients corresponding to different strains are plottedin Fig. S7. We find a consistent negative correlation,meaning that the larger non-affine displacements happenpreferentially in regions with low density of crosslinks.
[1] V. Trappe, V. Prasad, L. Cipelletti, P. Segre, andD. Weitz, Nature 411, 772 (2001).
[2] P. J. Lu, E. Zaccarelli, F. Ciulla, A. B. Schofield,F. Sciortino, and D. A. Weitz, Nature 453, 499 (2008).
[3] O. Lieleg, J. Kayser, G. Brambilla, L. Cipelletti, andA. R. Bausch, Nature Materials 10, 236 (2011).
[4] C. Yan, A. Altunbas, T. Yucel, R. P. Nagarkar, J. P.Schneider, and D. J. Pochan, Soft Matter 6, 5143 (2010).
[5] A. Duri, D. A. Sessoms, V. Trappe, and L. Cipelletti,Phys. Rev. Lett. 102, 085702 (2009).
[6] S. Maccarrone, G. Brambilla, O. Pravaz, A. Duri, M. Ci-ccotti, J. M. Fromental, E. Pashkovski, A. Lips, D. Ses-soms, V. Trappe, and L. Cipelletti, Soft Matter 6, 5514(2010).
[7] J. Goyon, A. Colin, G. Ovarlez, A. Ajdari, and L. Boc-quet, Nature 454, 84 (2008).
[8] C. J. Dibble, M. Kogan, and M. J. Solomon, Phys. Rev.E 77, 050401 (2008).
[9] J. Pantina and E. Furst, Phys. Rev. Lett. 94, 138301(2005).
[10] E. Del Gado and W. Kob, Phys. Rev. Lett. 98, 28303(2007).
[11] S. Saw, N. Ellegaard, W. Kob, and S. Sastry, Phys. Rev.Lett. 103, 248305 (2009).
[12] M. A. Miller, R. Blaak, C. N. Lumb, and J.-P. Hansen, J.Chem. Phys. 130, 114507 (2009); B. Capone, I. Coluzza,F. LoVerso, C. N. Likos, and R. Blaak, Phys. Rev. Lett.
109, 238301 (2012); F. Sciortino and E. Zaccarelli, Curr.Opin. Solid State Mater. Sci. 15, 246 (2011).
[13] The two- and three-body terms in the interaction po-tential correspond to U2(r) = A
(
a r−18 − r−16)
and
U3(r, r′) = B Λ(r)Λ(r′) exp
[
−(
r·r′
rr′− cos θ
)2
/w2
]
, re-
spectively. The factor Λ(r) = r−10[
1− (r/2)10]2
H(2 −r), H being the unit step function, ensures that onlytriplets of neighbors contribute to the energy. Here weconsider A = 6.27, a = 0.85, B = 67.27, θ = 65◦, w =0.30.
[14] V. Prasad, V. Trappe, A. D. Dinsmore, P. N. Segre,L. Cipelletti, and D. A. Weitz, Faraday Discuss. 123,1 (2003).
[15] M. Laurati, S. Egelhaaf, and G. Petekidis, J. Rheol. 55,673 (2011).
[16] S. Plimpton, J. Comp. Phys. 117, 1 (1995).[17] See Supplementary Information.[18] The barrier has the form Uc
2 (rij/σ) =C exp
[
−(rij/σ − γ)2/δ2]
, with C = 10.0, γ = 1.2and δ = 0.01.
[19] W. Gotze, International Series of Monographs on Physics143 (2009).
[20] L. Berthier, G. Biroli, J.-P. Bouchaud, L. Cipelletti, andW. Van Saarloos, International Series of Monographs onPhysics (2011).
[21] C. Donati, S. Franz, S. Glotzer, and G. Parisi, Journalof Non-Crystalline Solids 307, 215 (2002).
[22] N. Lacevic, F. Starr, T. Schroeder, and S. Glotzer, Jour-nal of Chemical Physics 119, 7372 (2003).
[23] T. Abete, A. de Candia, E. Del Gado, A. Fierro, andA. Coniglio, Phys. Rev. E 78, 041404 (2008).
[24] A. Fierro, E. Del Gado, A. de Candia, and A. Coniglio,J. Stat. Mech. , L04002 (2008).
[25] L. Berthier, G. Biroli, J.-P. Bouchaud, W. Kob,K. Miyazaki, and D. Reichmann, J. Chem. Phys. 126,184503 (2007).
[26] A. Widmer-Cooper, P. Harrowell, and H. Fynewever,Phys. Rev. Lett. 93, 135701 (2004).
[27] A. Widmer-Cooper and P. Harrowell, J. Chem. Phys.126, 154503 (2007).
[28] A. Widmer-Cooper, H. Perry, P. Harrowell, and D. Re-ichman, Nature Physics 4, 711 (2008).
[29] A. Widmer-Cooper, H. Perry, P. Harrowell, and D. R.Reichman, J. Chem. Phys. 131, 194508 (2009).
[30] J. L. Rodgers and W. A. Nicewander, The AmericanStatistician 42, 59 (1988).
[31] A. Duri and L. Cipelletti, Europhys. Lett. 76, 972 (2006).[32] R. Candelier, A. Widmer-Cooper, J. K. Kummerfeld,
O. Dauchot, G. Biroli, P. Harrowell, and D. R. Reich-man, Phys. Rev. Lett. 105, 135702 (2010).
[33] C. De Michele, E. Del Gado, and D. Leporini, Soft Mat-ter 7, 4025 (2011).
[34] A. Lemaıtre and C. Caroli, Phys. Rev. E 76, 036104(2007).
[35] D. Evans and G. Morriss, Statistical Mechanics of
Nonequilibrium Liquids (ANU E Press, 2007).[36] A. P. Thompson, S. J. Plimpton, and W. Mattson, J.
Chem. Phys. 131, 154107 (2009).[37] The “particle stress” wi