Thermography pattern analysis and separation Bin Gao, Libing Bai, W. L. Woo, and Guiyun Tian Citation: Applied Physics Letters 104, 251902 (2014); doi: 10.1063/1.4884644 View online: http://dx.doi.org/10.1063/1.4884644 View Table of Contents: http://scitation.aip.org/content/aip/journal/apl/104/25?ver=pdfcov Published by the AIP Publishing Articles you may be interested in Eddy current step heating thermography for quantitatively evaluation Appl. Phys. Lett. 103, 194101 (2013); 10.1063/1.4828889 Defect characterization by inductive heated thermography AIP Conf. Proc. 1430, 483 (2012); 10.1063/1.4716266 An Experimental Study of Defect Determination using Pulsed Thermal NonDestructive Testing AIP Conf. Proc. 1017, 215 (2008); 10.1063/1.2940630 TONE BURST EDDYCURRENT THERMOGRAPHY (TBET) AIP Conf. Proc. 975, 544 (2008); 10.1063/1.2902708 Integrated active transient thermography for rapid nondestructive analysis of sputtering target bond integrity J. Vac. Sci. Technol. A 24, 1100 (2006); 10.1116/1.2210950 This article is copyrighted as indicated in the article. Reuse of AIP content is subject to the terms at: http://scitation.aip.org/termsconditions. Downloaded to IP: 125.71.229.163 On: Tue, 24 Jun 2014 02:02:54
Transcript
Thermography pattern analysis and separationBin Gao, Libing Bai, W. L. Woo, and Guiyun Tian
Citation: Applied Physics Letters 104, 251902 (2014); doi: 10.1063/1.4884644 View online: http://dx.doi.org/10.1063/1.4884644 View Table of Contents: http://scitation.aip.org/content/aip/journal/apl/104/25?ver=pdfcov Published by the AIP Publishing Articles you may be interested in Eddy current step heating thermography for quantitatively evaluation Appl. Phys. Lett. 103, 194101 (2013); 10.1063/1.4828889 Defect characterization by inductive heated thermography AIP Conf. Proc. 1430, 483 (2012); 10.1063/1.4716266 An Experimental Study of Defect Determination using Pulsed Thermal NonDestructive Testing AIP Conf. Proc. 1017, 215 (2008); 10.1063/1.2940630 TONE BURST EDDYCURRENT THERMOGRAPHY (TBET) AIP Conf. Proc. 975, 544 (2008); 10.1063/1.2902708 Integrated active transient thermography for rapid nondestructive analysis of sputtering target bond integrity J. Vac. Sci. Technol. A 24, 1100 (2006); 10.1116/1.2210950
This article is copyrighted as indicated in the article. Reuse of AIP content is subject to the terms at: http://scitation.aip.org/termsconditions. Downloaded to IP:
Bin Gao,1,a) Libing Bai,1 W. L. Woo,2 and Guiyun Tian2,1
1School of Automation Engineering, University of Electronic Science and Technology of China, Chengdu, China2School of Electrical and Electronic Engineering, Newcastle University, England, United Kingdom
(Received 11 May 2014; accepted 10 June 2014; published online 23 June 2014)
Analysis of thermography spatial-transient patterns has considerable potential to enable automatic
identification and quantification of defects in non-destructive testing and evaluation. This Letter
proposes a non-negative pattern separation model for eddy current pulsed thermography to
automatically extract important spatial and time patterns according to the transient thermal
sequences without any pre-training or prior knowledge. In particular, the method is scale-invariant,
such that large differences in surface emissivity, hot spots, and cool areas with dynamic range of
thermal contrast can be extracted. Finally, an artificial slot in a steel sample with shining, black
strip on the surface is tested to validate the proposed method. VC 2014 AIP Publishing LLC.
[http://dx.doi.org/10.1063/1.4884644]
Infrared thermography methods have reached a prominent
status as a non-destructive testing and evaluation (NDT&E)
method due to both ease and speed of inspection.1–4 The ther-
mography based defect detection methods still pose two chal-
lenges. First, the variation of surface emissivity introduces
spurious temperature inhomogeneity and can result in false
alarm of defect detection. Second, the need to cope with the
growing demands for advanced methods that enable automatic
identification of defects. To deal with above issues, Shepard5
proposed thermographic signal reconstruction (TSR) based on
flash thermography to reduce the influence of the thermal
emissivity. Maldague and Marinetti6 inhibited the influence of
thermal emissivity variation by using the pulse phase infrared
thermography method. Chatterjee and Tuli7 removed the influ-
ence of non-uniform heating and surface emissivity variation
using a Fourier transformation based image reconstruction
algorithm. In addition, algorithms based on Principal
Component Analysis (PCA) and Independent Component
Analysis (ICA)8,9 have been used to automatically detect
flaws. All the aforementioned methods, however, cannot effi-
ciently perform automatic defect identification and simultane-
ously overcome the problem of large dynamic differences in
emissivity. The obtained results are acceptable but generally
not predictable.
Eddy current pulsed thermography (ECPT)10 is an
emerging infrared thermography method for conductive ma-
terial. It has recently gaining popularity with an increasing
span of applications. Compared with other thermography
methods,11 the heat of ECPT is not limited to the sample sur-
face; rather it can penetrate a certain depth, which is gov-
erned by the skin depth of eddy current. Furthermore, ECPT
concentrates the heat on the defect due to eddy current dis-
tortion, which increases the temperature contrast between
the defective region and defect-free areas. In our previous
work,12,13 we have proposed a PCA/ICA source separation
algorithm on ECPT for automatic crack detection and identi-
fication. However, the method did not consider the interfer-
ence from surface emissivity. In addition, the previous
model cannot efficiently separate the thermal patterns which
have a large dynamic range of thermal contrast. In this paper,
we proposed a new separation method based on the smooth
This article is copyrighted as indicated in the article. Reuse of AIP content is subject to the terms at: http://scitation.aip.org/termsconditions. Downloaded to IP:
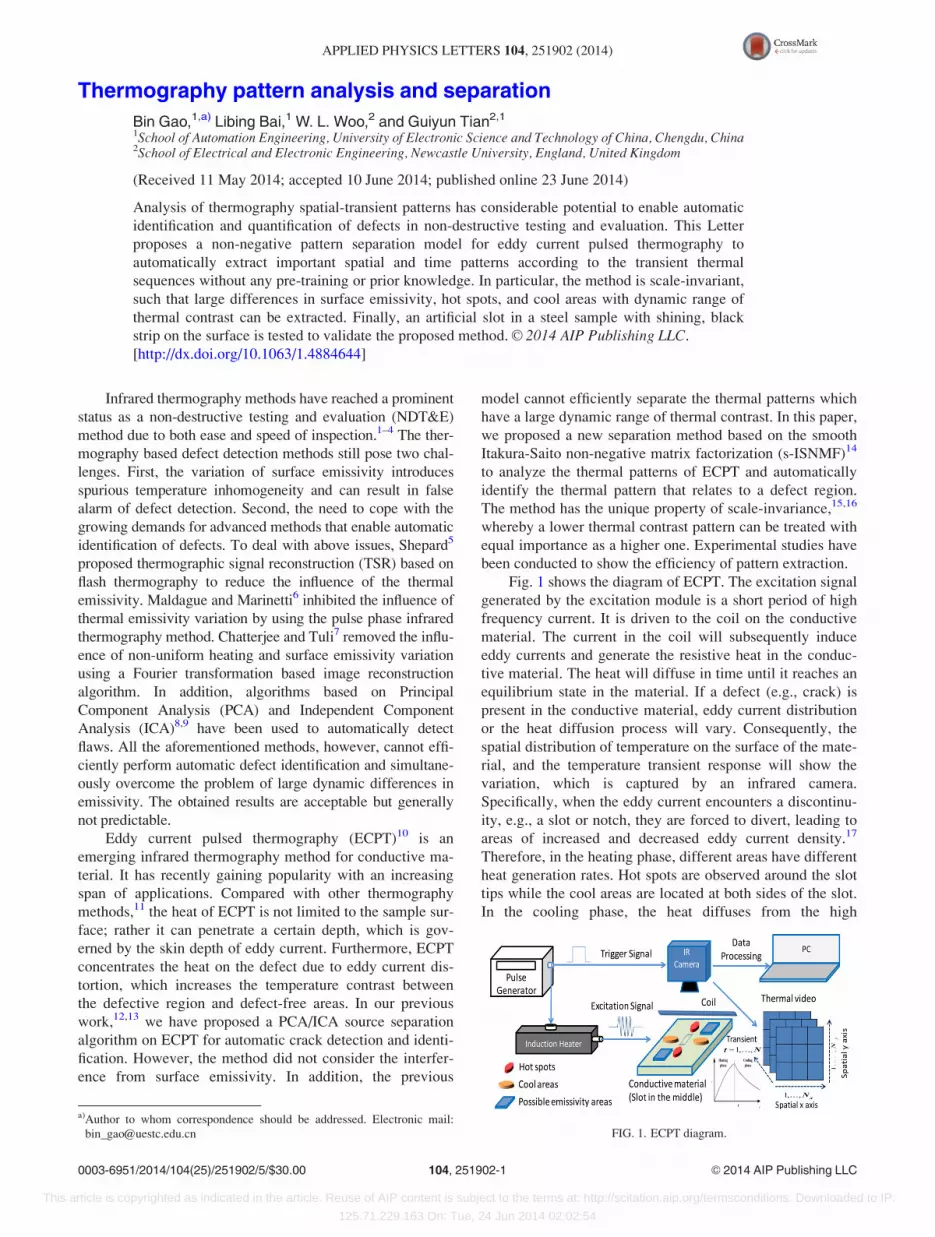
sient response for a point on the surface of material is shown
in Fig. 1. It can be divided into two phases: heating phase
and cooling phase.
The analysis of ECPT thermal patterns (hot spots, cool
area, emissivity, and so on) is very useful for automatic
defect detection and identification. As can be seen in Fig. 1,
the hot spot pattern directly reveals the location of slot and
can be used to quantify the size of the defect. However, dur-
ing the recording by the infrared camera, the different ther-
mal patterns at different rates are mixed together. There are
different thermal patterns which have resulted in different
spatial thermal distribution. On the other hand, there are dif-
ferent heating and cooling rates of the transient characteris-
tics. This is illustrated in Fig. 5. Therefore, the recorded
thermal sequences from the thermal camera can be modelled
as a composition of different thermal patterns. Thus, the
issue of how to automatically separate different thermal pat-
terns from the IR images poses a crucial challenge. The char-
acteristics of different thermal patterns are described as
follows: In terms of emissivity, according to Stefan-
Boltzmann law, the energy emitted by a black body per sec-
ond per unit of area is proportional to the fourth power of its
absolute temperature. This can be described as
j� ¼ rsbT4; (1)
where rsb¼ 5.67� 10� 8 W/(m2 � k4) is the Stefan-
Boltzmann constant and T is the absolute temperature. When
the temperature of the material changes slightly, the radia-
tion power will cause a large change. The radiance of the
actual object depends on the properties of the material and
the surface preparation besides the temperature. This differ-
ence can be described by the emissivity 0 � e � 1 which
denotes the ratio of radiation of actual object with respect to
the black body. Thus, the Stefan-Boltzmann law which is
applied to the actual object can be described as
j� ¼ ersbT4: (2)
In ECPT testing, the samples under test possibly have oil,
oxide, and other stains on the surface. Oil and oxide can
drastically increase the thermal radiation and results in
unwanted spurious high temperature in the infrared images.
In terms of the hot and cool areas, when the eddy current
encounters a discontinuity, e.g., a slot or notch, it is forced to
divert, leading to areas of increased and decreased eddy cur-
rent density and the resultant hot and cool areas due to Joule
heating. Therefore, the hot spots are observed around the slot
tips which can be used to locate as well as sizing the defect,
while the cool areas are located at both sides of the slot.
Once the test sample with mixture of areas with strong
emissivity gradient to another (e.g., black stains on the sur-
face) and defect (e.g., slot which consists of cool and hot
spots areas), the task of separating different thermal patterns
becomes a difficult challenge. Generally, the temperature of
hot spots is three times higher than the cool area. However,
the temperature of a black stain region can be as high as ten
times higher than at the cool area due to the high emissivity.
In this case, the hot spots around the slot tip cannot be
observed, and this directly reduces the probability of detect-
ing the defects.
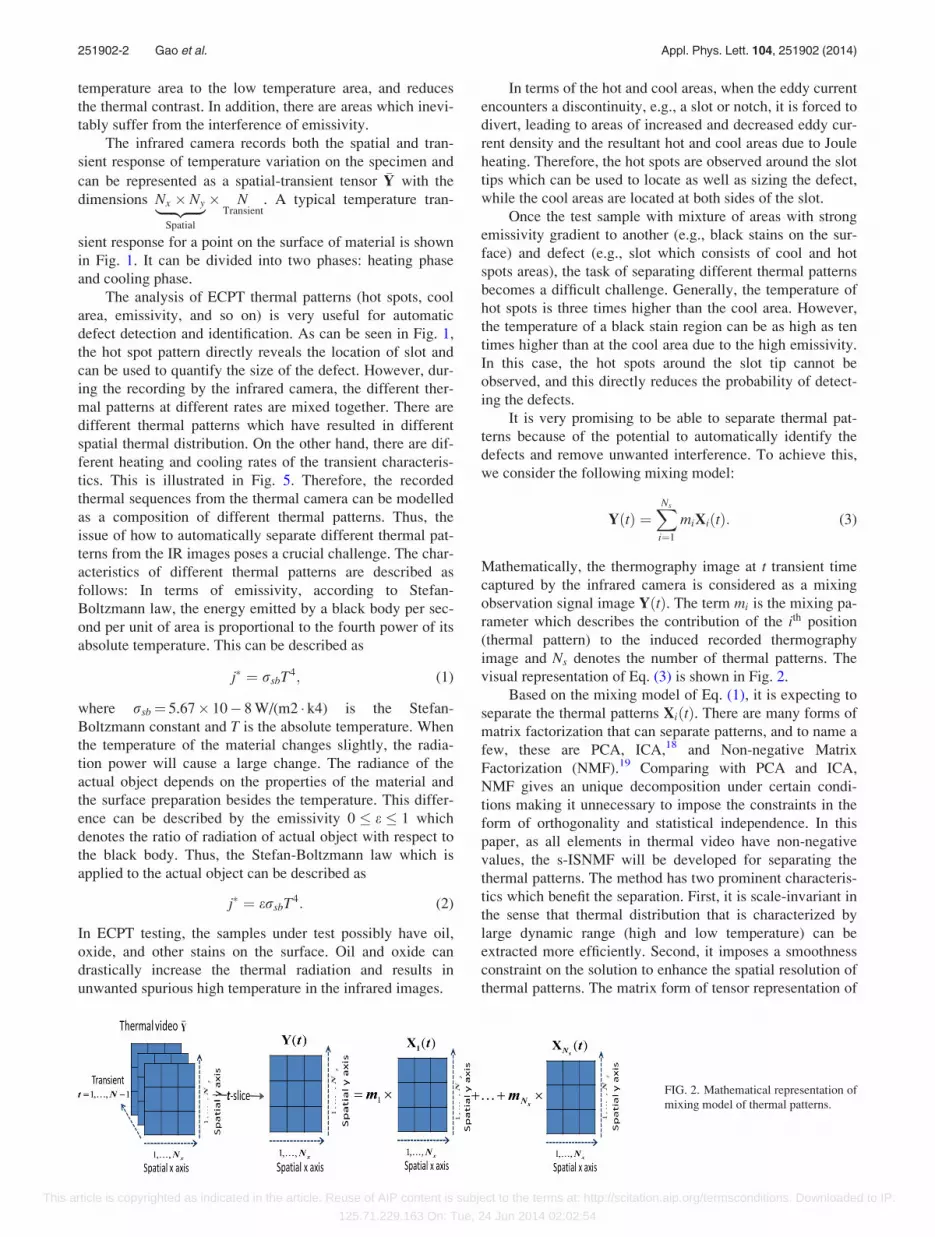
It is very promising to be able to separate thermal pat-
terns because of the potential to automatically identify the
defects and remove unwanted interference. To achieve this,
we consider the following mixing model:
YðtÞ ¼XNs
i¼1
miXiðtÞ: (3)
Mathematically, the thermography image at t transient time
captured by the infrared camera is considered as a mixing
observation signal image YðtÞ. The term mi is the mixing pa-
rameter which describes the contribution of the ith position
(thermal pattern) to the induced recorded thermography
image and Ns denotes the number of thermal patterns. The
visual representation of Eq. (3) is shown in Fig. 2.
Based on the mixing model of Eq. (1), it is expecting to
separate the thermal patterns XiðtÞ. There are many forms of
matrix factorization that can separate patterns, and to name a
few, these are PCA, ICA,18 and Non-negative Matrix
Factorization (NMF).19 Comparing with PCA and ICA,
NMF gives an unique decomposition under certain condi-
tions making it unnecessary to impose the constraints in the
form of orthogonality and statistical independence. In this
paper, as all elements in thermal video have non-negative
values, the s-ISNMF will be developed for separating the
thermal patterns. The method has two prominent characteris-
tics which benefit the separation. First, it is scale-invariant in
the sense that thermal distribution that is characterized by
large dynamic range (high and low temperature) can be
extracted more efficiently. Second, it imposes a smoothness
constraint on the solution to enhance the spatial resolution of
thermal patterns. The matrix form of tensor representation of
FIG. 2. Mathematical representation of
mixing model of thermal patterns.
251902-2 Gao et al. Appl. Phys. Lett. 104, 251902 (2014)
This article is copyrighted as indicated in the article. Reuse of AIP content is subject to the terms at: http://scitation.aip.org/termsconditions. Downloaded to IP:
125.71.229.163 On: Tue, 24 Jun 2014 02:02:54
�Y can be expressed as Y0 ¼ ½vecðYðtÞÞ; vecðYðtþ 1ÞÞ;…;vecðYðtþ N � 1ÞÞ�T, where “T” denotes the transpose oper-
ator and “vec” denotes the vectorization operator. The
specific steps of transformation procedure can be found in
Ref. 14. Thus, the NMF factorizes this matrix into a product
of two non-negative matrices as
Y0 ¼MX0 ; (4)
where M ¼ ½m1;…;mNs� represents the mixing matrix
and mi ¼ ½mi;1;…;mi;N�1�T is the ith mixing vector.
X0 ¼ ½x1; x2;…; xNs�T; where xi ¼ vecðXiÞ denotes the pat-
tern basis matrix and xi ¼ ½xi;1;…; xi;L�T and L ¼ Nx
�Ny � 1. The b-divergence was introduced in Ref. 14 which
is defined as
dbðajbÞ¼
1
bðb�1Þ abþðb�1Þbb�babb�1� �
b2< 0;1f g
a loga� logbð Þþ b�að Þ b¼ 1
a
b� log
a
b�1 b¼ 0
:
8>>>>>><>>>>>>:
(5)
The term b is defined as the divergence choice which has
been used for optimization of NMF. It is interesting to note
that for b ¼ 2, we obtain the Euclidean distance expressed
by Frobenius norm and, for b ¼ 1, the generalized Kullback-
Leibler (KL) divergence is defined. For b ¼ 0, this results in
the Itakura-Saito (IS) divergence.15 As noted by F�evotte,14 a
noteworthy property of the b-divergence is its behaviour
with respect to the scale, as the following equation holds for
any value of b:
dbðcajcbÞ ¼ cbdbðajbÞ: (6)
It implies that factorizations obtained with b > 0 (such as
with the Euclidean distance or the Kullback–Leibler diver-
gence) will rely more heavily on the predominant large value
data (i.e., these are the high power components). By the
same token, less precision is expected in the estimation of
the low-power components, i.e., dLSðcajcbÞ ¼ c2dLSðajbÞ and
dKLðcajcbÞ ¼ cdKLðajbÞ. For the case of b ¼ 0, this results
in the IS divergence which is scale-invariant, i.e., dISðcajcbÞ¼ dISðajbÞ and is the only one in the family of b-divergences
to possess this property. The IS divergence was mainly used
as a measure of the goodness of fit between two spectra.
Recently, IS divergence has received renewed interest in the
NMF. The IS divergence leads to desirable statistical inter-
pretations of the NMF problem. Most significantly, NMF
with IS divergence can provide scale invariant property
which enables low energy components of Y0 to bear the
same relative importance as high energy ones. This is rele-
vant to situations in which the coefficients of Y0 have a large
dynamic range such as thermal patterns which simultane-
ously consist of both extreme high and low temperature
region. The un-penalized IS divergence NMF algorithm is
based on surrogate auxiliary functions (local majorizations
of the cost function). The majorization-minimization (MM)
algorithm can be derived by optimizing these auxiliary func-
tions, which result in efficient multiplicative updates. The
monotonicity of the cost function can be proven by leverag-
ing on techniques in Ref. 14. The smoothness constraint is
encoded in the form of Markov chains, namely,
pðX0 Þ ¼YNs
i¼1
YL
l¼2
pðx0i;ljx0i;ðl�1ÞÞpðx0i;1Þ; (7)
where the Markov kernel pðx0i;ljx0i;ðl�1ÞÞ is a probability den-
sity function (pdf) defined on the non-negative orthant, with
mode at x0i;ðl�1Þ. The specific steps for S-ISNMF can be
found in Ref. 14, and Table I summarizes the thermal pattern
separation method.
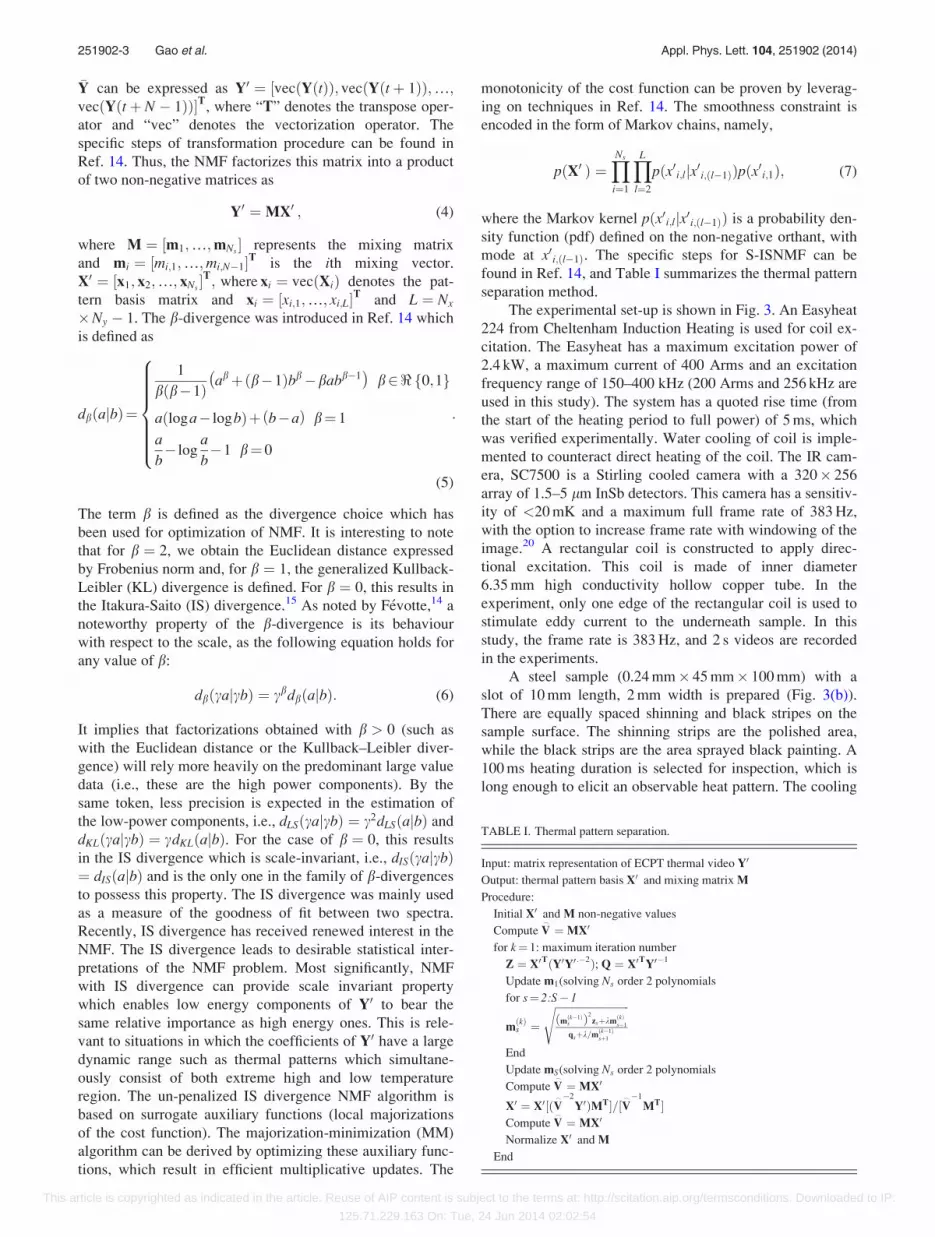
The experimental set-up is shown in Fig. 3. An Easyheat
224 from Cheltenham Induction Heating is used for coil ex-
citation. The Easyheat has a maximum excitation power of
2.4 kW, a maximum current of 400 Arms and an excitation
frequency range of 150–400 kHz (200 Arms and 256 kHz are
used in this study). The system has a quoted rise time (from
the start of the heating period to full power) of 5 ms, which
was verified experimentally. Water cooling of coil is imple-
mented to counteract direct heating of the coil. The IR cam-
era, SC7500 is a Stirling cooled camera with a 320� 256
array of 1.5–5 lm InSb detectors. This camera has a sensitiv-
ity of <20 mK and a maximum full frame rate of 383 Hz,
with the option to increase frame rate with windowing of the
image.20 A rectangular coil is constructed to apply direc-
tional excitation. This coil is made of inner diameter
6.35 mm high conductivity hollow copper tube. In the
experiment, only one edge of the rectangular coil is used to
stimulate eddy current to the underneath sample. In this
study, the frame rate is 383 Hz, and 2 s videos are recorded
in the experiments.
A steel sample (0.24 mm� 45 mm� 100 mm) with a
slot of 10 mm length, 2 mm width is prepared (Fig. 3(b)).
There are equally spaced shinning and black stripes on the
sample surface. The shinning strips are the polished area,
while the black strips are the area sprayed black painting. A
100 ms heating duration is selected for inspection, which is
long enough to elicit an observable heat pattern. The cooling
TABLE I. Thermal pattern separation.
Input: matrix representation of ECPT thermal video Y0
Output: thermal pattern basis X0 and mixing matrix M
251902-3 Gao et al. Appl. Phys. Lett. 104, 251902 (2014)
This article is copyrighted as indicated in the article. Reuse of AIP content is subject to the terms at: http://scitation.aip.org/termsconditions. Downloaded to IP:
125.71.229.163 On: Tue, 24 Jun 2014 02:02:54
time is 1.9 s, which is long enough to ensure the sample
reaching a new thermal equilibrium state. The excitation coil
is placed at the back of the sample.
During the ECPT testing—when eddy current encoun-
ters a discontinuity, e.g., a slot or notch—it is forced to
divert, leading to areas of increased and decreased eddy cur-
rent density and resulting in hot and cool areas due to Joule
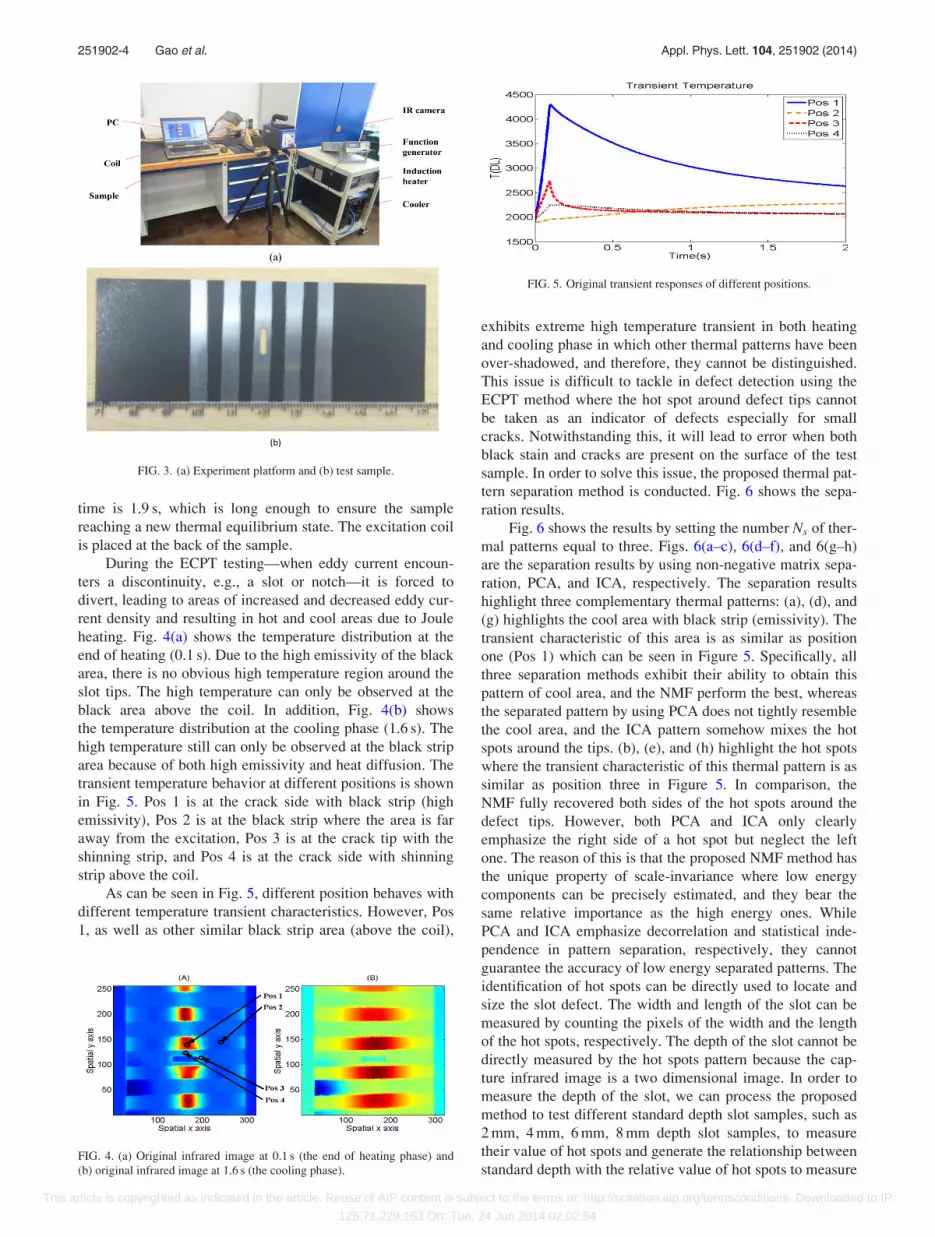
heating. Fig. 4(a) shows the temperature distribution at the
end of heating (0.1 s). Due to the high emissivity of the black
area, there is no obvious high temperature region around the
slot tips. The high temperature can only be observed at the
black area above the coil. In addition, Fig. 4(b) shows
the temperature distribution at the cooling phase (1.6 s). The
high temperature still can only be observed at the black strip
area because of both high emissivity and heat diffusion. The
transient temperature behavior at different positions is shown
in Fig. 5. Pos 1 is at the crack side with black strip (high
emissivity), Pos 2 is at the black strip where the area is far
away from the excitation, Pos 3 is at the crack tip with the
shinning strip, and Pos 4 is at the crack side with shinning
strip above the coil.
As can be seen in Fig. 5, different position behaves with
different temperature transient characteristics. However, Pos
1, as well as other similar black strip area (above the coil),
exhibits extreme high temperature transient in both heating
and cooling phase in which other thermal patterns have been
over-shadowed, and therefore, they cannot be distinguished.
This issue is difficult to tackle in defect detection using the
ECPT method where the hot spot around defect tips cannot
be taken as an indicator of defects especially for small
cracks. Notwithstanding this, it will lead to error when both
black stain and cracks are present on the surface of the test
sample. In order to solve this issue, the proposed thermal pat-
tern separation method is conducted. Fig. 6 shows the sepa-
ration results.
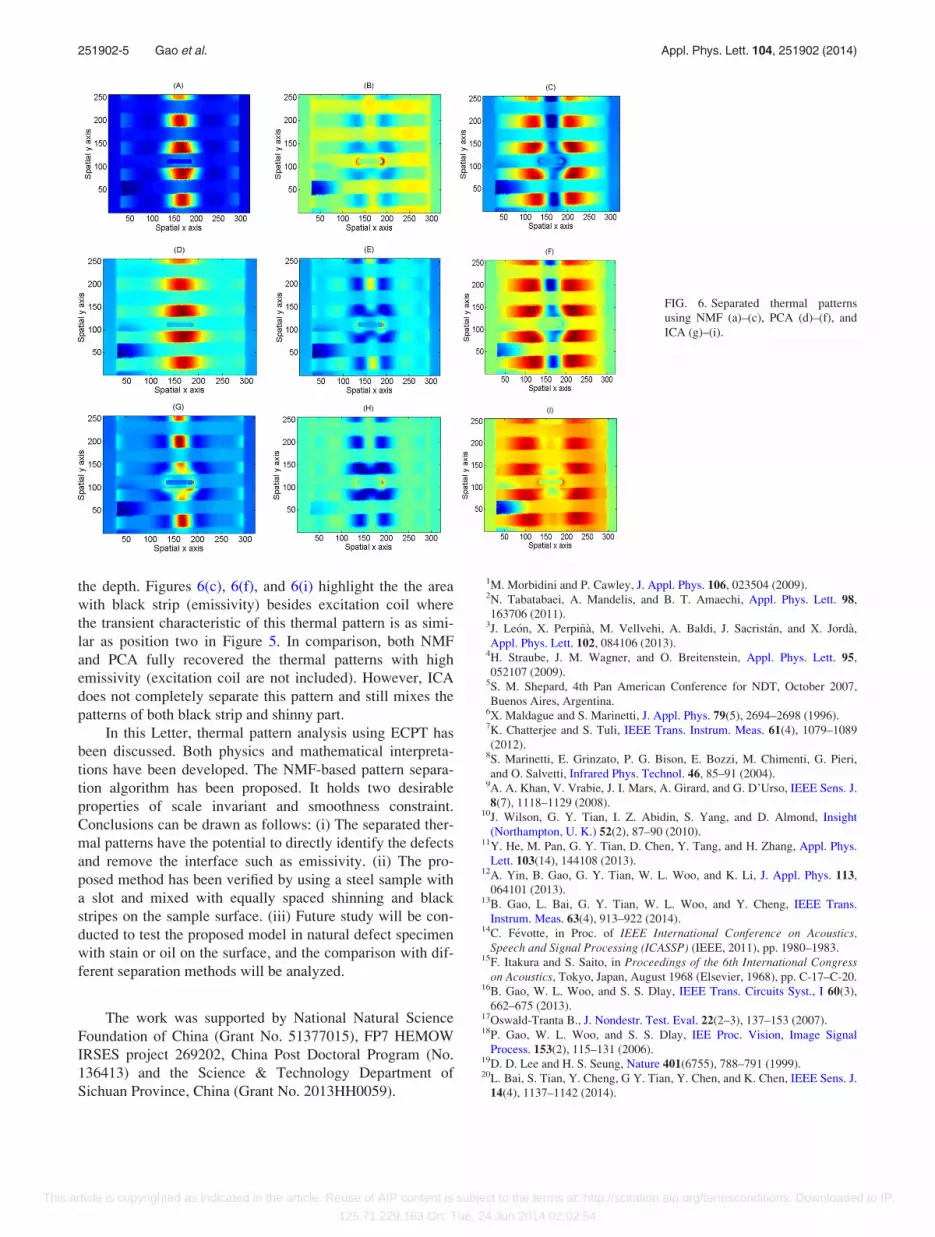
Fig. 6 shows the results by setting the number Ns of ther-
mal patterns equal to three. Figs. 6(a–c), 6(d–f), and 6(g–h)
are the separation results by using non-negative matrix sepa-
ration, PCA, and ICA, respectively. The separation results
highlight three complementary thermal patterns: (a), (d), and
(g) highlights the cool area with black strip (emissivity). The
transient characteristic of this area is as similar as position
one (Pos 1) which can be seen in Figure 5. Specifically, all
three separation methods exhibit their ability to obtain this
pattern of cool area, and the NMF perform the best, whereas
the separated pattern by using PCA does not tightly resemble
the cool area, and the ICA pattern somehow mixes the hot
spots around the tips. (b), (e), and (h) highlight the hot spots
where the transient characteristic of this thermal pattern is as
similar as position three in Figure 5. In comparison, the
NMF fully recovered both sides of the hot spots around the
defect tips. However, both PCA and ICA only clearly
emphasize the right side of a hot spot but neglect the left
one. The reason of this is that the proposed NMF method has
the unique property of scale-invariance where low energy
components can be precisely estimated, and they bear the
same relative importance as the high energy ones. While
PCA and ICA emphasize decorrelation and statistical inde-
pendence in pattern separation, respectively, they cannot
guarantee the accuracy of low energy separated patterns. The
identification of hot spots can be directly used to locate and
size the slot defect. The width and length of the slot can be
measured by counting the pixels of the width and the length
of the hot spots, respectively. The depth of the slot cannot be
directly measured by the hot spots pattern because the cap-
ture infrared image is a two dimensional image. In order to
measure the depth of the slot, we can process the proposed
method to test different standard depth slot samples, such as
2 mm, 4 mm, 6 mm, 8 mm depth slot samples, to measure
their value of hot spots and generate the relationship between
standard depth with the relative value of hot spots to measure
FIG. 3. (a) Experiment platform and (b) test sample.
FIG. 4. (a) Original infrared image at 0.1 s (the end of heating phase) and
(b) original infrared image at 1.6 s (the cooling phase).
FIG. 5. Original transient responses of different positions.
251902-4 Gao et al. Appl. Phys. Lett. 104, 251902 (2014)
This article is copyrighted as indicated in the article. Reuse of AIP content is subject to the terms at: http://scitation.aip.org/termsconditions. Downloaded to IP:
125.71.229.163 On: Tue, 24 Jun 2014 02:02:54
the depth. Figures 6(c), 6(f), and 6(i) highlight the the area
with black strip (emissivity) besides excitation coil where
the transient characteristic of this thermal pattern is as simi-
lar as position two in Figure 5. In comparison, both NMF
and PCA fully recovered the thermal patterns with high
emissivity (excitation coil are not included). However, ICA
does not completely separate this pattern and still mixes the
patterns of both black strip and shinny part.
In this Letter, thermal pattern analysis using ECPT has
been discussed. Both physics and mathematical interpreta-
tions have been developed. The NMF-based pattern separa-
tion algorithm has been proposed. It holds two desirable
properties of scale invariant and smoothness constraint.
Conclusions can be drawn as follows: (i) The separated ther-
mal patterns have the potential to directly identify the defects
and remove the interface such as emissivity. (ii) The pro-
posed method has been verified by using a steel sample with
a slot and mixed with equally spaced shinning and black
stripes on the sample surface. (iii) Future study will be con-
ducted to test the proposed model in natural defect specimen
with stain or oil on the surface, and the comparison with dif-
ferent separation methods will be analyzed.
The work was supported by National Natural Science
Foundation of China (Grant No. 51377015), FP7 HEMOW
IRSES project 269202, China Post Doctoral Program (No.
136413) and the Science & Technology Department of
Sichuan Province, China (Grant No. 2013HH0059).
1M. Morbidini and P. Cawley, J. Appl. Phys. 106, 023504 (2009).2N. Tabatabaei, A. Mandelis, and B. T. Amaechi, Appl. Phys. Lett. 98,
163706 (2011).3J. Le�on, X. Perpi~n�a, M. Vellvehi, A. Baldi, J. Sacrist�an, and X. Jord�a,
Appl. Phys. Lett. 102, 084106 (2013).4H. Straube, J. M. Wagner, and O. Breitenstein, Appl. Phys. Lett. 95,
052107 (2009).5S. M. Shepard, 4th Pan American Conference for NDT, October 2007,
Buenos Aires, Argentina.6X. Maldague and S. Marinetti, J. Appl. Phys. 79(5), 2694–2698 (1996).7K. Chatterjee and S. Tuli, IEEE Trans. Instrum. Meas. 61(4), 1079–1089
(2012).8S. Marinetti, E. Grinzato, P. G. Bison, E. Bozzi, M. Chimenti, G. Pieri,
and O. Salvetti, Infrared Phys. Technol. 46, 85–91 (2004).9A. A. Khan, V. Vrabie, J. I. Mars, A. Girard, and G. D’Urso, IEEE Sens. J.
8(7), 1118–1129 (2008).10J. Wilson, G. Y. Tian, I. Z. Abidin, S. Yang, and D. Almond, Insight
(Northampton, U. K.) 52(2), 87–90 (2010).11Y. He, M. Pan, G. Y. Tian, D. Chen, Y. Tang, and H. Zhang, Appl. Phys.
Lett. 103(14), 144108 (2013).12A. Yin, B. Gao, G. Y. Tian, W. L. Woo, and K. Li, J. Appl. Phys. 113,
064101 (2013).13B. Gao, L. Bai, G. Y. Tian, W. L. Woo, and Y. Cheng, IEEE Trans.
Instrum. Meas. 63(4), 913–922 (2014).14C. F�evotte, in Proc. of IEEE International Conference on Acoustics,
Speech and Signal Processing (ICASSP) (IEEE, 2011), pp. 1980–1983.15F. Itakura and S. Saito, in Proceedings of the 6th International Congress
on Acoustics, Tokyo, Japan, August 1968 (Elsevier, 1968), pp. C-17–C-20.16B. Gao, W. L. Woo, and S. S. Dlay, IEEE Trans. Circuits Syst., I 60(3),
662–675 (2013).17Oswald-Tranta B., J. Nondestr. Test. Eval. 22(2–3), 137–153 (2007).18P. Gao, W. L. Woo, and S. S. Dlay, IEE Proc. Vision, Image Signal
Process. 153(2), 115–131 (2006).19D. D. Lee and H. S. Seung, Nature 401(6755), 788–791 (1999).20L. Bai, S. Tian, Y. Cheng, G Y. Tian, Y. Chen, and K. Chen, IEEE Sens. J.
14(4), 1137–1142 (2014).
FIG. 6. Separated thermal patterns
using NMF (a)–(c), PCA (d)–(f), and
ICA (g)–(i).
251902-5 Gao et al. Appl. Phys. Lett. 104, 251902 (2014)
This article is copyrighted as indicated in the article. Reuse of AIP content is subject to the terms at: http://scitation.aip.org/termsconditions. Downloaded to IP: