Species diversity and population size of earthworms after oil spillage in a pipeline vandalized area in Lagos
State, Nigeria
Aemere Ogunlaja1* and Olajumoke A. Morenikeji2
1Biological Department, Redeemer’s University, Ogun State, Nigeria.
2Zoology Department University of Ibadan, Oyo State, Nigeria.
Accepted 21 January, 2013
This study investigated the impact of repeated oil spill on the population of earthworm in an oil pipeline vandalized area in Lagos state, Nigeria after oil spillage. The study area was divided into two study sites; I (100 m within the epicenter of spill) and II (500 m away from spill) based on the impact of the spill; samples were collected every month for two years using standard methods. Data collected were subjected to Mann Whithney (U- test), Shannon-Weiner Diversity Index analyses and Pearson correlation. In the first year, only Lybiodrilus violaceous, was encountered in site I while site II had L. violaceous and Dichogaster Modigliani (H = 0.28). In the second year, Sites I and II had four species; L. violaceous, D. modiglanin, Ephyriodrilus afroccidentalis and Heliodrilus lagosensis (H = 0.73). Abundance of earthworm in Site II was significantly higher than in Site I for the first year but no significant difference in the two sites for the second year. There was also significant difference in Site I between the first and second year but not for Site II. There was negative impact on the abundance and diversity of earthworms in Site I compared to Site II during the first year with slight recovery recorded during the second year. L. violaceous was identified to be the most abundant; the increase in number and species of earthworm in the second year suggests possible remediation of the environment. Key words: Oil spill, Earthworm species, population, diversity.
INTRODUCTION Pollution has been one of man’s contending challenges for some decades as its effect cuts across organisms at all trophic levels of the ecosystem. Soil being a habitat for many terrestrial organisms is a centre of important ecological processes. Soil has been described as an ecologically interactive system which consist of different components; its physical and chemical characteristics, organic matter, biological activities and its chemical characteristics (Coleman et al., 1992). Earthworms have *Corresponding author. E-mail: [email protected].
been acclaimed to be the most important animal influencing the function of soil ecosystem (Hendrix and Bohlen, 2002) because they dominate the fauna of the foodweb in terms of biomass. It has been shown that macronutrients are abundant around earthworm casts and burrows and that root growth is particularly enhanced in such area of the soil (Edwards and Bater, 1992). In this manner, tropical earthworms are also known to contribute to soil fertility in tropical soils, as they co-exist with soil feeding termites (Fragoso and Lavelle, 1992). Earthworms are considered as indicators of the nature; their presence in the soil have great influence on some properties of soil including, the structure, particle size distribution, organic matter content tensile strength, water
inflteration, etc. (Cannavacciuolo et al., 1998; Blanchart et al., 1999). Some African earthworm species have been identified; they include Pontoscolex corethrurus, Perionex excavatus, Dichogaster modigliani and Polypheretima elongate among others (Ching et al., 2006), their abundance and distribution is based on soil type, soil moisture, texture and soil constituent. Other factors include rainfall, vegetation, topography, soil depth, light, pH etc. (Owa et al, 2004). Tropical earthworms are known to be greatly influenced by temperature, nutrient levels and seasonality (Fragoso and Lavelle, 1992). Usually, the abundance and distribution of earthworms in undisturbed soil are more than from soils that have been cultivated, burnt or undergone various crop practices like the use of fertilizers, fallowing etc. Generally, organisms are known to avoid areas polluted with contaminants above tolerable levels (Amorim et al., 2005; Fenoglio et al., 2007). Changes in soil properties have great impact on earthworms and hence they serve as indicator organisms for ecotoxicity studies (OECD, 1984).
Earthworms also serve as indicators of soil status such as the level of pollutants e.g. agrochemicals, heavy metals, toxic substances, industrial effluents and human-induced activities e.g. land-management practices and forest degradation (Radha and Natchimuthu, 2010).
Earthworms are used as test organisms and they are known to play an important role in decomposition and soil-structuring processes and also live in close contact with soil and pore water (Bleeker and Gestel, 2007).
Their role in the structure and resultant fertility of soil has been extensively studied and reported (Tunira and Krishan, 2010). Clearing of forest vegetation, bush burning, cropping systems and practices have been shown to have influence on earthworm abundance, diversity and reduction in their activities. Researches have also highlighted the effect of pollutants, agrochemicals and land management practices on earthworms. Some researches have focused on the role of earthworm species in their tolerance, absorption or conversion of metals, petroleum hydrocarbons and polynuclear aromatic hydrocarbons (PAHs) from the environment including that of oil contaminated soils (Zachary and Reid, 2008; Owojori et al., 2009).
However limited information exists on the effect of petroleum contaminants on tropical earthworm species. Aside the Niger-Delta which have so much be acclaimed to be polluted by oil, the issue of pipeline vandalization have become widespread and a recurrent one in Nigeria in recent times, only a few of such areas have been assessed to determine the impact of the spills. This study aimed at investigating the impact of oil spill on earthworm species diversity as well as abundance in one of the several pipeline vandalized areas in south western, Nigeria.
MATERIALS AND METHODS The study was carried out within a two years period between April
2007 and March 2009.
Study area Agaye community (Lat. 06° 30'N and Long. 03° 15' E) is located in Iba local government development area, Lagos State of Nigeria, there had been reports of repeated oil spill in December, 2006 and January, 2007; this resulted in an inferno. The impact was the destruction of soil microfloral and fauna (including earthworms) and the plants within that area. The aftermath also included contamination of the soil with petroleum constituents. Physicochemical parameters The weather and soil condition of the study location depicted by rainfall, soil moisture and soil temperature were determined by standard methods. Chemical analysis A total number of 144 random soil samples were collected bimonthly from study area and pH; Total organic carbon (TOC),total organic matter (TOM) and total petroleum hydrocarbon (TPH) were carried out throughout the period of study. Earthworm population study The study area was divided into two study site designated Site I and Site II; Site I was an area of size 100m
2 by 100m
2, within 100m of
point of oil spill and site II was an area 100m2
X 100m2, 500m away
from point of oil spill. The selection of sites was based on nearness to point of spill and the physical assessment of impact and inferno on vegetation. Preliminary test for earthworm collection method In order to determine the appropriate collection method, a preliminary test was carried out on 20 random selected areas by quadrat throws in which the chemical expulsion method was administered in order to ensure capturing all possible earthworm types (epigeic, anecic and endogeic).
Soil samples were collected from quadrat size 0.5 m × 0.5 m in 20 randomly marked plots of each site and then using spade, soils were collected 30 cm deep for each quadrat. Earthworms were sorted out by hand and preserved in Formoacetoalcohol (FAA), composed on volume basis of 50% alcohol, 10% formalin, 2% glacial acetic acid and 40% distilled water. This preservative minimizes shrinkage and increases pliability of earthworms. A replacement of the preservative was done after the first 24 h (Owa et al., 2004). It was ensured that whole earthworms including adult and juvenile earthworms collected were kept in separate labeled specimen bottles bearing the source, quadrat number, date and time of collection. Earthworms collected were then taken to laboratory for onward enumeration and identification.
Analysis of earthworm species Earthworms for each quadrat were first counted and rinsed in water to remove soil particles and then mopped up to remove excess water before sorting out into species, based on maturity (adults and juveniles). Adults were identified as those earthworms with clitellum (fully developed reproductive organs). Juveniles are indicated by clitellum and gonopores without clear position. Juveniles were then
Rainfall at site relative to long term average (mm)
Ave. air temp
(°C)
Long - term
Average (°C)
June ‘07 327 336 +8 26 25.5
July ‘07 130 150 -20 23 25
Aug ‘07 31 59 _28 27 24.5
Sept ‘07 163 214 -51 26.5 25
Oct ‘07 189 222 -33 27 26
Nov ‘07 86 77 +9 29 26.5
Dec ‘07 49 41 +8 30 27
Jan ‘08 48 40 +8 32 27
Feb ‘08 63 57 +6 30.2 28
March ‘08 117 100 +17 31 28
April ,08 212 115 +3 29 28
May ‘08 234 215 +19 28 27
June ‘08 382 336 +46 23 26
July ‘08 144 150 -14 22 25
Aug ‘08 53 59 -6 23.5 25
Sept ‘08 208 214 -6 24 25
Oct ‘08 238 222 +16 25.5 26
Nov ‘08 86 77 +9 28 27
Dec ‘08 43 41 +2 28.5 27
Jan ‘09 45 40 +5 33 27
Feb ‘09 68 57 +18 32 28
March ‘09 112 100 +12 28.5 28
April ,09 105 115 +10 25 27.5
May ‘09 150 215 +65 26 27
Table 2. Soil condition of sampling area.
Months
First year Second year
Average temperature (°C)
Moisture (%) pH Average
Temperature (°C) Moisture (%) pH
June 25.3 45-50 5.53 23.5 40-50 5.57
July 24.8 50-60 5.32 24.5 50-60 5.45
Aug 23.5 50-60 5.41 23 55-60 5.59
Sept 22.5 55-65 5.95 23.3 60-65 5.82
Oct 21.3 60-65 6.17 22.4 60-65 6.08
Nov 27.6 40-50 6.23 26.7 45-50 6.11
Dec 27.2 20-25 6.44 27 25-35 6.17
Jan 28.9 15-20 6.35 27.8 15-20 6.21
Feb 29.8 15-20 6.25 28.3 15-20 6.25
March 27.8 20-30 6.28 28.5 25-30 6.38
April 29.3 30-40 6.7 29 30-40 6.49
May 27.4 40-50 5.98 26.7 45-50 5.73
enumerated, weighed and recorded alongside with adolescents (Tables 1 and 2). The earthworms were identified following the original descriptions (Beddard 1891; Rosa 1896, Sims 1971) with the assistance of the earthworm taxonomist, Prof. S.O. Owa of Olabisi Onabanjo University, Ago-Iwoye.
pH (Ionic concentration)
pH measurement was performed using Accumet pH Model 15 meter (Fisher Scientific). Soil pH was measured using EPA Standard Method No. 9045C (USEPA, 1987).
Total organic carbon and total organic matter
The soil samples (1 g) were grounded to pass through 0.5 mm
sieve after which they were weighed in duplicate and transferred to 250 cm
3 Erlenmeyer flasks. Exactly 10 cm
3 of 1 M potassium
dichromate (K2Cr2O7) was pipetted into each flask and swirled gently to disperse the soil followed by addition of 20 cm
3 of
concentrated, sulphuric acid. The flask was swirled gently until soil and reagents were thoroughly mixed. The mixture was then allowed to stand for 30 min on a glass plate to allow for the oxidation of potassium dichromate to chromic acid. Distilled water (100 cm
3)
was added followed by addition of 3 to 4 drops of ferroin indicator, after which the mixture was titrated with 0.5 M ferrous sulphate solution ((NH4)2SO4Fe). A blank titration (without 1 g of soil) wassimilarly carried out. The % organic carbon is given by the following equation:
F = Correction factor (1.33); M1 = mole of K2Cr2O7; e1 = volume of K2Cr2O7; M2 = mole of FeSO4; and e2 = volume of FeSO4 % Organic matter in soil = % Organic carbon × 1.729 (Anderson and Ingram, 1993). Total extractable petroleum hydrocarbon or total petroleum hydrocarbon (TPH)
One gram (1.0 g) of each soil sample was put into a 500 ml volumetric flask and to this was added 200 ml of xylene. The xylene/soil mixture was shaken vigorously for five minutes and filtered into 400 ml cylinder. The volumetric flask and solid materials were rinsed properly with 500 ml xylene and filtered again into the cylinder. Total hydrocarbon content (THC) in the xylene/hydrocarbon mixture was thereafter determined by photometric method using Fisher Electrophotometer-II at a wavelength of 425 nm. THC was estimated from a calibration curve, obtained by measuring absorbance of a standard prepared in 2.5, 5.0, 10.0, 20.0, 25.0 and 30 (Osuji and Adesanya, 2005).
Statistical analysis Data collected were subjected to statistical analysis including the Correlation, Mann Whithney U- test, Shannon wiener’s index of diversity and GLM analysis.
RESULTS
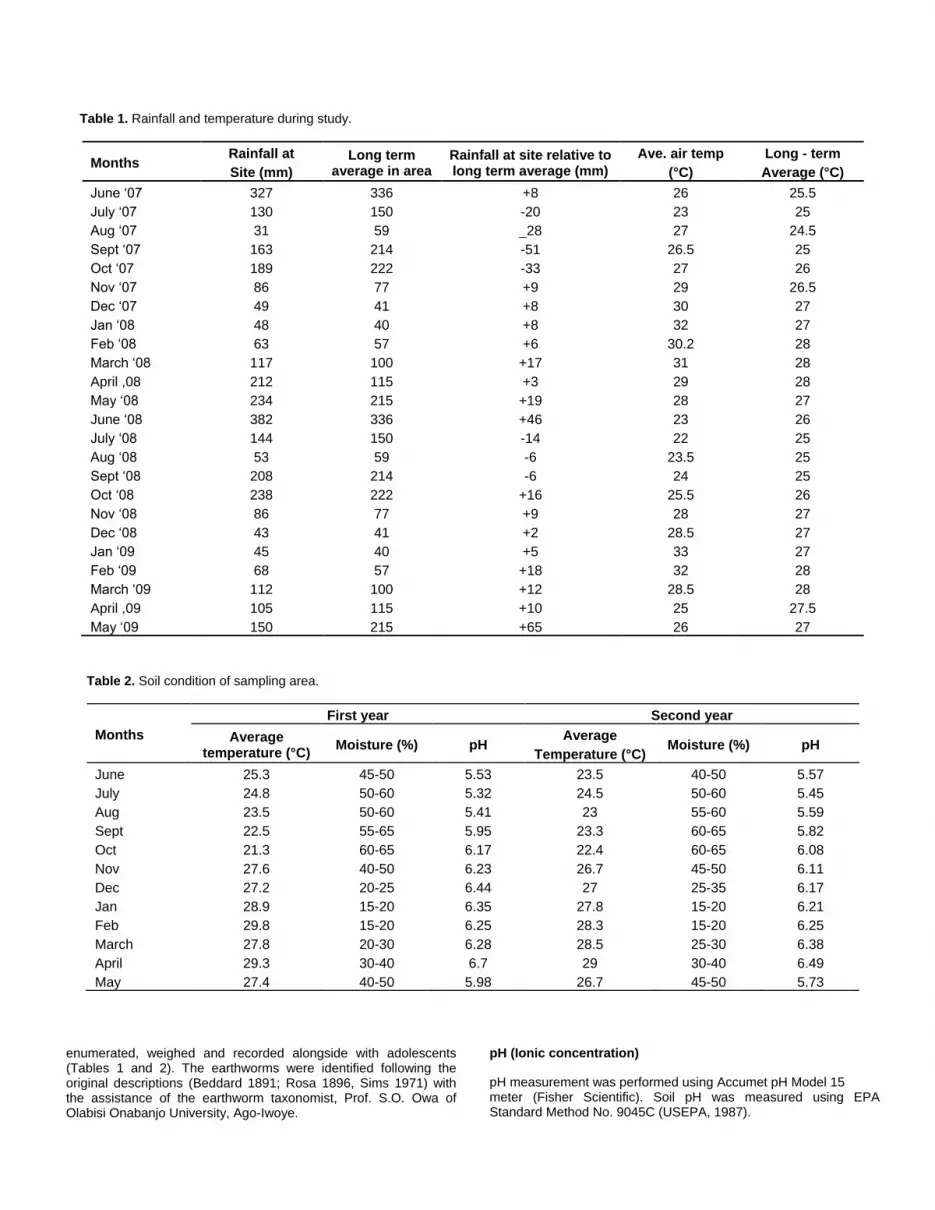
Rainfall
The highest rainfalls were recorded during April to June and September to October and the highest earthworm populations for all species were recorded between September to October. The highest rainfall of 327 and 382 mm was recorded during June 2007 and June 2008 respectively in the study area. The seasonal dynamics in an annual cycle showed that earthworm numbers and total weight were high in the rainy season with a gradual decline in number at the onset of dry season (November) and complete absence during the peak of the dry season (Febuary and March). The earthworm population size
gradually increased at the onset of the rainy season (April) and maximum numbers of earthworms and total weight were recorded in the rainy season (Table 1). Moisture The soil moisture content directly matched with the rainfall. The soil moisture content at 15 cm to 20 cm depth ranged between 15.0 to 65.0% in the study area during the 24 months of the study (Table 2). Temperature The soil and atmospheric temperature tallied with the seasonal variation observed in the study site (dry and rainy season). The soil temperature ranged from 21.3
to
29.8°C while the atmospheric temperature ranged from 22 to 28.5°C (Table 2).
Preliminary result for earthworm collection method All earthworm species collected and identified were void of the anacic type hence the choice of digging and hand sorting method of collection. Biological system
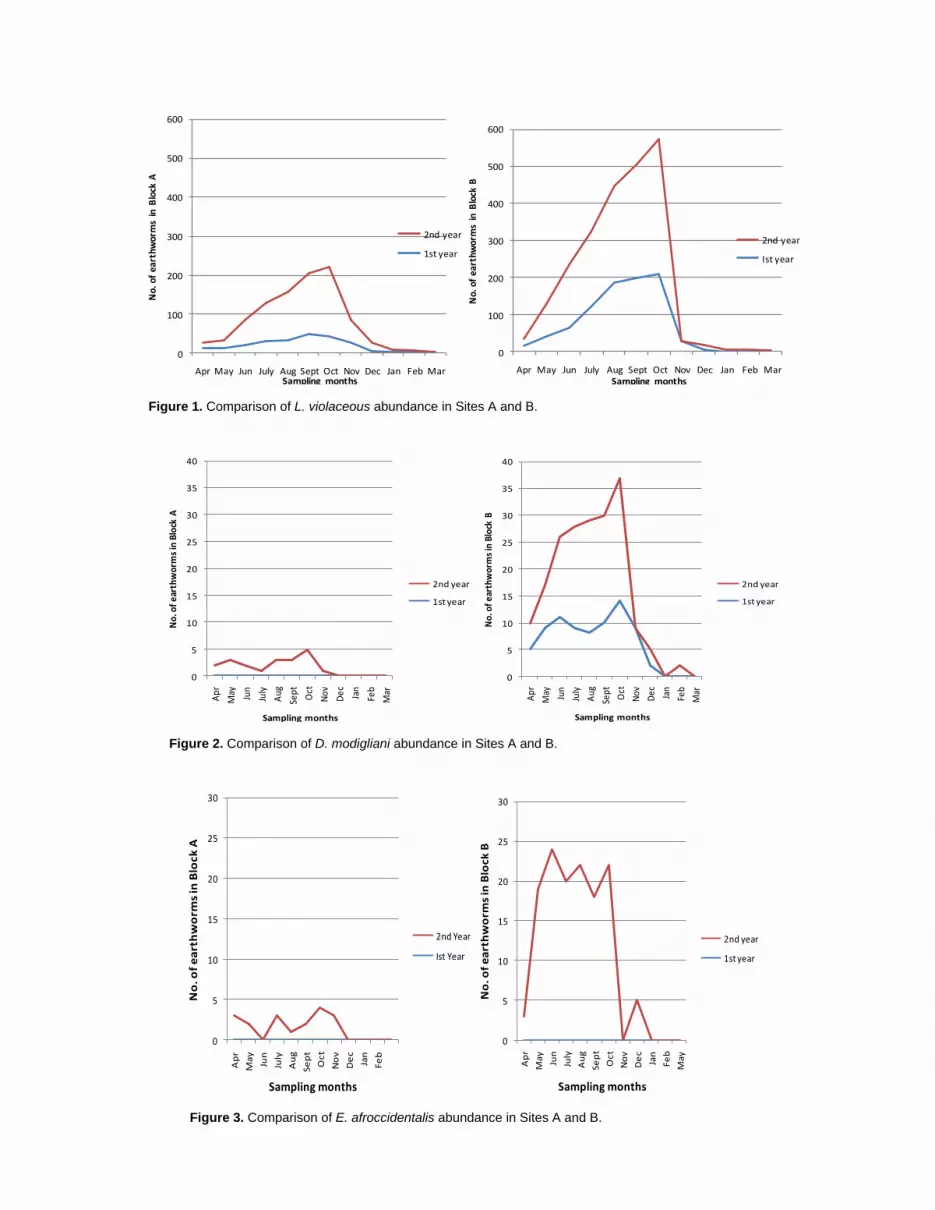
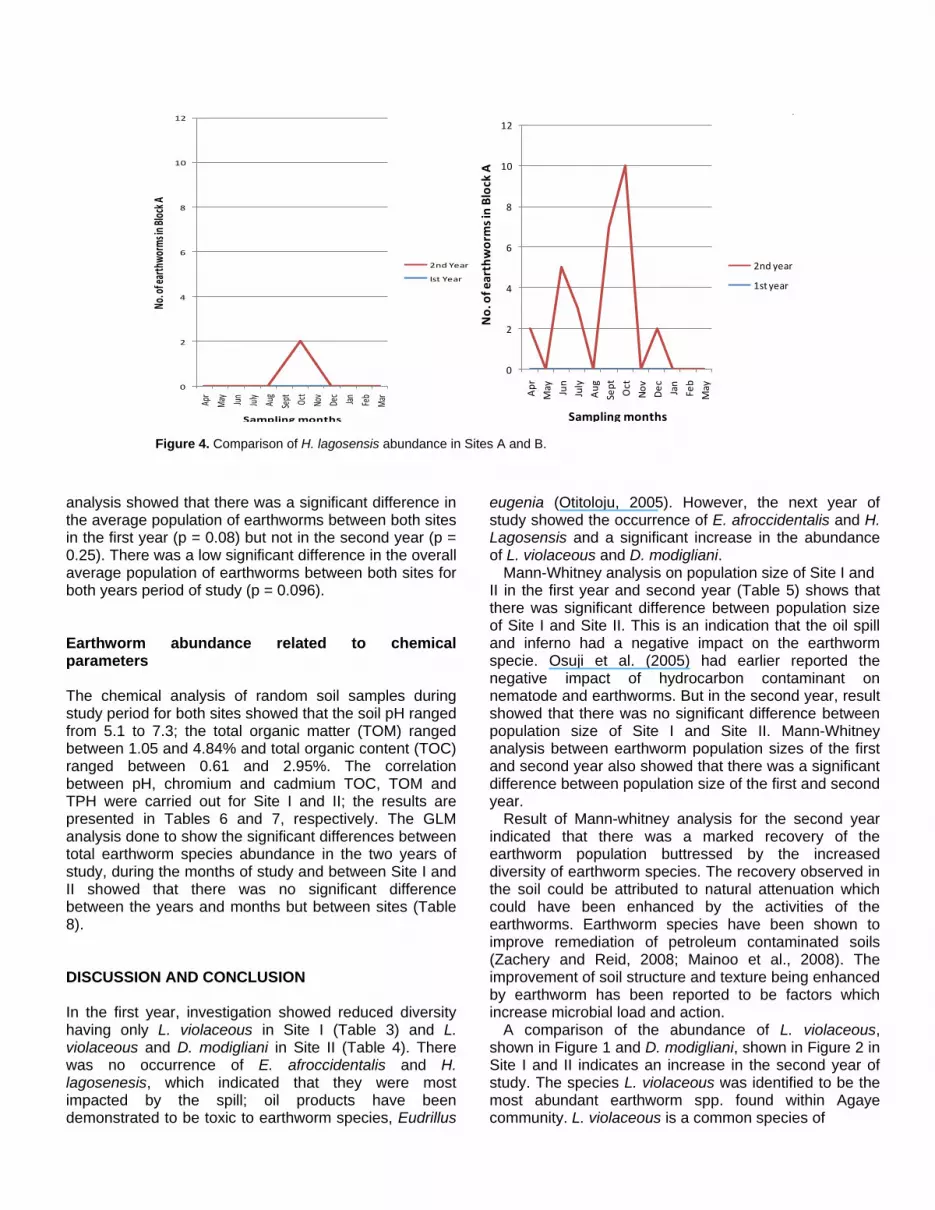
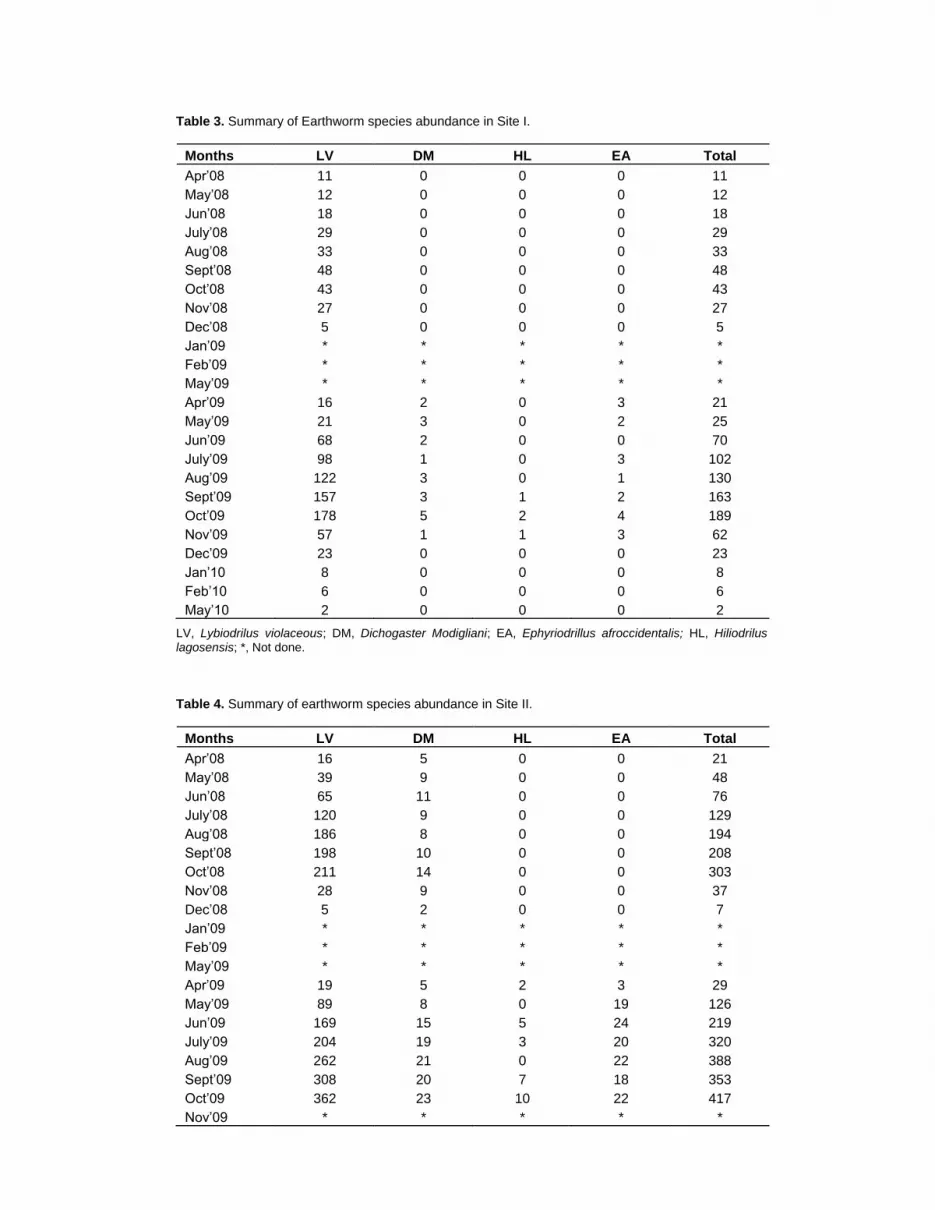
Throughout the study, the species of earthworms encountered were L. violaceous Beddard, 1891. D. modigliani Rosa, 1896, Ephyriodrilus afroccidentalis Sims, 1971 and Heliodrilus lagosensis Beddard, 1891. In the first year of study, analysis showed that L. violaceous alone was encountered in Site I (Table 3) and contributed 100% of total earthworm weight. In Site II, two species were recorded; 92% L. violaceous contributing 99% of the total earthworm weight and 8% D. modigliani. In the second year, four species were identified in Site I, 92% were L. violaceous, 3% were D. modigliani, 4% were E. afroccidentalis and 1% were H. lagosensis sp. In Site II, four species identified, 84% were L. violaceous, 7% were D. modigliani, 8% were E. afroccidentalis and 1% was H. lagosensis (Table 4).
L. violaceous was identified to be the most abundant earthworm species found within Agaye community. The Shannon-Weiner Diversity Index showed that in the first year, H = 0.2813, an indication of a low specie diversity; While in the second year, H = 0.7315, an indication of a higher species diversity. A comparison of the abundance of each earthworm species between Site I and II in the first and second year is illustrated in Figures 1 to 4.
Mann- Whitney analysis for population sizes of each Site (I and II) was determined between the first year and second year and for both sites between the two years, the result is presented in Table 5. The Mann Whitney
Figure 1. Comparison of L. violaceous abundance in Sites A and B.
0
5
10
15
20
25
30
35
40
Apr
May Jun
July
Aug
Sept
Oct
Nov
Dec Jan
Feb
Mar
No.
of e
arth
wor
ms
in B
lock
A
Sampling months
2nd year
1st year
0
5
10
15
20
25
30
35
40
Apr
May Jun
July
Aug
Sept
Oct
Nov
Dec Jan
Feb
Mar
No.
of e
arth
wor
ms
in B
lock
B
Sampling months
2nd year
1st year
0
5
10
15
20
25
30
35
40
Apr
May Jun
July
Aug
Sept
Oct
Nov
Dec Jan
Feb
Mar
No
. of
eart
hwo
rms
in B
lock
A
Sampling months
2nd year
1st year
0
5
10
15
20
25
30
35
40
Apr
May Jun
July
Aug
Sept
Oct
Nov
Dec Jan
Feb
Mar
No.
of e
arth
wor
ms
in B
lock
B
Sampling months
2nd year
1st year
Figure 2. Comparison of D. modigliani abundance in Sites A and B.
0
5
10
15
20
25
30
Ap
r
Ma
y
Jun
July
Au
g
Se
pt
Oc
t
No
v
De
c
Jan
Fe
b
No
. of
ea
rth
wo
rms
in B
lock
A
Sampling months
2nd Year
Ist Year
0
5
10
15
20
25
30
Ap
r
May Jun
July
Au
g
Sep
t
Oct
No
v
De
c
Jan
Feb
May
No
. of
ea
rth
wo
rms
in B
lock
B
Sampling months
2nd year
1st year
0
5
10
15
20
25
30
Ap
r
Ma
y
Jun
July
Au
g
Se
pt
Oc
t
No
v
De
c
Jan
Fe
b
No
. of
ea
rth
wo
rms
in B
lock
A
Sampling months
2nd Year
Ist Year
0
5
10
15
20
25
30
Ap
r
May Jun
July
Au
g
Sep
t
Oct
No
v
De
c
Jan
Feb
May
No
. of
ea
rth
wo
rms
in B
lock
B
Sampling months
2nd year
1st year
Figure 3. Comparison of E. afroccidentalis abundance in Sites A and B.
Abundance of H. lagosensis in Block A
0
2
4
6
8
10
12
Ap
r
May Jun
July
Au
g
Sep
t
Oct
No
v
De
c
Jan
Feb
May
No
. of e
arth
wo
rms
in B
lock
A
Sampling months
2nd year
1st year
0
2
4
6
8
10
12
Apr
May Jun
July
Aug
Sept Oc
t
Nov
Dec
Jan
Feb
Mar
No. o
f ear
thw
orm
s in
Bloc
k A
Sampling months
2nd Year
Ist Year
Figure 4. Comparison of H. lagosensis abundance in Sites A and B.
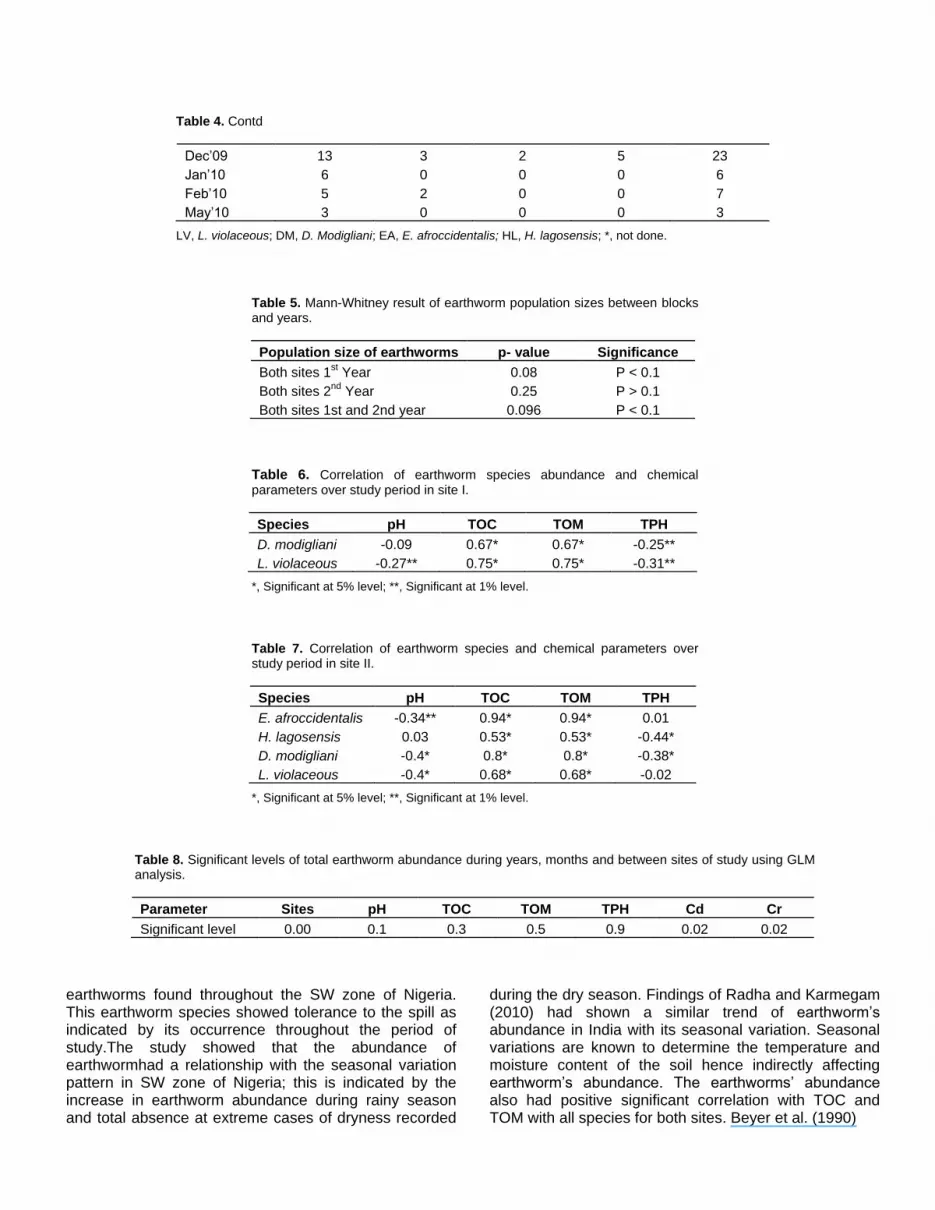
analysis showed that there was a significant difference in the average population of earthworms between both sites in the first year (p = 0.08) but not in the second year (p = 0.25). There was a low significant difference in the overall average population of earthworms between both sites for both years period of study (p = 0.096). Earthworm abundance related to chemical parameters The chemical analysis of random soil samples during study period for both sites showed that the soil pH ranged from 5.1 to 7.3; the total organic matter (TOM) ranged between 1.05 and 4.84% and total organic content (TOC) ranged between 0.61 and 2.95%. The correlation between pH, chromium and cadmium TOC, TOM and TPH were carried out for Site I and II; the results are presented in Tables 6 and 7, respectively. The GLM analysis done to show the significant differences between total earthworm species abundance in the two years of study, during the months of study and between Site I and II showed that there was no significant difference between the years and months but between sites (Table 8). DISCUSSION AND CONCLUSION In the first year, investigation showed reduced diversity having only L. violaceous in Site I (Table 3) and L. violaceous and D. modigliani in Site II (Table 4). There was no occurrence of E. afroccidentalis and H. lagosenesis, which indicated that they were most impacted by the spill; oil products have been demonstrated to be toxic to earthworm species, Eudrillus
eugenia (Otitoloju, 2005). However, the next year of study showed the occurrence of E. afroccidentalis and H. Lagosensis and a significant increase in the abundance of L. violaceous and D. modigliani.
Mann-Whitney analysis on population size of Site I and II in the first year and second year (Table 5) shows that there was significant difference between population size of Site I and Site II. This is an indication that the oil spill and inferno had a negative impact on the earthworm specie. Osuji et al. (2005) had earlier reported the negative impact of hydrocarbon contaminant on nematode and earthworms. But in the second year, result showed that there was no significant difference between population size of Site I and Site II. Mann-Whitney analysis between earthworm population sizes of the first and second year also showed that there was a significant difference between population size of the first and second year.
Result of Mann-whitney analysis for the second year indicated that there was a marked recovery of the earthworm population buttressed by the increased diversity of earthworm species. The recovery observed in the soil could be attributed to natural attenuation which could have been enhanced by the activities of the earthworms. Earthworm species have been shown to improve remediation of petroleum contaminated soils (Zachery and Reid, 2008; Mainoo et al., 2008). The improvement of soil structure and texture being enhanced by earthworm has been reported to be factors which increase microbial load and action.
A comparison of the abundance of L. violaceous, shown in Figure 1 and D. modigliani, shown in Figure 2 in Site I and II indicates an increase in the second year of study. The species L. violaceous was identified to be the most abundant earthworm spp. found within Agaye community. L. violaceous is a common species of
Table 4. Summary of earthworm species abundance in Site II.
Months LV DM HL EA Total
Apr’08 16 5 0 0 21
May’08 39 9 0 0 48
Jun’08 65 11 0 0 76
July’08 120 9 0 0 129
Aug’08 186 8 0 0 194
Sept’08 198 10 0 0 208
Oct’08 211 14 0 0 303
Nov’08 28 9 0 0 37
Dec’08 5 2 0 0 7
Jan’09 * * * * *
Feb’09 * * * * *
May’09 * * * * *
Apr’09 19 5 2 3 29
May’09 89 8 0 19 126
Jun’09 169 15 5 24 219
July’09 204 19 3 20 320
Aug’09 262 21 0 22 388
Sept’09 308 20 7 18 353
Oct’09 362 23 10 22 417
Nov’09 * * * * *
Table 4. Contd
Dec’09 13 3 2 5 23
Jan’10 6 0 0 0 6
Feb’10 5 2 0 0 7
May’10 3 0 0 0 3
LV, L. violaceous; DM, D. Modigliani; EA, E. afroccidentalis; HL, H. lagosensis; *, not done.
Table 5. Mann-Whitney result of earthworm population sizes between blocks and years.
Population size of earthworms p- value Significance
Both sites 1st Year 0.08 P < 0.1
Both sites 2nd
Year 0.25 P > 0.1
Both sites 1st and 2nd year 0.096 P < 0.1
Table 6. Correlation of earthworm species abundance and chemical parameters over study period in site I.
Species pH TOC TOM TPH
D. modigliani -0.09 0.67* 0.67* -0.25**
L. violaceous -0.27** 0.75* 0.75* -0.31**
*, Significant at 5% level; **, Significant at 1% level.
Table 7. Correlation of earthworm species and chemical parameters over study period in site II.
Species pH TOC TOM TPH
E. afroccidentalis -0.34** 0.94* 0.94* 0.01
H. lagosensis 0.03 0.53* 0.53* -0.44*
D. modigliani -0.4* 0.8* 0.8* -0.38*
L. violaceous -0.4* 0.68* 0.68* -0.02
*, Significant at 5% level; **, Significant at 1% level.
Table 8. Significant levels of total earthworm abundance during years, months and between sites of study using GLM analysis.
Parameter Sites pH TOC TOM TPH Cd Cr
Significant level 0.00 0.1 0.3 0.5 0.9 0.02 0.02
earthworms found throughout the SW zone of Nigeria. This earthworm species showed tolerance to the spill as indicated by its occurrence throughout the period of study.The study showed that the abundance of earthwormhad a relationship with the seasonal variation pattern in SW zone of Nigeria; this is indicated by the increase in earthworm abundance during rainy season and total absence at extreme cases of dryness recorded
during the dry season. Findings of Radha and Karmegam (2010) had shown a similar trend of earthworm’s abundance in India with its seasonal variation. Seasonal variations are known to determine the temperature and moisture content of the soil hence indirectly affecting earthworm’s abundance. The earthworms’ abundance also had positive significant correlation with TOC and TOM with all species for both sites. Beyer et al. (1990)
had reported a negative impact of pH (3.0 to 5.5) on earthworms depicted by total absence of earthworms in metal contaminated dredged sediment substrate whereas on an older landfill with a higher pH, earthworms were found.
pH range, 5.3±0.04 to 6.5±0.02 from this study however showed no negative impact on earthworm abundance. TPH (p<0.05), chromium (p<0.1) and cadmium (p<0.05) levels correlated negatively with earthworm abundance. The GLM analysis shows a significant difference between Sites I and II, however the analysis indicates that the underlying factors was not due to pH, TOC, TOM or TPH (p>0.05) (Table 8). The difference on the other hand was therefore due to TPH, chromium and cadmium.
The overall result from this investigation indicates a negative impact of the spill on the earthworm diversity and abundance with minimal recovery of the soil over the period of investigation. L. violaceous was identified to be the most abundant and most tolerant earthworm species. The earthworm population distributions were characterised by seasonal variation typically experienced in the SW zone of Nigeria. ACKNOWLEDGEMENT Authors thank Prof. S.O. Owa of the Olabisi Onabanjo University Ogun State for assisting in the identification of earthworms and Mr. K.O. Popoola of the Department of Chemistry, Redeemer’s University for his valuable support during sampling and analysis. REFERENCES Anderson JM, Ingram JSI (1993). Tropical Soil Biology and Fertility: A
Handbook of Methods. CAB International. Wallingford, UK. p. 156. Amorim MJB, Römbke J, Soares A (2005) Avoidance behaviour of
Enchytraeus albidus: effects of benomyl, carbendazim, phenmedipham and different soil types. Chemosphere 59:501-510.
Beyer WN, Miller G, Simmers JW (1990). Trace elements in soil and biota in confined disposal facilities for dredged material. Environ. Pollut. 65:19-32.
Cannavacciuolo MA, Bellido DA, Cluzeau C, Gascuel PT (1998). A geostatistical approach to the study of earthworm distribution in grassland. Appl. Soil Ecol. 9:345-349.
Coleman DC, Odum EP, Crosseley JR (1992). Soil biology, soil ecology and global change. Biol. Fertil. Soils 14:104-111
Blanchart E, Albrecht A, Alegre J, Duboisset A, Gilot C, Pashanasi B, Lavelle P, Brussaard L (1999). Effects of earthworms on soil structure and physical properties. In: Lavelle, P., Brussaard, L. and Hendrix, P. (Eds), Earthworm management in tropical agroecosystems. CAB International, Wallingford. pp.149-172.
Bleeker EAJ, van Gestel CAM (2007). Effects of spatial and temporal variation in metal availability on earthworms in floodplain soils of the river Dommel, The Netherlands. Environ. Pollut. 148(3):824-832.
Ching YH, Xiaoming Z, Carlos R (2006). Earthworm invasions in the tropics Springer Science+Business Media B.V. Biol Invasions.
Edwards CA, Bater JE (1992). The Use of Earthworms In Environmental Management. Soil Biology and Biochemistry. 24:1683-1689.
Fenoglio S, Cucco M, Gay P, Malacarne G (2007). Colonisation by
ground and edaphic invertebrates of soil patches with different pollution levels. Periodicum Biologorum 109:37-45.
Fragoso C, Lavelle P (1992). Earthworm communities of tropical rainforests. Soil Biol. Biochem. 24:1397-1408.
Hendrix PF, Bohlen PJ (2002) Exotic earthworm invasions in North America: ecological and policy implications. BioScience 52:801–811
Mainoo NOK, Joann KW, Suzzelle B (2008). Earthworm abundance related to soil physicochemical and microbial properties in Accra, Ghana. Afr. J. Agric. Res. 3(3):186-194.
OECD (Organisation for Economic Co-operation and Development), (1984). Guideline for testing of chemicals "Earthworm, Acute Toxicity Tests.
Osuji LC, Adesiyan SO (2005). Extractable hydrocarbons, nickel and vanadium contents of Ogbodo-Isiokpo oil spill polluted soils in Niger Delta, Nigeria. Environmental Monitoring and Assessment 110:129–139DOI: 10.1007/s10661-005-6283-0.
Otitoloju AA (2005). Stress indicators in earthworms Eudrilus eugeniae inhabiting a crude oil contaminated ecosystem acta. SATECH 2(1):1-5
Owa SO, Moreyibi HO, Dedeke GA, Olojo FO and Fasunwa OO (2004). Earthworm created micro environment around roots of lowland rice, J. Sci. Technol. 11(1):5261-5270.
Owojori OJ, Reinecke AJ, Rozanov AB (2009). Role of clay content in partitioning, uptake and toxicity of zinc in the earthworm Eisenia fetida. Ecotoxicol. Environ. Safe. 72(1):99-107.
Radha DK, Natchimuthu K (2010).The role of earthworms in tropics with emphasis on indian ecosystems. Appl. Environ. Soil Sci. review article. doi:10.1155/2010/414356.
Tunira B, Krishan GS (2010). Role of Earthworms in Soil Fertility Maintenance through the Production of Biogenic Structures. Applied and Environmental Soil Science . 2010, Article ID 816073, 7 pages doi:10.1155/2010/816073 .
U.S. Environmental Protection Agency, USEPA (1987). Test Methods for Evaluating Solid Waste, Doc.: SW-846.
Zachary AH, Reid BJ (2008). The co-application of earthworms (Dendrobaena veneta) and compost to increase hydrocarbon losses from diesel contaminated soils. Environment International. 34(7):1016-1022.