____________________________________________________________________________________________ *Corresponding author: E-mail: [email protected]; Journal of Scientific Research & Reports 3(11): 1518-1533, 2014; Article no. JSRR.2014.11.009 SCIENCEDOMAIN international www.sciencedomain.org Rheological Behavior of Concentrated Solutions EPDM of Some Viscosity Improvers in SAE 10W-40 Mineral Oil Ioana Stanciu 1* 1 University of Bucharest, Faculty of Chemistry, Department of Physical Chemistry, Bvd. Regina Elisabeta, no. 4-12, 030018 Bucharest, Romania. Author’s contribution This whole work was carried out by the author IS. Received 30 th January 2014 Accepted 23 rd March 2014 Published 28 th April 2014 ABSTRACT Rheology of polymer concentrated solutions represents a cross-disciplinary field, using wide spectra of theoretical tools from physics and chemistry. They effectively thicken the oil at all temperatures, but the increase of viscosity is more pronounced at high temperatures. The lubricating effect is extends across a wider temperature range and the oil becomes thus a multi-grade one. Its viscosity still decreases logarithmically with temperature, but the slope representing the change is lessened. This slope is dependent on the nature and amount of additive to the base oil. The purpose of this study was to obtain automotive multi-grade oils. They have a number of advantages such as easy starting cold engine, reducing wear and decrease the formation of deposits in the engine. Multi-grade oil can be used longer than the engine base oils because they are more highly refined and contain large proportions of additives. The rheological behaviour of the solutions was determined using a Haake VT 550 Viscometers developing shear rates ranging between 3 and 1312 s -1 and measuring viscosities from 10 4 to 10 6 mPa.s when the HV 1 viscosity sensor is used. Rheological measurements of 3; 6; 10 and 12% EPDM solutions in SAE 10W-40 mineral oil show non-Newtonian behaviour in the temperature range 313-370 K and shear rates ranging between 3 and 1312 s -1 . The lower slope is given by 3% solution, followed by 12%, and the highest one by 10% solutions. EPDM solutions present an increase of slope when passing from 3 to 6% and a decrease when the concentration exceeds the last value. The lowest slope was obtained for solution having the concentration 12%, followed by 3%, while 6% solution has the highest value. Original Research Article
Journal of Scientific Research amp Reports3(11) 1518-1533 2014 Article no JSRR201411009
SCIENCEDOMAIN internationalwwwsciencedomainorg
Rheological Behavior of ConcentratedSolutions EPDM of Some Viscosity Improvers
in SAE 10W-40 Mineral Oil
Ioana Stanciu1
1University of Bucharest Faculty of Chemistry Department of Physical Chemistry BvdRegina Elisabeta no 4-12 030018 Bucharest Romania
Authorrsquos contribution
This whole work was carried out by the author IS
Received 30th January 2014Accepted 23rd March 2014Published 28th April 2014
ABSTRACT
Rheology of polymer concentrated solutions represents a cross-disciplinary field usingwide spectra of theoretical tools from physics and chemistry They effectively thicken theoil at all temperatures but the increase of viscosity is more pronounced at hightemperatures The lubricating effect is extends across a wider temperature range and theoil becomes thus a multi-grade one Its viscosity still decreases logarithmically withtemperature but the slope representing the change is lessened This slope is dependenton the nature and amount of additive to the base oil The purpose of this study was toobtain automotive multi-grade oils They have a number of advantages such as easystarting cold engine reducing wear and decrease the formation of deposits in the engineMulti-grade oil can be used longer than the engine base oils because they are more highlyrefined and contain large proportions of additives The rheological behaviour of thesolutions was determined using a Haake VT 550 Viscometers developing shear ratesranging between 3 and 1312 s-1 and measuring viscosities from 104 to 106 mPas whenthe HV1 viscosity sensor is used Rheological measurements of 3 6 10 and 12 EPDMsolutions in SAE 10W-40 mineral oil show non-Newtonian behaviour in the temperaturerange 313-370 K and shear rates ranging between 3 and 1312 s-1 The lower slope isgiven by 3 solution followed by 12 and the highest one by 10 solutions EPDMsolutions present an increase of slope when passing from 3 to 6 and a decrease whenthe concentration exceeds the last value The lowest slope was obtained for solutionhaving the concentration 12 followed by 3 while 6 solution has the highest value
Original Research Article
Stanciu JSRR Article no JSRR201411009
1519
This suggests that EPDM can be a better viscosity improver for the mineral oil SAE 10W-40 both at low and high concentrations
Rheology of polymer concentrated solutions represents a cross-disciplinary field using widespectra of theoretical tools from physics and chemistry [1-3] For physicists understandingthe configuration and dynamics of long polymer chains has been a significant source ofproblems within statistical physics from the 1950rsquos onwards One of the reasons whyphysicists were drawn to the problem is the universality of polymer properties [4-8] Withinthe time and length scales much exceeding the atomic ones universal theories have beenbuilt well describing the main features in the polymer behavior insensitive to the details ofthe chemistry of the chains Among these theories the most popular are the Rouse andZimm models in which the polymer is represented as a chain of beads under Brownianmotion [9-12]
Additive effectively thickens the oil at all temperatures but the increase of viscosity is morepronounced at high temperatures The lubricating effect extends across a wider temperaturerange and the oil becomes thus a multi-grade one Its viscosity still decreases logarithmicallywith temperature but the slope representing the change is lessened This slope isdependent on the nature and amount of additive to the base oil [13-15]
The purpose of this study was to obtain automotive multi-grade oils They have a number ofadvantages such as easy starting cold engine reducing wear and decrease the formation ofdeposits in the engine Multi-grade oil can be used longer than the engine base oils becausethey are more highly refined and contain large proportions of additives Rheological behaviorand viscosity index properties are of great importance in terms of operation and fuelconsumption of an engine the oil viscosity increases the multi-grade oil consumption islower [16-21]
The object of this paper is to determine the rheological behaviour of some concentratedsolutions of copolymer EPDM produced by DSM Elastomers Europe BV and recommendedas viscosity improvers for multi-grade mineral oils at shear rates ranging between 3 and1312 s-1 and temperatures between 40 and 100ordmC to estimate their efficiency as lubricatingadditives for the low viscosity mineral oil SAE 10W-40
2 MATERIALS AND METHODS
The following copolymer was used as viscosity improvers ethylene-propylene-(ter) polymer(EPDM) product on DSM Thermoplastic Elastomers Europe BV The low viscosity oil SAE10W-40 (INCERP Romania) was used as mineral oil
Copolymer EPDM is recommended for plastics modification and oil modification forapplication in automotive construction wire and cable and general rubber good Thechemical and physical properties of Copolymer EPDM are physical state - solid form - balesor granulate colour ndash natural opaque brown in case of oil extended grades odour ndash weakparaffinic relative density 860-900 Kgm-3 bulk density depending on bale or granulate
Stanciu JSRR Article no JSRR201411009
1520
structure insoluble in water soluble in hydrocarbons such as (alkanes hexane heptanesoctane decane dodecane iso-octane isododecane cycloalkanes cyclo-octane decalinecyclododecane aromatic substances butyl benzene octylbenyene and oil paraffinicnaphthenic aromatic Typical of ethylene-propylene number-average molecular weight (4-20) 10000 molecular weight (20-40) 10000 visco-average molecular weight of the wind 10-40 million Their ratio which can be taken as a measure of copolymer polydispersity is 237The composition copolymer of a EPDM is 45 propylene 525 ethylene and 25 dienemonomer
The properties physico-chemicals oil SAE10W-40 are density 0872103 kgm-3 kinematicviscosity at 40ordmC ndash 1085 cSt kinematic viscosity at 1000C ndash 154cSt viscosity index ndash 149viscosity-temperature coefficient (VTC) ndash 08580 CCS viscosity at -25ordmC ndash 6270 cP flashpoint ndash 220ordmC pour point - -37ordmC sulfated ash ndash 086 neutralization No (TBN-E) ndash 71and color 2
The dissolution of the copolymer was performed at room temperature with continuousshaking for several weeks
Solutions has the concentrations 3 6 10 and 12 gdL were prepared EPDM requires muchmore time for complete dissolution Concentration range indicated by the importing firm thatis between 1 and 12 and temperature range have chosen to follow the behaviour of thepolymer in the engine The range of 1-3 concentrations or could not make determinationswith Viscometer used
The rheological behaviour of solutions was determined using a Haake VT 550 Viscotesterdeveloping shear rates ranging between 3 and 1312 s-1 and measuring viscosities from 104
to 106 mPas when the HV1 viscosity sensor is used The solutions concentrated ofthe copolymers were investigated in the temperature range of 40 -100ordmC The accuracy ofthe temperature was plusmn01ordmC
To calculate the value of the shear stress the following equation is used
σ = Z α (1)
where represents the constant of the rotating cylinder The z value depends on the sizes ofthe cylinders and on the constant of action for the spring chosen from the apparatusconstant sheet α ndash factor that is read after each determination The accuracy of measuringshear stress was +- 1
3 RESULTS AND DISCUSSION
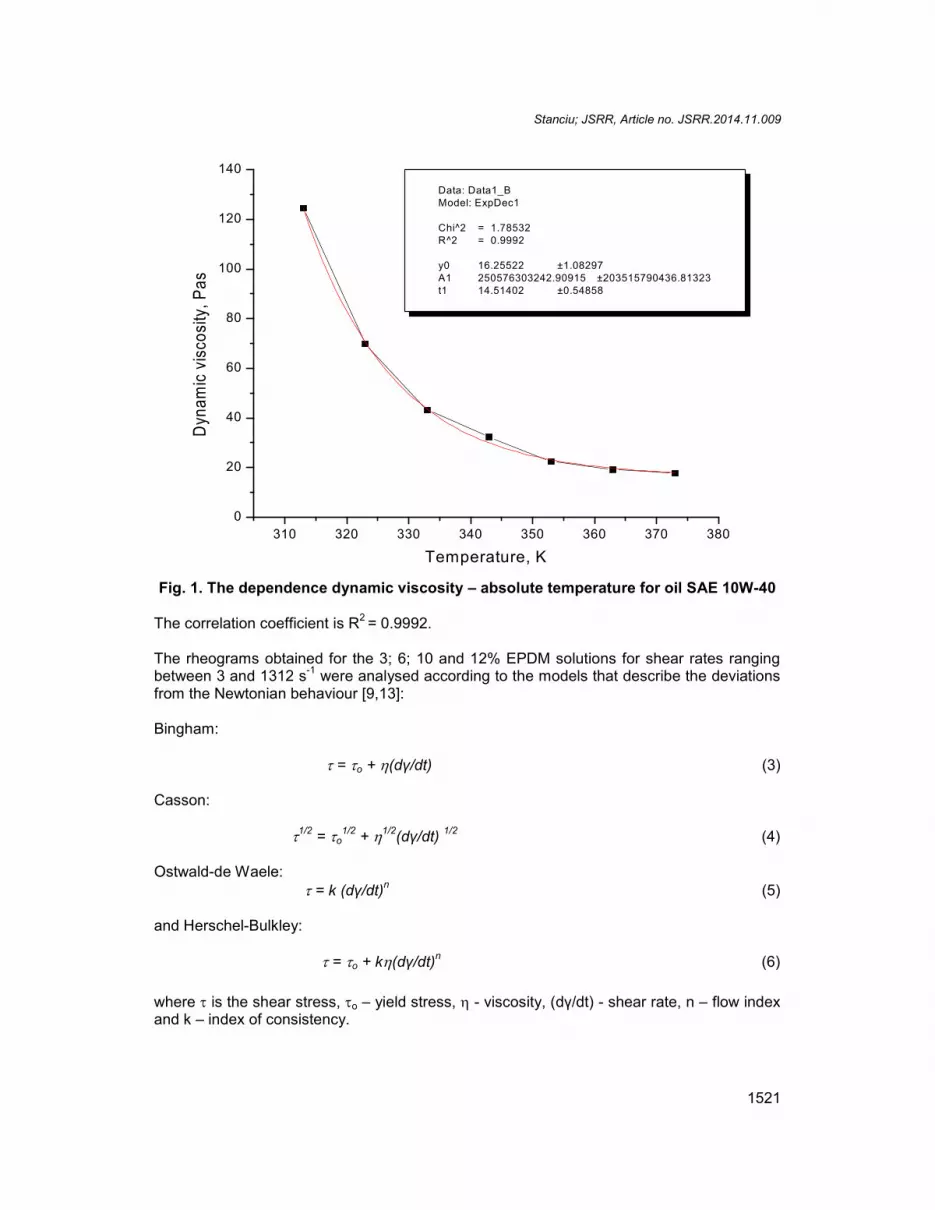
The Fig 1 shows dependence dynamic viscosity on absolute temperature for oil SAE 10W-40 without additives The dynamic viscosity of oil decreases exponentially with increasingabsolute temperature by an equation of the form (2)
Fig 1 The dependence dynamic viscosity ndash absolute temperature for oil SAE 10W-40
The correlation coefficient is R2 = 09992
The rheograms obtained for the 3 6 10 and 12 EPDM solutions for shear rates rangingbetween 3 and 1312 s-1 were analysed according to the models that describe the deviationsfrom the Newtonian behaviour [913]
Bingham
= o + (dγdt) (3)
Casson
12 = o12 + 12(dγdt) 12 (4)
Ostwald-de Waele = k (dγdt)n (5)
and Herschel-Bulkley
= o + k(dγdt)n (6)
where is the shear stress o ndash yield stress - viscosity (dγdt) - shear rate n ndash flow indexand k ndash index of consistency
Stanciu JSRR Article no JSRR201411009
1522
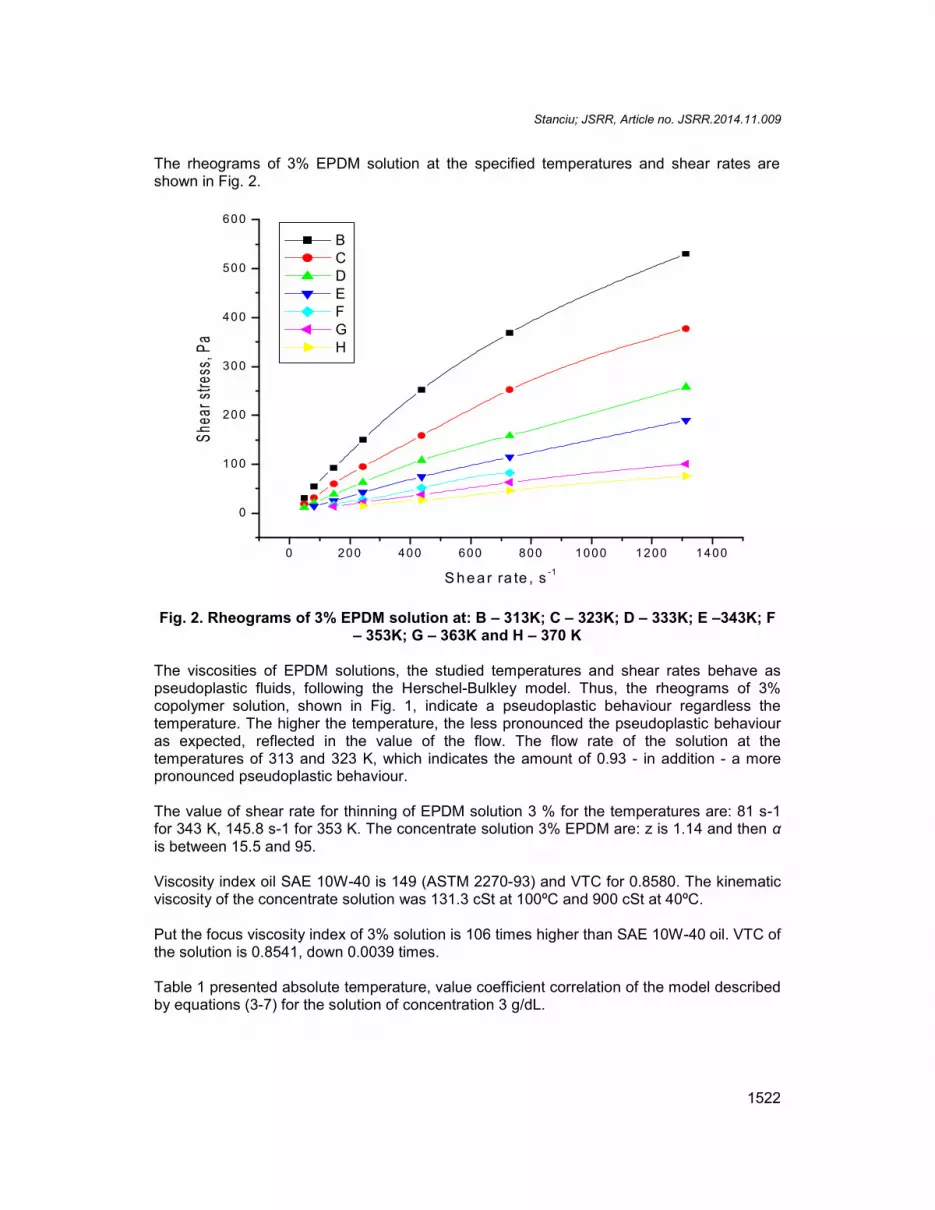
The rheograms of 3 EPDM solution at the specified temperatures and shear rates areshown in Fig 2
0 200 400 600 800 1000 1200 1400
0
100
200
300
400
500
600Sh
ear s
tress
Pa
S hea r ra te s -1
B C D E F G H
Fig 2 Rheograms of 3 EPDM solution at B ndash 313K C ndash 323K D ndash 333K E ndash343K Fndash 353K G ndash 363K and H ndash 370 K
The viscosities of EPDM solutions the studied temperatures and shear rates behave aspseudoplastic fluids following the Herschel-Bulkley model Thus the rheograms of 3copolymer solution shown in Fig 1 indicate a pseudoplastic behaviour regardless thetemperature The higher the temperature the less pronounced the pseudoplastic behaviouras expected reflected in the value of the flow The flow rate of the solution at thetemperatures of 313 and 323 K which indicates the amount of 093 - in addition - a morepronounced pseudoplastic behaviour
The value of shear rate for thinning of EPDM solution 3 for the temperatures are 81 s-1for 343 K 1458 s-1 for 353 K The concentrate solution 3 EPDM are z is 114 and then αis between 155 and 95
Viscosity index oil SAE 10W-40 is 149 (ASTM 2270-93) and VTC for 08580 The kinematicviscosity of the concentrate solution was 1313 cSt at 100ordmC and 900 cSt at 40ordmC
Put the focus viscosity index of 3 solution is 106 times higher than SAE 10W-40 oil VTC ofthe solution is 08541 down 00039 times
Table 1 presented absolute temperature value coefficient correlation of the model describedby equations (3-7) for the solution of concentration 3 gdL
Stanciu JSRR Article no JSRR201411009
1523
The model proposed to describe the dependence of shear stress vs shear rate for theconcentration of solutions of 3 6 10 and 12 is described by equation (7)
= A + B(dγdt)+C(dγdt)2 (7)
The parameters A B and C were obtained by fitting a polynomial solution concentrationrheogram 3 absolute temperature of 313 K A = 639202 B = 063535 and C = -180371E-4
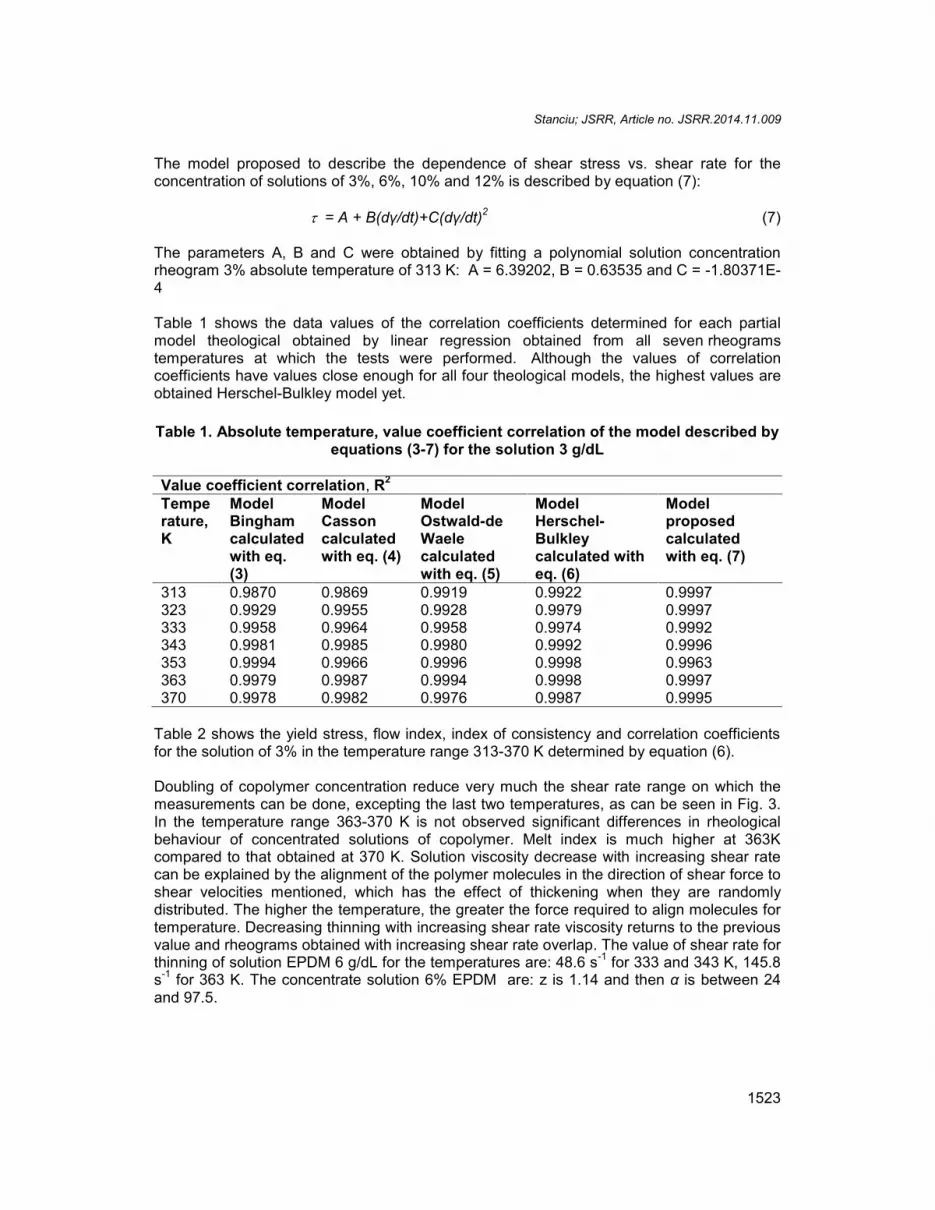
Table 1 shows the data values of the correlation coefficients determined for each partialmodel theological obtained by linear regression obtained from all seven rheogramstemperatures at which the tests were performed Although the values of correlationcoefficients have values close enough for all four theological models the highest values areobtained Herschel-Bulkley model yet
Table 1 Absolute temperature value coefficient correlation of the model described byequations (3-7) for the solution 3 gdL
Table 2 shows the yield stress flow index index of consistency and correlation coefficientsfor the solution of 3 in the temperature range 313-370 K determined by equation (6)
Doubling of copolymer concentration reduce very much the shear rate range on which themeasurements can be done excepting the last two temperatures as can be seen in Fig 3In the temperature range 363-370 K is not observed significant differences in rheologicalbehaviour of concentrated solutions of copolymer Melt index is much higher at 363Kcompared to that obtained at 370 K Solution viscosity decrease with increasing shear ratecan be explained by the alignment of the polymer molecules in the direction of shear force toshear velocities mentioned which has the effect of thickening when they are randomlydistributed The higher the temperature the greater the force required to align molecules fortemperature Decreasing thinning with increasing shear rate viscosity returns to the previousvalue and rheograms obtained with increasing shear rate overlap The value of shear rate forthinning of solution EPDM 6 gdL for the temperatures are 486 s-1 for 333 and 343 K 1458s-1 for 363 K The concentrate solution 6 EPDM are z is 114 and then α is between 24and 975
Stanciu JSRR Article no JSRR201411009
1524
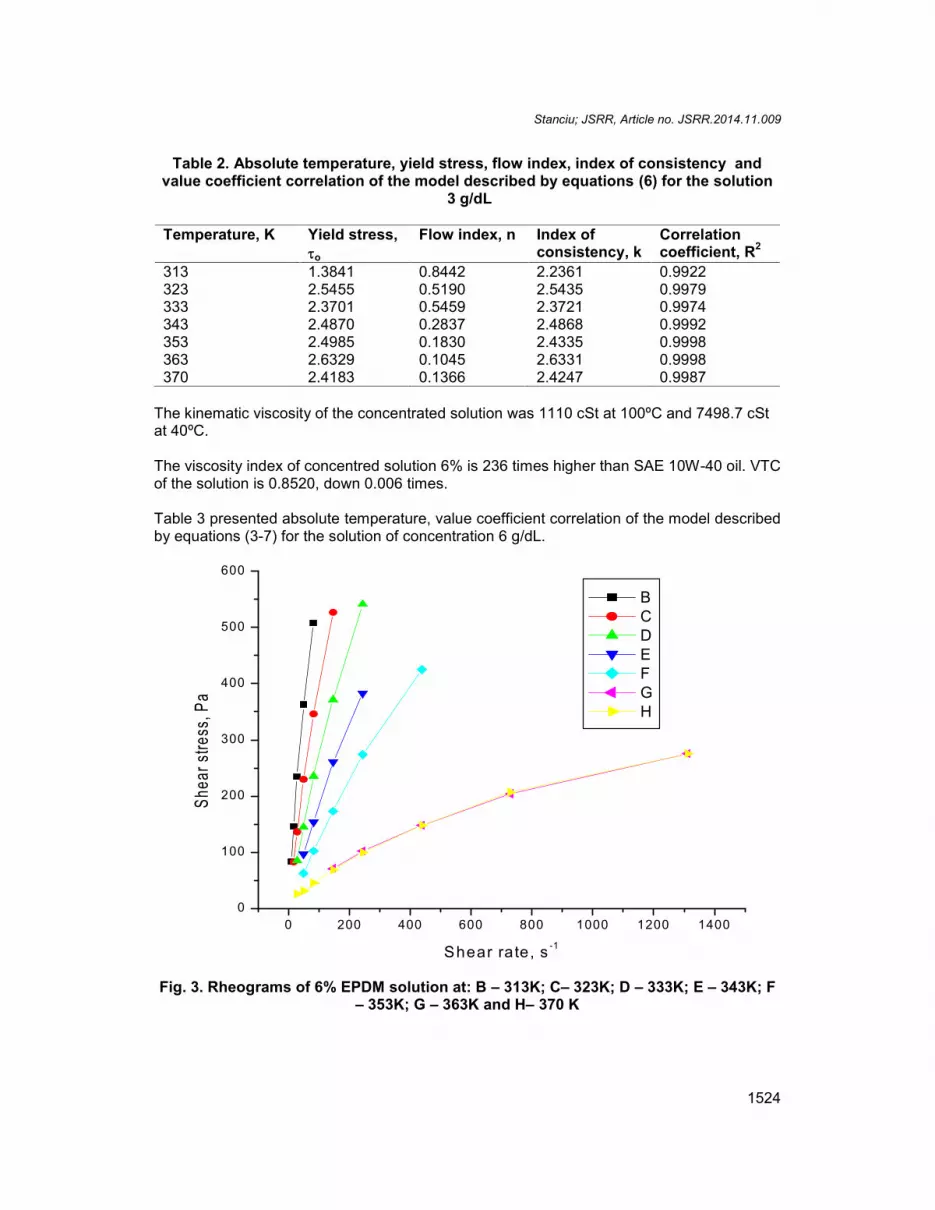
Table 2 Absolute temperature yield stress flow index index of consistency andvalue coefficient correlation of the model described by equations (6) for the solution
The kinematic viscosity of the concentrated solution was 1110 cSt at 100ordmC and 74987 cStat 40ordmC
The viscosity index of concentred solution 6 is 236 times higher than SAE 10W-40 oil VTCof the solution is 08520 down 0006 times
Table 3 presented absolute temperature value coefficient correlation of the model describedby equations (3-7) for the solution of concentration 6 gdL
0 200 400 600 800 1000 1200 14000
100
200
300
400
500
600
Shea
r stre
ss P
a
Shear rate s -1
B C D E F G H
Fig 3 Rheograms of 6 EPDM solution at B ndash 313K Cndash 323K D ndash 333K E ndash 343K Fndash 353K G ndash 363K and Hndash 370 K
Stanciu JSRR Article no JSRR201411009
1525
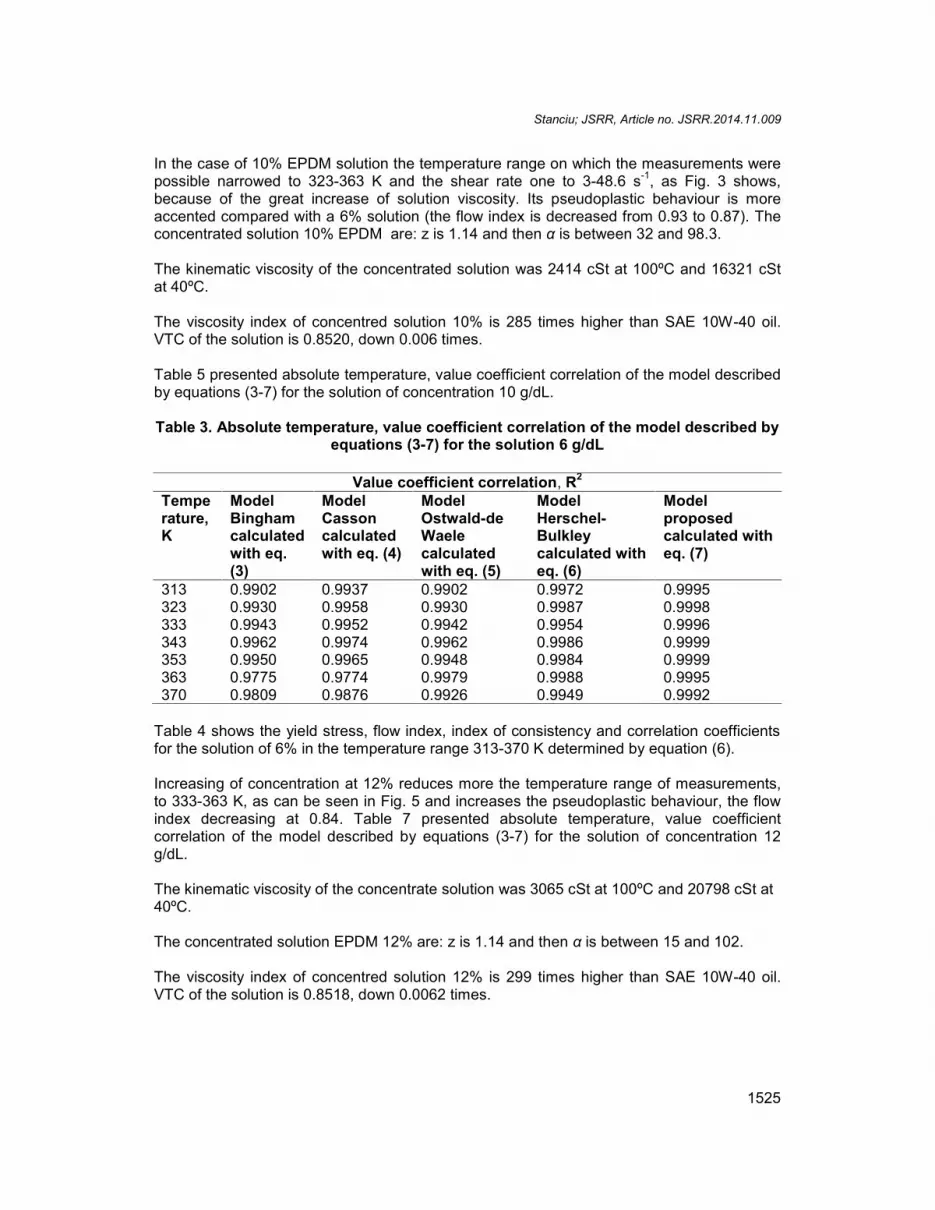
In the case of 10 EPDM solution the temperature range on which the measurements werepossible narrowed to 323-363 K and the shear rate one to 3-486 s-1 as Fig 3 showsbecause of the great increase of solution viscosity Its pseudoplastic behaviour is moreaccented compared with a 6 solution (the flow index is decreased from 093 to 087) Theconcentrated solution 10 EPDM are z is 114 and then α is between 32 and 983
The kinematic viscosity of the concentrated solution was 2414 cSt at 100ordmC and 16321 cStat 40ordmC
The viscosity index of concentred solution 10 is 285 times higher than SAE 10W-40 oilVTC of the solution is 08520 down 0006 times
Table 5 presented absolute temperature value coefficient correlation of the model describedby equations (3-7) for the solution of concentration 10 gdL
Table 3 Absolute temperature value coefficient correlation of the model described byequations (3-7) for the solution 6 gdL
Table 4 shows the yield stress flow index index of consistency and correlation coefficientsfor the solution of 6 in the temperature range 313-370 K determined by equation (6)
Increasing of concentration at 12 reduces more the temperature range of measurementsto 333-363 K as can be seen in Fig 5 and increases the pseudoplastic behaviour the flowindex decreasing at 084 Table 7 presented absolute temperature value coefficientcorrelation of the model described by equations (3-7) for the solution of concentration 12gdL
The kinematic viscosity of the concentrate solution was 3065 cSt at 100ordmC and 20798 cSt at40ordmC
The concentrated solution EPDM 12 are z is 114 and then α is between 15 and 102
The viscosity index of concentred solution 12 is 299 times higher than SAE 10W-40 oilVTC of the solution is 08518 down 00062 times
Stanciu JSRR Article no JSRR201411009
1526
0 5 10 15 20 25 30 35 40 45 50
50
100
150
200
250
300
350
400
450
500
550
600Sh
ear s
tress
Pa
S hear ra te s -1
B C D E F
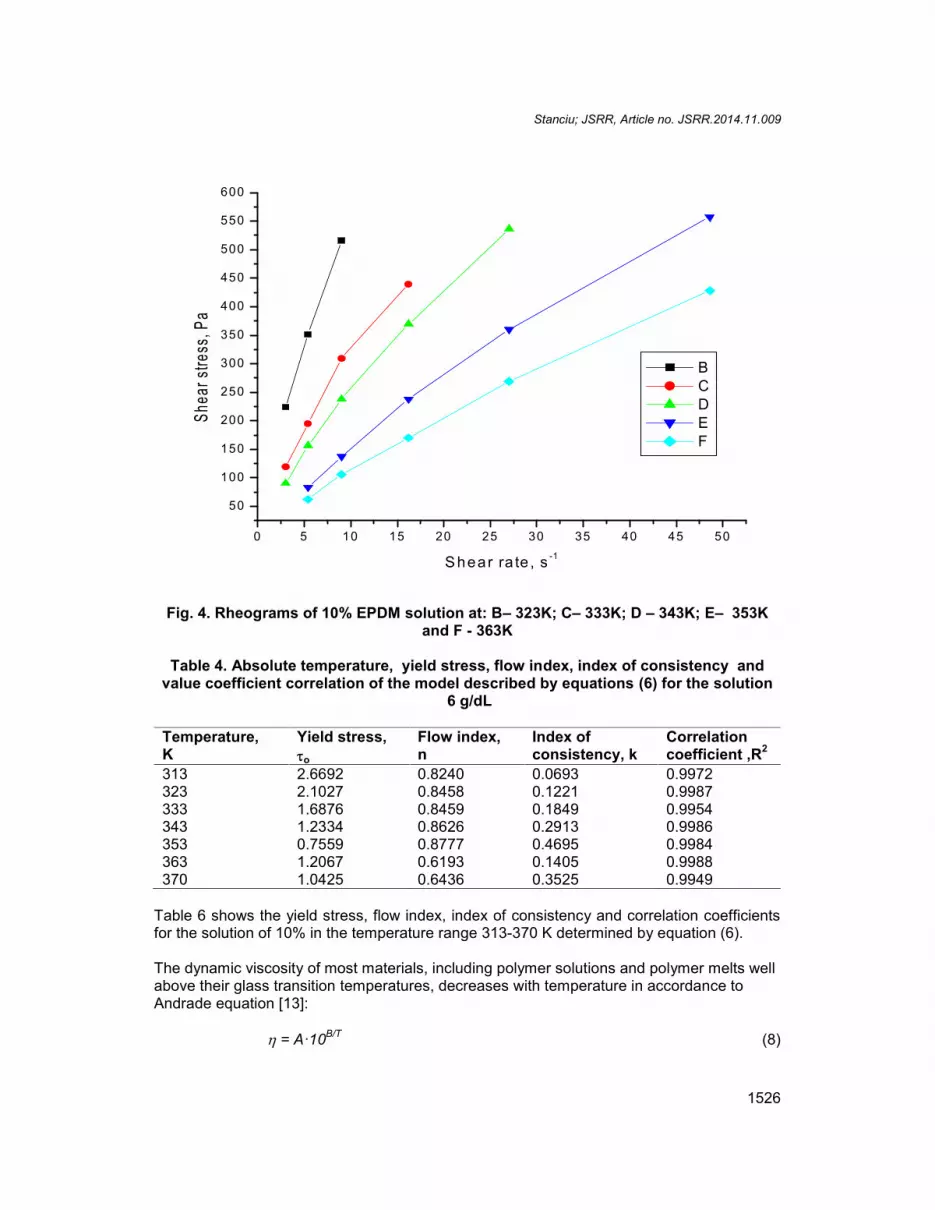
Fig 4 Rheograms of 10 EPDM solution at Bndash 323K Cndash 333K D ndash 343K Endash 353Kand F - 363K
Table 4 Absolute temperature yield stress flow index index of consistency andvalue coefficient correlation of the model described by equations (6) for the solution
Table 6 shows the yield stress flow index index of consistency and correlation coefficientsfor the solution of 10 in the temperature range 313-370 K determined by equation (6)
The dynamic viscosity of most materials including polymer solutions and polymer melts wellabove their glass transition temperatures decreases with temperature in accordance toAndrade equation [13]
= Amiddot10BT (8)
Stanciu JSRR Article no JSRR201411009
1527
where A and B are constants characteristic of the polymer and T is the absolutetemperature
Table 5 Absolute temperature value coefficient correlation of the model described byequations (3-7) for the solution 10 gdL
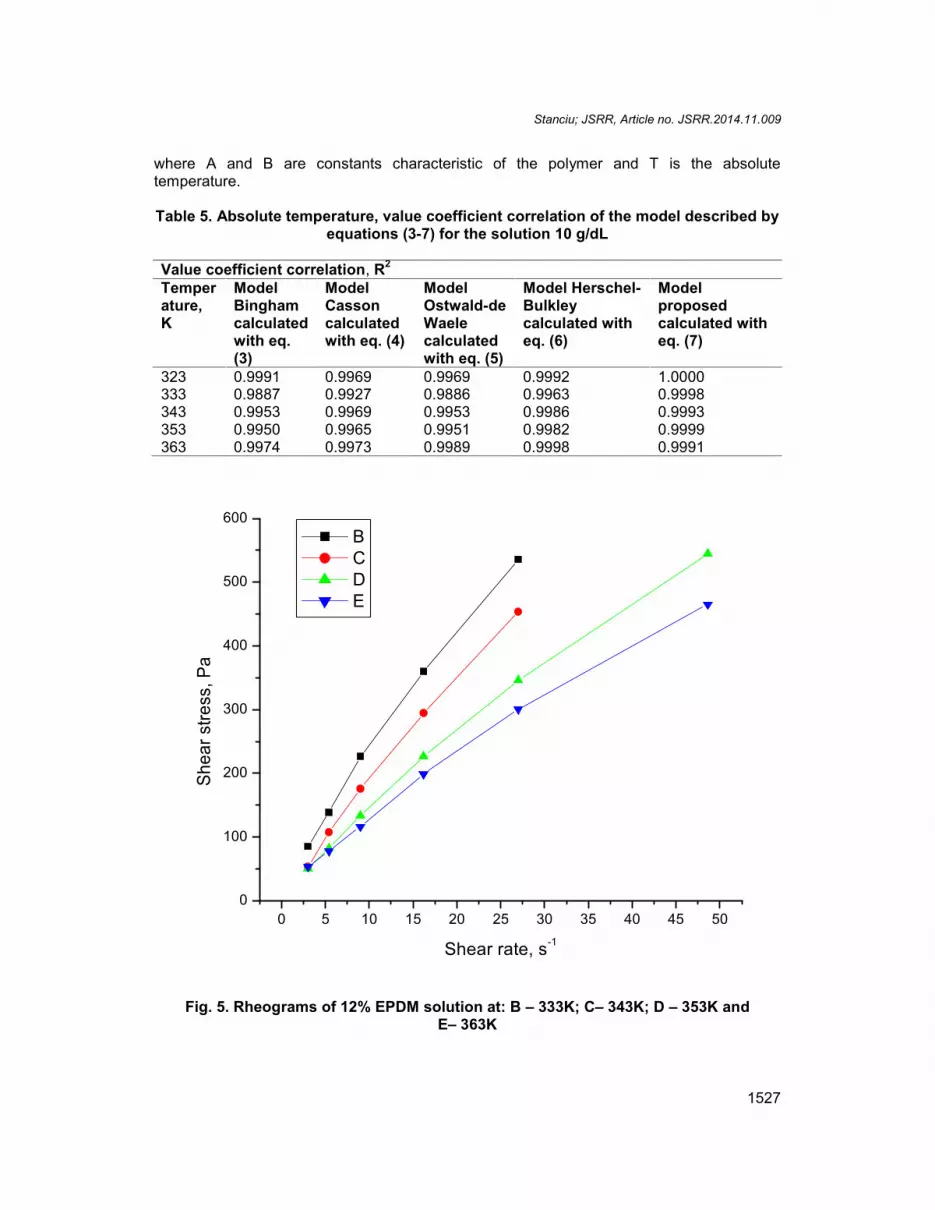
Fig 5 Rheograms of 12 EPDM solution at B ndash 333K Cndash 343K D ndash 353K andEndash 363K
Stanciu JSRR Article no JSRR201411009
1528
Table 6 Absolute temperature yield stress flow index index of consistency andvalue coefficient correlation of the model described by equations (6) for the solution
Table 8 shows the yield stress flow index index of consistency and correlation coefficientsfor the solution of 12 in the temperature range 313-370 K determined by equation (6)
Table 8 Absolute temperature yield stress flow index index of consistency andvalue coefficient correlation of the model described by equations (6) for the solution
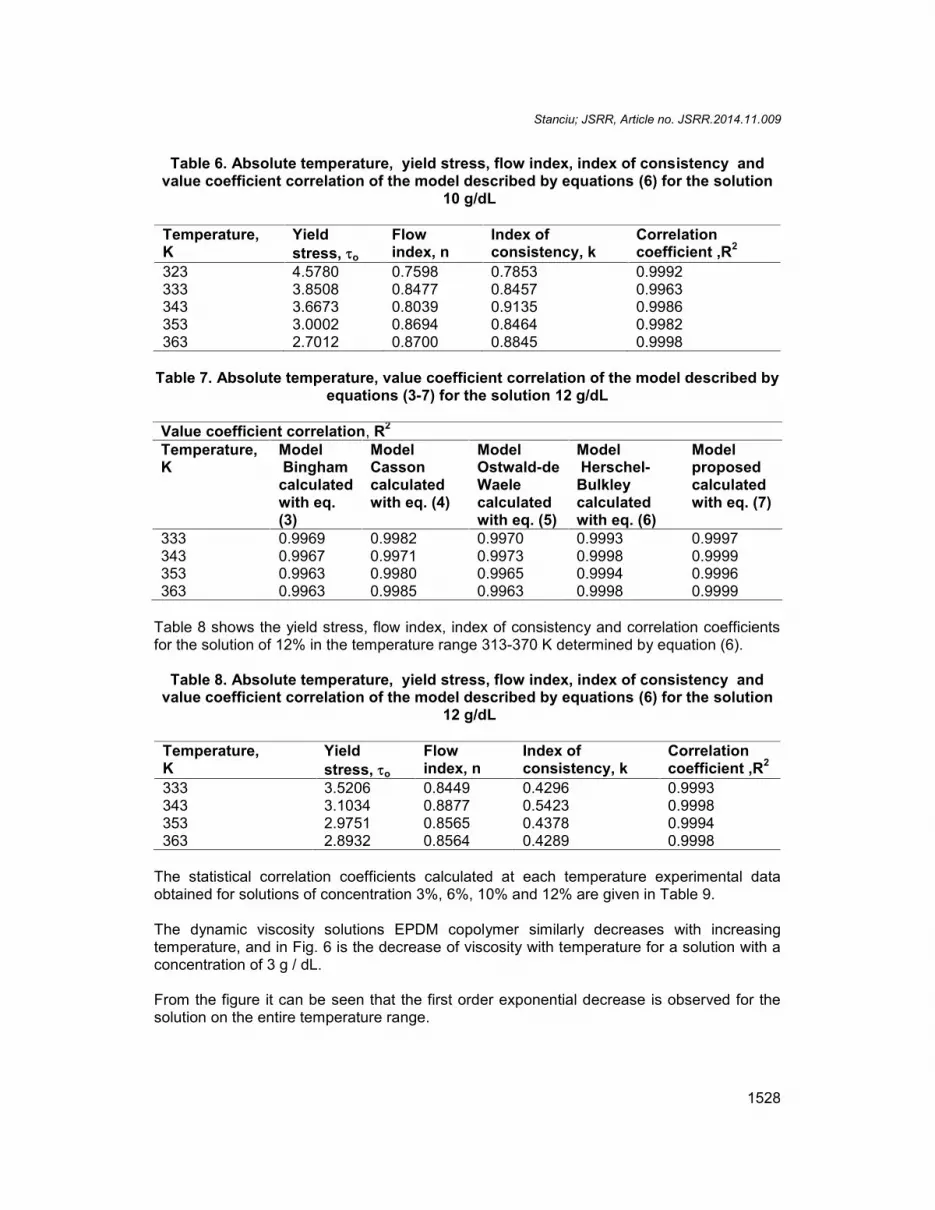
The statistical correlation coefficients calculated at each temperature experimental dataobtained for solutions of concentration 3 6 10 and 12 are given in Table 9
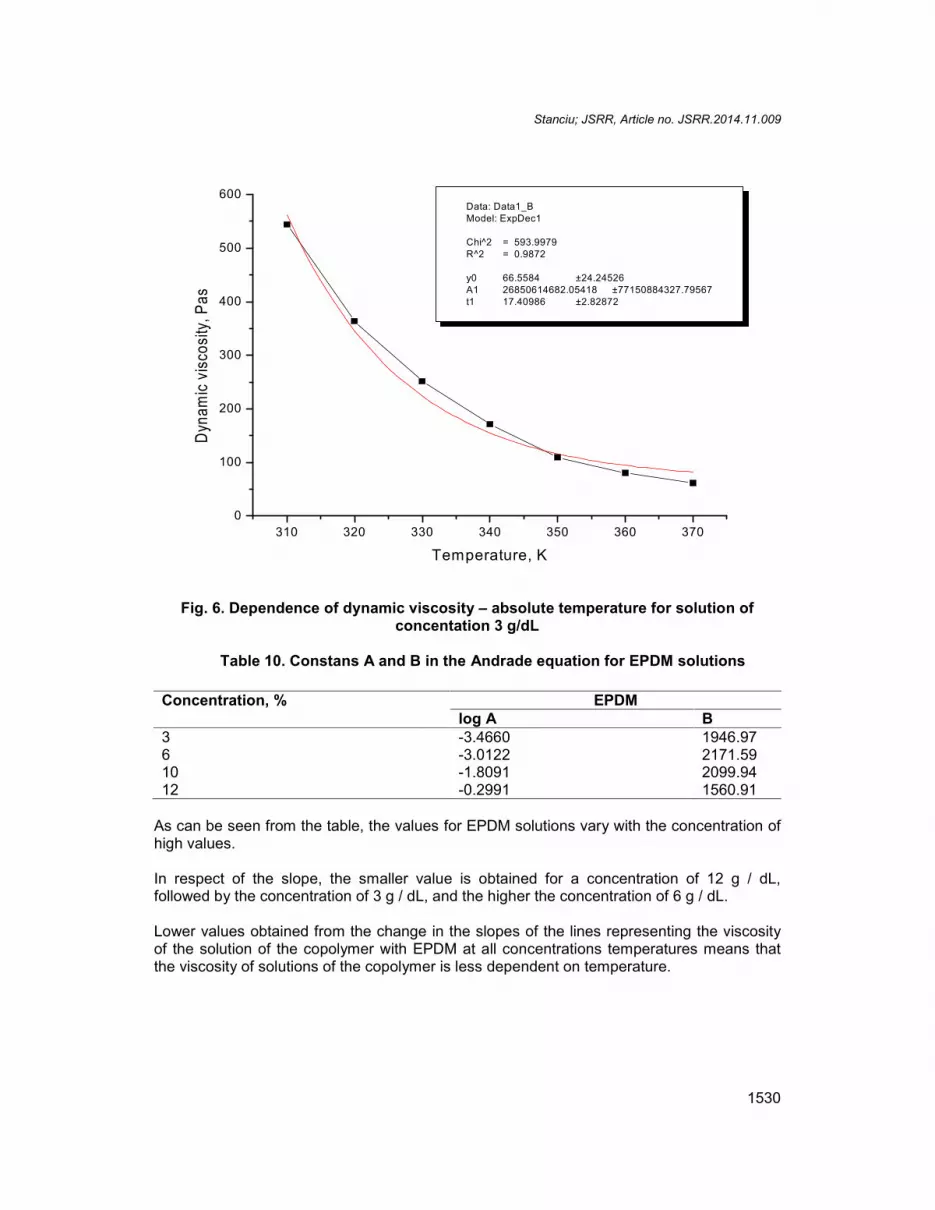
The dynamic viscosity solutions EPDM copolymer similarly decreases with increasingtemperature and in Fig 6 is the decrease of viscosity with temperature for a solution with aconcentration of 3 g dL
From the figure it can be seen that the first order exponential decrease is observed for thesolution on the entire temperature range
Stanciu JSRR Article no JSRR201411009
1529
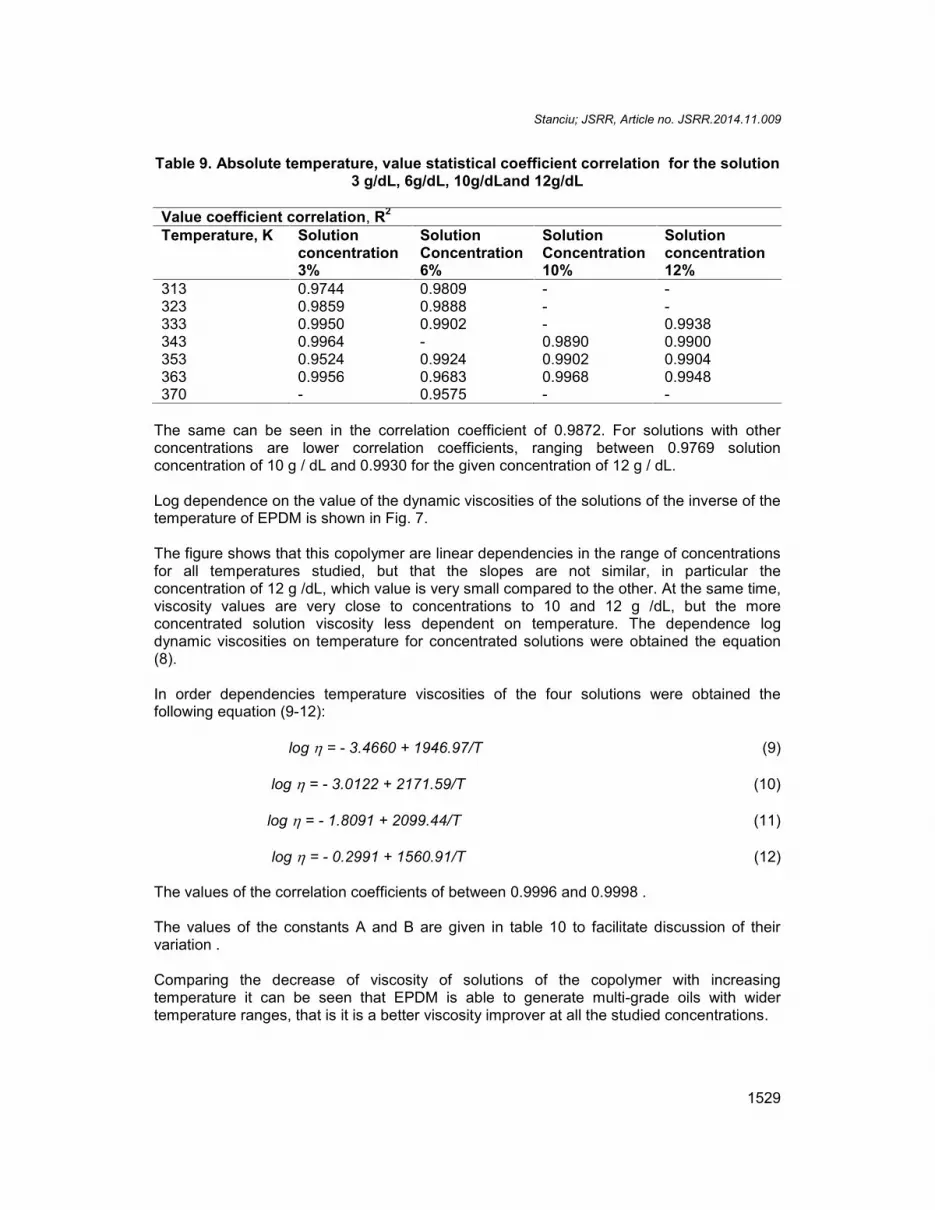
Table 9 Absolute temperature value statistical coefficient correlation for the solution3 gdL 6gdL 10gdLand 12gdL
The same can be seen in the correlation coefficient of 09872 For solutions with otherconcentrations are lower correlation coefficients ranging between 09769 solutionconcentration of 10 g dL and 09930 for the given concentration of 12 g dL
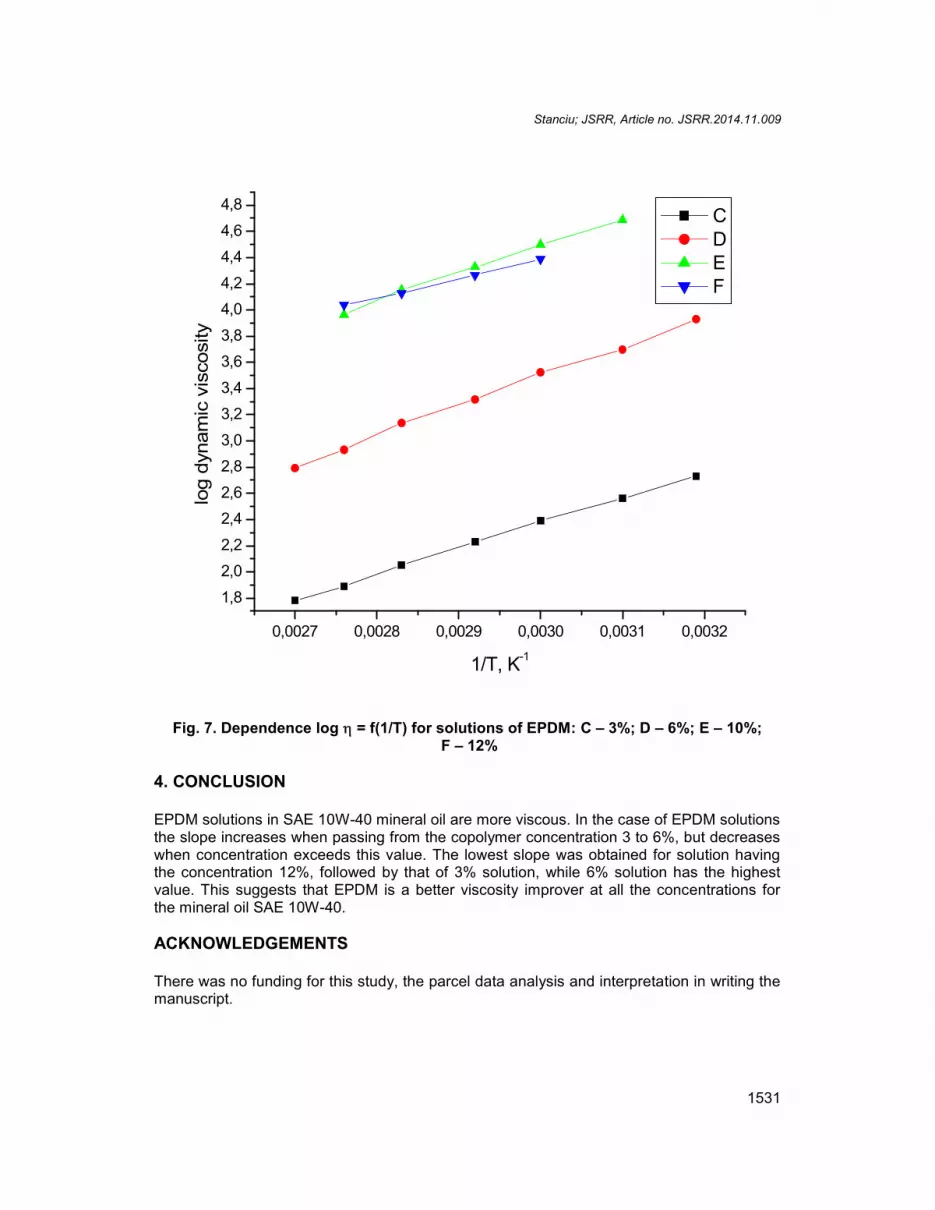
Log dependence on the value of the dynamic viscosities of the solutions of the inverse of thetemperature of EPDM is shown in Fig 7
The figure shows that this copolymer are linear dependencies in the range of concentrationsfor all temperatures studied but that the slopes are not similar in particular theconcentration of 12 g dL which value is very small compared to the other At the same timeviscosity values are very close to concentrations to 10 and 12 g dL but the moreconcentrated solution viscosity less dependent on temperature The dependence logdynamic viscosities on temperature for concentrated solutions were obtained the equation(8)
In order dependencies temperature viscosities of the four solutions were obtained thefollowing equation (9-12)
log = - 34660 + 194697T (9)
log = - 30122 + 217159T (10)
log = - 18091 + 209944T (11)
log = - 02991 + 156091T (12)
The values of the correlation coefficients of between 09996 and 09998
The values of the constants A and B are given in table 10 to facilitate discussion of theirvariation
Comparing the decrease of viscosity of solutions of the copolymer with increasingtemperature it can be seen that EPDM is able to generate multi-grade oils with widertemperature ranges that is it is a better viscosity improver at all the studied concentrations
Fig 6 Dependence of dynamic viscosity ndash absolute temperature for solution ofconcentation 3 gdL
Table 10 Constans A and B in the Andrade equation for EPDM solutions
Concentration EPDMlog A B
361012
-34660-30122-18091-02991
194697217159209994156091
As can be seen from the table the values for EPDM solutions vary with the concentration ofhigh values
In respect of the slope the smaller value is obtained for a concentration of 12 g dLfollowed by the concentration of 3 g dL and the higher the concentration of 6 g dL
Lower values obtained from the change in the slopes of the lines representing the viscosityof the solution of the copolymer with EPDM at all concentrations temperatures means thatthe viscosity of solutions of the copolymer is less dependent on temperature
Stanciu JSRR Article no JSRR201411009
1531
00027 00028 00029 00030 00031 00032
18202224262830323436384042444648
log
dyna
mic
vis
cosi
ty
1T K-1
C D E F
Fig 7 Dependence log = f(1T) for solutions of EPDM C ndash 3 D ndash 6 E ndash 10F ndash 12
4 CONCLUSION
EPDM solutions in SAE 10W-40 mineral oil are more viscous In the case of EPDM solutionsthe slope increases when passing from the copolymer concentration 3 to 6 but decreaseswhen concentration exceeds this value The lowest slope was obtained for solution havingthe concentration 12 followed by that of 3 solution while 6 solution has the highestvalue This suggests that EPDM is a better viscosity improver at all the concentrations forthe mineral oil SAE 10W-40
ACKNOWLEDGEMENTS
There was no funding for this study the parcel data analysis and interpretation in writing themanuscript
Stanciu JSRR Article no JSRR201411009
1532
COMPETING INTERESTS
Author has declared that no competing interests exist
REFERENCES
1 Gericke M Schlufter K Liebert T Heinze T Budtova T Rheological properties ofcelluloseionic liquid solutions From dilute to concentrated states Biomacromolecules200910(5)1188-1194
2 Uppuluri S Keinath SE Tomalia DA Dvornic PR Rheology of dendrimers INewtonian flow behavior of medium and highly concentrated solutions ofpolyamidoamine (PAMAM) dendrimers in ethylenediamine (EDA)solvent Macromolecules 199831(14)4498-4510
3 Quemada D Rheology of concentrated disperse systems II A model for non-newtonian shear viscosity in steady flows Rheologica Acta 197817(6)632-642
4 Chauveteau G Rodlike polymer solution flow through fine pores Influence of poresize on rheological behavior Journal of Rheology 198226111
5 Flomenbom O Silbey RJ Utilizing the information content in two-statetrajectories Proceedings of the National Academy of Sciences 2006103(29)10907-10910
6 Toacutethovaacute J Lisyacute V Relaxation times of flexible polymer chains in solution from non-conventional viscosity measurements Open Macromolecules Journal 20104(1)26-31
7 Osa M Ueda H Yoshizaki T Yamakawa H First cumulant of the dynamic structurefactor for polymers in Θ solvents Effects of chain stiffness and local chainconformation Polymer Journal 200638(2)153-158
8 Toacutethovaacute J Lisyacute V Relaxation times of flexible polymer chains in solution from non-conventional viscosity measurements Open Macromolecules Journal 20104(1)26-31
9 Larson RG The rheology of dilute solutions of flexible polymers Progress andproblems J Rheol 2005491
10 Kremer K Sukumaran SK Everaers R Grest GS Entangled polymersystems Computer physics communications 2005169(1)75-81
11 Lisy V Tothova J Zatovsky AV Long-time dynamics of RousendashZimm polymers indilute solutions with hydrodynamic memory The Journal of Chemical Physics2004121106-99
12 Tchesskaya T A generalized Zimm model Hydrodynamic screening in polymersolutions Journal of Molecular Liquids 2009150(1)77-80
13 Bender Jonathan W Norman JW Optical measurement of the contributions ofcolloidal forces to the rheology of concentrated suspensions Journal of Colloid andInterface Science 19951721171-184
14 Strivens TA The rheological properties of concentrated cetyltrimethylammoniumbromide-salicylic acid solutions in water Colloid and Polymer Science 1989267(3)269-280
15 Tothova J Brutovsky B Lisy V Monomer dynamics in single-and double-strandedDNA coils The European Physical Journal E 200724(1)61-67
16 Barrow MS Brown SWJ Cordy S Williams PR Williams RL Rheology of multigradeengine oils in high deformation rate extensional flows International Journal of EngineResearch 20045(4)349-364
Stanciu JSRR Article no JSRR201411009
1533
17 Bala V Rollin AJ Brandt G Rheological properties affecting the fuel economy ofmultigrade automotive gear lubricants Training 2014200003-24
18 Palacios JM Bajon ML Effective viscosity of oils containing VI improver and itsrelation to wear Tribology International 198316(1)27-31
19 Eckert RJA Covey DF Developments in the field of hydrogenated diene copolymersas viscosity index improvers Lubrication Science 19881(1)65-80
20 Bair S Reference liquids for quantitative elastohydrodynamics Selection andrheological characterization Tribology Letters 200622(2)197-206
21 Mufti RA Jefferies A Novel method of measuring tappet rotation and the effect oflubricant rheology Tribology International 200841(11)1039-1048
_________________________________________________________________________copy 2014 Stanciu This is an Open Access article distributed under the terms of the Creative Commons AttributionLicense (httpcreativecommonsorglicensesby30) which permits unrestricted use distribution and reproductionin any medium provided the original work is properly cited
Peer-review historyThe peer review history for this paper can be accessed here
Rheology of polymer concentrated solutions represents a cross-disciplinary field using widespectra of theoretical tools from physics and chemistry [1-3] For physicists understandingthe configuration and dynamics of long polymer chains has been a significant source ofproblems within statistical physics from the 1950rsquos onwards One of the reasons whyphysicists were drawn to the problem is the universality of polymer properties [4-8] Withinthe time and length scales much exceeding the atomic ones universal theories have beenbuilt well describing the main features in the polymer behavior insensitive to the details ofthe chemistry of the chains Among these theories the most popular are the Rouse andZimm models in which the polymer is represented as a chain of beads under Brownianmotion [9-12]
Additive effectively thickens the oil at all temperatures but the increase of viscosity is morepronounced at high temperatures The lubricating effect extends across a wider temperaturerange and the oil becomes thus a multi-grade one Its viscosity still decreases logarithmicallywith temperature but the slope representing the change is lessened This slope isdependent on the nature and amount of additive to the base oil [13-15]
The purpose of this study was to obtain automotive multi-grade oils They have a number ofadvantages such as easy starting cold engine reducing wear and decrease the formation ofdeposits in the engine Multi-grade oil can be used longer than the engine base oils becausethey are more highly refined and contain large proportions of additives Rheological behaviorand viscosity index properties are of great importance in terms of operation and fuelconsumption of an engine the oil viscosity increases the multi-grade oil consumption islower [16-21]
The object of this paper is to determine the rheological behaviour of some concentratedsolutions of copolymer EPDM produced by DSM Elastomers Europe BV and recommendedas viscosity improvers for multi-grade mineral oils at shear rates ranging between 3 and1312 s-1 and temperatures between 40 and 100ordmC to estimate their efficiency as lubricatingadditives for the low viscosity mineral oil SAE 10W-40
2 MATERIALS AND METHODS
The following copolymer was used as viscosity improvers ethylene-propylene-(ter) polymer(EPDM) product on DSM Thermoplastic Elastomers Europe BV The low viscosity oil SAE10W-40 (INCERP Romania) was used as mineral oil
Copolymer EPDM is recommended for plastics modification and oil modification forapplication in automotive construction wire and cable and general rubber good Thechemical and physical properties of Copolymer EPDM are physical state - solid form - balesor granulate colour ndash natural opaque brown in case of oil extended grades odour ndash weakparaffinic relative density 860-900 Kgm-3 bulk density depending on bale or granulate
Stanciu JSRR Article no JSRR201411009
1520
structure insoluble in water soluble in hydrocarbons such as (alkanes hexane heptanesoctane decane dodecane iso-octane isododecane cycloalkanes cyclo-octane decalinecyclododecane aromatic substances butyl benzene octylbenyene and oil paraffinicnaphthenic aromatic Typical of ethylene-propylene number-average molecular weight (4-20) 10000 molecular weight (20-40) 10000 visco-average molecular weight of the wind 10-40 million Their ratio which can be taken as a measure of copolymer polydispersity is 237The composition copolymer of a EPDM is 45 propylene 525 ethylene and 25 dienemonomer
The properties physico-chemicals oil SAE10W-40 are density 0872103 kgm-3 kinematicviscosity at 40ordmC ndash 1085 cSt kinematic viscosity at 1000C ndash 154cSt viscosity index ndash 149viscosity-temperature coefficient (VTC) ndash 08580 CCS viscosity at -25ordmC ndash 6270 cP flashpoint ndash 220ordmC pour point - -37ordmC sulfated ash ndash 086 neutralization No (TBN-E) ndash 71and color 2
The dissolution of the copolymer was performed at room temperature with continuousshaking for several weeks
Solutions has the concentrations 3 6 10 and 12 gdL were prepared EPDM requires muchmore time for complete dissolution Concentration range indicated by the importing firm thatis between 1 and 12 and temperature range have chosen to follow the behaviour of thepolymer in the engine The range of 1-3 concentrations or could not make determinationswith Viscometer used
The rheological behaviour of solutions was determined using a Haake VT 550 Viscotesterdeveloping shear rates ranging between 3 and 1312 s-1 and measuring viscosities from 104
to 106 mPas when the HV1 viscosity sensor is used The solutions concentrated ofthe copolymers were investigated in the temperature range of 40 -100ordmC The accuracy ofthe temperature was plusmn01ordmC
To calculate the value of the shear stress the following equation is used
σ = Z α (1)
where represents the constant of the rotating cylinder The z value depends on the sizes ofthe cylinders and on the constant of action for the spring chosen from the apparatusconstant sheet α ndash factor that is read after each determination The accuracy of measuringshear stress was +- 1
3 RESULTS AND DISCUSSION
The Fig 1 shows dependence dynamic viscosity on absolute temperature for oil SAE 10W-40 without additives The dynamic viscosity of oil decreases exponentially with increasingabsolute temperature by an equation of the form (2)
Fig 1 The dependence dynamic viscosity ndash absolute temperature for oil SAE 10W-40
The correlation coefficient is R2 = 09992
The rheograms obtained for the 3 6 10 and 12 EPDM solutions for shear rates rangingbetween 3 and 1312 s-1 were analysed according to the models that describe the deviationsfrom the Newtonian behaviour [913]
Bingham
= o + (dγdt) (3)
Casson
12 = o12 + 12(dγdt) 12 (4)
Ostwald-de Waele = k (dγdt)n (5)
and Herschel-Bulkley
= o + k(dγdt)n (6)
where is the shear stress o ndash yield stress - viscosity (dγdt) - shear rate n ndash flow indexand k ndash index of consistency
Stanciu JSRR Article no JSRR201411009
1522
The rheograms of 3 EPDM solution at the specified temperatures and shear rates areshown in Fig 2
0 200 400 600 800 1000 1200 1400
0
100
200
300
400
500
600Sh
ear s
tress
Pa
S hea r ra te s -1
B C D E F G H
Fig 2 Rheograms of 3 EPDM solution at B ndash 313K C ndash 323K D ndash 333K E ndash343K Fndash 353K G ndash 363K and H ndash 370 K
The viscosities of EPDM solutions the studied temperatures and shear rates behave aspseudoplastic fluids following the Herschel-Bulkley model Thus the rheograms of 3copolymer solution shown in Fig 1 indicate a pseudoplastic behaviour regardless thetemperature The higher the temperature the less pronounced the pseudoplastic behaviouras expected reflected in the value of the flow The flow rate of the solution at thetemperatures of 313 and 323 K which indicates the amount of 093 - in addition - a morepronounced pseudoplastic behaviour
The value of shear rate for thinning of EPDM solution 3 for the temperatures are 81 s-1for 343 K 1458 s-1 for 353 K The concentrate solution 3 EPDM are z is 114 and then αis between 155 and 95
Viscosity index oil SAE 10W-40 is 149 (ASTM 2270-93) and VTC for 08580 The kinematicviscosity of the concentrate solution was 1313 cSt at 100ordmC and 900 cSt at 40ordmC
Put the focus viscosity index of 3 solution is 106 times higher than SAE 10W-40 oil VTC ofthe solution is 08541 down 00039 times
Table 1 presented absolute temperature value coefficient correlation of the model describedby equations (3-7) for the solution of concentration 3 gdL
Stanciu JSRR Article no JSRR201411009
1523
The model proposed to describe the dependence of shear stress vs shear rate for theconcentration of solutions of 3 6 10 and 12 is described by equation (7)
= A + B(dγdt)+C(dγdt)2 (7)
The parameters A B and C were obtained by fitting a polynomial solution concentrationrheogram 3 absolute temperature of 313 K A = 639202 B = 063535 and C = -180371E-4
Table 1 shows the data values of the correlation coefficients determined for each partialmodel theological obtained by linear regression obtained from all seven rheogramstemperatures at which the tests were performed Although the values of correlationcoefficients have values close enough for all four theological models the highest values areobtained Herschel-Bulkley model yet
Table 1 Absolute temperature value coefficient correlation of the model described byequations (3-7) for the solution 3 gdL
Table 2 shows the yield stress flow index index of consistency and correlation coefficientsfor the solution of 3 in the temperature range 313-370 K determined by equation (6)
Doubling of copolymer concentration reduce very much the shear rate range on which themeasurements can be done excepting the last two temperatures as can be seen in Fig 3In the temperature range 363-370 K is not observed significant differences in rheologicalbehaviour of concentrated solutions of copolymer Melt index is much higher at 363Kcompared to that obtained at 370 K Solution viscosity decrease with increasing shear ratecan be explained by the alignment of the polymer molecules in the direction of shear force toshear velocities mentioned which has the effect of thickening when they are randomlydistributed The higher the temperature the greater the force required to align molecules fortemperature Decreasing thinning with increasing shear rate viscosity returns to the previousvalue and rheograms obtained with increasing shear rate overlap The value of shear rate forthinning of solution EPDM 6 gdL for the temperatures are 486 s-1 for 333 and 343 K 1458s-1 for 363 K The concentrate solution 6 EPDM are z is 114 and then α is between 24and 975
Stanciu JSRR Article no JSRR201411009
1524
Table 2 Absolute temperature yield stress flow index index of consistency andvalue coefficient correlation of the model described by equations (6) for the solution
The kinematic viscosity of the concentrated solution was 1110 cSt at 100ordmC and 74987 cStat 40ordmC
The viscosity index of concentred solution 6 is 236 times higher than SAE 10W-40 oil VTCof the solution is 08520 down 0006 times
Table 3 presented absolute temperature value coefficient correlation of the model describedby equations (3-7) for the solution of concentration 6 gdL
0 200 400 600 800 1000 1200 14000
100
200
300
400
500
600
Shea
r stre
ss P
a
Shear rate s -1
B C D E F G H
Fig 3 Rheograms of 6 EPDM solution at B ndash 313K Cndash 323K D ndash 333K E ndash 343K Fndash 353K G ndash 363K and Hndash 370 K
Stanciu JSRR Article no JSRR201411009
1525
In the case of 10 EPDM solution the temperature range on which the measurements werepossible narrowed to 323-363 K and the shear rate one to 3-486 s-1 as Fig 3 showsbecause of the great increase of solution viscosity Its pseudoplastic behaviour is moreaccented compared with a 6 solution (the flow index is decreased from 093 to 087) Theconcentrated solution 10 EPDM are z is 114 and then α is between 32 and 983
The kinematic viscosity of the concentrated solution was 2414 cSt at 100ordmC and 16321 cStat 40ordmC
The viscosity index of concentred solution 10 is 285 times higher than SAE 10W-40 oilVTC of the solution is 08520 down 0006 times
Table 5 presented absolute temperature value coefficient correlation of the model describedby equations (3-7) for the solution of concentration 10 gdL
Table 3 Absolute temperature value coefficient correlation of the model described byequations (3-7) for the solution 6 gdL
Table 4 shows the yield stress flow index index of consistency and correlation coefficientsfor the solution of 6 in the temperature range 313-370 K determined by equation (6)
Increasing of concentration at 12 reduces more the temperature range of measurementsto 333-363 K as can be seen in Fig 5 and increases the pseudoplastic behaviour the flowindex decreasing at 084 Table 7 presented absolute temperature value coefficientcorrelation of the model described by equations (3-7) for the solution of concentration 12gdL
The kinematic viscosity of the concentrate solution was 3065 cSt at 100ordmC and 20798 cSt at40ordmC
The concentrated solution EPDM 12 are z is 114 and then α is between 15 and 102
The viscosity index of concentred solution 12 is 299 times higher than SAE 10W-40 oilVTC of the solution is 08518 down 00062 times
Stanciu JSRR Article no JSRR201411009
1526
0 5 10 15 20 25 30 35 40 45 50
50
100
150
200
250
300
350
400
450
500
550
600Sh
ear s
tress
Pa
S hear ra te s -1
B C D E F
Fig 4 Rheograms of 10 EPDM solution at Bndash 323K Cndash 333K D ndash 343K Endash 353Kand F - 363K
Table 4 Absolute temperature yield stress flow index index of consistency andvalue coefficient correlation of the model described by equations (6) for the solution
Table 6 shows the yield stress flow index index of consistency and correlation coefficientsfor the solution of 10 in the temperature range 313-370 K determined by equation (6)
The dynamic viscosity of most materials including polymer solutions and polymer melts wellabove their glass transition temperatures decreases with temperature in accordance toAndrade equation [13]
= Amiddot10BT (8)
Stanciu JSRR Article no JSRR201411009
1527
where A and B are constants characteristic of the polymer and T is the absolutetemperature
Table 5 Absolute temperature value coefficient correlation of the model described byequations (3-7) for the solution 10 gdL
Fig 5 Rheograms of 12 EPDM solution at B ndash 333K Cndash 343K D ndash 353K andEndash 363K
Stanciu JSRR Article no JSRR201411009
1528
Table 6 Absolute temperature yield stress flow index index of consistency andvalue coefficient correlation of the model described by equations (6) for the solution
Table 8 shows the yield stress flow index index of consistency and correlation coefficientsfor the solution of 12 in the temperature range 313-370 K determined by equation (6)
Table 8 Absolute temperature yield stress flow index index of consistency andvalue coefficient correlation of the model described by equations (6) for the solution
The statistical correlation coefficients calculated at each temperature experimental dataobtained for solutions of concentration 3 6 10 and 12 are given in Table 9
The dynamic viscosity solutions EPDM copolymer similarly decreases with increasingtemperature and in Fig 6 is the decrease of viscosity with temperature for a solution with aconcentration of 3 g dL
From the figure it can be seen that the first order exponential decrease is observed for thesolution on the entire temperature range
Stanciu JSRR Article no JSRR201411009
1529
Table 9 Absolute temperature value statistical coefficient correlation for the solution3 gdL 6gdL 10gdLand 12gdL
The same can be seen in the correlation coefficient of 09872 For solutions with otherconcentrations are lower correlation coefficients ranging between 09769 solutionconcentration of 10 g dL and 09930 for the given concentration of 12 g dL
Log dependence on the value of the dynamic viscosities of the solutions of the inverse of thetemperature of EPDM is shown in Fig 7
The figure shows that this copolymer are linear dependencies in the range of concentrationsfor all temperatures studied but that the slopes are not similar in particular theconcentration of 12 g dL which value is very small compared to the other At the same timeviscosity values are very close to concentrations to 10 and 12 g dL but the moreconcentrated solution viscosity less dependent on temperature The dependence logdynamic viscosities on temperature for concentrated solutions were obtained the equation(8)
In order dependencies temperature viscosities of the four solutions were obtained thefollowing equation (9-12)
log = - 34660 + 194697T (9)
log = - 30122 + 217159T (10)
log = - 18091 + 209944T (11)
log = - 02991 + 156091T (12)
The values of the correlation coefficients of between 09996 and 09998
The values of the constants A and B are given in table 10 to facilitate discussion of theirvariation
Comparing the decrease of viscosity of solutions of the copolymer with increasingtemperature it can be seen that EPDM is able to generate multi-grade oils with widertemperature ranges that is it is a better viscosity improver at all the studied concentrations
Fig 6 Dependence of dynamic viscosity ndash absolute temperature for solution ofconcentation 3 gdL
Table 10 Constans A and B in the Andrade equation for EPDM solutions
Concentration EPDMlog A B
361012
-34660-30122-18091-02991
194697217159209994156091
As can be seen from the table the values for EPDM solutions vary with the concentration ofhigh values
In respect of the slope the smaller value is obtained for a concentration of 12 g dLfollowed by the concentration of 3 g dL and the higher the concentration of 6 g dL
Lower values obtained from the change in the slopes of the lines representing the viscosityof the solution of the copolymer with EPDM at all concentrations temperatures means thatthe viscosity of solutions of the copolymer is less dependent on temperature
Stanciu JSRR Article no JSRR201411009
1531
00027 00028 00029 00030 00031 00032
18202224262830323436384042444648
log
dyna
mic
vis
cosi
ty
1T K-1
C D E F
Fig 7 Dependence log = f(1T) for solutions of EPDM C ndash 3 D ndash 6 E ndash 10F ndash 12
4 CONCLUSION
EPDM solutions in SAE 10W-40 mineral oil are more viscous In the case of EPDM solutionsthe slope increases when passing from the copolymer concentration 3 to 6 but decreaseswhen concentration exceeds this value The lowest slope was obtained for solution havingthe concentration 12 followed by that of 3 solution while 6 solution has the highestvalue This suggests that EPDM is a better viscosity improver at all the concentrations forthe mineral oil SAE 10W-40
ACKNOWLEDGEMENTS
There was no funding for this study the parcel data analysis and interpretation in writing themanuscript
Stanciu JSRR Article no JSRR201411009
1532
COMPETING INTERESTS
Author has declared that no competing interests exist
REFERENCES
1 Gericke M Schlufter K Liebert T Heinze T Budtova T Rheological properties ofcelluloseionic liquid solutions From dilute to concentrated states Biomacromolecules200910(5)1188-1194
2 Uppuluri S Keinath SE Tomalia DA Dvornic PR Rheology of dendrimers INewtonian flow behavior of medium and highly concentrated solutions ofpolyamidoamine (PAMAM) dendrimers in ethylenediamine (EDA)solvent Macromolecules 199831(14)4498-4510
3 Quemada D Rheology of concentrated disperse systems II A model for non-newtonian shear viscosity in steady flows Rheologica Acta 197817(6)632-642
4 Chauveteau G Rodlike polymer solution flow through fine pores Influence of poresize on rheological behavior Journal of Rheology 198226111
5 Flomenbom O Silbey RJ Utilizing the information content in two-statetrajectories Proceedings of the National Academy of Sciences 2006103(29)10907-10910
6 Toacutethovaacute J Lisyacute V Relaxation times of flexible polymer chains in solution from non-conventional viscosity measurements Open Macromolecules Journal 20104(1)26-31
7 Osa M Ueda H Yoshizaki T Yamakawa H First cumulant of the dynamic structurefactor for polymers in Θ solvents Effects of chain stiffness and local chainconformation Polymer Journal 200638(2)153-158
8 Toacutethovaacute J Lisyacute V Relaxation times of flexible polymer chains in solution from non-conventional viscosity measurements Open Macromolecules Journal 20104(1)26-31
9 Larson RG The rheology of dilute solutions of flexible polymers Progress andproblems J Rheol 2005491
10 Kremer K Sukumaran SK Everaers R Grest GS Entangled polymersystems Computer physics communications 2005169(1)75-81
11 Lisy V Tothova J Zatovsky AV Long-time dynamics of RousendashZimm polymers indilute solutions with hydrodynamic memory The Journal of Chemical Physics2004121106-99
12 Tchesskaya T A generalized Zimm model Hydrodynamic screening in polymersolutions Journal of Molecular Liquids 2009150(1)77-80
13 Bender Jonathan W Norman JW Optical measurement of the contributions ofcolloidal forces to the rheology of concentrated suspensions Journal of Colloid andInterface Science 19951721171-184
14 Strivens TA The rheological properties of concentrated cetyltrimethylammoniumbromide-salicylic acid solutions in water Colloid and Polymer Science 1989267(3)269-280
15 Tothova J Brutovsky B Lisy V Monomer dynamics in single-and double-strandedDNA coils The European Physical Journal E 200724(1)61-67
16 Barrow MS Brown SWJ Cordy S Williams PR Williams RL Rheology of multigradeengine oils in high deformation rate extensional flows International Journal of EngineResearch 20045(4)349-364
Stanciu JSRR Article no JSRR201411009
1533
17 Bala V Rollin AJ Brandt G Rheological properties affecting the fuel economy ofmultigrade automotive gear lubricants Training 2014200003-24
18 Palacios JM Bajon ML Effective viscosity of oils containing VI improver and itsrelation to wear Tribology International 198316(1)27-31
19 Eckert RJA Covey DF Developments in the field of hydrogenated diene copolymersas viscosity index improvers Lubrication Science 19881(1)65-80
20 Bair S Reference liquids for quantitative elastohydrodynamics Selection andrheological characterization Tribology Letters 200622(2)197-206
21 Mufti RA Jefferies A Novel method of measuring tappet rotation and the effect oflubricant rheology Tribology International 200841(11)1039-1048
_________________________________________________________________________copy 2014 Stanciu This is an Open Access article distributed under the terms of the Creative Commons AttributionLicense (httpcreativecommonsorglicensesby30) which permits unrestricted use distribution and reproductionin any medium provided the original work is properly cited
Peer-review historyThe peer review history for this paper can be accessed here