PHYSICAL PROPERTIES Selected physical properties for canola oil are shown in Table 1. Table 1. Physical Properties of Canola Oil Parameter Value Relative Density (g/cm3; 20˚C/water at 20˚C) 0.914 - 0.917 Refractive Index (nD 40˚C) 1.465 - 1.467 Crismer Value 67 - 70 Viscosity (Kinematic at 20˚C, mm2/sec) 78.2 Cold Test (15 Hrs at 4˚C) Passed Smoke Point (˚C) 220 - 230 Flash Point, Open cup (˚C) 275 - 290 Specific Heat (J/g at 20˚C) 1.910 - 1.916 Thermal Conductivity (W/m˚K) 0.179 - 0.188 Relative Density The relative density of canola oil was first reported by Ackman and Eaton in 1977 and later confirmed by Vadke et al. (1988) and Lang et al. (1992). Noureddini et al. (1992) reported a density for high erucic acid rapeseed oil of 0.9073 g/cm 3 while Appelqvist & Ohlson (1972) reported a range from 0.906 g/cm 3 to 0.914 g/cm 3 . Ackman and Eaton (1977) indicated that a different proportion of eicosenoic (C20:1) and C18 polyunsaturated acids could be a major factor for the increase in relative density of canola oil. The higher specific gravity of 0.9193 g/cm 3 observed for soybean oil can be attributed to the higher content of linoleic acid (Ackman and Eaton, 1977). As for other liquids, the density of vegetable oils is temper- ature dependent and decreases in value when temperature increases (Figure 1). Figure 1: Effect of Temperature on Density of Selected Oils. Adapted from Lang, et al (1992) and Noureddini, et al (1992) Crismer Value The Crismer Value measures the miscibility of an oil in a standard solvent mixture, composed of t-amyl alcohol, ethyl alcohol and water in the vol- ume proportion 5:5:0.27. Crismer value (CV) is one of the specification criteria used for international trade, mostly in Europe. Characteristic val- ues are usually within a narrow limit (AOCS, 1992). The miscibility of an oil is related to the solubility of glycerides, and is affected mainly by the unsaturation and chain length of the constituent fatty acids. Little data is available describing the solubility characteristics of canola oil. Sahasrabudhe (1977) found that the Crismer value decreased from 82.0 to 76.8 with the reduction of erucic acid content from 54 to 0.1%. Viscosity Viscosity values estimate an oil’s relative thickness or resistance to flow. Viscosity of refined, bleached and deodorized (RBD) canola is higher than soybean oil (Figure 2). Figure 2: Effect of Temperature on Viscosity of Canola and Selected Oils. Adapted from Lang et al. (1992), Vadke et al. (1988) and Noureddini et al. (1992) Lang et al. (1992) and Noureddini et al. (1992a) found that the viscosity of canola and other vegetable oils, like other liquids, was affected by temperature and proposed an equation to calculate viscosity in the temperature range from 4 to 100˚C. Figure 2 shows the relation between temperature and viscosity for canola and selected vegetable oils. Rapeseed oil exhibited a higher viscosity than canola, corn and soybean oils. This can be directly related to the contribution of saturated fatty acids (Noureddini et al., 1992a). Canola Oil: Physical and Chemical Properties Canola Oil: Physical and Chemical Properties by Dr. Roman Przybylski Canola oil produced in Canada is obtained from the seeds of Brassica napus and Brassica rapa. These cultivars, low in erucic acid and glucosinolates, are very different from high erucic acid rapeseed oil in chemical, physical and nutritional properties. 1
Transcript
PHYSICAL PROPERTIES
Selected physical properties for canola oil are shown in Table 1.
Table 1. Physical Properties of Canola Oil
Parameter Value
Relative Density (g/cm3; 20˚C/water at 20˚C) 0.914 - 0.917 Refractive Index (nD 40˚C) 1.465 - 1.467Crismer Value 67 - 70Viscosity (Kinematic at 20˚C, mm2/sec) 78.2Cold Test (15 Hrs at 4˚C) Passed Smoke Point (˚C) 220 - 230Flash Point, Open cup (˚C) 275 - 290Specific Heat (J/g at 20˚C) 1.910 - 1.916Thermal Conductivity (W/m˚K) 0.179 - 0.188
Relative Density
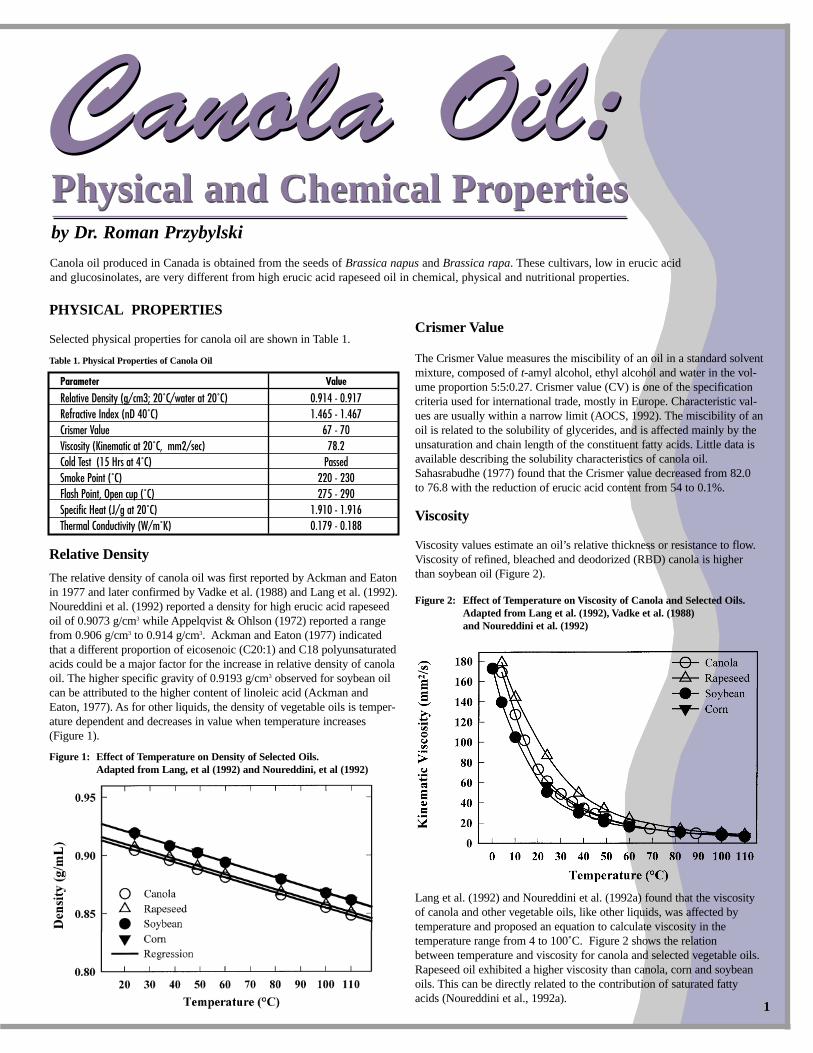
The relative density of canola oil was first reported by Ackman and Eatonin 1977 and later confirmed by Vadke et al. (1988) and Lang et al. (1992).Noureddini et al. (1992) reported a density for high erucic acid rapeseedoil of 0.9073 g/cm3 while Appelqvist & Ohlson (1972) reported a rangefrom 0.906 g/cm3 to 0.914 g/cm3. Ackman and Eaton (1977) indicatedthat a different proportion of eicosenoic (C20:1) and C18 polyunsaturatedacids could be a major factor for the increase in relative density of canolaoil. The higher specific gravity of 0.9193 g/cm3 observed for soybean oilcan be attributed to the higher content of linoleic acid (Ackman andEaton, 1977). As for other liquids, the density of vegetable oils is temper-ature dependent and decreases in value when temperature increases (Figure 1).
Figure 1: Effect of Temperature on Density of Selected Oils.Adapted from Lang, et al (1992) and Noureddini, et al (1992)
Crismer Value
The Crismer Value measures the miscibility of an oil in a standard solventmixture, composed of t-amyl alcohol, ethyl alcohol and water in the vol-ume proportion 5:5:0.27. Crismer value (CV) is one of the specificationcriteria used for international trade, mostly in Europe. Characteristic val-ues are usually within a narrow limit (AOCS, 1992). The miscibility of anoil is related to the solubility of glycerides, and is affected mainly by theunsaturation and chain length of the constituent fatty acids. Little data isavailable describing the solubility characteristics of canola oil.Sahasrabudhe (1977) found that the Crismer value decreased from 82.0 to 76.8 with the reduction of erucic acid content from 54 to 0.1%.
Viscosity
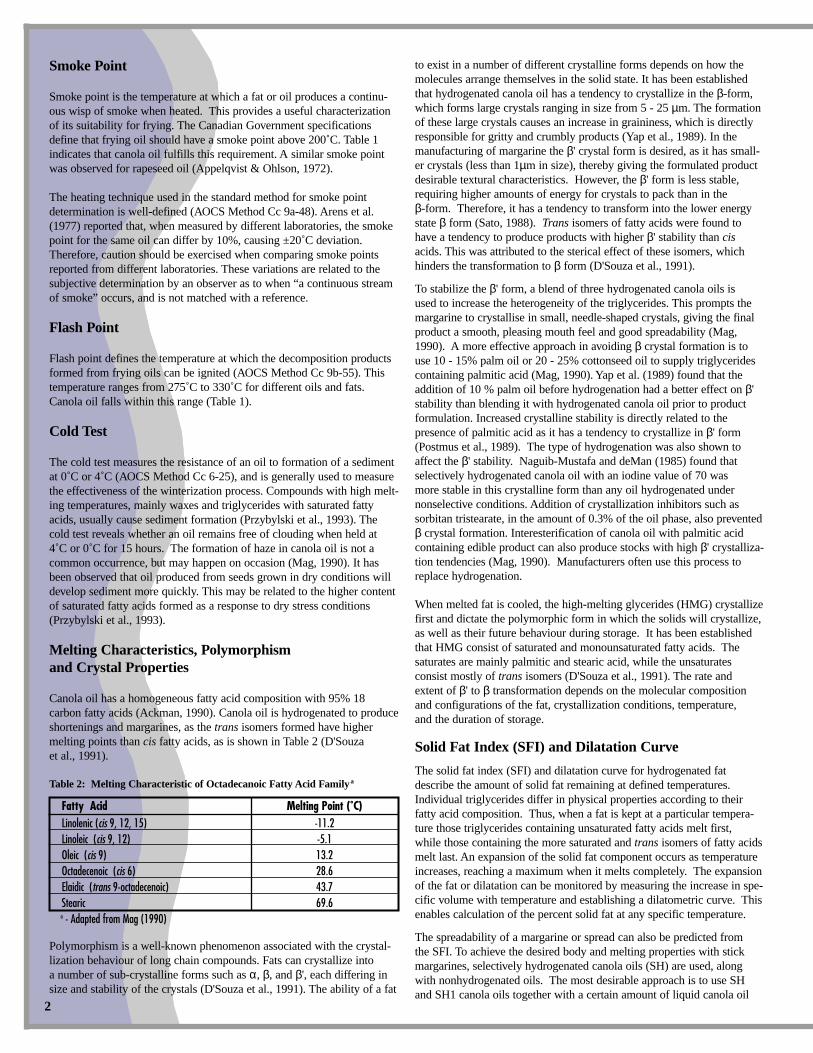
Viscosity values estimate an oil’s relative thickness or resistance to flow.Viscosity of refined, bleached and deodorized (RBD) canola is higherthan soybean oil (Figure 2).
Figure 2: Effect of Temperature on Viscosity of Canola and Selected Oils.Adapted from Lang et al. (1992), Vadke et al. (1988) and Noureddini et al. (1992)
Lang et al. (1992) and Noureddini et al. (1992a) found that the viscosityof canola and other vegetable oils, like other liquids, was affected by temperature and proposed an equation to calculate viscosity in the temperature range from 4 to 100˚C. Figure 2 shows the relation between temperature and viscosity for canola and selected vegetable oils.Rapeseed oil exhibited a higher viscosity than canola, corn and soybeanoils. This can be directly related to the contribution of saturated fattyacids (Noureddini et al., 1992a).
Canola Oil:Physical and Chemical Properties
Canola Oil:Physical and Chemical Propertiesby Dr. Roman Przybylski
Canola oil produced in Canada is obtained from the seeds of Brassica napus and Brassica rapa. These cultivars, low in erucic acid and glucosinolates, are very different from high erucic acid rapeseed oil in chemical, physical and nutritional properties.
1
2
Smoke Point
Smoke point is the temperature at which a fat or oil produces a continu-ous wisp of smoke when heated. This provides a useful characterizationof its suitability for frying. The Canadian Government specificationsdefine that frying oil should have a smoke point above 200˚C. Table 1indicates that canola oil fulfills this requirement. A similar smoke pointwas observed for rapeseed oil (Appelqvist & Ohlson, 1972).
The heating technique used in the standard method for smoke point determination is well-defined (AOCS Method Cc 9a-48). Arens et al.(1977) reported that, when measured by different laboratories, the smokepoint for the same oil can differ by 10%, causing ±20˚C deviation.Therefore, caution should be exercised when comparing smoke pointsreported from different laboratories. These variations are related to thesubjective determination by an observer as to when “a continuous streamof smoke” occurs, and is not matched with a reference.
Flash Point
Flash point defines the temperature at which the decomposition productsformed from frying oils can be ignited (AOCS Method Cc 9b-55). Thistemperature ranges from 275˚C to 330˚C for different oils and fats.Canola oil falls within this range (Table 1).
Cold Test
The cold test measures the resistance of an oil to formation of a sedimentat 0˚C or 4˚C (AOCS Method Cc 6-25), and is generally used to measurethe effectiveness of the winterization process. Compounds with high melt-ing temperatures, mainly waxes and triglycerides with saturated fattyacids, usually cause sediment formation (Przybylski et al., 1993). Thecold test reveals whether an oil remains free of clouding when held at 4˚C or 0˚C for 15 hours. The formation of haze in canola oil is not acommon occurrence, but may happen on occasion (Mag, 1990). It hasbeen observed that oil produced from seeds grown in dry conditions willdevelop sediment more quickly. This may be related to the higher contentof saturated fatty acids formed as a response to dry stress conditions(Przybylski et al., 1993).
Melting Characteristics, Polymorphism and Crystal Properties
Canola oil has a homogeneous fatty acid composition with 95% 18 carbon fatty acids (Ackman, 1990). Canola oil is hydrogenated to produceshortenings and margarines, as the trans isomers formed have highermelting points than cis fatty acids, as is shown in Table 2 (D'Souza et al., 1991).
Table 2: Melting Characteristic of Octadecanoic Fatty Acid Familya
Polymorphism is a well-known phenomenon associated with the crystal-lization behaviour of long chain compounds. Fats can crystallize into a number of sub-crystalline forms such as α, β, and β', each differing in size and stability of the crystals (D'Souza et al., 1991). The ability of a fat
to exist in a number of different crystalline forms depends on how themolecules arrange themselves in the solid state. It has been establishedthat hydrogenated canola oil has a tendency to crystallize in the β-form,which forms large crystals ranging in size from 5 - 25 µm. The formationof these large crystals causes an increase in graininess, which is directlyresponsible for gritty and crumbly products (Yap et al., 1989). In the manufacturing of margarine the β' crystal form is desired, as it has small-er crystals (less than 1µm in size), thereby giving the formulated productdesirable textural characteristics. However, the β' form is less stable,requiring higher amounts of energy for crystals to pack than in the β-form. Therefore, it has a tendency to transform into the lower energystate β form (Sato, 1988). Trans isomers of fatty acids were found tohave a tendency to produce products with higher β' stability than cisacids. This was attributed to the sterical effect of these isomers, whichhinders the transformation to β form (D'Souza et al., 1991).
To stabilize the β' form, a blend of three hydrogenated canola oils is used to increase the heterogeneity of the triglycerides. This prompts themargarine to crystallise in small, needle-shaped crystals, giving the finalproduct a smooth, pleasing mouth feel and good spreadability (Mag,1990). A more effective approach in avoiding β crystal formation is touse 10 - 15% palm oil or 20 - 25% cottonseed oil to supply triglyceridescontaining palmitic acid (Mag, 1990). Yap et al. (1989) found that theaddition of 10 % palm oil before hydrogenation had a better effect on β'stability than blending it with hydrogenated canola oil prior to productformulation. Increased crystalline stability is directly related to the presence of palmitic acid as it has a tendency to crystallize in β' form(Postmus et al., 1989). The type of hydrogenation was also shown toaffect the β' stability. Naguib-Mustafa and deMan (1985) found thatselectively hydrogenated canola oil with an iodine value of 70 was more stable in this crystalline form than any oil hydrogenated under nonselective conditions. Addition of crystallization inhibitors such as sorbitan tristearate, in the amount of 0.3% of the oil phase, also preventedβ crystal formation. Interesterification of canola oil with palmitic acidcontaining edible product can also produce stocks with high β' crystalliza-tion tendencies (Mag, 1990). Manufacturers often use this process toreplace hydrogenation.
When melted fat is cooled, the high-melting glycerides (HMG) crystallizefirst and dictate the polymorphic form in which the solids will crystallize,as well as their future behaviour during storage. It has been establishedthat HMG consist of saturated and monounsaturated fatty acids. The saturates are mainly palmitic and stearic acid, while the unsaturates consist mostly of trans isomers (D'Souza et al., 1991). The rate and extent of β' to β transformation depends on the molecular compositionand configurations of the fat, crystallization conditions, temperature,and the duration of storage.
Solid Fat Index (SFI) and Dilatation Curve
The solid fat index (SFI) and dilatation curve for hydrogenated fatdescribe the amount of solid fat remaining at defined temperatures.Individual triglycerides differ in physical properties according to theirfatty acid composition. Thus, when a fat is kept at a particular tempera-ture those triglycerides containing unsaturated fatty acids melt first,while those containing the more saturated and trans isomers of fatty acidsmelt last. An expansion of the solid fat component occurs as temperatureincreases, reaching a maximum when it melts completely. The expansionof the fat or dilatation can be monitored by measuring the increase in spe-cific volume with temperature and establishing a dilatometric curve. Thisenables calculation of the percent solid fat at any specific temperature.
The spreadability of a margarine or spread can also be predicted from the SFI. To achieve the desired body and melting properties with stickmargarines, selectively hydrogenated canola oils (SH) are used, alongwith nonhydrogenated oils. The most desirable approach is to use SHand SH1 canola oils together with a certain amount of liquid canola oil
3
(Table 4). The solid fat indices of the oil phase blend must be in the rangeof 25 - 30 at 10˚C, 14 -18 at 21.1˚C, and 2 -3.5 at 33.3˚C (Moustafa,1992). The low solid fat index at 10˚C in soft margarines appeared to beresponsible for their spreadability at refrigeration temperatures (Table 4).Formulation of these margarines requires the use of 70 -85% of slightlyhydrogenated and/or liquid oils, with a minimum of about 11 -15% ofhighly hydrogenated stock (usually nonselective) (Table 4). Using thisstock, the formulated product is characterized by good spreadability at refrigeration temperatures and good emulsion stability so there are no oiling-out problems (Mag, 1990). Typical solid fat indices of softmargarines are 8 - 14 at 10˚C, 5 - 8 at 21.1˚C, and 0.5 -2.5 at 33.3˚C(Moustafa, 1992).
In margarines with good mouth-melt characteristics the oil phase in theproduct melts sharply at body temperature which results in the totalbreakdown of the emulsion in the mouth with the release of the flavour-laden water phase (Moustafa, 1992). If the crystalline structure does notmelt rapidly the margarine feels waxy or thick in the mouth.
Table 3. Solid Fat Indices of Hydrogenated Canola Stocks and Margarines a
Sample Solid Fat Index Fatty acids10.0˚C 21.1˚C 33.3˚C PUFA MUFA SAT.e TRANS
Edible oils and fats are composed primarily of triglycerides, which are the ester of one molecule of glycerol and three molecules of fatty acids.Canola oil analyses show that the triglycerides constitute 94.4 to 99.1% ofthe total lipid (Mag, 1990). The typical composition of canola, rapeseedand soybean oils is presented in Table 4.
Table 4: Constituents of Canola, Rapeseed and Soybean Oilsa
Component Canola Rapeseed SoybeanTriglycerides (%) 94.4 - 99.1 91.8 - 99.0 93.0 - 99.2Phospholipids (%)Crude Oil up to 2.5 up to 3.5 up to 4.0Water-degummed up to 0.6 up to 0.8 up to 0.4Acid-degummed up to 0.1 - up to 0.2Free Fatty Acids (%) 0.4 - 1.2 0.5 - 1.8 0.3 - 1.0 Unsaponifiables (%) 0.5 - 1.2 0.5 - 1.2 0.5 - 1.6Tocopherols (ppm) 700 - 1200 700 - 1000 1700 - 2200Chlorophylls (ppm) 5 - 35 5 - 35 TraceSulfur (ppm) 3 - 15 5 - 25 Nila - Adapted from Mag (1990) and Ying, et al (1989)
Triglycerides
Triacylglycerols (TAG) are the most abundant lipid class found in canolaoil. The combination of fatty acids on the glycerol moiety is complex,
with n3 amount of potential molecular species where n is the number ofdifferent fatty acids present in the oil (Figure 3).
Figure 3: Structure of Acylglycerides and Phospholipids.FR - Functional Residue such as Nitrogenous or PolyolR1, 2, 3 - Residue of Fatty Acid
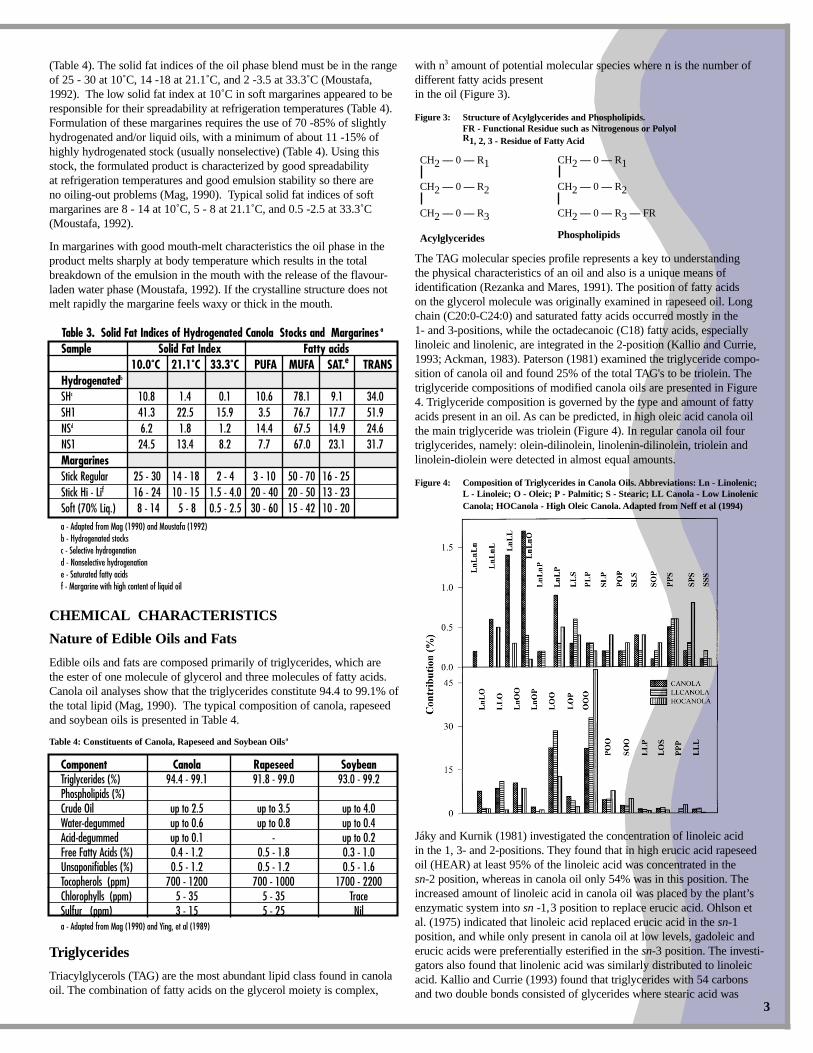
The TAG molecular species profile represents a key to understanding the physical characteristics of an oil and also is a unique means of identification (Rezanka and Mares, 1991). The position of fatty acids on the glycerol molecule was originally examined in rapeseed oil. Longchain (C20:0-C24:0) and saturated fatty acids occurred mostly in the 1- and 3-positions, while the octadecanoic (C18) fatty acids, especiallylinoleic and linolenic, are integrated in the 2-position (Kallio and Currie,1993; Ackman, 1983). Paterson (1981) examined the triglyceride compo-sition of canola oil and found 25% of the total TAG's to be triolein. Thetriglyceride compositions of modified canola oils are presented in Figure4. Triglyceride composition is governed by the type and amount of fattyacids present in an oil. As can be predicted, in high oleic acid canola oilthe main triglyceride was triolein (Figure 4). In regular canola oil fourtriglycerides, namely: olein-dilinolein, linolenin-dilinolein, triolein andlinolein-diolein were detected in almost equal amounts.
Figure 4: Composition of Triglycerides in Canola Oils. Abbreviations: Ln - Linolenic;L - Linoleic; O - Oleic; P - Palmitic; S - Stearic; LL Canola - Low Linolenic Canola; HOCanola - High Oleic Canola. Adapted from Neff et al (1994)
Jáky and Kurnik (1981) investigated the concentration of linoleic acid in the 1, 3- and 2-positions. They found that in high erucic acid rapeseedoil (HEAR) at least 95% of the linoleic acid was concentrated in the sn-2 position, whereas in canola oil only 54% was in this position. Theincreased amount of linoleic acid in canola oil was placed by the plant’senzymatic system into sn -1,3 position to replace erucic acid. Ohlson etal. (1975) indicated that linoleic acid replaced erucic acid in the sn-1position, and while only present in canola oil at low levels, gadoleic anderucic acids were preferentially esterified in the sn-3 position. The investi-gators also found that linolenic acid was similarly distributed to linoleicacid. Kallio and Currie (1993) found that triglycerides with 54 carbonsand two double bonds consisted of glycerides where stearic acid was
CH2 –– 0 –– R1
CH2 –– 0 –– R2
CH2 –– 0 –– R3
Acylglycerides
CH2 –– 0 –– R1
CH2 –– 0 –– R2
CH2 –– 0 –– R3 –– FR
Phospholipids
present predominately at the sn-2 position. Glycerides with saturated fatty acids in this position usually have higher a melting point and poorsolubility, (Rezanka, 1989). Additionally high melting glycerides candirectly effect the clarity of an oil and stimulate sediment formation (Liuet al., 1993).
The hydrogenation of unsaturated fatty acids proceeds more rapidly in the sn-1 and 3 positions than in the sn-2 position (Kaimal andLakshinarayana, 1979). Therefore, the distribution of fatty acids in canola oil is a factor affecting the selectivity of hydrogenation.
Fatty Acids
Fatty acids are composed of a carboxyl group and a hydrocarbon chain.Individual fatty acids are distinguished from one another by the nature of the hydrocarbon chain (Figure 5). This chain can vary in length from 4to 24 carbon atoms and can be saturated, monounsaturated (one doublebond, MUFA) or polyunsaturated (two or more double bonds, PUFA).The most common fatty acids in edible oils and fats are those containing18 carbons. These include: stearic acid (a saturated fatty acid), oleic acid (a monounsaturated fatty acid), and linoleic and linolenic acids(polyunsaturated fatty acids containing two and three double bonds,respectively) (Figure 5).
Figure 5: Configuration of Octadecanoic Fatty Acids
Fatty acid abbreviations are made according to the number of carbonatoms in the molecule and the number of cis ethylenic double bonds. The general assumption is that all multiple double bonds are methylene-interrupted. The chemical nomenclature requires that carbon atoms becounted from the carboxyl end of the fatty acid. However, for biologicalactivity carbon atoms are numbered from the terminal methyl group tothe first carbon of the ethylenic bond. Such a classification is designatedby the symbol ϖ-x, ϖx, or n-x, nx, where x denotes the position of thedouble bond closest to the terminal methyl group. For example, linoleicacid with two double bonds, where one is located on the sixth carbonatom counted from the methyl group, will be abbreviated as C18:2n-6.
Geometric Isomerism
In the case of unsaturated fatty acids, the carbon chain is bent into a fixed position at the double bond, resulting in several possible geometricisomers. When the portions of the chain are bent towards each other they are called cis; and when bent away from each other, trans (Figure 5).The natural configuration of fatty acids is cis, as shown for oleic acid.The corresponding trans configuration, elaidic acid, results in a straightchain (Fig. 5).
From a nutritional point of view the cis isomer is more desirable.However, fatty acids with trans configuration affect the texture and melting properties of fat or oil. Isomerization from cis to trans occursmainly during the hydrogenation of an oil. Formation of trans isomers of linolenic and linoleic acids may also occur when harsh conditions areapplied during refining. During processing of canola oil formation oftrans isomers of linolenic and linoleic acids are observed. Oleic acid is less prone to isomerization, trans isomers were detected only whenextreme parameters were applied. (Ferrari, 1996).
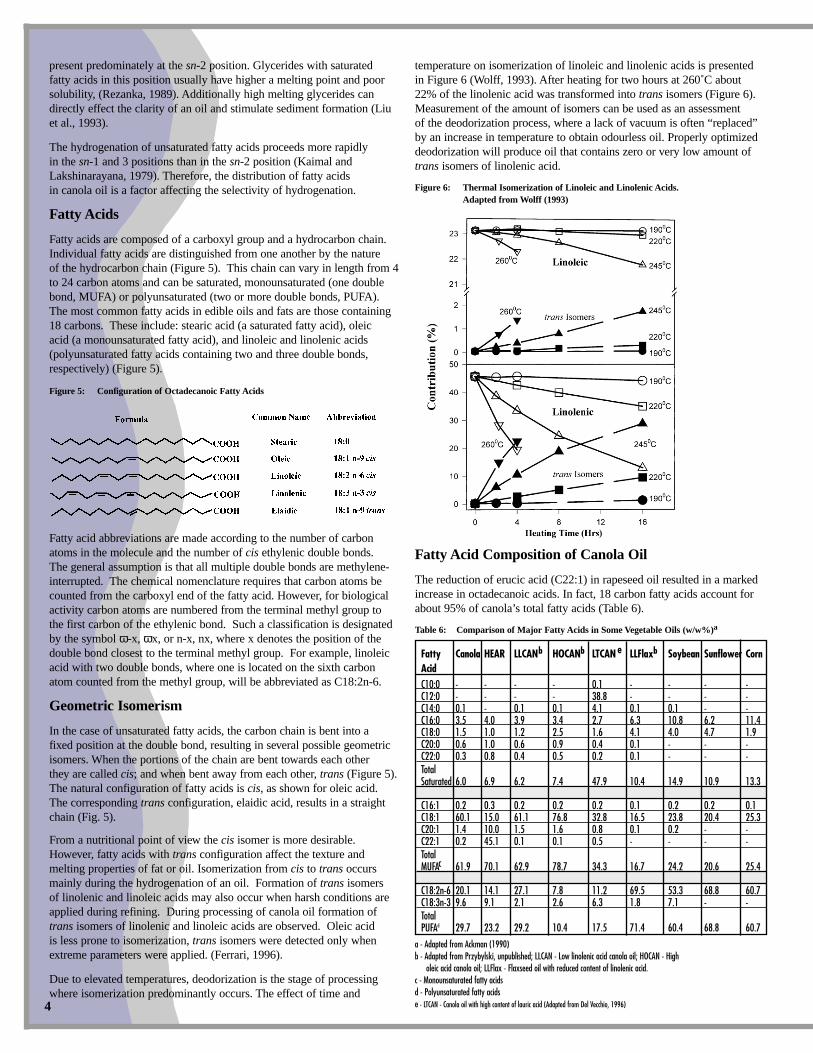
Due to elevated temperatures, deodorization is the stage of processingwhere isomerization predominantly occurs. The effect of time and
temperature on isomerization of linoleic and linolenic acids is presentedin Figure 6 (Wolff, 1993). After heating for two hours at 260˚C about22% of the linolenic acid was transformed into trans isomers (Figure 6).Measurement of the amount of isomers can be used as an assessment of the deodorization process, where a lack of vacuum is often “replaced”by an increase in temperature to obtain odourless oil. Properly optimizeddeodorization will produce oil that contains zero or very low amount oftrans isomers of linolenic acid.
Figure 6: Thermal Isomerization of Linoleic and Linolenic Acids. Adapted from Wolff (1993)
Fatty Acid Composition of Canola Oil
The reduction of erucic acid (C22:1) in rapeseed oil resulted in a markedincrease in octadecanoic acids. In fact, 18 carbon fatty acids account forabout 95% of canola’s total fatty acids (Table 6).
Table 6: Comparison of Major Fatty Acids in Some Vegetable Oils (w/w%)a
a - Adapted from Ackman (1990)b - Adapted from Przybylski, unpublished; LLCAN - Low linolenic acid canola oil; HOCAN - High
oleic acid canola oil; LLFlax - Flaxseed oil with reduced content of linolenic acid.c - Monounsaturated fatty acidsd - Polyunsaturated fatty acidse - LTCAN - Canola oil with high content of lauric acid (Adapted from Del Vecchio, 1996)4
5
Plant breeders developed canola oil with the linolenic acid contentreduced to 2.1% (Scarth et al., 1988) (Table 6). Storage stability of this oil was shown to be better than regular canola oil (Przybylski et al., 1993a). Low linolenic canola oil also exhibited improved fryingperformance and better storage stability of fried products such as french fries and potato chips (Petukhov et al., 1999; Warner and Mounts, 1993).Canola has been further developed to produce an oil with an oleic acidcontent raised from 60% to 85% (Wong et al, 1991). The fatty acid composition of high oleic canola is presented in Figure 6. This oil showedimproved frying stability and produced better quality fried potato chips(Petukhov et al, 1999). From the health and flavour formation point ofview, both low linolenic and high oleic canola oils should provide goodquality frying products without the presence of trans isomers (Ackman,1990). Warner and Mounts (1993) found that some amount of linolenicacid is required for good flavour formation in fried foods. This is due to the formation of oxidation products, which are important flavour compounds. Thus elimination of linolenic acid from oil can cause negative changes in fried product flavour formation.
Recently canola oil with an elevated content of lauric acid was developed(Table 6). This oil is being used in confectionery coatings, coffee whiten-ers, whipped toppings and center filling fats (Del Vecchio, 1996). Calgenehas also succeeded in the development of a canola plant that produces oilcontaining 40% stearic acid. This oil could be used as a replacement forhydrogenated fats in bread and bakery applications (INFORM, 1999).
Minor Fatty Acids
Minor fatty acids present often differ from their acid family members bythe location of the double bond (Table 6). Most of these acids are presentin the 0.01 - 0.1% range, except for C16:1n-7 which is around 0.3%.Most of the minor fatty acids in canola oil are from the n-7 series, but n-9isomers are also present in varying amounts. (Ackman, 1990).
A similar series of minor fatty acids was found in the B. rapa varietyCandle (Sebedio and Ackman, 1981). Conjugated C18:2 fatty acids havealso been found in canola oils. Some of these compounds are artefacts ofrefining, although some were observed as natural components in some oilseeds. The refining process itself is a source of artefact fatty acids due tothe isomerization of one or more of the double bonds of cis linolenic acid.These trans isomers can be found after refining in any linolenic acid-con-taining oil, accounting for 1% or more of the parent acid (Ackman, 1990).
Canola oil is the only known edible oil that contains one or more fattyacid with sulfur as the integral part of the molecule (Figure 7). The struc-ture of the proposed molecule of this fatty acid suggests the formation or presence of many isomers (Wijesundera and Ackman, 1988).
Figure 7: Isomers of a Sulfur-Bearing Cyclic Fatty Acid Found in Canola OilAdapted from Wijesundera et al. (1988)
In the sediment from industrial winterization, additional minor fatty acidsand alcohols with 26 to 32 carbon atoms have been found in waxes andtriglycerides (Przybylski et al., 1993). Most of these compounds areextracted from the seed coat/hull and can initiate sedimentation in canolaoil (Hu et al., 1994).
Polar Lipids
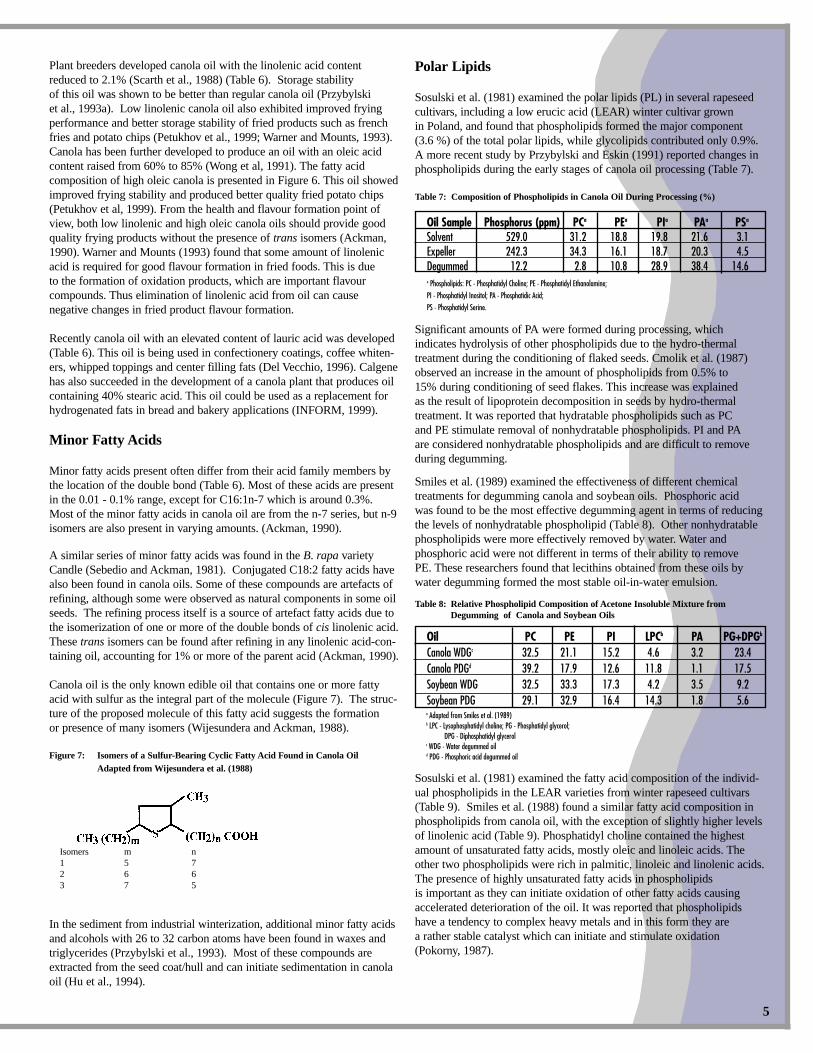
Sosulski et al. (1981) examined the polar lipids (PL) in several rapeseedcultivars, including a low erucic acid (LEAR) winter cultivar grown in Poland, and found that phospholipids formed the major component(3.6 %) of the total polar lipids, while glycolipids contributed only 0.9%.A more recent study by Przybylski and Eskin (1991) reported changes inphospholipids during the early stages of canola oil processing (Table 7).
Table 7: Composition of Phospholipids in Canola Oil During Processing (%)
PI - Phosphatidyl Inositol; PA - Phosphatidic Acid;
PS - Phosphatidyl Serine.
Significant amounts of PA were formed during processing, which indicates hydrolysis of other phospholipids due to the hydro-thermaltreatment during the conditioning of flaked seeds. Cmolik et al. (1987)observed an increase in the amount of phospholipids from 0.5% to 15% during conditioning of seed flakes. This increase was explained as the result of lipoprotein decomposition in seeds by hydro-thermal treatment. It was reported that hydratable phospholipids such as PC and PE stimulate removal of nonhydratable phospholipids. PI and PA are considered nonhydratable phospholipids and are difficult to removeduring degumming.
Smiles et al. (1989) examined the effectiveness of different chemicaltreatments for degumming canola and soybean oils. Phosphoric acid was found to be the most effective degumming agent in terms of reducingthe levels of nonhydratable phospholipid (Table 8). Other nonhydratablephospholipids were more effectively removed by water. Water and phosphoric acid were not different in terms of their ability to remove PE. These researchers found that lecithins obtained from these oils bywater degumming formed the most stable oil-in-water emulsion.
Table 8: Relative Phospholipid Composition of Acetone Insoluble Mixture from Degumming of Canola and Soybean Oils
Sosulski et al. (1981) examined the fatty acid composition of the individ-ual phospholipids in the LEAR varieties from winter rapeseed cultivars(Table 9). Smiles et al. (1988) found a similar fatty acid composition inphospholipids from canola oil, with the exception of slightly higher levelsof linolenic acid (Table 9). Phosphatidyl choline contained the highestamount of unsaturated fatty acids, mostly oleic and linoleic acids. Theother two phospholipids were rich in palmitic, linoleic and linolenic acids.The presence of highly unsaturated fatty acids in phospholipids is important as they can initiate oxidation of other fatty acids causingaccelerated deterioration of the oil. It was reported that phospholipidshave a tendency to complex heavy metals and in this form they are a rather stable catalyst which can initiate and stimulate oxidation(Pokorny, 1987).
Isomers m n1 5 72 6 63 7 5
Tocopherol and Tocotrienol Isomers
Isomers R1 R2 R3α CH3 CH3 CH3β CH3 H CH3γ H CH3 CH3δ H H CH3
6
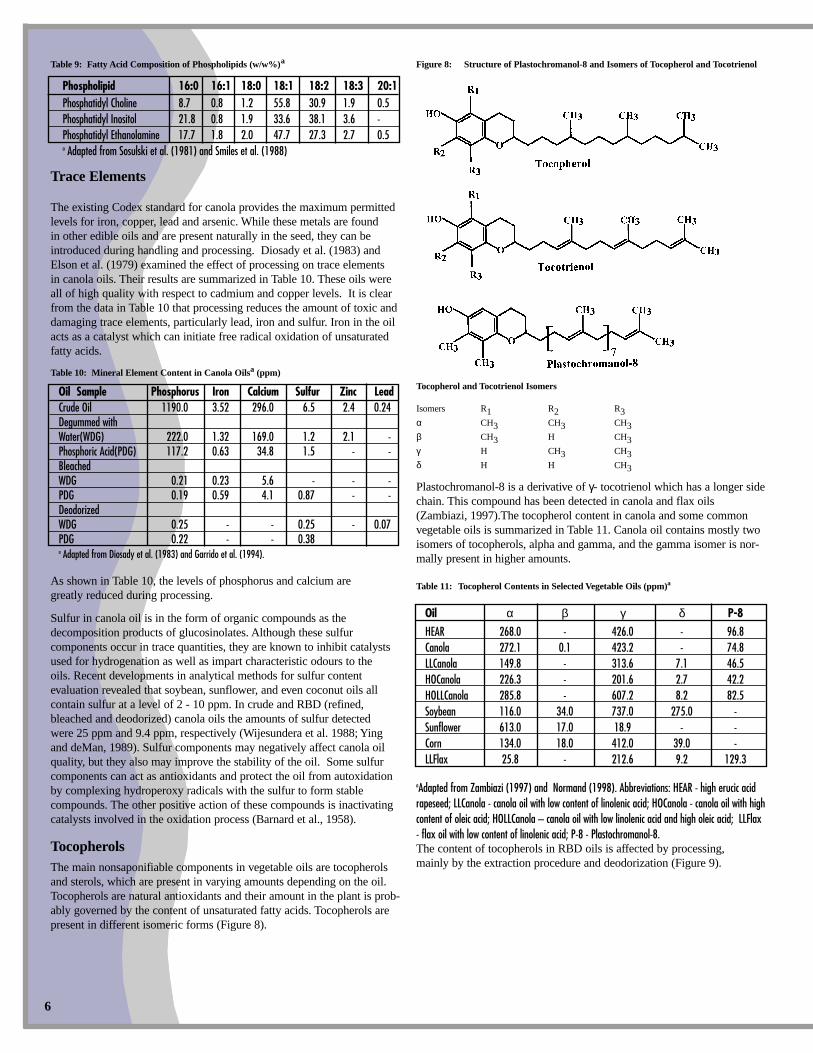
Table 9: Fatty Acid Composition of Phospholipids (w/w%)a
The existing Codex standard for canola provides the maximum permittedlevels for iron, copper, lead and arsenic. While these metals are found in other edible oils and are present naturally in the seed, they can be introduced during handling and processing. Diosady et al. (1983) andElson et al. (1979) examined the effect of processing on trace elements in canola oils. Their results are summarized in Table 10. These oils were all of high quality with respect to cadmium and copper levels. It is clearfrom the data in Table 10 that processing reduces the amount of toxic anddamaging trace elements, particularly lead, iron and sulfur. Iron in the oilacts as a catalyst which can initiate free radical oxidation of unsaturatedfatty acids.
Table 10: Mineral Element Content in Canola Oilsa (ppm)
As shown in Table 10, the levels of phosphorus and calcium are greatly reduced during processing.
Sulfur in canola oil is in the form of organic compounds as the decomposition products of glucosinolates. Although these sulfur components occur in trace quantities, they are known to inhibit catalystsused for hydrogenation as well as impart characteristic odours to the oils. Recent developments in analytical methods for sulfur content evaluation revealed that soybean, sunflower, and even coconut oils allcontain sulfur at a level of 2 - 10 ppm. In crude and RBD (refined,bleached and deodorized) canola oils the amounts of sulfur detected were 25 ppm and 9.4 ppm, respectively (Wijesundera et al. 1988; Yingand deMan, 1989). Sulfur components may negatively affect canola oilquality, but they also may improve the stability of the oil. Some sulfurcomponents can act as antioxidants and protect the oil from autoxidationby complexing hydroperoxy radicals with the sulfur to form stable compounds. The other positive action of these compounds is inactivatingcatalysts involved in the oxidation process (Barnard et al., 1958).
TocopherolsThe main nonsaponifiable components in vegetable oils are tocopherolsand sterols, which are present in varying amounts depending on the oil.Tocopherols are natural antioxidants and their amount in the plant is prob-ably governed by the content of unsaturated fatty acids. Tocopherols arepresent in different isomeric forms (Figure 8).
Figure 8: Structure of Plastochromanol-8 and Isomers of Tocopherol and Tocotrienol
Plastochromanol-8 is a derivative of γ- tocotrienol which has a longer sidechain. This compound has been detected in canola and flax oils(Zambiazi, 1997).The tocopherol content in canola and some commonvegetable oils is summarized in Table 11. Canola oil contains mostly twoisomers of tocopherols, alpha and gamma, and the gamma isomer is nor-mally present in higher amounts.
Table 11: Tocopherol Contents in Selected Vegetable Oils (ppm)a
aAdapted from Zambiazi (1997) and Normand (1998). Abbreviations: HEAR - high erucic acidrapeseed; LLCanola - canola oil with low content of linolenic acid; HOCanola - canola oil with highcontent of oleic acid; HOLLCanola – canola oil with low linolenic acid and high oleic acid; LLFlax- flax oil with low content of linolenic acid; P-8 - Plastochromanol-8. The content of tocopherols in RBD oils is affected by processing,mainly by the extraction procedure and deodorization (Figure 9).
7
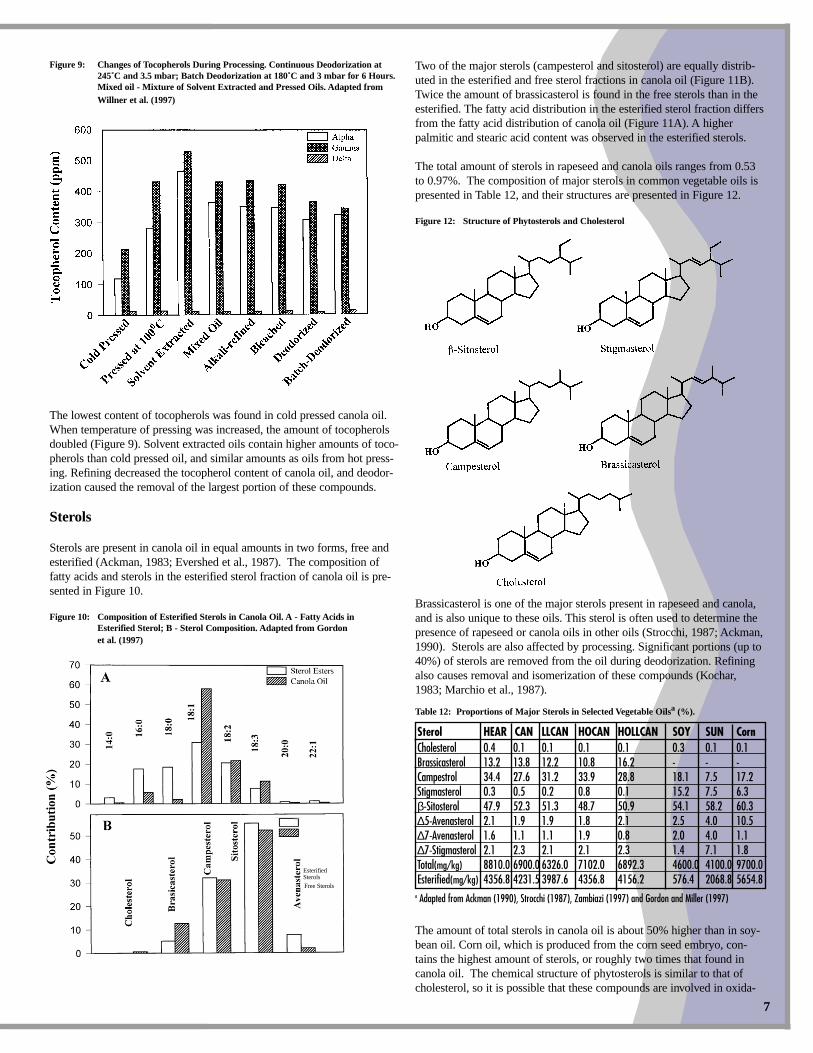
Figure 9: Changes of Tocopherols During Processing. Continuous Deodorization at 245˚C and 3.5 mbar; Batch Deodorization at 180˚C and 3 mbar for 6 Hours. Mixed oil - Mixture of Solvent Extracted and Pressed Oils. Adapted from Willner et al. (1997)
The lowest content of tocopherols was found in cold pressed canola oil.When temperature of pressing was increased, the amount of tocopherolsdoubled (Figure 9). Solvent extracted oils contain higher amounts of toco-pherols than cold pressed oil, and similar amounts as oils from hot press-ing. Refining decreased the tocopherol content of canola oil, and deodor-ization caused the removal of the largest portion of these compounds.
Sterols
Sterols are present in canola oil in equal amounts in two forms, free andesterified (Ackman, 1983; Evershed et al., 1987). The composition offatty acids and sterols in the esterified sterol fraction of canola oil is pre-sented in Figure 10.
Figure 10: Composition of Esterified Sterols in Canola Oil. A - Fatty Acids inEsterified Sterol; B - Sterol Composition. Adapted from Gordonet al. (1997)
Two of the major sterols (campesterol and sitosterol) are equally distrib-uted in the esterified and free sterol fractions in canola oil (Figure 11B).Twice the amount of brassicasterol is found in the free sterols than in theesterified. The fatty acid distribution in the esterified sterol fraction differsfrom the fatty acid distribution of canola oil (Figure 11A). A higherpalmitic and stearic acid content was observed in the esterified sterols.
The total amount of sterols in rapeseed and canola oils ranges from 0.53to 0.97%. The composition of major sterols in common vegetable oils ispresented in Table 12, and their structures are presented in Figure 12.
Figure 12: Structure of Phytosterols and Cholesterol
Brassicasterol is one of the major sterols present in rapeseed and canola,and is also unique to these oils. This sterol is often used to determine thepresence of rapeseed or canola oils in other oils (Strocchi, 1987; Ackman,1990). Sterols are also affected by processing. Significant portions (up to40%) of sterols are removed from the oil during deodorization. Refiningalso causes removal and isomerization of these compounds (Kochar,1983; Marchio et al., 1987).
Table 12: Proportions of Major Sterols in Selected Vegetable Oilsa (%).
a Adapted from Ackman (1990), Strocchi (1987), Zambiazi (1997) and Gordon and Miller (1997)
The amount of total sterols in canola oil is about 50% higher than in soy-bean oil. Corn oil, which is produced from the corn seed embryo, con-tains the highest amount of sterols, or roughly two times that found incanola oil. The chemical structure of phytosterols is similar to that ofcholesterol, so it is possible that these compounds are involved in oxida-
Free Sterols
Esterified Sterols
8
tive reactions (Figure 12). Recently, Przybylski and Eskin (1991) foundplant sterol oxidation products formed during the storage of fried foodproducts. Similar oxidation products have been found in soybean oil andwheat flour (Nourooz-Zadeh & Appelqvist, 1992). During the last fewyears more and more data is also being published showing the positiveeffect of plant sterols and their derivatives, particularly stanol esters, onhuman plasma cholesterol (Hendriks et al., 1999).
Pigments
Pigments present in canola and other oilseeds are important factors asthey can impart undesirable colour to vegetable oils, promote oxidation in the presence of light, and inhibit catalysts used for hydrogenation.
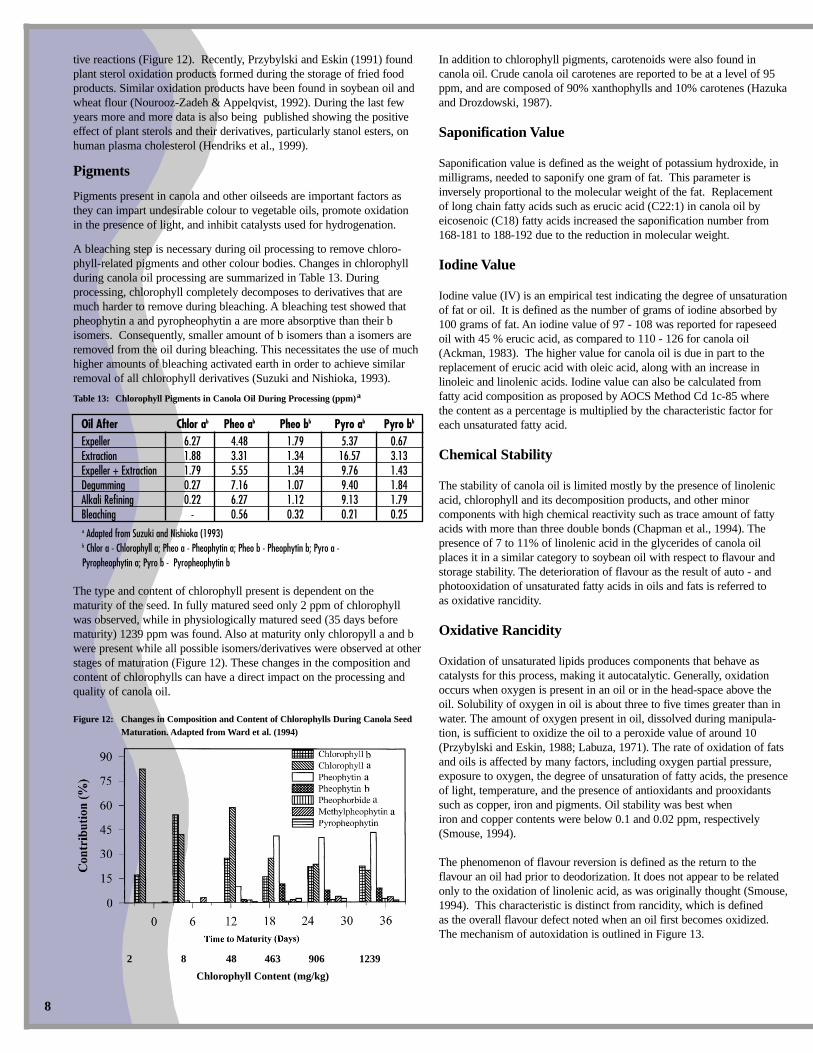
A bleaching step is necessary during oil processing to remove chloro-phyll-related pigments and other colour bodies. Changes in chlorophyllduring canola oil processing are summarized in Table 13. During processing, chlorophyll completely decomposes to derivatives that aremuch harder to remove during bleaching. A bleaching test showed thatpheophytin a and pyropheophytin a are more absorptive than their b isomers. Consequently, smaller amount of b isomers than a isomers areremoved from the oil during bleaching. This necessitates the use of muchhigher amounts of bleaching activated earth in order to achieve similarremoval of all chlorophyll derivatives (Suzuki and Nishioka, 1993).
Table 13: Chlorophyll Pigments in Canola Oil During Processing (ppm)a
Oil After Chlor ab Pheo ab Pheo bb Pyro ab Pyro bb
Expeller 6.27 4.48 1.79 5.37 0.67Extraction 1.88 3.31 1.34 16.57 3.13Expeller + Extraction 1.79 5.55 1.34 9.76 1.43Degumming 0.27 7.16 1.07 9.40 1.84Alkali Refining 0.22 6.27 1.12 9.13 1.79Bleaching - 0.56 0.32 0.21 0.25a Adapted from Suzuki and Nishioka (1993)b Chlor a - Chlorophyll a; Pheo a - Pheophytin a; Pheo b - Pheophytin b; Pyro a -Pyropheophytin a; Pyro b - Pyropheophytin b
The type and content of chlorophyll present is dependent on the maturity of the seed. In fully matured seed only 2 ppm of chlorophyll was observed, while in physiologically matured seed (35 days before maturity) 1239 ppm was found. Also at maturity only chloropyll a and bwere present while all possible isomers/derivatives were observed at otherstages of maturation (Figure 12). These changes in the composition andcontent of chlorophylls can have a direct impact on the processing andquality of canola oil.
Figure 12: Changes in Composition and Content of Chlorophylls During Canola Seed Maturation. Adapted from Ward et al. (1994)
In addition to chlorophyll pigments, carotenoids were also found incanola oil. Crude canola oil carotenes are reported to be at a level of 95ppm, and are composed of 90% xanthophylls and 10% carotenes (Hazukaand Drozdowski, 1987).
Saponification Value
Saponification value is defined as the weight of potassium hydroxide, inmilligrams, needed to saponify one gram of fat. This parameter isinversely proportional to the molecular weight of the fat. Replacement of long chain fatty acids such as erucic acid (C22:1) in canola oil byeicosenoic (C18) fatty acids increased the saponification number from168-181 to 188-192 due to the reduction in molecular weight.
Iodine Value
Iodine value (IV) is an empirical test indicating the degree of unsaturationof fat or oil. It is defined as the number of grams of iodine absorbed by100 grams of fat. An iodine value of 97 - 108 was reported for rapeseedoil with 45 % erucic acid, as compared to 110 - 126 for canola oil(Ackman, 1983). The higher value for canola oil is due in part to thereplacement of erucic acid with oleic acid, along with an increase inlinoleic and linolenic acids. Iodine value can also be calculated from fatty acid composition as proposed by AOCS Method Cd 1c-85 where the content as a percentage is multiplied by the characteristic factor foreach unsaturated fatty acid.
Chemical Stability
The stability of canola oil is limited mostly by the presence of linolenicacid, chlorophyll and its decomposition products, and other minor components with high chemical reactivity such as trace amount of fattyacids with more than three double bonds (Chapman et al., 1994). Thepresence of 7 to 11% of linolenic acid in the glycerides of canola oilplaces it in a similar category to soybean oil with respect to flavour andstorage stability. The deterioration of flavour as the result of auto - andphotooxidation of unsaturated fatty acids in oils and fats is referred to as oxidative rancidity.
Oxidative Rancidity
Oxidation of unsaturated lipids produces components that behave as catalysts for this process, making it autocatalytic. Generally, oxidationoccurs when oxygen is present in an oil or in the head-space above theoil. Solubility of oxygen in oil is about three to five times greater than inwater. The amount of oxygen present in oil, dissolved during manipula-tion, is sufficient to oxidize the oil to a peroxide value of around 10(Przybylski and Eskin, 1988; Labuza, 1971). The rate of oxidation of fatsand oils is affected by many factors, including oxygen partial pressure,exposure to oxygen, the degree of unsaturation of fatty acids, the presenceof light, temperature, and the presence of antioxidants and prooxidantssuch as copper, iron and pigments. Oil stability was best when iron and copper contents were below 0.1 and 0.02 ppm, respectively(Smouse, 1994).
The phenomenon of flavour reversion is defined as the return to theflavour an oil had prior to deodorization. It does not appear to be relatedonly to the oxidation of linolenic acid, as was originally thought (Smouse,1994). This characteristic is distinct from rancidity, which is defined as the overall flavour defect noted when an oil first becomes oxidized.The mechanism of autoxidation is outlined in Figure 13.
2 8 48 463 906 1239
Chlorophyll Content (mg/kg)
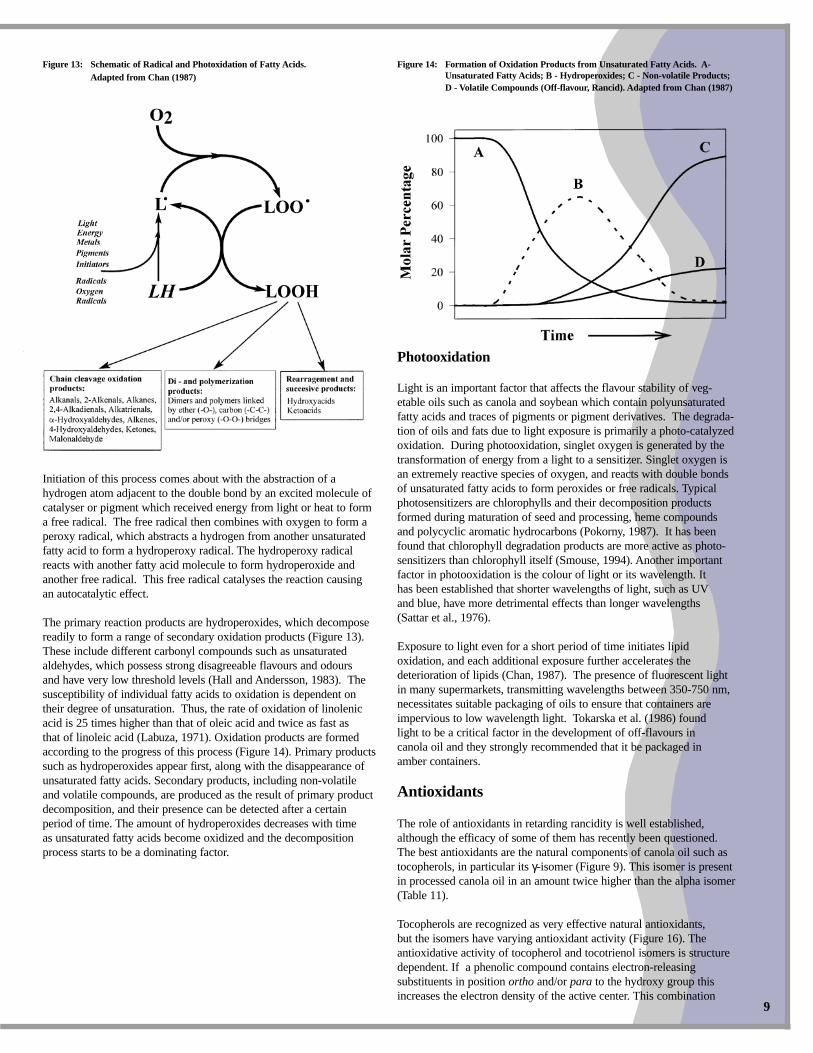
Figure 13: Schematic of Radical and Photoxidation of Fatty Acids. Adapted from Chan (1987)
Initiation of this process comes about with the abstraction of a hydrogen atom adjacent to the double bond by an excited molecule ofcatalyser or pigment which received energy from light or heat to form a free radical. The free radical then combines with oxygen to form aperoxy radical, which abstracts a hydrogen from another unsaturatedfatty acid to form a hydroperoxy radical. The hydroperoxy radicalreacts with another fatty acid molecule to form hydroperoxide andanother free radical. This free radical catalyses the reaction causing an autocatalytic effect.
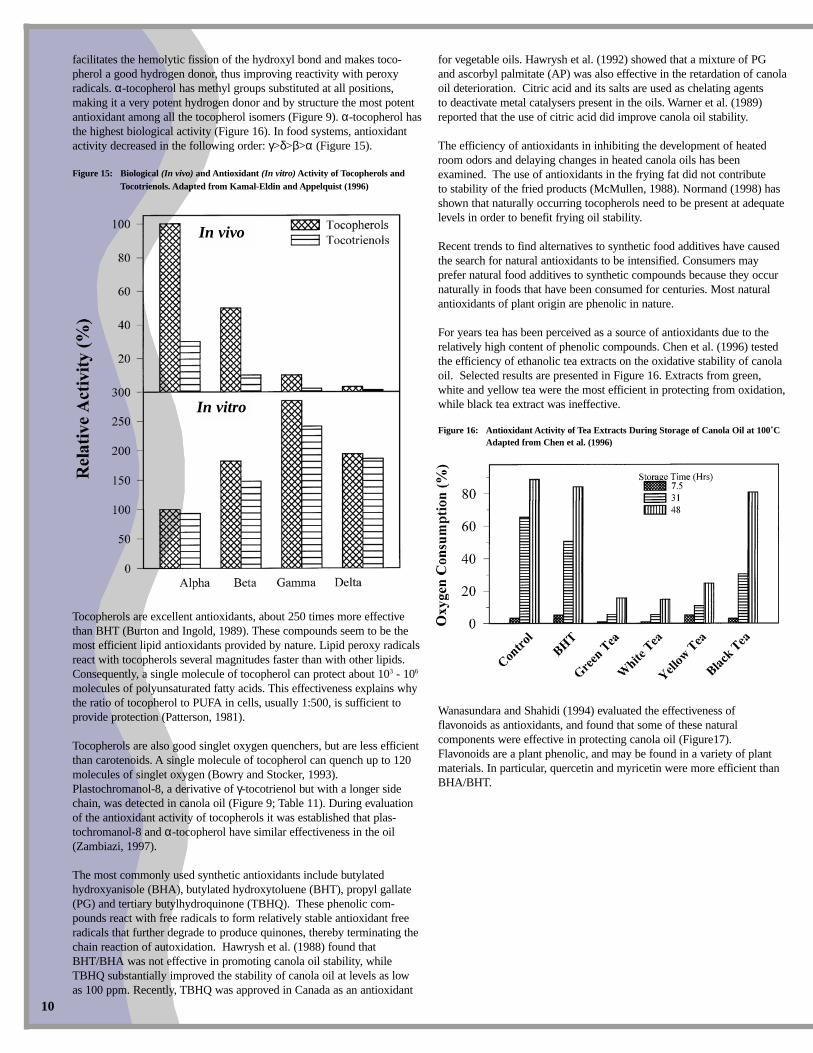
The primary reaction products are hydroperoxides, which decomposereadily to form a range of secondary oxidation products (Figure 13).These include different carbonyl compounds such as unsaturated aldehydes, which possess strong disagreeable flavours and odours and have very low threshold levels (Hall and Andersson, 1983). Thesusceptibility of individual fatty acids to oxidation is dependent on their degree of unsaturation. Thus, the rate of oxidation of linolenicacid is 25 times higher than that of oleic acid and twice as fast as that of linoleic acid (Labuza, 1971). Oxidation products are formedaccording to the progress of this process (Figure 14). Primary productssuch as hydroperoxides appear first, along with the disappearance ofunsaturated fatty acids. Secondary products, including non-volatile and volatile compounds, are produced as the result of primary productdecomposition, and their presence can be detected after a certain period of time. The amount of hydroperoxides decreases with time as unsaturated fatty acids become oxidized and the decompositionprocess starts to be a dominating factor.
Figure 14: Formation of Oxidation Products from Unsaturated Fatty Acids. A-Unsaturated Fatty Acids; B - Hydroperoxides; C - Non-volatile Products; D - Volatile Compounds (Off-flavour, Rancid). Adapted from Chan (1987)
Photooxidation
Light is an important factor that affects the flavour stability of veg-etable oils such as canola and soybean which contain polyunsaturatedfatty acids and traces of pigments or pigment derivatives. The degrada-tion of oils and fats due to light exposure is primarily a photo-catalyzedoxidation. During photooxidation, singlet oxygen is generated by thetransformation of energy from a light to a sensitizer. Singlet oxygen isan extremely reactive species of oxygen, and reacts with double bondsof unsaturated fatty acids to form peroxides or free radicals. Typicalphotosensitizers are chlorophylls and their decomposition productsformed during maturation of seed and processing, heme compoundsand polycyclic aromatic hydrocarbons (Pokorny, 1987). It has beenfound that chlorophyll degradation products are more active as photo-sensitizers than chlorophyll itself (Smouse, 1994). Another importantfactor in photooxidation is the colour of light or its wavelength. It has been established that shorter wavelengths of light, such as UV and blue, have more detrimental effects than longer wavelengths (Sattar et al., 1976).
Exposure to light even for a short period of time initiates lipid oxidation, and each additional exposure further accelerates the deterioration of lipids (Chan, 1987). The presence of fluorescent lightin many supermarkets, transmitting wavelengths between 350-750 nm,necessitates suitable packaging of oils to ensure that containers areimpervious to low wavelength light. Tokarska et al. (1986) found light to be a critical factor in the development of off-flavours in canola oil and they strongly recommended that it be packaged in amber containers.
Antioxidants
The role of antioxidants in retarding rancidity is well established,although the efficacy of some of them has recently been questioned.The best antioxidants are the natural components of canola oil such astocopherols, in particular its γ-isomer (Figure 9). This isomer is present in processed canola oil in an amount twice higher than the alpha isomer(Table 11).
Tocopherols are recognized as very effective natural antioxidants,but the isomers have varying antioxidant activity (Figure 16). The antioxidative activity of tocopherol and tocotrienol isomers is structuredependent. If a phenolic compound contains electron-releasing substituents in position ortho and/or para to the hydroxy group thisincreases the electron density of the active center. This combination
9
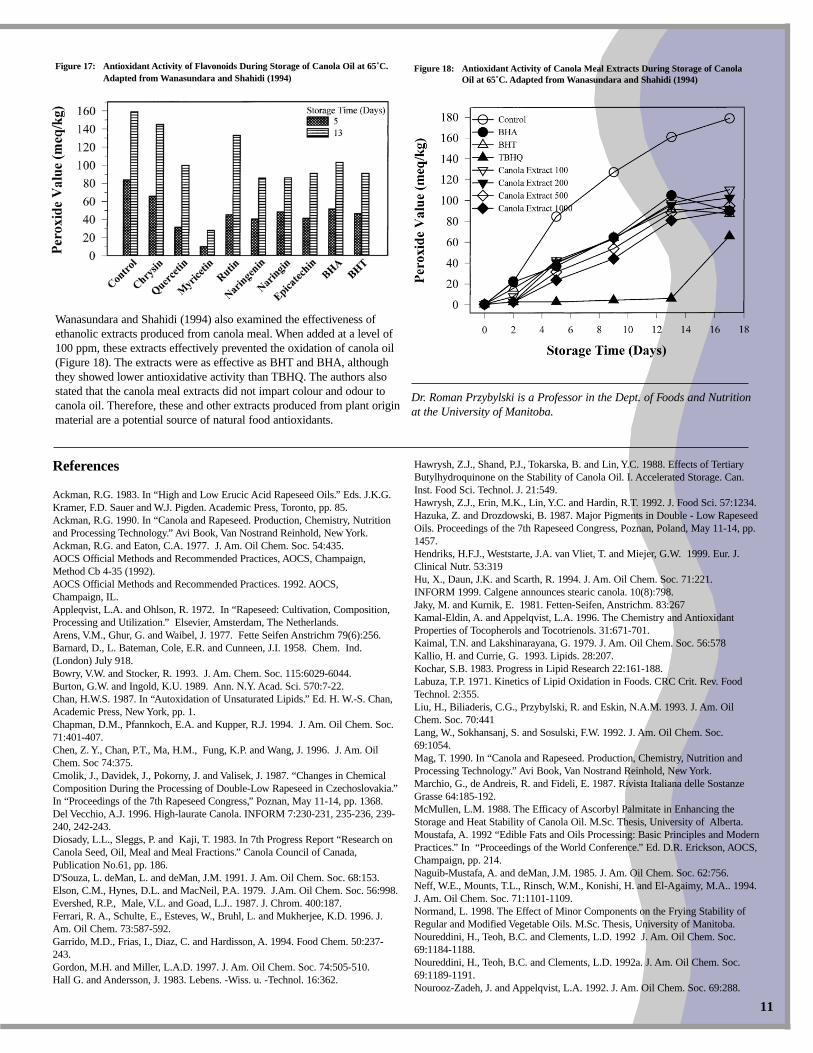
facilitates the hemolytic fission of the hydroxyl bond and makes toco-pherol a good hydrogen donor, thus improving reactivity with peroxy radicals. α-tocopherol has methyl groups substituted at all positions,making it a very potent hydrogen donor and by structure the most potentantioxidant among all the tocopherol isomers (Figure 9). α-tocopherol hasthe highest biological activity (Figure 16). In food systems, antioxidantactivity decreased in the following order: γ>δ>β>α (Figure 15).
Figure 15: Biological (In vivo) and Antioxidant (In vitro) Activity of Tocopherols and Tocotrienols. Adapted from Kamal-Eldin and Appelquist (1996)
Tocopherols are excellent antioxidants, about 250 times more effectivethan BHT (Burton and Ingold, 1989). These compounds seem to be themost efficient lipid antioxidants provided by nature. Lipid peroxy radicalsreact with tocopherols several magnitudes faster than with other lipids.Consequently, a single molecule of tocopherol can protect about 103 - 106
molecules of polyunsaturated fatty acids. This effectiveness explains whythe ratio of tocopherol to PUFA in cells, usually 1:500, is sufficient toprovide protection (Patterson, 1981).
Tocopherols are also good singlet oxygen quenchers, but are less efficientthan carotenoids. A single molecule of tocopherol can quench up to 120molecules of singlet oxygen (Bowry and Stocker, 1993).Plastochromanol-8, a derivative of γ-tocotrienol but with a longer sidechain, was detected in canola oil (Figure 9; Table 11). During evaluationof the antioxidant activity of tocopherols it was established that plas-tochromanol-8 and α-tocopherol have similar effectiveness in the oil(Zambiazi, 1997).
The most commonly used synthetic antioxidants include butylatedhydroxyanisole (BHA), butylated hydroxytoluene (BHT), propyl gallate(PG) and tertiary butylhydroquinone (TBHQ). These phenolic com-pounds react with free radicals to form relatively stable antioxidant freeradicals that further degrade to produce quinones, thereby terminating thechain reaction of autoxidation. Hawrysh et al. (1988) found thatBHT/BHA was not effective in promoting canola oil stability, whileTBHQ substantially improved the stability of canola oil at levels as lowas 100 ppm. Recently, TBHQ was approved in Canada as an antioxidant
for vegetable oils. Hawrysh et al. (1992) showed that a mixture of PG and ascorbyl palmitate (AP) was also effective in the retardation of canolaoil deterioration. Citric acid and its salts are used as chelating agents to deactivate metal catalysers present in the oils. Warner et al. (1989)reported that the use of citric acid did improve canola oil stability.
The efficiency of antioxidants in inhibiting the development of heatedroom odors and delaying changes in heated canola oils has been examined. The use of antioxidants in the frying fat did not contribute to stability of the fried products (McMullen, 1988). Normand (1998) hasshown that naturally occurring tocopherols need to be present at adequatelevels in order to benefit frying oil stability.
Recent trends to find alternatives to synthetic food additives have causedthe search for natural antioxidants to be intensified. Consumers may prefer natural food additives to synthetic compounds because they occurnaturally in foods that have been consumed for centuries. Most naturalantioxidants of plant origin are phenolic in nature.
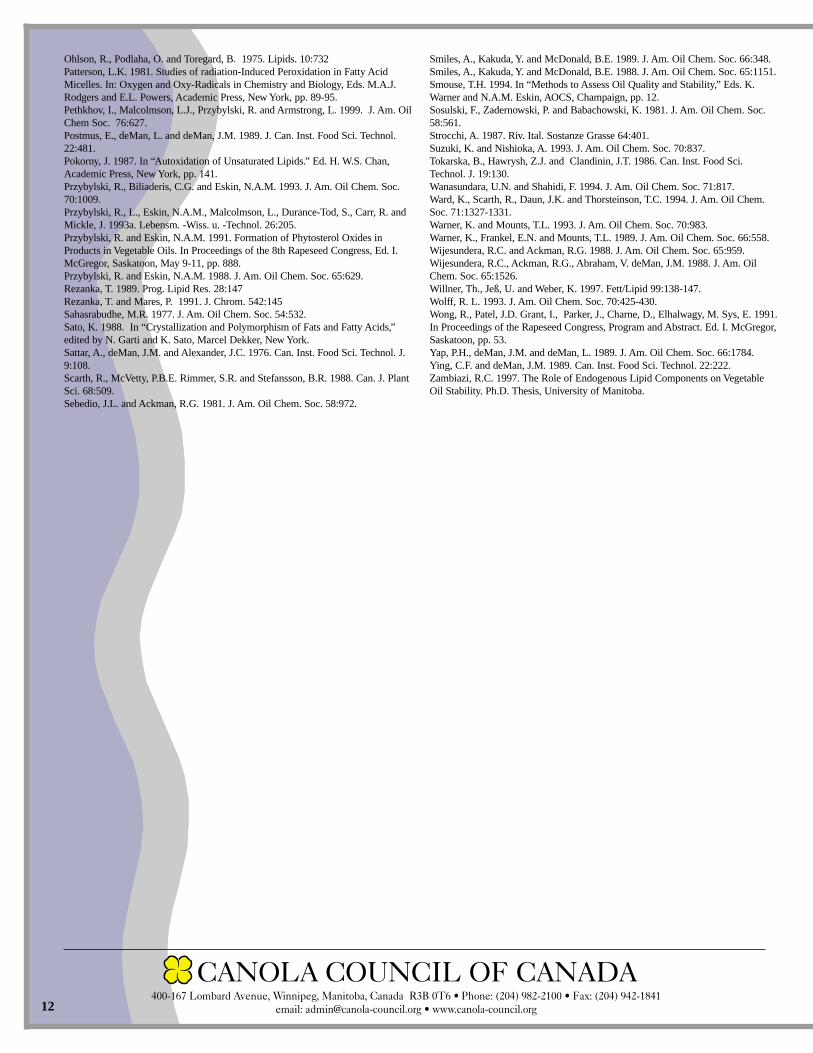
For years tea has been perceived as a source of antioxidants due to therelatively high content of phenolic compounds. Chen et al. (1996) testedthe efficiency of ethanolic tea extracts on the oxidative stability of canolaoil. Selected results are presented in Figure 16. Extracts from green,white and yellow tea were the most efficient in protecting from oxidation,while black tea extract was ineffective.
Figure 16: Antioxidant Activity of Tea Extracts During Storage of Canola Oil at 100˚C Adapted from Chen et al. (1996)
Wanasundara and Shahidi (1994) evaluated the effectiveness offlavonoids as antioxidants, and found that some of these natural components were effective in protecting canola oil (Figure17). Flavonoids are a plant phenolic, and may be found in a variety of plantmaterials. In particular, quercetin and myricetin were more efficient thanBHA/BHT.
10
In vivo
In vitro
Figure 17: Antioxidant Activity of Flavonoids During Storage of Canola Oil at 65˚C.Adapted from Wanasundara and Shahidi (1994)
Wanasundara and Shahidi (1994) also examined the effectiveness ofethanolic extracts produced from canola meal. When added at a level of100 ppm, these extracts effectively prevented the oxidation of canola oil(Figure 18). The extracts were as effective as BHT and BHA, althoughthey showed lower antioxidative activity than TBHQ. The authors alsostated that the canola meal extracts did not impart colour and odour tocanola oil. Therefore, these and other extracts produced from plant originmaterial are a potential source of natural food antioxidants.
Figure 18: Antioxidant Activity of Canola Meal Extracts During Storage of Canola Oil at 65˚C. Adapted from Wanasundara and Shahidi (1994)
References
Ackman, R.G. 1983. In “High and Low Erucic Acid Rapeseed Oils.” Eds. J.K.G.Kramer, F.D. Sauer and W.J. Pigden. Academic Press, Toronto, pp. 85. Ackman, R.G. 1990. In “Canola and Rapeseed. Production, Chemistry, Nutritionand Processing Technology.” Avi Book, Van Nostrand Reinhold, New York.Ackman, R.G. and Eaton, C.A. 1977. J. Am. Oil Chem. Soc. 54:435.AOCS Official Methods and Recommended Practices, AOCS, Champaign,Method Cb 4-35 (1992).AOCS Official Methods and Recommended Practices. 1992. AOCS,Champaign, IL. Appleqvist, L.A. and Ohlson, R. 1972. In “Rapeseed: Cultivation, Composition,Processing and Utilization.” Elsevier, Amsterdam, The Netherlands.Arens, V.M., Ghur, G. and Waibel, J. 1977. Fette Seifen Anstrichm 79(6):256.Barnard, D., L. Bateman, Cole, E.R. and Cunneen, J.I. 1958. Chem. Ind.(London) July 918.Bowry, V.W. and Stocker, R. 1993. J. Am. Chem. Soc. 115:6029-6044.Burton, G.W. and Ingold, K.U. 1989. Ann. N.Y. Acad. Sci. 570:7-22.Chan, H.W.S. 1987. In “Autoxidation of Unsaturated Lipids.” Ed. H. W.-S. Chan,Academic Press, New York, pp. 1.Chapman, D.M., Pfannkoch, E.A. and Kupper, R.J. 1994. J. Am. Oil Chem. Soc.71:401-407. Chen, Z. Y., Chan, P.T., Ma, H.M., Fung, K.P. and Wang, J. 1996. J. Am. OilChem. Soc 74:375.Cmolik, J., Davidek, J., Pokorny, J. and Valisek, J. 1987. “Changes in ChemicalComposition During the Processing of Double-Low Rapeseed in Czechoslovakia.”In “Proceedings of the 7th Rapeseed Congress,” Poznan, May 11-14, pp. 1368.Del Vecchio, A.J. 1996. High-laurate Canola. INFORM 7:230-231, 235-236, 239-240, 242-243.Diosady, L.L., Sleggs, P. and Kaji, T. 1983. In 7th Progress Report “Research onCanola Seed, Oil, Meal and Meal Fractions.” Canola Council of Canada,Publication No.61, pp. 186.D'Souza, L. deMan, L. and deMan, J.M. 1991. J. Am. Oil Chem. Soc. 68:153.Elson, C.M., Hynes, D.L. and MacNeil, P.A. 1979. J.Am. Oil Chem. Soc. 56:998.Evershed, R.P., Male, V.L. and Goad, L.J.. 1987. J. Chrom. 400:187.Ferrari, R. A., Schulte, E., Esteves, W., Bruhl, L. and Mukherjee, K.D. 1996. J.Am. Oil Chem. 73:587-592.Garrido, M.D., Frias, I., Diaz, C. and Hardisson, A. 1994. Food Chem. 50:237-243.Gordon, M.H. and Miller, L.A.D. 1997. J. Am. Oil Chem. Soc. 74:505-510.Hall G. and Andersson, J. 1983. Lebens. -Wiss. u. -Technol. 16:362.
Hawrysh, Z.J., Shand, P.J., Tokarska, B. and Lin, Y.C. 1988. Effects of TertiaryButylhydroquinone on the Stability of Canola Oil. I. Accelerated Storage. Can.Inst. Food Sci. Technol. J. 21:549. Hawrysh, Z.J., Erin, M.K., Lin, Y.C. and Hardin, R.T. 1992. J. Food Sci. 57:1234.Hazuka, Z. and Drozdowski, B. 1987. Major Pigments in Double - Low RapeseedOils. Proceedings of the 7th Rapeseed Congress, Poznan, Poland, May 11-14, pp.1457.Hendriks, H.F.J., Weststarte, J.A. van Vliet, T. and Miejer, G.W. 1999. Eur. J.Clinical Nutr. 53:319 Hu, X., Daun, J.K. and Scarth, R. 1994. J. Am. Oil Chem. Soc. 71:221.INFORM 1999. Calgene announces stearic canola. 10(8):798.Jaky, M. and Kurnik, E. 1981. Fetten-Seifen, Anstrichm. 83:267Kamal-Eldin, A. and Appelqvist, L.A. 1996. The Chemistry and AntioxidantProperties of Tocopherols and Tocotrienols. 31:671-701.Kaimal, T.N. and Lakshinarayana, G. 1979. J. Am. Oil Chem. Soc. 56:578Kallio, H. and Currie, G. 1993. Lipids. 28:207.Kochar, S.B. 1983. Progress in Lipid Research 22:161-188.Labuza, T.P. 1971. Kinetics of Lipid Oxidation in Foods. CRC Crit. Rev. FoodTechnol. 2:355.Liu, H., Biliaderis, C.G., Przybylski, R. and Eskin, N.A.M. 1993. J. Am. OilChem. Soc. 70:441Lang, W., Sokhansanj, S. and Sosulski, F.W. 1992. J. Am. Oil Chem. Soc.69:1054.Mag, T. 1990. In “Canola and Rapeseed. Production, Chemistry, Nutrition andProcessing Technology.” Avi Book, Van Nostrand Reinhold, New York.Marchio, G., de Andreis, R. and Fideli, E. 1987. Rivista Italiana delle SostanzeGrasse 64:185-192.McMullen, L.M. 1988. The Efficacy of Ascorbyl Palmitate in Enhancing theStorage and Heat Stability of Canola Oil. M.Sc. Thesis, University of Alberta.Moustafa, A. 1992 “Edible Fats and Oils Processing: Basic Principles and ModernPractices.” In “Proceedings of the World Conference.” Ed. D.R. Erickson, AOCS,Champaign, pp. 214.Naguib-Mustafa, A. and deMan, J.M. 1985. J. Am. Oil Chem. Soc. 62:756.Neff, W.E., Mounts, T.L., Rinsch, W.M., Konishi, H. and El-Agaimy, M.A.. 1994.J. Am. Oil Chem. Soc. 71:1101-1109.Normand, L. 1998. The Effect of Minor Components on the Frying Stability ofRegular and Modified Vegetable Oils. M.Sc. Thesis, University of Manitoba. Noureddini, H., Teoh, B.C. and Clements, L.D. 1992 J. Am. Oil Chem. Soc.69:1184-1188.Noureddini, H., Teoh, B.C. and Clements, L.D. 1992a. J. Am. Oil Chem. Soc.69:1189-1191.Nourooz-Zadeh, J. and Appelqvist, L.A. 1992. J. Am. Oil Chem. Soc. 69:288.
11
Dr. Roman Przybylski is a Professor in the Dept. of Foods and Nutritionat the University of Manitoba.
Ohlson, R., Podlaha, O. and Toregard, B. 1975. Lipids. 10:732Patterson, L.K. 1981. Studies of radiation-Induced Peroxidation in Fatty AcidMicelles. In: Oxygen and Oxy-Radicals in Chemistry and Biology, Eds. M.A.J.Rodgers and E.L. Powers, Academic Press, New York, pp. 89-95. Pethkhov, I., Malcolmson, L.J., Przybylski, R. and Armstrong, L. 1999. J. Am. OilChem Soc. 76:627.Postmus, E., deMan, L. and deMan, J.M. 1989. J. Can. Inst. Food Sci. Technol.22:481.Pokorny, J. 1987. In “Autoxidation of Unsaturated Lipids.” Ed. H. W.S. Chan,Academic Press, New York, pp. 141.Przybylski, R., Biliaderis, C.G. and Eskin, N.A.M. 1993. J. Am. Oil Chem. Soc.70:1009.Przybylski, R., L., Eskin, N.A.M., Malcolmson, L., Durance-Tod, S., Carr, R. andMickle, J. 1993a. Lebensm. -Wiss. u. -Technol. 26:205. Przybylski, R. and Eskin, N.A.M. 1991. Formation of Phytosterol Oxides inProducts in Vegetable Oils. In Proceedings of the 8th Rapeseed Congress, Ed. I.McGregor, Saskatoon, May 9-11, pp. 888. Przybylski, R. and Eskin, N.A.M. 1988. J. Am. Oil Chem. Soc. 65:629.Rezanka, T. 1989. Prog. Lipid Res. 28:147Rezanka, T. and Mares, P. 1991. J. Chrom. 542:145Sahasrabudhe, M.R. 1977. J. Am. Oil Chem. Soc. 54:532.Sato, K. 1988. In “Crystallization and Polymorphism of Fats and Fatty Acids,”edited by N. Garti and K. Sato, Marcel Dekker, New York. Sattar, A., deMan, J.M. and Alexander, J.C. 1976. Can. Inst. Food Sci. Technol. J.9:108.Scarth, R., McVetty, P.B.E. Rimmer, S.R. and Stefansson, B.R. 1988. Can. J. PlantSci. 68:509.Sebedio, J.L. and Ackman, R.G. 1981. J. Am. Oil Chem. Soc. 58:972.
Smiles, A., Kakuda, Y. and McDonald, B.E. 1989. J. Am. Oil Chem. Soc. 66:348.Smiles, A., Kakuda, Y. and McDonald, B.E. 1988. J. Am. Oil Chem. Soc. 65:1151.Smouse, T.H. 1994. In “Methods to Assess Oil Quality and Stability,” Eds. K.Warner and N.A.M. Eskin, AOCS, Champaign, pp. 12.Sosulski, F., Zadernowski, P. and Babachowski, K. 1981. J. Am. Oil Chem. Soc.58:561.Strocchi, A. 1987. Riv. Ital. Sostanze Grasse 64:401. Suzuki, K. and Nishioka, A. 1993. J. Am. Oil Chem. Soc. 70:837.Tokarska, B., Hawrysh, Z.J. and Clandinin, J.T. 1986. Can. Inst. Food Sci.Technol. J. 19:130.Wanasundara, U.N. and Shahidi, F. 1994. J. Am. Oil Chem. Soc. 71:817.Ward, K., Scarth, R., Daun, J.K. and Thorsteinson, T.C. 1994. J. Am. Oil Chem.Soc. 71:1327-1331.Warner, K. and Mounts, T.L. 1993. J. Am. Oil Chem. Soc. 70:983. Warner, K., Frankel, E.N. and Mounts, T.L. 1989. J. Am. Oil Chem. Soc. 66:558.Wijesundera, R.C. and Ackman, R.G. 1988. J. Am. Oil Chem. Soc. 65:959.Wijesundera, R.C., Ackman, R.G., Abraham, V. deMan, J.M. 1988. J. Am. OilChem. Soc. 65:1526.Willner, Th., Jeß, U. and Weber, K. 1997. Fett/Lipid 99:138-147.Wolff, R. L. 1993. J. Am. Oil Chem. Soc. 70:425-430.Wong, R., Patel, J.D. Grant, I., Parker, J., Charne, D., Elhalwagy, M. Sys, E. 1991.In Proceedings of the Rapeseed Congress, Program and Abstract. Ed. I. McGregor,Saskatoon, pp. 53.Yap, P.H., deMan, J.M. and deMan, L. 1989. J. Am. Oil Chem. Soc. 66:1784.Ying, C.F. and deMan, J.M. 1989. Can. Inst. Food Sci. Technol. 22:222.Zambiazi, R.C. 1997. The Role of Endogenous Lipid Components on VegetableOil Stability. Ph.D. Thesis, University of Manitoba.
12
CANOLA COUNCIL OF CANADA400-167 Lombard Avenue, Winnipeg, Manitoba, Canada R3B 0T6 • Phone: (204) 982-2100 • Fax: (204) 942-1841