This article appeared in a journal published by Elsevier. The attached copy is furnished to the author for internal non-commercial research and education use, including for instruction at the authors institution and sharing with colleagues. Other uses, including reproduction and distribution, or selling or licensing copies, or posting to personal, institutional or third party websites are prohibited. In most cases authors are permitted to post their version of the article (e.g. in Word or Tex form) to their personal website or institutional repository. Authors requiring further information regarding Elsevier’s archiving and manuscript policies are encouraged to visit: http://www.elsevier.com/copyright
Transcript
This article appeared in a journal published by Elsevier. The attachedcopy is furnished to the author for internal non-commercial researchand education use, including for instruction at the authors institution
and sharing with colleagues.
Other uses, including reproduction and distribution, or selling orlicensing copies, or posting to personal, institutional or third party
websites are prohibited.
In most cases authors are permitted to post their version of thearticle (e.g. in Word or Tex form) to their personal website orinstitutional repository. Authors requiring further information
regarding Elsevier’s archiving and manuscript policies areencouraged to visit:
a Department of Agricultural and Bioresource Engineering, 57 Campus Drive, University of Saskatchewan, Saskatoon, SK, Canada S7N 5A9b Department of Mechanical Engineering, 57 Campus Drive, University of Saskatchewan, Saskatoon, SK, Canada S7N 5A9
a b s t r a c ta r t i c l e i n f o
Article history:Received 2 October 2009Received in revised form 24 March 2010Accepted 28 March 2010Available online 9 April 2010
Keywords:Coefficient of internal frictionCohesionSteam exploded strawBarley strawCanola strawOat strawWheat straw
During storage and handling, accurate knowledge of the physical and frictional behaviors of biomass grindsis essential for the efficient design of equipment. Therefore, experiments were performed on non-treated andsteam exploded barley, canola, oat and wheat straw grinds to determine their coefficient of internal frictionand cohesion at three hammer mill screen sizes of 6.4, 3.2 and 1.6 mm, three normal stress values of 9.8, 19.6and 39.2 kPa at 10% moisture content (wb). At any specific hammer mill screen size, the geometric meanparticle size and bulk density of non-treated straw was significantly larger than steam exploded straw. Thebulk density of ground straw significantly increased with a decrease in hammer mill screen sizes. The steamexploded straw grinds resulted in higher coefficient of internal friction compared to non-treated strawgrinds primarily because of lower bulk densities. The coefficient of friction for non-treated barley, canola, oatand wheat straw were in the range of 0.505 to 0.584, 0.661 to 0.665, 0.498 to 0.590, and 0.532 to 0.591,respectively. Similarly, the coefficient of friction for steam exploded barley, canola, oat and wheat straw werein the range of 0.562 to 0.738, 0.708 to 0.841, 0.660 to 0.860, and 0.616 to 1.036, respectively, which werehigher than non-treated straw of the kind. Power, logarithmic or exponential equations were developed topredict the coefficient of internal friction and cohesion with respect to average geometric mean particle sizesfor non-treated and steam explode barley, canola, oat and wheat straw grinds.
Efficient and economic production and processing of agriculturalbiomass residue as feedstock are critical for the viability of a biofuelindustry [1,2]. Due to their heterogeneous nature, agriculturalbiomass materials possess inherently low bulk densities, and oftenrequire densification to improve their handling characteristics andlogistics of transportation and storage [3,4]. The bulk density of looseand standard baled straw is approximately 40 kg/m3 and 100 kg/m3,respectively, compared with the bulk density of unprocessed woodresidue, which is approximately 250 kg/m3 [5,6]. Fuels with high bulkdensity are advantageous because they represent a high energy-for-volume value. Consequently, these fuels need less storage space for agiven refueling time. Inadequate bulk densities can be improved byeither briquetting or pelleting of the biomass [7,8]. A bulk density of650 kg/m3 is stated as design value for wood pellet producers [9].
Prior to densification, biomass grinds need to be efficiently stored,handled and transported. Physical and frictional properties of biomass
have a significant effecton thedesignof newandmodificationof existingbins, hoppers and feeders [10]. The frictional behavior of biomass grindsin all engineering applications is described by two independentparameters: the coefficient of internal friction, and the coefficient ofwall friction. The former determines the stress distribution withinparticles undergoing strain, and the latter describes themagnitude of thestresses between the particle and the walls of its container [11]. Theclassic lawof friction states that frictional force is directly proportional tothe total force that acts normal to the shear surfaces [12]. Frictional forcedepends on the nature of the materials in contact but is independent ofthe area of contact or sliding velocity [13]. Material properties such asmoisture content and particle size affect the frictional properties anddensification performance of an individual feedstock [4,12]. In addition,the determination of the coefficient of friction is essential for the designof production and handling equipment and in storage structures [14].
Mani et al. [3] studied the coefficient of wall friction properties ofcorn stover at two grind sizes of 6.35 and 3.18 mm, and three moisturecontents of 7, 11 and 15% (wb) on a galvanized steel surface. It wasobserved that the adhesion coefficient did not exhibit dependence onmoisture content. The coefficient of wall friction of corn stover grindincreased from 0.18 to 0.26 with an increase in moisture content from7% to 15%. No clear trend was observed for the adhesion coefficient.
Shaw and Tabil [4] performed studies to determine themechanicalproperties of peat moss, wheat straw, oat hulls and flax shives at 9–
10% moisture content (wb) having geometric mean particle sizes of0.74, 0.65, 0.47 and 0.64 mm, respectively, on a mild steel surface. Itwas found that peat moss and oat hulls had the highest (0.68) andlowest (0.39) wall coefficients of friction, respectively. While, theadhesion coefficient values ranged from 0.2635 kPa for peat moss, to16.203 kPa for flax shives.
Afzalinia and Roberge [15] studied the static friction coefficient ofalfalfa, barley straw, wheat straw and green barley on a polished steelsurface athighpressure levels closer tobalingor densificationpressures,which were in the range of 200 to 735 kPa. The data revealed that thecoefficient of friction of alfalfa and barley straw increased from 0.15 to0.26 and 0.14 to 0.27with an increase inmaterialmoisture content from12.0 to 45.7% (wb), respectively. In addition, coefficients of friction forwheat straw at 10% moisture content and whole green barley at 51%moisture content were 0.13 and 0.21, respectively.
Fasina et al. [10] determined the internal frictional and cohesionproperties of peanut hull, switchgrass and poultry litter at hammer millscreen sizes of 0.79, 1.59 and 3.2 mm. They have determined that bothpeanut hull and switchgrass can be classified as cohesive materialswhilepoultry litter canbeclassified aseasyflowingmaterial. In addition,the hammer mill screen size did not have any significant effect on the
angle of internal friction and cohesive properties of these materials.The average angles of internal friction for peanut hull, switchgrassand poultry litter were 42.82°±1.34, 41.76°±0.92, and 41.26°±1.43,respectively.
Chevanan et al. (2008) determined the frictional properties ofchopped switchgrass (7.81 and 13.50 mm), wheat straw (7.09 and10.39 mm) and corn stover (7.80 and 14.89 mm) using a direct shearcell at four applied normal stresses of 1.23, 2.46, 3.67 and 4.92 kPa.The chopped biomass coefficient of internal friction was in the rangeof 0.765 to 1.586 for the various normal pressures [16]. The frictioncoefficient increased for reduced normal pressure for all threechopped biomass types, however, changing the particle size causedno statistically significant difference in the friction coefficients exceptat the lowest normal pressure of 1.23 kPa for chopped corn stover andchopped wheat straw.
Larsson [12] determined the influence of normal stress on thecoefficient of kinematic wall friction of reed canary grass powder froma hammer mill screen size of 4.0 mm at low (0.52 to 7.52 kPa) andhigh (23 to 275 MPa) normal stresses. It was observed that at bothlow and high normal stresses, the coefficient of kinematic wall frictionwas negatively correlated to normal stress. However, a high friction
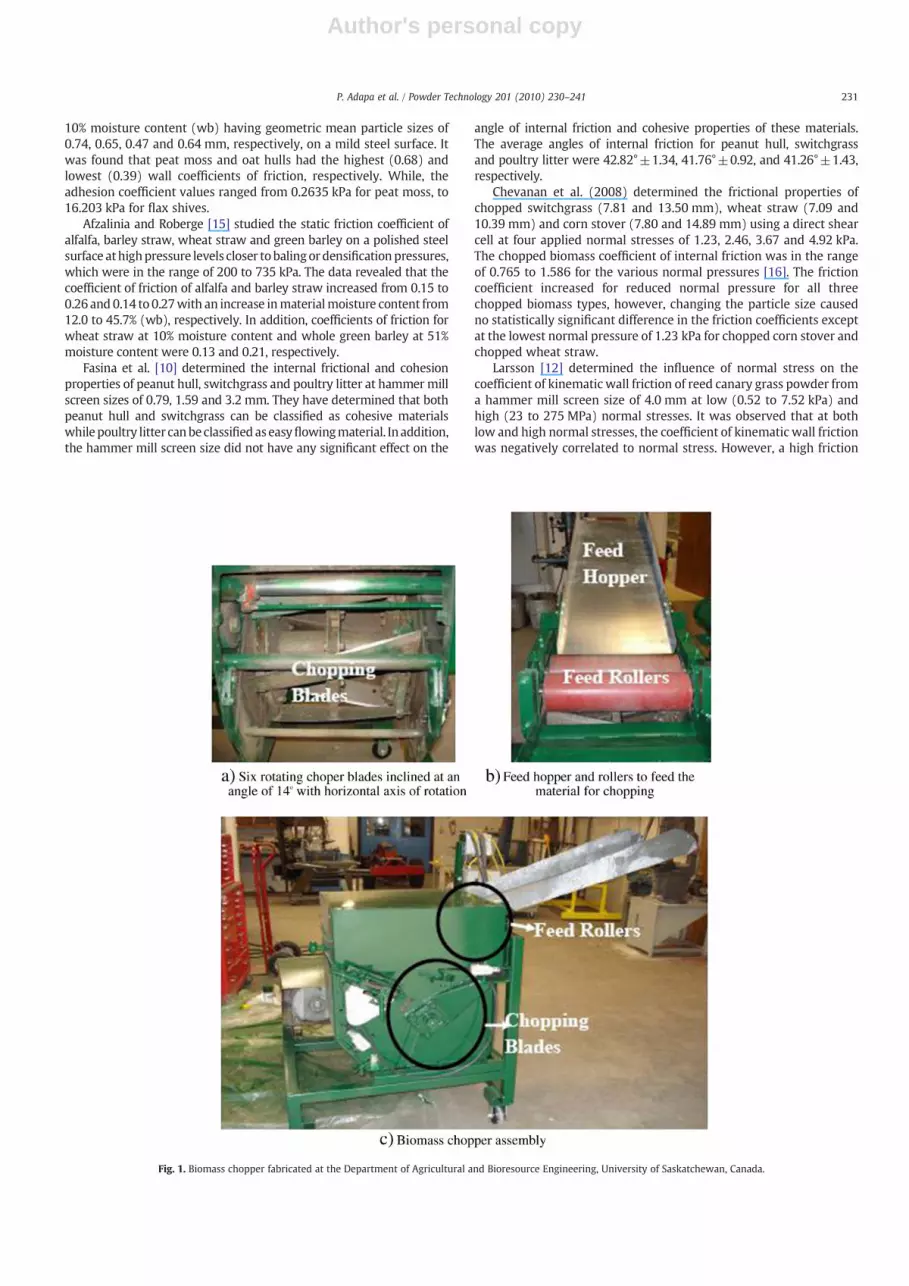
Fig. 1. Biomass chopper fabricated at the Department of Agricultural and Bioresource Engineering, University of Saskatchewan, Canada.
231P. Adapa et al. / Powder Technology 201 (2010) 230–241
value of about 0.6 was observed for normal stress values of 50 MPaand lower. Hence, it was concluded that the friction values obtainedprobably originated from internal friction occurring within sampleand not from kinematic wall friction.
The coefficient of internal friction has been reported by Fasina et al.[10] for peanut hull, switchgrass and poultry litter, and Chevanan et al.[16] for chopped switchgrass, wheat straw and corn stover. However,no studies were found on internal friction and cohesion properties ofnon-treated and steam exploded barley, canola, oat and wheat strawgrinds. Therefore, the objective of the present study was to determinethe effect of steam explosion pre-treatment, hammer mill screen size,and normal forces on coefficient of internal friction and cohesionproperties of non-treated and steam exploded barley, canola, oat andwheat straw.
2. Materials and methods
2.1. Agricultural biomass
Four types of agricultural biomass (barley, canola, oat and wheatstraw) were used for the experiments. The straw samples wereacquired in small square bale form (typically having dimensions of0.45×0.35×1.00 m) during the summer of 2008 from a farmer in theCentral Butte area of Saskatchewan, Canada.
The initial moisture contents of ground barley, canola, oat andwheat straw were 6.7, 6.7, 5.3 and 4.0% (wb), respectively. Theagricultural biomass was stored under a tarpaulin cover during thewinter of 2008 (approximately for 7 months). During this period themoisture content of barley, canola, oat and wheat straw increased to13.5, 15.1, 13.1 and 15.6% (wb), respectively.
All of the baled straw samples were chopped using a chopper,which was fabricated in the Bioprocessing Lab, Department ofAgricultural and Bioresource Engineering, University of Saskatchewan(Fig. 1). The biomass chopper is a modified and compact version of thecurrently available New Holland Forage Chopper series 770 havingsimilar specification of the chopper and cutter-bar. The biomasschopper was equipped with a feed hopper and a pair of rollers to feedthe material to the chopping blades. The feed rate of biomass to the
blades was dependent on the roller speed. After a few preliminarytrials, the rollers were set to rotate at 50 rpm in order to avoidmaterial clogging. Each of the six chopper blades were inclined at anangle of 14° (with respect to horizontal axis of rotation) to delivershearing effect on the biomass and were set to rotate at 460 rpm.
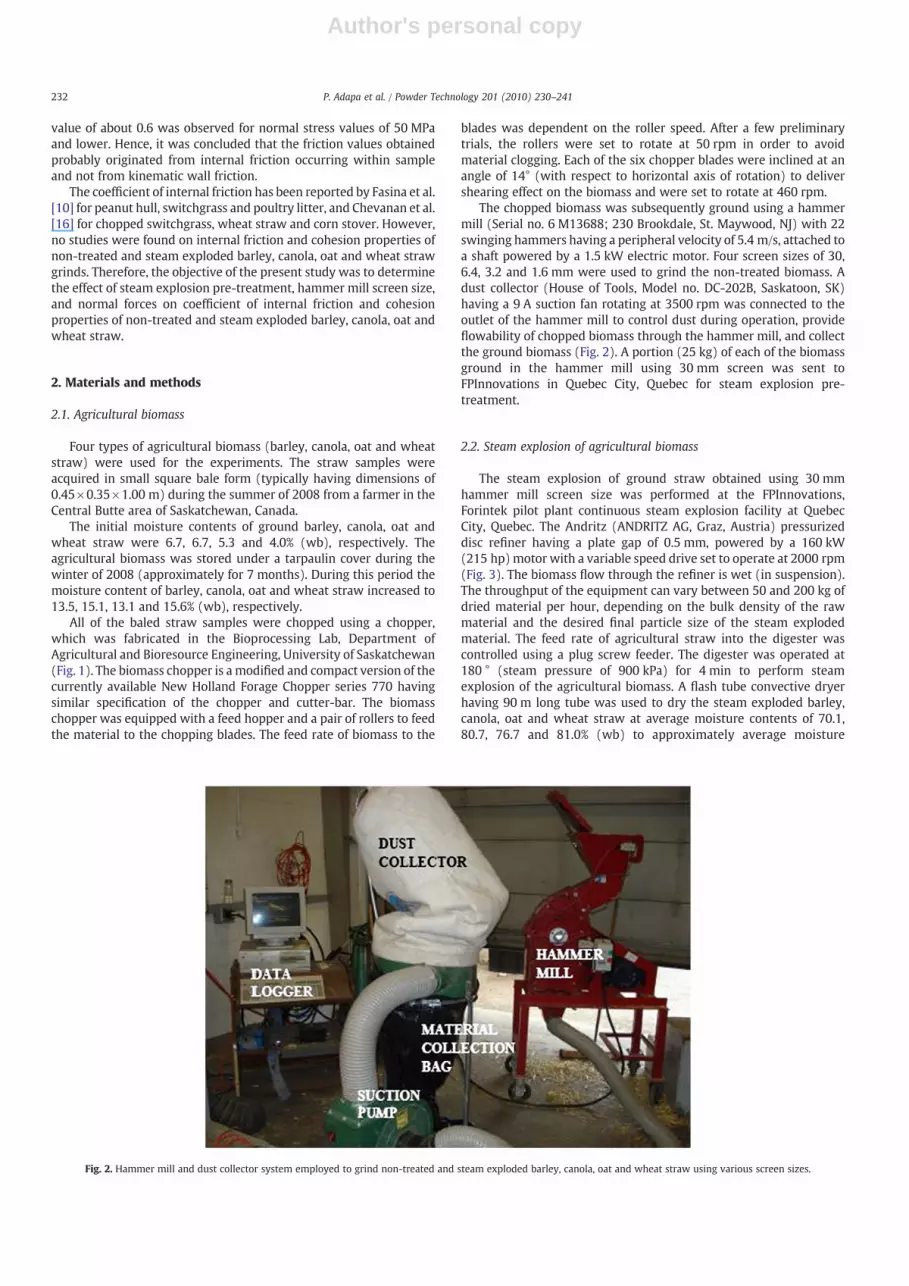
The chopped biomass was subsequently ground using a hammermill (Serial no. 6 M13688; 230 Brookdale, St. Maywood, NJ) with 22swinging hammers having a peripheral velocity of 5.4 m/s, attached toa shaft powered by a 1.5 kW electric motor. Four screen sizes of 30,6.4, 3.2 and 1.6 mm were used to grind the non-treated biomass. Adust collector (House of Tools, Model no. DC-202B, Saskatoon, SK)having a 9 A suction fan rotating at 3500 rpm was connected to theoutlet of the hammer mill to control dust during operation, provideflowability of chopped biomass through the hammer mill, and collectthe ground biomass (Fig. 2). A portion (25 kg) of each of the biomassground in the hammer mill using 30 mm screen was sent toFPInnovations in Quebec City, Quebec for steam explosion pre-treatment.
2.2. Steam explosion of agricultural biomass
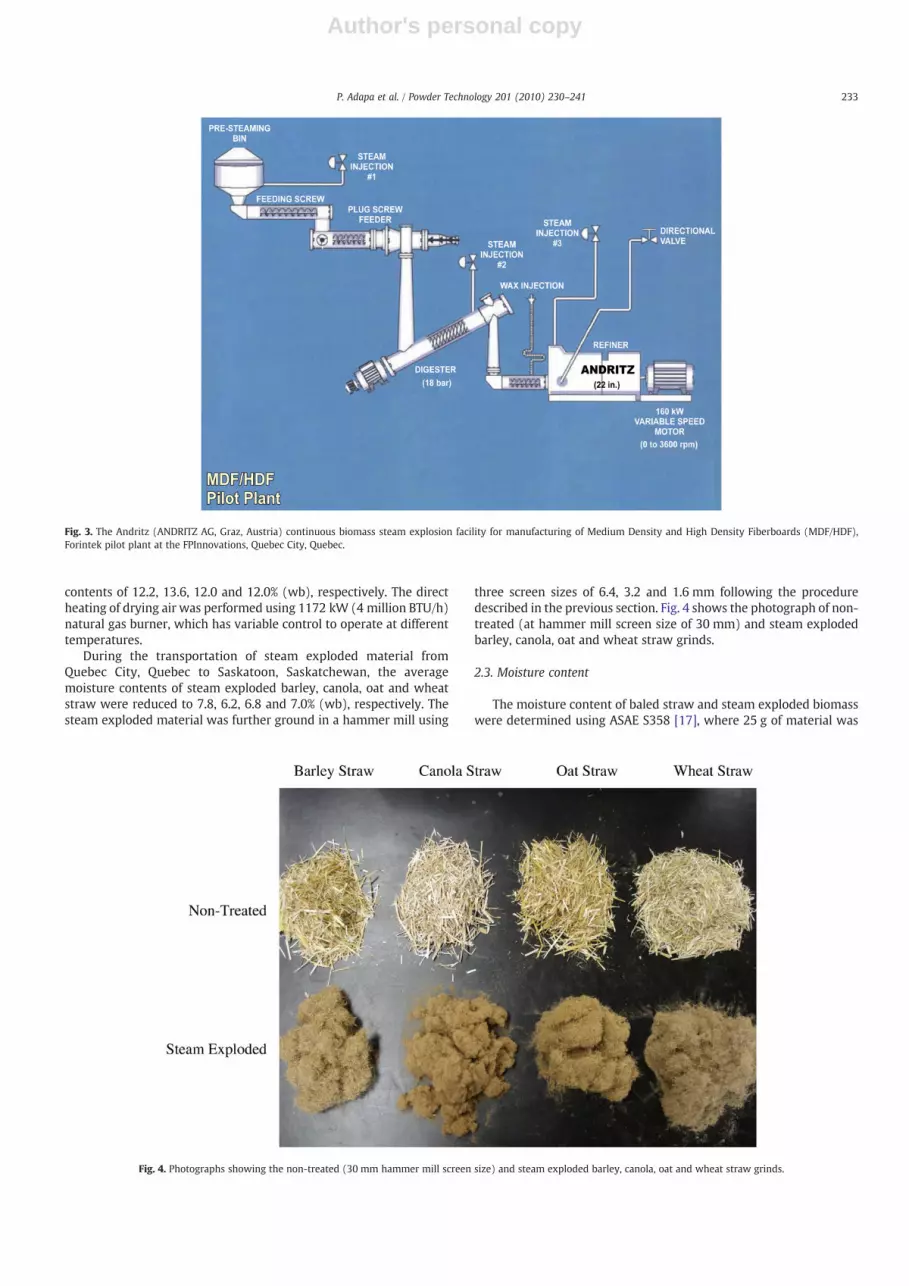
The steam explosion of ground straw obtained using 30 mmhammer mill screen size was performed at the FPInnovations,Forintek pilot plant continuous steam explosion facility at QuebecCity, Quebec. The Andritz (ANDRITZ AG, Graz, Austria) pressurizeddisc refiner having a plate gap of 0.5 mm, powered by a 160 kW(215 hp)motor with a variable speed drive set to operate at 2000 rpm(Fig. 3). The biomass flow through the refiner is wet (in suspension).The throughput of the equipment can vary between 50 and 200 kg ofdried material per hour, depending on the bulk density of the rawmaterial and the desired final particle size of the steam explodedmaterial. The feed rate of agricultural straw into the digester wascontrolled using a plug screw feeder. The digester was operated at180 ° (steam pressure of 900 kPa) for 4 min to perform steamexplosion of the agricultural biomass. A flash tube convective dryerhaving 90 m long tube was used to dry the steam exploded barley,canola, oat and wheat straw at average moisture contents of 70.1,80.7, 76.7 and 81.0% (wb) to approximately average moisture
Fig. 2. Hammer mill and dust collector system employed to grind non-treated and steam exploded barley, canola, oat and wheat straw using various screen sizes.
232 P. Adapa et al. / Powder Technology 201 (2010) 230–241
contents of 12.2, 13.6, 12.0 and 12.0% (wb), respectively. The directheating of drying air was performed using 1172 kW (4 million BTU/h)natural gas burner, which has variable control to operate at differenttemperatures.
During the transportation of steam exploded material fromQuebec City, Quebec to Saskatoon, Saskatchewan, the averagemoisture contents of steam exploded barley, canola, oat and wheatstraw were reduced to 7.8, 6.2, 6.8 and 7.0% (wb), respectively. Thesteam exploded material was further ground in a hammer mill using
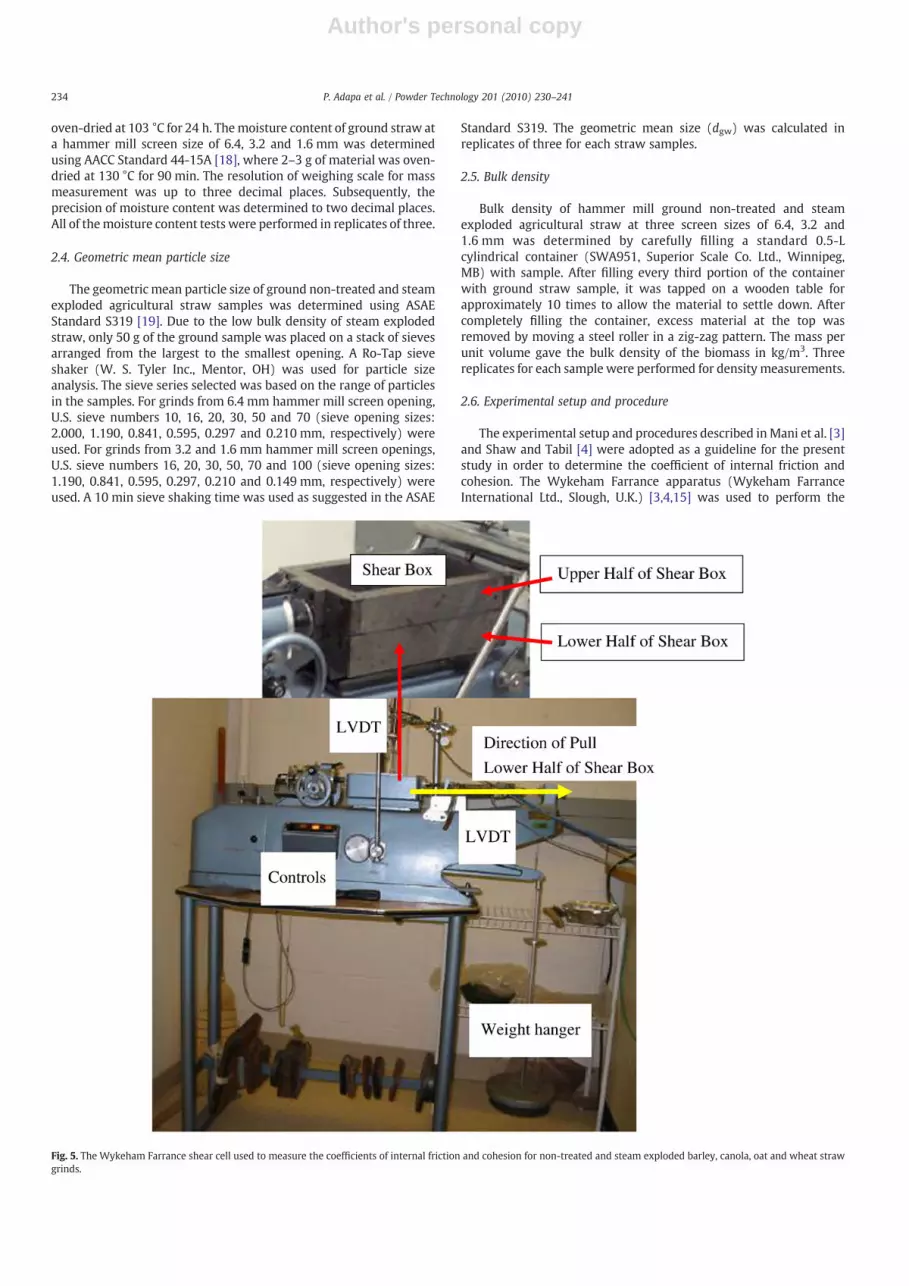
three screen sizes of 6.4, 3.2 and 1.6 mm following the proceduredescribed in the previous section. Fig. 4 shows the photograph of non-treated (at hammer mill screen size of 30 mm) and steam explodedbarley, canola, oat and wheat straw grinds.
2.3. Moisture content
The moisture content of baled straw and steam exploded biomasswere determined using ASAE S358 [17], where 25 g of material was
Fig. 4. Photographs showing the non-treated (30 mm hammer mill screen size) and steam exploded barley, canola, oat and wheat straw grinds.
Fig. 3. The Andritz (ANDRITZ AG, Graz, Austria) continuous biomass steam explosion facility for manufacturing of Medium Density and High Density Fiberboards (MDF/HDF),Forintek pilot plant at the FPInnovations, Quebec City, Quebec.
233P. Adapa et al. / Powder Technology 201 (2010) 230–241
Author's personal copy
oven-dried at 103 °C for 24 h. Themoisture content of ground straw ata hammer mill screen size of 6.4, 3.2 and 1.6 mm was determinedusing AACC Standard 44-15A [18], where 2–3 g of material was oven-dried at 130 °C for 90 min. The resolution of weighing scale for massmeasurement was up to three decimal places. Subsequently, theprecision of moisture content was determined to two decimal places.All of themoisture content tests were performed in replicates of three.
2.4. Geometric mean particle size
The geometric mean particle size of ground non-treated and steamexploded agricultural straw samples was determined using ASAEStandard S319 [19]. Due to the low bulk density of steam explodedstraw, only 50 g of the ground sample was placed on a stack of sievesarranged from the largest to the smallest opening. A Ro-Tap sieveshaker (W. S. Tyler Inc., Mentor, OH) was used for particle sizeanalysis. The sieve series selected was based on the range of particlesin the samples. For grinds from 6.4 mm hammer mill screen opening,U.S. sieve numbers 10, 16, 20, 30, 50 and 70 (sieve opening sizes:2.000, 1.190, 0.841, 0.595, 0.297 and 0.210 mm, respectively) wereused. For grinds from 3.2 and 1.6 mm hammer mill screen openings,U.S. sieve numbers 16, 20, 30, 50, 70 and 100 (sieve opening sizes:1.190, 0.841, 0.595, 0.297, 0.210 and 0.149 mm, respectively) wereused. A 10 min sieve shaking time was used as suggested in the ASAE
Standard S319. The geometric mean size (dgw) was calculated inreplicates of three for each straw samples.
2.5. Bulk density
Bulk density of hammer mill ground non-treated and steamexploded agricultural straw at three screen sizes of 6.4, 3.2 and1.6 mm was determined by carefully filling a standard 0.5-Lcylindrical container (SWA951, Superior Scale Co. Ltd., Winnipeg,MB) with sample. After filling every third portion of the containerwith ground straw sample, it was tapped on a wooden table forapproximately 10 times to allow the material to settle down. Aftercompletely filling the container, excess material at the top wasremoved by moving a steel roller in a zig-zag pattern. The mass perunit volume gave the bulk density of the biomass in kg/m3. Threereplicates for each sample were performed for density measurements.
2.6. Experimental setup and procedure
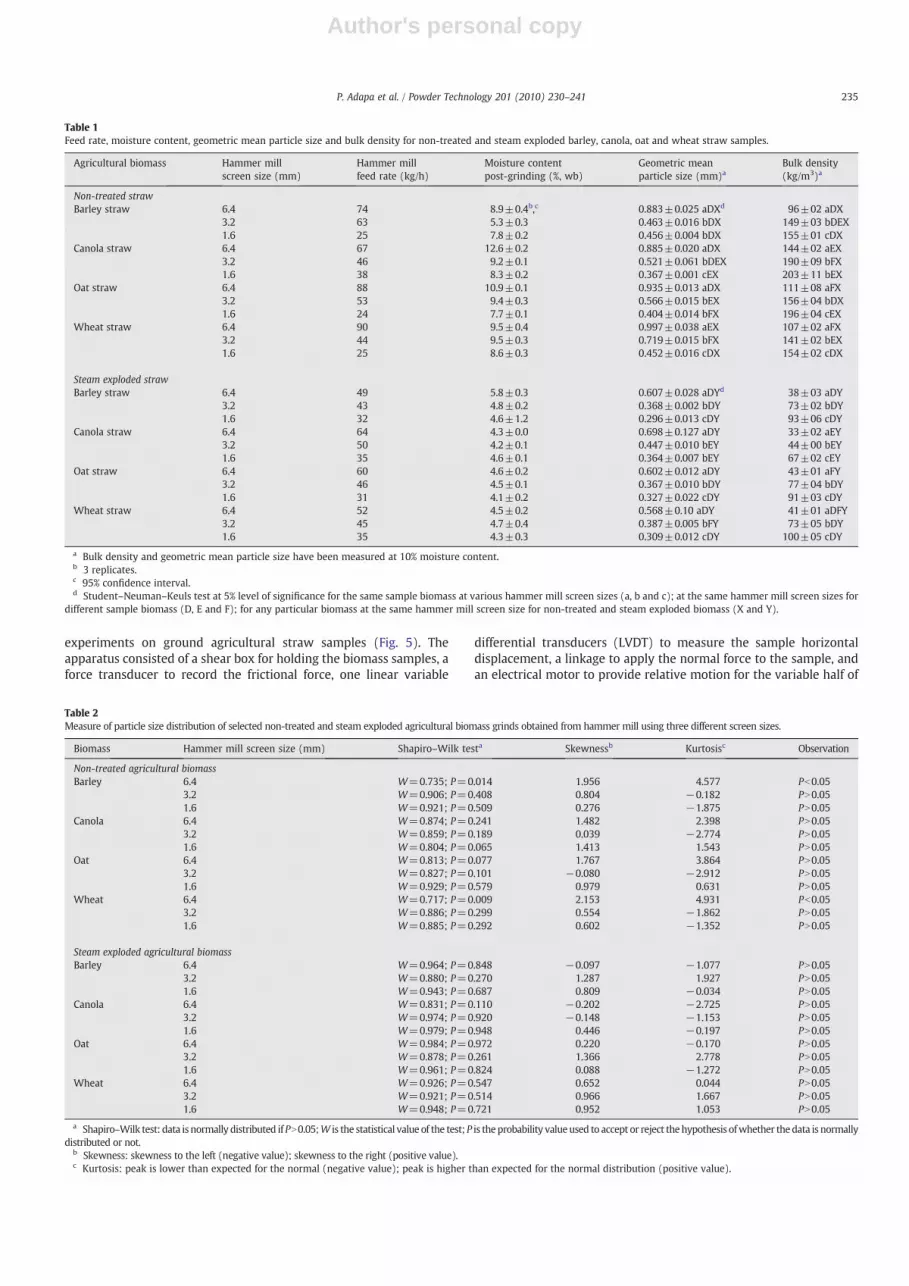
The experimental setup and procedures described inMani et al. [3]and Shaw and Tabil [4] were adopted as a guideline for the presentstudy in order to determine the coefficient of internal friction andcohesion. The Wykeham Farrance apparatus (Wykeham FarranceInternational Ltd., Slough, U.K.) [3,4,15] was used to perform the
Fig. 5. The Wykeham Farrance shear cell used to measure the coefficients of internal friction and cohesion for non-treated and steam exploded barley, canola, oat and wheat strawgrinds.
234 P. Adapa et al. / Powder Technology 201 (2010) 230–241
Author's personal copy
experiments on ground agricultural straw samples (Fig. 5). Theapparatus consisted of a shear box for holding the biomass samples, aforce transducer to record the frictional force, one linear variable
differential transducers (LVDT) to measure the sample horizontaldisplacement, a linkage to apply the normal force to the sample, andan electrical motor to provide relative motion for the variable half of
Table 2Measure of particle size distribution of selected non-treated and steam exploded agricultural biomass grinds obtained from hammer mill using three different screen sizes.
a Shapiro–Wilk test: data is normally distributed if PN0.05;W is the statistical value of the test; P is the probability valueused to accept or reject thehypothesis ofwhether thedata is normallydistributed or not.
b Skewness: skewness to the left (negative value); skewness to the right (positive value).c Kurtosis: peak is lower than expected for the normal (negative value); peak is higher than expected for the normal distribution (positive value).
Table 1Feed rate, moisture content, geometric mean particle size and bulk density for non-treated and steam exploded barley, canola, oat and wheat straw samples.
a Bulk density and geometric mean particle size have been measured at 10% moisture content.b 3 replicates.c 95% confidence interval.d Student–Neuman–Keuls test at 5% level of significance for the same sample biomass at various hammer mill screen sizes (a, b and c); at the same hammer mill screen sizes for
different sample biomass (D, E and F); for any particular biomass at the same hammer mill screen size for non-treated and steam exploded biomass (X and Y).
235P. Adapa et al. / Powder Technology 201 (2010) 230–241
Author's personal copy
the sample box with respect to its fixed half. The dimensions of shearbox were 100 mm square, 18 mm thick and 37 mm deep. Prior to theexperiments, the agricultural straw was re-moistened to 10%moisture content (wb) by adding/sprinkling a calculated amount ofwater, except for canola and oat straw at 6.4 mm hammer mill screensize, which were already at 12.6 and 10.9% (wb), respectively. Thesamples were subsequently stored in plastic bags and kept in a coldroom at 4 °C for a minimum of one week. Three levels of normal loadsof 1.0, 2.0 and 4.0 kg (corresponding to 98.1, 196.2 and 392.4 N), withrespective pressures of 9.8, 19.6 and 39.2 kPa were applied to thesamples by weight acting through a load hanger that rested on the topplate. These loads were selected based on the studies performed byShaw and Tabil [4], where high friction coefficients of around 0.6 wereobserved at normal stresses of 0.3 to 16.0 kPa for peat moss, wheatstraw, oat hulls and flax shives. Larsson [12] also showed that highfriction coefficients of about 0.6 are observed below 50 MPa. Inaddition, Chevanan et al. [16] also conducted their experiments atnormal pressures of 1.23 to 4.92 kPa. The internal friction coefficientof ground straw sample was measured by filling the top and bottomhalves of the box. Subsequently, the bottom half of the box was pulledat a constant speed of 1.2 mm/min in the horizontal direction to applythe shear force at three levels of normal loads. A total of threereplicates were performed for each biomass sample and individualnormal loads. The maximum shear stresses were plotted versus thenormal pressures (normal stress) for non-treated and steam explodedbarley, canola, oat and wheat straw at three hammermill grinds sizes.
The coefficient of internal friction was calculated from Eq. (1) as theslope of the relationship. The cohesion (C) was calculated as theintercept defined by the Mohr–Coulomb model [20,21]:
τ = μσ + C ð1Þ
where, τ, is the shear stress (kPa), σ is the normal stress (kPa), μ is thecoefficient of internal friction, and C is the cohesion (kPa).
2.7. Statistical analysis
The experiments were setup as completely random experimentaldesign with 3 replications of shearing stress (to determine internalfriction and cohesion) and four-variable (straw, pre-treatment,hammermill screen size and normal load) factorial design. Coefficientof internal friction and cohesion were the dependent variables, whilestraw, pre-treatment, hammer mill screen size and normal load werethe independent variables. Statistical analyses were conducted on thegeometric mean particle size, bulk density and shear stress data usingSAS for Windows (version 8.2) [22]. The SAS general linear model(GLM) for completely randomized design (CRD) procedure was usedand the Student–Neuman–Keuls test (SNK) was performed todetermine the difference between any two treatment means at a 5%level of significance (SASManual, [22]). Best predictor equations weredeveloped for the coefficient of internal friction and cohesion havingthe highest coefficient of determination (R2) with straw, pre-
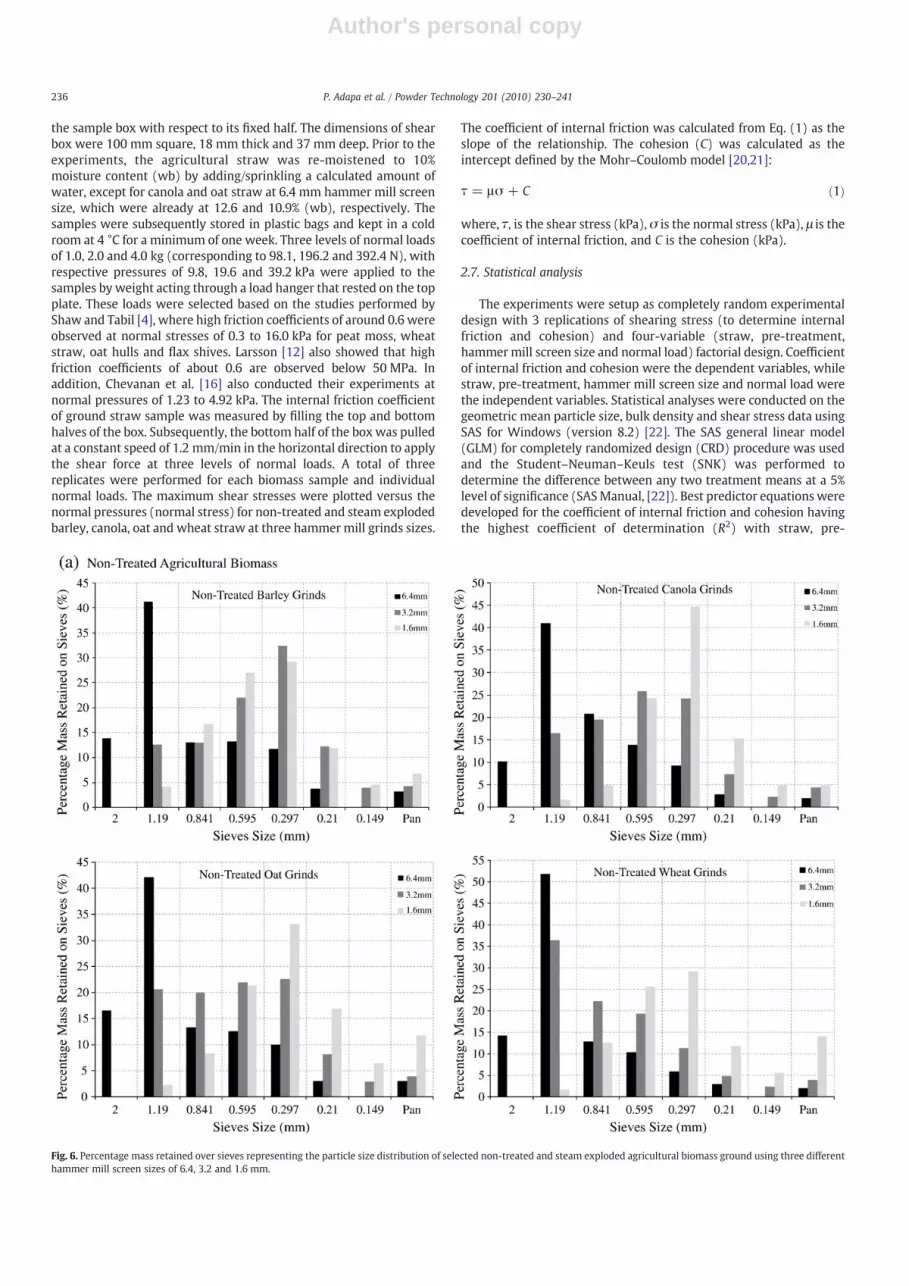
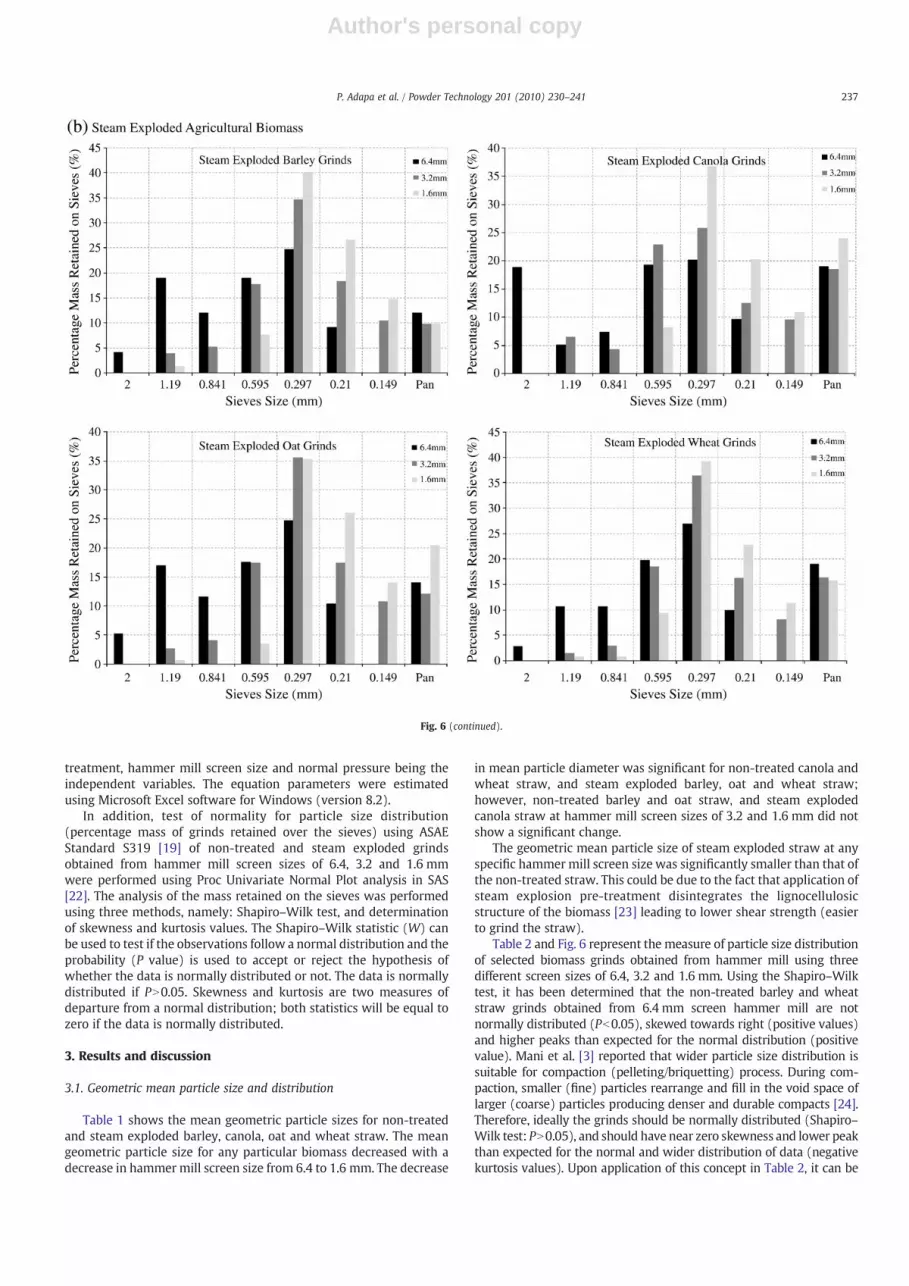
Fig. 6. Percentage mass retained over sieves representing the particle size distribution of selected non-treated and steam exploded agricultural biomass ground using three differenthammer mill screen sizes of 6.4, 3.2 and 1.6 mm.
236 P. Adapa et al. / Powder Technology 201 (2010) 230–241
Author's personal copy
treatment, hammer mill screen size and normal pressure being theindependent variables. The equation parameters were estimatedusing Microsoft Excel software for Windows (version 8.2).
In addition, test of normality for particle size distribution(percentage mass of grinds retained over the sieves) using ASAEStandard S319 [19] of non-treated and steam exploded grindsobtained from hammer mill screen sizes of 6.4, 3.2 and 1.6 mmwere performed using Proc Univariate Normal Plot analysis in SAS[22]. The analysis of the mass retained on the sieves was performedusing three methods, namely: Shapiro–Wilk test, and determinationof skewness and kurtosis values. The Shapiro–Wilk statistic (W) canbe used to test if the observations follow a normal distribution and theprobability (P value) is used to accept or reject the hypothesis ofwhether the data is normally distributed or not. The data is normallydistributed if PN0.05. Skewness and kurtosis are two measures ofdeparture from a normal distribution; both statistics will be equal tozero if the data is normally distributed.
3. Results and discussion
3.1. Geometric mean particle size and distribution
Table 1 shows the mean geometric particle sizes for non-treatedand steam exploded barley, canola, oat and wheat straw. The meangeometric particle size for any particular biomass decreased with adecrease in hammermill screen size from 6.4 to 1.6 mm. The decrease
in mean particle diameter was significant for non-treated canola andwheat straw, and steam exploded barley, oat and wheat straw;however, non-treated barley and oat straw, and steam explodedcanola straw at hammer mill screen sizes of 3.2 and 1.6 mm did notshow a significant change.
The geometric mean particle size of steam exploded straw at anyspecific hammermill screen size was significantly smaller than that ofthe non-treated straw. This could be due to the fact that application ofsteam explosion pre-treatment disintegrates the lignocellulosicstructure of the biomass [23] leading to lower shear strength (easierto grind the straw).
Table 2 and Fig. 6 represent the measure of particle size distributionof selected biomass grinds obtained from hammer mill using threedifferent screen sizes of 6.4, 3.2 and 1.6 mm. Using the Shapiro–Wilktest, it has been determined that the non-treated barley and wheatstraw grinds obtained from 6.4 mm screen hammer mill are notnormally distributed (Pb0.05), skewed towards right (positive values)and higher peaks than expected for the normal distribution (positivevalue). Mani et al. [3] reported that wider particle size distribution issuitable for compaction (pelleting/briquetting) process. During com-paction, smaller (fine) particles rearrange and fill in the void space oflarger (coarse) particles producing denser and durable compacts [24].Therefore, ideally the grinds should be normally distributed (Shapiro–Wilk test: PN0.05), and should have near zero skewness and lower peakthan expected for the normal and wider distribution of data (negativekurtosis values). Upon application of this concept in Table 2, it can be
Fig. 6 (continued).
237P. Adapa et al. / Powder Technology 201 (2010) 230–241
Author's personal copy
deduced that for non-treated barley straw at 1.6 mm hammer millscreen size (PN0.05; skewness=0.276; kurtosis=−1.875), canolastraw (PN0.05; skewness=0.039; kurtosis=−2.774), oat straw(PN0.05; skewness=−0.080; kurtosis=−2.912), and wheat straw(PN0.05; skewness=0.554; kurtosis=−1.862) at 3.2 mm hammermill screen size resulted in grinds that would potentially produce bettercompacts. For steam exploded agricultural biomass, Table 2 also showsthat barley (PN0.05; skewness=−0.097; kurtosis=−1.077), canola(PN0.05; skewness=−0.202; kurtosis=−2.725) andwheat (PN0.05;skewness=0.652; kurtosis=0.044) straw at 6.4 mm hammer millscreen size, and oat (PN0.05; skewness=0.088; kurtosis=−1.272)straw at 1.6 mmscreen sizewould potentially produce better compacts.
3.2. Bulk density
The bulk density values for barley, canola, oat and wheat strawgrinds are given in Table 1. The bulk density of non-treated and steamexploded straw significantly increased with a decrease in hammer
mill screen size from 6.4 to 1.6 mm, except for non-treated canolastraw at 3.2 and 1.6 mm.
The bulk density of non-treated barley, canola, oat and wheatstraw at any specific hammer mill screen size was significantly higherthan steam exploded straw (Table 1). This could again be attributed tothe fact that application of steam explosion pre-treatment disinte-grates the organized and compact lignocellulosic structure of biomassleading to lower bulk densities.
3.3. Frictional properties
Tables 3–6 show that predominantly a linear correlation exists(higher R2 values) between normal and shear stresses for non-treatedand steam exploded barley, canola, oat and wheat straw grinds. Inaddition, it has been observed that the shear stress for both non-treated and steam exploded straw at any specific hammer mill screensize significantly increased with an increase in normal stress. It istypically expected that the shear stress should be lower than normal
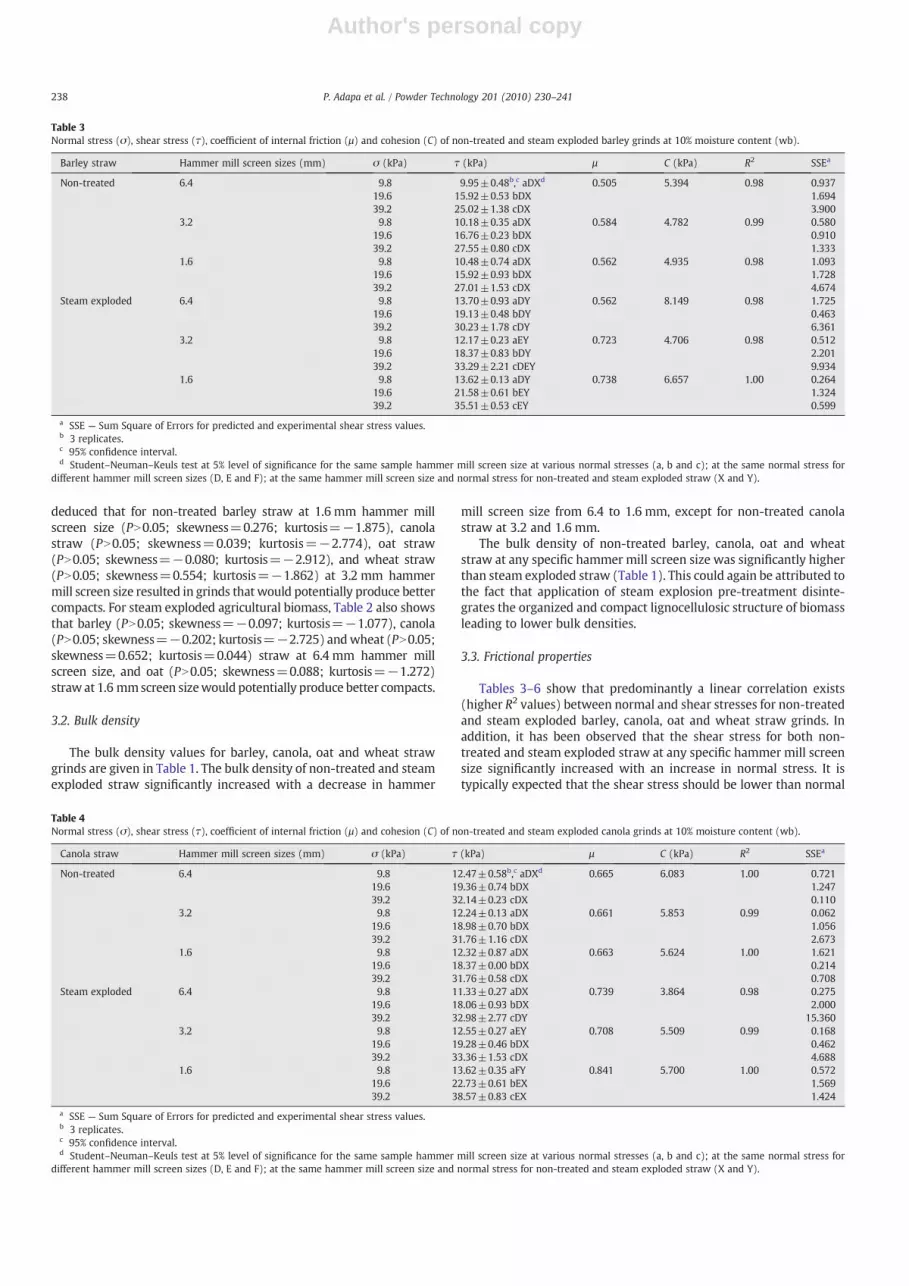
Table 3Normal stress (σ), shear stress (τ), coefficient of internal friction (µ) and cohesion (C) of non-treated and steam exploded barley grinds at 10% moisture content (wb).
1.6 9.8 13.62±0.13 aDY 0.738 6.657 1.00 0.26419.6 21.58±0.61 bEY 1.32439.2 35.51±0.53 cEY 0.599
a SSE — Sum Square of Errors for predicted and experimental shear stress values.b 3 replicates.c 95% confidence interval.d Student–Neuman–Keuls test at 5% level of significance for the same sample hammer mill screen size at various normal stresses (a, b and c); at the same normal stress for
different hammer mill screen sizes (D, E and F); at the same hammer mill screen size and normal stress for non-treated and steam exploded straw (X and Y).
Table 4Normal stress (σ), shear stress (τ), coefficient of internal friction (µ) and cohesion (C) of non-treated and steam exploded canola grinds at 10% moisture content (wb).
a SSE — Sum Square of Errors for predicted and experimental shear stress values.b 3 replicates.c 95% confidence interval.d Student–Neuman–Keuls test at 5% level of significance for the same sample hammer mill screen size at various normal stresses (a, b and c); at the same normal stress for
different hammer mill screen sizes (D, E and F); at the same hammer mill screen size and normal stress for non-treated and steam exploded straw (X and Y).
238 P. Adapa et al. / Powder Technology 201 (2010) 230–241
Author's personal copy
stress. Most of the measured data points in this study show this trend,but some data show the opposite. Similar observations were made byChevanan et al. [16] for chopped switchgrass, wheat straw and cornstover, and by Richter [25] for chopped grass and corn silage, wherehigher shear stress than normal stress values were observed. Thisphenomenon was usually observed at lower applied pressures, with afew exceptions at higher pressures, primarily due to fibrous andirregular shaped particles.
The shear stress for non-treated and steam exploded barley, canolaand wheat straw at any specific normal stress was not significantlydifferent at various hammermill screen sizes, with a few exceptions forsteam exploded straw (Tables 3, 4 and 6). As a result, the sum of squareof error (SSE) values had higher degree of variability in steam explodedmaterial as compared to non-treated straw (Tables 3, 4 and 6).
At any specific normal stress, the shear stress was not significantlydifferent at 3.2 and 1.6 mm screen size for non-treated oat straw. In
general, the shear stress for non-treated and steam exploded oat strawgrinds at 6.4 mm screen size was significantly lower than 3.2 and1.6 mm screen size at all normal stress, with a few exceptions (Table 5).No specific trend was observed for steam exploded material (Table 5).
In general, the shear stress values for steam exploded barley, oatand wheat straw grind at all hammer mill screen sizes and normalstress were significantly higher than those of the non-treated straw(Tables 3, 5 and 6). This could be due to significantly lower bulkdensities of steam exploded material as compared to non-treatedmaterial. It can also be confirmed from the fact that highlycompressible powders (lower bulk density) are less flowable, andvice versa [3]. As a result, the coefficient of internal friction was higherfor steam exploded straw as compared to non-treated straw.
The shear stress values for non-treated and steam exploded canolastraw were not significantly different, except for steam explodedstraw at 6.4 mm screen size and 39.2 kPa normal stress, and screen
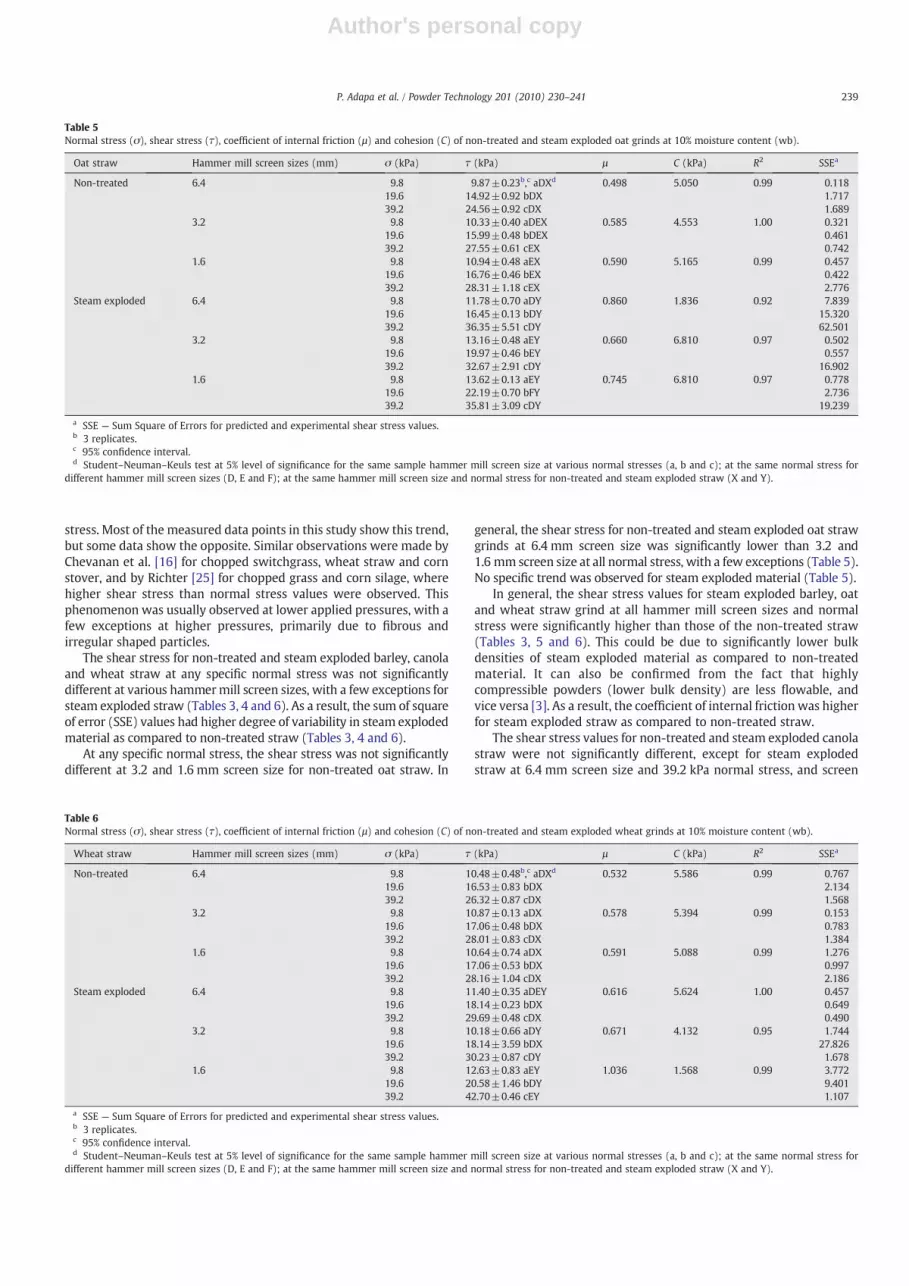
Table 5Normal stress (σ), shear stress (τ), coefficient of internal friction (µ) and cohesion (C) of non-treated and steam exploded oat grinds at 10% moisture content (wb).
a SSE — Sum Square of Errors for predicted and experimental shear stress values.b 3 replicates.c 95% confidence interval.d Student–Neuman–Keuls test at 5% level of significance for the same sample hammer mill screen size at various normal stresses (a, b and c); at the same normal stress for
different hammer mill screen sizes (D, E and F); at the same hammer mill screen size and normal stress for non-treated and steam exploded straw (X and Y).
Table 6Normal stress (σ), shear stress (τ), coefficient of internal friction (µ) and cohesion (C) of non-treated and steam exploded wheat grinds at 10% moisture content (wb).
a SSE — Sum Square of Errors for predicted and experimental shear stress values.b 3 replicates.c 95% confidence interval.d Student–Neuman–Keuls test at 5% level of significance for the same sample hammer mill screen size at various normal stresses (a, b and c); at the same normal stress for
different hammer mill screen sizes (D, E and F); at the same hammer mill screen size and normal stress for non-treated and steam exploded straw (X and Y).
239P. Adapa et al. / Powder Technology 201 (2010) 230–241
Author's personal copy
sizes of 3.2 mm and 1.6 mm at 9.8 kPa normal stress, which weresignificantly higher (Table 4). The result for canola straw has been incontrary to those observed for barley, oat and wheat straw. Therefore,it has been realized that the shear stress values could be a result of acombination of different factors. Table 1 depicts that the geometricmean particle sizes for steam exploded canola straw are significantlyhigher than non-treated straw; however, the increase in values atdifferent hammer mill screen sizes is lower than other straws.Therefore, it is anticipated that a combination of bulk density andgeometric mean particle diameter of the canola straw resulted ininsignificant differences in shear stress values. However, the coeffi-cient of internal friction was higher for steam exploded straw ascompared to non-treated straw.
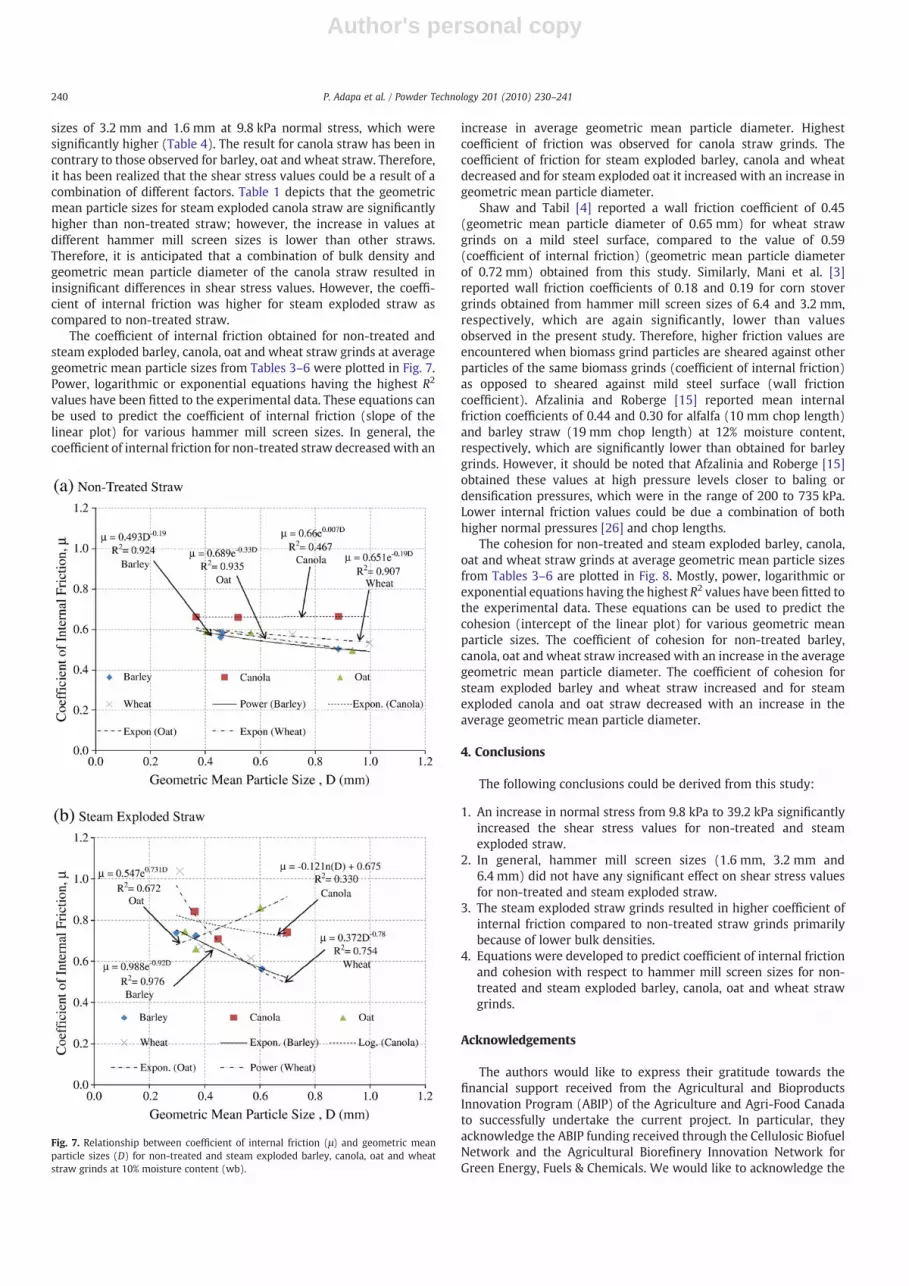
The coefficient of internal friction obtained for non-treated andsteam exploded barley, canola, oat and wheat straw grinds at averagegeometric mean particle sizes from Tables 3–6 were plotted in Fig. 7.Power, logarithmic or exponential equations having the highest R2
values have been fitted to the experimental data. These equations canbe used to predict the coefficient of internal friction (slope of thelinear plot) for various hammer mill screen sizes. In general, thecoefficient of internal friction for non-treated straw decreasedwith an
increase in average geometric mean particle diameter. Highestcoefficient of friction was observed for canola straw grinds. Thecoefficient of friction for steam exploded barley, canola and wheatdecreased and for steam exploded oat it increased with an increase ingeometric mean particle diameter.
Shaw and Tabil [4] reported a wall friction coefficient of 0.45(geometric mean particle diameter of 0.65 mm) for wheat strawgrinds on a mild steel surface, compared to the value of 0.59(coefficient of internal friction) (geometric mean particle diameterof 0.72 mm) obtained from this study. Similarly, Mani et al. [3]reported wall friction coefficients of 0.18 and 0.19 for corn stovergrinds obtained from hammer mill screen sizes of 6.4 and 3.2 mm,respectively, which are again significantly, lower than valuesobserved in the present study. Therefore, higher friction values areencountered when biomass grind particles are sheared against otherparticles of the same biomass grinds (coefficient of internal friction)as opposed to sheared against mild steel surface (wall frictioncoefficient). Afzalinia and Roberge [15] reported mean internalfriction coefficients of 0.44 and 0.30 for alfalfa (10 mm chop length)and barley straw (19 mm chop length) at 12% moisture content,respectively, which are significantly lower than obtained for barleygrinds. However, it should be noted that Afzalinia and Roberge [15]obtained these values at high pressure levels closer to baling ordensification pressures, which were in the range of 200 to 735 kPa.Lower internal friction values could be due a combination of bothhigher normal pressures [26] and chop lengths.
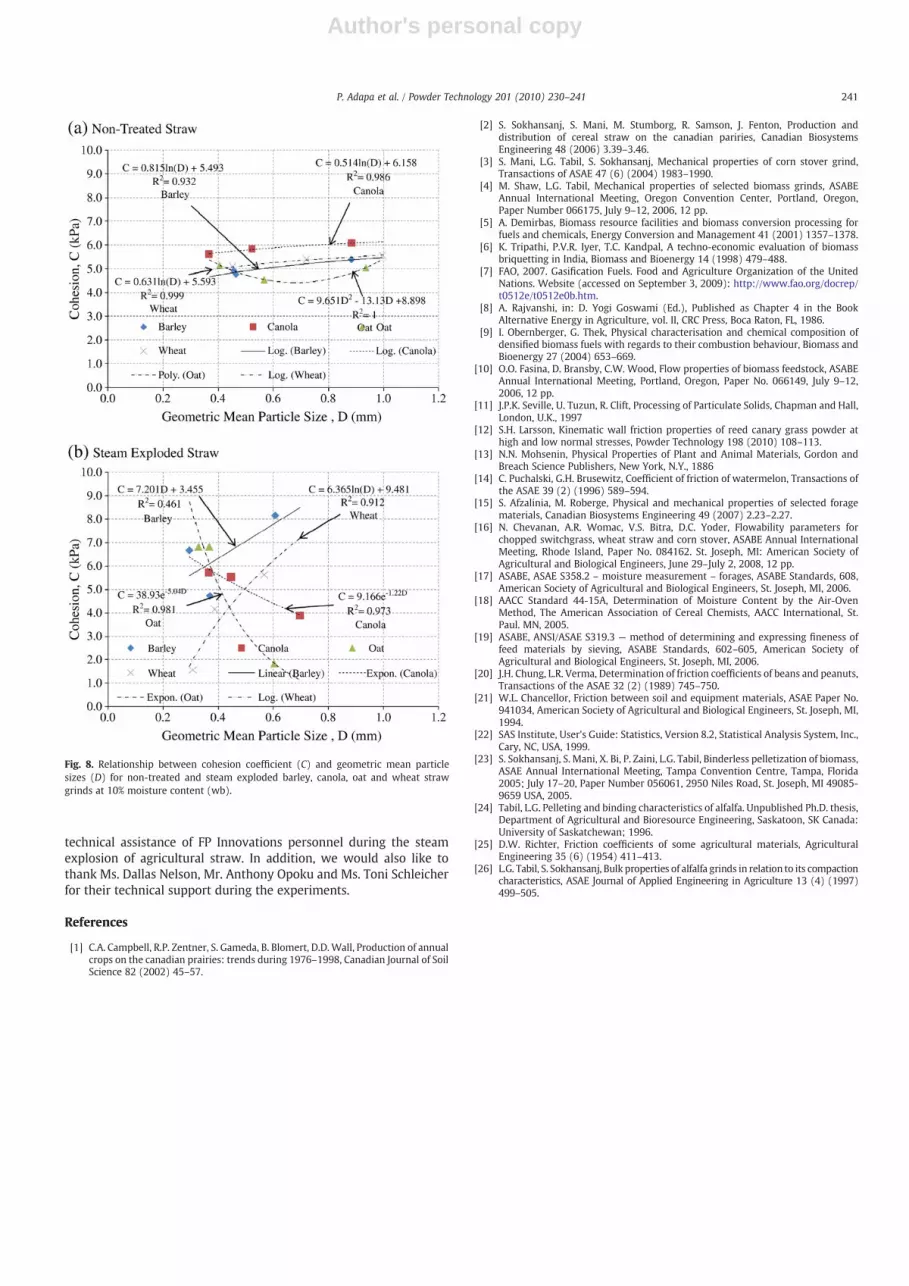
The cohesion for non-treated and steam exploded barley, canola,oat and wheat straw grinds at average geometric mean particle sizesfrom Tables 3–6 are plotted in Fig. 8. Mostly, power, logarithmic orexponential equations having the highest R2 values have been fitted tothe experimental data. These equations can be used to predict thecohesion (intercept of the linear plot) for various geometric meanparticle sizes. The coefficient of cohesion for non-treated barley,canola, oat and wheat straw increased with an increase in the averagegeometric mean particle diameter. The coefficient of cohesion forsteam exploded barley and wheat straw increased and for steamexploded canola and oat straw decreased with an increase in theaverage geometric mean particle diameter.
4. Conclusions
The following conclusions could be derived from this study:
1. An increase in normal stress from 9.8 kPa to 39.2 kPa significantlyincreased the shear stress values for non-treated and steamexploded straw.
2. In general, hammer mill screen sizes (1.6 mm, 3.2 mm and6.4 mm) did not have any significant effect on shear stress valuesfor non-treated and steam exploded straw.
3. The steam exploded straw grinds resulted in higher coefficient ofinternal friction compared to non-treated straw grinds primarilybecause of lower bulk densities.
4. Equations were developed to predict coefficient of internal frictionand cohesion with respect to hammer mill screen sizes for non-treated and steam exploded barley, canola, oat and wheat strawgrinds.
Acknowledgements
The authors would like to express their gratitude towards thefinancial support received from the Agricultural and BioproductsInnovation Program (ABIP) of the Agriculture and Agri-Food Canadato successfully undertake the current project. In particular, theyacknowledge the ABIP funding received through the Cellulosic BiofuelNetwork and the Agricultural Biorefinery Innovation Network forGreen Energy, Fuels & Chemicals. We would like to acknowledge the
Fig. 7. Relationship between coefficient of internal friction (μ) and geometric meanparticle sizes (D) for non-treated and steam exploded barley, canola, oat and wheatstraw grinds at 10% moisture content (wb).
240 P. Adapa et al. / Powder Technology 201 (2010) 230–241
Author's personal copy
technical assistance of FP Innovations personnel during the steamexplosion of agricultural straw. In addition, we would also like tothank Ms. Dallas Nelson, Mr. Anthony Opoku and Ms. Toni Schleicherfor their technical support during the experiments.
References
[1] C.A. Campbell, R.P. Zentner, S. Gameda, B. Blomert, D.D. Wall, Production of annualcrops on the canadian prairies: trends during 1976–1998, Canadian Journal of SoilScience 82 (2002) 45–57.
[2] S. Sokhansanj, S. Mani, M. Stumborg, R. Samson, J. Fenton, Production anddistribution of cereal straw on the canadian pariries, Canadian BiosystemsEngineering 48 (2006) 3.39–3.46.
[3] S. Mani, L.G. Tabil, S. Sokhansanj, Mechanical properties of corn stover grind,Transactions of ASAE 47 (6) (2004) 1983–1990.
[4] M. Shaw, L.G. Tabil, Mechanical properties of selected biomass grinds, ASABEAnnual International Meeting, Oregon Convention Center, Portland, Oregon,Paper Number 066175, July 9–12, 2006, 12 pp.
[5] A. Demirbas, Biomass resource facilities and biomass conversion processing forfuels and chemicals, Energy Conversion and Management 41 (2001) 1357–1378.
[6] K. Tripathi, P.V.R. Iyer, T.C. Kandpal, A techno-economic evaluation of biomassbriquetting in India, Biomass and Bioenergy 14 (1998) 479–488.
[7] FAO, 2007. Gasification Fuels. Food and Agriculture Organization of the UnitedNations. Website (accessed on September 3, 2009): http://www.fao.org/docrep/t0512e/t0512e0b.htm.
[8] A. Rajvanshi, in: D. Yogi Goswami (Ed.), Published as Chapter 4 in the BookAlternative Energy in Agriculture, vol. II, CRC Press, Boca Raton, FL, 1986.
[9] I. Obernberger, G. Thek, Physical characterisation and chemical composition ofdensified biomass fuels with regards to their combustion behaviour, Biomass andBioenergy 27 (2004) 653–669.
[10] O.O. Fasina, D. Bransby, C.W. Wood, Flow properties of biomass feedstock, ASABEAnnual International Meeting, Portland, Oregon, Paper No. 066149, July 9–12,2006, 12 pp.
[11] J.P.K. Seville, U. Tuzun, R. Clift, Processing of Particulate Solids, Chapman and Hall,London, U.K., 1997
[12] S.H. Larsson, Kinematic wall friction properties of reed canary grass powder athigh and low normal stresses, Powder Technology 198 (2010) 108–113.
[13] N.N. Mohsenin, Physical Properties of Plant and Animal Materials, Gordon andBreach Science Publishers, New York, N.Y., 1886
[14] C. Puchalski, G.H. Brusewitz, Coefficient of friction of watermelon, Transactions ofthe ASAE 39 (2) (1996) 589–594.
[15] S. Afzalinia, M. Roberge, Physical and mechanical properties of selected foragematerials, Canadian Biosystems Engineering 49 (2007) 2.23–2.27.
[16] N. Chevanan, A.R. Womac, V.S. Bitra, D.C. Yoder, Flowability parameters forchopped switchgrass, wheat straw and corn stover, ASABE Annual InternationalMeeting, Rhode Island, Paper No. 084162. St. Joseph, MI: American Society ofAgricultural and Biological Engineers, June 29–July 2, 2008, 12 pp.
[17] ASABE, ASAE S358.2 – moisture measurement – forages, ASABE Standards, 608,American Society of Agricultural and Biological Engineers, St. Joseph, MI, 2006.
[18] AACC Standard 44-15A, Determination of Moisture Content by the Air-OvenMethod, The American Association of Cereal Chemists, AACC International, St.Paul. MN, 2005.
[19] ASABE, ANSI/ASAE S319.3 — method of determining and expressing fineness offeed materials by sieving, ASABE Standards, 602–605, American Society ofAgricultural and Biological Engineers, St. Joseph, MI, 2006.
[20] J.H. Chung, L.R. Verma, Determination of friction coefficients of beans and peanuts,Transactions of the ASAE 32 (2) (1989) 745–750.
[21] W.L. Chancellor, Friction between soil and equipment materials, ASAE Paper No.941034, American Society of Agricultural and Biological Engineers, St. Joseph, MI,1994.
[22] SAS Institute, User's Guide: Statistics, Version 8.2, Statistical Analysis System, Inc.,Cary, NC, USA, 1999.
[23] S. Sokhansanj, S. Mani, X. Bi, P. Zaini, L.G. Tabil, Binderless pelletization of biomass,ASAE Annual International Meeting, Tampa Convention Centre, Tampa, Florida2005; July 17–20, Paper Number 056061, 2950 Niles Road, St. Joseph, MI 49085-9659 USA, 2005.
[24] Tabil, L.G. Pelleting and binding characteristics of alfalfa. Unpublished Ph.D. thesis,Department of Agricultural and Bioresource Engineering, Saskatoon, SK Canada:University of Saskatchewan; 1996.
[25] D.W. Richter, Friction coefficients of some agricultural materials, AgriculturalEngineering 35 (6) (1954) 411–413.
[26] L.G. Tabil, S. Sokhansanj, Bulk properties of alfalfa grinds in relation to its compactioncharacteristics, ASAE Journal of Applied Engineering in Agriculture 13 (4) (1997)499–505.
Fig. 8. Relationship between cohesion coefficient (C) and geometric mean particlesizes (D) for non-treated and steam exploded barley, canola, oat and wheat strawgrinds at 10% moisture content (wb).
241P. Adapa et al. / Powder Technology 201 (2010) 230–241