Original article Improvement of Chemlali olive oil oxidative stability by blending with Che ´ toui and Rekhami cultivars Manel Issaoui, 1 Guido Flamini, 2 Kaouther Ben Hassine, 1 Hechmi Chehab, 3 Faten Brahmi 1 & Mohamed Hammami 1 * 1 Laboratory of Biochemistry, UR ‘Human Nutrition and Metabolic Disorder’ Faculty of Medicine of Monastir, University of Monastir, Monastir 5019, Tunisia 2 Dipartimento di Chimica Bioorganica e Biofarmacia, Universita` di Pisa, via Bonanno 33, Pisa 56126, Italy 3 Institute of Olivier of Sousse, Sousse, Tunisia (Received 16 December 2008; Accepted in revised from 17 March 2009) Summary In order to improve the quality of Chemlali olive oil, characterised by a very low stability (2.09 h), blending with two different monovarietal oils in various proportions: Che´toui and Rekhami (known by their higher stability 7.79 and 13.99 h, respectively) was carried out. Results showed that blended oils had an improved oil composition compared to that of Chemlali. In fact, the highest percentage of Che ´toui and Rekhami olive oils (90% of blending) can reduce the acidity up to 68.79% and 79.61%, respectively. At 50% blending, oleic acid increased from 53% to 59.54%, while palmitic acid decreased from 20.97% to 14.89% with Che´toui olive oil. At the lowest percentage (10–20%), chlorophylls in Chemlali olive oil underwent significant increase (from 0.18 to 0.47 and 0.65 mg kg )1 , respectively). The amount of carotenoids was higher when Chemlali was blended by 20–40% with Che´toui olive oil (from 2.23 to 4.13 and 4.33 mg kg )1 ). Blending can be used in industrial applications to provide oils with improved composition related to stability, nutrition and functionality and endowed with the characteristics requested by consumers’ preferences. Keywords Aroma compounds, blending, Chemlali olive oil, colour, oxidative stability. Introduction In Tunisia, the second VOO exporter and producer after the European Union (Haddada et al., 2007), the two main cultivars are Chemlali and Che´toui. Che´toui, the second main variety cultivated in Tunisia is widespread in the north of the country, occurring in plains as well in mountain regions, and shows a high capacity of adap- tation to various pedo-climatic conditions (Ben Temime et al., 2006). In addition, this oil has a very balanced fatty acid profile and an important amount of phenols, which make it quite astringent. This latter characteristic is not accepted by the majority of consumers, especially by kids. Chemlali variety, which is mainly cultivated in the central and southern areas of the country, contrib- utes to 80% of the national olive oil production. It is a productive variety, well adapted to severe environmental conditions. However, its oil is characterised by relatively low levels of oleic acid (53–60%), high levels of palmitic and linoleic acids, presents a high acidity and a low amount of phenols (Baccouri et al., 2007). These unde- sirable characteristics make it often rejected by consum- ers. Therefore, these disadvantages could have considerably limited the possibilities of exporting of the Tunisian olive oil production, especially in the presence of a very competitive international market that demands high quality. Hence, the improvement of the oil quality by blending could be a tool to provide a product with balanced fatty acid composition, low acidity, optimal levels of antioxidants compounds and a good flavour and taste. The main goal of this work was to characterise Chemlali olive oils before and after blending with the oil obtained from two varieties known for their high quality (Che´toui and Rekhami). In order to improve the quality of the Chemlali olive oils, acidity, fatty acid composition, phenols, sensory proprieties, oxidative stability and volatiles were attested at different percentage of blending with these two varieties and also for Chemlali and Rekhami. Materials and methods Olive samples Olive fruits were hand picked, in triplicate, in perfect sanitary conditions. Before extraction of oils, fruits were exposed to the morphological studies. *Correspondent: Fax: +216 73 460 737; e-mail: [email protected]International Journal of Food Science and Technology 2009, 44, 1323–1332 1323 doi:10.1111/j.1365-2621.2009.01961.x Ó 2009 The Authors. Journal compilation Ó 2009 Institute of Food Science and Technology
Transcript
Original article
Improvement of Chemlali olive oil oxidative stability by blending
In Tunisia, the second VOO exporter and producer afterthe European Union (Haddada et al., 2007), the twomain cultivars are Chemlali and Chetoui. Chetoui, thesecond main variety cultivated in Tunisia is widespreadin the north of the country, occurring in plains as well inmountain regions, and shows a high capacity of adap-tation to various pedo-climatic conditions (Ben Temimeet al., 2006). In addition, this oil has a very balancedfatty acid profile and an important amount of phenols,which make it quite astringent. This latter characteristicis not accepted by the majority of consumers, especiallyby kids. Chemlali variety, which is mainly cultivated inthe central and southern areas of the country, contrib-utes to 80% of the national olive oil production. It is aproductive variety, well adapted to severe environmentalconditions. However, its oil is characterised by relativelylow levels of oleic acid (53–60%), high levels of palmiticand linoleic acids, presents a high acidity and a lowamount of phenols (Baccouri et al., 2007). These unde-sirable characteristics make it often rejected by consum-
ers. Therefore, these disadvantages could haveconsiderably limited the possibilities of exporting ofthe Tunisian olive oil production, especially in thepresence of a very competitive international market thatdemands high quality. Hence, the improvement of theoil quality by blending could be a tool to provide aproduct with balanced fatty acid composition, lowacidity, optimal levels of antioxidants compounds anda good flavour and taste. The main goal of this workwas to characterise Chemlali olive oils before and afterblending with the oil obtained from two varieties knownfor their high quality (Chetoui and Rekhami). In order toimprove the quality of the Chemlali olive oils, acidity,fatty acid composition, phenols, sensory proprieties,oxidative stability and volatiles were attested at differentpercentage of blending with these two varieties and alsofor Chemlali and Rekhami.
Materials and methods
Olive samples
Olive fruits were hand picked, in triplicate, in perfectsanitary conditions. Before extraction of oils, fruits wereexposed to the morphological studies.
International Journal of Food Science and Technology 2009, 44, 1323–1332 1323
doi:10.1111/j.1365-2621.2009.01961.x
� 2009 The Authors. Journal compilation � 2009 Institute of Food Science and Technology
Oil samples
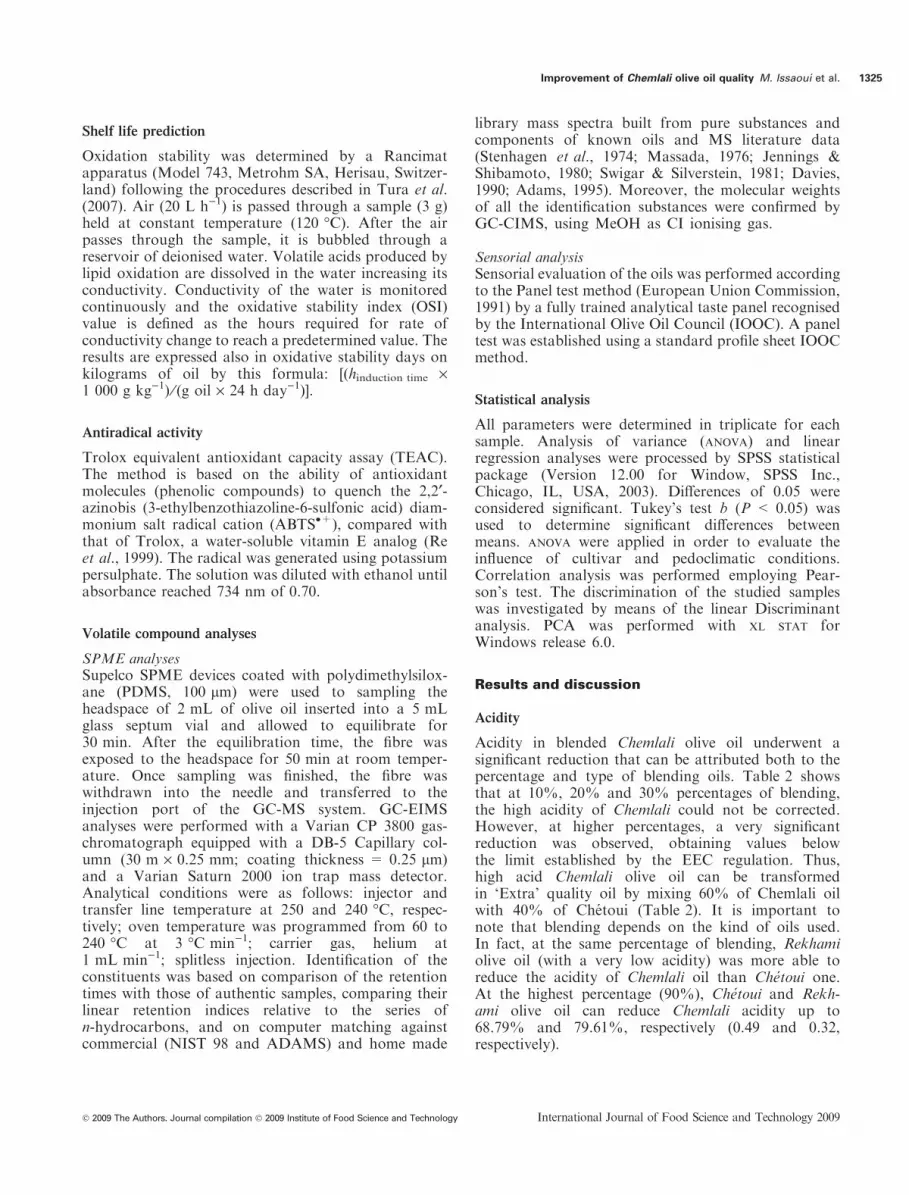
The study was carried out on monovarietal VOOs fromthree Tunisian cultivars (Cvs. Chemlali, Chetoui andRekhami). Oil content, expressed as a percentage of dryweight, was determined by extracting dry material with68 �C n-hexane using a Soxhlet apparatus (Chemlali:31.70%, Chetoui: 50.9% and Rekhami: 35%). All the oilsamples were extracted in a laboratory plant, using thefollowing procedure: fruits, after leaves removal, werewashed and then crushed with a stainless steel hammermill. The olive paste was malaxed for 30 min at 30 �Cand submitted to centrifugation. The resulting liquidphase was put into a cylinder and allowed to decant for30 min before removing of the solid remains. The upperoil layer was further centrifuged for 5 min at 3 000 rpm.The extraction procedure was carried three times.Blending Chemlali olive oil were prepared by mixingoils (Table 1) of two different cultivars (Chetoui orRekhami) with Chemlali olive oil at different percentages(from 10% to 90%). Each blending samples wasprepared twice.
Chemicals and reagents
ABTS•+method: 2,2¢-azinobis-(3-ethylbensothiazoline)-6-sulfonic acid (ABTS), potassium peroxodisulphate(K2S2O8) and the standard antioxidant used 6-hydro-xy-2,5,7,8-tetramethyl-chroman-2-carboxylic acid andthe Folin-Ciocalteu reagent were all purchased fromSigma-Aldrich Chemie GmbH (Taufkirchen, Germany).Methanol, ethanol, diethyl ether, tetrachloride, andn-hexane were provided by Merck (Darmstadt,
Germany). Bidistilled deionised water was used and allthe reagents were of suitable analytic purity.
Acidity
To determine the acidity, 5 g of oil were added to 60 mLof ethyl alcohol diethyl ether (1:1 v ⁄v) mixture andneutralised with 0.1 n NaOH. Data obtained wereexpressed as g of oleic acid per 100 g of oil (EEC Reg.2568, 1991).
Fatty acid composition
Fatty acid methyl esters (FAMEs) from the oil sampleswere carried as described by Issaoui et al. (2008). Individ-ual FAMEs were separated and quantified by gas chro-matography using a model 5 890 series II instrument(Hewelett-Packard, PaloAlto,CA,USA) equippedwith aflame ionisation detector, and a fused silica capillarycolumnHP-INNOWAX(30 mlength · 0.25 mmi.d.and0.25 lm of film thickness). Iodine values were calculatedfrom fatty acid percentages using the formula of Torres &Maestri (2006). Oxidative susceptibility of the oils wasestimated according to Cert et al. (1996).
Carotenoids and chlorophylls
Carotenoids and chlorophylls were determined accord-ing the procedure of Wolf (1968). This method is basedon the absorbance measurement at 610, 630 and 670 nmusing carbon tetrachloride as a control and the contentof chlorophylls is expressed as mg kg)1 oil.
Phenols and o-diphenols
Total phenols were extracted following the methodproposed by Montedoro et al. (1992). Ten grams of oliveoil were put into a test tube and 0.2 mL of Tween 20(Merck) and 10 mL of methanol:water mixture(80:20 v ⁄v) added. The sample was then homogenisedwith an Ultra-Turrax T25 macerator for 1 min, and thencentrifuged at 5000 · g for 10 minat 20 �C.Themethanolextract was collected with a pipette and transferred to a50 mL flask. The same procedure was repeated twice. Theextractswere then assembled, added toanhydrous sodiumsulphate and put in a freezer for 6 h. Finally, the samplewas filtered through Whatman filter paper and 1 mLtaken for analysis. The phenol and o-diphenols contentswere determined spectrophotometrically at 765 and500 nm, respectively and the concentrationwas expressedas milligrams of hydroxytyrosol per kilograms of oil.
Evaluation of the intensity of bitterness
Evaluation of the intensity of bitterness was carried withthe procedure described by Beltran et al. (2007).
Table 1 Sample code of blending oils between Chemlali · Chetoui and
Chemlali · Rekhami
Sample Code
Chemlali 100% 1
Chemlali 90% + Chetoui 10% 2
Chemlali 80% + Chetoui 20% 3
Chemlali 70% + Chetoui 30% 4
Chemlali 60% + Chetoui 40% 5
Chemlali 50% + Chetoui 50% 6
Chemlali 40% + Chetoui 60% 7
Chemlali 30% + Chetoui 70% 8
Chemlali 20% + Chetoui 80% 9
Chemlali 10% + Chetoui 90% 10
Chetoui 100% 11
Chemlali 90% + Rekhami 10% 12
Chemlali 80% + Rekhami 20% 13
Chemlali 70% + Rekhami 30% 14
Chemlali 60% + Rekhami 40% 15
Chemlali 50% + Rekhami 50% 16
Chemlali 10% + Rekhami 90% 17
Rekhami 100% 18
Improvement of Chemlali olive oil quality M. Issaoui et al.1324
International Journal of Food Science and Technology 2009 � 2009 The Authors. Journal compilation � 2009 Institute of Food Science and Technology
Shelf life prediction
Oxidation stability was determined by a Rancimatapparatus (Model 743, Metrohm SA, Herisau, Switzer-land) following the procedures described in Tura et al.(2007). Air (20 L h)1) is passed through a sample (3 g)held at constant temperature (120 �C). After the airpasses through the sample, it is bubbled through areservoir of deionised water. Volatile acids produced bylipid oxidation are dissolved in the water increasing itsconductivity. Conductivity of the water is monitoredcontinuously and the oxidative stability index (OSI)value is defined as the hours required for rate ofconductivity change to reach a predetermined value. Theresults are expressed also in oxidative stability days onkilograms of oil by this formula: [(hinduction time ·1 000 g kg)1) ⁄ (g oil · 24 h day)1)].
Antiradical activity
Trolox equivalent antioxidant capacity assay (TEAC).The method is based on the ability of antioxidantmolecules (phenolic compounds) to quench the 2,2¢-azinobis (3-ethylbenzothiazoline-6-sulfonic acid) diam-monium salt radical cation (ABTS•+), compared withthat of Trolox, a water-soluble vitamin E analog (Reet al., 1999). The radical was generated using potassiumpersulphate. The solution was diluted with ethanol untilabsorbance reached 734 nm of 0.70.
Volatile compound analyses
SPME analysesSupelco SPME devices coated with polydimethylsilox-ane (PDMS, 100 lm) were used to sampling theheadspace of 2 mL of olive oil inserted into a 5 mLglass septum vial and allowed to equilibrate for30 min. After the equilibration time, the fibre wasexposed to the headspace for 50 min at room temper-ature. Once sampling was finished, the fibre waswithdrawn into the needle and transferred to theinjection port of the GC-MS system. GC-EIMSanalyses were performed with a Varian CP 3800 gas-chromatograph equipped with a DB-5 Capillary col-umn (30 m · 0.25 mm; coating thickness = 0.25 lm)and a Varian Saturn 2000 ion trap mass detector.Analytical conditions were as follows: injector andtransfer line temperature at 250 and 240 �C, respec-tively; oven temperature was programmed from 60 to240 �C at 3 �C min)1; carrier gas, helium at1 mL min)1; splitless injection. Identification of theconstituents was based on comparison of the retentiontimes with those of authentic samples, comparing theirlinear retention indices relative to the series ofn-hydrocarbons, and on computer matching againstcommercial (NIST 98 and ADAMS) and home made
library mass spectra built from pure substances andcomponents of known oils and MS literature data(Stenhagen et al., 1974; Massada, 1976; Jennings &Shibamoto, 1980; Swigar & Silverstein, 1981; Davies,1990; Adams, 1995). Moreover, the molecular weightsof all the identification substances were confirmed byGC-CIMS, using MeOH as CI ionising gas.
Sensorial analysisSensorial evaluation of the oils was performed accordingto the Panel test method (European Union Commission,1991) by a fully trained analytical taste panel recognisedby the International Olive Oil Council (IOOC). A paneltest was established using a standard profile sheet IOOCmethod.
Statistical analysis
All parameters were determined in triplicate for eachsample. Analysis of variance (anova) and linearregression analyses were processed by SPSS statisticalpackage (Version 12.00 for Window, SPSS Inc.,Chicago, IL, USA, 2003). Differences of 0.05 wereconsidered significant. Tukey’s test b (P < 0.05) wasused to determine significant differences betweenmeans. anova were applied in order to evaluate theinfluence of cultivar and pedoclimatic conditions.Correlation analysis was performed employing Pear-son’s test. The discrimination of the studied sampleswas investigated by means of the linear Discriminantanalysis. PCA was performed with xl stat forWindows release 6.0.
Results and discussion
Acidity
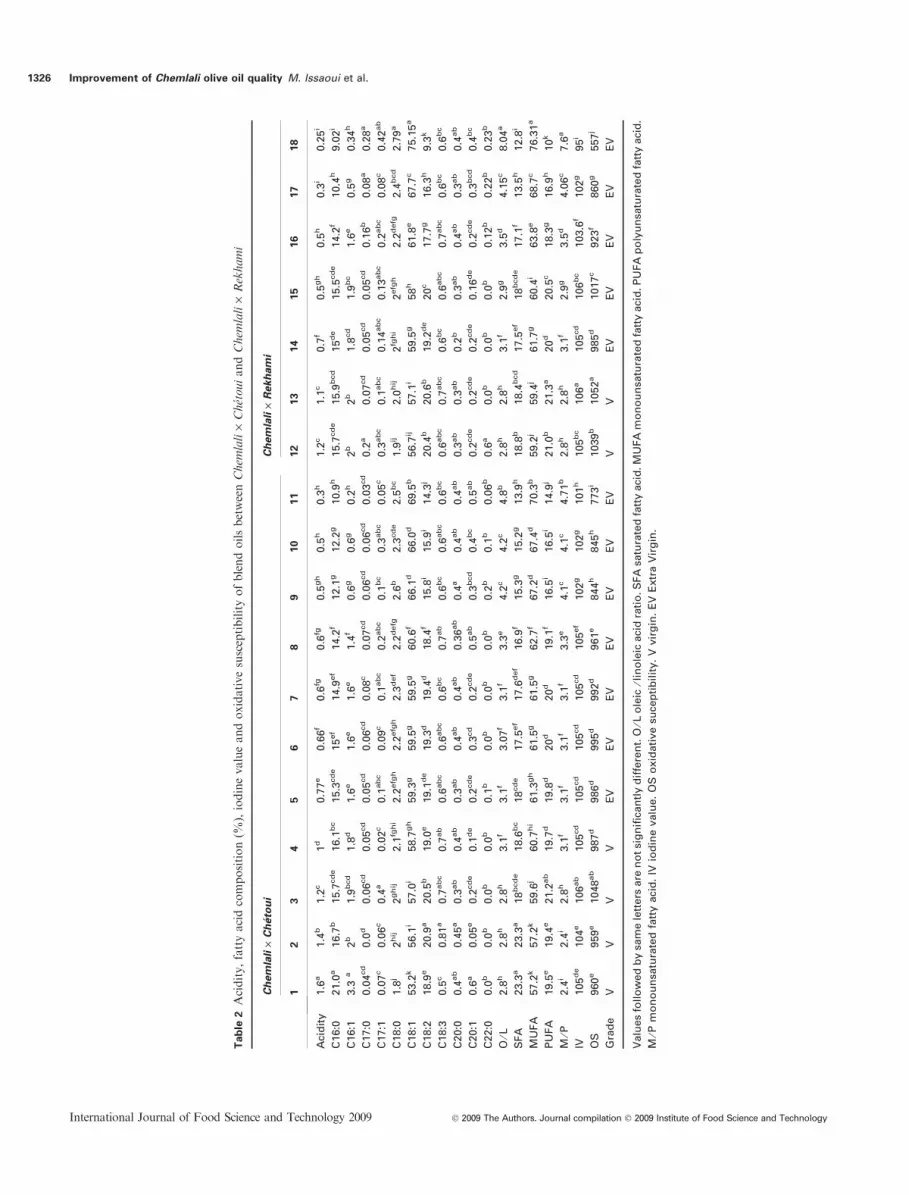
Acidity in blended Chemlali olive oil underwent asignificant reduction that can be attributed both to thepercentage and type of blending oils. Table 2 showsthat at 10%, 20% and 30% percentages of blending,the high acidity of Chemlali could not be corrected.However, at higher percentages, a very significantreduction was observed, obtaining values belowthe limit established by the EEC regulation. Thus,high acid Chemlali olive oil can be transformedin ‘Extra’ quality oil by mixing 60% of Chemlali oilwith 40% of Chetoui (Table 2). It is important tonote that blending depends on the kind of oils used.In fact, at the same percentage of blending, Rekhamiolive oil (with a very low acidity) was more able toreduce the acidity of Chemlali oil than Chetoui one.At the highest percentage (90%), Chetoui and Rekh-ami olive oil can reduce Chemlali acidity up to68.79% and 79.61%, respectively (0.49 and 0.32,respectively).
Improvement of Chemlali olive oil quality M. Issaoui et al. 1325
� 2009 The Authors. Journal compilation � 2009 Institute of Food Science and Technology International Journal of Food Science and Technology 2009
Improvement of Chemlali olive oil quality M. Issaoui et al.1326
International Journal of Food Science and Technology 2009 � 2009 The Authors. Journal compilation � 2009 Institute of Food Science and Technology
Fatty acid composition
A peculiarity of olive oil is the high level of oleic acid, aMUFA (18:1 n-9), which ranges from 54% to 84% oftotal fatty acids, while linoleic acid (18:2 n-6), the majoressential fatty acid and the most abundant PUFA, ispresent in concentration between 3% and 21% (Visioliet al., 2002). However, as reported in previous studies(Baccouri et al., 2007), Chemlali olive oil (especiallyChemlali Sfax) exhibited a lower oleic acid percentage(53%) and a higher level of palmitic and linoleic acids(20% and 18%, respectively). This study showed thatblending could correct this problem (Table 2). Thus, 10%blending with Chetoui and Rekhami olive oils can moveChemlali olive oil from ‘Out’ the limit to ‘Within’ the EECregulation (from 53% to 56%). At 50% blending withChetoui olive oil, oleic acid increased from 53% to59.54%, and palmitic acid decreased from 20.97% to14.89%. Using Rekhami olive oil, oleic acid underwent asignificant increase to 61.80% and a decrease of palmiticacid to 14.19%. At the highest percentage of blending(90%), oleic acid underwent an important increase, to66.02% and 67.74%, respectively with Chetoui andRekhami olive oils. In contrast, palmitic acid exhibits asharp decrease to 12.23% and 10.38%, respectively. Insummary, the blended oil samples showed an improvedfatty acid composition, characterised by an increasing inoleic acid content and a decreasing in the palmitic andlinoleic levels with respect to those of pure Chemlali oil.Also the fatty acid distribution became within the rangeexpected for high quality olive oils. TheMUFA content isvery important because of their nutritional implicationand effect on oxidative stability of the oils. Besides theirpositive role on the shelf life of the fats, it has beenrecently postulated that oils with high MUFA levelscorrelated with a bitter taste (Garcıa-Mesa et al., 2008).The unsaturated ⁄ saturated acid ratio influences theorganoleptic characteristics of the oil. It has beenobserved that oils with a high content of SFA are moreviscous and persistent on the mucous of the oral cavity.This gives rise to the defect known as ‘fatty sensation’(Solinas, 1990). The blended oils exhibited a significantincrease of MUFA at the different proportions of mixingoils (from 20% to 90% of blending); in contrast the SFAshowed a decrease (Table 2). Besides the ratio MUFA ⁄ -PUFA, also the oleic to linoleic acid ratio (O ⁄L) is a veryimportant indicator parameter for the quality andstability of olive oils. Results showed that, at 50%blending, the O ⁄L ratio of the blends Chemlali olive oilincreased from 2.80 to 3.07 and 3.50 with Chetoui andRekhami olive oils, respectively.
Pigments
Chemlali olive oil has very low amounts of pigments(0.18 and 2.23 mg kg)1 of chlorophylls and carotenoids,
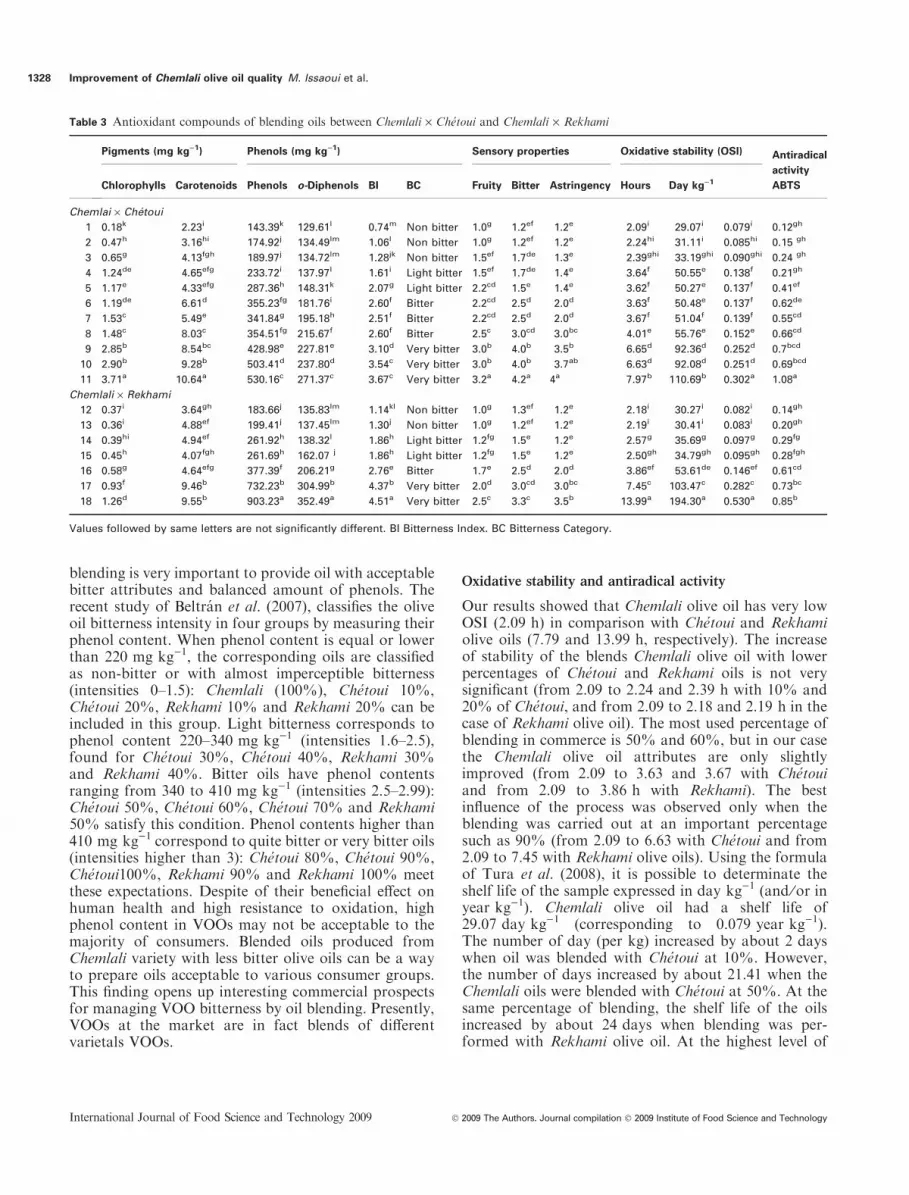
respectively). In contrast, pigments in Chetoui olive oilwere 20 and 5 fold more abundant than in Chemlaliolive oil (chlorophylls and carotenoids, respectively).Thus, Chetoui oil has a deeper intensity of colour thanChemlali one (Table 3). Hence, in order to improveChemlali olive oil colour, different mixing percentagesbetween Chetoui and Chemlali were tested (Table 3). Atthe lower percentages (10–20%), chlorophylls in Cheml-ali olive oil underwent an increase of about 4-fold.Similarly, at 60% of blending Chetoui can improve theamount of pigments in Chemlali oils from 0.18 to1.48 mg kg)1 (�9-fold). The amount of carotenoids was2-fold more important when Chemlali olive oil wasblended with 20–40% of Chetoui one. The production ofhighly pigmented oils should be of considerable interestfor the industry.
Phenols and bitterness
The low phenol content (<150 mg kg)1) of Chemlaliolive oil, experienced a significant increase when Chetouiand Rekhami olive oils were added (Table 3). Theamount of phenols slowly increased with the percentageof blending. At 10% of blending, the amount of phenolsincreased from 143.39 to 174.92 and 183.66 mg kg)1
with Chetoui and Rekhami olive oils, respectively. At50%, 60% and 70%, the amount of phenols increasedsignificantly in comparison to the initial amount. How-ever, from a statistical point of view, there were nosignificant differences among the three values (355.23,341.84 and 354.51 for Chetoui olive oils at 50%, 60%and 70%). It is also remarkable that Rekhami olive oil isthe best one for phenols fortification in Chemlali oliveoil. Besides their important role in the stability of theoils, o-diphenols are usually correlated with the bittertaste. An excessive presence may lead to the rejection ofthe oil by consumers accustomed to the milder taste ofrefined oils, mainly in important markets such as Japan,Canada, USA, Australia, China or Northern Europeancountries (Garcia et al., 2005). Nevertheless, theiravailability could mean many different blending possi-bilities with other VOOs to obtain products withbalanced taste and good nutritional properties. Becauseof its high level of o-diphenols, Chetoui olive oil is verybitter. In contrast, Chemlali olive oil was sweeter. Bittertaste is one of the characteristic attributes of VOO. Itsintensity varies greatly and influences consumer attrac-tion and acceptance; a high intensity might be refused bysome consumers (Beltran et al., 2007). Our resultsshowed that Chemlali olive oil has an almost impercep-tible bitterness, which may be explained by its lowphenols content. In contrast, Chetoui and Rekhami oliveoils have quite bitter attributes. From a commercialpoint of view, the studied oils had the inconvenience tobe not bitter or too bitter, characteristics which are notaccepted by the majority of the consumers. Thus
Improvement of Chemlali olive oil quality M. Issaoui et al. 1327
� 2009 The Authors. Journal compilation � 2009 Institute of Food Science and Technology International Journal of Food Science and Technology 2009
blending is very important to provide oil with acceptablebitter attributes and balanced amount of phenols. Therecent study of Beltran et al. (2007), classifies the oliveoil bitterness intensity in four groups by measuring theirphenol content. When phenol content is equal or lowerthan 220 mg kg)1, the corresponding oils are classifiedas non-bitter or with almost imperceptible bitterness(intensities 0–1.5): Chemlali (100%), Chetoui 10%,Chetoui 20%, Rekhami 10% and Rekhami 20% can beincluded in this group. Light bitterness corresponds tophenol content 220–340 mg kg)1 (intensities 1.6–2.5),found for Chetoui 30%, Chetoui 40%, Rekhami 30%and Rekhami 40%. Bitter oils have phenol contentsranging from 340 to 410 mg kg)1 (intensities 2.5–2.99):Chetoui 50%, Chetoui 60%, Chetoui 70% and Rekhami50% satisfy this condition. Phenol contents higher than410 mg kg)1 correspond to quite bitter or very bitter oils(intensities higher than 3): Chetoui 80%, Chetoui 90%,Chetoui100%, Rekhami 90% and Rekhami 100% meetthese expectations. Despite of their beneficial effect onhuman health and high resistance to oxidation, highphenol content in VOOs may not be acceptable to themajority of consumers. Blended oils produced fromChemlali variety with less bitter olive oils can be a wayto prepare oils acceptable to various consumer groups.This finding opens up interesting commercial prospectsfor managing VOO bitterness by oil blending. Presently,VOOs at the market are in fact blends of differentvarietals VOOs.
Oxidative stability and antiradical activity
Our results showed that Chemlali olive oil has very lowOSI (2.09 h) in comparison with Chetoui and Rekhamiolive oils (7.79 and 13.99 h, respectively). The increaseof stability of the blends Chemlali olive oil with lowerpercentages of Chetoui and Rekhami oils is not verysignificant (from 2.09 to 2.24 and 2.39 h with 10% and20% of Chetoui, and from 2.09 to 2.18 and 2.19 h in thecase of Rekhami olive oil). The most used percentage ofblending in commerce is 50% and 60%, but in our casethe Chemlali olive oil attributes are only slightlyimproved (from 2.09 to 3.63 and 3.67 with Chetouiand from 2.09 to 3.86 h with Rekhami). The bestinfluence of the process was observed only when theblending was carried out at an important percentagesuch as 90% (from 2.09 to 6.63 with Chetoui and from2.09 to 7.45 with Rekhami olive oils). Using the formulaof Tura et al. (2008), it is possible to determinate theshelf life of the sample expressed in day kg)1 (and ⁄or inyear kg)1). Chemlali olive oil had a shelf life of29.07 day kg)1 (corresponding to 0.079 year kg)1).The number of day (per kg) increased by about 2 dayswhen oil was blended with Chetoui at 10%. However,the number of days increased by about 21.41 when theChemlali oils were blended with Chetoui at 50%. At thesame percentage of blending, the shelf life of the oilsincreased by about 24 days when blending was per-formed with Rekhami olive oil. At the highest level of
Table 3 Antioxidant compounds of blending oils between Chemlali · Chetoui and Chemlali · Rekhami
Values followed by same letters are not significantly different. BI Bitterness Index. BC Bitterness Category.
Improvement of Chemlali olive oil quality M. Issaoui et al.1328
International Journal of Food Science and Technology 2009 � 2009 The Authors. Journal compilation � 2009 Institute of Food Science and Technology
blending, the oxidative stability of Chemlali oils under-went an important increase, from 29.07 to 92.36 and103.47 day kg)1, respectively with Chetoui and Rekhamioils. These results (Table 3) showed that the blendingprocess could increase the antiradical activity of Cheml-ali olive oil by the transfer of antioxidant compoundssuch as phenols, pigments, O ⁄L and some aromaticcompounds. The capacity to quench radicals is alsoother peculiarity that can make olive oil an importanthealthy and nutritional product of the Mediterraneandiet. Our results showed that Chetoui olive oil had thehighest antiradical capacity (1.08 mm) however Chemlaliexhibit the lowest capacity to quench radicals (0.12 mm).Blending with Chetoui can improve the lower ability ofChemlali olive oil to scavenge radicals generated(Table 3).
Aroma compounds
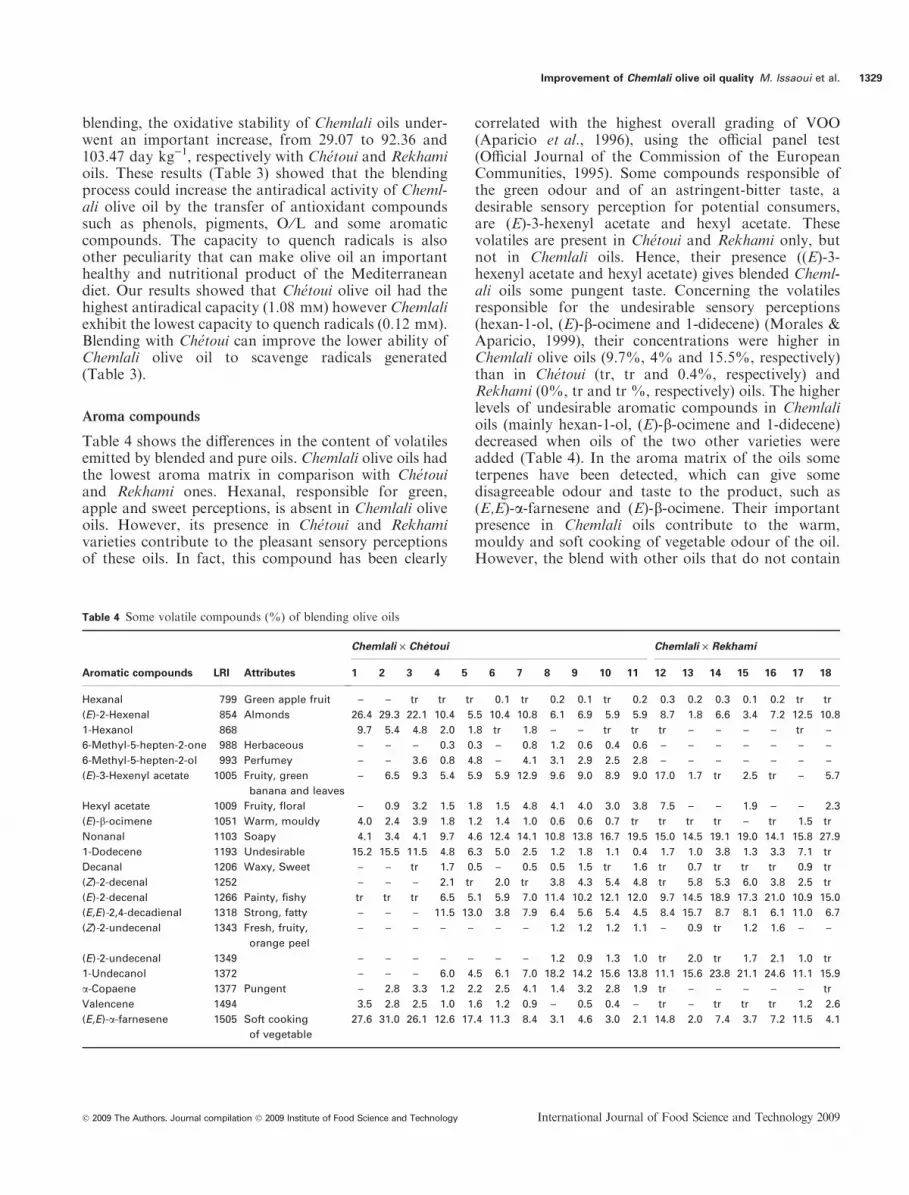
Table 4 shows the differences in the content of volatilesemitted by blended and pure oils. Chemlali olive oils hadthe lowest aroma matrix in comparison with Chetouiand Rekhami ones. Hexanal, responsible for green,apple and sweet perceptions, is absent in Chemlali oliveoils. However, its presence in Chetoui and Rekhamivarieties contribute to the pleasant sensory perceptionsof these oils. In fact, this compound has been clearly
correlated with the highest overall grading of VOO(Aparicio et al., 1996), using the official panel test(Official Journal of the Commission of the EuropeanCommunities, 1995). Some compounds responsible ofthe green odour and of an astringent-bitter taste, adesirable sensory perception for potential consumers,are (E)-3-hexenyl acetate and hexyl acetate. Thesevolatiles are present in Chetoui and Rekhami only, butnot in Chemlali oils. Hence, their presence ((E)-3-hexenyl acetate and hexyl acetate) gives blended Cheml-ali oils some pungent taste. Concerning the volatilesresponsible for the undesirable sensory perceptions(hexan-1-ol, (E)-b-ocimene and 1-didecene) (Morales &Aparicio, 1999), their concentrations were higher inChemlali olive oils (9.7%, 4% and 15.5%, respectively)than in Chetoui (tr, tr and 0.4%, respectively) andRekhami (0%, tr and tr %, respectively) oils. The higherlevels of undesirable aromatic compounds in Chemlalioils (mainly hexan-1-ol, (E)-b-ocimene and 1-didecene)decreased when oils of the two other varieties wereadded (Table 4). In the aroma matrix of the oils someterpenes have been detected, which can give somedisagreeable odour and taste to the product, such as(E,E)-a-farnesene and (E)-b-ocimene. Their importantpresence in Chemlali oils contribute to the warm,mouldy and soft cooking of vegetable odour of the oil.However, the blend with other oils that do not contain
Table 4 Some volatile compounds (%) of blending olive oils
Aromatic compounds LRI Attributes
Chemlali · Chetoui Chemlali · Rekhami
1 2 3 4 5 6 7 8 9 10 11 12 13 14 15 16 17 18
Hexanal 799 Green apple fruit – – tr tr tr 0.1 tr 0.2 0.1 tr 0.2 0.3 0.2 0.3 0.1 0.2 tr tr
Improvement of Chemlali olive oil quality M. Issaoui et al. 1329
� 2009 The Authors. Journal compilation � 2009 Institute of Food Science and Technology International Journal of Food Science and Technology 2009
these two compounds can decrease their level in Cheml-ali oil blends.
Sensory attributes
The three monovarietal olive oils studied exhibitedvery different sensorial properties. According to the
Variables (F1 & F2 : 64.64%)
1 2
34
5
67 8
9 1011
12
13
14
15
16
17
1819
20
21
22
2324
25 2627
28
29
30
31
32
3334
35
36
37
38
39
40 4142
4344
45
46
47
48
49
50
51
52
–1
–0.5
0
0.5
1
–1 –0.5 0 0.5 1Factor 1 (47.74%)
Fac
tor
2 (1
6.90
%)
>
F1 & F2 : 64.64%
18
17
1615
1413
12
11109
8
7654
32
1
–15
–10
–5
0
5
10
15
–15 –10 –5 0 5 10 15– Factor 1 (47.74%) –>
– F
acto
r 2
(16.
90%
) --
>
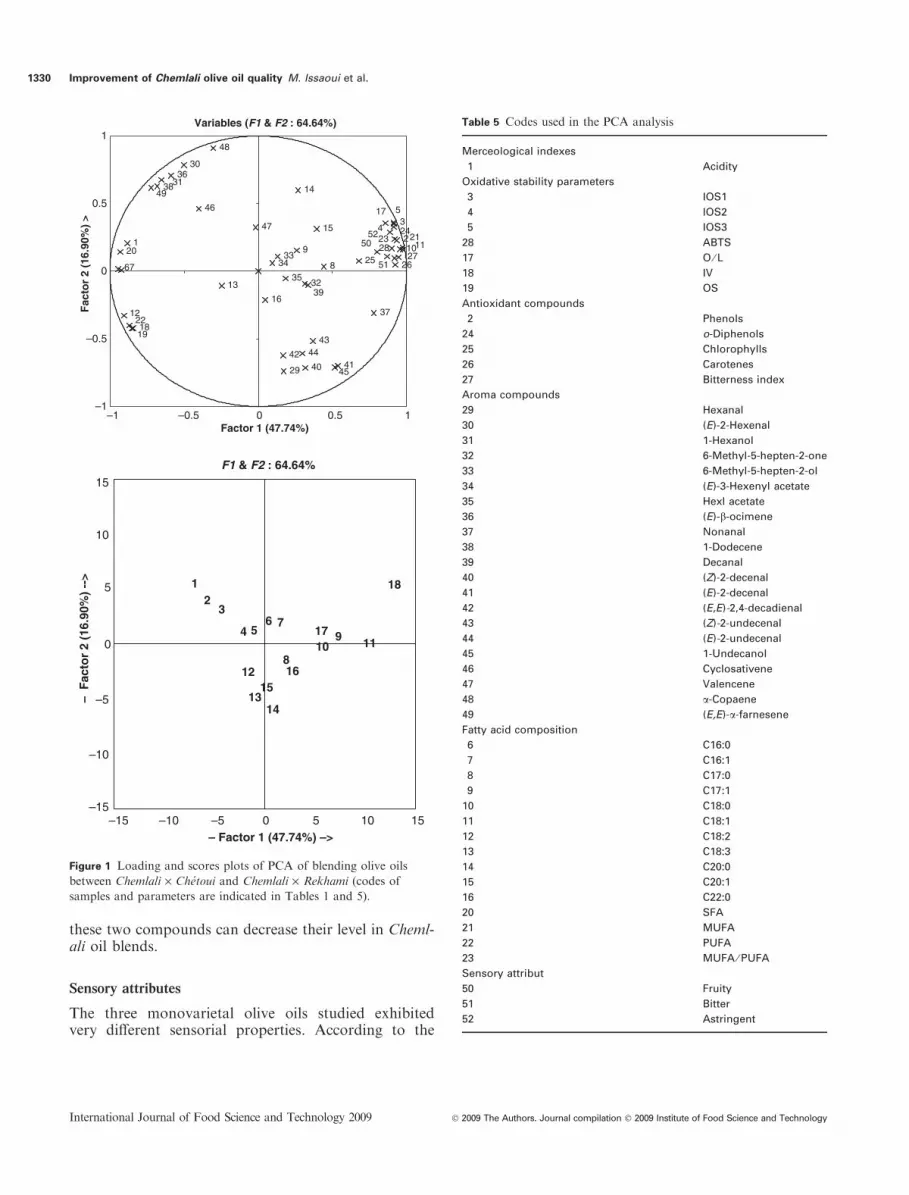
Figure 1 Loading and scores plots of PCA of blending olive oils
between Chemlali · Chetoui and Chemlali · Rekhami (codes of
samples and parameters are indicated in Tables 1 and 5).
Table 5 Codes used in the PCA analysis
Merceological indexes
1 Acidity
Oxidative stability parameters
3 IOS1
4 IOS2
5 IOS3
28 ABTS
17 O ⁄ L18 IV
19 OS
Antioxidant compounds
2 Phenols
24 o-Diphenols
25 Chlorophylls
26 Carotenes
27 Bitterness index
Aroma compounds
29 Hexanal
30 (E)-2-Hexenal
31 1-Hexanol
32 6-Methyl-5-hepten-2-one
33 6-Methyl-5-hepten-2-ol
34 (E)-3-Hexenyl acetate
35 Hexl acetate
36 (E)-b-ocimene
37 Nonanal
38 1-Dodecene
39 Decanal
40 (Z)-2-decenal
41 (E)-2-decenal
42 (E,E)-2,4-decadienal
43 (Z)-2-undecenal
44 (E)-2-undecenal
45 1-Undecanol
46 Cyclosativene
47 Valencene
48 a-Copaene
49 (E,E)-a-farnesene
Fatty acid composition
6 C16:0
7 C16:1
8 C17:0
9 C17:1
10 C18:0
11 C18:1
12 C18:2
13 C18:3
14 C20:0
15 C20:1
16 C22:0
20 SFA
21 MUFA
22 PUFA
23 MUFA ⁄ PUFA
Sensory attribut
50 Fruity
51 Bitter
52 Astringent
Improvement of Chemlali olive oil quality M. Issaoui et al.1330
International Journal of Food Science and Technology 2009 � 2009 The Authors. Journal compilation � 2009 Institute of Food Science and Technology
previous chemical test on these olive cultivars, sensorialprofiles of Chetoui olive oil were characterised by veryhigh intensities of olive bitterness with a clear pun-gency. In addition, the panel tests prove the highintensities of Chetoui olive oil fruitiness. In contrast,Chemlali olive oil was characterised by very lowintensities of olive fruitiness and bitterness with a lowpungency. Our result shows that mixing between oliveoils with high intensities of bitterness (Chetoui andRekhami oils) can improve the low intensities ofChemlali olive oil bitterness. However, it is noteworthythat many people dislike oils with high intensity ofbitterness such as kids and foreign consumers (non-traditional consumers such as Canadian, United States,Australian, South American and Japanese people). Infact, the present investigation can give an idea toindustrial to make a product with balanced antioxidantcomposition and sensorial attributes. Hence, the bestformula to obtain the equilibrated olive oil sample is50–50%.
Chemometrics
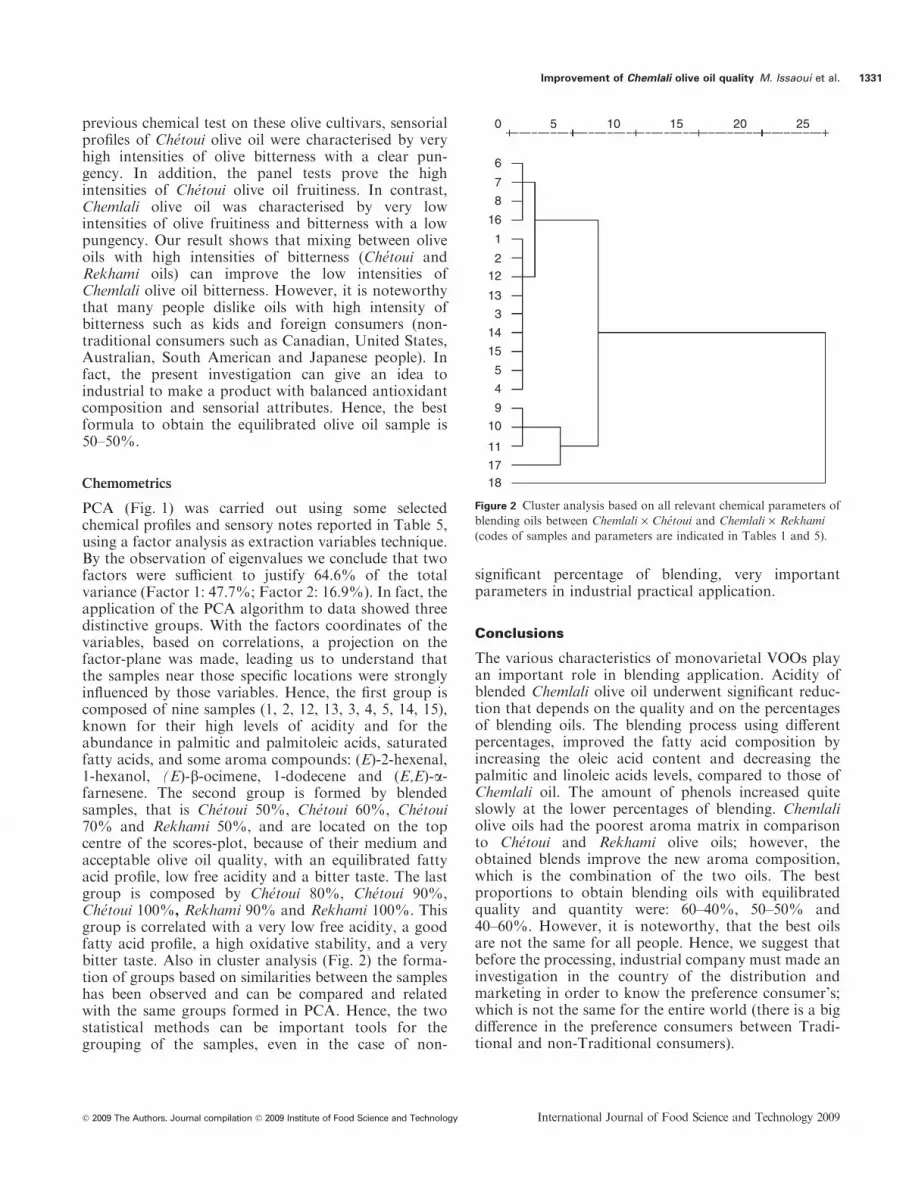
PCA (Fig. 1) was carried out using some selectedchemical profiles and sensory notes reported in Table 5,using a factor analysis as extraction variables technique.By the observation of eigenvalues we conclude that twofactors were sufficient to justify 64.6% of the totalvariance (Factor 1: 47.7%; Factor 2: 16.9%). In fact, theapplication of the PCA algorithm to data showed threedistinctive groups. With the factors coordinates of thevariables, based on correlations, a projection on thefactor-plane was made, leading us to understand thatthe samples near those specific locations were stronglyinfluenced by those variables. Hence, the first group iscomposed of nine samples (1, 2, 12, 13, 3, 4, 5, 14, 15),known for their high levels of acidity and for theabundance in palmitic and palmitoleic acids, saturatedfatty acids, and some aroma compounds: (E)-2-hexenal,1-hexanol, (E)-b-ocimene, 1-dodecene and (E,E)-a-farnesene. The second group is formed by blendedsamples, that is Chetoui 50%, Chetoui 60%, Chetoui70% and Rekhami 50%, and are located on the topcentre of the scores-plot, because of their medium andacceptable olive oil quality, with an equilibrated fattyacid profile, low free acidity and a bitter taste. The lastgroup is composed by Chetoui 80%, Chetoui 90%,Chetoui 100%, Rekhami 90% and Rekhami 100%. Thisgroup is correlated with a very low free acidity, a goodfatty acid profile, a high oxidative stability, and a verybitter taste. Also in cluster analysis (Fig. 2) the forma-tion of groups based on similarities between the sampleshas been observed and can be compared and relatedwith the same groups formed in PCA. Hence, the twostatistical methods can be important tools for thegrouping of the samples, even in the case of non-
significant percentage of blending, very importantparameters in industrial practical application.
Conclusions
The various characteristics of monovarietal VOOs playan important role in blending application. Acidity ofblended Chemlali olive oil underwent significant reduc-tion that depends on the quality and on the percentagesof blending oils. The blending process using differentpercentages, improved the fatty acid composition byincreasing the oleic acid content and decreasing thepalmitic and linoleic acids levels, compared to those ofChemlali oil. The amount of phenols increased quiteslowly at the lower percentages of blending. Chemlaliolive oils had the poorest aroma matrix in comparisonto Chetoui and Rekhami olive oils; however, theobtained blends improve the new aroma composition,which is the combination of the two oils. The bestproportions to obtain blending oils with equilibratedquality and quantity were: 60–40%, 50–50% and40–60%. However, it is noteworthy, that the best oilsare not the same for all people. Hence, we suggest thatbefore the processing, industrial company must made aninvestigation in the country of the distribution andmarketing in order to know the preference consumer’s;which is not the same for the entire world (there is a bigdifference in the preference consumers between Tradi-tional and non-Traditional consumers).
0
6
7
8
16
1
212
13
3
14
15
5
4
9
10
11
1718
5 10 15 20 25
Figure 2 Cluster analysis based on all relevant chemical parameters of
blending oils between Chemlali · Chetoui and Chemlali · Rekhami
(codes of samples and parameters are indicated in Tables 1 and 5).
Improvement of Chemlali olive oil quality M. Issaoui et al. 1331
� 2009 The Authors. Journal compilation � 2009 Institute of Food Science and Technology International Journal of Food Science and Technology 2009
Acknowledgments
This research was supported by the Tunisian Ministry ofScientific Research, Technology and CompetencyDevelopment (UR03ES08). Part of this work wascarried out at the Dipartimento di Chimica Bioorganicae Biofarmacia, Universita‘ di Pisa, Italy.
References
Adams, R.P. (1995). Identification of Essential Oil Components By GasChromatography-Mass Spectroscopy. USA: Allured Publ. corpCarol Stream.
Aparicio, R., Morales, M.T. & Alonso, V. (1996). Relationshipbetween volatile compounds and sensory attributes of olive oils bythe sensory wheel. Journal of Agricultural and Food Chemistry, 73,1253–1264.
Baccouri, B., Ben Temime, S., Taamalli, W., Daoud, D., M’Sallem, M.& Zarrouk, M. (2007). Analytical characteristics of virgin olive oilsfrom two new varieties obtained by controlled crossing on Meskivariety. Journal of Food Lipids, 14, 19–34.
Beltran, G., Ruano, M.T., Jimenez, A., Uceda, M. & Aguilera, M.P.(2007). Evaluation of virgin olive oil bitterness by total phenolcontent analysis. European Journal of Lipid Science and Technology,108, 193–197.
Ben Temime, S., Taamalli, W., Baccouri, B., Abaza, L., Daoud, D. &Zarrouk, M. (2006). Changes in olive oil quality of Chetoui varietyaccording to origin of plantation. Journal of Food Lipids, 13, 88–99.
Cert, A., Alba, J., Leon-Camacho, M., Moreda, W. & Perez-Camino,M.C. (1996). Effects of talc addition and operating mode on thequality and oxidative stability of virgin olive oils obtained bycentrifugation. Journal of Agricultural and Food Chemistry, 44,3930–3934.
Davies, N.W. (1990). Gas chromatographic retention indexes ofmonoterpenes and sesquiterpenes on methyl silicone and carbowax20M phases. Journal of Chromatography, 503, 1–24.
European Union Commission. (1991). Regulation EEC 2568 ⁄ 1991 onthe characteristics of olive oil and olive pomace and their analyticalmethods. Official Journal of European Communities, L248, 1–83.
Garcıa-Mesa, A., Pereira-Caro, G., Fernndez-Hernandez, A., Garcıa-Ortız Civantos, C. & Mateos, R. (2008). Influence of lipid matrix inthe bitterness perception of virgin olive oil. Food Quality andPreference, 19, 421–430.
Haddada, F.M., Manai, H., Daoud, D., Fernandez, X., Lizzani-Cuvelier, L. & Zarrouk, M. (2007). Profiles of volatiles compoundsfrom some monovarietal Tunisian virgin olive oils. Comparison withFrench PDO. Food Chemistry, 103, 467–476.
International Olive Oil Council (IOOC) (2000). T20 ⁄Doc., N. 15Rev.n.1.
Issaoui, M., Mechri, B., Echbili, A. et al. (2008). Chemometriccharacterization of five Tunisian varietals of Olea europaea L. olivefruit according to different maturation indices. Journal of FoodLipids, 15, 322–328.
Jennings, W. & Shibamoto, T. (1980). Qualitative Analysis of Flavorand Fragrance Volatiles by Glass Capillary Chromatography. NewYork: Academic Press.
Massada, Y. (1976). Analysis of Essential Oils by Gas Chromatographyand Mass Spectrometry. New York: Wiley and Sons.
Montedoro, G.F., Servili, M., Baldioli, M. & Miniati, E. (1992).Simple and hydrolyzable phenolic compounds in virgin olive oil. 1.Their extraction, separation, and quantitative and semiquantitativeevaluation by HPLC. Journal of the Agricultural and Food Chem-istry, 40, 1571–1576.
Morales, M.T. & Aparicio, R. (1999). Effect of extraction conditionson sensory quality of virgin olive oil. Journal of American OilChemists Society, 3, 295–300.
Official Journal of the Commission of the European Communities(1995). Regulation no. 1 656 ⁄ 95. March 28, Pp. 3–4.
Re, R., Pellegrini, N., Proteggente, A., Pannala, A., Yang, M. & Rice-Evans, C. (1999). Antioxidant activity applying an important ABTSradical cation decolorization assay. Free Radical Biology andMedicine, 26, 1231–1237.
Solinas, M. (1990). Olive oil quality and its determinings factors. In:Proceedings of Problems on Olive Oil Quality Congress, Sassari,Italy. Pp. 23–55.
Stenhagen, E., Abrahamsson, S. & Mc Lafferty, F.W. (1974). Registryof Mass Spectral Data. New York: Wiley and Sons.
Torres, M.M. & Maestri, D.M. (2006). The effects of genotype andextraction methods on chemical composition of virgin olive oilsfrom Treslasierra Valley (Cordoba, Argentina). Food Chemistry, 96,507–511.
Tura, D., Gigliotti, C., Pedo, S., Failla, O., Bassi, D. & Serraiocco, A.(2007). Influence of cultivar and site of cultivation on levels oflipophilic and hydrophilic antioxidants in virgin olive oils (Oleaeuropea L.) and correlations with oxidative stability. ScientiaHorticulturae, 112, 108–119.
Visioli, F., Poli, A. & Galli, C. (2002). Antioxidant and otherbiological activities of phenols from olives and olive oil. MedicinalResearch Reviewers, 22, 65–75.
Wolf, J.P. (1968). Manuel d’analyse des Corps Gras. P. 198. Vol. 370.Paris: Azoulay.
Improvement of Chemlali olive oil quality M. Issaoui et al.1332
International Journal of Food Science and Technology 2009 � 2009 The Authors. Journal compilation � 2009 Institute of Food Science and Technology