Housing: Mirror and Mould for Australian Society? Andrew Beer This is the third in a series of essays based on data from the 2006 Census, produced in cooperation with the Australian Bureau of Statistics Occasional Paper 5/2008 Census Series # 3 The Academy of the Social Sciences in Australia Canberra 2008
Transcript
Housing:Mirror and Mould forAustralian Society?
Andrew Beer
This is the third in a series of essays based on data fromthe 2006 Census, produced in cooperation with
the Australian Bureau of Statistics
Occasional Paper 5/2008Census Series # 3
The Academy of the Social Sciences in AustraliaCanberra 2008
Requests and enquiries concerning reproduction rights should beaddressed to the Academy of the Social Sciences in Australia, GPOBox 1956, Canberra 2601.Tel 02 6249 1788; Fax 02 6247 4335;Email [email protected] Academy is not responsible, as a body, for the opinionsexpressed in any of its publications.
All articles appearing in the Occasional PaperCensus Series are peer reviewed.
Academy of the Social Sciences 2008/1
Housing: Mirror and Mould for Austr alian Society?1
Andrew Beer
1. Introduction
ustralian society is changing in response to social, economic, demographic and policyprocesses that affect all dimensions of life, including housing. These changes raise
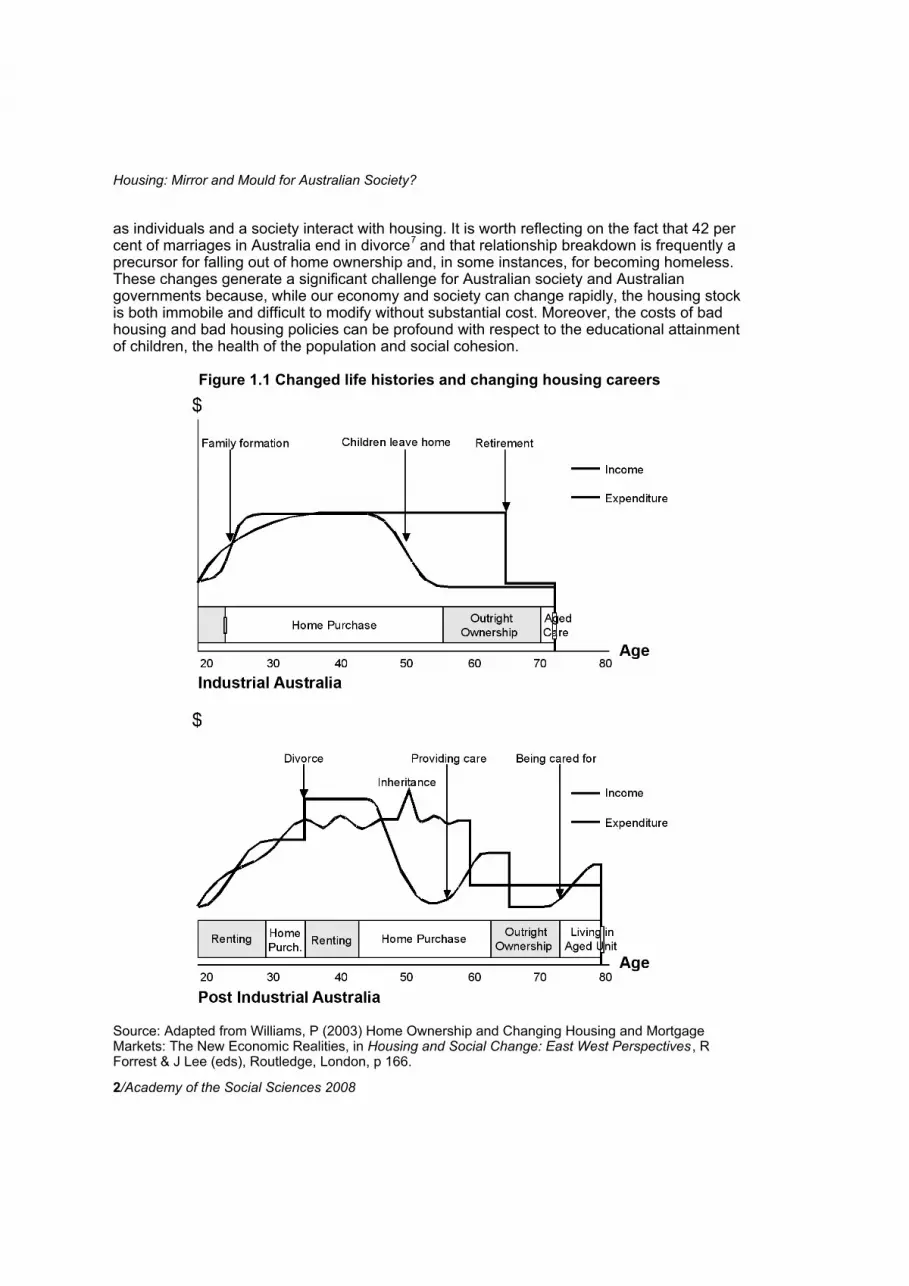
important questions about how Australians see themselves both at home and abroad andhow we think of our housing.Public representations of Australia are no longer solely focused on the perhaps mythical‘quarter acre block’, as reflected in popular television programs such as ‘The Block’ and, to acertain extent, ‘Big Brother’. At the same time, home and housing continues to occupy animportant place within the national psyche with home renovation/lifestyle programs andmagazines such as ‘Renovation Rescue’, ‘Better Homes and Gardens’ dominating both theprint and television media. Indeed, Fiona Allon at the Centre for Cultural Research at theUniversity of Western Sydney has suggested that we have become a ‘Renovation Nation’2.Even in the midst of global economic turmoil we cannot escape the fact that the business ofbuying, selling, renovating, demolishing and building homes has a prominent place withinAustralian society. The stimulation of housing markets through the doubling of the First HomeOwners Grant has been an important part of the Rudd Labor Government’s response to crisisin the world’s financial markets. A whole new lexicon has been invented over the last decadeto describe new ways of dealing and operating in the housing market: a home to bedemolished and replaced with a more expensive property is now a ‘knockdown’; the processof reconfiguring the home is called a ‘renno’; while the real estate industry now offers‘executive apartments’ or ‘luxury executive apartments’ – never apartments3 – and ‘lifestyleconcepts’.There can be no denying that the way Australians live in their home and interact with thehousing market has changed dramatically over the last two decades. Home is no longersimply a place to be ‘safe and sound’4 but is instead a part of a much more dynamic and fast-paced society. We ‘transition’ through housing, matching the dwelling within which we live toour employment circumstances, stage in the lifecycle, friendships and consumptionaspirations5. One way of thinking about this set of processes is to focus on the idea of anindividual’s or household’s housing career or housing history. That is, the set of housingcircumstances individuals, families and households occupy through their lifetime6.The contrast between past and present attitudes to, and consumption of, housing can berepresented schematically (Figure 1.1). What this figure attempts to show is that thirty or fortyyears ago the employment and life histories of many Australians were marked by a degree ofcertainty and predictability. Employment and marriage were long term commitments, homeownership was the ‘natural’ tenure for virtually everyone at some stage in their life, and theprocesses of caring for others followed a reasonably uniform pattern. In post-industrialAustralia, however, much has changed. Many social phenomena that were previouslyconstant and unchanging – employment, forming a relationship, place of residence – are nowmuch more dynamic, with profound implications for the operation of the housing market andindividuals’ transitions through the dwelling stock. Divorce or separation, periods ofunemployment or underemployment, the provision of care to older or disabled relatives, thereceipt of an inheritance and living into ‘old old’ age all have a significant impact on how we
A
Housing: Mirror and Mould for Australian Society?
2/Academy of the Social Sciences 2008
as individuals and a society interact with housing. It is worth reflecting on the fact that 42 percent of marriages in Australia end in divorce7 and that relationship breakdown is frequently aprecursor for falling out of home ownership and, in some instances, for becoming homeless.These changes generate a significant challenge for Australian society and Australiangovernments because, while our economy and society can change rapidly, the housing stockis both immobile and difficult to modify without substantial cost. Moreover, the costs of badhousing and bad housing policies can be profound with respect to the educational attainmentof children, the health of the population and social cohesion.
Figure 1.1 Changed life histories and changing housing careers
Source: Adapted from Williams, P (2003) Home Ownership and Changing Housing and MortgageMarkets: The New Economic Realities, in Housing and Social Change: East West Perspectives , RForrest & J Lee (eds), Routledge, London, p 166.
Housing: Mirror and Mould for Australian Society?
Academy of the Social Sciences 2008/3
Clearly there are profound changes taking place in the Australian housing system andAustralian society needs to better understand these changes in order to adequately plan forthe future. We also need information on, and an understanding of, what is happening in thehousing market to help us provide services that meet needs. Even as individuals it isimportant that we have a good grasp of the shifts and trends in the housing market so we canmake sense of the changes that surround us. The release of data from the 2006 Censuspresents a unique opportunity to take stock of what is happening with Australians and theirhousing. For professional housing researchers the Census represents the ‘gold standard’ forhousing data as it is the most comprehensive and uniform enumeration available.Researchers in other developed economies have access to information sources unavailablein Australia, such as the English, Welsh, Scottish and Northern Ireland House ConditionSurveys which have been undertaken since 19678. On the other hand, those in Australia withan interest in housing matters have access to the Survey of Income and Housing Costs, aswell as the benefit of a five-yearly Census. Other nations such as the UK, Ireland and theUSA have a decade-long interval between their population censuses. Every five yearsAustralian housing researchers can therefore assess both the direction and rate of change inthe construction and use of housing.This paper makes use of the 2006 and two previous Censuses in order to present a snapshotof the evolution of Australian housing and highlight the changes in the way Australiansconsume housing. In particular, this essay pays attention to the ways in which housingreflects broader societal change while at the same time moulding the future of our nation.There is a focus on the degree of fit between the housing stock and the changing Australianhouseholds, including developments in family formation, the number of persons living in eachhome, the ageing of the population and the different outcomes confronting men and womenin the housing market. Along the way the essay also considers issues of housing affordabilityand the processes through which the current housing affordability ‘crisis’ is shaping both theways in which we live as a nation and the type of society we are becoming.
2. Australians and their housing: continuity, change and emerging issues
Some of the most important questions about Australians and their housing are: where doAustralians live, do we have sufficient housing for the population, and is their housingchanging? Fortunately, there is a good deal of research already published that can help usanswer these questions.Recent projections show that the housing stock is growing and will continue to grow over theforeseeable future. Projections indicate that by 2011 there will be demand for an additional1.1 million dwellings9 and that Australian households will continue to decline in size asparents occupy their existing dwellings and young people seek new housing. The Censusdata provides a reliable indicator of the pace of this growth. At the 1996 Census there were7,195,216 households within the Australian housing stock, by 2001 this had risen to7,810,345 and by 2006 it stood at 8,446,726.One of the most important changes over the last 20 years in the way Australians consumehousing has been that since the 1990s housing demand has been driven by the growth in thenumber of households rather than the growth in population10. That is, people are now morelikely to form new households as a result of processes – divorce, separation, migration forwork-related reasons, and the ageing of the population – that have nothing to do with thegrowth of the population. Partly for this reason, there is evidence that Australia has not beenproducing enough housing relative to demand11 and that this lag has been evident overseveral years. This gap within housing supply has reflected change in the nature of Australian
Housing: Mirror and Mould for Australian Society?
4/Academy of the Social Sciences 2008
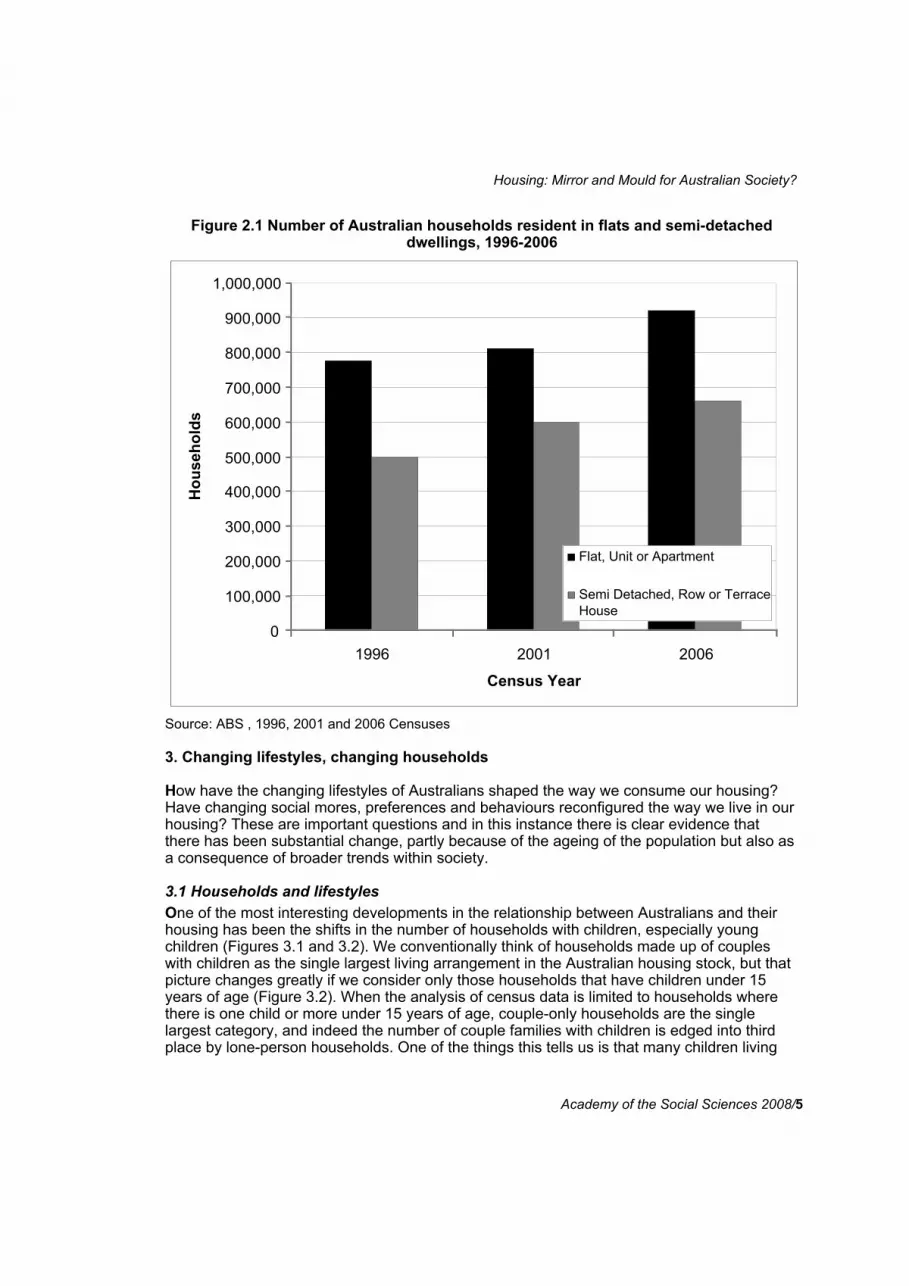
households but also contributed to that change via higher housing costs and a growingaffordability challenge for many families and individuals12.The available evidence indicates that there has been change in the demand for housing overthe last two decades but have those shifts been reflected in the types of dwellings Australiansoccupy? That is, has the housing stock and the housing industry kept pace with the moredynamic economy and society Australia has become? At one level the answer is no:overwhelmingly Australians continue to live in separate houses, most of which have three ormore bedrooms. In aggregate the ‘typical’ Australian home in 2006 looks very similar to the‘typical’ home in 1986, 1976 and 1996. But this is not to suggest that there hasn’t beenimportant change, as the proportion of occupied dwellings in Australia that are separatehouses has been falling slowly but steadily over recent years. At Census 2006 74.8 per centof occupied private dwellings in Australia were separate houses (5,685,387 of 7,596,183private occupied dwellings), compared with 75.3 per cent in 2001 and 78 per cent in 1991.Allied with this decline in the percentage of dwellings that are separate houses has been anincrease in the number and proportion of all private occupied dwellings that are higherdensity – increasing from 19.5 per cent of all private occupied dwellings in 1991, to 22.2 percent in 2001 and most recently to 23.4 per cent in 2006. In short, Australians are slowlyembracing a more ‘urban’ rather than suburban lifestyle and the housing that comes with it.Indeed, even within suburbia there has been substantial change within the housing stock.Recent research by Hall13 has shown that whereas conventional detached housingdevelopment in Australian suburbs from the 1960s, 1970s or 1980s resulted in the dwellinghaving a ‘footprint’ of approximately 30 per cent of the residential block, contemporarydevelopment results in a footprint close to 60 per cent. Houses have grown larger andbackyards have dwindled in size.Urban consolidation policies have had a profound impact on the nature of urban developmentand resulted in both smaller backyards within the new detached housing stock and higherdensity housing – townhouses and high rise apartments – in the larger cities such as Sydney,Melbourne and Brisbane. The rate of growth of higher density housing forms has outstrippedthe growth of the conventional housing stock (ABS 2003) and Figure 2.1 suggests that in themost recent inter-censal period the rate of growth in the higher density housing forms – flatsand apartments – has outpaced medium density semi detached housing. The ABS14 reportedthat between 1991 and 2001 higher density housing increased at more than three times therate of separate houses in Sydney and that similar patterns were evident in Melbourne,Brisbane and Canberra.Significantly, higher density housing has emerged as one of the few affordable housingoptions for low and moderate income households and it therefore occupies an importanttransitional phase in the life trajectories of many families. Some households, of course, staywithin this housing permanently. Women with children would be especially affected by thistrend because of their lower incomes relative to men, their periods outside paid work due tochild care commitments and through the concentration of female employment in the CBDwhere house price pressures are most acute15. Flats, units and apartments represented 55per cent of the total dwelling stock in inner Sydney at the 2001 Census, compared with 30 percent in the middle suburbs and 11 per cent in outer Sydney16. Higher density housing,therefore, is a more affordable and accessible option for many families, and one which hasthe potential to better meet changing household circumstances, as well as the demands ofthe modern workplace.
Housing: Mirror and Mould for Australian Society?
Academy of the Social Sciences 2008/5
Figure 2.1 Number of Australian households resident in flats and semi-detacheddwellings, 1996-2006
0
100,000
200,000
300,000
400,000
500,000
600,000
700,000
800,000
900,000
1,000,000
1996 2001 2006
Census Year
Hou
seho
lds
Flat, Unit or Apartment
Semi Detached, Row or TerraceHouse
Source: ABS , 1996, 2001 and 2006 Censuses
3. Changing lifestyles, changing households
How have the changing lifestyles of Australians shaped the way we consume our housing?Have changing social mores, preferences and behaviours reconfigured the way we live in ourhousing? These are important questions and in this instance there is clear evidence thatthere has been substantial change, partly because of the ageing of the population but also asa consequence of broader trends within society.
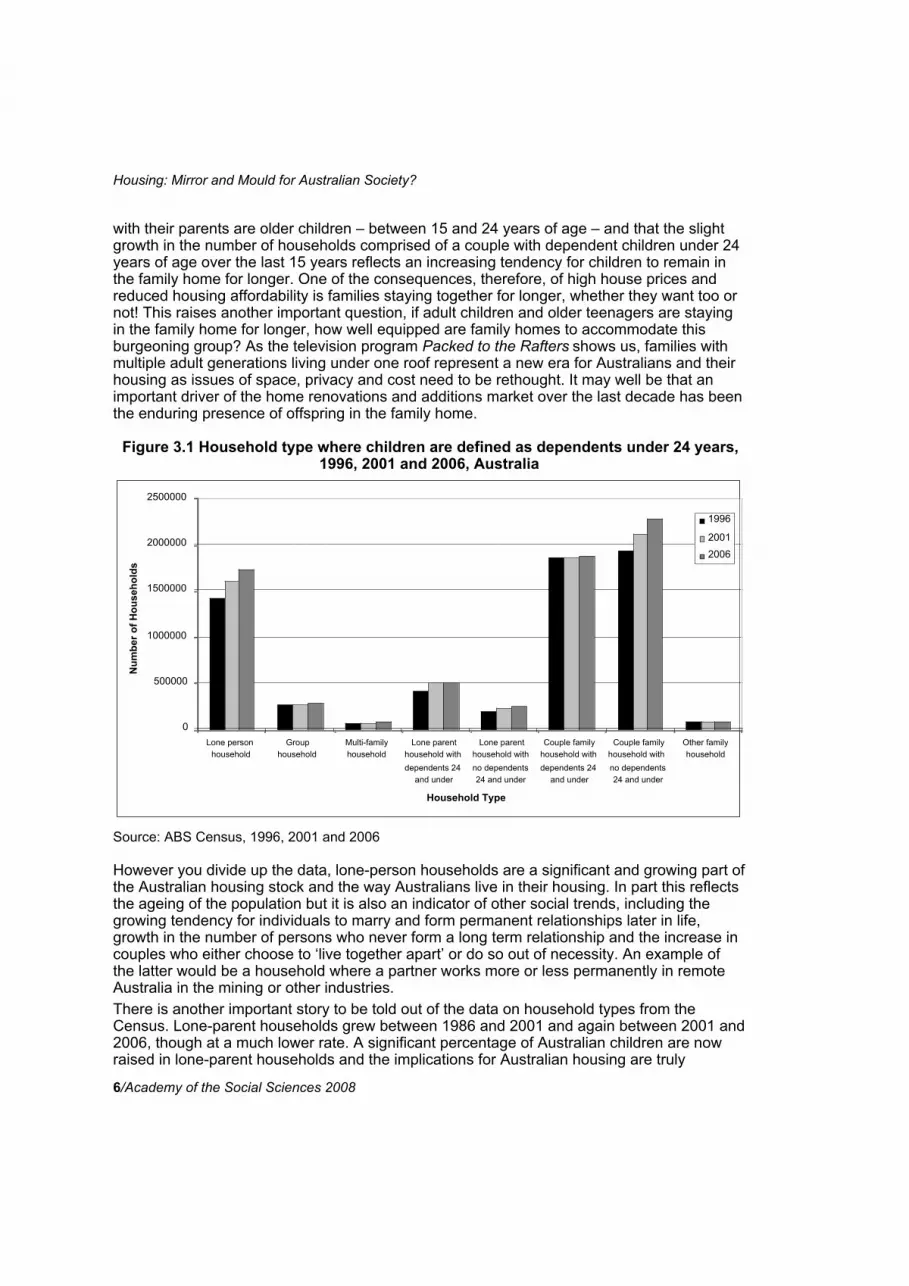
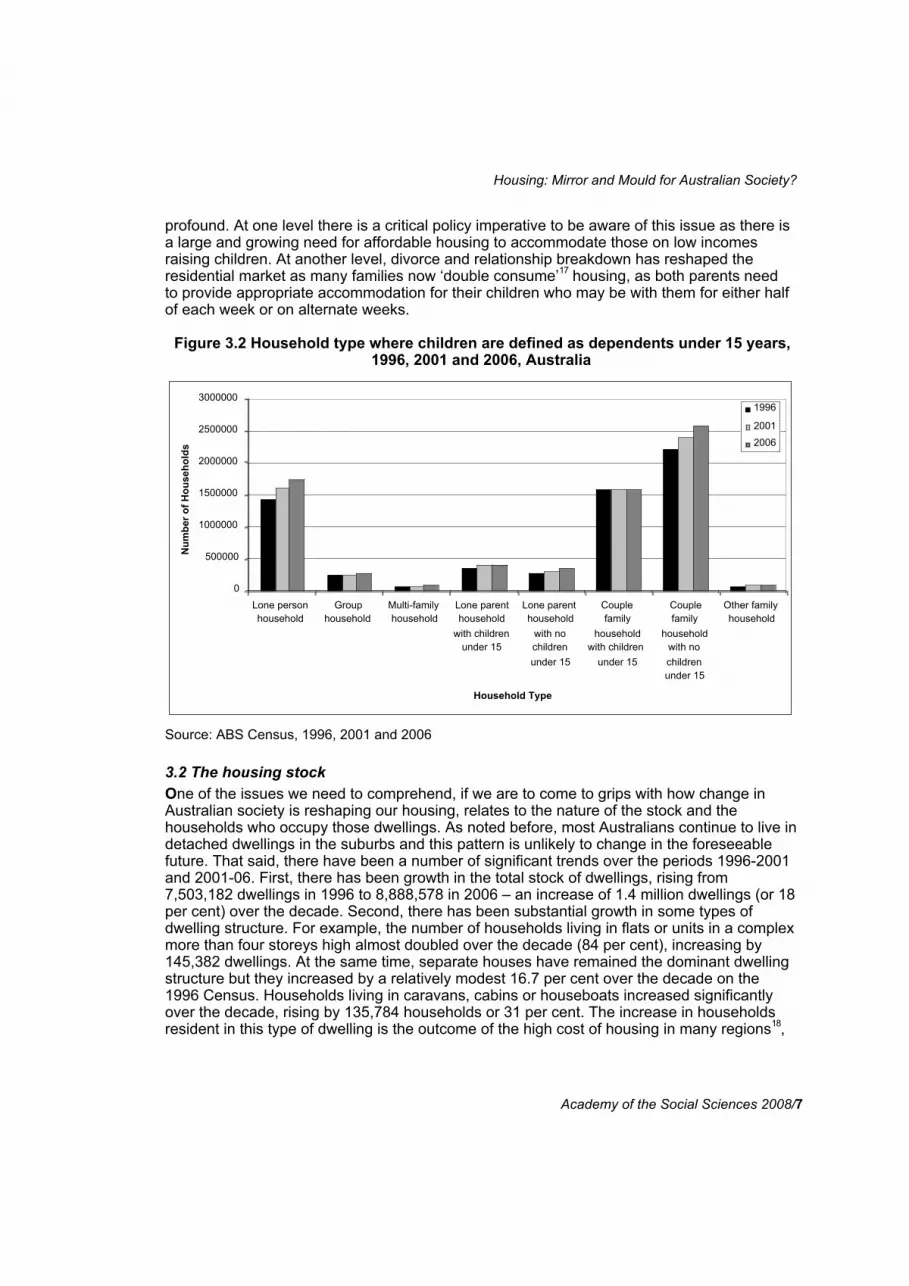
3.1 Households and lifestylesOne of the most interesting developments in the relationship between Australians and theirhousing has been the shifts in the number of households with children, especially youngchildren (Figures 3.1 and 3.2). We conventionally think of households made up of coupleswith children as the single largest living arrangement in the Australian housing stock, but thatpicture changes greatly if we consider only those households that have children under 15years of age (Figure 3.2). When the analysis of census data is limited to households wherethere is one child or more under 15 years of age, couple-only households are the singlelargest category, and indeed the number of couple families with children is edged into thirdplace by lone-person households. One of the things this tells us is that many children living
Housing: Mirror and Mould for Australian Society?
6/Academy of the Social Sciences 2008
with their parents are older children – between 15 and 24 years of age – and that the slightgrowth in the number of households comprised of a couple with dependent children under 24years of age over the last 15 years reflects an increasing tendency for children to remain inthe family home for longer. One of the consequences, therefore, of high house prices andreduced housing affordability is families staying together for longer, whether they want too ornot! This raises another important question, if adult children and older teenagers are stayingin the family home for longer, how well equipped are family homes to accommodate thisburgeoning group? As the television program Packed to the Rafters shows us, families withmultiple adult generations living under one roof represent a new era for Australians and theirhousing as issues of space, privacy and cost need to be rethought. It may well be that animportant driver of the home renovations and additions market over the last decade has beenthe enduring presence of offspring in the family home.
Figure 3.1 Household type where children are defined as dependents under 24 years,1996, 2001 and 2006, Australia
0
500000
1000000
1500000
2000000
2500000
Lone personhousehold
Grouphousehold
Multi-familyhousehold
Lone parenthousehold withdependents 24
and under
Lone parenthousehold withno dependents24 and under
Couple familyhousehold withdependents 24
and under
Couple familyhousehold withno dependents24 and under
Other familyhousehold
Household Type
Num
ber o
f Hou
seho
lds
1996
2001
2006
Source: ABS Census, 1996, 2001 and 2006
However you divide up the data, lone-person households are a significant and growing part ofthe Australian housing stock and the way Australians live in their housing. In part this reflectsthe ageing of the population but it is also an indicator of other social trends, including thegrowing tendency for individuals to marry and form permanent relationships later in life,growth in the number of persons who never form a long term relationship and the increase incouples who either choose to ‘live together apart’ or do so out of necessity. An example ofthe latter would be a household where a partner works more or less permanently in remoteAustralia in the mining or other industries.There is another important story to be told out of the data on household types from theCensus. Lone-parent households grew between 1986 and 2001 and again between 2001 and2006, though at a much lower rate. A significant percentage of Australian children are nowraised in lone-parent households and the implications for Australian housing are truly
Housing: Mirror and Mould for Australian Society?
Academy of the Social Sciences 2008/7
profound. At one level there is a critical policy imperative to be aware of this issue as there isa large and growing need for affordable housing to accommodate those on low incomesraising children. At another level, divorce and relationship breakdown has reshaped theresidential market as many families now ‘double consume’17 housing, as both parents needto provide appropriate accommodation for their children who may be with them for either halfof each week or on alternate weeks.
Figure 3.2 Household type where children are defined as dependents under 15 years,1996, 2001 and 2006, Australia
0
500000
1000000
1500000
2000000
2500000
3000000
Lone personhousehold
Grouphousehold
Multi-familyhousehold
Lone parenthousehold
with childrenunder 15
Lone parenthousehold
with nochildrenunder 15
Couplefamily
householdwith children
under 15
Couplefamily
householdwith nochildrenunder 15
Other familyhousehold
Household Type
Num
ber o
f Hou
seho
lds
1996
2001
2006
Source: ABS Census, 1996, 2001 and 2006
3.2 The housing stockOne of the issues we need to comprehend, if we are to come to grips with how change inAustralian society is reshaping our housing, relates to the nature of the stock and thehouseholds who occupy those dwellings. As noted before, most Australians continue to live indetached dwellings in the suburbs and this pattern is unlikely to change in the foreseeablefuture. That said, there have been a number of significant trends over the periods 1996-2001and 2001-06. First, there has been growth in the total stock of dwellings, rising from7,503,182 dwellings in 1996 to 8,888,578 in 2006 – an increase of 1.4 million dwellings (or 18per cent) over the decade. Second, there has been substantial growth in some types ofdwelling structure. For example, the number of households living in flats or units in a complexmore than four storeys high almost doubled over the decade (84 per cent), increasing by145,382 dwellings. At the same time, separate houses have remained the dominant dwellingstructure but they increased by a relatively modest 16.7 per cent over the decade on the1996 Census. Households living in caravans, cabins or houseboats increased significantlyover the decade, rising by 135,784 households or 31 per cent. The increase in householdsresident in this type of dwelling is the outcome of the high cost of housing in many regions18,
Housing: Mirror and Mould for Australian Society?
8/Academy of the Social Sciences 2008
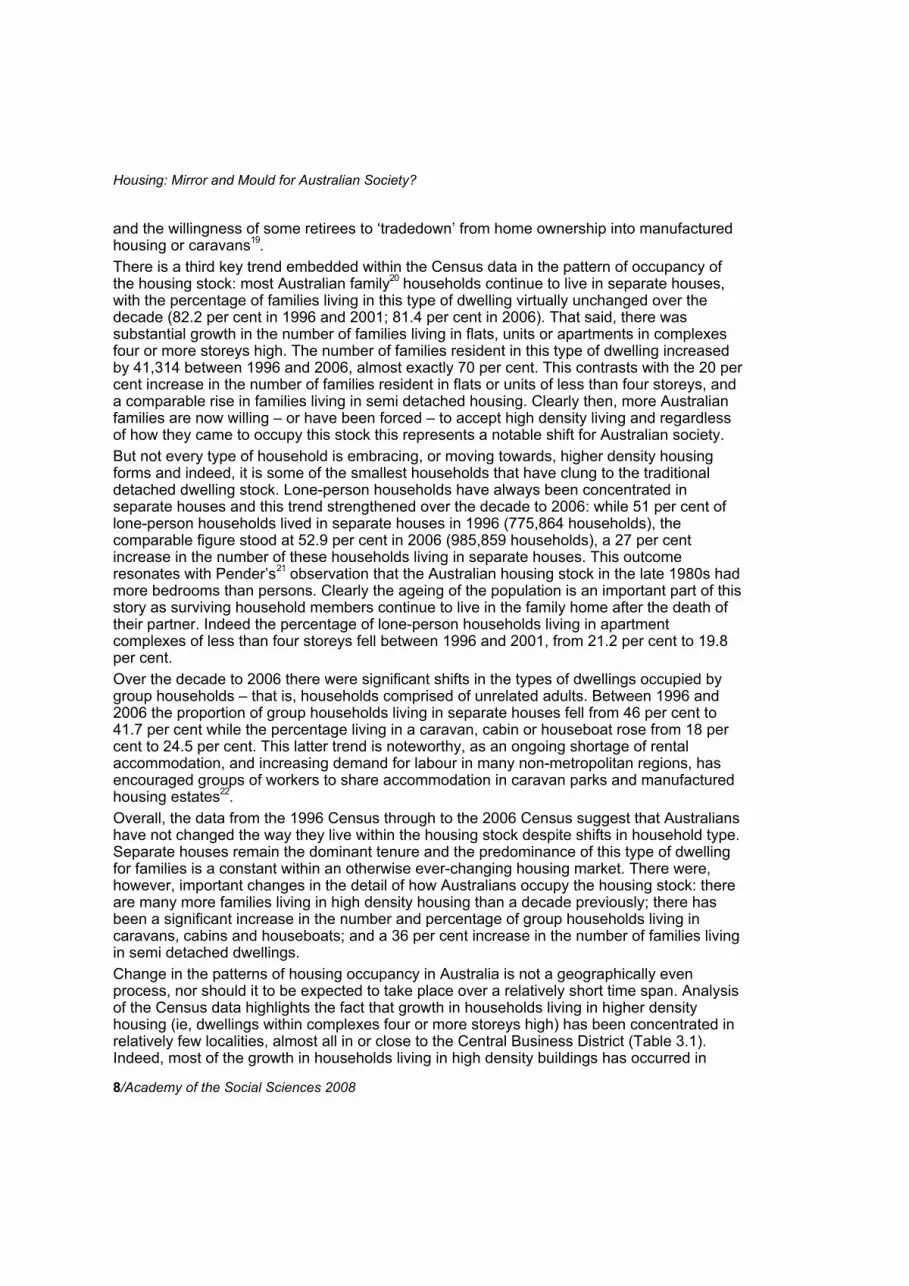
and the willingness of some retirees to ‘tradedown’ from home ownership into manufacturedhousing or caravans19.There is a third key trend embedded within the Census data in the pattern of occupancy ofthe housing stock: most Australian family20 households continue to live in separate houses,with the percentage of families living in this type of dwelling virtually unchanged over thedecade (82.2 per cent in 1996 and 2001; 81.4 per cent in 2006). That said, there wassubstantial growth in the number of families living in flats, units or apartments in complexesfour or more storeys high. The number of families resident in this type of dwelling increasedby 41,314 between 1996 and 2006, almost exactly 70 per cent. This contrasts with the 20 percent increase in the number of families resident in flats or units of less than four storeys, anda comparable rise in families living in semi detached housing. Clearly then, more Australianfamilies are now willing – or have been forced – to accept high density living and regardlessof how they came to occupy this stock this represents a notable shift for Australian society.But not every type of household is embracing, or moving towards, higher density housingforms and indeed, it is some of the smallest households that have clung to the traditionaldetached dwelling stock. Lone-person households have always been concentrated inseparate houses and this trend strengthened over the decade to 2006: while 51 per cent oflone-person households lived in separate houses in 1996 (775,864 households), thecomparable figure stood at 52.9 per cent in 2006 (985,859 households), a 27 per centincrease in the number of these households living in separate houses. This outcomeresonates with Pender’s21 observation that the Australian housing stock in the late 1980s hadmore bedrooms than persons. Clearly the ageing of the population is an important part of thisstory as surviving household members continue to live in the family home after the death oftheir partner. Indeed the percentage of lone-person households living in apartmentcomplexes of less than four storeys fell between 1996 and 2001, from 21.2 per cent to 19.8per cent.Over the decade to 2006 there were significant shifts in the types of dwellings occupied bygroup households – that is, households comprised of unrelated adults. Between 1996 and2006 the proportion of group households living in separate houses fell from 46 per cent to41.7 per cent while the percentage living in a caravan, cabin or houseboat rose from 18 percent to 24.5 per cent. This latter trend is noteworthy, as an ongoing shortage of rentalaccommodation, and increasing demand for labour in many non-metropolitan regions, hasencouraged groups of workers to share accommodation in caravan parks and manufacturedhousing estates22.Overall, the data from the 1996 Census through to the 2006 Census suggest that Australianshave not changed the way they live within the housing stock despite shifts in household type.Separate houses remain the dominant tenure and the predominance of this type of dwellingfor families is a constant within an otherwise ever-changing housing market. There were,however, important changes in the detail of how Australians occupy the housing stock: thereare many more families living in high density housing than a decade previously; there hasbeen a significant increase in the number and percentage of group households living incaravans, cabins and houseboats; and a 36 per cent increase in the number of families livingin semi detached dwellings.Change in the patterns of housing occupancy in Australia is not a geographically evenprocess, nor should it to be expected to take place over a relatively short time span. Analysisof the Census data highlights the fact that growth in households living in higher densityhousing (ie, dwellings within complexes four or more storeys high) has been concentrated inrelatively few localities, almost all in or close to the Central Business District (Table 3.1).Indeed, most of the growth in households living in high density buildings has occurred in
Housing: Mirror and Mould for Australian Society?
Academy of the Social Sciences 2008/9
Sydney and Melbourne, with some growth in Brisbane and to a very limited extent, theCentral Business District of Adelaide. It is in these localities that we can expect to find asignificant increase in the number of families resident in higher density housing.
Table 3.1 Top 20 statistical local areas (SLA) to record an increase in householdsresident in buildings four or more storeys high, 1996 to 2006
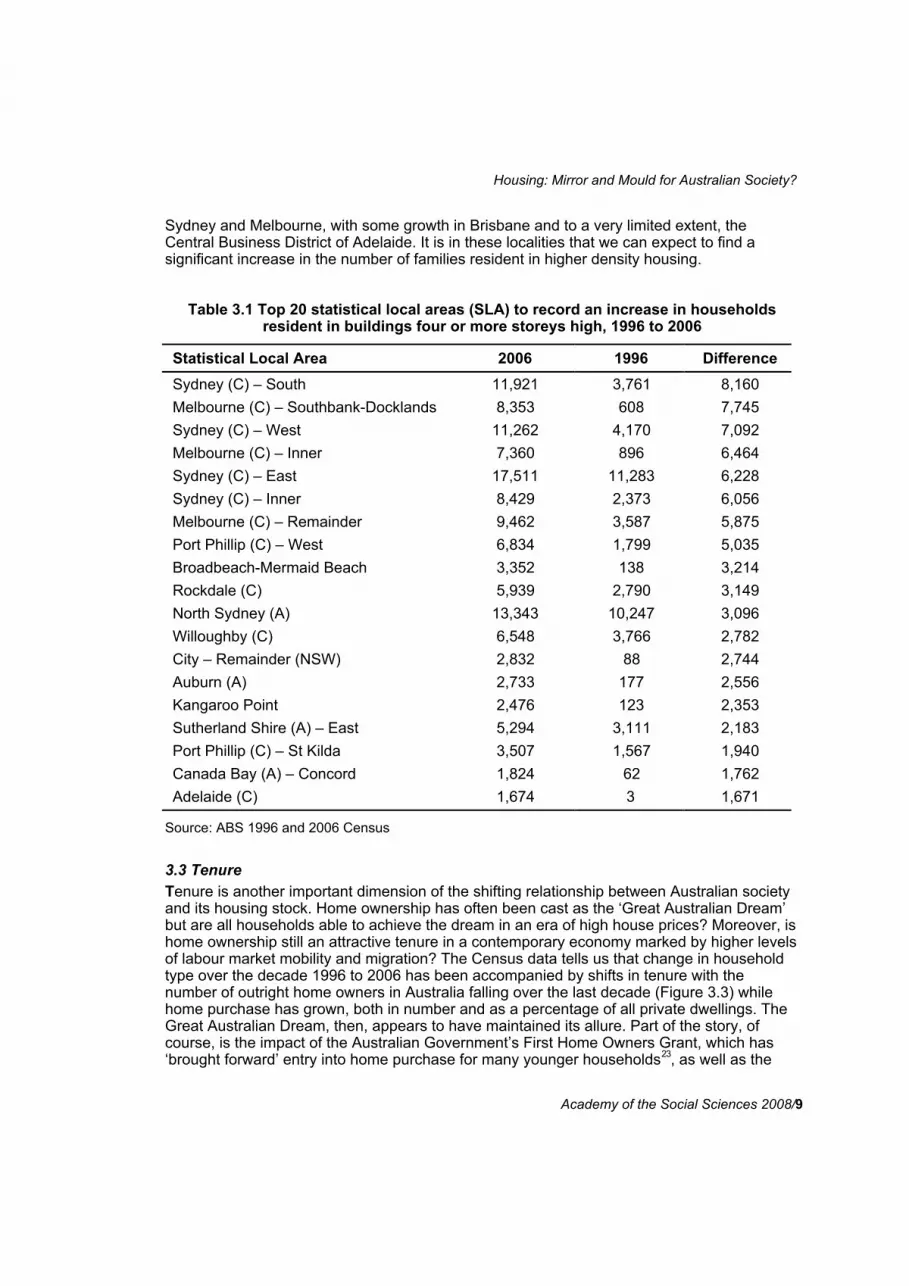
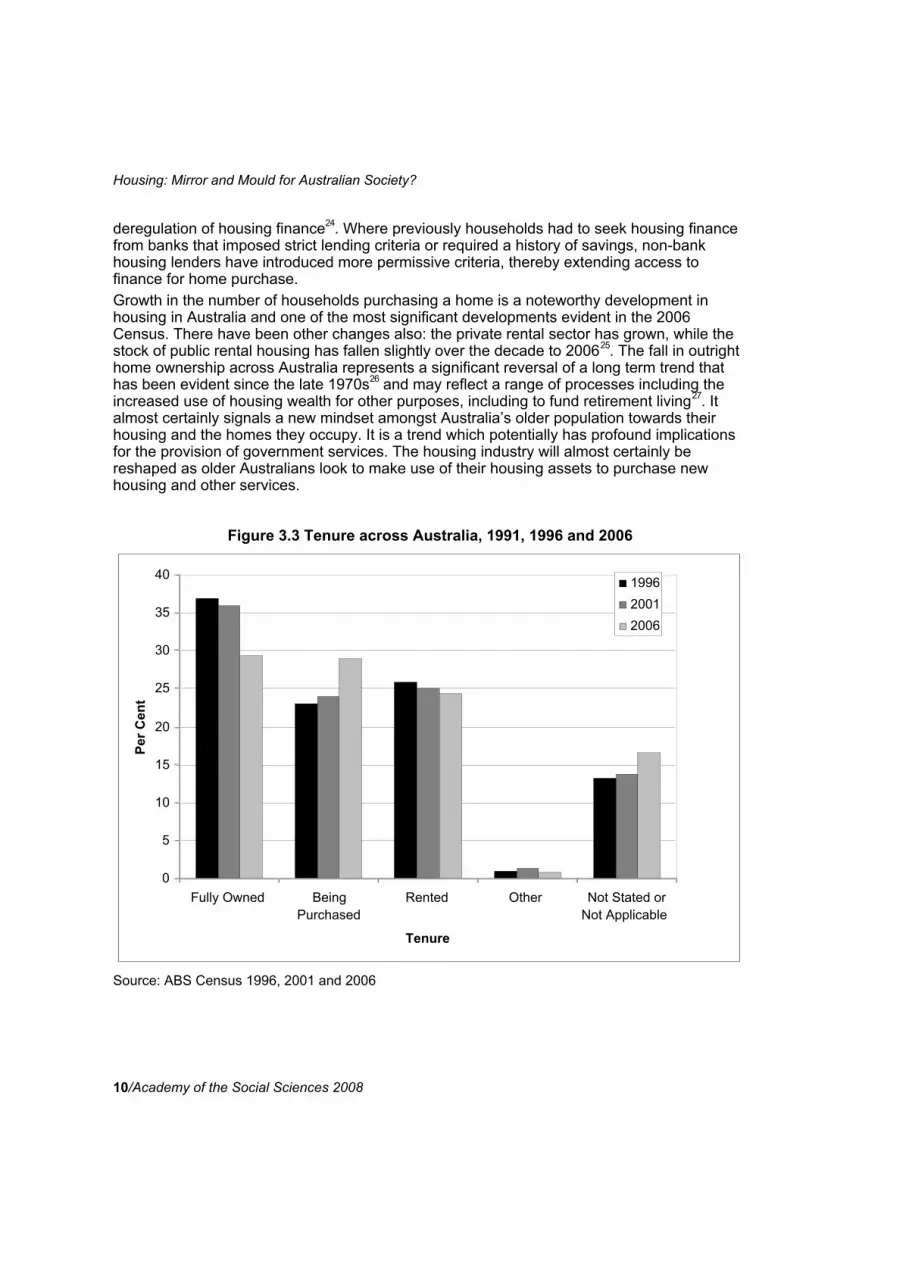
3.3 TenureTenure is another important dimension of the shifting relationship between Australian societyand its housing stock. Home ownership has often been cast as the ‘Great Australian Dream’but are all households able to achieve the dream in an era of high house prices? Moreover, ishome ownership still an attractive tenure in a contemporary economy marked by higher levelsof labour market mobility and migration? The Census data tells us that change in householdtype over the decade 1996 to 2006 has been accompanied by shifts in tenure with thenumber of outright home owners in Australia falling over the last decade (Figure 3.3) whilehome purchase has grown, both in number and as a percentage of all private dwellings. TheGreat Australian Dream, then, appears to have maintained its allure. Part of the story, ofcourse, is the impact of the Australian Government’s First Home Owners Grant, which has‘brought forward’ entry into home purchase for many younger households23, as well as the
Housing: Mirror and Mould for Australian Society?
10/Academy of the Social Sciences 2008
deregulation of housing finance24. Where previously households had to seek housing financefrom banks that imposed strict lending criteria or required a history of savings, non-bankhousing lenders have introduced more permissive criteria, thereby extending access tofinance for home purchase.Growth in the number of households purchasing a home is a noteworthy development inhousing in Australia and one of the most significant developments evident in the 2006Census. There have been other changes also: the private rental sector has grown, while thestock of public rental housing has fallen slightly over the decade to 200625. The fall in outrighthome ownership across Australia represents a significant reversal of a long term trend thathas been evident since the late 1970s26 and may reflect a range of processes including theincreased use of housing wealth for other purposes, including to fund retirement living27. Italmost certainly signals a new mindset amongst Australia’s older population towards theirhousing and the homes they occupy. It is a trend which potentially has profound implicationsfor the provision of government services. The housing industry will almost certainly bereshaped as older Australians look to make use of their housing assets to purchase newhousing and other services.
Figure 3.3 Tenure across Australia, 1991, 1996 and 2006
0
5
10
15
20
25
30
35
40
Fully Owned BeingPurchased
Rented Other Not Stated orNot Applicable
Tenure
Per C
ent
199620012006
Source: ABS Census 1996, 2001 and 2006
Housing: Mirror and Mould for Australian Society?
Academy of the Social Sciences 2008/11
4. Affordability
Housing affordability is a significant problem across Australia and it is a phenomenon thathighlights the impact of broader social processes on housing, as well as the influence thehousing sector in turn has on society. Australia’s current housing affordability challenges arethe product of a number of processes including the structure of tax arrangements28, landsupply lags, shortages in skilled labour and growth in the demand for housing29. The 2006Census data provides an opportunity to take stock of changes in house price affordability bycomparing data across the decades. Importantly, the very nature of this data set – as acensus rather than a survey or other enumeration – allows us to undertake a detailedanalysis of those persons affected by housing affordability problems and whether thosegroups have changed over time.Recent estimates suggest that between 700,000 and 1.1 million households throughoutAustralia experience housing stress30 where housing stress is defined as households in thebottom 40 per cent of the income distribution paying 30 per cent or more of their income onhousing31. The problem is most acute in the private rental sector, which has both the greatestnumber and percentage of households affected by housing stress. Research by Burke et al32
has highlighted the difficult circumstances confronting many low income rental households,with respondents to a survey reporting that they have gone without food, sold personal itemsor failed to pay utility bills in order to meet their housing cost. The highly regarded housingeconomist Associate Professor Judy Yates has argued that the problem is now sowidespread and such a large number of households are so deeply affected that housingaffordability will remain a policy challenge for governments across Australia for at least 15years.
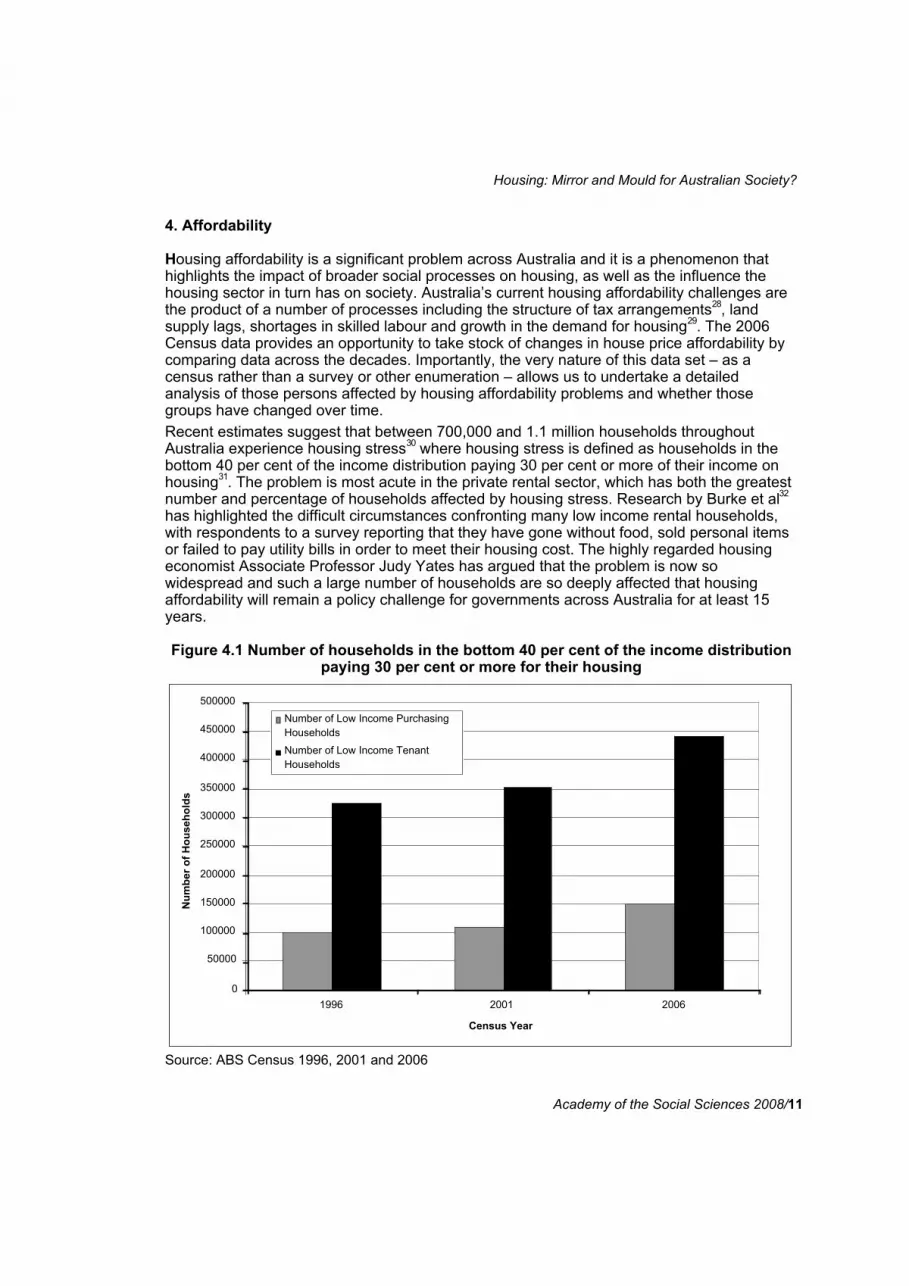
Figure 4.1 Number of households in the bottom 40 per cent of the income distributionpaying 30 per cent or more for their housing
0
50000
100000
150000
200000
250000
300000
350000
400000
450000
500000
1996 2001 2006
Census Year
Num
ber o
f Hou
seho
lds
Number of Low Income PurchasingHouseholds
Number of Low Income TenantHouseholds
Source: ABS Census 1996, 2001 and 2006
Housing: Mirror and Mould for Australian Society?
12/Academy of the Social Sciences 2008
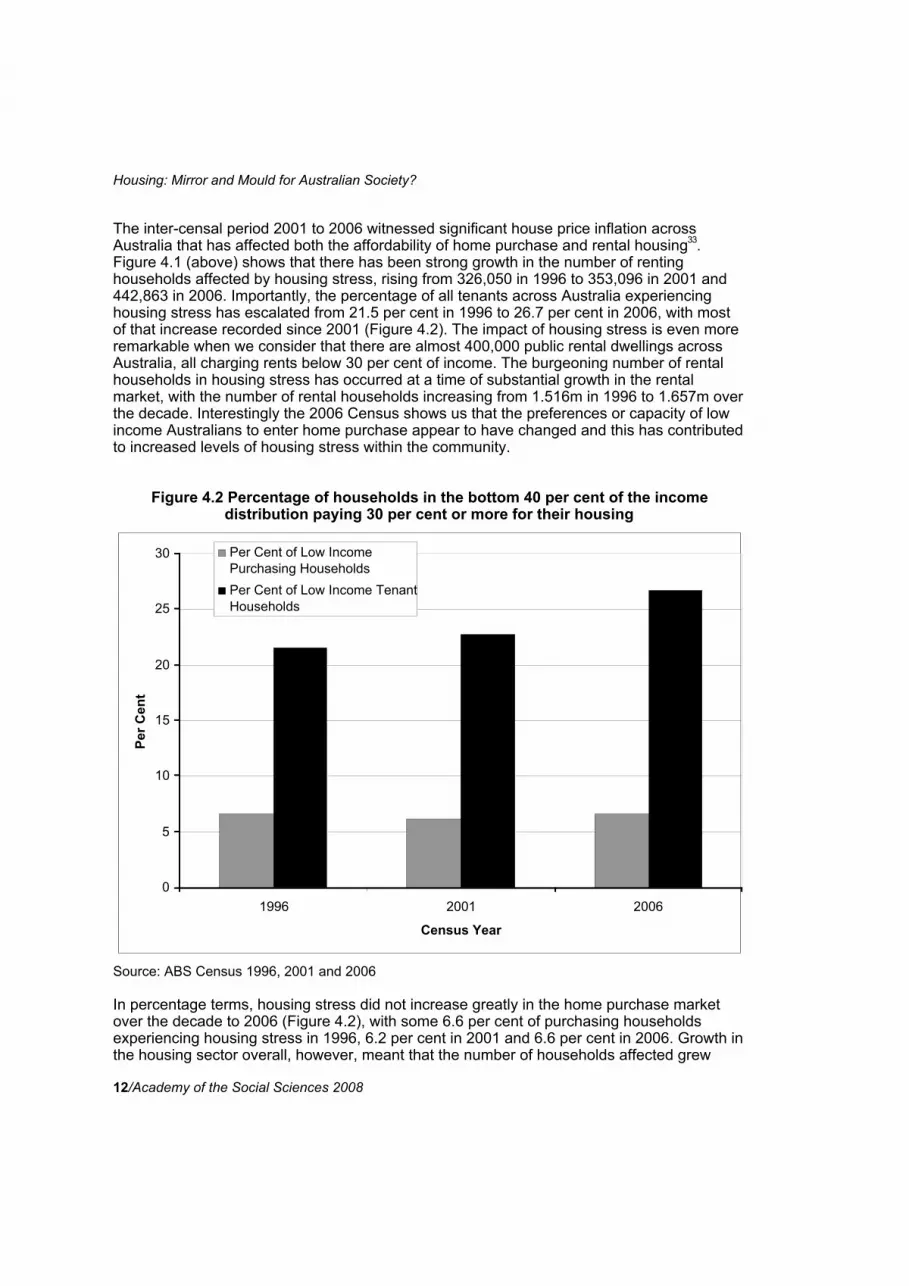
The inter-censal period 2001 to 2006 witnessed significant house price inflation acrossAustralia that has affected both the affordability of home purchase and rental housing33.Figure 4.1 (above) shows that there has been strong growth in the number of rentinghouseholds affected by housing stress, rising from 326,050 in 1996 to 353,096 in 2001 and442,863 in 2006. Importantly, the percentage of all tenants across Australia experiencinghousing stress has escalated from 21.5 per cent in 1996 to 26.7 per cent in 2006, with mostof that increase recorded since 2001 (Figure 4.2). The impact of housing stress is even moreremarkable when we consider that there are almost 400,000 public rental dwellings acrossAustralia, all charging rents below 30 per cent of income. The burgeoning number of rentalhouseholds in housing stress has occurred at a time of substantial growth in the rentalmarket, with the number of rental households increasing from 1.516m in 1996 to 1.657m overthe decade. Interestingly the 2006 Census shows us that the preferences or capacity of lowincome Australians to enter home purchase appear to have changed and this has contributedto increased levels of housing stress within the community.
Figure 4.2 Percentage of households in the bottom 40 per cent of the incomedistribution paying 30 per cent or more for their housing
0
5
10
15
20
25
30
1996 2001 2006
Census Year
Per C
ent
Per Cent of Low IncomePurchasing Households Per Cent of Low Income TenantHouseholds
Source: ABS Census 1996, 2001 and 2006
In percentage terms, housing stress did not increase greatly in the home purchase marketover the decade to 2006 (Figure 4.2), with some 6.6 per cent of purchasing householdsexperiencing housing stress in 1996, 6.2 per cent in 2001 and 6.6 per cent in 2006. Growth inthe housing sector overall, however, meant that the number of households affected grew
Housing: Mirror and Mould for Australian Society?
Academy of the Social Sciences 2008/13
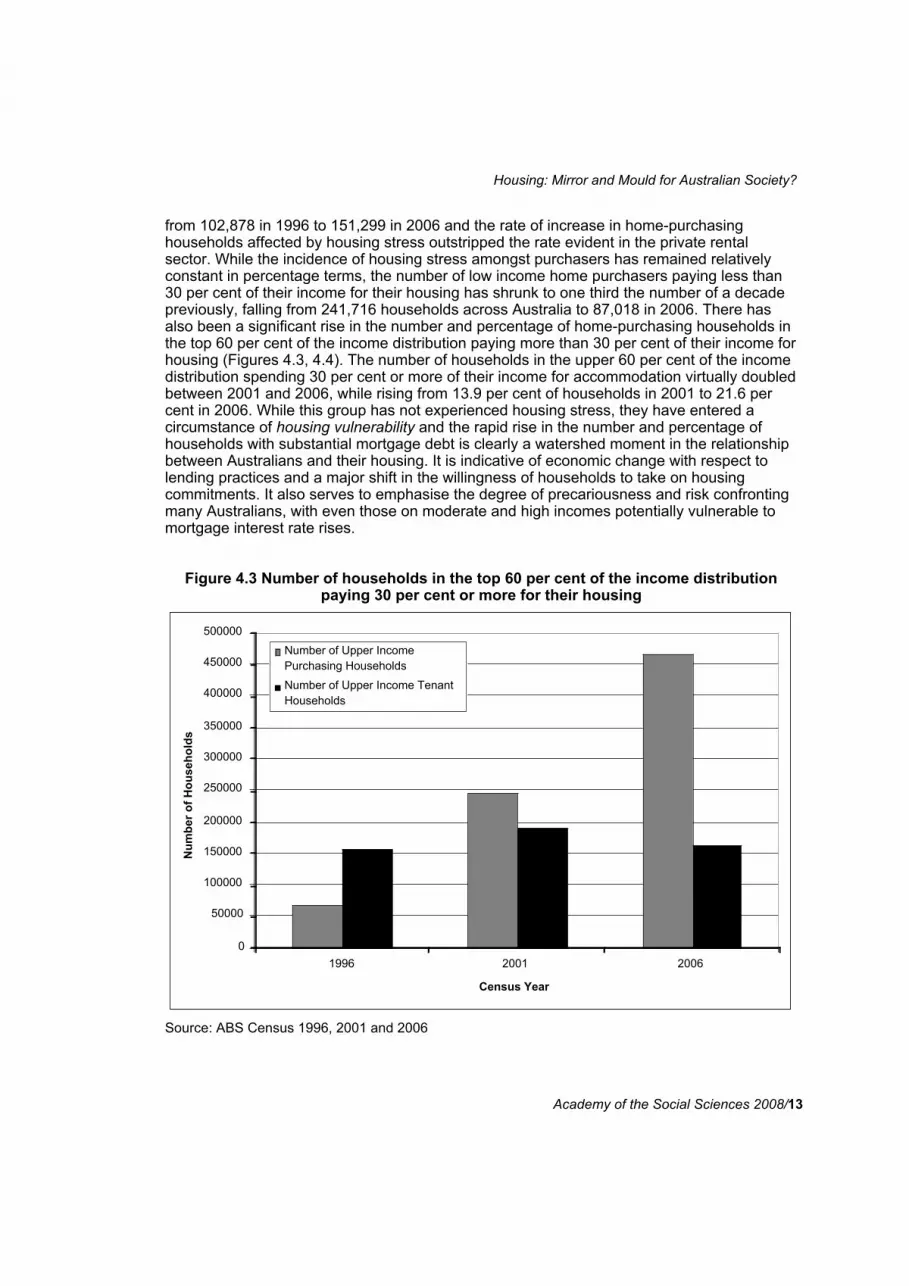
from 102,878 in 1996 to 151,299 in 2006 and the rate of increase in home-purchasinghouseholds affected by housing stress outstripped the rate evident in the private rentalsector. While the incidence of housing stress amongst purchasers has remained relativelyconstant in percentage terms, the number of low income home purchasers paying less than30 per cent of their income for their housing has shrunk to one third the number of a decadepreviously, falling from 241,716 households across Australia to 87,018 in 2006. There hasalso been a significant rise in the number and percentage of home-purchasing households inthe top 60 per cent of the income distribution paying more than 30 per cent of their income forhousing (Figures 4.3, 4.4). The number of households in the upper 60 per cent of the incomedistribution spending 30 per cent or more of their income for accommodation virtually doubledbetween 2001 and 2006, while rising from 13.9 per cent of households in 2001 to 21.6 percent in 2006. While this group has not experienced housing stress, they have entered acircumstance of housing vulnerability and the rapid rise in the number and percentage ofhouseholds with substantial mortgage debt is clearly a watershed moment in the relationshipbetween Australians and their housing. It is indicative of economic change with respect tolending practices and a major shift in the willingness of households to take on housingcommitments. It also serves to emphasise the degree of precariousness and risk confrontingmany Australians, with even those on moderate and high incomes potentially vulnerable tomortgage interest rate rises.
Figure 4.3 Number of households in the top 60 per cent of the income distributionpaying 30 per cent or more for their housing
0
50000
100000
150000
200000
250000
300000
350000
400000
450000
500000
1996 2001 2006
Census Year
Num
ber o
f Hou
seho
lds
Number of Upper IncomePurchasing Households
Number of Upper Income TenantHouseholds
Source: ABS Census 1996, 2001 and 2006
Housing: Mirror and Mould for Australian Society?
14/Academy of the Social Sciences 2008
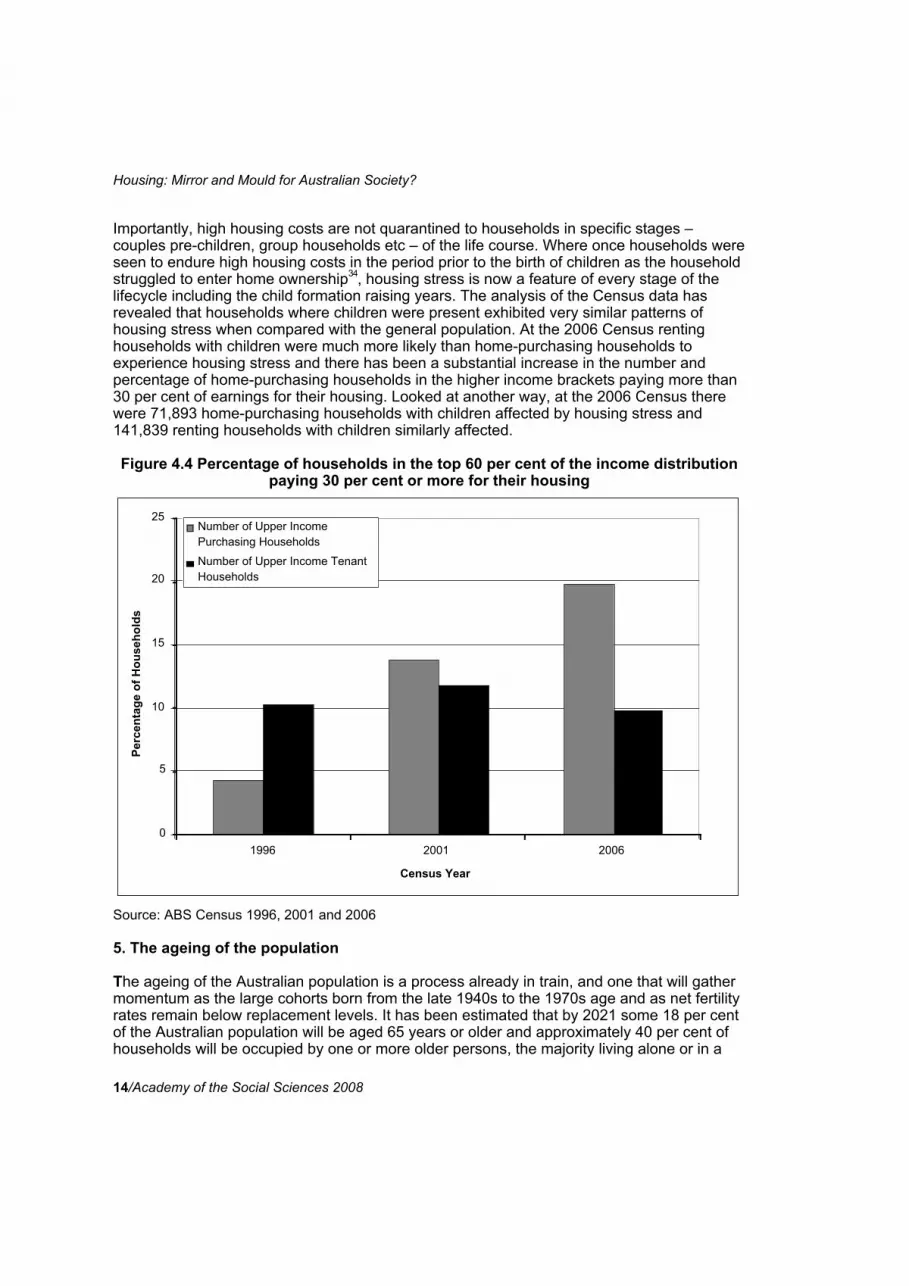
Importantly, high housing costs are not quarantined to households in specific stages –couples pre-children, group households etc – of the life course. Where once households wereseen to endure high housing costs in the period prior to the birth of children as the householdstruggled to enter home ownership34, housing stress is now a feature of every stage of thelifecycle including the child formation raising years. The analysis of the Census data hasrevealed that households where children were present exhibited very similar patterns ofhousing stress when compared with the general population. At the 2006 Census rentinghouseholds with children were much more likely than home-purchasing households toexperience housing stress and there has been a substantial increase in the number andpercentage of home-purchasing households in the higher income brackets paying more than30 per cent of earnings for their housing. Looked at another way, at the 2006 Census therewere 71,893 home-purchasing households with children affected by housing stress and141,839 renting households with children similarly affected.
Figure 4.4 Percentage of households in the top 60 per cent of the income distributionpaying 30 per cent or more for their housing
0
5
10
15
20
25
1996 2001 2006
Census Year
Perc
enta
ge o
f Hou
seho
lds
Number of Upper IncomePurchasing Households
Number of Upper Income TenantHouseholds
Source: ABS Census 1996, 2001 and 2006
5. The ageing of the population
The ageing of the Australian population is a process already in train, and one that will gathermomentum as the large cohorts born from the late 1940s to the 1970s age and as net fertilityrates remain below replacement levels. It has been estimated that by 2021 some 18 per centof the Australian population will be aged 65 years or older and approximately 40 per cent ofhouseholds will be occupied by one or more older persons, the majority living alone or in a
Housing: Mirror and Mould for Australian Society?
Academy of the Social Sciences 2008/15
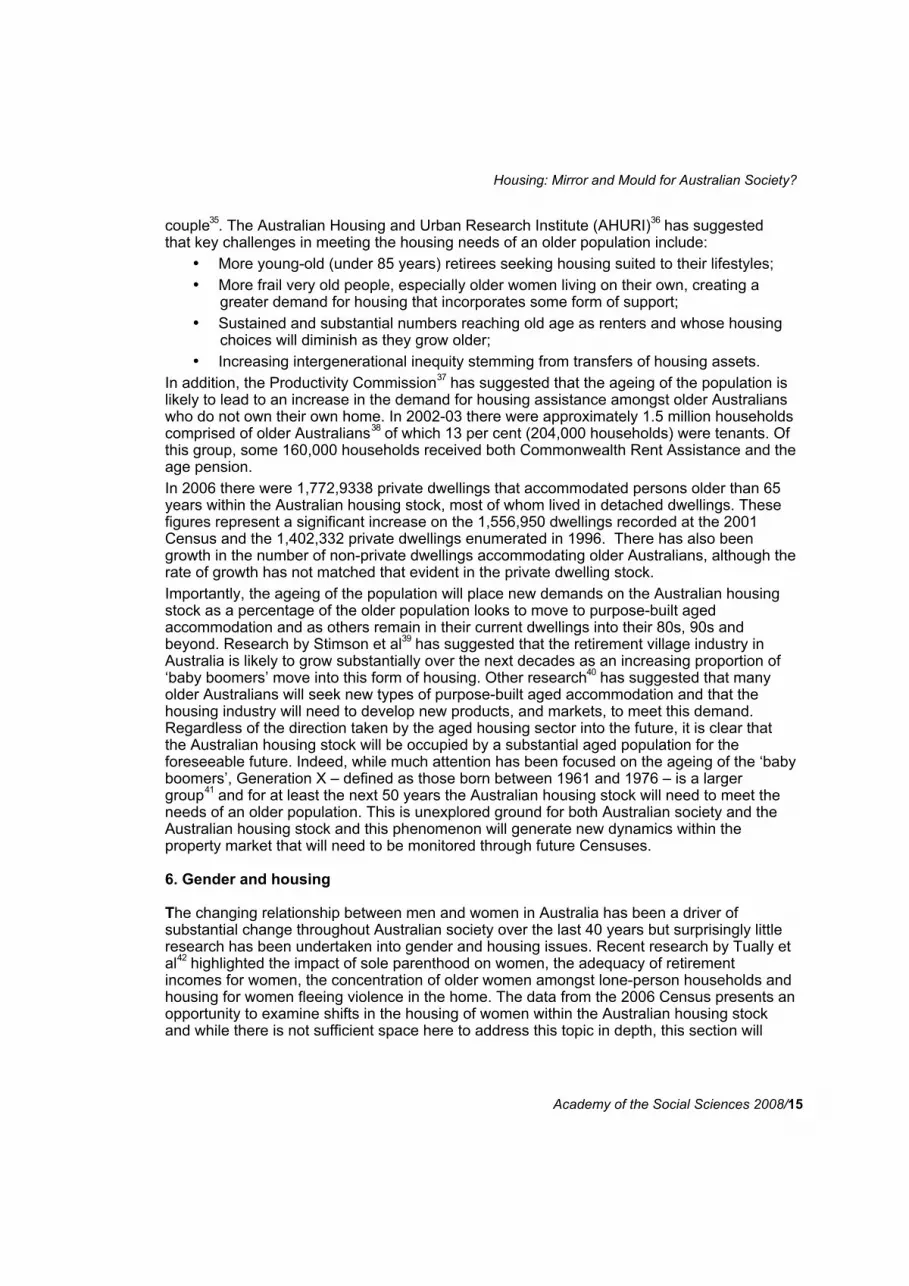
couple35. The Australian Housing and Urban Research Institute (AHURI)36 has suggestedthat key challenges in meeting the housing needs of an older population include:
• More young-old (under 85 years) retirees seeking housing suited to their lifestyles;• More frail very old people, especially older women living on their own, creating a
greater demand for housing that incorporates some form of support;• Sustained and substantial numbers reaching old age as renters and whose housing
choices will diminish as they grow older;• Increasing intergenerational inequity stemming from transfers of housing assets.
In addition, the Productivity Commission37 has suggested that the ageing of the population islikely to lead to an increase in the demand for housing assistance amongst older Australianswho do not own their own home. In 2002-03 there were approximately 1.5 million householdscomprised of older Australians38 of which 13 per cent (204,000 households) were tenants. Ofthis group, some 160,000 households received both Commonwealth Rent Assistance and theage pension.In 2006 there were 1,772,9338 private dwellings that accommodated persons older than 65years within the Australian housing stock, most of whom lived in detached dwellings. Thesefigures represent a significant increase on the 1,556,950 dwellings recorded at the 2001Census and the 1,402,332 private dwellings enumerated in 1996. There has also beengrowth in the number of non-private dwellings accommodating older Australians, although therate of growth has not matched that evident in the private dwelling stock.Importantly, the ageing of the population will place new demands on the Australian housingstock as a percentage of the older population looks to move to purpose-built agedaccommodation and as others remain in their current dwellings into their 80s, 90s andbeyond. Research by Stimson et al39 has suggested that the retirement village industry inAustralia is likely to grow substantially over the next decades as an increasing proportion of‘baby boomers’ move into this form of housing. Other research40 has suggested that manyolder Australians will seek new types of purpose-built aged accommodation and that thehousing industry will need to develop new products, and markets, to meet this demand.Regardless of the direction taken by the aged housing sector into the future, it is clear thatthe Australian housing stock will be occupied by a substantial aged population for theforeseeable future. Indeed, while much attention has been focused on the ageing of the ‘babyboomers’, Generation X – defined as those born between 1961 and 1976 – is a largergroup41 and for at least the next 50 years the Australian housing stock will need to meet theneeds of an older population. This is unexplored ground for both Australian society and theAustralian housing stock and this phenomenon will generate new dynamics within theproperty market that will need to be monitored through future Censuses.
6. Gender and housing
The changing relationship between men and women in Australia has been a driver ofsubstantial change throughout Australian society over the last 40 years but surprisingly littleresearch has been undertaken into gender and housing issues. Recent research by Tually etal42 highlighted the impact of sole parenthood on women, the adequacy of retirementincomes for women, the concentration of older women amongst lone-person households andhousing for women fleeing violence in the home. The data from the 2006 Census presents anopportunity to examine shifts in the housing of women within the Australian housing stockand while there is not sufficient space here to address this topic in depth, this section will
Housing: Mirror and Mould for Australian Society?
16/Academy of the Social Sciences 2008
examine housing affordability for two demographic groups where women are considered tobe especially vulnerable: lone parents and sole-person households.Lone parents are one of the groups of women considered to be at risk within the Australianhousing market43 because relationship breakdown often results in them occupying housingthat is insecure and/or unaffordable. For some women, the impacts of marital separation areexacerbated by the consequences of violence in the home. At the 2006 Census some208,611 lone-parent households were enumerated where the respondent reported both theirincome and housing costs. Women were in the overwhelming majority, comprising 80.5 percent of this group and some 26 per cent of lone-parent households had incomes in thebottom 40 per cent of the income distribution. Women paying more than 30 per cent of theirincome for their housing comprised 61 per cent of this group, while only eight per cent of menon low incomes spent more than 30 per cent of income on their housing.
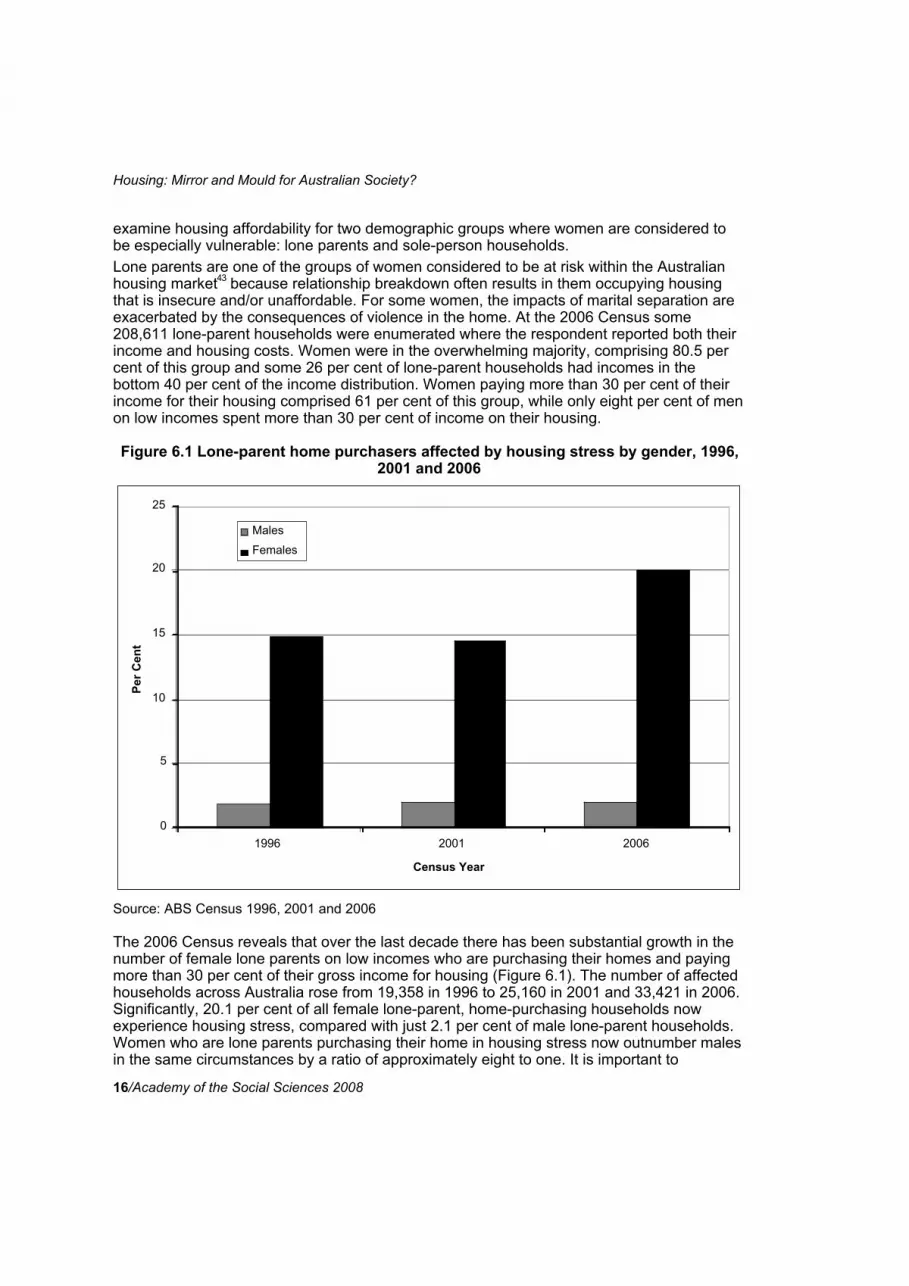
Figure 6.1 Lone-parent home purchasers affected by housing stress by gender, 1996,2001 and 2006
0
5
10
15
20
25
1996 2001 2006
Census Year
Per C
ent
Males
Females
Source: ABS Census 1996, 2001 and 2006
The 2006 Census reveals that over the last decade there has been substantial growth in thenumber of female lone parents on low incomes who are purchasing their homes and payingmore than 30 per cent of their gross income for housing (Figure 6.1). The number of affectedhouseholds across Australia rose from 19,358 in 1996 to 25,160 in 2001 and 33,421 in 2006.Significantly, 20.1 per cent of all female lone-parent, home-purchasing households nowexperience housing stress, compared with just 2.1 per cent of male lone-parent households.Women who are lone parents purchasing their home in housing stress now outnumber malesin the same circumstances by a ratio of approximately eight to one. It is important to
Housing: Mirror and Mould for Australian Society?
Academy of the Social Sciences 2008/17
acknowledge that this set of outcomes reflects profound drivers within the housing market: ina relationship breakdown where children are involved, women are more likely to be awardedthe family home in the Family Court settlement but may have few other financial resources,including access to well paid employment, superannuation or other savings. As noted before,relationship breakdown is now more common and in addition there is an increasingexpectation that female sole parents will remain in the paid labour market and not have theopportunity to live within public housing.
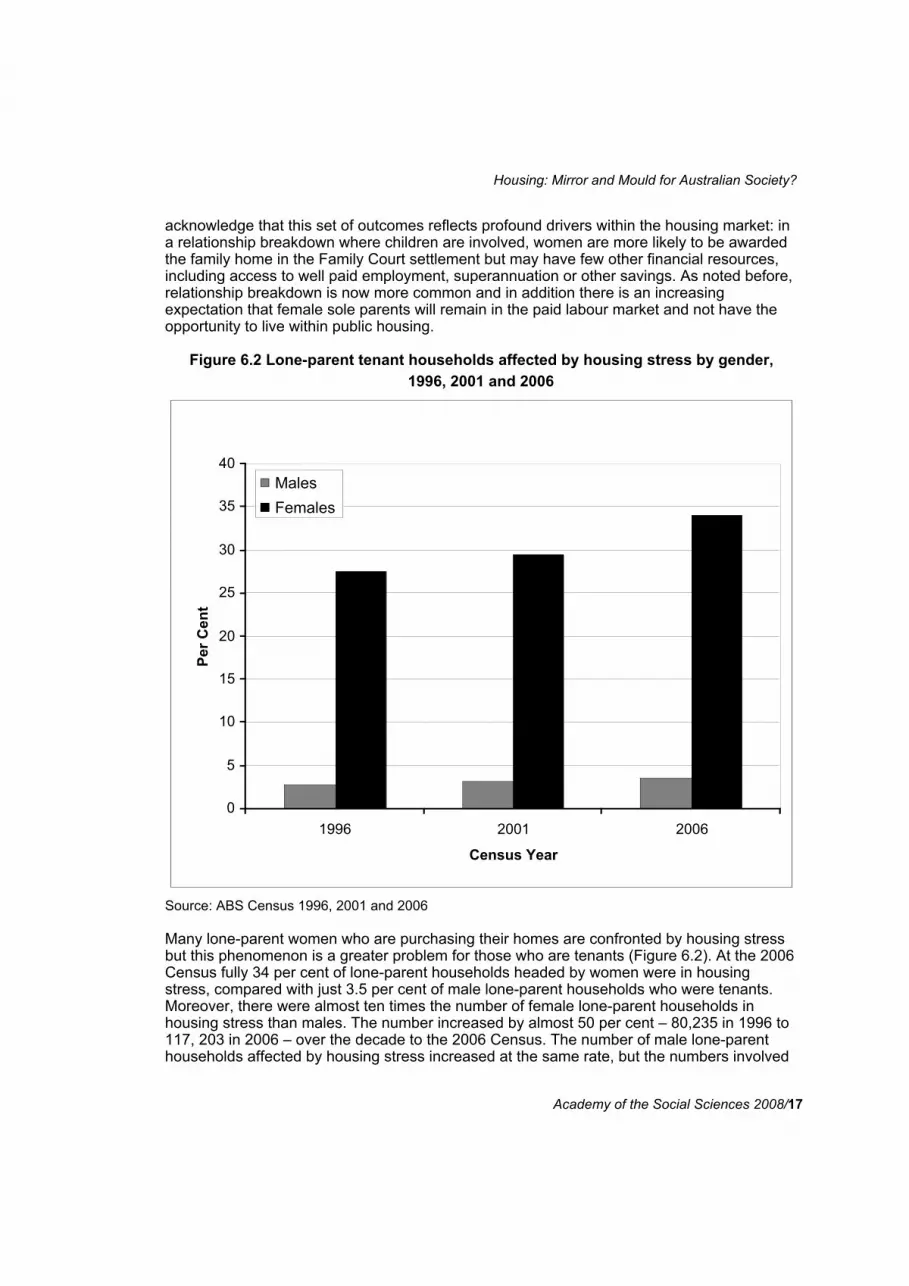
Figure 6.2 Lone-parent tenant households affected by housing stress by gender,1996, 2001 and 2006
0
5
10
15
20
25
30
35
40
1996 2001 2006
Census Year
Per C
ent
Males Females
Source: ABS Census 1996, 2001 and 2006
Many lone-parent women who are purchasing their homes are confronted by housing stressbut this phenomenon is a greater problem for those who are tenants (Figure 6.2). At the 2006Census fully 34 per cent of lone-parent households headed by women were in housingstress, compared with just 3.5 per cent of male lone-parent households who were tenants.Moreover, there were almost ten times the number of female lone-parent households inhousing stress than males. The number increased by almost 50 per cent – 80,235 in 1996 to117, 203 in 2006 – over the decade to the 2006 Census. The number of male lone-parenthouseholds affected by housing stress increased at the same rate, but the numbers involved
Housing: Mirror and Mould for Australian Society?
18/Academy of the Social Sciences 2008
were much lower. Interestingly, in 2006 there were fewer female-headed, lone-parenthouseholds in the top 60 per cent of the income distribution paying more than 30 per cent oftheir income in rent and this applied to both the number and percentage of female lone-parent households. These data highlight the increasing concentration of poverty amongstwomen: in 1996 there were 140,761 female-headed, lone-parent households in the lowest 40per cent of the national income distribution; by 2001 this number had risen to 170,840 and by2006 this figure stood at 216,822.Women living alone are a second group considered to be vulnerable within the Australianhousing stock as many are older women who have limited incomes and assets. They are agroup that has become more prominent within Australian society through the structuralageing of the population and increasing life expectancy. Clare44 has noted that many womenwho were over the age of 65 at the 2006 Census had little chance to accumulatesuperannuation savings earlier in life because of periods spent out of the paid labour force.The lower wages generally received by women when compared with men, and restrictedaccess to this form of savings prior to 1989, are also important. Many older women,therefore, who live alone are dependent on the age pension and have limited savings. Someare able to maintain an adequate standard of living because they are outright home owners,but others remain in the rental market where they may be confronted by the need to relocaterelatively frequently, limited control over their homes and high housing costs, especially in theprivate rental market.
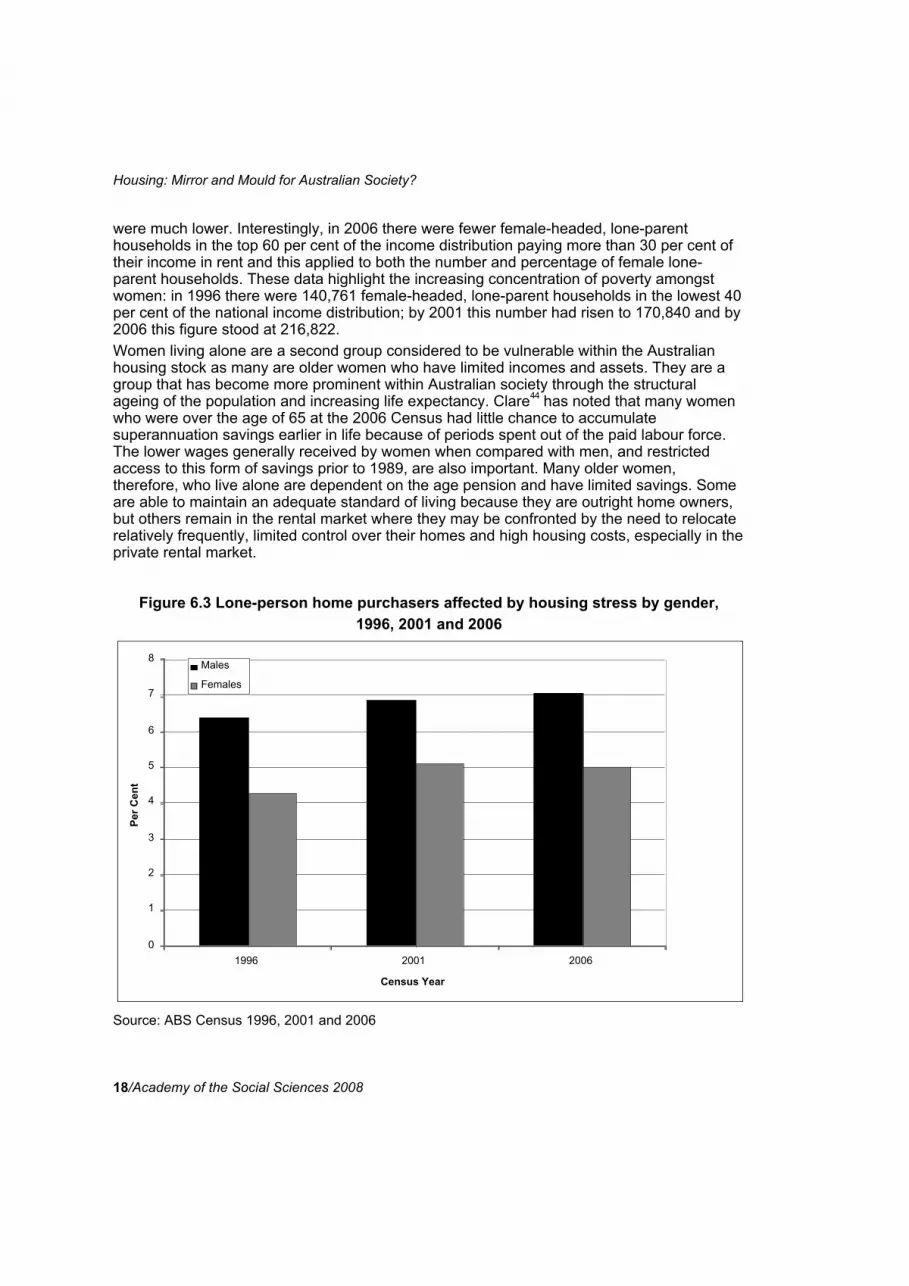
Figure 6.3 Lone-person home purchasers affected by housing stress by gender,1996, 2001 and 2006
0
1
2
3
4
5
6
7
8
1996 2001 2006
Census Year
Per C
ent
Males
Females
Source: ABS Census 1996, 2001 and 2006
Housing: Mirror and Mould for Australian Society?
Academy of the Social Sciences 2008/19
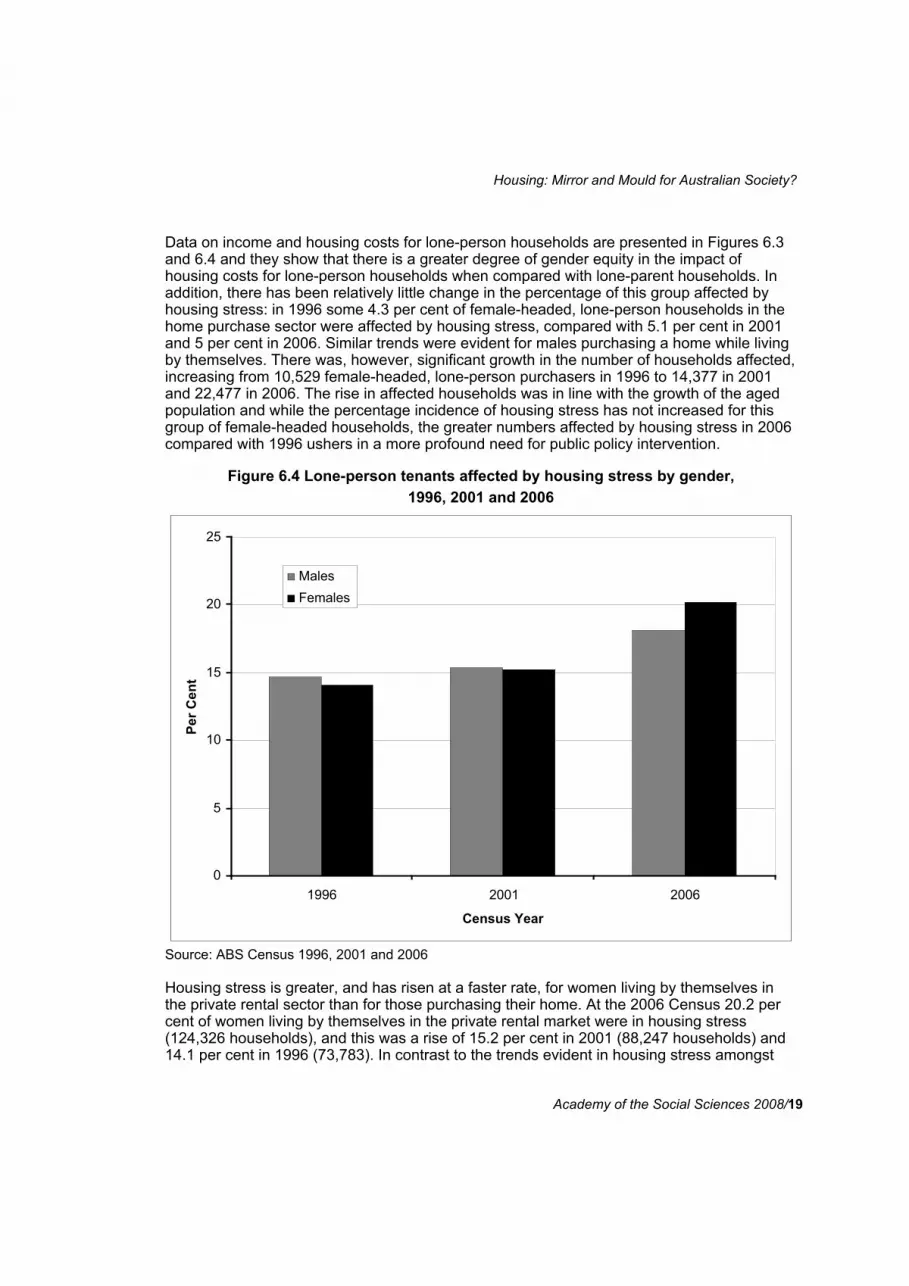
Data on income and housing costs for lone-person households are presented in Figures 6.3and 6.4 and they show that there is a greater degree of gender equity in the impact ofhousing costs for lone-person households when compared with lone-parent households. Inaddition, there has been relatively little change in the percentage of this group affected byhousing stress: in 1996 some 4.3 per cent of female-headed, lone-person households in thehome purchase sector were affected by housing stress, compared with 5.1 per cent in 2001and 5 per cent in 2006. Similar trends were evident for males purchasing a home while livingby themselves. There was, however, significant growth in the number of households affected,increasing from 10,529 female-headed, lone-person purchasers in 1996 to 14,377 in 2001and 22,477 in 2006. The rise in affected households was in line with the growth of the agedpopulation and while the percentage incidence of housing stress has not increased for thisgroup of female-headed households, the greater numbers affected by housing stress in 2006compared with 1996 ushers in a more profound need for public policy intervention.
Figure 6.4 Lone-person tenants affected by housing stress by gender,1996, 2001 and 2006
0
5
10
15
20
25
1996 2001 2006
Census Year
Per C
ent
Males Females
Source: ABS Census 1996, 2001 and 2006
Housing stress is greater, and has risen at a faster rate, for women living by themselves inthe private rental sector than for those purchasing their home. At the 2006 Census 20.2 percent of women living by themselves in the private rental market were in housing stress(124,326 households), and this was a rise of 15.2 per cent in 2001 (88,247 households) and14.1 per cent in 1996 (73,783). In contrast to the trends evident in housing stress amongst
Housing: Mirror and Mould for Australian Society?
20/Academy of the Social Sciences 2008
female lone-parents, the rate of increase in the incidence of housing stress is broadlycomparable for both genders, which suggests the impact of housing market processes alonerather than reflecting a combination of factors.
7. The housing of Indigenous Australians
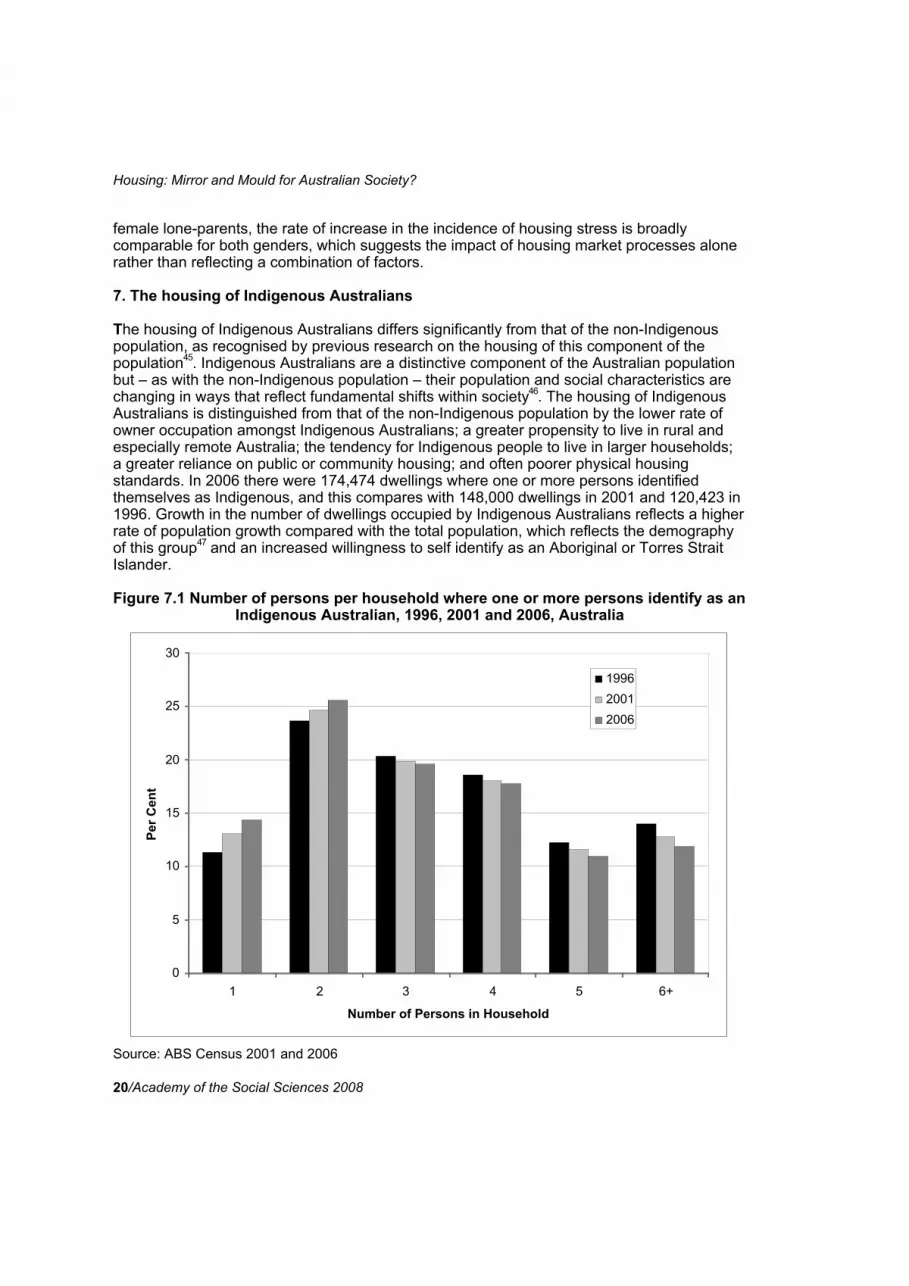
The housing of Indigenous Australians differs significantly from that of the non-Indigenouspopulation, as recognised by previous research on the housing of this component of thepopulation45. Indigenous Australians are a distinctive component of the Australian populationbut – as with the non-Indigenous population – their population and social characteristics arechanging in ways that reflect fundamental shifts within society46. The housing of IndigenousAustralians is distinguished from that of the non-Indigenous population by the lower rate ofowner occupation amongst Indigenous Australians; a greater propensity to live in rural andespecially remote Australia; the tendency for Indigenous people to live in larger households;a greater reliance on public or community housing; and often poorer physical housingstandards. In 2006 there were 174,474 dwellings where one or more persons identifiedthemselves as Indigenous, and this compares with 148,000 dwellings in 2001 and 120,423 in1996. Growth in the number of dwellings occupied by Indigenous Australians reflects a higherrate of population growth compared with the total population, which reflects the demographyof this group47 and an increased willingness to self identify as an Aboriginal or Torres StraitIslander.
Figure 7.1 Number of persons per household where one or more persons identify as anIndigenous Australian, 1996, 2001 and 2006, Australia
0
5
10
15
20
25
30
1 2 3 4 5 6+
Number of Persons in Household
Per C
ent
199620012006
Source: ABS Census 2001 and 2006
Housing: Mirror and Mould for Australian Society?
Academy of the Social Sciences 2008/21
At the 2006 Census 11 per cent of households where one or more persons identifiedthemselves as Indigenous were owned outright, 23 per cent were being purchased, 60 percent were tenants and the remainder lived in other types of tenure or did not state their tenurearrangements. This pattern was somewhat changed from 2001 where 12.8 per cent ofhouseholds were outright home owners, 19.4 per cent were purchasing their home, and 61.2per cent were tenants. Limitations in the available data mean that it is not possible to makecomparisons back to the 1996 Census, but the most recent Census provides evidence of anincreased rate of home purchase amongst the Indigenous population as with the non-Indigenous population. However, the home purchase rate for the Indigenous population isjust one third that for all Australians. At the 2006 Census fully 20 per cent of all Indigenoushouseholds rented from a state or territory government, the single largest landlord type forthis population group. Earlier research has noted the concentration of Indigenous householdsin public rental housing, though the level of representation in this tenure still does not matchneed48.
Figure 7.2 Number of persons per household where no persons identify as anIndigenous Australian, 1996, 2001 & 2006, Australia
0
5
10
15
20
25
30
35
40
1 2 3 4 5 6+
Number of Persons in Household
Per
Cen
t
1996
2001
2006
Source: ABS Census 2001 & 2006
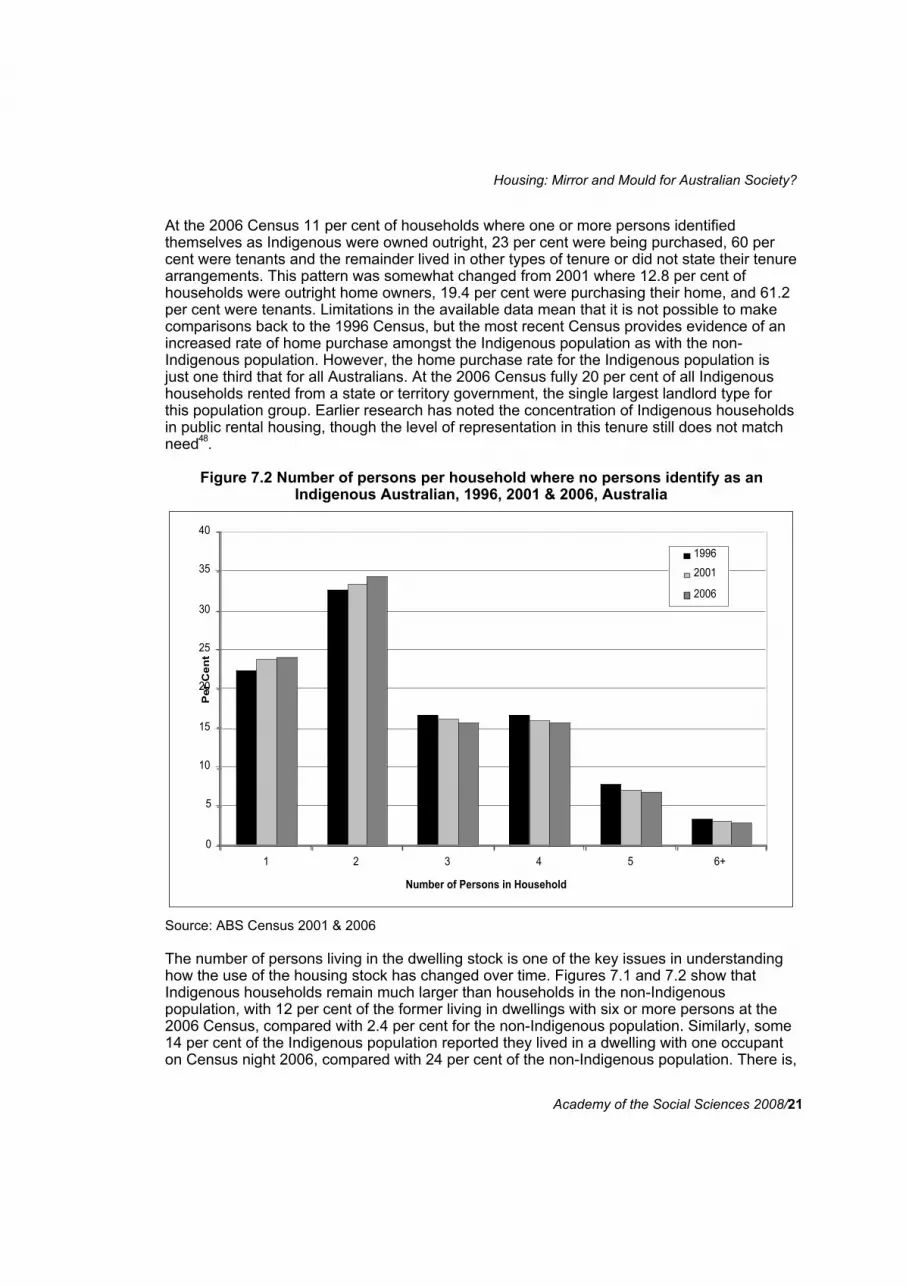
The number of persons living in the dwelling stock is one of the key issues in understandinghow the use of the housing stock has changed over time. Figures 7.1 and 7.2 show thatIndigenous households remain much larger than households in the non-Indigenouspopulation, with 12 per cent of the former living in dwellings with six or more persons at the2006 Census, compared with 2.4 per cent for the non-Indigenous population. Similarly, some14 per cent of the Indigenous population reported they lived in a dwelling with one occupanton Census night 2006, compared with 24 per cent of the non-Indigenous population. There is,
Housing: Mirror and Mould for Australian Society?
22/Academy of the Social Sciences 2008
however, some evidence of convergence over the decade as the households in whichIndigenous Australians live have fallen in size.Figures 7.1 and 7.2 (above) provide further evidence on the changing pattern of housingoccupancy amongst Indigenous Australians. Overcrowding has been one of the features ofIndigenous housing to attract policy and public attention over the last two decades. TheFigures clearly demonstrate that at the 2001 and 2006 Censuses Indigenous Australianslived in much larger households and at much higher densities than the total population. Forexample, at the 2006 Census fully 23.2 per cent of Indigenous households were comprised offive or more persons, compared with 10.1 per cent for the total population. Indigenoushouseholds also tend to live in smaller dwellings than the total population, with 28.1 per centof the total population living in dwellings of four bedrooms or more, compared with 24.7 percent of the Indigenous population. This trend to living in smaller dwellings is evident despitethe larger average household size and contributes to the problem of homes of inadequatesize for many Indigenous households.In addition, it is important to acknowledge that the Census data on place of usual residencedoes not fully reflect the impact of short-term movements across and within regions. There isa considerable literature49 that emphasises the episodic nature of much overcrowding and itis likely that there is more overcrowding amongst Indigenous households than is evident fromthe Census.
8. Conclusion
This paper began by suggesting that social, economic, demographic and policy change isplaying a major role in the reshaping of the relationship between Australians and theirhousing. The 2006 Census data clearly shows that there have been major changes in theway Australians live in, pay for and have built housing over the last decade. The Australianhousing stock is now called upon to perform a far greater set of roles for the Australianpopulation as the life course of individuals and households has become more complex overthe last three decades. The ageing of the population, the growth in divorce and relationshipbreakdown, growth in service sector employment with its emphasis on access to the CentralBusiness District, and the ongoing desire for owner occupation, has generated new social,economic and policy tensions, especially focused on housing affordability. Interestingly, manyof these new functions are still played out within stock that was built 20, 30 or even 50 yearsago, as the physical characteristics of the Australian housing stock have changed relativelylittle.This paper has shown that there have been substantial shifts in housing affordability withgrowth in both the number and percentage of low-income households affected by housingstress. This story is well known50 but little attention has been paid to the growth in the numberand percentage of households in the upper 60 per cent of the income distribution payingmore than 30 per cent of their income for housing. While it can be argued that thesehouseholds have the capacity to pay more for their accommodation, many have becomevulnerable to both a potential downturn in the economy, as well as the interest ratemovements evident through the latter part of 2006 and into the first part of 2008. Importantly,social, economic and policy change – including the growth in non-conforming lending, thereassessment of prudential margins by the major banks in the early part of this decade andtaxation reforms introduced in 2000 – have contributed to house price inflation and anaffordability crisis. Australia is now marked as a nation of both housing stress (amongst lowincome earners) and housing vulnerability (amongst those on higher incomes).
Housing: Mirror and Mould for Australian Society?
Academy of the Social Sciences 2008/23
As the 2006 Census shows, the contemporary Australian housing market reflects an array ofsocial, economic and demographic trends. At the same time, the housing market is reshapingAustralian society and moulding the future of our nation. The Census data examined throughthis paper provides a number of examples of how housing market circumstances arereshaping the everyday lives of Australians: the challenges of housing affordability haveplayed a role in the tendency for children to remain in the family home for longer, which inturn has encouraged the additions and renovations market which has served to push upprices. At the same time the decline of the public housing sector, in combination with the lowincomes and the high cost of renting privately, has contributed to the poverty evidentamongst female lone parents, which in turn has contributed to on-going gender inequalitywithin Australian society. The housing of many Indigenous Australians lags behind that of thegeneral population in terms of access to home ownership, security of tenure and theincidence of overcrowding. While these outcomes reflect general social and economicconditions, the housing of Indigenous Australians further reinforces disadvantage because asa group they have reduced access to the capital gains often associated with home ownershipand they are more likely to live in insecure rental housing which has the capacity to imposeadditional costs on the household. In addition, overcrowding has implications for the health ofresidents and the educational achievements of children – both of which affect long termearnings and well being. Importantly, there is some evidence to suggest improvements in thehousing outcomes of the Indigenous population.Finally, it is worth acknowledging the need for an on-going examination of housing inAustralia. Housing remains one of the most important asset classes within the Australianeconomy51 and an important determinant of the welfare of the population. It is thereforeimportant to continue to scrutinise housing trends and outcomes and the Census provides animportant vehicle for this analysis. Hopefully this paper represents a preliminary step in amore detailed examination of the 2006 Census data. Ideally this process will engage allmembers of the community and provide industry, government, non-government organisationsand consumers with the capacity to shape a better future for housing in Australia.
Andrew Beer is the Director of the Flinders Institute forHousing, Urban and Regional Research and has previouslyserved as the Director of the Southern Research Centre,Australian Housing and Urban Research Institute. Andrew iscurrently a Board member of the Regional StudiesAssociation and was previously a Leverhulme Fellow at theUniversity of Ulster and a Visiting Research Fellow at theUniversity of Plymouth. Over the past 15 years he hasundertaken a range of research projects on housingaffordability, regional housing, disability and housing, andhousing transitions. Professor Beer has also consulted widelywith a range of government and non-governmentorganisations.
Housing: Mirror and Mould for Australian Society?
24/Academy of the Social Sciences 2008
1 Many thanks to Mrs Cecile Cutler for assistance with the proofreading of this manuscript and Mrs
Louise O’Loughlin with its typing. Many thanks also to Professor Jeff Borland and Professor AnneEdwards for their very helpful comments on an earlier draft of this paper.
2 Allon, F (2008). Renovation Nation, University of New South Wales Press, Kensington.3 Thanks to Professor Chris Paris for this insight.4 Badcock, B and Beer, A (2000). Home Truths, Property Ownership and Housing Wealth in Australia,
Melbourne University Press, Melbourne.5 Beer, A and Faulkner, D (forthcoming). 21st Century Housing Careers and Australia’s Housing
Future, Final Report, AHURI, Melbourne.6 Beer, A, Faulkner, A and Gabrielle, M (2006). 21st Century Housing Careers and Australia’s Housing
Future, Literature Review, AHURI, Melbourne.7 Hugo, G (2005). ‘Implications of demographic change for future housing demand in Australia’,
Australian Planner, 42:2: 33-41.8 Department of Communities and Local Government (2008).
http://www.communities.gov.uk/housing/housingresearch/housingsurveys/englishhousecondition/introduction/ Accessed 30 April 2008.
9 McDonald, P (2003). Medium and Long Term Projections of Housing Needs in Australia: FinalNarrative Report, AHURI, Melbourne.
10 McDonald, P (2004). Projected Housing Demand in Australia to 2011, Research and Policy Bulletin,AHURI, Melbourne.
11 Eslake, S (2008). Housing Wealth, An Economist’s Perspective, Presentation to the NationalHousing Conference, Sydney, 22 February; BIS Shrapnel 2008 Long Term Forecasts , BIS Shrapnel,Sydney.
12 Yates, J and Milligan, V (2007). Housing Affordability: A 21st Century Problem, Final Report, AHURI,Melbourne.
13 Hall, T (2007). Where Have all the Gardens Gone? An Investigation into the Disappearance ofBackyards in the Newer Australian Suburb, Urban Research Program, Research Paper 13, GriffithUniversity, Brisbane.
14 Australian Bureau of Statistics (ABS) 2003 Australian Social Trends, 2003, ABS, Canberra.15 Beer, Faulkner and Gabrielle, (2006) op cit .16 Australian Bureau of Statistics (ABS) 2006 Census, ABS, Canberra.17 Beer and Faulkner (forthcoming), op cit .18 Mowbray, M and Stubbs J (1996). ‘Manufactured housing estates: extending housing options or
benchmarking cities?’ Urban Policy and Research, 14,2: 129-43; Greenhalgh, E (2002). ‘Principalplace of residence? Long term caravan park residents in Australia’, Unpublished Masters Thesis,University of Queenland.
19 Bunce, D (forthcoming). ‘Retirement housing choices: the decision to reside in a residential park’,Unpublished Masters Thesis, School of Geography, Population and Environmental Management,Flinders University.
20 This includes families comprised of couple-only households.21 Pender, H (1992). ‘Public policy and the cost of capital for business and investment’, Capital Income
Taxation in Australia, EPAC Background Paper No. 20, AGPS, Canberra.22 Office of Regional Development (2003). Regional Workforce Accommodation Solutions Study, ORA,
Adelaide; Beer, A (2004). ‘On wine, rent and regions’, European Planning Studies, 12,1: 57-83.23 Wood, G, Watson, R and Flatau, P (2003). A Microsimulation Model of the Australian Housing
Market with Applications to Commonwealth and State Policy Initiatives, Final Report, AHURI,Melbourne.
24 Stephens, M (2007). ‘Mortgage market deregulation and its consequences’, Housing Studies, 22,2:201-220.
25 Beer, A, Kearins, B and Pieters, H (2007). ‘Housing affordability and planning in Australia’, HousingStudies, 22,1: 11-24.
26 Paris, C (1993). Housing Australia, McMillan, South Melbourne.
Housing: Mirror and Mould for Australian Society?
Academy of the Social Sciences 2008/25
27 Oldsberg, D and Winter, M (2005). Ageing in Place: Intergenerational and Interfamilial HousingTransfers Later in Life, Final Report, AHURI, Melbourne.
28 Yates and Milligan, (2007) op cit.29 Productivity Commission (2004). First Home Ownership, Inquiry Report No. 28, Productivity
Commission, Melbourne.30 Yates and Milligan, (2007) op cit.31 Gabrielle, M, Jacobson, K, Arthurson, K, Burke, T and Yates, J (2007). Conceptualising and
Measuring the Housing Affordability Problem, AHURI, Melbourne.32 Burke, T, Pinnegar, S, Phibbs, P, Neske, C, Gabrielle, M, Ralston, L and Rumming, K (2007).
Experiencing the Housing Affordability Problem: Blocked Aspirations, Tradeoffs and FinancialHardship, AHURI, Melbourne.
33 Tanton, R, Nepal, B and Harding, A (2008). Wherever I Lay My Debt, That’s My Home, AMPNATSEM Income and Wealth Report, No. 19, NATSEM, Canberra.
34 Kending, H (1981). Buying and Renting, Household Moves in Adelaide, Australian Institute for UrbanStudies, Canberra.
35 Australian Housing and Urban Research Institute (2004).36 Ibid.37 Productivity Commission (2003). Economic Implications of an Ageing Australia, Productivity
Commission, Melbourne.38 Australian Bureau of Statistics (ABS) 2005 Australian Social Trends, 2005, ABS, Canberra.39 Stimson, RJ (ed) (2002). The Retirement Village Industry in Australia: Evolution, Prospects,
Challenges, University of Queensland Press for the Centre for Research into Sustainable Urban andRegional Futures, Brisbane: 251.
40 Faulkner, D, Beer, A and Cutler, C (2007). Aspirations and Expectations of Older Age Cohorts inSouth Australia, Southern Research Centre, Adelaide.
41 Beer, Faulkner and Gabrielle, op cit.42 Tually, S, Beer, A and Faulkner, D (2007). Too Big To Ignore: Future Issues for Australian Women's
Housing 2006-2025, Report prepared for the Women’s Housing Caucus of SA, Southern ResearchCentre, Adelaide, September,<http://www.socsci.flinders.edu.au/ahuri.src/publications/2007/toobigtooignore.php>
43 Ibid.44 Clare, R (2007). Are Retirement Savings on Track? ASFA Research & Resource Centre, The
Association of Superannuation Funds of Australia, Sydney, June.45 Birdsall-Jones, C and Corunna, V (2008). The Housing Careers of Indigenous Urban Households,
Final Report, AHURI, Melbourne; Roberts, D, Fuller, D, Bradley, H, Hugo, G, Coffee, N and Gollan,S (2005). The Emerging Housing Needs of Indigenous South Australians, Southern ResearchCentre, Adelaide.
46 Hugo, G (2007). ‘New questions in the 2006 population census: some initial findings, People andPlace, 15,3: 53-56.
47 Ibid.48 Flatau, P, McGrath, N, Cooper, L, McGrath, N, Edwards, D, Hart, D, Morris, M, Lacroix, C, Adam, M,
Marinova, D, Beer, A, Tually, S and Traee, C (2005). Indigenous Access to Mainstream Public andCommunity Housing, Final Report, AHURI, Melbourne.
49 Birdsall-Jones & Corunna, (2008) op cit .50 Yates and Milligan, (2007) op cit; Beer, Kearins and Pieters, (2007) op cit ; Tanton, Nepal and
Harding, (2008) op cit.51 Schwartz, C, Hampton, T, Lewis, C and Norman, D (2006). A Survey of Housing Equity Withdrawal
and Injection in Australia, Research Discussion Paper 2006-08, Reserve Bank of Australia, Sydney.