j ourna l homepage: www.e lsev ie r .com/ locate /env int
Evaluation of pharmaceuticals in surface water: Reliability of PECscompared to MECs
Hélène Celle-Jeanton a,b,c,⁎, Dimitri Schemberg d, Nabaz Mohammed a,b,c,e, Frédéric Huneau f,g,Guillaume Bertrand h, Véronique Lavastre a,b,i, Philippe Le Coustumer e
a Clermont Université, Université Blaise Pascal, Laboratoire Magmas et Volcans, BP 10448, F-63000 Clermont-Ferrand, Franceb CNRS, UMR 6524, LMV, 63038 Clermont-Ferrand, Francec IRD, R 163, LMV, 63038 Clermont-Ferrand, Franced Agence Régionale de Santé d'Auvergne, 60 Avenue de l'Union Soviétique, 63057 Clermont-Ferrand Cedex 1, Francee Université de Bordeaux, EA 4592 Géoressources & Environnement, ENSEGID, 1 allée F. Daguin, F-33607 Pessac, Francef Université de Corse Pascal Paoli, Faculté des Sciences et Techniques, Laboratoire d'Hydrogéologie, Campus Grimaldi, BP 52, 20250 Corte, Franceg CNRS, UMR 6134, SPE, 20250 Corte, Franceh University of Sao Paulo, Instituto de Geosciências, Centro de Pesquisas de Água Subterrânea, Rua do lago, 562 Cidade universitaria, 05508-80, Sao Paulo, Brazili Université de Lyon, Université Jean Monnet, 23 rue du Dr. Michelon, 42023 Saint Etienne, France
Due to the current analytical processes that are not able to measure all the pharmaceutical molecules and to thehigh costs and the consumption of time to sample and analyzePhACs,models to calculate Predicted EnvironmentalConcentrations (PECs) have been developed. However a comparison betweenMECs and PECs, taking into accountthemethods of calculations and peculiarly the parameters included in the calculation (consumption data, pharma-cokinetic parameters, elimination rate in STPs and in the environment), is necessary to assess the validity of PECs.MEC variations of sixteen target PhACs [acetaminophen (ACE), amlodipine (AML), atenolol (ATE), caffeine (CAF),carbamazepine (CAR), doxycycline (DOX), epoxycarbamazepine (EPO), fluvoxamine (FLU), furosemide (FUR), hy-drochlorothiazide (HYD), ifosfamide (IFO), losartan (LOS), pravastatin (PRA), progesterone (PROG), ramipril(RAM), trimetazidine (TRI)] have been evaluated during one hydrological cycle, from October 2011 to October2012 and compared to PECs calculated by using an adaptation of the models proposed by Heberer and Feldmann(2005) and EMEA (2006). Comparison of PECs andMECS has been achieved for sixmolecules: ATE, CAR, DOX, FUR,HYD and PRA. DOX, FUR and HYD present differences between PECs and MECs on an annual basis but their tem-poral evolutions follow the same trends. PEC evaluation for these PhACs could then be possible but need some ad-justments of consumption patterns, pharmacokinetic parameters and/or mechanisms of (bio)degradation. ATE,CAR and PRAarewellmodeled; PECs can thenbeusedas reliable estimation of concentrationswithout any reserve.
The presence of pharmaceuticals in the aqueous environment isgenerally related to anthropogenic processes (Vystavna et al., 2012):industrial discharges, animal manure, wastewater treatment discharge,waste and runoff of unused drugs discharged in domestic waste landfillor in sewage water. Results of previous studies argue that wastewatersare the main sources of pharmaceuticals in the aquatic environment(Bendz et al., 2005; Clara et al., 2004; Comeau et al., 2008; Heberer,2002; Hirsch et al., 1999; Joss et al., 2006; Lee et al., 2005; Lindqvistet al., 2005; Ternes, 1998); the most contaminated are hospital
wastewaters (Steger-Hartmann et al., 1997) as they content high con-centrations of medicines. When administered to a human, a part ofmedicine drugs is excreted unchanged or metabolized in urine andfeces and reaches the environment via sewage. A particular attentionmust be paid to the contamination of surface waters as they are partlyused for drinking water supplies, or are in connection with alluvial sys-tems that are used for these purposes, because they directly collect par-tially untreated wastewaters from Sewage Treatment Plants (STPs)and/or the leakage of septic tanks (Ternes et al., 1999). The concentra-tions of pharmaceuticals in surface water thus depend on various fac-tors: consumption of medicines in the water catchment area of awater body, absorption and elimination rates of the pharmaceuticalsfrom the organism, elimination rate in the STPs, the volume of surfacewater, and elimination rate in the environment (Ter Laak et al., 2010).In addition, the proportion of sewage treated before discharge in the
11H. Celle-Jeanton et al. / Environment International 73 (2014) 10–21
environment and the disposal modes of unused drugs can be added(Ortiz de Garcia et al., 2013). Many of these emerging contaminantsraise considerable toxicological and public concern, especially whenhuman health based guideline values are unavailable (Schriks et al.,2010). If exposures to humans are below the predicted no effect con-centrations, potential interactions among trace levels of individualpharmaceuticals are difficult to evaluate and still require risk assess-ment techniques to quantify any potential risk to human health(Schwab et al., 2005).
The presence of pharmaceutical products in the aquatic environ-ment is known since the 70s. However, the interest of the scientificcommunity on the pharmaceutical has really grown during the twolast decades due to their continuous increased use (consumption inFrance has been multiplied by 200 since the 80s (Dulio et al., 2009))and to the evolution of analytical techniques that enough improved toallowquantifying the presence of these substances inwaters, even at re-ally low concentrations. Then numerous publications deal with theMeasured Environmental Concentrations (MECs) of pharmaceuticalsthat have been detected with levels which can go from ng/L to μg/L insurface waters of Austria (Clara et al., 2004), Canada (Comeau et al.,2008), Finland (Lindqvist et al., 2005), France (Togola and Budzinski,2008; Vystavna et al., 2012), Germany (Nödler et al., 2011; Ternes,1998), Greece (Arditsoglou and Voutsa, 2008), Italy (Zuccato et al.,2005), India (Larsson et al., 2007), Japan (Nakada et al., 2008), Korea(Choi et al., 2008), Norway (Grund et al., 2008), Romania (Moldovan,2006), Spain (Joss et al., 2006), Sweden (Bendz et al., 2005),Switzerland (Tauxe-Wuersch et al., 2005), Ukraine (Vystavna et al.,2012), USA (MacLeod et al., 2007), and Western Balkans (Terzić et al.,2008), … in groundwater (Barnes et al., 2008; Fram and Belitz, 2011;Lopez-Serna et al., 2013; Müller et al., 2011; Reh et al., 2013; Vullietand Cren-Olivé, 2011, …), as well as in drinking and tap waters(Heberer, 2002; Kuster et al., 2008; Schwab et al., 2005; Vulliet andCren-Olivé, 2011; Valcárcel et al., 2011; …). Nevertheless, due to thecurrent analytical processes that are not able tomeasure all the pharma-ceutical molecules, to the number and the variability of molecules thatmay enter the environment, to the high costs and the consumption oftime to sample and analyze this molecules, and to the requirements ofCommission Directive 93/67/EEC, 1993; Commission Regulation,1488/94/EC, 1994 and Commission Directive 98/8/EC, 1998, models tocalculate Predicted Environmental Concentrations (PECs) have been de-veloped (Castiglioni et al., 2004; Henshel et al., 1997; Stuer-Lauridsenet al., 2000). If PECs provide important information for the prioritizationof pharmaceutical products for environmental strategies, approxima-tions introduced in the calculations lead to uncertainties (Coetsieret al., 2009). Then a comparison betweenMECs and PECs, taking into ac-count themethods of calculations and peculiarly the parameters includ-ed in the calculation, is necessary to assess the validity of predictedconcentrations. Most of the studies present a comparison betweenMECs and PECs calculated by using national consumption data (Besseet al., 2008; Coetsier et al., 2009; Heberer and Feldmann, 2005; Johnsonet al., 2007; Ort et al., 2010; Ortiz de Garcia et al., 2013; Ter Laak et al.,2010; Vystavna et al., 2012), only few of them use local consumption(Oosterhuis et al., 2013) despite the fact that local patterns can highlymodify the estimations. Our study is a new attempt to compare PECs andMECs for a local site,where patterns of consumption differ from the nation-al ones, and to evaluate the reliability of PECs. Analyses of 47 PhACs(Pharmaceutical Active Compounds) have been achieved on samplescollected on a monthly basis from the Allier River between October2011 and October 2012. Among these, 16 have been selected for theybelong to the priority list of the AFSSAPS (French Agency of SanitarySafety of Food and Health Products, 2008): acetaminophen (ACE),amlodipine (AML), atenolol (ATE), caffeine (CAF), carbamazepine(CAR), doxycycline (DOX), epoxycarbamazepine (EPO), fluvoxamine(FLU), furosemide (FUR), hydrochlorothiazide (HYD), ifosfamide(IFO), losartan (LOS), pravastatin (PRA), progesterone (PROG), ramipril(RAM), and trimetazidine (TRI).
2. Material and methods
2.1. Site settings
This studywas performed in central France, in theAllier River, locatedin the Allier basin covering a surface of 14,310 km2 (Fig. 1). In this region,the climate is subjected to high spatial variability due to altitude varia-tions from 167 to 1423 m.a.s.l. and to the mixed influences of both oce-anic and continental climate as well as Mediterranean incomes in thesouthern part. Rainfall presents an average of 800 mm/year and isoften different from year to year and even from one location to another.These variations strongly influence the Allier River, the main tributary ofthe Loire River, which flows roughly South toward North with a totallength of 410 km long and assumes a pluvial regime with high flow dur-ing autumn/spring and low flow during winter/summer. Concerning,land occupations, the upper Allier basin is poorly occupied in terms of in-habitants and mainly comports grasslands and forestry zones whereasthe basin's alluvial plain is used primarily for animal husbandry and ag-riculture (maize and cereal) which occupies about 71% of the land cover,forest and grassland (24%) and urban areas (5%). The sampling site(45°45′16.20″, 3°13′9.43″, z = 320 m) is located on the Allier River,about 20 km from the east of the city Clermont–Ferrand and is directlyconnected to an alluvial aquifer used for the drinking water supply ofabout 100,000 inhabitants. 378 STPs, but only 18 serving more than2000 inhabitants, have been recognized in the Allier Watershed abovethe sampling site. The nearest STP is Cournon's one, 4.2 km upstreamto the station, which is dedicated to the treatment of wastewaters of36,000 inhabitants living in the Auzon watershed. The treatment pro-cesses consist of an activated sludge with prolonged aeration andnitrification/denitrification added to phosphate removal. The STP's efflu-ent discharges in the Auzon River 300 m upper the connection betweenAuzon River and Allier River. It is assumed that this station contributesfor a great part to the concentrations measured in the sampling site.
2.2. Sampling methodology and analytical procedure of MECs
Fourteen campaigns have been achieved, every 4 weeks, at the sam-pling site of the Allier River from October 2011 to October 2012. Grabwater samples have been collected in pre-rinsed bottles of green glass,kept cool in an ice-box and immediately transported to the EUROFINS-Coeur de France laboratory (Moulins, France) where analyses havebeen performed. In total, 705 measurements have been achievedthrough the following methods.
Each sample was analyzed for 47 pharmaceuticals by Rapid Resolu-tion Liquid Chromatography coupled with a tandemmass spectrometer(RRLC/MSMS) after Solid-Phase Extraction (SPE).
For the SPE, 1 L ofwater sample added to 10 μL of amixing of isotopictracers (caffeine-D3, ibuprofen-D3 and acetaminophen-D4) has beenloaded at 3 mL/min approximately onto Oasis HLB cartridges previouslyconditioned with 3 mL methanol, then 3 mL Ultra-pure grade water.Cartridges have then been dried 30 min under vacuum and elutedwith 3 × 0.5 mL methanol (70%)/acetonitrile (30%). Then, the eluatehas been dried with an air stream to 100 μL and reconstituted in 1 mLUltra-pure grade water.
Chromatographic separation was performed on a UPLC Agilent 1260system coupled with an electrospray ion source triple-quad massspectrometer (AB Sciex API5500). The chromatographic separation wasperformed on a UPLC C18 Acquity HSS T3 (100 × 2.1 mm, 1.8 μm)column. The column oven temperature was set to 40 °C, injection vol-ume was 20 μL, and flow rate was of 350 μL/min. The gradient programis indicated in Table 1.
The mass spectrometry analysis was achieved in the negative ionmode for FUR, HYD, and PRA, and in the positive ion mode for othercompounds. The multiple reaction monitoring mode (MRM) waschosen for quantification, measuring the fragmentation products ofthe protonated or deprotonated pseudo-molecular ions of each
Fig. 1 Location of the study site within the Allier Basin.
12 H. Celle-Jeanton et al. / Environment International 73 (2014) 10–21
pharmaceuticals and internal standards. Each compound has beenquantified by MRM, using the two highest characteristic precursorion/product ion transitions. Comparison of the retention times withthe corresponding reference standards also helped identify the com-pounds. The internal standards were caffeine-D3 and acetaminophen-D4 to quantify the pharmaceuticals analyzed in the positive ion mode,and ibuprofen-D3 for compounds analyzed in the negative ion mode.
The method performance has been evaluated through the followingprocedures. Extracts from Ultra-pure grade water before and after SPEhave been used as blanks. Analyte extraction recoveries have beendetermined at 10 ng/L using raw water samples, before and after SPE
step. Moreover three deuterated standards were used as internal stan-dard: caffeine-D3, ibuprofen-D3 and acetaminophen-D4. Calibrationstandards (1, 2, 5, 10, 50, 100, 500 μg/L) were injected, with isotopicallylabeled compounds at 10 μg/L. Seven point calibration curveswere usedfor the final quantification. Table 2 gives the corresponding electrospraymode, SPE recovery and LQ (Limit of Quantification) for eachpharmaceutical.
3. Calculations of PECs
3.1. Consumption data
The CPAM (social health care system of Puy-de-Dôme) providedmonthly data on subsidized pharmaceutical molecules in Auzon watercatchment. This dataset concerns 91% of the total inhabitants of theAuzon basin (43,833 covered by the national social insurance over atotal of 47,930 inhabitants) and comprises the number of packagessubsidized by the CPAM which have been bought from October 2011to October 2012 (Table 3). Medicines dispensed in hospitals (IFO) andCAF, mainly due to the consumption of coffee, tea and soft drinks in-stead of its pharmaceutical compound (Camacho-Munoz et al., 2010)are not included in these datasets.
Table 2Analytical method performance.
Name CAS number Electrospray mode SPE recovery (%) LQ(ng·L−1)
13H. Celle-Jeanton et al. / Environment International 73 (2014) 10–21
3.2. Determination of pharmacokinetic parameters
When consumed, PhACs can be absorbed by the digestive tract: afraction will be eliminated directly by feces while the other will passinto the body. The absorption rate depends on the route of administra-tion. The fraction which is not absorbed is eliminated unchanged. Thefraction absorbed can then pass through several metabolization process-es that can be summarized into two steps: phase I and phase II reactions.Phase I reactions correspond to oxidations (hydroxylation, N or S-oxidation, etc.) and give metabolites that are different from the parentcompounds. These metabolites can show a pharmacological activity.Phase II reactions correspond to conjugations with functional groupswhich enhance elimination from the body and lower the pharmacologi-cal activity of the parent compounds. The main groups are glucuronideand sulfate whose conjugated metabolites are susceptible to be cleavedin the sewage water and regenerate parent compounds (Heberer andFeldmann, 2005), even if sulfate ones appears to be more stable(Johnson et al., 2007; Kumar et al., 2012). Glucuronide and sulfate conju-gates should then be considered together with the excreted unchangedparent compound in order to calculate excretion rate.
Pharmacokinetic parameters (absorption, excretion unchanged andglucuro- or sulfato-conjugated, Table 3) have been determined througha general review that includes www.theriaque.org (official French sum-maries of products characteristics), www.drugs.com,www.drugbank.caand literature review (Besse and Garric, 2008; Besse et al., 2012;Carballa et al., 2008; Heberer and Feldmann, 2005; Oosterhuis et al.,2013; Ortiz de Garcia et al., 2013). Injected products were logically setto an absorption rate of 1.When no data is available, themost conserva-tive parameters are taken: absorption and excretion rates are set equalto 1. For some molecules, excretion rates include glucuro-conjugatesbut do not consider sulfato-conjugates, eventually leading to an under-estimation of excretion.
3.3. Determination of Fstp (elimination rate in STPs) and environmentalparameters
The elimination rates of each PhAC for various type of STPs (Table 3)were reviewed in the literature (Besse and Garric, 2008; Besse et al.,2012; Carballa et al., 2008; Heberer and Feldmann, 2005; Joss et al.,2006; Miege et al., 2009; Oosterhuis et al., 2013; Ortiz de Garcia et al.,2013; Soulier et al., 2011; Vieno et al., 2007). When no data was avail-able, the most conservative value was taken: the elimination rate wasset equal to 0 (i.e. the molecule is not eliminated at all by STP).
The dailyflow rates of the Allier andAuzonRivers have been extract-ed from www.hydro.eaufrance database (French Ministry of Ecologyand Sustainable Development).
3.4. Model used to calculate PECs
The model used in this publication is adapted from the models pro-posed by Heberer and Feldmann (2005) and EMEA (2006).
It was assumed that the entire amount of each product subsidizedwas consumed and that the consumption profile of the 91% of Auzonbasin inhabitants covered by national health insurance can be appliedto the entire population. Amounts of each PhACmonthly excretedwith-in the Auzon catchment are calculated by Eq. (1):
mAuzon;x ¼X
bj � uj �mj � 1−aj
� �þ aj � e
h ið1Þ
where,mAuzon is the total amount of the PhAC excreted during themonthx in the Auzon catchment, bj is the number of packages of formulation jsubsidized during the month x in the Auzon catchment, uj is the numberof units per package of formulation j, mj is the amount of PhAC per unit offormulation j, aj is the absorption rate for formulation jwhich depends onthemode of administration, and e is the portion of the PhAC excreted un-changed or as glucuro- and/or sulfato-conjugates after its absorption. Formetabolites, (1− aj)member has been suppressed fromEq. (1), since thepart of the PhAC that is not absorbed is not metabolized, andmj memberhas been divided by the molecular mass of the parent molecule andmultiplied by the molecular mass of the metabolite.
The pharmacokinetic parameters may differ from one reference toanother (Table 3). When more than one value is available for at leastone pharmacokinetic, a range of predicted amounts excreted annuallyin the catchment area can be derived from minimum and maximumvalues by using the Eqs. (2) and (3):
mAuzon;x;min ¼X
bj � uj �mj � 1−aj;max
� �þ aj;max � emin
h ið2Þ
mAuzon;x;max ¼X
bj � uj �mj � 1−aj;min
� �þ aj;min � emax
h ið3Þ
where, mAuzon,x,min and mAuzon, x,max are respectively the minimum andthe maximum amounts of the PhAC excreted during the month x in theAuzon catchment by people covered by the national health insurance,aj,min and aj,max are respectively theminimum and themaximum absorp-tion rate for the formulation j, and emin and emax are respectively themin-imum and the maximum excretion rate of PhAC after its absorption.
STP of Cournon treatswastewater of 36,000 inhabitants of the Auzoncatchment, the amount of PhAC incoming into Cournon's STP is calculat-ed by Eqs. (4) and (5):
Trimetazidine (TRI) Anti-anginal Non Oral 817 – – –
a www.theriaque.fr.b www.drugs.com.c www.drugbank.ca.d Ortiz de Garcia et al. (2013).e Besse et al. (2008).f Joss et al. (2006).g Miege et al. (2009).h Yamamoto et al. (2009).i Soulier et al. (2011).j Vieno et al. (2007).k Heberer and Feldmann (2005).l Oosterhuis et al. (2013).m Besse et al. (2012).n Reimbursement stopped since March 2012.
15H. Celle-Jeanton et al. / Environment International 73 (2014) 10–21
minf ;x;max ¼ mAuzon;x;max �pop:STP
pop:Auzonð5Þ
where pop. Auzon is the number of inhabitants of Auzon catchmentcovered by national health insurance and pop. STP is the number of ha-bitants linked to the STP of Cournon. The amount of PhAC exiting theSTP of Cournon is given by Eqs. (6) and (7):
meff;x;min ¼ minf;x;min � 1−Fstpmaxð Þ ð6Þ
meff;x;max ¼ minf ;x;max � 1−Fstpminð Þ ð7Þ
where, Fstpmin and Fstpmax are respectively theminimum and themax-imum elimination rates (Table 3) for the same type of STPs as the oneinstalled in Cournon city.
The minimal and maximal PECs for each PhAC incoming into the Al-lier River is finally calculated by using Eqs. (8) and (9):
PECmin ¼ meff;x;min
flowAUZONþALLIERð8Þ
PECmax ¼ meff ;x;max
flowAUZONþALLIERð9Þ
where, flowAUZON + ALLIER is the daily flow rates (m3/s) of Allier andAuzon Rivers measured the day of the corresponding sample.
Environmental degradation and sorption are currently not includedin the prediction.Moreover incoming concentrations from the upper Al-lier Basin are not taken into account. Upstream amounts of labile mole-cules, such as ACE, able to reach downstream part are extremely low(Buerge et al., 2003; Kasprzyk-Hordern et al., 2009; Vystavna et al.,2013). However, for conservative molecules, concentrations comingfrom the upper basin could enhance concentrations at the sampling site.
4. MECs
MEC variations of the sixteen target PhACs have been evaluated dur-ing one hydrological cycle, from October 2011 to October 2012. Statisti-cal calculations are presented in Table 4. Vystavna et al. (2012) showthat two river basins with similar hydrologic characteristics and waterusage (wastewaters, discharge, irrigation, …) can however present
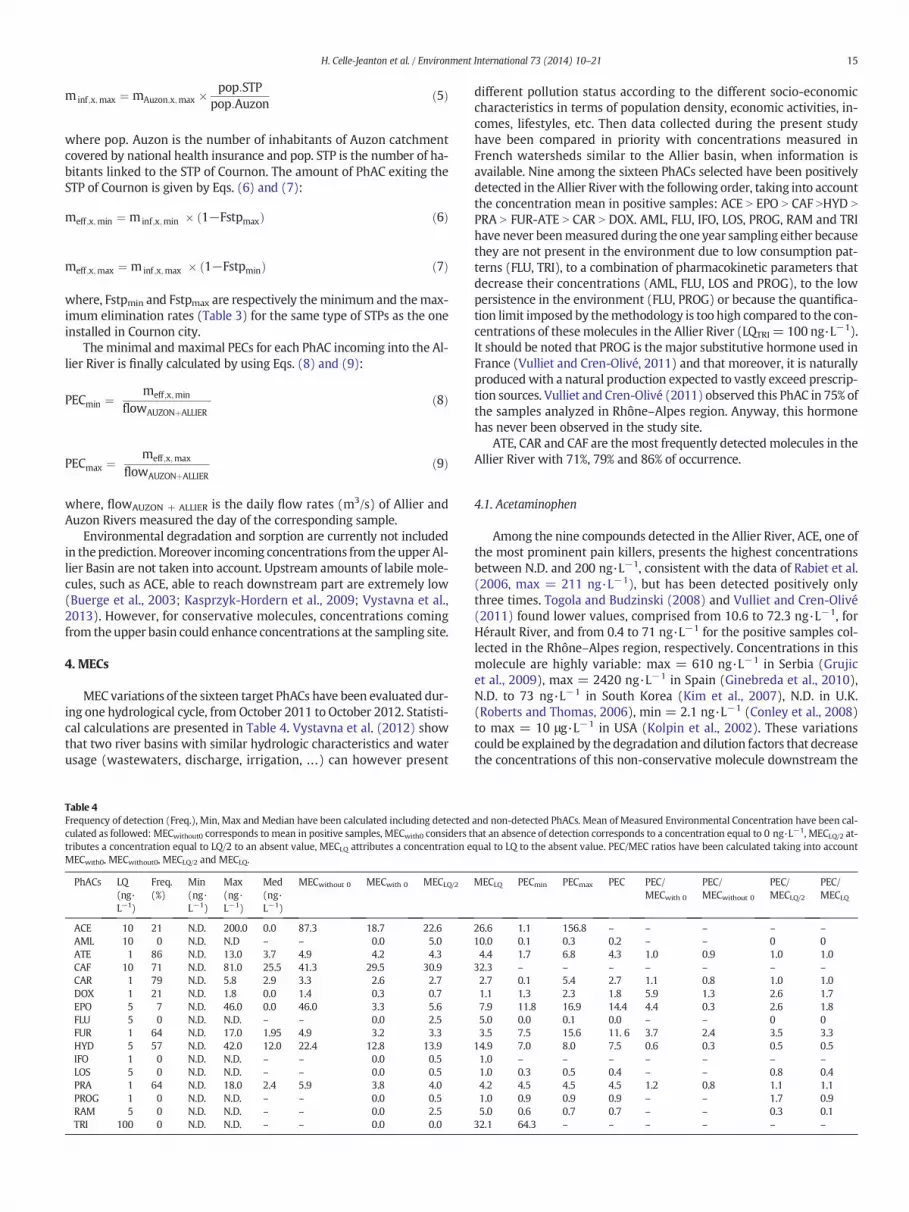
Table 4Frequency of detection (Freq.), Min, Max and Median have been calculated including detectedculated as followed: MECwithout0 corresponds to mean in positive samples, MECwith0 considers ttributes a concentration equal to LQ/2 to an absent value, MECLQ attributes a concentration eMECwith0, MECwithout0, MECLQ/2 and MECLQ.
different pollution status according to the different socio-economiccharacteristics in terms of population density, economic activities, in-comes, lifestyles, etc. Then data collected during the present studyhave been compared in priority with concentrations measured inFrench watersheds similar to the Allier basin, when information isavailable. Nine among the sixteen PhACs selected have been positivelydetected in the Allier Riverwith the following order, taking into accountthe concentration mean in positive samples: ACE N EPO N CAF NHYD N
PRA N FUR-ATE N CAR N DOX. AML, FLU, IFO, LOS, PROG, RAM and TRIhave never beenmeasured during the one year sampling either becausethey are not present in the environment due to low consumption pat-terns (FLU, TRI), to a combination of pharmacokinetic parameters thatdecrease their concentrations (AML, FLU, LOS and PROG), to the lowpersistence in the environment (FLU, PROG) or because the quantifica-tion limit imposed by themethodology is too high compared to the con-centrations of thesemolecules in the Allier River (LQTRI = 100 ng·L−1).It should be noted that PROG is themajor substitutive hormone used inFrance (Vulliet and Cren-Olivé, 2011) and that moreover, it is naturallyproducedwith a natural production expected to vastly exceed prescrip-tion sources. Vulliet and Cren-Olivé (2011) observed this PhAC in 75% ofthe samples analyzed in Rhône–Alpes region. Anyway, this hormonehas never been observed in the study site.
ATE, CAR and CAF are themost frequently detected molecules in theAllier River with 71%, 79% and 86% of occurrence.
4.1. Acetaminophen
Among the nine compounds detected in the Allier River, ACE, one ofthe most prominent pain killers, presents the highest concentrationsbetween N.D. and 200 ng·L−1, consistent with the data of Rabiet et al.(2006, max = 211 ng·L−1), but has been detected positively onlythree times. Togola and Budzinski (2008) and Vulliet and Cren-Olivé(2011) found lower values, comprised from 10.6 to 72.3 ng·L−1, forHérault River, and from 0.4 to 71 ng·L−1 for the positive samples col-lected in the Rhône–Alpes region, respectively. Concentrations in thismolecule are highly variable: max = 610 ng·L−1 in Serbia (Grujicet al., 2009), max = 2420 ng·L−1 in Spain (Ginebreda et al., 2010),N.D. to 73 ng·L−1 in South Korea (Kim et al., 2007), N.D. in U.K.(Roberts and Thomas, 2006), min = 2.1 ng·L−1 (Conley et al., 2008)to max = 10 μg·L−1 in USA (Kolpin et al., 2002). These variationscould be explained by the degradation and dilution factors that decreasethe concentrations of this non-conservative molecule downstream the
and non-detected PhACs. Mean of Measured Environmental Concentration have been cal-hat an absence of detection corresponds to a concentration equal to 0 ng·L−1, MECLQ/2 at-qual to LQ to the absent value. PEC/MEC ratios have been calculated taking into account
16 H. Celle-Jeanton et al. / Environment International 73 (2014) 10–21
STPs (Vystavna et al., 2013). The low ratio of detection (21%) for ACE isalso due to its labile behavior (Lam et al., 2003; Loffler et al., 2005;Yamamoto et al., 2009).
4.2. Atenolol
Information on ATE, a current β-blocker, is incomplete since only afew studies take this molecule into account. This PhAC is characterizedby a half-life up to 166 days (Liu and Williams, 2007; Yamamoto et al.,2009) attesting its persistence within the environment. In the studysite, ATE has been detected in twelve samples among fourteenwith con-centrations varying from N.D. to 13 ng·L−1. These values are in agree-ment with the mean concentration in positive samples of 4.7 ng·L−1
reported by Vulliet and Cren-Olivé (2011) in Rhône–Alpes watersheds.Other data gathered from the literature review are systematicallyhigher: N.D. −465 ng·L−1 in Spain (Fernández et al., 2010; Ginebredaet al., 2010; Gros et al., 2007; Osorio et al., 2012), maximum value of41.7 ng·L−1 for the Po River (Zuccato et al., 2005).
4.3. Caffeine
Caffeine is themostwidespread PhAC in the environment (Nikolaouet al., 2007) with the highest frequency reported in similar studies(Spongberg et al., 2011) and is often considered as a good anthropogen-ic wastemarker. This molecule has a labile behavior in the environment(Benotti and Brownawell, 2007); concentrations can then be loweredrapidly in the environment. In the Allier River, concentrations in CAFvary from N.D. to 81 ng·L−1. These values are consistent with theones found in the Hérault River in France (13–107.2 ng·L−1 in Togolaand Budzinski, 2008) and in the Jalle River (max = 75 ng·L−1,Vystavna et al., 2012). They are lower than those measured in CostaRica (max=1.12mg·L−1 in Spongberg et al., 2011)where a natural or-igin from plants could be invoked, South Korea (2.9–194 ng·L−1, Kimet al., 2007), Spain (12.2–415.7 ng·L−1, Fernández et al., 2010), USA(max = 5.7 μg·L−1, Kolpin et al., 2002).
4.4. Carbamazepine
Along with CAF, CAR has been proposed as an anthropogenicwaste marker as it is one of the most frequently detected drugs inaquatic environment and it is poorly degraded in STPs (Hebererand Feldmann, 2005; Ternes, 1998). Literature provides then largeinformation on concentrations of this molecule in surface waters.CAR in the Allier River presents concentrations between N.D. and5.8 ng·L−1. These values are generally lower than the concentrationsavailable in France (N.D. −56.3 ng·L−1 in Togola and Budzinski,2008; mean concentration in positive samples 13.9 ng·L−1 inVulliet and Cren-Olivé, 2011; data from 4 sampling campaignsevolve from 105 to 675 ng·L−1 in Coetsier et al., 2009; max =27 ng·L−1 in Vystavna et al., 2012) or in other countries likeCanada (N.D. −28 ng·L−1, Lissemore et al., 2006), Costa-Rica (max =82 ng·L−1), Germany (max = 1075 ng·L−1 in Herberer, 2002), Italy(max = 175.3 ng·L−1 in Zuccato et al., 2005), Serbia (max =130 ng·L−1 in Grujic et al., 2009), South Korea (N.D. −61 ng·L−1 inKim et al., 2007), South Wales (N.D. −356 ng·L−1 in Kasprzyk-Hordern et al., 2008), Spain (N.D. −110 ng·L−1 in Gros et al., 2006;max = 110 ng·L−1 in Pedrouzo et al., 2007; N.D. −104 ng·L−1 inFernández et al., 2010; max = 3090 ng·L−1 in Ginebreda et al., 2010;max = 266.7 ng·L−1 in Osorio et al., 2012), Switzerland (max =250 ng·L−1 in Ollers et al., 2001), and Ukraine (max = 272 ng·L−1,Vystavna et al., 2012). Small values comparable to the ones of ourstudy have been reported by Togola (2006) for the Gironde (max =13 ng·L−1) and Adour (max = 8 ng·L−1) River estuaries. As CAR isnoted to be highly resistant to biodegradation and thus highly recalci-trant under standard biological wastewater treatment conditions(Clara et al., 2004; Donner et al., 2013; Kosjek et al., 2009), the
consumption factor may be invoked to explain the differences observedbetween the different studies.
4.5. Others positively detected PhACs
Five other PhACs (DOX, EPO, FUR, HYD and PRA) have been de-tected with the following occurrence and concentrations: DOX 21%(N.D. −1.8 ng·L−1), EPO 7% (N.D. −46 ng·L−1), FUR 64%(N.D. −17 ng·L−1), HYD 57% (N.D. −42 ng·L−1), and PRA 64%(N.D. −18 ng·L−1). Little information exists on these moleculeswithin the literature. EPO, one of the metabolites of carbamazepine,has been positively detected only one time at a concentration largelyexceeding that of CAR's. The input and persistence of antibiotics,such as DOX into the environment are of major concern due to the pos-sible development of bacterial resistance to these compounds(Khachatourian, 1998). In our study, DOX has been detected onlythree times and with low concentrations. Most of the studies carriedout on PhACs, show an absence of DOX (Focazio et al., 2008; Hirschet al., 1999; Kolpin et al., 2002; Vulliet and Cren-Olivé, 2011; Weiet al., 2011). Maximum concentration of 74 ng·L−1 with an occurrenceof 77% has been reported by Spongberg et al. (2011) in Costa Rica riverwaters. Tetracycline antibiotics have been shown to dissipate rapidly inthe aqueous environment due notably to photocatalytic degradation(Makowski et al., 2009). The relatively high occurrence and concentra-tion found by Spongberg et al. (2011) likely indicate high usage in CostaRica compared to previously reported studies. Low concentration andoccurrence in the Allier River are related to both factors of low con-sumption and photodegradation. FUR, HYD and PRA are prescribed forlong-term treatments, that explains their high occurrence in AllierRiver; concentrations have to be relied to the consumption factor. FURis a loop diuretic used in the treatment of congestive heart failure andedema, determined as stable in the environment during 90 days (Kiritet al., 1980). Values found for the Allier River are in agreementwith the measurements (max = 67.2 ng·L−1) achieved in the PoRiver by Zuccato et al. (2005). They are lower than concentrations ofmax = 254.7 ng·L−1 reported by same author for Lambro River. HYDis a diuretic drug frequently used for the treatment of hypertension,congestive heart failure, symptomatic edema, diabetes insipidus, andrenal tubular acidosis. Concentrations evaluated for the Allier Riverare lower than those reported for Spain and Italy: Llobregat Riverpresents concentration from N.D. to 2435.5 ng·L−1 (Osorio et al.,2012), Henares–Jarama–Tajo Rivers from N.D. to 960.3 ng·L−1
(Fernández et al., 2010), and maximum concentration in Po River is of24.4 ng·L−1 (Zuccato et al., 2005). At last, PRA is primarily used forthe treatment of dyslipidemia and the prevention of cardiovascular dis-ease. Valuesmeasured in the Allier River are in agreementwith the datareported for the Rhône–Alpes neighboring region (mean concentrationin positive samples = 1.6 ng·L−1, Vulliet and Cren-Olivé, 2011).
4.6. Time-evolution
The observed variations within a sampling location can be due tovarying consumption rate over time, such as ACE and DOX (Nödleret al., 2011), decreasing (bio)degradation in waste water treatmentand the environment at low temperature (Daneshvar et al., 2010;Gardarsdottir et al., 2010; Suárez et al., 2008), varying river's flow rate(Ter Laak et al., 2010) and dilution of surface water by rain water(Baker and Kasprzyk-Hordern, 2013).
Fig. 2 shows the temporal evolution of the PhACs, flow rate of the Al-lier River, rainfall height and temperature records fromOctober 2011 toOctober 2012. Two peaks of concentrations can be seen in February2012 and September 2012. Positive peak of February 2012 can be ex-plained by low flow rate of the Allier River, small rainfall amount andlow temperature. However, the peak registered in September 2012seems not related to the temperature but most probably to the lowflow rate of the Allier River or the dilution by rainwater.
Fig. 2. Temporal variations of Allier flow rate, rainfall height, temperature and total con-centrations of PhACs.
17H. Celle-Jeanton et al. / Environment International 73 (2014) 10–21
Variation of consumption with time will be explored in the nextparagraph.
5. Comparison between PECs and MECs
Annual averages of PEC and MECs have been used to calculate PEC/MEC ratios (Fig. 3, Table 4) to see if PECs and MECs are in the sameorder of magnitude. An absence of values within the MEC datasetmeans an absence of PhACs within the Allier River or a concentrationbelow the quantification limit. MECs may then lie anywhere between0 and LQ for non-detected PhACs. To evaluate the impact of these lowvalues annual averages of MECs are calculated: 1) by considering thatan absence of measurement corresponds to a concentration equal to0 ng·L−1 (MECwith0); 2) by considering that an absence of values corre-sponds to an absence of measurements (MECwithout0, Ter Laak et al.,2010), 3) by attributing to the absent value, a concentration equal toLQ/2 (MECLQ/2, Choubert et al., 2011), and 4) by attributing to the absentvalue, a concentration equal to LQ (MECLQ, Coetsier et al., 2009). PEC/MEC ratios, for each case, were used to assess the reliability of PEC cal-culation over a long period (14 months). When PEC/MEC is above 1,PEC is considered to be overestimated. When PEC/MEC is below 1, PECis underestimated. And When PEC/MEC is close to 1, a good correspon-dence between measured and calculated concentrations is assumed.
5.1. Atenolol
ATE presents a good correspondence of PECs andMECs at an annualscale with PEC/MEC ratios varying from 0.9 to 1.0 (Table 4). Fig. 3a high-lights the concomitant evolutions of MEC, PECmin and PECmax for thesampling period (oct-2011/oct-2012), MEC's curve is between PECmin
and PECmax ones. PECs of ATE are then well simulated by the appliedmodel calculations.
5.2. Carbamazepine
PEC/MEC ratios for CAR, varying between 0.8 and 1.1, testify for agood correspondence between PECs and MECs. Generally, PECmin isslightly underestimated and PECmax, slightly overestimated (Table 4,Fig. 3b). MECs evolve between PECmin and PECmax curves and presentthe same shape. This molecule is well-known to be persistent in the en-vironment; an input from the upper Allier basin should also be takeninto account. Nevertheless, as the consumption of CAR is relativelylow (Table 3), it is probable that the concentration before the junctionbetween Allier and Auzon Rivers is highly diluted by the Allier River.Themodel of calculation is then clearly adapted to evaluate PECs of CAR.
5.3. Doxycycline
PEC/MEC ratios of DOX vary from 1.3 to 5.9 (Table 4), which high-lights a possible overestimation of PECs compared to MECs. Fig. 3c pre-sents similar trend for the curves of MECs and PECs taking into accountthat DOX has been measured only three times during the whole periodof sampling. The overestimation of PECs could be due to further process-es that take place after discharge of STPs such as biodegradationhighlighted by Kümmerer and Cunningham (2006) and/or photoreac-tion showed by Kümmerer (2009). These mechanisms could partly ex-plain the difference observed and should be considered for a betterestimation of PECs of DOX.
5.4. Furosemide
PEC/MEC ratios of FUR give values comprised between 2.4 and 3.7(Table 4). MEC curve (Fig. 3d) presents the same shape than the onesof PECmin and PECmax but is clearly below the two latter. This couldimply either an uncompleted use of medicine prescribed or a degrada-tion of FUR within the environment. According to the literature reviewachieved during this study, sparse data is available on the eliminationrate of this molecule in surface water; PBT profiler gives a DT50 equalto 60 days and Kirit et al. (1980) a stability of 90 days. In order to bettermodel PECs of FUR, further evaluation of FUR's consumption and persis-tence within the environment has to be done.
5.5. Hydrochlorothiazide
HYD's PEC/MEC ratio dataset, varying from 0.3 to 0.6, is consistentwhatever themethod of calculations selected and show a clear underes-timation of PECs compared to MECs. Fig. 3e highlights MEC, PECmin,PECmax and LQ of HYD evolutions. Same peaks are observed on thethree concentration curves, PECs presenting themost attenuated evolu-tion. The underestimation of PECs could be explained by a wrong eval-uation of the pharmacokinetic parameters. Another hypothesis relies onthe persistence of HYD in the environment, badly known. If this PhAC isshown to be highly persistent, a supply by the upper part of the Allierbasin could increase MECs compared to PECs and then explain the lowratios observed. Verification on pharmacokinetic parameters and evalu-ation of the persistence of this PhAC within the environment wouldallow ameliorating the calculations of PECs for HYD.
Fig. 3. Temporal evolution of MECs (Measured Environmental Concentrations) and PECs (Predicted Environmental Concentrations). PECmax and PECmin are the maximum and the mini-mum values of PECs, LQ is the Limit of Quantification.
18 H. Celle-Jeanton et al. / Environment International 73 (2014) 10–21
5.6. Pravastatine
PEC/MEC ratios are comprised between 0.8 and 1.2 and then show agood correspondence between PECs andMECs at an annual scale. Fig. 3fpresents the evolution of MEC, PEC and LQ of PRA. The two curves arecharacterized by similar shapes, MECs presenting however bigger am-plitudes. This marginal difference could be explained by calculationmethod that includes mass of PhAC rejected through the whole monthand then attenuates daily variations of PECs whereas MECs consist ofpunctual measurements. As no information on the PRA's (bio)degrad-ability is available, inputs of PRA from the upper Allier basin, beforethe connection between the Allier and the Auzon Rivers, can be impliedand could also explain the slightly higherMECs. Anyway,model used forcalculation is considered to bewell adapted for PEC evaluation of PRA. Abest fitting could be expected through the integration of accurate (bio)degradability parameters.
5.7. Other molecules
Some PhACs (ACE, CAF, EPO, IFO and TRI) have been excluded forPEC calculations because no or poor information is available on their
consumption patterns. CAF is mainly due to other sources than medi-cines. IFO is generally used in hospitals where it is difficult to gatherthe consumption information. Two antagonist facts could alter PEC cal-culation of ACE: the availability of this molecule without medical pre-scription that results in PEC underestimation and the uncompletedconsumption of sold medication that leads to an overestimation ofPEC. At last, data provided by CPAM on TRI is only available till March2012 as the reimbursement of this PhACs stopped at this date.
PECs of EPO have not been calculated as EPO is themetabolite of CAR.PEC calculations of AML, FLU, LOS, RAM and PROG confirm the
low MECs observed for these molecules. PECmin and PECmax are system-atically below the quantification limit, attesting that these PhACs shouldbe present in the environment but at very low concentrations.
6. Conclusion
Sixteen PhACs have been selected for they belong to the priority list ofthe AFFSAPS and they are a part of the dataset acquired on the Allier Riverduring one year measurements, from October-2011 to October-2012.
Nine among the sixteen targetedmolecules have been positively de-tected in the surface waters of the Allier River. Atenolol, carbamazepine
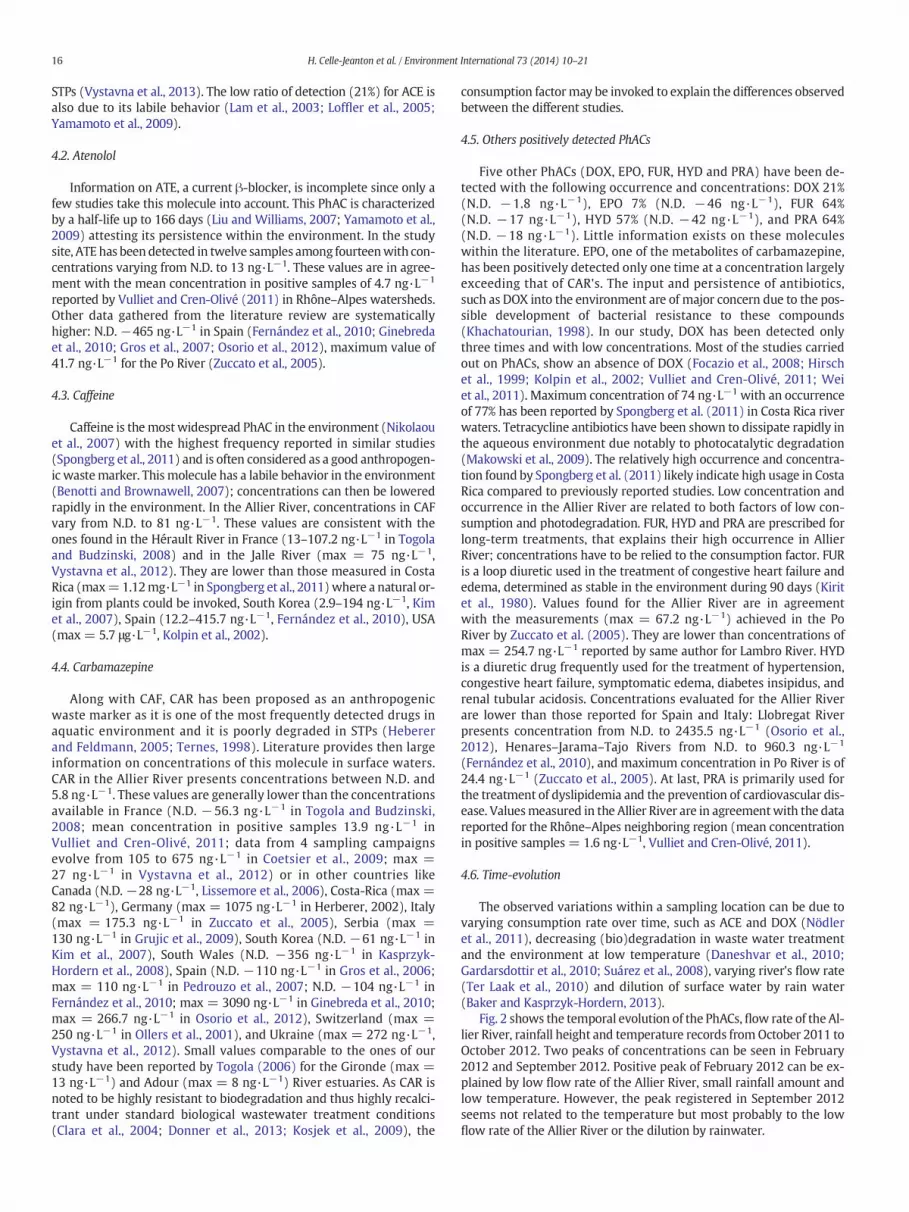
Table 5Conclusion on the reliability of PEC calculation.
PhACs Evaluation PECs vs MECs Conclusions
PECs are not modeled ACECAFIFOTRI
MEC N LQPEC?
Consumption levels of these PhACs are difficult to evaluate (multiplicity of products containingthis molecule, uncompleted use, availability without prescription, prescription by hospitals, andstop in the reimbursement). An improvement of the accounting system of PhACs would allowcalculating PECs for these molecules.
PECs are modeled but needadjustments
AMLFLULOSRAMPROG
0 b PEC b LQMEC = N.D.
These molecules should be present in the environment, but are, at the current stage, notdetected.An improvement of analytical method is needed for a better evaluation of these PhACs
DOXFUR
PEC N MECMEC and PEC present similar trends.
Evaluation of processes that can decrease MECs after discharge of STPs (biodegradability) andestimation of the uncompleted use of medicine is needed to improve PEC calculations.
HYD PEC b MECMEC and PEC present similar trends.
Better evaluation of pharmacokinetic parameters is needed to improve PEC calculations.
PEC = MEC ATECARPRA
PEC = MECMEC and PEC present similar trends.
PEC calculation should be used for these PhAC evaluation, without any reserve.
19H. Celle-Jeanton et al. / Environment International 73 (2014) 10–21
and caffeine are themost frequentlymeasured PhACs in relation to bothconsumption and persistence in the STPs and the environment.Acetaminophen and caffeine, despite their (bio)degradation facility inthe STPs and environment, present the highest concentrations of the da-tabase due to the fact that these compounds are among themost used inFrance.
Comparison between MECs and PECs has been achieved by using anadaptation of the models proposed by Heberer and Feldmann (2005)and EMEA (2006). Table 5 presents the main conclusions of the study.The application of the model comes against the difficulty on gatheringthe needed information for PEC calculations. One of themajor problemsconcerns the evaluation of consumption patterns of PhACs, at a localscale. For this reason, evaluation of PECs for ACE, CAF, IFO and TRI hasnot been achieved and seems to be difficult as a precise accounting sys-tem is quite impossible to settle for these molecules. PEC evaluations ofnon-detected molecules during the study, show that these PhACsshould be present within the environment but at concentrationsbelow the quantification limit. As MECs are not available, a comparisonbetweenMEC and PEC is not possible and then PEC evaluation cannot beverified. This evaluation has to be tested again if analytical methods im-prove and quantification limit decrease. DOX, FUR and HYD presentoverestimation or underestimation of PECs compared to MECs. Howev-er, evolution curves within one hydrological cycle show a good similar-ity betweenMECs and PECs. Accurate PEC evaluation is then possible forthese PhACs but need some parameter adjustments, notably transfor-mation within the environment (Oosterhuis et al., 2013; ter Laak et al.,2010). At last, ATE, CAR and PRA are well modeled by PEC calculation,then the methods proposed by the paper to calculate PECs could be ap-plied without any reserve for these PhACs. As suggested by Oosterhuiset al. (2013), this information has to be coupled with an evaluation ofpossible ecotoxicological or human health risks.
Aknowledgments
The study was financially supported by the European Regional De-velopment Fund (ERDF) (Program-0020, contract-34874) through the“Plan Loire Grandeur Nature”, the “Agence de l'Eau Loire-Bretagne”(AELB) and the municipality of Clermont–Ferrand. The authors wouldlike to thank CPAM (social health care system of Puy-de-Dôme) for pro-viding the dataset on pharmaceutical consumption.
References
AFSSAPS. Hiérarchisation des résidus de médicaments d'intérêt pour l'analyse desressources et des eaux traitées. Rapport; 2008 [31 pp., afssaps & anses].
Arditsoglou A, Voutsa D. Passive sampling of selected endocrine disrupting compoundsusing polar organic chemical integrative samplers. Environ Pollut 2008;156:316–24.
Baker DR, Kasprzyk-Hordern B. Spatial and temporal occurrence of pharmaceuticals andillicit drugs in the aqueous environment and during wastewater treatment. New de-velopments science of the total environment; 2013 [454–455/442–456].
Barnes KK, Kolpin DW, Furlong ET, Zaugg SD, Meyer MT, Barber LB. A national reconnais-sance of pharmaceuticals and other organic wastewater contaminants in the UnitedStates — I) groundwater. Sci Total Environ 2008;402:192–200.
BendzD, Paxeus NA, Ginn TR, Loge FJ. Occurrence and fate of pharmaceutically active com-pounds in the environment, a case study: Hoje River in Sweden. J HazardMater 2005;122(3):195–204.
Benotti MJ, Brownawell BJ. Distributions of pharmaceuticals in an urban estuary duringboth dry- and wet-weather conditions. Environ Sci Tech 2007;41(16):5795–802.
Besse JP, Garric J. Human pharmaceuticals in surface waters implementation of a prioriti-zation methodology and application to the French situation. Toxicol Lett 2008;176(2):104–23.
Besse JP, Kausch Barreto C, Garric J. Exposure assessment of pharmaceuticals and theirmetabolites in the aquatic environment: application to the French situation and pre-liminary prioritization. Hum Ecol Risk Assess 2008;14(4):665–95.
Besse JP, Latour JF, Garric J. Anticancer drugs in surface waters. What canwe say about theoccurrence and environmental significance of cytotoxic, cytostatic and endocrinetherapy drugs? Environ Int 2012;39:73–86.
Buerge IJ, Poiger T, Muller MD, Buser HR. Caffeine, an anthropogenic marker for wastewa-ter contamination of surface waters. Environ Sci Tech 2003;37:691–700.
Camacho-Munoz MD, Santos JL, Aparicio I, Alonso E. Presence of pharmaceutically activecompounds in Donana Park (Spain) main watersheds. J Hazard Mater 2010;177:1159–62.
CarballaM, Omil F, Lema JM. Comparison of predicted andmeasured concentrations of se-lected pharmaceuticals, fragrances and hormones in Spanish sewage. Chemosphere2008;72(8):1118–23.
Castiglioni S, Fanelli R, Calamari D, Bagnati R, Zuccato E. Methodological approaches forstudying pharmaceuticals in the environment by comparing predicted and measuredconcentrations in River Po, Italy. Regul Toxicol Pharmacol 2004;39(1):25–32.
Choi K, Kim Y, Park J, Park CK, Kim M, Kim HS, et al. Seasonal variations of several phar-maceutical residues in surface water and sewage treatment plants of Han River,Korea. Sci Total Environ 2008;405:120–8.
Choubert JM, Martin-Ruel S, Budzinski H, Miège C, Eperanza M, Soulier C, et al. Évaluer lesrendements des stations d'épuration. Apports méthodologiques et résultats pour lesmicropolluants en filières conventionnelles et avancées. Extrait numérique de Tech-niques Sciences, Méthodes n° ½; 2011.
Clara M, Strenn B, Kreuzinger N. Carbamazepine as a possible anthropogenic marker inthe aquatic environment: investigations on the behavior of carbamazepine in waste-water treatment and during groundwater infiltration. Water Res 2004;38:947–54.
Coetsier CM, Spinelli S, Lin L, Roig B, Touraud E. Discharge of pharmaceutical products(PPs) through a conventional biological sewage treatment plant: MECs vs PECs. Envi-ron Int 2009;35:787–92.
Comeau F, Surette C, Brun GL, Losier R. The occurrence of acidic drugs and caffeine in sew-age effluents and receiving waters from three coastal watersheds in Atlantic Canada.Sci Total Environ 2008;396:132–46.
Commission Directive 93/67/EEC: Principles for the assessment of risks to man and theenvironment of substances notified in accordance with Council Directive 67/548/EEC. 20/7/93. Official Journal of the European Communities. n° L227 1993:9–18.
Commission Directive 98/8/EC: Placing of biocidal products on the market: 16/2/98. Offi-cial Journal of the European Communities. n° L123 1998:1–63.
Commission Regulation 1488/94/EC: Principles for the assessment of risks to man and theenvironment of existing substances in accordance with Council Regulation (EEC)n°793/93. 28/06/94. Official Journal of the European Communities. n° L161 1994:3–11.
Conley JM, Symes SJ, Schorr MS, Richards SM. Spatial and temporal analysis of pharma-ceutical concentrations in the upper Tennessee River basin. Chemosphere 2008;73:1178–87.
Daneshvar A, Svanfelt J, KronbergM, Prévost M,Weyhenmeyer GA. Seasonal variations inthe occurrence and fate of basic and neutral pharmaceuticals in a Swedish river-lakesystem. Chemosphere 2010;80:301–9.
20 H. Celle-Jeanton et al. / Environment International 73 (2014) 10–21
Donner E, Kosjek T, Qualmann S, Kusk KO, Heath E, Revitt DM, Ledin A, Andersen HR.Ecotoxicity of carbamazepine and its UV photolysis transformation products. SciTotal Environ 2013;443:870–6.
Dulio V, Morin A, Staub PF. Les substances émergentes dans l'environnement. Note desynthèse sur l'état de l'art concernant les produits pharmaceutiques, les cosmétiqueset les produits d'hygiène corporelle. Rapport ONEMA-INERIS DRC-09-95687-06381C;2009.
European MEdecine Agency. Guideline on environmental risk assessment of medicinalproducts for human use. Doc. Ref. EMEA/CHMP/SWP/4447/00 corr 1*; 2006.
Fernández C, González-Doncel M, Pro J, Carbonell G, Tarazona JV. Occurrence of pharma-ceutically active compounds in surface waters of the Henares–Jarama–Tajo River sys-tem (Madrid, Spain) and a potential risk characterization. Sci Total Environ 2010;408:543–51.
Focazio MJ, Kolpin DW, Barnes KK, Furlong ET, Meyer MT, Zaugg SD, et al. A national re-connaissance for pharmaceuticals and other organic wastewater contaminants in theUnited States e II) untreated drinking water sources. Sci Total Environ 2008;402:201–16.
Fram MS, Belitz K. Occurrence and concentrations of pharmaceutical compounds ingroundwater used for public drinking-water supply in California. Sci Total Environ2011;409(18):3409–17.
Gardarsdottir H, Egberts TC, van Dijk L, Heerdink ER. Seasonal patterns of initiating anti-depressant therapy in general practice in the Netherlands during 2002–2007. J AffectDisord 2010;122:208–12.
Ginebreda A, Muñoz I, Alda ML, Brix R, López-Doval J, Barceló D. Environmental risk as-sessment of PhACs in rivers: relationships between hazard indexes and aquatic mac-roinvertebrate diversity indexes in the Llobregat River (NE Spain). Environ Int 2010;36:53–62.
Gros M, Petrovic M, Barcelo D. Development of a multi-residue analytical methodologybased on liquid chromatography–tandem mass spectrometry (LC–MS/MS) forscreening and trace level determination of pharmaceuticals in surface and wastewa-ters. Talanta 2006;70(4):678–90.
Gros M, Petrovic M, Barcelo D. Wastewater treatment plants as a pathway for aquaticcontamination by pharmaceuticals in the Ebro river basin (northeast Spain). EnvironToxicol Chem 2007;26(8):1553–62.
Grujic S, Vasiljevic T, LausevicM. Determination ofmultiple pharmaceutical classes in sur-face and ground waters by liquid chromatography–ion trap-tandem mass spectrom-etry. J Chromatogr A 2009;1216(25):4989–5000.
Grund M, Kallqvist Y, Sakshaug S, Skurtveit S, Thomas K. Environmental Assessment ofNorwegian priority pharmaceuticals based on EMEA guideline. Ecotoxicol EnvironSaf 2008;71:328–40.
Heberer T. Tracking persistent pharmaceutical residues from municipal sewage to drink-ing water. J Hydrol 2002;226:175–89.
Heberer T, Feldmann D. Contribution of effluents from hospitals and private householdsto the total loads of diclofenac and carbamazepine in municipal sewage effluents —modeling versus measurements. J Hazard Mater 2005;122(3):211–8.
Henshel KP, Wenzel A, Dietrich M, Fliedner A. Environmental hazard assessment of phar-maceuticals. Regul Toxicol Pharmacol 1997;25:220–5.
Hirsch R, Ternes T, Haberer K, Kratz KL. Occurrence of antibiotics in the aquatic environ-ment. Sci Total Environ 1999;225:109–18.
Johnson AC, Keller V, Williams RJ, Young A. A practical demonstration in modelingdiclofenac and propranolol river water concentrations using a GIS hydrology modelin a rural UK catchment. Environ Pollut 2007;146(1):155–65.
Joss A, Zabczynski S, Gobel A, Hoffmann B, Loffler D, McArdell CS, et al. Biological degra-dation of pharmaceuticals inmunicipal wastewater treatment: proposing a classifica-tion scheme. Water Res 2006;40:1686–96.
Kasprzyk-Hordern B, Dinsdale RM, Guwy AJ. The occurrence of pharmaceuticals, personalcare products, endocrine disruptors and illicit drugs in surface water in South Wales,UK. Water Res 2008;42(13):3498–518.
Kasprzyk-Hordern B, Dinsdale RM, Guwy AJ. Illicit drugs and pharmaceuticals in theenvironment-forensic applications of environmental data, part 1: estimation of theusage of drugs in local communities. Environ Pollut 2009;157:1778–86.
Khachatourian G. Agricultural use of antibiotics and the evolution and transfer ofantibiotic-resistant bacteria. Can Med Assoc J 1998;159:1129–36.
Kim SD, Cho J, Kim IS, Vanderford BJ, Snyder SA. Occurrence and removal of pharmaceu-ticals and endocrine disruptors in South Korean surface, drinking, and waste waters.Water Res 2007;41:1013–21.
Kirit AS, Das Gupta V, Kenneth RS. Effect of pH, chlorobutanol, cysteine hydrochlo-ride, ethylenediaminetetraacetic acid, propylene glycol, sodium metabisulfite,and sodium sulfite on furosemide stability in aqueous solutions. J Pharm Sci1980;69:594–6.
Kolpin DW, Furlong E, Meyer M, Thurman EM, Zaugg S. Pharmaceuticals, hormones, andother organic wastewater contaminants in U.S. streams, 1999–2000: a national re-connaissance. Environ Sci Tech 2002;36:1202–11.
Kosjek T, Andersen HR, Kompare B, Ledin A, Heath E. Fate of carbamazepine during watertreatment. Environ Sci Tech 2009;43(16):6256–61.
Kumar V, Johnson AC, Nakada N, Yamashita N, Tanaka H. De-conjugation behavior of con-jugated estrogens in the raw sewage, activated sludge and river water. J HazardMater 2012;227–228:49–54.
Kümmerer K. The presence of pharmaceuticals in the environment due to human use —present knowledge and future challenge. J Environ Manage 2009;90(8):2354–66.
Kümmerer K, Cunningham VL. Summary of workshop on fate of pharmaceuticals in theenvironment. Drug Inf J 2006;41(2):193–4.
Kuster M, Lopez Jose, de Alda M, Dolores Hernando M, Petrovic M, Martin-Alonso J, et al.Analysis and occurrence of pharmaceuticals, estrogens, progestogens and polar pes-ticides in sewage treatment plant effluents, river water and drinking water in theLlobregat river basin (Barcelona, Spain). J Hydrol 2008;358(1–2):112–23.
LamMW, Tantuco K, Mabury SA. PhotoFate: a new approach in accounting for the contri-bution of indirect photolysis of pesticides and pharmaceuticals in surface waters. En-viron Sci Tech 2003;37(5):899–907.
Larsson D, Pedro C, Paxeus M. Effluent from drug manufactures contains extremely highlevel of pharmaceuticals. J Hazard Mater 2007;148:751–5.
Lee HB, Thomas EP, Lewina Svoboda M. Determination of endocrine-disrupting phe-nols, acidic pharmaceuticals, and personal-care products in sewage by solid-phase extraction and gas chromatography–mass spectrometry. J Chromatogr A2005;1094:122–9.
Lindqvist N, Tuhkanen T, Kronberg L. Occurrence of acidic pharmaceuticals in raw andtreated sewages and in receiving waters. Water Res 2005;39:2219–28.
Lissemore L, Hao C, Yang P, Sibley PK, Mabury S, Solomon KR. An exposure assessment forselected pharmaceuticals within a watershed in Southern Ontario. Chemosphere2006;64:717–29.
Liu QT, Williams HE. Kinetics and degradation products for direct photolysis of B-blockersin water. Environ Sci Technol 2007;41:803–10.
Loffler D, Rombke J, Meller M, Ternes TA. Environmental fate of pharmaceuticals inwater/sediment systems. Environ Sci Tech 2005;39(14):5209–18.
Lopez-Serna R, Jurado A, Vazquez-Suné E, Carrera J, Petrovic M, Barcelo D. Occurrence of95 pharmaceuticals and transformation products in urban groundwaters underlyingthe metropolis of Barcelona, Spain. Environ Pollut 2013;174:205–15.
MacLeod SL, McClure EL, Wong CS. Laboratory calibration and field deployment of thepolar organic chemical integrative sampler for pharmaceuticals and personal careproducts in wastewater and surface water. Environ Toxicol Chem 2007;26:2517–29.
Makowski A, Sobczak A, Wcislo D, Adamek E, Baran W, Kostecki M. Photocatalytic degra-dation of doxycycline in water solutions. Proceeding of ECOpole, 2009, 3, 1. Proceed-ings of Ecopole; 2009. p. 87–94.
Miege C, Choubert JM, Ribeiro L, Eusebe M, Coquery M. Fate of pharmaceuticals and per-sonal care products in wastewater treatment plants — conception of a database andfirst results. Environ Pollut 2009;157(5):1721–6.
Moldovan Z. Occurrences of pharmaceutical and personal care products asmicropollutants in rivers from Romania. Chemosphere 2006;64:1808–17.
Müller B, Scheytt T, Zippel M, Hannappel S, Klein-Goedicke J, Duscher K. A New approachto calculate EMEA's predicted environmental concentration for human pharmaceuti-cals in groundwater at bank filtration sites. Water Air Soil Pollut 2011;217(1–4):67–82.
Nakada N, Kiri K, Shinohara H, Harada A, Kuroda K, Takizawa S, Takada H. Evaluation ofpharmaceuticals and personal care products as water-soluble molecular markers ofsewage. Environ Sci Tech 2008;42:6347–53.
Nikolaou A, Meric S, Fatta D. Occurrence patterns of pharmaceuticals in water and waste-water environments. Anal Bioanal Chem 2007;387:1225–34.
Nödler K, Licha T, Fischer S, Wagner B, Sauter M. A case study on the correlation of micro-contaminants and potassium in the Leine River (Germany). Appl Geochem 2011;26(12):2172–80.
Ollers S, Singer HP, Fassler P, Muller SR. Simultaneous quantification of neutral and acidicpharmaceuticals and pesticides at the low-ng/l level in surface and waste water. JChromatogr A 2001;911:225–34.
Oosterhuis M, Sacher F, Ter Laak TL. Prediction of concentration levels of metformin andother high consumption pharmaceuticals in wastewater and regional surface waterbased on sales data. Sci Total Environ 2013;442:380–8.
Ort C, Lawrence MG, Reungoat J, Eaglesham G, Carter S, Keller J. Determining the fractionof pharmaceutical residues in wastewater originating from a hospital. Water Res2010;44:605–15.
Ortiz de Garcia S, Pinto Pinto G, Garcia Encina P, Irusta Mata R. Consumption and occur-rence of pharmaceutical and personal care products in the aquatic environment inSpain. Sci Total Environ 2013;444:451–65.
Osorio V,Marcé R, Pérez S, Ginebreda A, Cortina JL, Barceló D. Occurrence andmodeling ofpharmaceuticals on a sewage-impacted Mediterranean river and their dynamicsunder different hydrological conditions. Sci Total Environ 2012;440:3–13.
Pedrouzo M, Reverté S, Borrull F, Pocurull E, Marcé RM. Pharmaceutical determination insurface and wastewaters using high-performance liquid chromatography-(electrospray)-mass spectrometry. J Separ Sci 2007;30(3):297–303.
Rabiet M, Togola A, Brissaud F, Seidel JL, Budzinski H, Elbaz-Poulichet F. Consequences oftreated water recycling as regards pharmaceuticals and drugs in surface and groundwaters of a medium-sized Mediterranean catchment. Environ Sci Tech 2006;40(17):5282–8.
Reh R, Licha T, Geyer T, Noedler K, Sauter M. Occurrence and spatial distribution of organ-ic micro-pollutants in a complex hydrogeological karst system during low flow andhigh flow periods, results of a two-year study. Sci Total Environ 2013;443:438–45.
Roberts PH, Thomas KV. The occurrence of selected pharmaceuticals inwastewater effluentand surface waters of the lower Tyne catchment. Sci Total Environ 2006;356:143–53.
Schriks M, Heringa MB, van der Kooi MME, de Voogt P, van Wezel AP. Toxicological rele-vance of emerging contaminants for drinking water quality. Water Res 2010;44:461–76.
Schwab BW, Hayes EP, Fiori JM, Mastrocco FJ, Roden NM, Cragin D, et al. Human pharma-ceuticals in US surface waters: a human health risk assessment. Regul ToxicolPharmacol 2005;42(3):296–312.
Soulier C, Gabet V, Lardy S, Lemenach K, Pardon P, Esperanza M, Miege C, Choubert JM,Martin Ruel S, Bruchet A, Coquery M, Budzinski H. Zoom sur les substancespharmaceutiques: présence, partition, devenir en station d'épuration. Extraitnumérique de Techniques Sciences Méthodes 2011(1/2):63–77.
Spongberg AL, Witter JD, Acun J, Murillo M, Umana G, Gomez E, et al. Reconnaissance ofselected PPCP compounds in Costa Rican surfacewaters.Water Res 2011;45:6709–17.
Steger-Hartmann T, Kummerer K, Hartmann A. Biological degradation of cyclophos-phamide and its occurrence in sewage water. Ecotoxicol Environ Saf 1997;36:174–9.
21H. Celle-Jeanton et al. / Environment International 73 (2014) 10–21
Stuer-Lauridsen F, Birkved M, Hansen LP, Holten Lutzhoft HC, Halling-Sorensen B. Envi-ronmental risk assessment of human pharmaceuticals in Denmark after normal ther-apeutic use. Chemosphere 2000;40:783–93.
Suárez S, Carballa M, Omil F, Lema JM. How are pharmaceutical and personal care prod-ucts (PPCPs) removed from urban wastewaters? Rev Environ Sci Biotechnol 2008;7(2):125–38.
Tauxe-Wuersch A, Alencastro LF, Granjean D, Tarradelas J. Occurrence of several acidicdrugs in sewage treatment plants in Switzerland and risk assessment. Water Res2005;39:1761–72.
Ter Laak TL, Van der Aa M, Houtman CJ, Stoks PC, Van Wezel AP. Relating environmentalconcentrations of pharmaceuticals to consumption: a mass balance approach for theriver Rhine. Environ Int 2010;36:403–9.
Ternes TA. Occurrence of drugs in German sewage treatment plants and rivers. Water Res1998;32:3245–60.
Ternes TA, StumpfM,Mueller J, Haberer K, Wilken RD, ServosM. Behavior and occurrenceof estrogens in municipal sewage treatment plants — I. Investigations in Germany,Canada and Brazil. Sci Total Environ 1999;225:81–90.
Terzić S, Senta I, Ahel M, Gros M, Petrović M, Barcelo D, Muller J, Knepper T, Marti I,Ventura F, Jovancic P, Jacubar D. Occurrence and fate of emerging wastewater con-taminants in Western Balkan Region. Sci Total Environ 2008;399:66–77.
Togola A. Présence et devenir des substances pharmaceutiques dans les écosystèmesaquatiques. France: Université Bordeaux 1; 2006 (PhD thesis).
Togola A, Budzinski H. Multi-residue analysis of pharmaceutical compounds in aqueoussamples. J Chromatogr A 2008;177:150–8.
Valcárcel Y, González Alonso S, Rodríguez-Gil JL, RomoMaroto R, Gil A, Catalá M. Analysisof the presence of cardiovascular and analgesic/anti-inflammatory/antipyretic
pharmaceuticals in river- and drinking-water of the Madrid Region in Spain.Chemosphere 2011;82:1062–71.
Vieno N, Tuhkanen T, Kronberg L. Elimination of pharmaceuticals in sewage treatmentplants in Finland. Water Res 2007;41:1001–12.
Vulliet E, Cren-Olivé C. Screening of pharmaceuticals and hormones at the regional scale,in surface and groundwaters intended to human consumption. Environ Pollut 2011;2011(159):2929–34.
Vystavna Y, Huneau F, Grynenko V, Vergeles Y, Celle-Jeanton H, Tapie N, Budzinski H, LeCoustumer P. Pharmaceuticals in rivers of two regions with contrasted socio-eco-nomic conditions: occurrence, accumulation, and comparison for Ukraine and France.Water Air Soil Pollut 2012;223(5):2111–24.
Vystavna Y, Le Coustumer P, Huneau F.Monitoring of tracemetals and pharmaceuticals asanthropogenic and socio-economic indicators of urban and industrial impact on sur-face waters. Environ Monit Assess 2013;185(4):3581–601.
Wei R, Ge F, Huang S, Chen M, Wang R. Occurrence of veterinary antibiotics in animalwastewater and surface water around farms in Jiangsu Province, China. Chemosphere2011;83(10):1408–14.
Yamamoto H, Nakamura Y, Morigushi S, Nakamura Y, Honda Y, Tamura I, Hirata Y,Hayashi A, Sekizawa J. Persistence and partitioning of eight selected pharmaceuticalsin the aquatic environment: laboratory photolysis, biodegradation, and sorption ex-periments. Water Res 2009;43(2):351–62.
Zuccato E, Castiglioni S, Fanelli R. Identification of the pharmaceuticals for human usecontaminating the Italian aquatic environment. J Hazard Mater 2005;122:205–9.


![[123doc] Vietnam Pharmaceuticals Healthcare Report Q1 2016](https://static.documents.page/doc/80x56/636262320bc31e3c17052c93/123doc-vietnam-pharmaceuticals-healthcare-report-q1-2016.jpg)


