j. Soc. Cosmet. Chem., 47, 325-336 (September/October 1996) Tretinoin assay in cosmetics andpharmaceuticals by carbon phase extraction G. RAGNO, M. VERONICO, R. MADDALENA,and C. VETUSCHI,Pharmaco Chemistry Department ofUniversity, Via E. Orabona 4, 70126 Bari, Italy. Accepted for publication September 30, 1996. Presented at IV CRSAAE Bologna, Italy, October 1991. Synopsis A tretinoin assay, useful to verifyits absence in cosmetics, where the drug is forbidden, was proposed. The method was based on a carbon phase extraction that allows oneto obtain the analyte free from interfering matrix components and in an enriched concentration in such a way as to attain a higher sensitivity. When the analyte was present, a quantitation was performed by UV-derivative spectrophotometry. In the presence of substances with a high absorptivity, like sunfilters,besides the carbon extraction step, a furthersepara- tion by HPTLC was required. The drug absence was validated over 0.1 mg/100g. Since theTRT amount in pharmaceuticals for topical use is 10 to 100 mg/100g, this revelation limit assures a sufficient warranty. A simplified procedure, by direct derivative spectrophotometry, maybe applied for tretinoin determination in pharmaceuticals. INTRODUCTION Tretinoin (TRT), all-trans retinoic acid, is usedfor the treatment of severe cystic acne (1-2) and other skin diseases (3), for its positiveactionon cell proliferation and kera- tinization of the skin, as well as for decreasing sebum secretion and inflammation (4). Research with retinoids and clinical observations in humans sometimes givesapparently contradictory results: while stimulating the proliferation of normal epidermal cells, retinoids may check the growthof psoriatic cells and neoplasms, but the side effects of these compounds are fairly unpleasant (3). Sun exposure during treatmentmust be stringently avoided. Teratogenicity for isotretinoin is well documented (5,6), and it is suspected as a potential effectof tretinoin. For thesereasons, the use of tretinoin in pregnancy is forbidden. On 27 July 1976 theEuropean Community promulgated Law76/768, actuated in Italy with Law 11 October 1986 no. 713, which forbids the use of TRT and several other chemicals in the cosmetic field. Furthermore, in Italy the Ministry of Health, with Cir- cular 18 October 1990 no. 27, hascommittedthe public laboratories to checkfor the absence of TRT in cosmetics. Analytical methods for TRT have been developed by usingHPLC on biological samples (7) and on anti-aging cosmetics (8,9); the U.S. Pharmacopeia 23rd Rev. (10) reportsa 325
Transcript
j. Soc. Cosmet. Chem., 47, 325-336 (September/October 1996)
Tretinoin assay in cosmetics and pharmaceuticals by carbon phase extraction
G. RAGNO, M. VERONICO, R. MADDALENA, and C. VETUSCHI, Pharmaco Chemistry Department of University, Via E. Orabona 4, 70126 Bari, Italy.
Accepted for publication September 30, 1996. Presented at IV CRSAAE Bologna, Italy, October 1991.
Synopsis
A tretinoin assay, useful to verify its absence in cosmetics, where the drug is forbidden, was proposed. The method was based on a carbon phase extraction that allows one to obtain the analyte free from interfering matrix components and in an enriched concentration in such a way as to attain a higher sensitivity. When the analyte was present, a quantitation was performed by UV-derivative spectrophotometry. In the presence of substances with a high absorptivity, like sun filters, besides the carbon extraction step, a further separa- tion by HPTLC was required. The drug absence was validated over 0.1 mg/100g. Since the TRT amount in pharmaceuticals for topical use is 10 to 100 mg/100g, this revelation limit assures a sufficient warranty. A simplified procedure, by direct derivative spectrophotometry, may be applied for tretinoin determination in pharmaceuticals.
INTRODUCTION
Tretinoin (TRT), all-trans retinoic acid, is used for the treatment of severe cystic acne (1-2) and other skin diseases (3), for its positive action on cell proliferation and kera- tinization of the skin, as well as for decreasing sebum secretion and inflammation (4).
Research with retinoids and clinical observations in humans sometimes gives apparently contradictory results: while stimulating the proliferation of normal epidermal cells, retinoids may check the growth of psoriatic cells and neoplasms, but the side effects of these compounds are fairly unpleasant (3). Sun exposure during treatment must be stringently avoided. Teratogenicity for isotretinoin is well documented (5,6), and it is suspected as a potential effect of tretinoin. For these reasons, the use of tretinoin in pregnancy is forbidden.
On 27 July 1976 the European Community promulgated Law 76/768, actuated in Italy with Law 11 October 1986 no. 713, which forbids the use of TRT and several other chemicals in the cosmetic field. Furthermore, in Italy the Ministry of Health, with Cir- cular 18 October 1990 no. 27, has committed the public laboratories to check for the absence of TRT in cosmetics.
Analytical methods for TRT have been developed by using HPLC on biological samples (7) and on anti-aging cosmetics (8,9); the U.S. Pharmacopeia 23rd Rev. (10) reports a
325
326 JOURNAL OF THE SOCIETY OF COSMETIC CHEMISTS
chromatographic assay on creams and gels calculating the analyte amount in compari- son with a standard preparation.
In this paper a procedure is described for routine control of skin-care cosmetics, like creams, gels, lotions, and ointments, able to reveal the possible presence of TRT in very low concentration. Due to the interferences of the complex cosmetic formulations, a treatment was required to simplify the matrix and to enrich the TRT concentration level in the sample. For this purpose, the cosmetic, dispersed in tetrahydrofuran, was treated with a carbon column. After removing excipients among the carbon granules and washing with repeated amounts of chloroform, pyridine was finally used as analyte eluent. TRT determination was performed on the pyridinic solution by UV-derivative spectrophotometry.
In the case of cosmetics containing UV filters highly overlapping the UV curve of TRT, a full fractionation with an alternative method was needed. Therefore, a further procedure by HPTLC densitometry was developed, performing the acidification of the pyridinic eluate with hydrochloric acid and the analyte extraction with methylene chloride.
It is plain that, in any case, when the UV signals are not clearly ascribed to TRT, due to whatever interference, the analyte presence can be assured by the HPTLC method. Sev- eral attempts to apply an HPTLC procedure without a prior fractionation and analyte enrichment of the samples proved to be unsuccessful.
The derivative spectrophotometric method was also suitable for TRT assay in pharma- ceutics, directly on a tetrahydrofuran suspension of the samples without any removal of the other components.
EXPERIMENTAL
MATERIALS
Tretinoin was purchased from Aldrich Chemicals (USA); HPTLC plates (Kieselgel 60, 10 )< 10 cm) from Merck (Germany); and nylon membrane filters, 0.45-1•m-pore size, from Whatman (England). All solvents, supplied by C. Erba (Italy), were of analytical grade.
Active carbon types studied are reported in Table I. Ointment and cream bases, used for recovery studies, were marketed by Resriva (Italy) and Schering-Plough (Italy).
Table I
Carbon Types Investigated
Proprietary name Particle size Supplying firms
Granular 1.5 mm Merck (Germany) Granular 2.5 mm Merck
Pharmaceutical forms assayed were: Retin-A cream 0.010%, 0.025%, 0.05%, gel 0.025%, and lotion 0.05 mg/ml (Cilag, Switzerland); Airol cream 0.05% and lotion 0.05% (Roche, Switzerland); and Apsor ointment 0.1% (IDI Farm., Italy).
The following commonly used cream and ointment excipients were used: 3-butyl-4- hydroxyanisole, diethylene glycol monoethyl ether, dimethyl polysiloxane, glyceryl be- henate, glyceril monostearate, glycerol, isopropyl myristate, lanolin, lanolin isopropyl esters, oleic acid esters, paraffin, perfluoropoliether, polyoxyethylen 40 stearate, perhy- drosqualene, propylene glycol, saturated fatty acids, triglycerides, saturated polygly- colyzed glycerides, sorbitol 70%, xanthan gum, and white wax. Several formulations with varying concentrations of these substances were prepared with the addition of known amounts of TRT.
The following products, variously employed in commercial anti-aging creams, were added to the base creams to study the potential interference: allantoin, p-aminobenzoic acid, benzoic acid, camphor, N-dimethyaminobenzoic acid, retinol, dl-o•-tocopherol, salicylic acid, salicylic esters, sorbic acid, and stearic acid.
The UV filters investigated were 2,2'-dihydroxhy-4,4'-dimethoxy-benzophenone, 2- ethylhexyl-p-methoxycinnamate, 1-(4-methoxyphenyl)-3-tert-buylphenyl) propan- 1,3- dione, 3-(4-methylbenzylidene)-camphor, and octyl-dimethyl p-aminobenzoic acid.
APPARATUS
Spectrophotometry. Spectra were recorded over the wavelength range of 450-250 nm in 10-mm silica quartz cells using a Perkin-Elmer Lambda 16 spectrophotometer; scan speed 2 nm/s; response (time constant) 1 s for zero-order and 5 s for second- and third- order derivative spectra; spectral bandwidth 1 nm; A)• 8 for both derivative orders. The spectra were elaborated with PECSS 4.0 software by Perkin Elmer.
Densitometry. Measurements were performed with a Shimadzu (USA) model CS930. Ex- perimental conditions were: absorption reading mode at 370 nm; scanning speed (lin- ear) 1 mm/s; recorder baseline 200 mV; beam size 0.4 X 0.4 mm. The development was performed in a linear development chamber (Camag, Switzerland).
Carbon columns. Glass tubes of 30 X 0.5 cm (i.d.) were used, with a capillary end of 0.05 cm (i.d.) to optimize the solvent flow. Three to five grams of carbon were washed, refluxing in Soxhelet with 200 ml of chloroform for 12 hours, then vacuum- dried at room temperature until a constant weight. One gram of dry carbon, accu- rately weighed, was transferred and gently packed in one column, obtaining a granu- lar phase height of 14 __+ 0.5 cm. For this column the intra- and inter-particles volumes proved to be 0.2 and 0.8 ml with THF, and 0.7 and 1.5 ml with pyridine, respectively.
LABORATORY PRECAUTIONS
All the assay procedures were carried out in a dark room provided with a red lamp of 60 W kept at a distance of 2 meters to avoid photodegradation of the retinoic acid (11,12). The carbon columns were protected with tin foil.
328 JOURNAL OF THE SOCIETY OF COSMETIC CHEMISTS
STANDARD SOLUTIONS
A stock solution of TRT was prepared, dissolving 100 mg, accurately weighed, in a 250-ml volumetric flask with tetrahydrofuran. Twenty working standard solutions were prepared by diluting this stock solution with THF to obtain an analyte concentration ranging between 0.1 and 60 •g/ml. Analogous standard solutions in pyridine were pre- pared.
For HPTLC analysis, ethanolic solutions were prepared in such a way that, loading on the plate volumes of 100 nl, the analyte amount was between 0.01 and 30 •g/deposit. Least squares linear regression was applied to fit plots of signal values versus theoretical concentration.
METHODS
COSMETICS
Carbon extraction. A dispersion of 3 g of the sample, accurately weighed, in 20 ml of THF, was loaded on the carbon column and flushed about 0.5 ml per minute. The col- umn was washed with portions of 2 ml of chloroform for a total of 50 ml, then dis- carded. The analyte was eluted with portions of 1 ml of pyridine for a total of 10 mi. The pyridine flow was not to be higher than 0.1 ml per minute.
UV procedure. If the cosmetic was a dermoprotective formulation for general use, TRT determination was directly performed on the pyridinic eluate by derivative spectropho- tometry through the 389-nm and 360-410-nm signals, in second and third derivative spectra, respectively. In the presence of sun filters, a further separation with HPTLC was needed.
HPTLC procedure. The solution was filtered through a 0.45-ptm-pore-size membrane, acidified with hydrochloric acid 37% (sample/HC1 1:1.25 v/v) and then extracted with methylene chloride 5 X mi. The extracts were evaporated under a gentle stream of ni- trogen and the residue dissolved in 100 p,l of ethanol. Volumes of 100 nl were spotted 1 cm from the bottom of the plate and 0.5 cm apart and developed with a hexane/ace- tone mixture (6:4 v/v). In these conditions TRT presented a Rf value of 0.72.
PHARMACEUTICALS
An amount of sample containing a declared amount of 0.5 mg of TRT was accurately weighed and transferred into a 25-ml volumetric flask containing 10 ml of tetrahydro- furan. The flask was vigorously shaken, and the suspension, diluted to volume, was spectrophotometrically analyzed by using the peak-trough 363-413 nm in the third- order derivative spectrum.
LABORATORY SAMPLE
Synthetic preparations were made by spiking ointment and cream bases with TRT to simulate samples with analyte levels within the range of 0.05 to 200 mg/100g. These samples were used to establish the accuracy of the method. Interference studies were performed, adding the above-mentioned excipients and UV filters in various mixtures and concentrations.
TRETINOIN ASSAY BY CARBON PHASE EXTRACTION 329
RESULTS AND DISCUSSION
The commercial forms of skin-care cosmetics contain excipients of very different polari- ties that make it very difficult for the preparation of an analytical sample. Among the high number of solvents tested, tetrahydrofuran gave solutions or clear dispersed phases. Unfortunately, the absorbance spectra in THF, for the commercial samples investigated, were not useful for TRT assay, due to other components totally or partially overlapping the analyte signal (353 nm) or the absorbance increase by turbidity background.
In these cases, a derivative spectrophotometric method appeared very helpful, since this technique allows one to obtain a resolution enhancement of the spectral curve and, without prior separation of insoluble excipients, to eliminate broad absorption bands re- sulting from matrix turbidity.
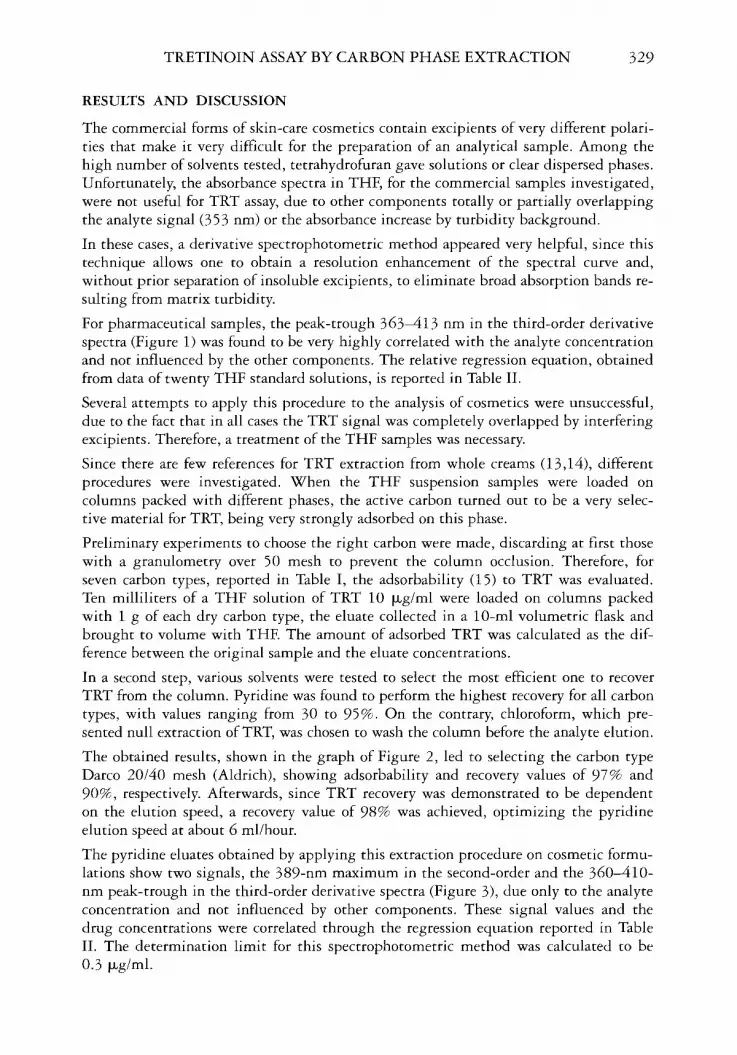
For pharmaceutical samples, the peak-trough 363413 nm in the third-order derivative spectra (Figure 1) was found to be very highly correlated with the analyte concentration and not influenced by the other components. The relative regression equation, obtained from data of twenty THF standard solutions, is reported in Table II.
Several attempts to apply this procedure to the analysis of cosmetics were unsuccessful, due to the fact that in all cases the TRT signal was completely overlapped by interfering excipients. Therefore, a treatment of the THF samples was necessary.
Since there are few references for TRT extraction from whole creams (13,14), different procedures were investigated. When the THF suspension samples were loaded on columns packed with different phases, the active carbon turned out to be a very selec- tive material for TRT, being very strongly adsorbed on this phase.
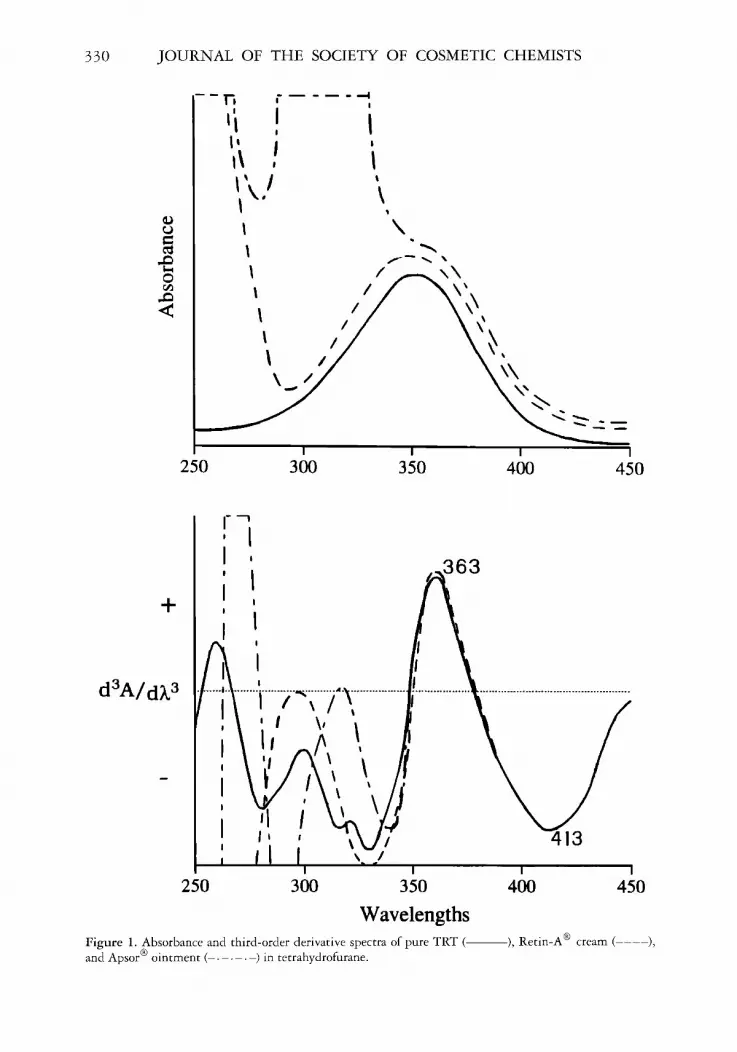
Preliminary experiments to choose the right carbon were made, discarding at first those with a granulometry over 50 mesh to prevent the column occlusion. Therefore, for seven carbon types, reported in Table I, the adsorbability (15) to TRT was evaluated. Ten milliliters of a THF solution of TRT 10 •g/ml were loaded on columns packed with 1 g of each dry carbon type, the eluate collected in a 10-ml volumetric flask and brought to volume with THE The amount of adsorbed TRT was calculated as the dif- ference between the original sample and the eluate concentrations.
In a second step, various solvents were tested to select the most efficient one to recover TRT from the column. Pyridine was found to perform the highest recovery for all carbon types, with values ranging from 30 to 95%. On the contrary, chloroform, which pre- sented null extraction of TRT, was chosen to wash the column before the analyte elution.
The obtained results, shown in the graph of Figure 2, led to selecting the carbon type Darco 20/40 mesh (Aldrich), showing adsorbability and recovery values of 97% and 90%, respectively. Afterwards, since TRT recovery was demonstrated to be dependent on the elution speed, a recovery value of 98% was achieved, optimizing the pyridine elution speed at about 6 ml/hour.
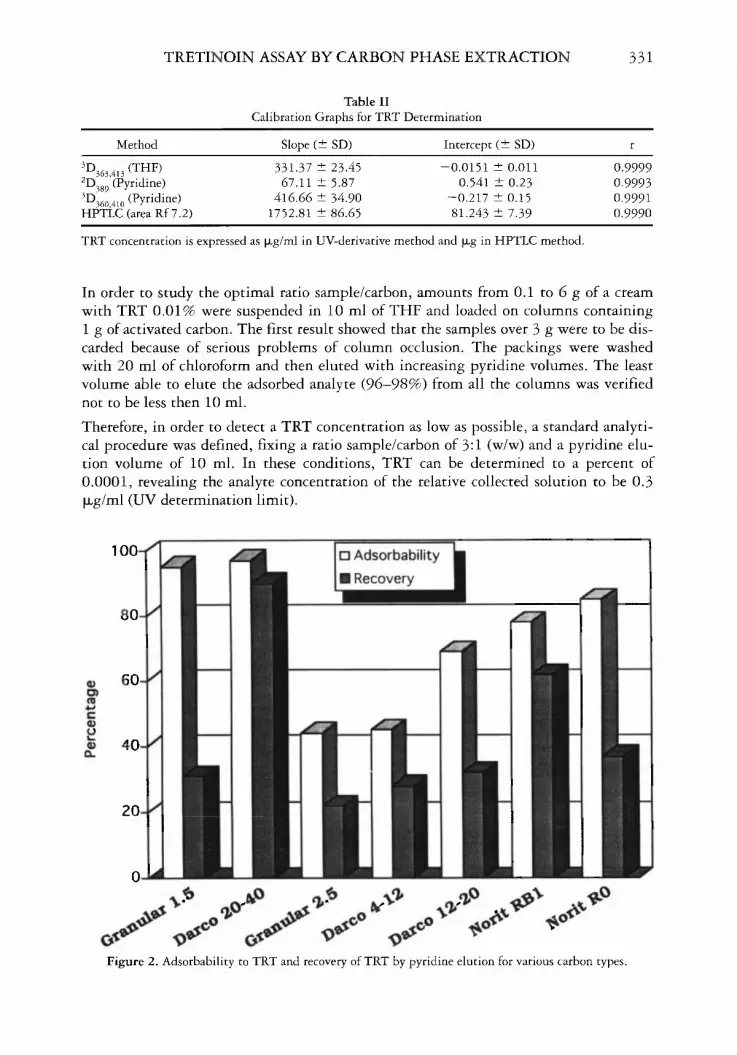
The pyridine eluates obtained by applying this extraction procedure on cosmetic formu- lations show two signals, the 389-nm maximum in the second-order and the 360-410- nm peak-trough in the third-order derivative spectra (Figure 3), due only to the analyte concentration and not influenced by other components. These signal values and the drug concentrations were correlated through the regression equation reported in Table II. The determination limit for this spectrophotometric method was calculated to be 0.3 •g/ml.
TRT concentration is expressed as •g/ml in UV-derivative method and •g in HPTLC method.
In order to study the optimal ratio sample/carbon, amounts from 0.1 to 6 g of a cream with TRT 0.01% were suspended in 10 ml of THF and loaded on columns containing 1 g of activated carbon. The first result showed that the samples over 3 g were to be dis- carded because of serious problems of column occlusion. The packings were washed with 20 ml of chloroform and then eluted with increasing pyridine volumes. The least volume able to elute the adsorbed analyte (96-98%) from all the columns was verified not to be less then 10 ml.
Therefore, in order to detect a TRT concentration as low as possible, a standard analyti- cal procedure was defined, fixing a ratio sample/carbon of 3:1 (w/w) and a pyridine elu- tion volume of 10 mi. In these conditions, TRT can be determined to a percent of 0.0001, revealing the analyte concentration of the relative collected solution to be 0.3 I•g/ml (UV determination limit).
80-
Recovery
Figure 2. Adsorbability to TRT and recovery of TRT by pyridine elution for various carbon types.
332 JOURNAL OF THE SOCIETY OF COSMETIC CHEMISTS
d•'A/d•)
t 389
. • I I I I
250 3• 350 400 450
-!-
daA/d•. a
[-3
I I
I I I
I
360
I I
I ,I • • • 250 300 350 400 450
Wavelengths Figure 3. Second- and third-order derivative s•ectra of pyridinic eluates from carbon column for pure TRT ( ) and a cosmetic formulation (Resriva base ointment) ( .... ), spiked with TRT.
TRETINOIN ASSAY BY CARBON PHASE EXTRACTION 3 3 3
24O
160 -
120 -
80-
40-
I I
I I
I I
_I
60 120
0 I I I 0 180 240 300 360
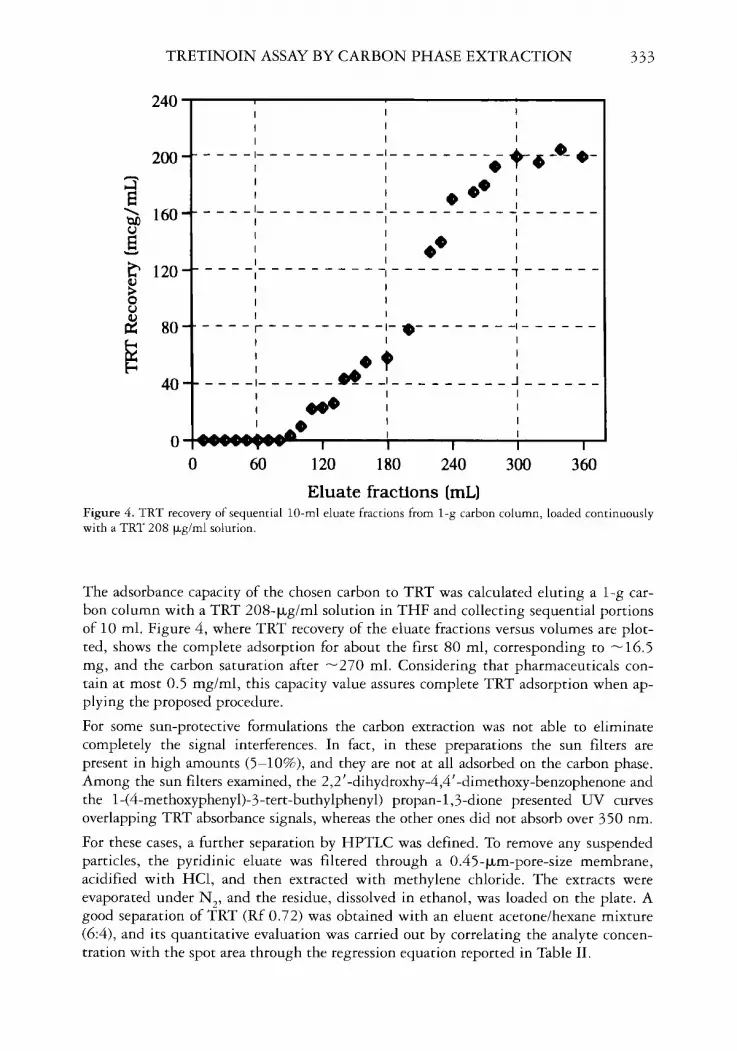
Eluate fractions (mL) Figure 4. TRT recovery of sequential 10-ml eluate fractions from 1-g carbon column, loaded continuously with a TRT 208 •xg/ml solution.
The adsorbance capacity of the chosen carbon to TRT was calculated eluting a 1-g car- bon column with a TRT 208-•g/ml solution in THF and collecting sequential portions of 10 ml. Figure 4, where TRT recovery of the eluate fractions versus volumes are plot- ted, shows the complete adsorption for about the first 80 ml, corresponding to --16.5 mg, and the carbon saturation after --270 mi. Considering that pharmaceuticals con- tain at most 0.5 mg/ml, this capacity value assures complete TRT adsorption when ap- plying the proposed procedure.
For some sun-protective formulations the carbon extraction was not able to eliminate completely the signal interferences. In fact, in these preparations the sun filters are present in high amounts (5-10%), and they are not at all adsorbed on the carbon phase. Among the sun filters examined, the 2,2'-dihydroxhy-4,4'-dimethoxy-benzophenone and the 1-(4-methoxyphenyl)-3-tert-buthylphenyl) propan-l,3-dione presented UV curves overlapping TRT absorbance signals, whereas the other ones did not absorb over 350 nm.
For these cases, a further separation by HPTLC was defined. To remove any suspended particles, the pyridinic eluate was filtered through a 0.45-•m-pore-size membrane, acidified with HC1, and then extracted with methylene chloride. The extracts were evaporated under N2, and the residue, dissolved in ethanol, was loaded on the plate. A good separation of TRT (Rf 0.72) was obtained with an eluent acetone/hexane mixture (6:4), and its quantitative evaluation was carried out by correlating the analyte concen- tration with the spot area through the regression equation reported in Table II.
334 JOURNAL OF THE SOCIETY OF COSMETIC CHEMISTS
In any case, the presence of the TRT signals in the second- and third-order derivative spectra allows one to quantify the analyte through the relative equations reported in Table II. When these signals are absent or they are influenced by whatever interference, the analyte presence can be assured by applying the HPTLC method.
VALIDATION
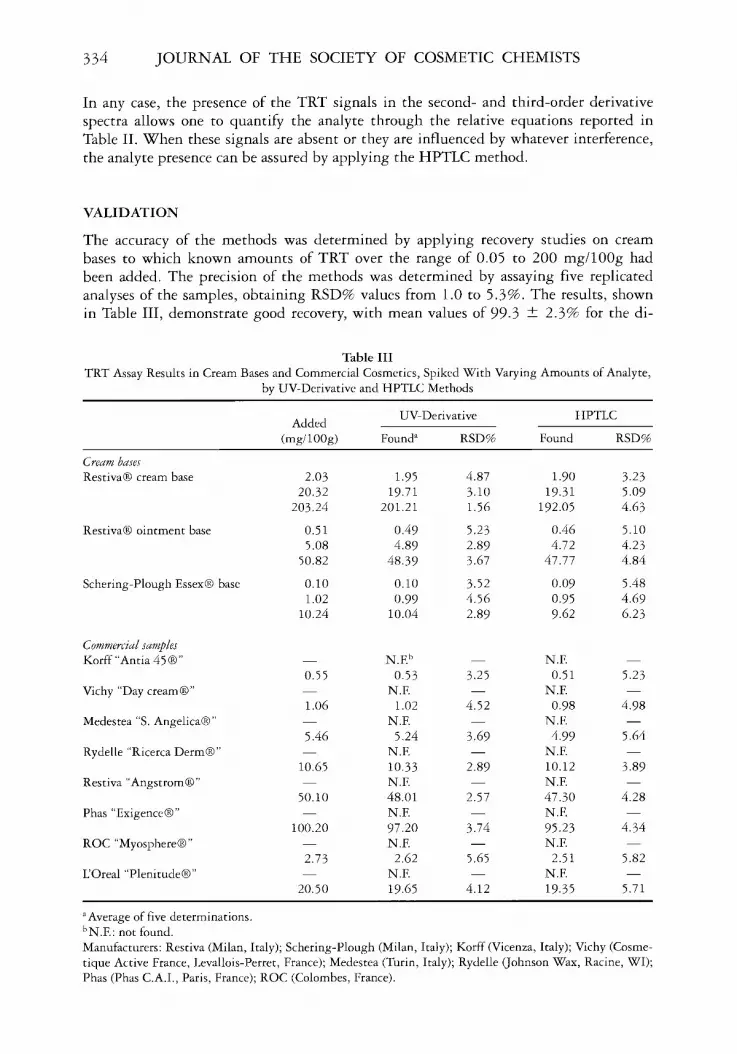
The accuracy of the methods was determined by applying recovery studies on cream bases to which known amounts of TRT over the range of 0.05 to 200 mg/100g had been added. The precision of the methods was determined by assaying five replicated analyses of the samples, obtaining RSD% values from 1.0 to 5.3%. The results, shown in Table III, demonstrate good recovery, with mean values of 99.3 +- 2.3% for the di-
Table III
TRT Assay Results in Cream Bases and Commercial Cosmetics, Spiked With Varying Amounts of Analyte, by UV-Derivative and HPTLC Methods
Retin-A gel 25.00 25.58 2.63 Retin-A lotion 50.00 49.30 1.56
aAverage of five determinations.
rect spectrophotometric analysis, 97.8 --- 4.2% for the carbon extraction procedure, and 95.4 + 5.2% for the HPTLC assay. Several substances, reported above, were added with varying concentrations to the cream bases and to several commercial formulations, showing in all cases no interference with the TRT assay.
The linearity for UV analysis was carried out by analysis of twenty TRT standard solu- tions in THF and pyridine over the range of 0.3 to 60 p•g/ml. The correlation coeffi- cients were not less than 0.998. Analogous results were obtained by analyzing twenty cream samples, spiked with TRT between 0.1% and 200 mg/100 g, by direct spec- trophotometric analysis and carbon phase extraction.
Assuming that the signal-to-noise ratio should be at least 3, the determination limit for the spectrophotometric method both in THF and pyridine solutions was calculated to be 0.1 mg/100 g. For the HPTLC method, detection and determination limits proved to be 0.05 and 0.1 mg/100 g, respectively.
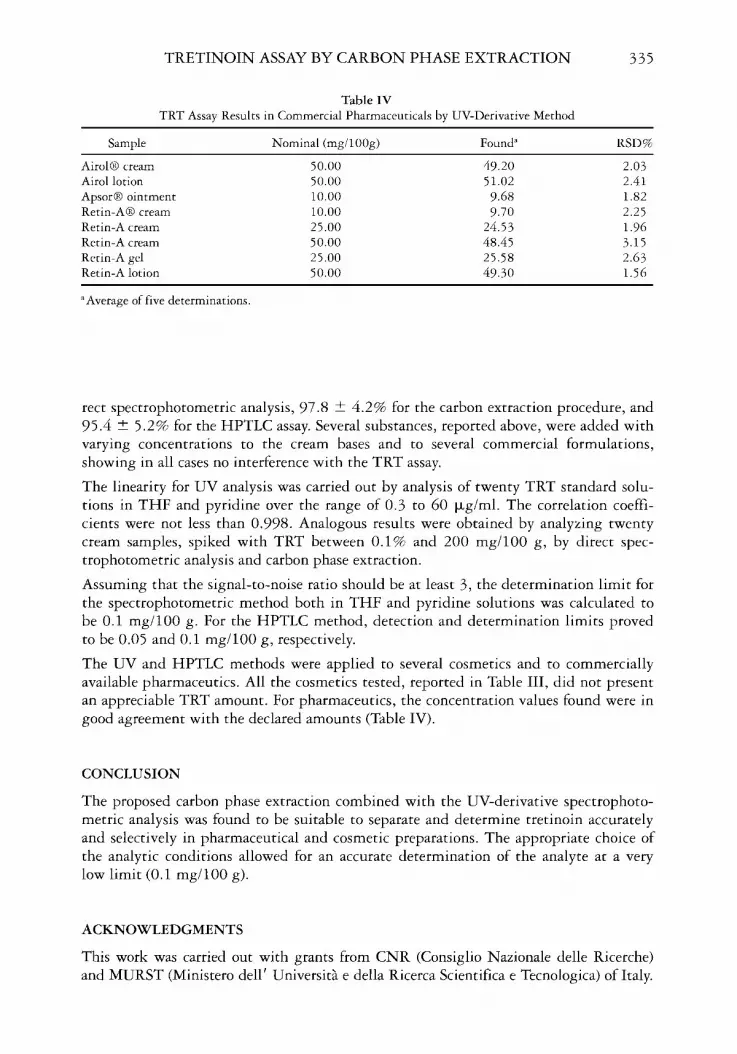
The UV and HPTLC methods were applied to several cosmetics and to commercially available pharmaceutics. All the cosmetics tested, reported in Table III, did not present an appreciable TRT amount. For pharmaceutics, the concentration values found were in good agreement with the declared amounts (Table IV).
CONCLUSION
The proposed carbon phase extraction combined with the UV-derivative spectrophoto- metric analysis was found to be suitable to separate and determine tretinoin accurately and selectively in pharmaceutical and cosmetic preparations. The appropriate choice of the analytic conditions allowed for an accurate determination of the analyte at a very low limit (0.1 mg/100 g).
ACKNOWLEDGMENTS
This work was carried out with grants from CNR (Consiglio Nazionale delle Ricerche) and MURST (Ministero dell' Universit• e della Ricerca Scientifica e Tecnologica) of Italy.
336 JOURNAL OF THE SOCIETY OF COSMETIC CHEMISTS
REFERENCES
(1) G. L. Peck, T. G. Olsen, F. W. Yoder, J. S. Strauss, D. T. Downing, M. Pandya, D. Butkus, and J. Arnaud-Battanier, Prolonged remission of cystis ache and conglobate ache with retinoic acid, N. Engl. J. Med., 300, 329-333 (1979).
(2) W. Bollag, C. E. Orfanos, O. Braun-Falco, E. M. Farber, Ch. Grupper, M. K. Polano, and R. Schuppli, Retinoids: Advances in Basic Research and Therapy (Springer, Berlin, ! 98 !), pp. 7-11.
(3) W. Bollag, Ed., Retinoids: New Trends in Research and Therapy 0. H. Saurat, Basle, 1985), pp. 274-277. (4) R. Hermitre, Aged skin, retinoids and alpha hydroxy acids, Cosmet. Toilets, 107, 63-67 (1992). (5) E.J. Hixson, J. A. Burdershaw, E. P. Denine, and S. D. Harrison, Comparative subchronic toxicity of
all-trans and 13-cis•retinoic acid in Sprague-Dawley rats, ToxicoL Appl. PharmacoL, 47, 359-365 (1979).
(6) D. M. Kochar, J. D. Penner, and C. I. Tellone, Comparative teratogenic activities of two retinoids: Ef- fects on palate and limb development, Teratogen. Carcinogen. Mutagen., 4, 377-387 (1984).
(7) R. Wyss and F. Bucheli, Determination of highly protein bound drugs in plasma using high-perform- ance liquid chromatography and column switching, exemplified by the retinoids. J. Chromatog•, 456, 33-43 (1988).
(8) L. Gagliardi, A. Amaro, L. Turchetto, D. Tonelli, and F. Chimenti, Identificazione e dosaggio della tretinoina nei prodotti cosmetici mediante HPLC, Costa. DermatoL, 5, 19-24 (1989).
(9) M. B. Kril, K. A. Burke, J. E. Dinunzio, and R. R. Gadde, Determination of tretinoin in creams by high-performance liquid chromatography. J. Chromatog•, 522,227-234 (1990).
(10) United States Pharmacopeia, 23rd ed. (United States Pharmacopeia Convention, Rockville, MD, 1995).
(11) G. M. Landers and J. A. Olson, Absence of isomerization of retinyl palmirate, retinol and retinal in chlorinated and nonchlorinated solvents under gold light,J. Assoc. Off Anal Chem., 69, 50-54 (1986).
(12) L. Bonhomme, B. Duleba, T. Beugre, and G. Fredj, HPLC determination of the stability of retinoic acid in gel formulation, Int. J. Pharm., 65, R9-R10 (1990).
(13) S.C. Kundu, A.D. Cameron, N.M. Meltzer, and T. W. Quick, Development and validation of method for determination of in vitro release of retinoic acid from creams, Drugs Dev. Ind. Pharm., 19, 425-438 (1993).
(14) M. J. Lucero, J. Vigo, and M. J. Leon, Stability of hydrophilic gels of tretinoin, Int. J. Pharm., 110, 241-248 (1994).
(15) I. Abe, H. Kamaya, and I. Ueda, Adsorption of local anesthetics on activated carbon: Freundlich ad- sorption isotherms,J. Pharm. Sci., 79, 354-358 (1990).


![[123doc] Vietnam Pharmaceuticals Healthcare Report Q1 2016](https://static.documents.page/doc/80x56/636262320bc31e3c17052c93/123doc-vietnam-pharmaceuticals-healthcare-report-q1-2016.jpg)


