+ All documents
Home > Documents > Drought Modeling using Geospatial Technology in Tirunelveli District

Drought Modeling using Geospatial Technology in Tirunelveli District

Date post: 15-May-2023
Category:
Upload: ramjimmakwana
View: 2 times
Download: 0 times
Share this document with a friend
11
IJIRST International Journal for Innovative Research in Science & Technology| Volume 1 | Issue 12 | May 2015 ISSN (online): 2349-6010 All rights reserved by www.ijirst.org 288 Drought Modeling using Geospatial Technology in Tirunelveli District M. Muthumeena G. Devi PG Student of Remote Sensing Assistant Professor Department of Civil Engineering Department of Civil Engineering Regional Centre of Anna University, Tirunelveli-627007 Regional Centre of Anna University, Tirunelveli-627007 Abstract Drought is considered to be most vulnerable National hazards affects the vast amount of people. The impacts of drought are non- structural and spread over a large geographical area which damages the life of the human beings. Tirunelveli is located in South part of Tamilnadu state. India, was selected as the study area. All the spatial and temporal data needed for the drought analysis were collected for Tirunelveli District from various Government departments. GIS is used to analyse the spatial and temporal variation of meteorological data across the study area to determine the affected area accurately for effective drought proofing. Meteorological drought analysis was performed by Standardised Precipitation Index (SPI) method to determine drought severity class. Using ten years rainfall data, frequencies of various classes of drought were determined. Based on this, meteorological drought risk area map Keywords: Meteorological Drought, Standardized Precipitation Index, Agricultural Drought, NDVI, GIS _______________________________________________________________________________________________________ I. INTRODUCTION Drought is considered by many to be the most complex but least understood of all natural hazards, affecting more people than any other hazard (G.Hagman 1984). However, there remains much confusion within the about its characteristics. It is precisely this confusion within the scientific and policy communities about its characteristics. It is precisely this confusion that explains, to some extent, the lack of progress in drought preparedness in most parts of the world. Drought is a slow-onset, creeping natural hazard that is a normal part of climate for virtually all regions of the world; it results in serious economic, social, and environmental impacts Drought onset and end are often difficult to determine, as is its severity. Types of Droughts: A. Droughts can be classified in four major categories: Meteorological drought Hydrological drought Agricultural drought Socio-economic drought II. STUDY AREA Tirunelveli district was formed in the year 1790 by the East India Company. The name tirunelveli has been composed from the three tamil word i.e „thiru-nel-veli‟ meaning Sacred Paddy Hedge. with effect from 20.10.1986 the district was bifurcatedand new Tuticorin District was formed. Tirunelveli District having geographical area of 6759 sq.kms, in theSoutheastern portion of Tamil Nadu is triangular in shape. It lies between 8° 05‟ and 9° 30‟ of the Northern latitudeand 77° 05‟ and 78° 25‟ of Eastern longitude. The district is located in the southern part of Tamil Nadu andsurrounded by Virudhunagar District on the north, Western Ghats on the West, Kanniyakumari District on the south,Tuticorin District on the East. The lifeline of the district is Tamiraparaniriver which feeds the district and quenches the thirst of the residents. Location map of Tirunelveli District is shown in fig.1
Transcript

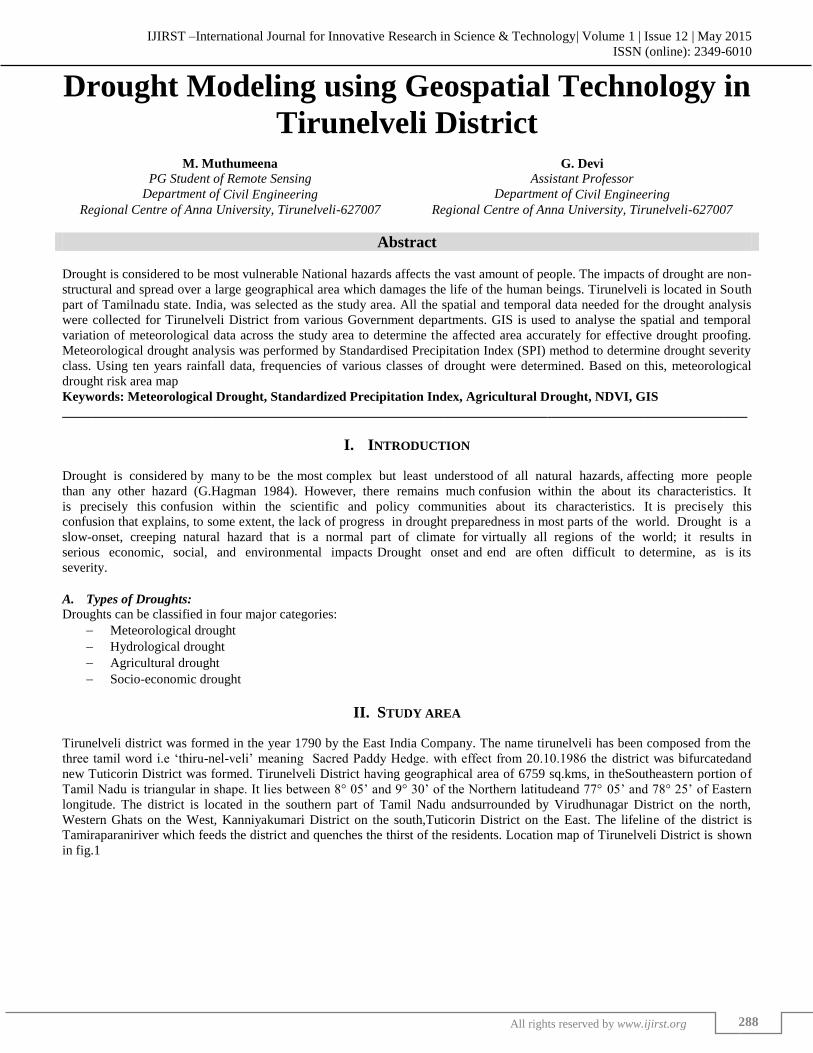
IJIRST –International Journal for Innovative Research in Science & Technology| Volume 1 | Issue 12 | May 2015 ISSN (online): 2349-6010

All rights reserved by www.ijirst.org 288

Drought Modeling using Geospatial Technology in

Tirunelveli District

M. Muthumeena G. Devi

PG Student of Remote Sensing Assistant Professor

Department of Civil Engineering Department of Civil Engineering

Regional Centre of Anna University, Tirunelveli-627007 Regional Centre of Anna University, Tirunelveli-627007

Abstract

Drought is considered to be most vulnerable National hazards affects the vast amount of people. The impacts of drought are non-

structural and spread over a large geographical area which damages the life of the human beings. Tirunelveli is located in South

part of Tamilnadu state. India, was selected as the study area. All the spatial and temporal data needed for the drought analysis

were collected for Tirunelveli District from various Government departments. GIS is used to analyse the spatial and temporal

variation of meteorological data across the study area to determine the affected area accurately for effective drought proofing.

Meteorological drought analysis was performed by Standardised Precipitation Index (SPI) method to determine drought severity

class. Using ten years rainfall data, frequencies of various classes of drought were determined. Based on this, meteorological

drought risk area map

Keywords: Meteorological Drought, Standardized Precipitation Index, Agricultural Drought, NDVI, GIS

_______________________________________________________________________________________________________

I. INTRODUCTION

Drought is considered by many to be the most complex but least understood of all natural hazards, affecting more people

than any other hazard (G.Hagman 1984). However, there remains much confusion within the about its characteristics. It

is precisely this confusion within the scientific and policy communities about its characteristics. It is precisely this

confusion that explains, to some extent, the lack of progress in drought preparedness in most parts of the world. Drought is a

slow-onset, creeping natural hazard that is a normal part of climate for virtually all regions of the world; it results in

serious economic, social, and environmental impacts Drought onset and end are often difficult to determine, as is its

severity.

Types of Droughts: A.

Droughts can be classified in four major categories:

Meteorological drought

Hydrological drought

Agricultural drought

Socio-economic drought

II. STUDY AREA

Tirunelveli district was formed in the year 1790 by the East India Company. The name tirunelveli has been composed from the

three tamil word i.e „thiru-nel-veli‟ meaning Sacred Paddy Hedge. with effect from 20.10.1986 the district was bifurcatedand

new Tuticorin District was formed. Tirunelveli District having geographical area of 6759 sq.kms, in theSoutheastern portion of

Tamil Nadu is triangular in shape. It lies between 8° 05‟ and 9° 30‟ of the Northern latitudeand 77° 05‟ and 78° 25‟ of Eastern

longitude. The district is located in the southern part of Tamil Nadu andsurrounded by Virudhunagar District on the north,

Western Ghats on the West, Kanniyakumari District on the south,Tuticorin District on the East. The lifeline of the district is

Tamiraparaniriver which feeds the district and quenches the thirst of the residents. Location map of Tirunelveli District is shown

in fig.1

Drought Modeling using Geospatial Technology in Tirunelveli District (IJIRST/ Volume 1 / Issue 12 / 051)

All rights reserved by www.ijirst.org 289

Fig. 1: Location Map of Tirunelveli District

III. METHODOLOGY

Meteorological Drought: A.

Definition: 1)

It can be defined as reduction in rainfall supply compared with specified average condition over some specified

period”.

Climatic drought is usually defined based on the degree of dryness and the duration of the dry period. Drought generally

occurs with a Climatic drought period.

Rainfall Analysis: 2)

Rainfall is a main factor, which is responsible for vegetation, Hydrology and it is particularly most important to agriculture.

Monthly rainfall data for 10 rainfall station in Tirunelveli District were collected from PWD, during 2004-2013. The statistical

parameters like mean, standard deviation were identified. Rain gauge location map of Tirunelveli District is shown in Figure 2.

Fig. 2: Rainfall Stations In Tirunelveli District

Meteorological Drought Assessment: 3)

SPI method is a simple and widely used one. The method gives close results achieved with the conventional methods used to

identify meteorological drought. SPI is calculated based on equation is given below

(1)

Xi-monthly rainfall of the station;

Xm-rainfall mean; Ϭ- standard deviation

Where,

Drought Modeling using Geospatial Technology in Tirunelveli District (IJIRST/ Volume 1 / Issue 12 / 051)

All rights reserved by www.ijirst.org 290

(2)

Xi-monthly rainfall of the station, µ-rainfall mean, n-number of values.

Drought Severity Classification Using SPI Values given in table Table – 1

Source: (U.S. National Drought Mitigation Centre)

Category Description Standardized Precipitation Index (SPI)

DO No drought -0.5 and above

D1 Abnormally dry -0.5 - -0.7

D2 Moderate drought -0.8 - -1.2

D3 Severe drought -1.3 - -1.5

D4 Extreme drought -1.6 - -1.9

D5 Exceptional drought -2 or less

The drought severity classes were found out for each rain gauge station on a yearly basis. The frequency of various classes of

drought severity for each station was found out. The weight ages 0, 1, 2, and 3 are assigned to drought severity classes of no,

mild, moderate and severe droughts respectively. The meteorological drought risk index of each station is found out by

multiplying the frequency of each class of drought severity by the corresponding weight age. The spatial distribution of drought

risk was found out using the nearest neighborhood analysis in GIS.

A schematic of the methodology has been presented in Figure 3

Fig. 3: Methodology

Meteorological Drought Risk Results: 4)

Meteorological drought risk index was developed by frequency analysis based on ten years rainfall data. Meteorological risk map

of the study area were generated for the study area. This figure releaved the presence of very severe metereologcial drought risk

and where as the slight metereologcial drought risks exist in Tirunelveli District. Fig 4,5,6,7 are represent the season wise

drought occurrence in tirunelveli District during 2004-2013.

Four drought risk classes were delineated based on the ranges of drought risk index. The spatial interpolation of

meteorological drought risk index was carried out using Arc GIS. Fig 8,9 shows the overall meteorological drought risk area map

and Spatial Distribution of annual Rainfall of Tirunelveli district.

Drought Modeling using Geospatial Technology in Tirunelveli District (IJIRST/ Volume 1 / Issue 12 / 051)

All rights reserved by www.ijirst.org 291

Fig. 4: Drought Severity on Winter Season in Tirunelveli District during 2004-2013

Fig. 5: Drought Severity in Summer Season O Tirunelveli District during 2004-2013

Fig. 6: Drought Severity in North-East Season of Tirunelveli District during 2004-2013

AMBAI

AYIKUDI

TENKASI

SIVAGIRI

NANGUNERI

SENKOTTAI

RADHAPURAM

TIRUNELVELI

SANKARANKOIL

PALAYAMKOTTAI

78°0'0"E

78°0'0"E

77°50'0"E

77°50'0"E

77°40'0"E

77°40'0"E

77°30'0"E

77°30'0"E

77°20'0"E

77°20'0"E

77°10'0"E

77°10'0"E

9°20'0"N 9°20'0"N

9°10'0"N 9°10'0"N

9°0'0"N 9°0'0"N

8°50'0"N 8°50'0"N

8°40'0"N 8°40'0"N

8°30'0"N 8°30'0"N

8°20'0"N 8°20'0"N

8°10'0"N 8°10'0"N

0 0.07 0.14 0.21 0.280.035Decimal Degrees

±

Drought risk class

Very mild(0)

Mild(1-5)

Moderate(5-10)

AMBAI

AYIKUDI

TENKASI

SIVAGIRI

NANGUNERI

SENKOTTAI

RADHAPURAM

TIRUNELVELI

SANKARANKOIL

PALAYAMKOTTAI

78°0'0"E

78°0'0"E

77°50'0"E

77°50'0"E

77°40'0"E

77°40'0"E

77°30'0"E

77°30'0"E

77°20'0"E

77°20'0"E

77°10'0"E

77°10'0"E

9°20'0"N 9°20'0"N

9°10'0"N 9°10'0"N

9°0'0"N 9°0'0"N

8°50'0"N 8°50'0"N

8°40'0"N 8°40'0"N

8°30'0"N 8°30'0"N

8°20'0"N 8°20'0"N

8°10'0"N 8°10'0"N

0 0.07 0.14 0.21 0.280.035Decimal Degrees

±

Drought risk class

Mild(1-5)

Moderate(5-10)

Severe(>10)

Drought Modeling using Geospatial Technology in Tirunelveli District (IJIRST/ Volume 1 / Issue 12 / 051)

All rights reserved by www.ijirst.org 292

Fig. 7: Drought Severity in South-West Season Of Tirunelveli District during 2004-2013

Fig. 8: Meteorological Drought Risk Map of District

Fig. 9: Spatial Distribution of Annual Rainfall in Tirunelveli District Tirunelveli District during 2004-2013

AMBAI

AYIKUDI

TENKASI

SIVAGIRI

NANGUNERI

SENKOTTAI

RADHAPURAM

TIRUNELVELI

SANKARANKOIL

PALAYAMKOTTAI

78°0'0"E

78°0'0"E

77°50'0"E

77°50'0"E

77°40'0"E

77°40'0"E

77°30'0"E

77°30'0"E

77°20'0"E

77°20'0"E

77°10'0"E

77°10'0"E

9°20'0"N 9°20'0"N

9°10'0"N 9°10'0"N

9°0'0"N 9°0'0"N

8°50'0"N 8°50'0"N

8°40'0"N 8°40'0"N

8°30'0"N 8°30'0"N

8°20'0"N 8°20'0"N

8°10'0"N 8°10'0"N

0 0.07 0.14 0.21 0.280.035Decimal Degrees

±

Drought risk class

Very mild(0)

Mild(1-5)

Drought Modeling using Geospatial Technology in Tirunelveli District (IJIRST/ Volume 1 / Issue 12 / 051)

All rights reserved by www.ijirst.org 293

Meteorological Drought Risk Areas: 5)

SPI is a simple methodology to assess meteorological drought severity of a region. A meteorological drought risk index was

developed using the frequency of different classes of drought severity (fig 8) ascertained by this method. Table – 2

Meteorological Drought Risk Areas

S.NO DESCRIPTION NO. OF TALUKS NAME OF TALUKS

1 Very mild 2 Ambai, Tenkasi

2 Mild 3 Sivagiri, Radhapuram, Alangulam

3 Moderate 3 Tirunelveli, Palayamkottai, Senkottai,

4 severe 2 Nanguneri, Sankarankoi.

Agricultural Drought: B.

Definition: 1)

Agricultural drought is a condition in which there is insufficient soil moisture available to a crop resulting in reduction

of yield.

Agricultural drought is the end effect of agricultural and hydrological drought.

Agricultural drought as an inadequate amount of soil water available during the critical crop growth periods.

Crop Yield Analysis: 2)

Crop yield is main factor, which is responsible for vegetation and NDVI.Crop yield data for 19 blocks in Tirunelveli District

were collected fromAgricultural Statistics Department, during 2005-2013. Agricultural blocks location map of Tirunelveli

District is shown in Figure 10.

NDVI Anomaly: 3)

Fig. 9:

Crop Yield Anomaly: 4)

Ya = ((Yi – Yt) / (Yt))*100

Ya - yield anomaly, Yi - yield in particular year, Yt – yield trend in 10 years

Drought Modeling using Geospatial Technology in Tirunelveli District (IJIRST/ Volume 1 / Issue 12 / 051)

All rights reserved by www.ijirst.org 294

Fig. 10: Agricultural Blocks in Tirunelveli District

Fig. 10: Landuse Map of Tirunelveli

Yield Trend Analysis: 5)

Yield trend has been computed and it was found by using maximum correlation during the last 10 years. In table.2 showed a

good correlation, which states that a good increase in production throughout years. Table – 3

Block Wise Correlation between Crop Yield and NDVI Anomaly

Spatial Pattern of NDVI Mean and Anomaly: 6)

This fig.12 shows the temporal pattern of NDVI from 2005-2013. It is evident from the graph that during the low rainfall years

NDVI values were also low.

Drought Modeling using Geospatial Technology in Tirunelveli District (IJIRST/ Volume 1 / Issue 12 / 051)

All rights reserved by www.ijirst.org 295

Fig. 12: Mean NDVI

Table – 4

Temporal Trends of NDVI and Rainfall (2005-2013)

This shows that rainfall has a great impact on the vegetation condition. At place with good amount of rainfall, vegetation

shows a good response and NDVI values at these places is high as compared to low rainfall areas.

Fig. 13: Spatial pattern of NDVI Anomaly

The approximate NDVI equivalent threshold from crop yield trend for the district as a whole was computed and agricultural

drought risk was thus delineated as slight, moderate and severe. Where NDVI equivalent threshold for slight drought was -10%,

moderate as -25% and severe as -50% fig.14 shows the frequency of each type of risk in agricultural drought.

Drought Modeling using Geospatial Technology in Tirunelveli District (IJIRST/ Volume 1 / Issue 12 / 051)

All rights reserved by www.ijirst.org 296

Fig. 14: Frequency of Agricultural Drought Risk in Three Different Severity Classes

Agricultural Drought Risk Areas: 7)

Finally to get agricultural risk map (fig 15) which shows the frequency of years in each risk level were multiplied by weights

according to the risk level and therefore high weight of 0.5 was given to severe, 0.3 to moderate, 0.2 to mild and 0.1 to very mild

risk.

Fig. 15: Agricultural Drought Risk Areas

NDVI is a simple methodology to assess agricultural drought severity of a region. An agricultural drought risk index was

developed using thefrequency of different classes of drought severity (table 4) ascertained by this method. Table – 5

Agricultural Drought Risk Areas

S.NO DESCRIPTION NO. OF TALUKS NAME OF TALUKS

1 Very mild 3 Ambai, Tenkasi, Senkottai

2 Mild 3 Sivagiri, Tirunelveli, Palayamkottai

3 Moderate 2 Radhapuram, Alangulam

4 Severe 2 Sankarankoil,

Nanguneri.

Drought Risk Classification: 8)

Final drought risk map, which has been obtained by integrating the risk map generated from Agricultural and Meteorological

drought.

Drought Modeling using Geospatial Technology in Tirunelveli District (IJIRST/ Volume 1 / Issue 12 / 051)

All rights reserved by www.ijirst.org 297

Fig. 16: Agricultural and Meteorological Drought

Table - 5

Agricultural and Meteorological Drought

s.no Description Agricultural Drought Meteorological Drought

No. of

Taluks Name of Taluks

No. of

Taluks Name of Taluks

1 Very mild 3 Ambai, Tenkasi,

Senkottai 2 Ambai, Tenkasi

2 Mild 3

Sivagiri,

Tirunelveli,

Palayamkottai

3 Sivagiri, Radhapuram,

Alangulam

3 Moderate 2 Radhapuram,

Alangulam 3

Tirunelveli, Palayamkottai,

Senkottai

4 Severe 2 Sankarankoil,

Nanguneri. 2 SankarankoilNanguneri.

Total 10 10

Area Facing Combined Risk: 9)

These maps were integrated using Arc GIS. The accompanying (Table.5) and (Fig.17)shows the area affected by the combined

risk. An Agricultural drought risk index was developed using the frequency of different types of drought severity (Table.6)

ascertained by this method.

Fig. 17: Combined Agricultural and Meteorological Drought Risk Areas

Drought Modeling using Geospatial Technology in Tirunelveli District (IJIRST/ Volume 1 / Issue 12 / 051)

All rights reserved by www.ijirst.org 298

Table - 6

Combined Agricultural and Meteorological Drought Risk Areas

S.NO DESCRIP

TION NO. OF TALUKS NAME OF TALUKS

1 Very mild 2 Ambai, Tenkasi

2 Mild 3 Sivagiri, Tirunelveli, Senkottai.

3 Moderate 3 Radhapuram, Alangulam, Palayamkottai.

4 severe 2 Nanguneri, Sankarankoi.

IV. CONCLUSION

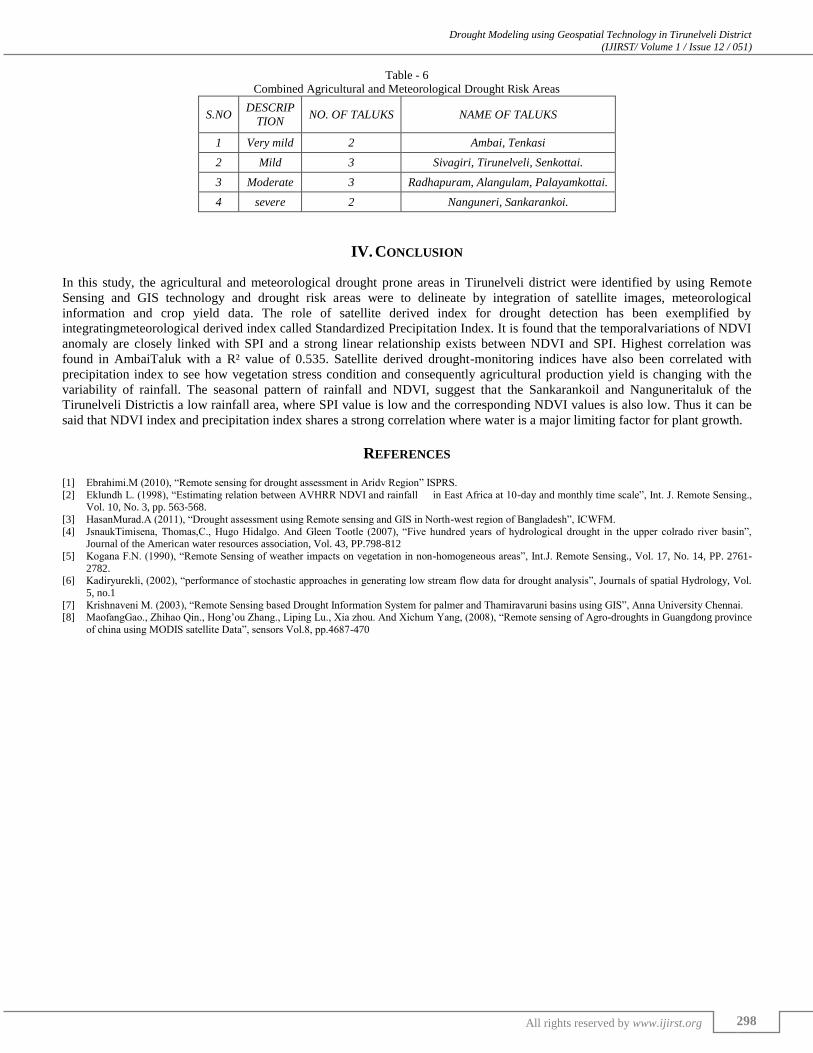
In this study, the agricultural and meteorological drought prone areas in Tirunelveli district were identified by using Remote

Sensing and GIS technology and drought risk areas were to delineate by integration of satellite images, meteorological

information and crop yield data. The role of satellite derived index for drought detection has been exemplified by

integratingmeteorological derived index called Standardized Precipitation Index. It is found that the temporalvariations of NDVI

anomaly are closely linked with SPI and a strong linear relationship exists between NDVI and SPI. Highest correlation was

found in AmbaiTaluk with a R² value of 0.535. Satellite derived drought-monitoring indices have also been correlated with

precipitation index to see how vegetation stress condition and consequently agricultural production yield is changing with the

variability of rainfall. The seasonal pattern of rainfall and NDVI, suggest that the Sankarankoil and Nanguneritaluk of the

Tirunelveli Districtis a low rainfall area, where SPI value is low and the corresponding NDVI values is also low. Thus it can be

said that NDVI index and precipitation index shares a strong correlation where water is a major limiting factor for plant growth.

REFERENCES

[1] Ebrahimi.M (2010), “Remote sensing for drought assessment in Aridv Region” ISPRS.

[2] Eklundh L. (1998), “Estimating relation between AVHRR NDVI and rainfall in East Africa at 10-day and monthly time scale”, Int. J. Remote Sensing., Vol. 10, No. 3, pp. 563-568.

[3] HasanMurad.A (2011), “Drought assessment using Remote sensing and GIS in North-west region of Bangladesh”, ICWFM.

[4] JsnaukTimisena, Thomas,C., Hugo Hidalgo. And Gleen Tootle (2007), “Five hundred years of hydrological drought in the upper colrado river basin”, Journal of the American water resources association, Vol. 43, PP.798-812

[5] Kogana F.N. (1990), “Remote Sensing of weather impacts on vegetation in non-homogeneous areas”, Int.J. Remote Sensing., Vol. 17, No. 14, PP. 2761-

2782. [6] Kadiryurekli, (2002), “performance of stochastic approaches in generating low stream flow data for drought analysis”, Journals of spatial Hydrology, Vol.

5, no.1

[7] Krishnaveni M. (2003), “Remote Sensing based Drought Information System for palmer and Thamiravaruni basins using GIS”, Anna University Chennai. [8] MaofangGao., Zhihao Qin., Hong‟ou Zhang., Liping Lu., Xia zhou. And Xichum Yang, (2008), “Remote sensing of Agro-droughts in Guangdong province

of china using MODIS satellite Data”, sensors Vol.8, pp.4687-470


Recommended