Page 1
Brunei Darussalam
Prepared by : Ika Nurjanah (NEX150442)
2.1 Population
1. Brunei Darussalam
As of 1 January 2015, the population of Brunei Darussalam was estimated to be
433.775 people. This is an increase of 1.71 % (7 301 people) compared to population of
426.474 the year before. In 2014 the natural increase was positive, as the number of
births exceeded the number of deaths by 6.192. Due to external migration, the population
increased by 1.109. The sex ratio of the total population was 1.020 (1 020 males per 1
000 females) which is higher than global sex ratio. The global sex ratio in the world was
approximately 1.016 males to 1.000 females as of 2014.
During 2015 Brunei Darussalam population is estimated to be increased by 7 426
people and reach 441.201 in the beginning of 2016. The natural increase is expected to be
positive, as the number of births will exceed the number of deaths by 6.298. If external
migration will remain on the previous year level, the population will be increased by 1.128
due to the migration reasons. It means that amount of people who moves into Brunei
Darussalam (to which they are not native) in order to settle there as permanent residents
(immigrants) will prevail over the amount of people who leaves the country to settle
permanently in another country (emigrants).
2. United States of America (USA)
The total population in the USA was last recorded at 318.9 million people in
2014 from 76.1 million in 1900, changing 319 percent during the last 50 years.
Population in the United States averaged 181.62 Million from 1900 until 2014, reaching
an all time high of 318.86 Million in 2014 and a record low of 76.09 Million in 1900.
Page 2
2.2 Population Growth
1. Brunei Darussalam
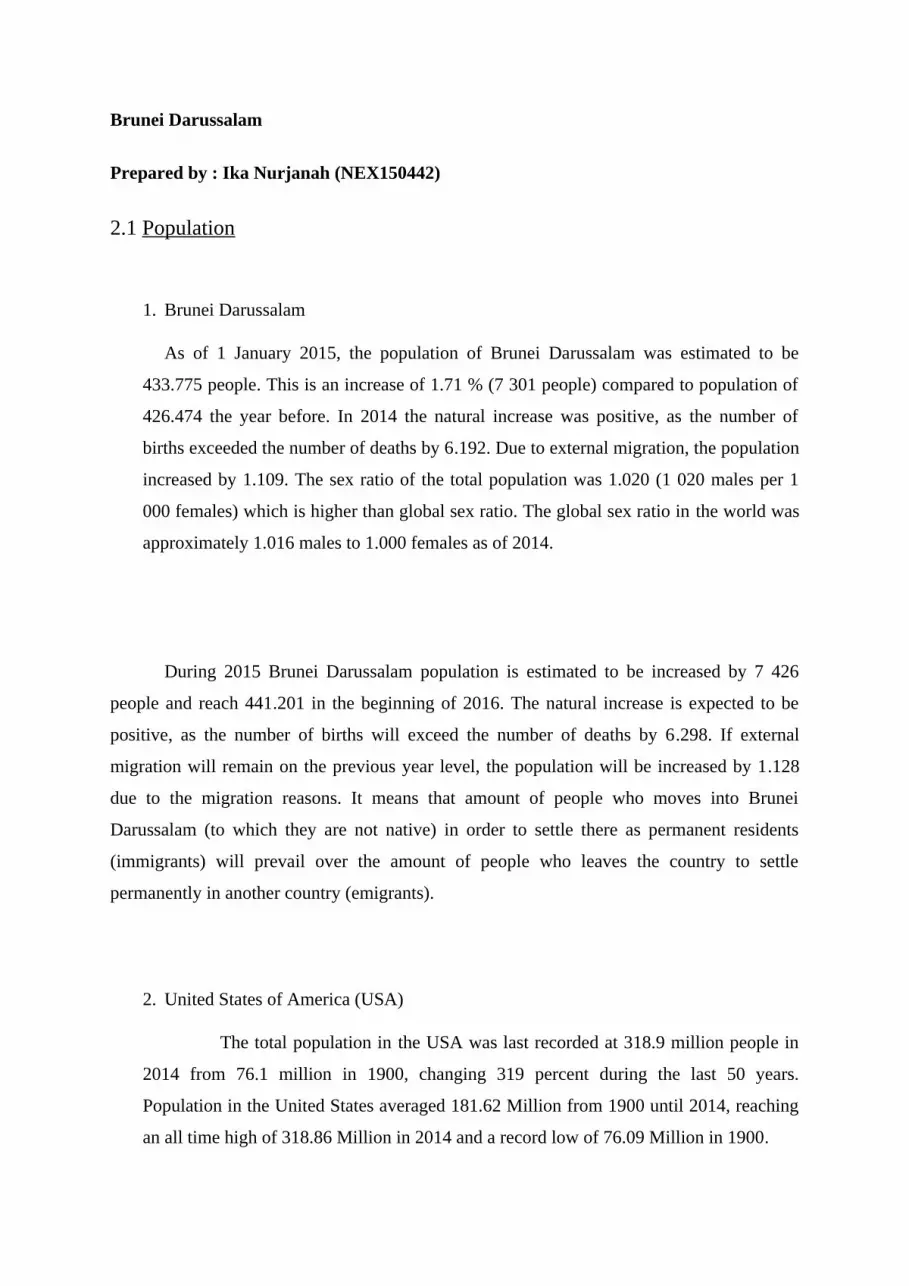
Population growth (annual %) in Brunei was last measured at 1.42 in 2014, according to
the World Bank. Annual population growth rate for year it is the exponential rate of growth
of midyear population from year t-1 to t, expressed as a percentage . Population is based on
the de facto definition of population, which counts all residents regardless of legal status or
citizenship--except for refugees not permanently settled in the country of asylum, who are
generally considered part of the population of the country of origin. This page has the latest
recorded value, an historical data chart and related indicators for Population growth (annual
%) in Brunei.
Graph 2.2.1
2. USA
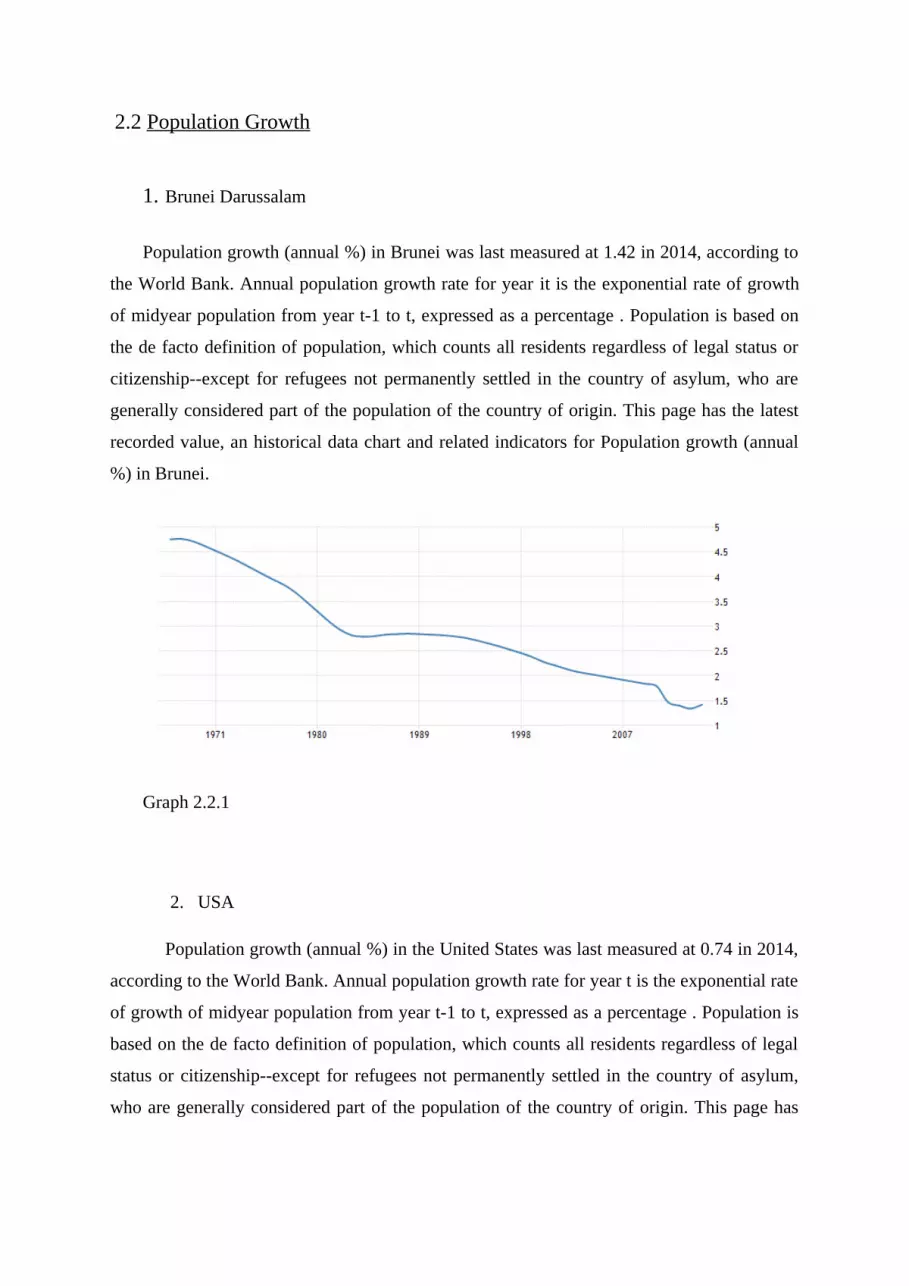
Population growth (annual %) in the United States was last measured at 0.74 in 2014,
according to the World Bank. Annual population growth rate for year t is the exponential rate
of growth of midyear population from year t-1 to t, expressed as a percentage . Population is
based on the de facto definition of population, which counts all residents regardless of legal
status or citizenship--except for refugees not permanently settled in the country of asylum,
who are generally considered part of the population of the country of origin. This page has
Page 3
the latest recorded value, an historical data chart and related indicators for Population growth
(annual %) in the United States.
Graph 2.2.2
2.3 Economy
1. Brunei Darussalam
Brunei's small, wealthy economy is a mixture
of foreign and domestic entrepreneurship, government regulation, welfare measures, and
village tradition. Crude oil and natural gas production account for about 90% of its
GDP. About 167,000 barrels (26,600 m3) of oil are produced every day, making Brunei the
fourth-largest producer of oil in Southeast Asia. It also produces approximately 25.3 million
cubic metres (890×106 cu ft) of liquified natural gas per day, making Brunei the ninth-largest
exporter of the substance in the world. BIMP-EAGA meeting in the office of Brunei Prime
Minister on 25 April 2013. Brunei is part of the BIMP-EAGA, a subregional economic co-
operation initiative in Southeast Asia.Substantial income from overseas investment
supplements income from domestic production.
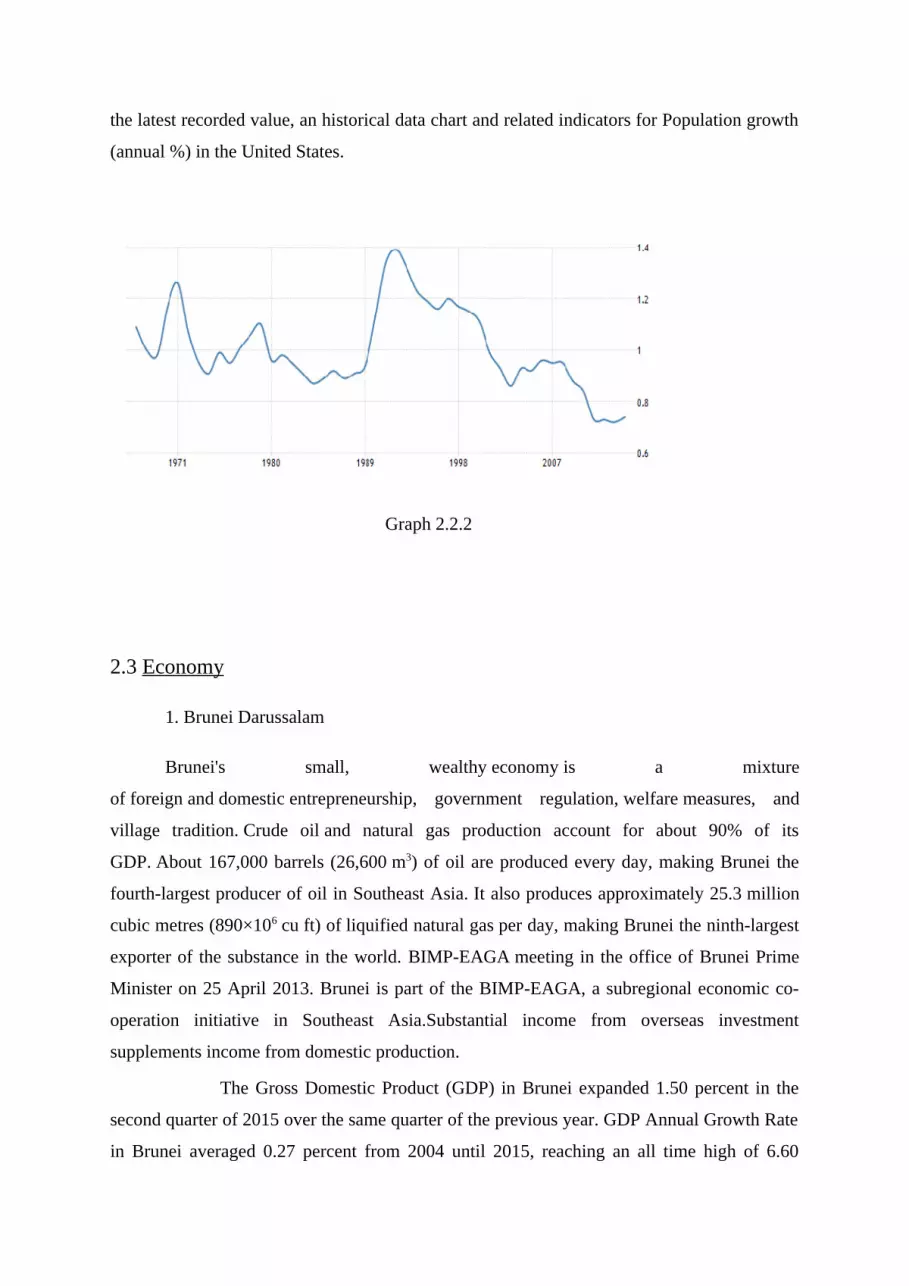
The Gross Domestic Product (GDP) in Brunei expanded 1.50 percent in the
second quarter of 2015 over the same quarter of the previous year. GDP Annual Growth Rate
in Brunei averaged 0.27 percent from 2004 until 2015, reaching an all time high of 6.60
Page 4
percent in the second quarter of 2010 and a record low of -6.60 percent in the first quarter of
2015. GDP Annual Growth Rate in Brunei is reported by the Department of Economic
Planning and Development, Brunei.
Chart 2.3.1
2.USA
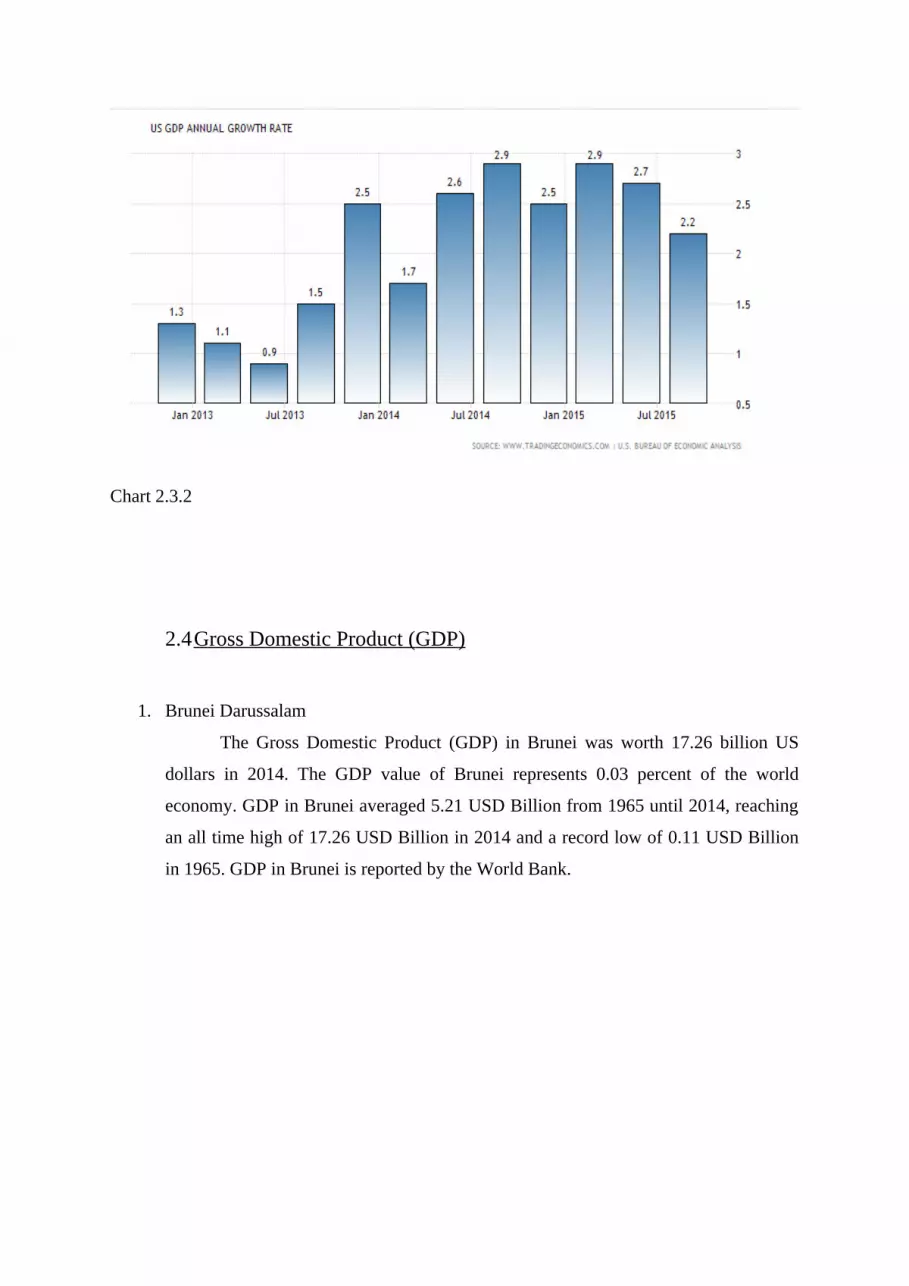
The Gross Domestic Product (GDP) in the United States expanded 2.20 percent in the
third quarter of 2015 over the same quarter of the previous year. GDP Annual Growth Rate in
the United States averaged 3.22 percent from 1948 until 2015, reaching an all time high of
13.40 percent in the fourth quarter of 1950 and a record low of -4.10 percent in the second
quarter of 2009. GDP Annual Growth Rate in the United States is reported by the U.S.
Bureau of Economic Analysis.
Page 5
Chart 2.3.2
2.4Gross Domestic Product ( GDP )
1. Brunei Darussalam
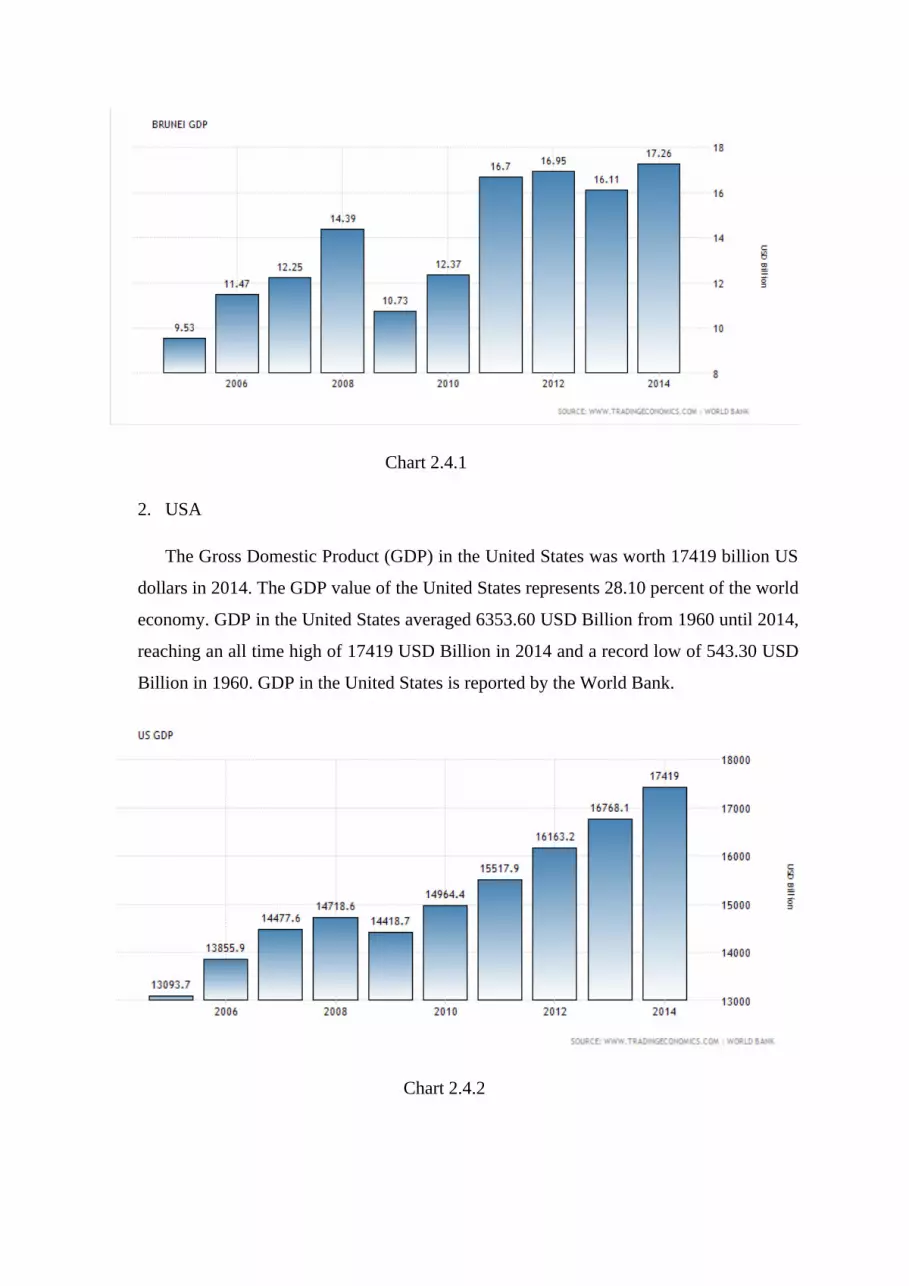
The Gross Domestic Product (GDP) in Brunei was worth 17.26 billion US
dollars in 2014. The GDP value of Brunei represents 0.03 percent of the world
economy. GDP in Brunei averaged 5.21 USD Billion from 1965 until 2014, reaching
an all time high of 17.26 USD Billion in 2014 and a record low of 0.11 USD Billion
in 1965. GDP in Brunei is reported by the World Bank.
Page 6
Chart 2.4.1
2. USA
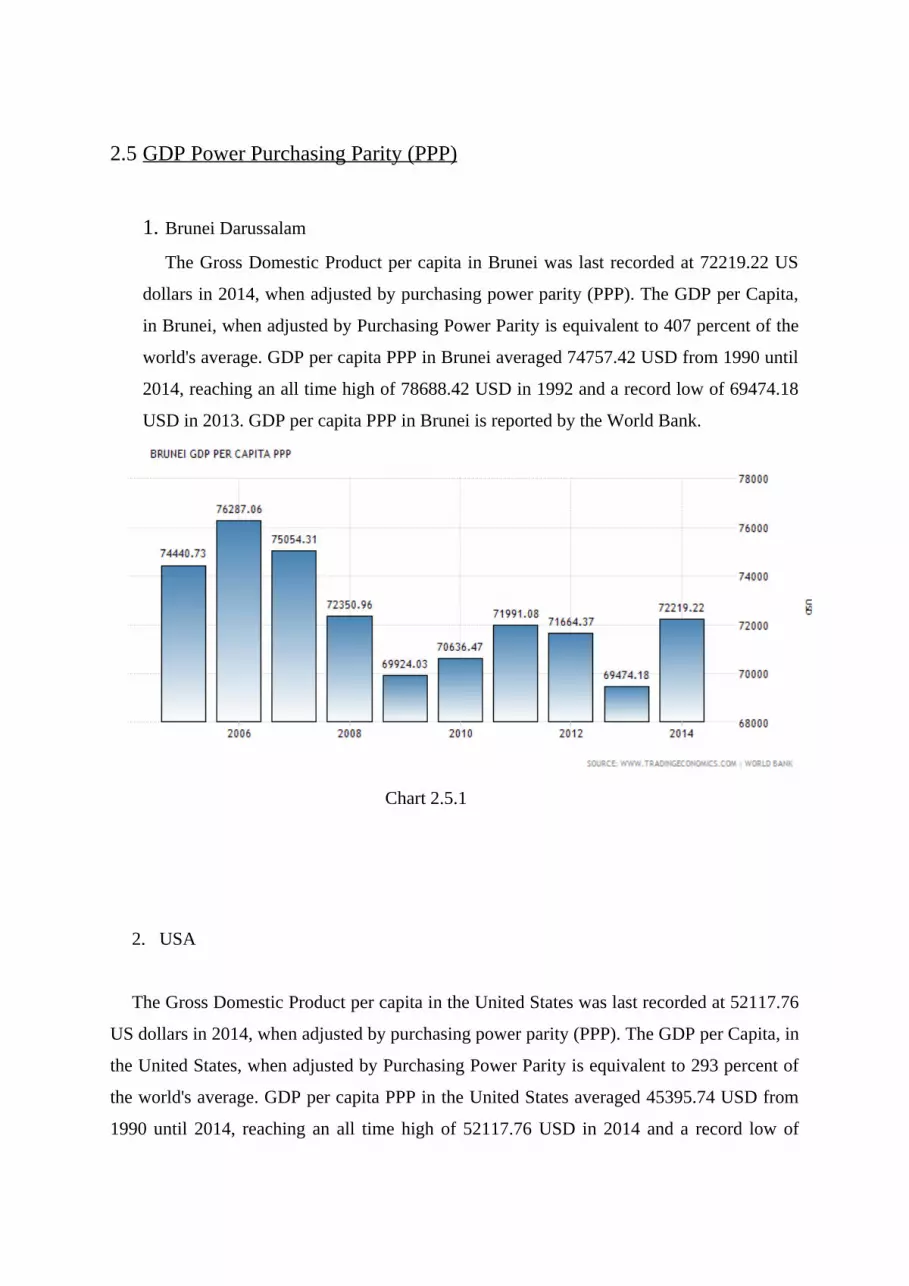
The Gross Domestic Product (GDP) in the United States was worth 17419 billion US
dollars in 2014. The GDP value of the United States represents 28.10 percent of the world
economy. GDP in the United States averaged 6353.60 USD Billion from 1960 until 2014,
reaching an all time high of 17419 USD Billion in 2014 and a record low of 543.30 USD
Billion in 1960. GDP in the United States is reported by the World Bank.
Chart 2.4.2
Page 7
2.5 GDP Power Purchasing Parity (PPP)
1. Brunei Darussalam
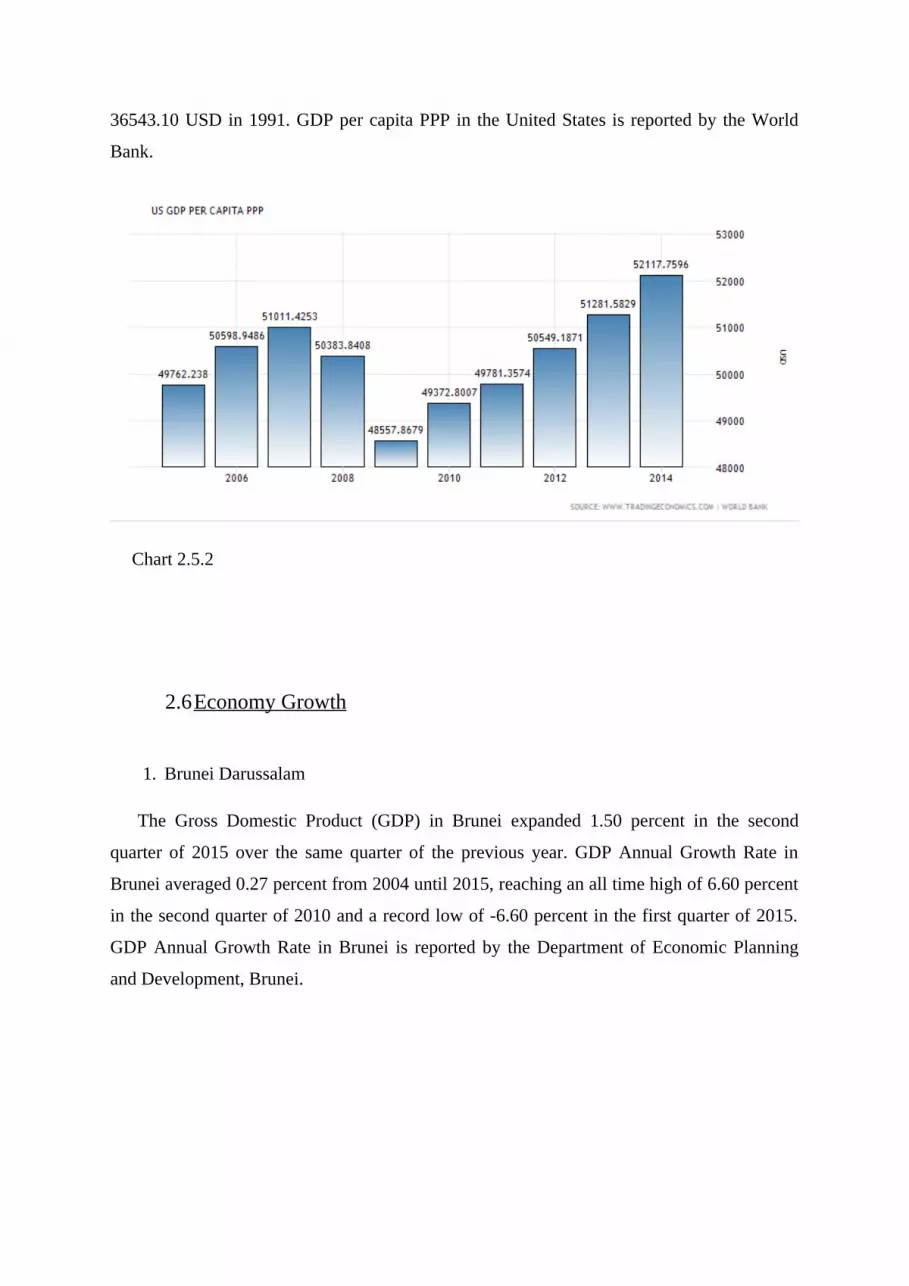
The Gross Domestic Product per capita in Brunei was last recorded at 72219.22 US
dollars in 2014, when adjusted by purchasing power parity (PPP). The GDP per Capita,
in Brunei, when adjusted by Purchasing Power Parity is equivalent to 407 percent of the
world's average. GDP per capita PPP in Brunei averaged 74757.42 USD from 1990 until
2014, reaching an all time high of 78688.42 USD in 1992 and a record low of 69474.18
USD in 2013. GDP per capita PPP in Brunei is reported by the World Bank.
Chart 2.5.1
2. USA
The Gross Domestic Product per capita in the United States was last recorded at 52117.76
US dollars in 2014, when adjusted by purchasing power parity (PPP). The GDP per Capita, in
the United States, when adjusted by Purchasing Power Parity is equivalent to 293 percent of
the world's average. GDP per capita PPP in the United States averaged 45395.74 USD from
1990 until 2014, reaching an all time high of 52117.76 USD in 2014 and a record low of
Page 8
36543.10 USD in 1991. GDP per capita PPP in the United States is reported by the World
Bank.
Chart 2.5.2
2.6Economy Growth
1. Brunei Darussalam
The Gross Domestic Product (GDP) in Brunei expanded 1.50 percent in the second
quarter of 2015 over the same quarter of the previous year. GDP Annual Growth Rate in
Brunei averaged 0.27 percent from 2004 until 2015, reaching an all time high of 6.60 percent
in the second quarter of 2010 and a record low of -6.60 percent in the first quarter of 2015.
GDP Annual Growth Rate in Brunei is reported by the Department of Economic Planning
and Development, Brunei.
Page 9
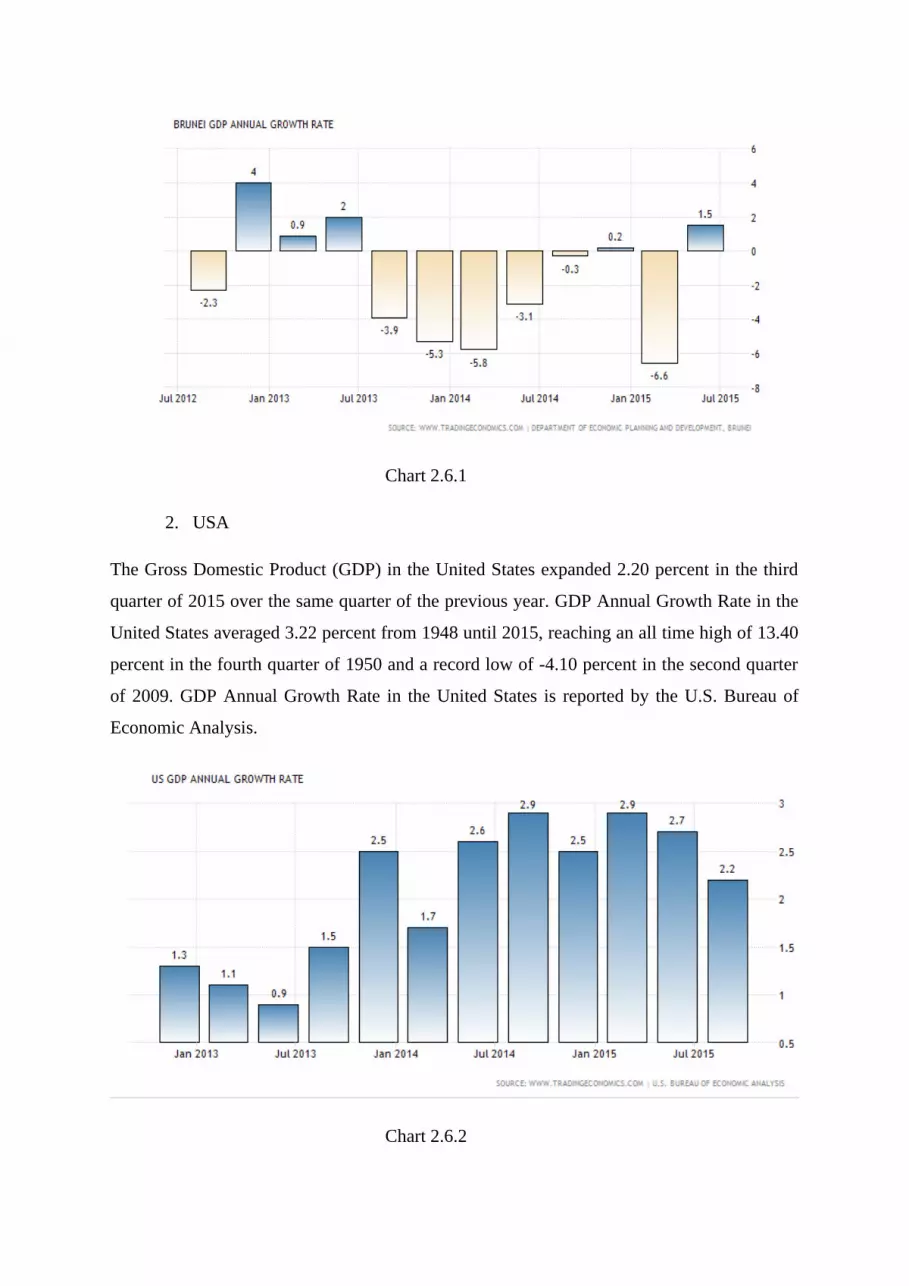
Chart 2.6.1
2. USA
The Gross Domestic Product (GDP) in the United States expanded 2.20 percent in the third
quarter of 2015 over the same quarter of the previous year. GDP Annual Growth Rate in the
United States averaged 3.22 percent from 1948 until 2015, reaching an all time high of 13.40
percent in the fourth quarter of 1950 and a record low of -4.10 percent in the second quarter
of 2009. GDP Annual Growth Rate in the United States is reported by the U.S. Bureau of
Economic Analysis.
Chart 2.6.2
Page 10
2.7 Unemployment Rate
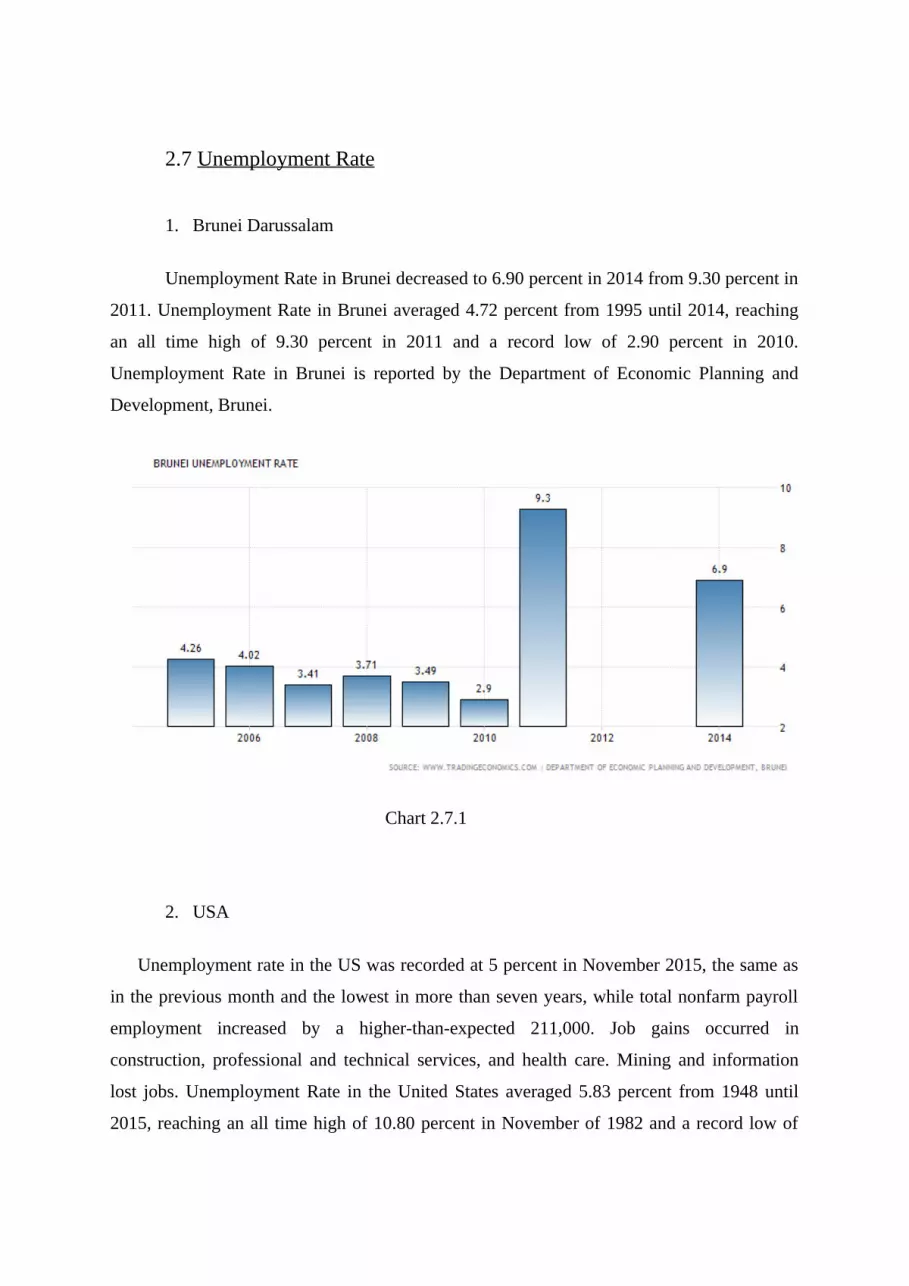
1. Brunei Darussalam
Unemployment Rate in Brunei decreased to 6.90 percent in 2014 from 9.30 percent in
2011. Unemployment Rate in Brunei averaged 4.72 percent from 1995 until 2014, reaching
an all time high of 9.30 percent in 2011 and a record low of 2.90 percent in 2010.
Unemployment Rate in Brunei is reported by the Department of Economic Planning and
Development, Brunei.
Chart 2.7.1
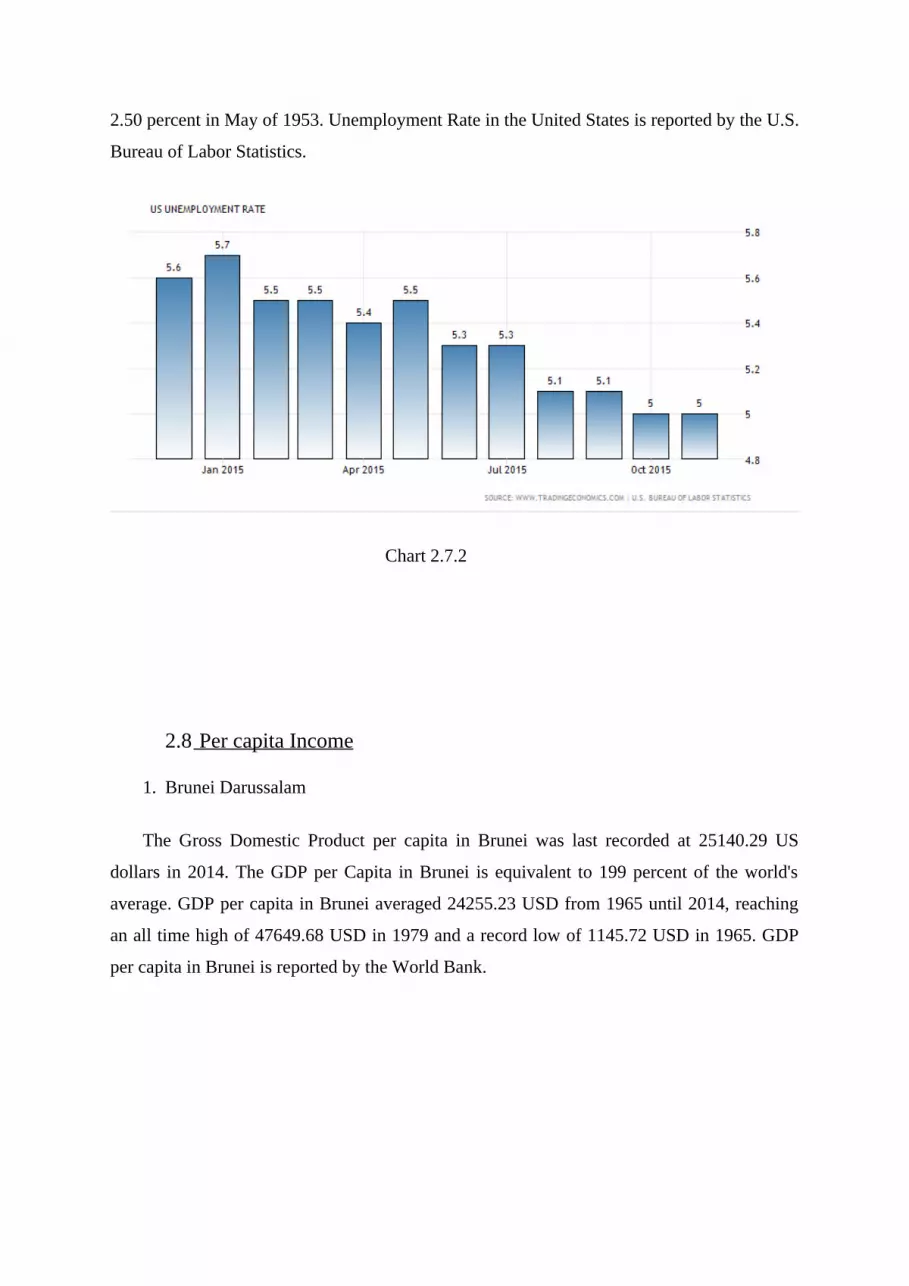
2. USA
Unemployment rate in the US was recorded at 5 percent in November 2015, the same as
in the previous month and the lowest in more than seven years, while total nonfarm payroll
employment increased by a higher-than-expected 211,000. Job gains occurred in
construction, professional and technical services, and health care. Mining and information
lost jobs. Unemployment Rate in the United States averaged 5.83 percent from 1948 until
2015, reaching an all time high of 10.80 percent in November of 1982 and a record low of
Page 11
2.50 percent in May of 1953. Unemployment Rate in the United States is reported by the U.S.
Bureau of Labor Statistics.
Chart 2.7.2
2.8 Per capita Income
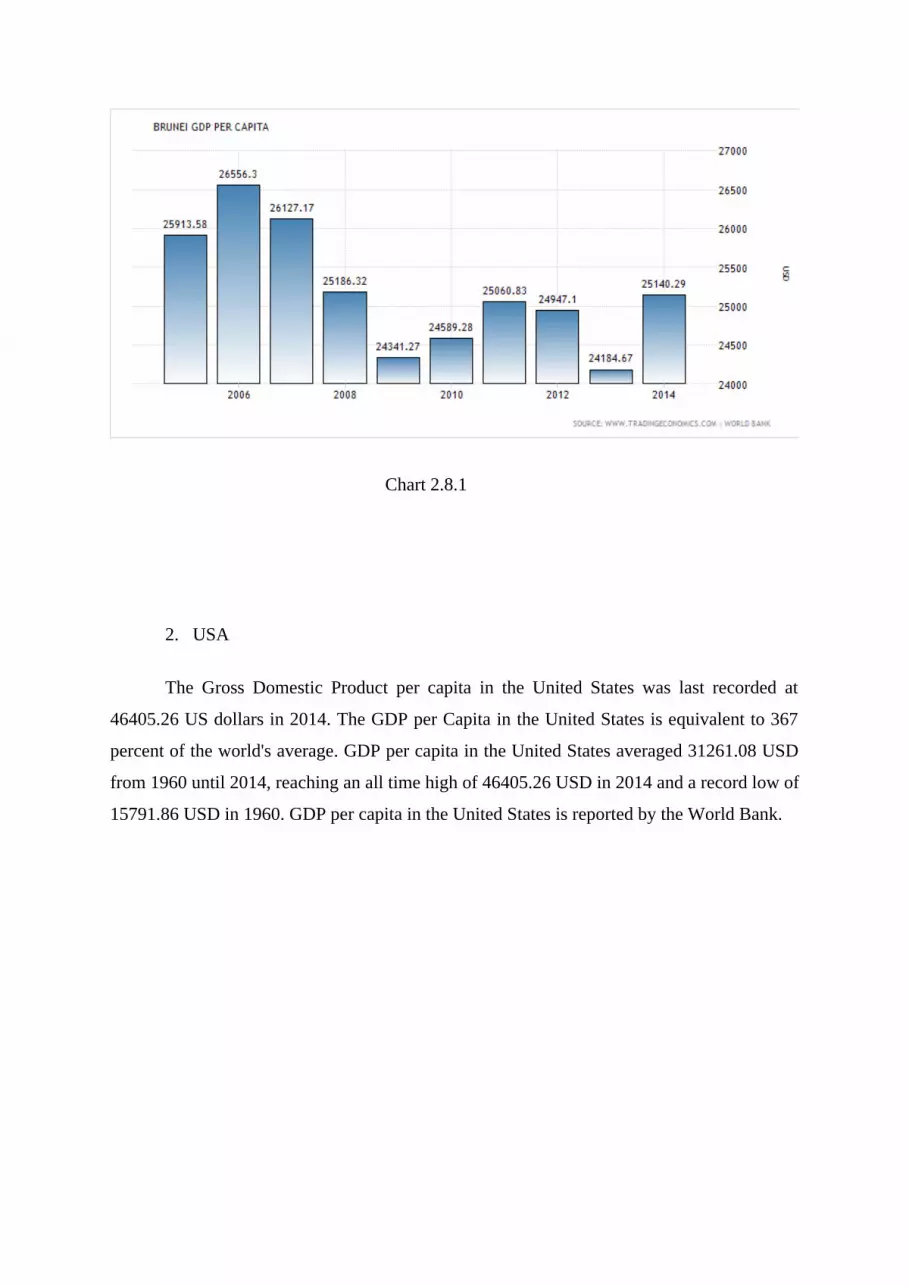
1. Brunei Darussalam
The Gross Domestic Product per capita in Brunei was last recorded at 25140.29 US
dollars in 2014. The GDP per Capita in Brunei is equivalent to 199 percent of the world's
average. GDP per capita in Brunei averaged 24255.23 USD from 1965 until 2014, reaching
an all time high of 47649.68 USD in 1979 and a record low of 1145.72 USD in 1965. GDP
per capita in Brunei is reported by the World Bank.
Page 12
Chart 2.8.1
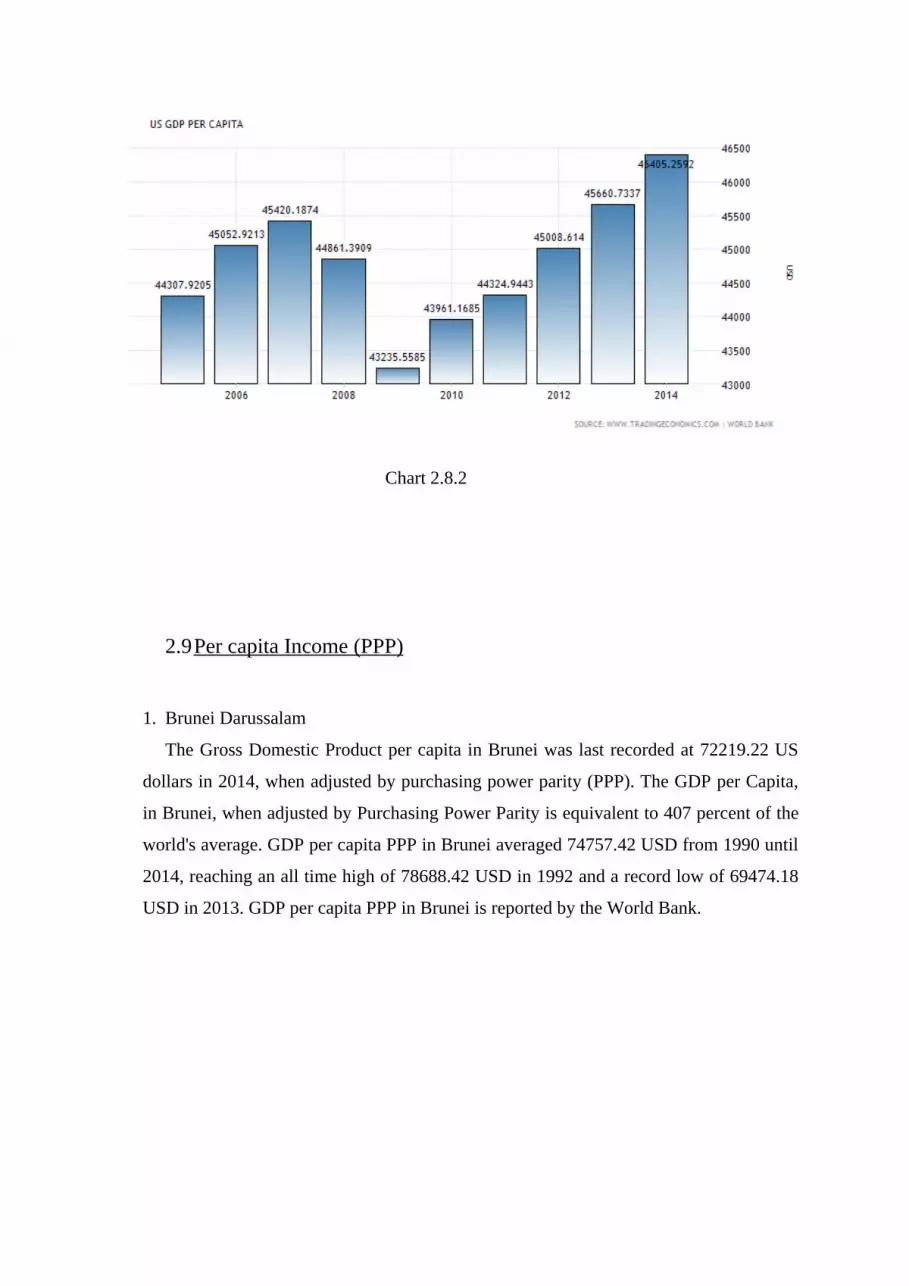
2. USA
The Gross Domestic Product per capita in the United States was last recorded at
46405.26 US dollars in 2014. The GDP per Capita in the United States is equivalent to 367
percent of the world's average. GDP per capita in the United States averaged 31261.08 USD
from 1960 until 2014, reaching an all time high of 46405.26 USD in 2014 and a record low of
15791.86 USD in 1960. GDP per capita in the United States is reported by the World Bank.
Page 13
Chart 2.8.2
2.9Per capita Income (PPP)
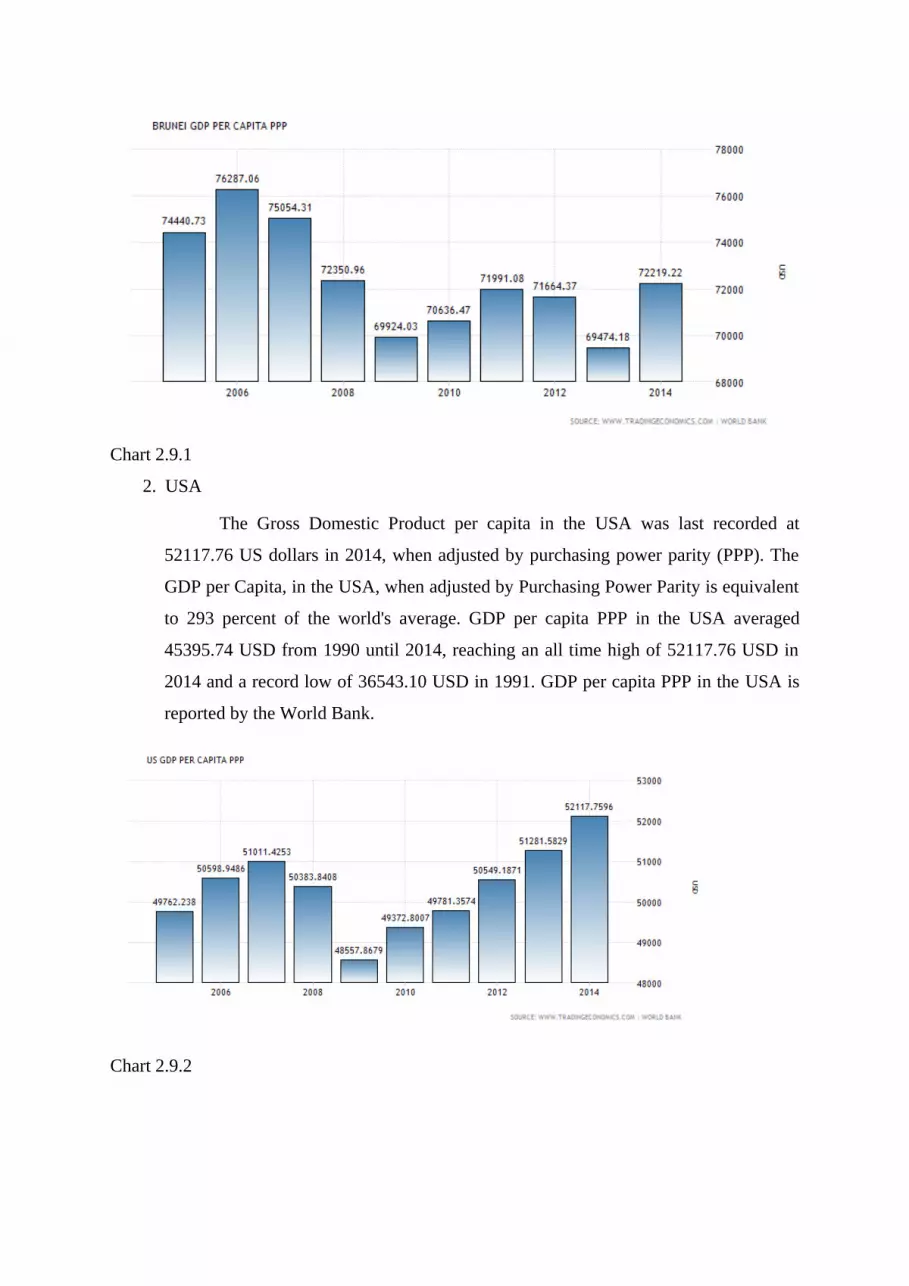
1. Brunei Darussalam
The Gross Domestic Product per capita in Brunei was last recorded at 72219.22 US
dollars in 2014, when adjusted by purchasing power parity (PPP). The GDP per Capita,
in Brunei, when adjusted by Purchasing Power Parity is equivalent to 407 percent of the
world's average. GDP per capita PPP in Brunei averaged 74757.42 USD from 1990 until
2014, reaching an all time high of 78688.42 USD in 1992 and a record low of 69474.18
USD in 2013. GDP per capita PPP in Brunei is reported by the World Bank.
Page 14
Chart 2.9.1
2. USA
The Gross Domestic Product per capita in the USA was last recorded at
52117.76 US dollars in 2014, when adjusted by purchasing power parity (PPP). The
GDP per Capita, in the USA, when adjusted by Purchasing Power Parity is equivalent
to 293 percent of the world's average. GDP per capita PPP in the USA averaged
45395.74 USD from 1990 until 2014, reaching an all time high of 52117.76 USD in
2014 and a record low of 36543.10 USD in 1991. GDP per capita PPP in the USA is
reported by the World Bank.
Chart 2.9.2
Page 15
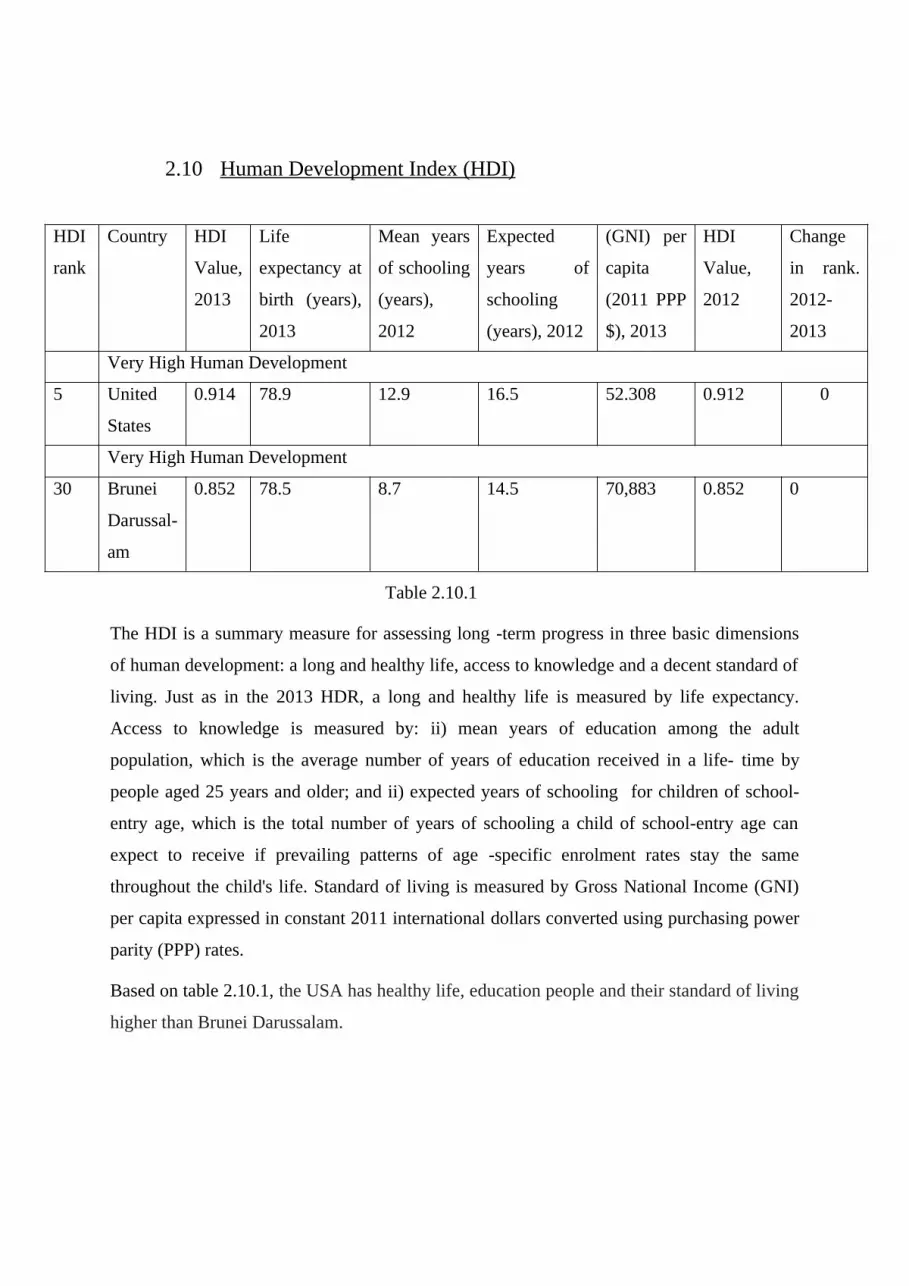
2.10 Human Development Index (HDI)
HDI
rank
Country HDI
Value,
2013
Life
expectancy at
birth (years),
2013
Mean years
of schooling
(years),
2012
Expected
years of
schooling
(years), 2012
(GNI) per
capita
(2011 PPP
$), 2013
HDI
Value,
2012
Change
in rank.
2012-
2013
Very High Human Development
5 United
States
0.914 78.9 12.9 16.5 52.308 0.912 0
Very High Human Development
30 Brunei
Darussal-
am
0.852 78.5 8.7 14.5 70,883 0.852 0
Table 2.10.1
The HDI is a summary measure for assessing long -term progress in three basic dimensions
of human development: a long and healthy life, access to knowledge and a decent standard of
living. Just as in the 2013 HDR, a long and healthy life is measured by life expectancy.
Access to knowledge is measured by: ii) mean years of education among the adult
population, which is the average number of years of education received in a life- time by
people aged 25 years and older; and ii) expected years of schooling for children of school-
entry age, which is the total number of years of schooling a child of school-entry age can
expect to receive if prevailing patterns of age -specific enrolment rates stay the same
throughout the child's life. Standard of living is measured by Gross National Income (GNI)
per capita expressed in constant 2011 international dollars converted using purchasing power
parity (PPP) rates.
Based on table 2.10.1, the USA has healthy life, education people and their standard of living
higher than Brunei Darussalam.
Page 16
2.10 Inflation rate
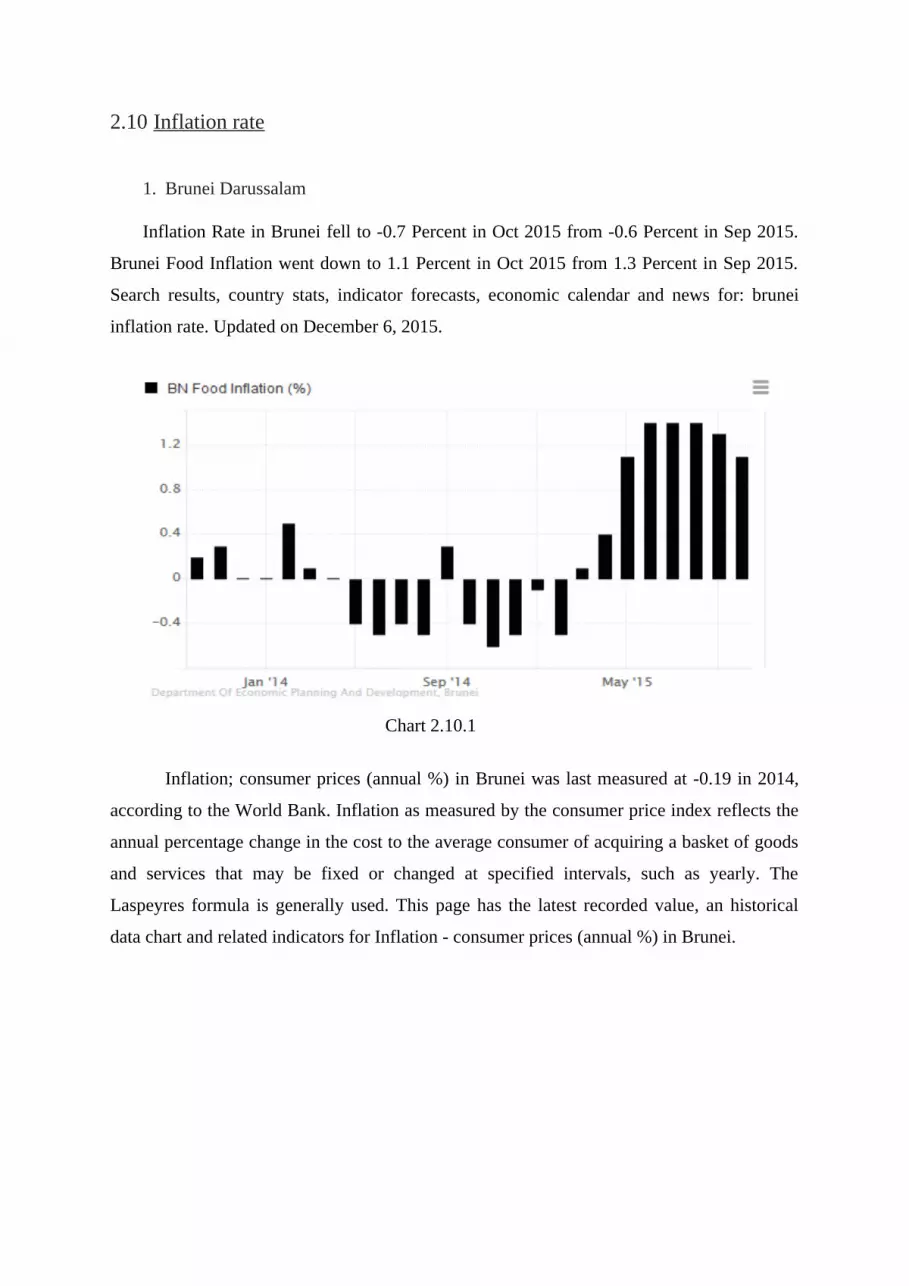
1. Brunei Darussalam
Inflation Rate in Brunei fell to -0.7 Percent in Oct 2015 from -0.6 Percent in Sep 2015.
Brunei Food Inflation went down to 1.1 Percent in Oct 2015 from 1.3 Percent in Sep 2015.
Search results, country stats, indicator forecasts, economic calendar and news for: brunei
inflation rate. Updated on December 6, 2015.
Chart 2.10.1
Inflation; consumer prices (annual %) in Brunei was last measured at -0.19 in 2014,
according to the World Bank. Inflation as measured by the consumer price index reflects the
annual percentage change in the cost to the average consumer of acquiring a basket of goods
and services that may be fixed or changed at specified intervals, such as yearly. The
Laspeyres formula is generally used. This page has the latest recorded value, an historical
data chart and related indicators for Inflation - consumer prices (annual %) in Brunei.
Page 17
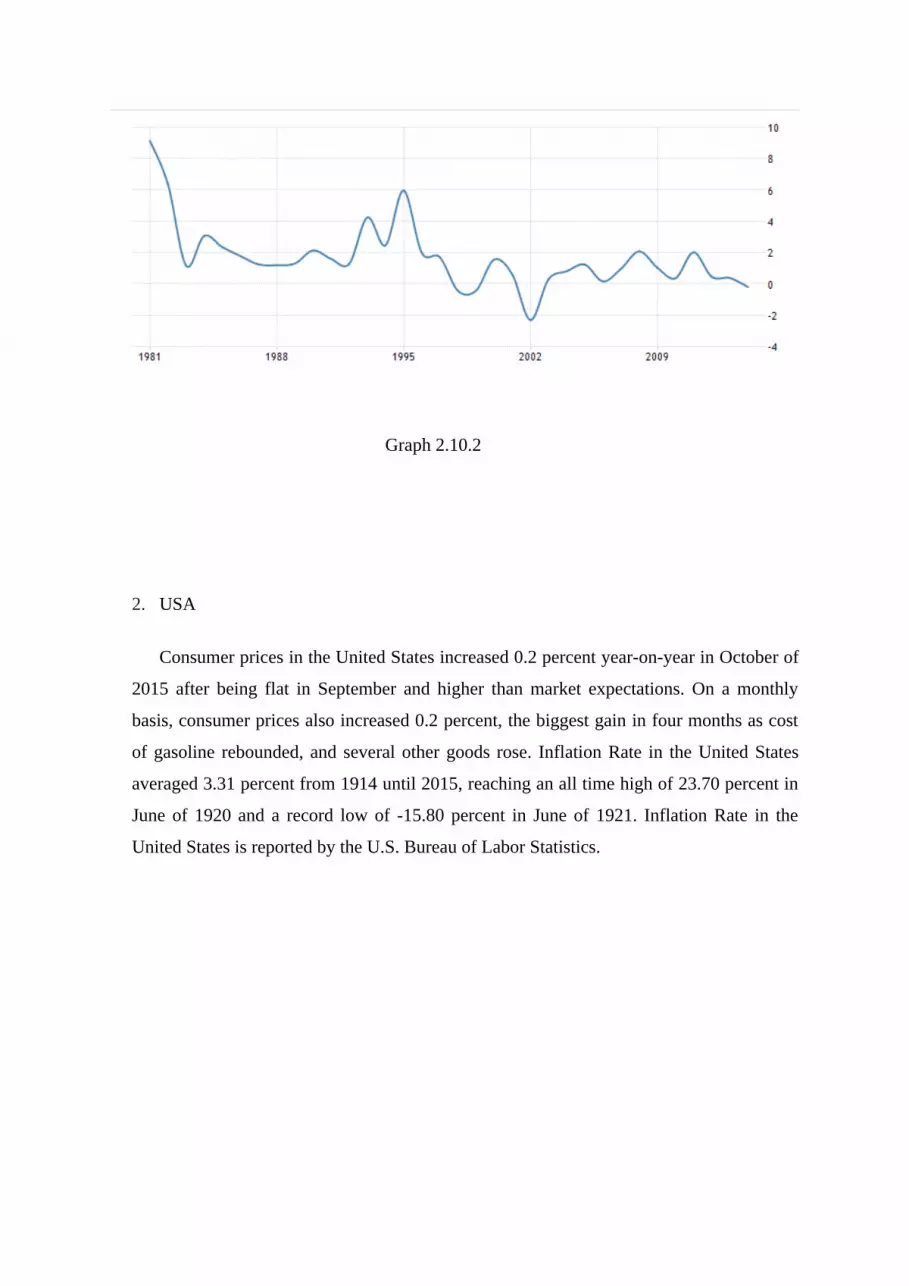
Graph 2.10.2
2. USA
Consumer prices in the United States increased 0.2 percent year-on-year in October of
2015 after being flat in September and higher than market expectations. On a monthly
basis, consumer prices also increased 0.2 percent, the biggest gain in four months as cost
of gasoline rebounded, and several other goods rose. Inflation Rate in the United States
averaged 3.31 percent from 1914 until 2015, reaching an all time high of 23.70 percent in
June of 1920 and a record low of -15.80 percent in June of 1921. Inflation Rate in the
United States is reported by the U.S. Bureau of Labor Statistics.
Page 18
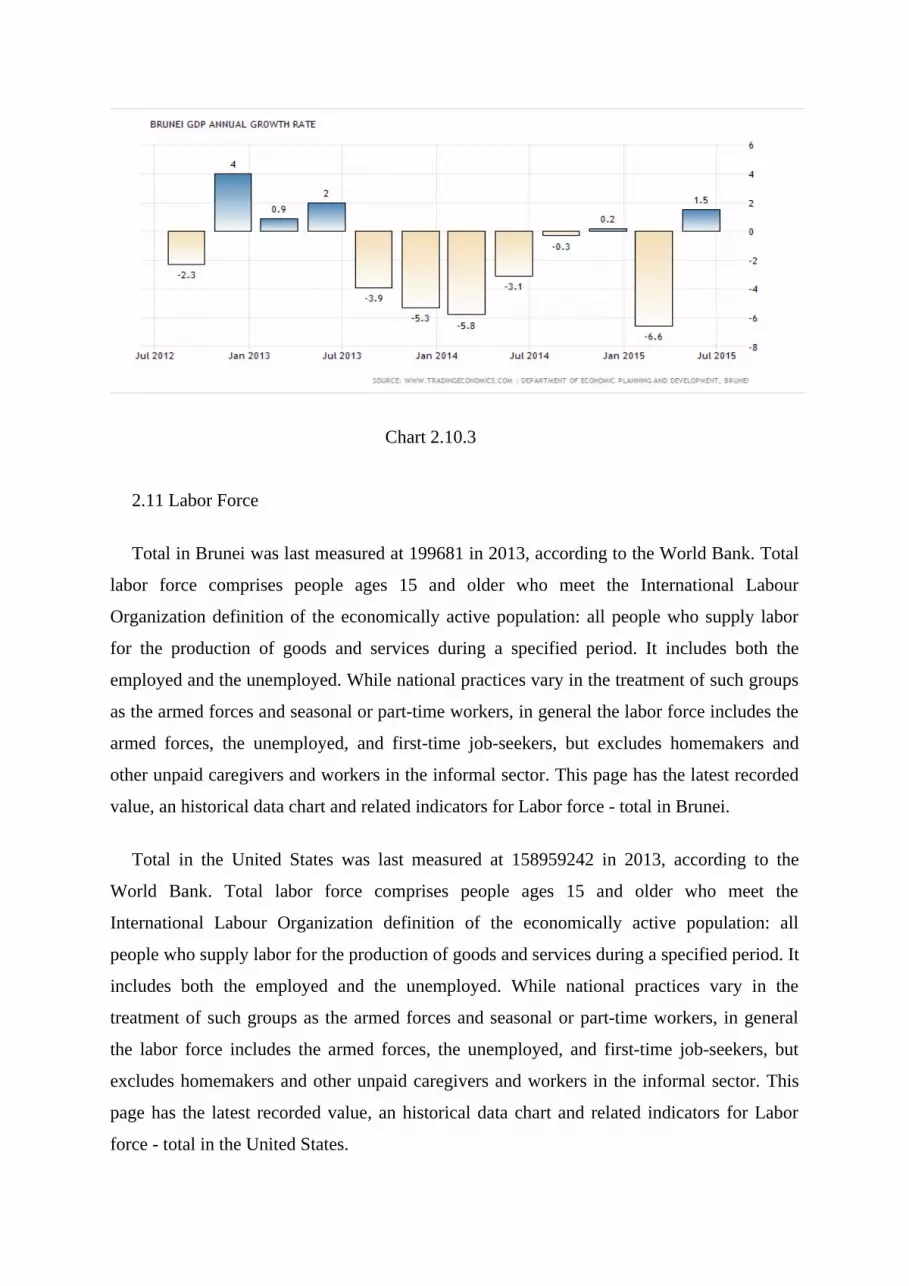
Chart 2.10.3
2.11 Labor Force
Total in Brunei was last measured at 199681 in 2013, according to the World Bank. Total
labor force comprises people ages 15 and older who meet the International Labour
Organization definition of the economically active population: all people who supply labor
for the production of goods and services during a specified period. It includes both the
employed and the unemployed. While national practices vary in the treatment of such groups
as the armed forces and seasonal or part-time workers, in general the labor force includes the
armed forces, the unemployed, and first-time job-seekers, but excludes homemakers and
other unpaid caregivers and workers in the informal sector. This page has the latest recorded
value, an historical data chart and related indicators for Labor force - total in Brunei.
Total in the United States was last measured at 158959242 in 2013, according to the
World Bank. Total labor force comprises people ages 15 and older who meet the
International Labour Organization definition of the economically active population: all
people who supply labor for the production of goods and services during a specified period. It
includes both the employed and the unemployed. While national practices vary in the
treatment of such groups as the armed forces and seasonal or part-time workers, in general
the labor force includes the armed forces, the unemployed, and first-time job-seekers, but
excludes homemakers and other unpaid caregivers and workers in the informal sector. This
page has the latest recorded value, an historical data chart and related indicators for Labor
force - total in the United States.
Page 19
2.12 Product
Brunei's oil production peaked in 1979 at over 240,000 barrels per day (38,000 m3/d).
Since then it has been deliberately cut back to extend the life of oil reserves and
improve recovery rates. Petroleum production is currently averaging some 200,000
barrels per day (32,000 m3/d).
U.S. Products is a leading manufacturer of carpet, upholstery, drapery, stone,
concrete, & tile cleaning and restoration equipment, tools and chemicals for the floor
care professional. In manufacturing, quality, reliability and innovation are words that
are frequently advertised. At U.S. Products.
2.13 Potential in Agricultural Product
Efforts are under way to direct greater focus to Brunei Darussalam’s
agriculture sector, in order to both improve food security and create a niche in the
global market. Crude oil and natural gas production comprise 60% of GDP and more
than 90% of exports, while the agriculture sector’s share of GDP is only 0.72% and
employs just 1.4% of the population.
The structural changes in U.S. agricultural exports paralleled these shifts in demand.
During 1960-64 cotton and tobacco accounted for 21 per cent of U.S. agricultural exports;
today they account for 11 per cent. The structural changes in U.S. agricultural exports
paralleled these shifts in demand. During 1960-64 cotton and tobacco accounted for 21
percent of U.S. agricultural exports; today they account for only 11 per cent. Food exports
have remained at about 50 per cent of the total value of U.S. agricultural exports.
Page 20
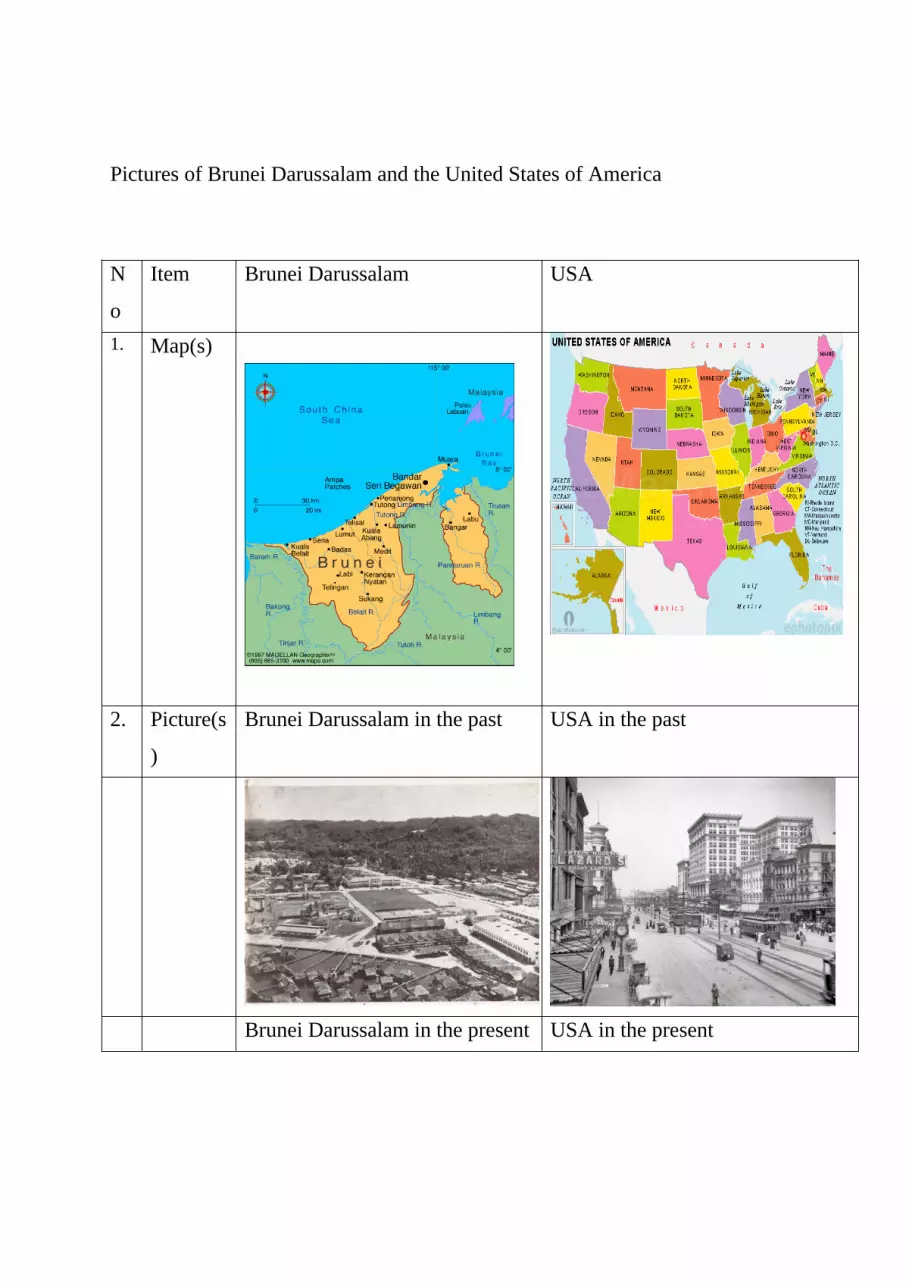
Pictures of Brunei Darussalam and the United States of America
N
o
Item Brunei Darussalam USA
1. Map(s)
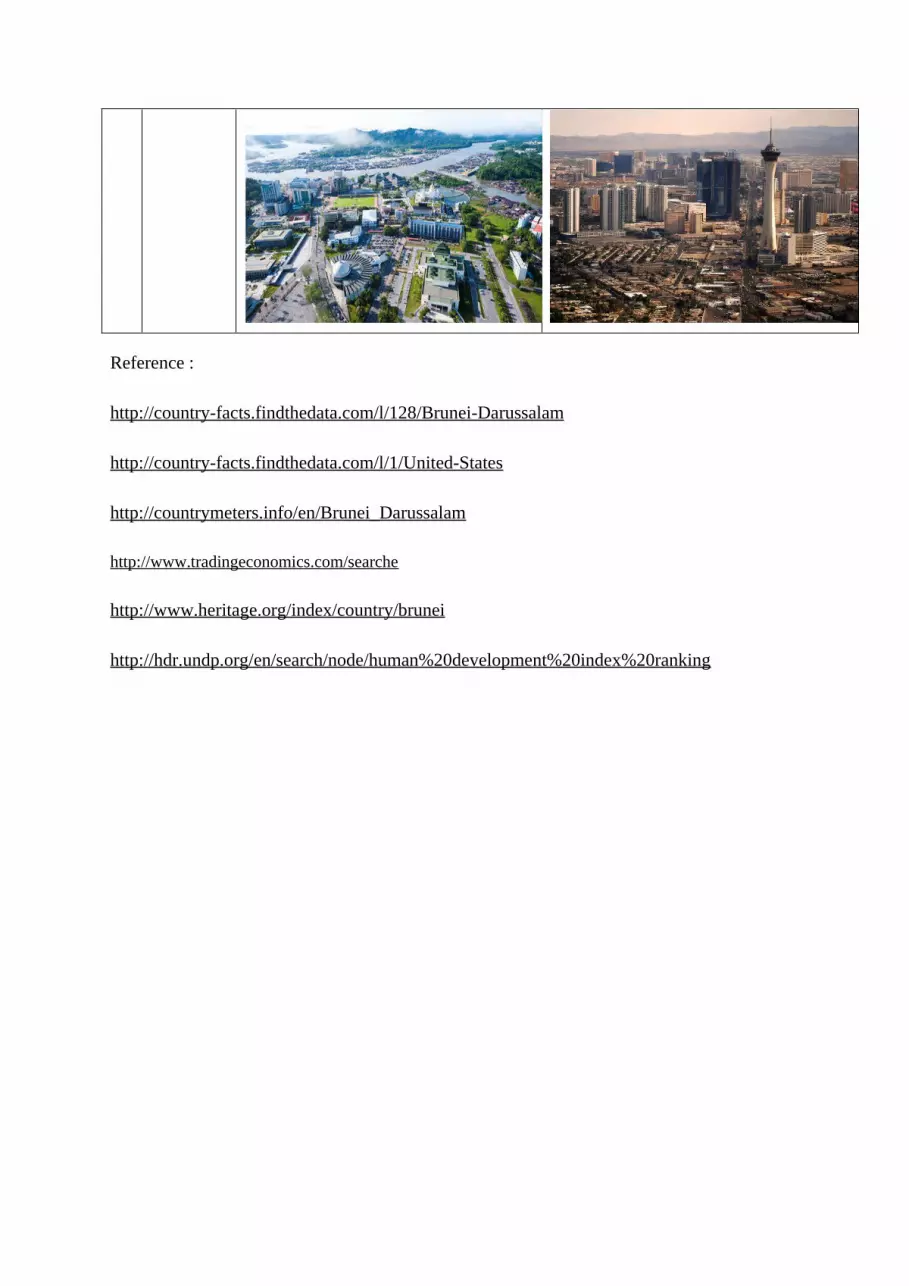
2. Picture(s
)
Brunei Darussalam in the past USA in the past
Brunei Darussalam in the present USA in the present
Page 21
Reference :
http://country-facts.findthedata.com/l/128/Brunei-Darussalam
http://country-facts.findthedata.com/l/1/United-States
http://countrymeters.info/en/Brunei_Darussalam
http://www.tradingeconomics.com/searche
http://www.heritage.org/index/country/brunei
http://hdr.undp.org/en/search/node/human%20development%20index%20ranking